the impact of home culture, parental involvement and
TRANSCRIPT

Beatrice Schindler Rangvid
The Impact of Home Culture, Parental Involvement and Attitudes on Cognitive Skills of Immigrant Students in Denmark

The publication The Impact of Home Culture, Parental Involvement and Attitudes on Cogni-tive Skills of Immigrant Students in Denmark is available at www.akf.dk AKF, Danish Institute of Governmental Research Nyropsgade 37, DK-1602 Copenhagen V Phone: +45 43 33 34 00 Fax: +45 43 33 34 01 E-mail: [email protected] Internet http://www.akf.dk © 2009 AKF and the author Extracts, including figures, tables and quotations, are permitted with clear indication of sources. Publications mentioning, reviewing, quoting or referring to this report should be sent to AKF. © Cover: Phonowerk, Lars Degnbol Publisher: AKF ISBN: 978-87-7509-905-4 I:\08 SEKRETARIAT\FORLAGET\BS\HOME CULTURE\2750\IMPACT_HOME_CULTURE.DOCX June 2009(07) AKF, Danish Institute of Governmental Research The purpose of the Institute is to provide new insights into relevant social conditions. AKF concentrates on research into administrative practices and welfare provision at local and re-gional level. The overall aim is to improve administrative praxis in public bodies and provide them with the best possible decision-making tools.

Beatrice Schindler Rangvid
The Impact of Home Culture, Parental Involvement and Attitudes on Cognitive Skills of Immigrant Students in Denmark
AKF, Danish Institute of Governmental Research 2009

Abstract
Using data from three Danish PISA-studies, I conduct an exploratory investigation of the re-lation between home culture and parental involvement and attitudes towards integration and school on immigrants’ test scores. The result indicates that only a few of the indicators inves-tigated in this study can be shown to influence students’ test scores. Cultural communication is shown to be the factor of home culture that is most closely related to higher test scores.
Acknowledgement
I thank Torben Tranæs, Rockwool Foundation Research Unit, for permission to use the PISA-Ethnic data and Anders Holm, Maria Knoth Humlum and Astrid Würtz Rasmussen for valu-able comments and suggestions. Financial support provided by the Danish Ministry of Inte-gration is gratefully acknowledged.

Contents
1 Introduction ............................................................................................... 7
2 Existing literature ...................................................................................... 8
3 Data and sample ......................................................................................... 9
4 The impact of home culture and parental involvement and attitudes on student achievement .............................................................. 15
4.1 Outcomes and controls ...................................................................................................... 15 4.2 Home culture ..................................................................................................................... 18 4.2.1 Cultural communication ........................................................................................... 18 4.2.2 Social communication ............................................................................................... 21 4.2.3 Home educational resources .................................................................................... 23 4.2.4 Cultural possessions ................................................................................................ 23 4.2.5 Joint estimation of the four indices ......................................................................... 24 4.3 Parental involvement and attitudes ................................................................................. 25 4.3.1 Language spoken at home ......................................................................................... 25 4.3.2 Participation in mother-tongue lessons ................................................................... 28 4.3.3 Organised leisure activities and paid job ................................................................. 28 4.3.4 Help with schoolwork .............................................................................................. 29 4.3.5 Missing school ......................................................................................................... 32 4.3.6 Ethnic school composition ....................................................................................... 32 4.4 Checking the robustness of the estimates ........................................................................ 33 4.4.1 Including immigration-specific variables .................................................................33 4.4.2 School fixed effects ................................................................................................... 35 4.4.3 Math and science results: suggestive evidence ......................................................... 37 4.5 Discussion and conclusion ............................................................................................... 37
5 References ............................................................................................... 38
6 Dansk sammenfatning.............................................................................. 39
7 Appendix .................................................................................................. 40


1 Introduction
Results from the international education literature indicate that the impact of school factors on students’ achievement is relatively small compared with the influence of students’ home background. Even though it is easier to change schools than to change students’ home back-grounds, such changes are expected to yield much higher returns. In addition to this, results from the existing literature show that immigrant students cluster together in the same schools marginalising them socially from Danish students (Rangvid 2007). It is generally be-lieved that students’ integration in social networks with Danish students also impacts on stu-dents’ academic achievement, e.g. due to better language acquisition and mutual help with schoolwork. Since which school to enrol one’s child in is a choice parents make, this dimen-sion is also regarded as being part of the influence of parents attitudes.
While the impact of parental socioeconomic status, such as education, income and family structure has been extensively studied in the literature on immigrant students’ academic achievement and educational attainment, this study adds to the literature by exploring the additional impact of home culture, parental involvement and attitudes towards issues related to schooling and integration into the Danish host society. If the analysis shows that (some of) these factors are clearly related to student achievement, these results might point at specific policy actions for immigrant families with school children.
This study uses quantitative analyses to gain an insight into the impact of students’ home background on academic achievement. Data from several PISA-assessments enable me to ex-amine different aspects concerning students’ home culture, e.g. whether parents talk with their children about school, about political/social issues or about books, movies and TV-programmes, and the amount of educational resources in the students’ homes (textbooks, dictionaries, a desk for studying, a quiet place to study). Moreover, several aspects concern-ing parental involvement in their child’s schooling and attitudes towards integration in the host society are examined, e.g. the language spoken at home (Danish or other), homework as-sistance from parents, aspects concerning parents’ acceptance of their children’s absence from school, of children’s participation in mother-tongue lessons, leisure time activities, paid jobs and the immigrant concentration in the school in which parents chose to enrol their child are included in the analysis.
7

2 Existing literature
In the literature of education economics, whether increasing financial resources at schools will improve student achievement has been debated for many years. Existing studies, investi-gating the effects of factors such as class size (e.g. Angrist & Lavy 1999), birth order and fam-ily size (Hanushek 1992), peer effects (Hanushek et al. 2003), or teacher characteristics (e.g. Rivkin, Hanushek & Kain 2005) have found widely different results. Some have found posi-tive effects (Krueger 1999), others insignificant or even negative effects (Hanushek 1996).
The landmark 1996 Coleman report – which found evidence that poor black children did perform better in integrated middle-class schools – also highlighted family background as a key component of educational production. Typically, a set of family variables are included, such as parental education and income. Hanushek (1992) notes the difficulty of controlling for the quality of parental time directly due to data limitations and uses family background variables as a proxy. The related literature on household production and time-allocation fo-cuses on housework, childcare and female labour supply issues. Mother’s education was found to have the most impact on time spent with children and plays thus a central role. In this study, I investigate further the role that factors associated with parental effort such as home culture, parental involvement and attitudes play in the production of academic achievement. Specifically, I concentrate on the role these issues play in the education produc-tion function of immigrant school children.
8

3 Data and sample
Sample
In this project, I use a combined sample consisting of the so-called PISA-Ethnic study from 2005, the 2004 Copenhagen PISA study, and the Danish part of the 2000 international PISA study. I combine these datasets to maximise the number of immigrant students in the final
dataset1. The first of those studies is a Danish PISA replicate study conducted in 2005 sam-pling 9th graders in schools with high immigrant concentrations (PISA-Ethnic). The second assessment focused on Copenhagen schools and was administered to all 9th graders in Co-penhagen public schools and a number of private schools in 2004 (PISA-Copenhagen). The last part is the Danish subsample of the international PISA 2000 assessment (PISA-2000). Table 3.1 presents selected summary statistics for each of these datasets. The PISA-Ethnic sample contributes the most to the final sample with 1,189 immigrant students, almost 60% of the total sample, while PISA-Copenhagen and PISA-2000 contribute with 654 and 204 ob-servations, respectively. The combined dataset includes 2,047 immigrant students.
Of the three datasets in the analysis, only the PISA-2000 dataset is a representative sample of the total population, while the other datasets oversample immigrant students (and their native peers). This has implications for the interpretation of results, if there are hetero-geneous effects. Since the results in the pooled sample are a weighted average of a represen-tative sample and non-representative samples, with most weight on the non-representative samples, the validity of results may be restrained to immigrant dense schools or school dis-tricts.
Some variables are not available in all datasets. E.g. parental highest occupation2 is not available in the PISA-Ethnic dataset and is therefore in the PISA-Ethnic dataset replaced by parental income drawn from administrative registers. Also, information on mother-tongue teaching and time spent on organised leisure activities and on paid work is only available in the Danish datasets (PISA-Copenhagen and PISA-Ethnic). Results for these variables are therefore based on a slightly smaller number of observations.
1
I have considered including data from the international PISA 2003 and 2006 assessments, too. Unfortunately, the bulk
of the variables on parental involvement has been dropped from the 2003 & 2006 surveys, and including these sam-ples is therefore irrelevant.
2 This measure is in the PISA-setting used as a measure of parental income.
9

Table 3.1 Descriptive statistics for variables
PISA-2000 PISA-Copenhagen PISA-Ethnic Pooled sample
Obs Mean Obs Mean Obs Mean Obs Mean
Outcome measure:
Reading test scores 204 421 654 405 1189 404 2047 406
SES controls:
Females 182 0,49 521 0,51 1193 0,54 1896 0,52
Years of education
- Father 191 10,5 618 10,1 1158 9,9 1967 10
- Mother 200 8,6 644 9,3 1185 8,5 2029 8,7
Nuclear family 201 0,71 642 0,73 1144 0,76 1987 0,74
Number of siblings 203 1,5 638 2,7 1193 1,8 2034 2
Parental occupational status 165 43 501 40 - - 666 40
Parental income ('000 DKK) - - - - 1031 292 1031 292
Father:
Full time 179 0,54 583 0,53 - - 762 0,53
Part time 179 0,09 583 0,07 - - 762 0,08
Unemployed 179 0,16 583 0,1 - - 762 0,12
Out of labour force 179 0,22 583 0,3 - - 762 0,28
Mother:
Full time 192 0,38 614 0,32 - - 806 0,33
Part time 192 0,11 614 0,11 - - 806 0,11
Unemployed 192 0,19 614 0,13 - - 806 0,14
Out of labour force 192 0,32 614 0,45 - - 806 0,42
Father:
Self-employed - - - - 1041 0,10 1041 0,10
High occup. status - - - - 1041 0,03 1041 0,03
Middle/low occup. status - - - - 1041 0,36 1041 0,36
Not working - - - - 1041 0,51 1041 0,51
Mother:
Self-employed - - - - 1145 0,04 1145 0,04
High occup. status - - - - 1145 0,01 1145 0,01
Middle/low occup. status - - - - 1145 0,31 1145 0,31
Not working - - - - 1145 0,64 1145 0,64
Home culture:
Cultural communication 193 -0,25 616 -0,19 1122 -0,27 1931 -0,24
Social communication 195 -0,30 629 -0,20 1145 -0,18 1969 -0,20
Home educational resources 199 -0,04 639 -0,17 1160 -0,02 1998 -0,07
Cultural possessions 201 -0,47 643 -0,55 1161 -0,50 2005 -0,52
Parental involvement & attitudes:
Speak Danish at home 201 0,23 570 0,19 912 0,20 1683 0,20
Mother-tongue teaching - - 630 0,56 1134 0,61 1764 0,59
Time on org. leisure activities - - 597 1,87 1127 1,37 1724 1,54
Time on job - - 522 1,70 1055 1,60 1577 1,63
Parental help with school work
197 2,42 622 2,45 1109 2,35 1928 2,39
Perc. immigrant peers in school
0-10% 204 0,25 654 0,04 1193 0,03 2051 0,05
10-25% 204 0,34 654 0,18 1193 0,19 2051 0,20
25-50% 204 0,31 654 0,19 1193 0,32 2051 0,28
50%+ 204 0,10 654 0,60 1193 0,46 2051 0,47
10

Definitions of immigrants
In accordance with the definition of Statistics Denmark, immigrants are defined as students,
whose parents both have origins in non-Western countries3. Where available, I use informa-tion on ethnicity drawn from administrative registers. For the 9% of the sample which is lack-
ing this information, I use data from the PISA-questionnaires instead4, which leaves me with only 23 observations with missing information on ethnicity. Immigrants from Western coun-tries are very few in number (74 students). This group is excluded from the analysis. Of the 2,047 students in our combined sample, 45% are first generation immigrants (i.e. born
abroad), while the remaining 55% are born in Denmark (labelled the second generation) 5.
Dependent variable
All three assessments use the framework of the first international PISA assessment (con-ducted in the year 2000) with reading being the main assessment area. I use reading literacy test scores as our main outcome measure, because the math and science tests were given to only half the students in the sample and the sample size is therefore much smaller for these areas and results are therefore less precise. Yet, in a separate section, I provide suggestive re-sults for math and science, too.
The PISA tests focus on the demonstration of knowledge and skills in a form that is rele-vant to everyday life challenges rather than how well students master a specific school cur-riculum. Using Item Response Theory to compute the scores, PISA mapped reading perform-ance on a scale which has been standardised to an OECD average score of 500 points and a standard deviation of 100 points. Average reading scores for the immigrant sample are 406 points, compared to 501 for Danes, a difference of almost one standard deviation, which is about the same size of gap that is commonly found for Black and White students in the US.
The second generation does only slightly better than the first: 411 vs. 400 points6.
Variables of interest
The variables of interest are divided into two sets of variables: a set of four indicators, which are straightforward indicators of home culture. These four indicators are investigated in the first part of our empirical analysis. However, I am also interested in investigating other as-pects of students’ background like the language spoken at home, help with schoolwork etc. Some of these indicators are more obviously endogenous to test scores (in particular help with schoolwork) and results are therefore primarily descriptive. The four indicators of home culture are: cultural communication, social communication, home educational resources and
cultural possessions7. Dimensions of parental involvement and attitudes are: the language spoken in the stu-
dent’s home most of the time (Danish or other), family’s help with schoolwork, parental ac- 3
Western countries are defined as EU25 and other Western European countries, North America, Japan, Australia and
New Zealand. 4
The reason why I do not use PISA-data as the first choice is that information on ethnicity from the student question-
naires is missing in the PISA-Ethnic sample, which is more than half of my sample of immigrants. 5
If information on country of birth is missing for one parent, the child is an immigrant if the other parent is born
abroad, otherwise the child is a native Dane in our definition. 6
This difference is significant at the 5% level. 7
There is another indicator that could possibly be included in the analysis, too, namely information on cultural activi-
ties like visiting a museum, attending an opera or watching live theatre. There are two problems with this indicator, though. First, this indicator is not available in the PISA-Ethnic dataset, which makes up 60% of the immigrant sample. Second, from the wording of the questionnaire, there is no information on, whether the student engaged in these ac-tivities together with his parents/family. I therefore decided against including the indicator in the empirical analysis.
11

ceptance of student absence from school, participation in courses teaching the mother tongue, time spent on leisure activities, time spent on paid work, and the percentage of im-migrant students in the child’s school.
The first four indicators are based on a range of related items from the student question-naire. Since the items describing each single factor are thought to be different dimensions of a common underlying factor, they should be grouped into a single index, since including them one by one is likely to produce insignificant estimators due to their high correlation. Therefore, I combine variables measuring home culture into scales that measure conceptually distinctive dimensions of home culture.
As a first step of the analysis, I look at two types of communication between parents and child. The first dimension is a scaled measure of cultural communication. The index of cul-tural communication is derived from students’ reports on the frequency with which their parents (or guardians) engaged with them in the following activities: discussing political or social issues; and discussing books, films or television programmes. Students receive one point for discussing this with their parents ‘never or hardly ever’, 2 points for ‘a few times a year’, 3 points for ‘about once a month’, 4 points for ‘several times a month’ and 5 points for
‘several times a week’, resulting in a possible range of 2 to 10 on this scale8. A second type of communication centres on social communication (interaction). This in-
cludes the frequency with which parents discuss (i) how well their child is doing at school, (ii) eat the main meal with their child around a table, and (iii) spend time just talking to their child. This scale is scored similarly to the cultural communication scale, with a possible score of 1 to 5 for each item and 3 to 15 for the summed scale.
Next, I include a measure of home educational resources. This scale includes three items: whether the student has a dictionary in his home, a quiet place to study and a desk for studying. These three items are yes-no format questions for which students can receive 1 point, resulting in a possible range of 0 to 3 on this scale.
Finally, I index cultural possessions. This scale includes having textbooks, classical lit-erature, books of poetry, works of art, and whether the student has more than 250 books in his home. These items are also yes-no format questions for which students can receive 1
point, resulting in a possible score of 0 to 5 on this scale9. The dimensions of parental involvement and attitudes are scaled as follows. Language
spoken at home (Danish or other) and participation in courses teaching the mother tongue are yes-no format questions. Moreover, I have created an index on total help from the par-ents. The index ranges from 1 to 5 with steps of 0.5, with 1 indicating that neither parent ever helps the student with her schoolwork, and 5 indicating that both parents help the student several times a week. I have then grouped the index values into three categories: category 1 for index-values of 1 and 1.5 meaning that parents never or only rarely help their child with his schoolwork, category 2 for values in the range of 2 to 3.5 indicates that parents help a few times a year to once a month (for both parents on average), while category 3 means that the index value is 4 to 5, indicating frequent help from both parents (several times a month to several times a week). Next, I index parental acceptance of student’s absence from school.
8
This measure of cultural communication deviates slightly from what is used in the official PISA-dataset, where also
another item is included (the frequency with which the student listens to classical music with his parents). Yet, since listening to classical music is no direct communication – which is what I want to focus on – this item is not included in my analysis.
9 Also this measure deviates slightly from the definition used in the official PISA-dataset, where only three of the five
items are used for the index. Yet, an auxiliary principal component analysis conducted on the present dataset sugge-sted the inclusion of two additional items: whether the student has textbooks in his home and the number of books (overall) in his home.
12

Students receive 1 point for not missing school a single day in the previous four school weeks, 2 points for missing ‘one to two times’, 3 points for ‘three to four’ times and 4 points for ‘five times or more’.
I look at two types of afternoon/weekend activities: time used in organised leisure activi-ties and in a paid job. Both dimensions are indexed by a single question that asks how many hours the student spends a week on each activity. Students get 1 point for engaging in the ac-tivity less than four hours a week, 2 points for ‘five or six hours’, and 3 points for ‘seven hours or more’. Finally, I create four categories for the percentage of immigrant students in the child’s school: 0-10%, 10-25%, 25-50% and more than 50%.
Control variables (socioeconomic status)
A range of measures of the students’ socioeconomic status is included in the regressions as controls to identify the additional impact of home culture on student achievement. Since di-mensions like cultural communication and possessions are probably to some degree corre-lated with parental education, not including controls for socioeconomic status (hereafter, SES) would probably overstate the correlation between our variables of interest and test scores. The SES variables include child and family characteristics that likely affect effort through preferences or resource constraints and affect achievement as an input.
Therefore, I include information on the student and her family. In addition to student’s gender, I include a set of variables capturing opportunity costs, preferences, and resources: family size (nuclear family, number of siblings), parental education, occupation, labour-market status and income. As an alternative to the full set of controls for labour-market status, I have created a much more simple set consisting of four indicators: (i) both parents in job, (ii) no parent in job, (iii) only father in job, and (iv) only mother in job. In Table 4.2, I present regression results including one set at a time in order to decide whether I can settle for the more simple specification.
Empirical approach
The empirical assessment starts with a regression of student test scores on SES controls as a baseline. I control for student and family characteristics (X) such as student’s gender, family structure and number of siblings, parental education, occupation, labour-market attachment and income, to investigate how much of the variation in test scores is taken account of by the typical set of SES controls. If i indices individuals, the model with the continuous variable
describing reading test scores is: iREAD
i 0 iREAD = + X + iα β ε
(1)
where the α and 0β are coefficients, and iε is a random error.
The next step are separate sets of regressions (with and without SES controls) of reading test scores (READ) on each of our measures for home culture, since the four dimensions of home culture are probably highly correlated. In an additional set of regressions, I enter all four dimensions jointly in the regression. Formally, these models can be written as:
i 1READ = + HC + i iα β ε (2)
i 0 i 1 iREAD = + X + HC + iα β β ε (3)
13
where are the four dimensions of home culture. The coefficients iHC 1β for the different
measures of home culture inform about the correlation between measures of home culture and reading scores. If the measure of home culture is associated with educational achieve-ment, the coefficient yields an estimate that is significantly different from zero. If this differ-ence is due to compositional effects of sociodemographic characteristics of the student and his family, the effect should disappear once the control variables (X) are introduced. In the second part of the empirical analysis (4.3), equations (2) and (3) are estimated for each di-mension of parental involvement and attitudes. All regressions are estimated by Ordinary Least Squares with adjustment of the standard errors for clustering at the school level.
Section 4.4 provides some sensitivity checks of the results of the main analysis. The first check is the inclusion of immigration-specific control variables like immigrant generation and country of origin, which may have an additional impact over and above the usual set of SES controls. As a second check, I include school fixed effects in the regression to make sure that differences in school resources and parents’ school choice preferences are not driving the results alone. Last, we provide suggestive evidence on math and science scores, which are available only for roughly half of the student sample.
14

4 The impact of home culture and parental involve-ment and attitudes on student achievement
4.1 Outcomes and controls
The main outcome measure used in this study is PISA-reading test scores. The test score mean for immigrants is 406 and the standard deviation is close to the international standard deviation of 100. A histogram of the distribution is shown in Figure 4.1. The distribution is symmetric around the mean with a minor concentration of students at the lower tail of the distribution.
Figure 4.1 Distribution of reading scores
Table 4.1 shows average reading scores for various subsamples delineated by different di-mensions of SES. Girls fare better than boys, students with higher educated parents, with higher occupational status, better labour-market attachment and higher income all do better. Moreover, students with fewer siblings do better, while students in nuclear families only do marginally better.
15

Table 4.1 By group means of reading scores
Mean reading scores
Size of subgroup
Males 394 51%
Females 413 49%
Father: max lower secondary education 391 49%
Father: more than lower secondary education 422 51%
Mother: max lower secondary education 396 61%
Mother: more than lower secondary education 422 39%
Nuclear family 410 72%
Other family types 397 28%
Up to two siblings 411 68%
More than two siblings 394 32%
Lower 50% of parental occupational status 410 50%
Upper 50% of parental occupational status 433 50%
Lower 50% of parental income 393 50%
Upper 50% of parental income 417 50%
Parental labour-market attachment:
Both parents in job (full or part time) 427 29%
None of parents in job 394 35%
Only father in job 402 25%
Only mother in job 420 11%
As controls, I use the common range of variables describing parental resources and the family situation. Summary statistics for these dimensions of SES are available in Table 3.1 (column 4 for the entire sample). Regarding income and economic circumstances of the family, a key piece of information is the highest parental occupation and income. These measures provide a good indication of the family's financial circumstance. Whether students live with both bio-logical parents or not (72% live with both parents), and the number of children in the home are also facts about the family that are used in the analysis (68% live in families with up to three children). Finally, I know father’s and mother’s years of education, which is a useful in-dication of their human capital. These are the measured resources of the family. Further-more, I control for students’ gender and labour-market attachment.
Using multiple regression analysis, I can consider the total impact of SES on students test scores. Table 4.2 reports the regression analyses for the students’ reading test score. The results document the influence of the family’s socioeconomic background on the reading test scores. Children have higher reading test scores in families with higher parental education, occupation and income. Children in families with a larger number of children have lower test
scores10, and girls outperform boys. The only variable which is not significantly related to test scores, once the other variables are controlled for, is family structure, i.e. whether the student lives with both parents or not. Due to correlation, single coefficient estimates should be interpreted with great caution.
10
When I conduct the analysis by gender, it becomes apparent that only girls are harmed by more siblings.
16
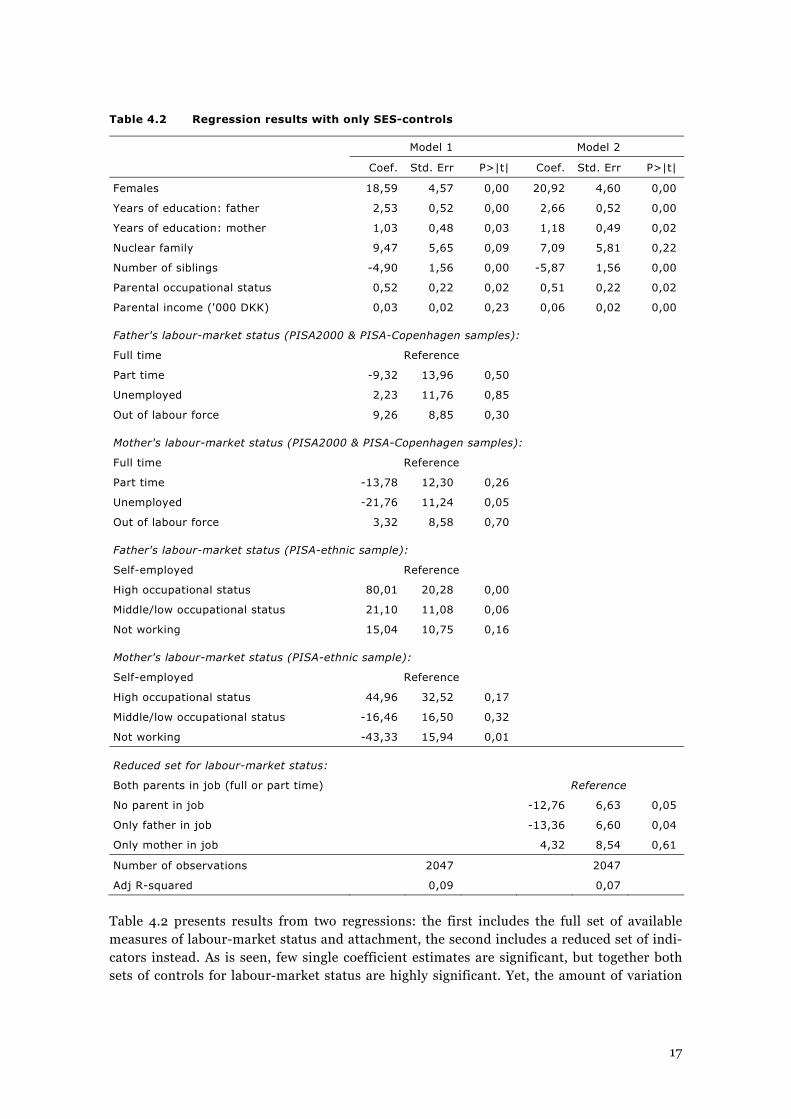
Table 4.2 Regression results with only SES-controls
Model 1 Model 2
Coef. Std. Err P>|t| Coef. Std. Err P>|t|
Females 18,59 4,57 0,00 20,92 4,60 0,00
Years of education: father 2,53 0,52 0,00 2,66 0,52 0,00
Years of education: mother 1,03 0,48 0,03 1,18 0,49 0,02
Nuclear family 9,47 5,65 0,09 7,09 5,81 0,22
Number of siblings -4,90 1,56 0,00 -5,87 1,56 0,00
Parental occupational status 0,52 0,22 0,02 0,51 0,22 0,02
Parental income ('000 DKK) 0,03 0,02 0,23 0,06 0,02 0,00
Father's labour-market status (PISA2000 & PISA-Copenhagen samples):
Full time Reference
Part time -9,32 13,96 0,50
Unemployed 2,23 11,76 0,85
Out of labour force 9,26 8,85 0,30
Mother's labour-market status (PISA2000 & PISA-Copenhagen samples):
Full time Reference
Part time -13,78 12,30 0,26
Unemployed -21,76 11,24 0,05
Out of labour force 3,32 8,58 0,70
Father's labour-market status (PISA-ethnic sample):
Self-employed Reference
High occupational status 80,01 20,28 0,00
Middle/low occupational status 21,10 11,08 0,06
Not working 15,04 10,75 0,16
Mother's labour-market status (PISA-ethnic sample):
Self-employed Reference
High occupational status 44,96 32,52 0,17
Middle/low occupational status -16,46 16,50 0,32
Not working -43,33 15,94 0,01
Reduced set for labour-market status:
Both parents in job (full or part time) Reference
No parent in job -12,76 6,63 0,05
Only father in job -13,36 6,60 0,04
Only mother in job 4,32 8,54 0,61
Number of observations 2047 2047
Adj R-squared 0,09 0,07
Table 4.2 presents results from two regressions: the first includes the full set of available measures of labour-market status and attachment, the second includes a reduced set of indi-cators instead. As is seen, few single coefficient estimates are significant, but together both sets of controls for labour-market status are highly significant. Yet, the amount of variation
17

in test scores explained by Model 1 is largest (R²). Therefore, I decided to use Model 1 in the analyses.
4.2 Home culture
Four dimensions of home culture are considered in the following analysis: cultural communi-cation, social communication, home educational resources and cultural possessions.
4.2.1 Cultural communication
Two items are used to describe cultural communication, one dimension of home culture. Stu-dents have been asked how often their parents discuss (i) political or social issues and (ii) books, films or television programmes with them. Figure 4.2 shows frequencies for these items. Overall, one in three immigrant students discusses political and social issues with their parents on a regular basis, i.e. several times a month or more. Yet, half of the immigrant students only rarely engage in discussing such issues with their parents (a few times a year at most). The frequency with which students engage in discussing books, films and TV pro-grammes with their parents is somewhat higher: 45% do so regularly, while 40% rarely do.
Figure 4.2 Distribution of answers: cultural communication
18

As explained in section 3, an index of cultural communication is calculated on the basis of these two items. The scale of this index is standardised with a mean of 0 and a standard de-viation of 1 for the entire sample (i.e. immigrants and Danes), so that results can be easily in-terpreted and comparisons be made between scales. In the upper part of Table 4.3, overall means and group means for the four indices of home culture are displayed. Column 1 shows the means for the cultural communication index. For immigrants, the index of cultural com-munication has a mean of -0.24 (which means a quarter of a standard deviation lower than for the total sample of Danes and immigrants).
19

Table 4.3 Results for home culture
Cultural communica-
tion
Social communica-
tion
Home educ. resources
Cultural possessions
(1) (2) (3) (4)
All -0,24 -0,2 -0,07 -0,52
Boys -0,35 -0,32 -0,06 -0,59
Girls -0,17 -0,08 -0,06 -0,49
Myos<=9 -0,32 -0,24 -0,13 -0,61
Myos>9 -0,12 -0,12 0,04 -0,37
Fyos<=9 -0,34 -0,26 -0,1 -0,65
Fyos>9 -0,14 -0,12 -0,03 -0,37
Nuclear family -0,22 -0,11 -0,05 -0,52
Not nuclear family -0,31 -0,42 -0,14 -0,49
<=2 siblings -0,23 -0,19 -0,03 -0,5
>2 siblings -0,26 -0,22 -0,14 -0,54
Low HISEI -0,32 -0,24 -0,17 -0,69
High HISEI -0,02 -0,16 0,01 -0,31
Low income -0,27 -0,15 -0,07 -0,53
High income -0,24 -0,12 0,02 -0,47
Both parents in job (full or part time) -0,14 -0,12 -0,002 -0,39
No parent in job -0,28 -0,25 -0,13 -0,52
Only father in job -0,26 -0,07 -0,1 -0,56
Only mother in job -0,2 -0,14 0,05 -0,59
Turkey -0,28 -0,2 -0,04 -0,5
Ex-Yugoslavia -0,23 0,03 -0,19 -0,66
Pakistan -0,24 -0,19 0,02 -0,6
Lebanon -0,19 -0,08 -0,08 -0,48
Gen1 -0,26 -0,28 -0,12 -0,48
Gen2 -0,23 -0,12 -0,03 -0,55
Regression results
Separate estimations
Without SES-controls
Coef 17,60 9,32 9,51 14,38
Se 2,30 1,89 2,11 2,60
Adj. R-sq 0,05 0,02 0,01 0,02
With SES-controls
Coef 13,05 6,84 6,59 8,84
Se 2,30 1,86 2,05 2,59
Adj. R-sq 0,12 0,10 0,10 0,10
Joint estimation
Without SES-controls
Coef 13,57 2,71 5,90 7,16
Se 2,61 2,06 2,16 2,72
Adj. R-sq 0,05
With SES-controls
Coef 10,69 2,01 4,47 3,63
Se 2,54 2,03 2,10 2,69
Adj. R-sq 0,12
20

Parents engage in cultural communication more frequently with their daughters than with their sons, a result that is also found by Houtenville & Smith Conway (2008). Students with higher educated parents engage more often in cultural communication, as do students in families with higher occupational status, while there is no significant difference by income. Students who live with both parents do marginally more often engage in cultural communica-tion, while whether the student has many or few siblings does not seem to play a part. There is no significant difference between the four countries of origin or by immigrant generation.
In the middle part of Table 4.3, each column presents the coefficients for each home cul-ture indicator from separate regressions. The bottom panel presents coefficients for the four home culture indicators after including all four in the same regression. Since the scales for the human capital indices are standardised, the coefficient in Table 4.3 implies that a one unit (=1 SD) increase in the index of cultural communication is associated with a 0.18 SD in-crease in reading scores in a regression without controls, and 0.13 SD in a regression with controls for SES included. Thus, as expected, controlling for differences in SES decreases the coefficient estimate, but higher levels of cultural communication are significantly related to higher reading scores also after controlling for SES.
4.2.2 Social communication
Figure 4.3 shows frequencies for the three items which enter into the calculation of the index of social communication. Overall, just over half of all immigrant students discuss how well they are doing at school with their parents several times a week, and further 27% do so sev-eral times a month. Yet, about 8% only rarely discuss this issue with their parents (a few times a year at most). There may be two reasons why students do not discuss school with their parents: either, because they are doing just fine, or, because parents are not interested in discussing school even though their children may not be strong learners. When I calculate average test scores, I find that students who rarely discuss how they are doing at school do much worse than the average.
The frequency with which parents eat a main meal around the table or spend time just talking with the student is higher than discussing school: 77% and 62% do this several times a week. Still, considering that these must be regarded as key indicators of a regular contact be-
tween parents and children, these numbers are not high11. Answers to the three single items are gathered in a common index of social communica-
tion12. For immigrants, the index of social communication has a mean of -0.20 (i.e. one fifth of a standard deviation lower than for the entire sample), see Table 4.3, second column.
11
For Danes, the respective numbers are: 87% and 74%. Only little of the gap between immigrants and Danes disappears,
when SES is controlled for. 12
As for cultural communication, the scale is standardised with a mean of 0 and a standard deviation of 1 for the entire
sample (i.e. immigrants and Danes).
21

Figure 4.3 Frequencies of answers for dimensions of social communication
As with cultural communication, girls engage in social communication more frequently than boys, as do students with higher educated parents, while there is no difference by the family’s financial means (occupation/income). Students who live with both parents engage more of-ten in social communication, while whether the student has many or few siblings does not
22

seem to play a role. There is no difference by country of origin, but first generation students engage less in social communication with their parents than immigrant students born in Denmark.
Results from multiple regressions of test scores on social communication are reported in Table 4.3 (middle panel, column 2). The size of the coefficient estimate means that a one unit increase in the index for social communication is associated with a 0.09 SD increase in read-ing scores in a regression without controls, and 0.07 SD in a regression where controls for SES are included. Thus, the SES-corrected relation between cultural communication and
reading scores is substantially higher than between social communication and test scores13.
4.2.3 Home educational resources
Three dimensions of home educational resources are considered: having a dictionary in one’s home, having a desk for studying and having a quiet place to study. Frequency counts of these three items reveal that almost all students have a dictionary at home (96%), and 91% have a desk for studying and 84% answer that they have a quiet place to study.
Table 4.3, column 3, shows that for immigrants, the index of home educational resources has a mean of -0.07 (i.e. the gap to Danes is much smaller than for the communication indi-ces). There are two differences compared to results for the communication indices: first, there is no gender gap for home educational resources, and the number of siblings has here a
clear negative correlation with the level of home educational resources14. Otherwise, the re-sults for home educational resources are broadly similar to those for cultural communication and social communication: students with higher educated mothers and parents with higher occupational status have higher levels of home educational resources and there is no signifi-cant difference between country of origin. Just as for cultural communication, there is no dif-ference between immigrant generations.
Results of a multiple regression analysis of test scores on home educational resources (Table 4.3, middle panel, column 3) show that a one unit increase in the scale for home edu-cational resources is associated with a 0.10 SD increase in reading scores in a regression without controls, and 0.07 SD in a regression where controls for SES are included. Thus, the correlation between home educational resources and reading scores is quite similar to that for social communication, but much lower than that for cultural communication.
4.2.4 Cultural possessions
The index of cultural possessions includes four items: having textbooks, classical literature, works of art and more than 250 books at home. Frequency counts show that about 40% of students have textbooks in their home, about 30% have some classical literature or poetry,
almost 50% have some work of art and 9% have more than about 250 books in their home15. The means for cultural possession levels in Table 4.3 indicate that for immigrants the in-
dex of cultural possessions has a mean of -0.52 (i.e. half a standard deviation below the full 13
Since one could easily imagine that talking about school can happen more frequently as a consequence of not doing so
well at school, the direction of causality is likely to be reversed for this item, which may decrease the estimate for the social communication index. To make sure that this is not driving the results, I have repeated the regression with a version of the social communication index not including this item. Results are virtually unchanged, suggesting that this is of no great concern.
14 An additional analysis shows that, interestingly, the difference is not due to the item quiet place to study, as one would
expect to be related to family size, but to dictionary and desk for studying. 15
Only 9% of immigrants have more than 250 books. I have conducted a robustness-check on the coding of the books-
variable: regression results are very similar when the cutoff-point is set at lower levels, e.g. 10 or 100 books.
23

sample mean). Differences in cultural possessions are most substantial by parental education and occupation: students with higher educated parents, and parents with a higher occupa-tional status and better labour-market attachment (both parents in job) have higher levels of cultural possessions. Interestingly, while these questions are asked about the house-
hold/home of the student, girls seem to enjoy higher levels of cultural possessions16. Results of multiple regressions of test scores on cultural possessions are reported in Ta-
ble 4.3, middle panel, column 4. A one unit increase in the scale for cultural possessions is associated with a 0.14 SD increase in reading scores in a regression without controls, and 0.09 SD in a regression where controls for SES are included.
The results on regressions, which include each index of home culture separately (Table 4.3, middle panel) show that all of the specific dimensions of home culture are statistically significantly associated with reading skills: cultural and social communication, home educa-tional resources and cultural possessions in the home, all show significant and positive asso-ciations. Including SES controls reduces the estimated coefficients by 20-35%, but all esti-mates stay positive and significant. The association is largest for cultural communication. The second highest correlation is found for cultural possessions, so the distinct cultural as-pect in the students’ parental home background is clearly important.
Yet, while all four indices are significantly related to reading scores when included sepa-rately, only cultural communication adds substantially to the explanatory power compared to the base-model including SES only (R²=0.09 vs. 0.12), indicating that most dimensions of home culture are highly correlated with SES.
Adding home culture indices to the production function does not substantially diminish other relationships, however. This suggests that the home culture measures are bringing new, independent information to the production function. At the same time, their omission does not seem to strongly bias the coefficients of the usual variables of interest (see Table A1), which is a reassuring result for researchers using data without such measures.
4.2.5 Joint estimation of the four indices
As described above, the empirical analysis started out by including the indices in separate regressions due to suspicions that the four dimensions of home culture are correlated. Table 4.4 confirms that this is indeed the case: the correlation is highest between cultural and so-cial communication and between cultural communication and possessions (about 0.40), while correlations between the remaining pairs of variables are roughly half that size.
Table 4.4 Correlation coefficients between the four dimensions of home culture
Cultural communication
Social communication
Home educ. resources
Cultural possessions
Cultural communication 1
Social communication 0,43 1
Home educational resources 0,17 0,20 1
Cultural possessions 0,39 0,19 0,23 1
16
This warrants a more in-detail analysis: Gender differences in single items are significant only for books of poetry
(22% of boys and 34% of girls). This difference is large and one can only speculate about its sources. Maybe girls are more interested in poetry and are therefore more aware of that they actually have such books in their home. Perhaps they have bought them for their personal use, which might explain why their brothers do not know about them.
24

25
In this next section, I conclude the analysis of home culture by entering all four indices jointly in the regression. Results of the joint estimation of all four factors of home culture are reported in the lower panel of Table 4.3. Including all factors jointly in a model substantially reduces the estimated coefficient sizes of most estimates. Yet, when SES is not controlled for, only social communication turns insignificant. In a model with controls included, the esti-mate for cultural possessions is insignificant, too. Thus, when entering all four indices simul-taneously, the results suggest that most of the impact on test scores comes from cultural communication. Also, including the four indices jointly does not add to the explanatory power compared with a model, where only cultural communication is included (R²=0.12 in both cases). These results suggest that among the four dimensions of home culture, cultural communication has the single strongest correlation with test scores.
4.3 Parental involvement and attitudes
Apart from information on home culture, student questionnaires also give information on other dimensions of parenthood that might be informative of their involvement with school and their attitudes towards school or integration related issues. Also these dimensions are possibly related to their children’s test scores. In this section, I consider issues like the lan-guage spoken at home, participation in mother-tongue lessons, leisure-time activities (par-ticipation in organised leisure activities or time spent in paid work), help with schoolwork, missing school and the student composition at school.
4.3.1 Language spoken at home
When students speak Danish at home most of the time, this may be a sign of greater integra-tion in the host society, and may promote students’ proficiency of Danish, leading to higher reading test scores. Table 4.5, column 1, shows the frequency with which students in different subsamples speak Danish in their homes. Only 20% of immigrant students speak mostly Dan-ish at home; 16% of the first generation immigrants and 23% of the second generation. Inter-estingly, more girls than boys speak Danish at home (23% vs. 17%). Contrary to what one might expect, the propensity to speak Danish at home does not differ significantly by parental education, occupation or income. There is a tendency for students in nuclear families to be more likely to speak another language than Danish. Students from Lebanon speak Danish at lower rates than the other immigrant groups (8% vs. 16-24%). In an international compari-son, in Denmark, immigrants speak the host country language at much lower rates than in other countries (Schnepf 2007).
Results on a multiple regression analysis of test scores on the language spoken at home are reported in Table 4.5, lower panel. Speaking Danish at home is associated with a 0.18 SD increase in reading scores in a regression without additional controls, and 0.13 SD in a re-gression where controls for SES are included. These impacts are of the same size as a one standard deviation increase in cultural communication index on reading scores, which was the highest among the four factors of home culture.

Table 4.5 Results for language at home, mother-tongue teaching, leisure activities and paid work
Organised leisure activities Paid work
Speak Danish at
home
Mother-tongue
teaching
No Less than 4 hours/
week
5 or 6 hours/ week
More than 7 hours/
week
No Less than 4 hours/
week
5 or 6 hours/ week
More than 7 hours/
week
All 20% 59% 31% 66% 14% 20% 44% 64% 9% 27%
Boys 17% 57% 18% 53% 16% 31% 37% 59% 10% 31%
Girls 23% 61% 41% 79% 12% 9% 51% 67% 9% 24%
Mother's education:
Max compulsory schooling 19% 62% 33% 66% 14% 20% 48% 65% 9% 26%
More than compulsory schooling 22% 55% 26% 66% 15% 19% 39% 61% 10% 28%
Father's education:
Max compulsory schooling 20% 62% 31% 67% 14% 19% 47% 66% 9% 25%
More than compulsory schooling 20% 58% 30% 65% 15% 21% 43% 62% 9% 29%
Nuclear family 19% 62% 30% 66% 15% 19% 52% 63% 9% 27%
Not nuclear family 24% 53% 34% 64% 13% 24% 57% 64% 10% 26%
Max 2 siblings 21% 58% 30% 67% 14% 20% 58% 62% 10% 29%
More than 2 siblings 18% 61% 31% 65% 16% 19% 49% 68% 9% 23%
Low occupational status 20% 55% - 45% 21% 34% - 59% 15% 25%
High occupational status 22% 56% - 45% 23% 31% - 58% 16% 26%
Low income 20% 58% 32% 77% 11% 12% 45% 67% 5% 27%
High income 18% 63% 28% 76% 10% 13% 43% 66% 6% 28%
Both parents in job 25% 59% 29% 64% 15% 21% 43% 62% 9% 29%
No parent in job 15% 61% 30% 66% 15% 19% 43% 64% 9% 27%
Only father in job 16% 65% 31% 66% 14% 20% 45% 66% 9% 26%
Only mother in job 27% 60% 29% 62% 15% 23% 45% 65% 10% 25%
Country of origin:
Turkey 24% 59% 29% 65% 14% 21% 40% 63% 10% 26%
Ex-Yugoslavia 17% 45% 34% 68% 14% 19% 33% 55% 10% 35%
Pakistan 16% 79% 42% 66% 17% 17% 59% 70% 11% 20%
Lebanon 8% 69% 26% 64% 14% 22% 47% 63% 9% 29%
First generation immigrant 16% 53% 31% 67% 14% 19% 43% 61% 9% 30%
Second generation immigrant 23% 64% 30% 65% 15% 21% 46% 65% 10% 25%

Organised leisure activities Paid work
Speak Danish at
home
Mother-tongue
teaching
No Less than 4 hours/
week
5 or 6 hours/ week
More than 7 hours/
week
No Less than 4 hours/
week
5 or 6 hours/ week
More than 7 hours/
week
Regression results
Without SES-controls
Coef 17,89 6,60 12,3 7,14 -4,77 -10,25 0,65 -5,91
Se 6,18 4,96 6,79 Ref. 7,21 6,3 3,75 Ref. 8,98 5,93
Adj. R-sq 0,02 0,00 0,002 0,001 0,001 0,00
With SES-controls
Coef 13,11 5,76 7,72 5,99 -0,35 -11,55 2,03 -3,88
Se 6,00 4,80 6,77 Ref. 7,10 6,47 5,87 Ref. 8,75 5,73
Adj. R-sq 0,11 0,09 0,08 0,09 0,09 0,10 0,09

4.3.2 Participation in mother-tongue lessons
Students have been asked whether they have (ever) participated in mother-tongue classes or-ganised by the school authorities in their municipality. Mother-tongue teaching is offered for two reasons: to enable the child to keep and develop the language of his/her country of ori-gin, and as an additional basis on which to build the acquisition of Danish as the child’s sec-ond language.
In all, almost 60% of all immigrants in our sample have attended mother-tongue lessons at some point of time during their compulsory school years (Table 4.5, column 2). Generally, there seems to be a slight tendency for children from lower educated parents to attend mother-tongue lessons at higher rates. There are no significant differences by gender, paren-tal occupation, income or labour-market participation. Students in nuclear families are more likely to attend mother-tongue lessons, as are, perhaps surprisingly, students born in Den-mark (second generation). Important differences occur in the rates of participation by coun-try of origin: with an attendance rate of almost 80%, Pakistanis are the most eager, while only 45% of Ex-Yugoslavians attend. Moreover (not shown in the table), even among those students who speak mostly Danish at home, 50% attend mother-tongue lessons.
Results on a multiple regression analysis of test scores on mother-tongue lessons are re-ported in Table 4.5, column 2 in the lower panel. Attending mother-tongue lessons is not sig-nificantly associated with reading scores in a regression, neither with nor without additional controls.
4.3.3 Organised leisure activities and paid job
What students do after school might also impact their academic skills. Language skills might be enhanced by talking to other youngsters in sporting clubs, playing in an orchestra, or when having a job after school in a supermarket. On the other hand, when parents allow their children to engage in such activities, this might also be merely a signal that the family is more integrated into the host society, such that any observed association between participating in these activities and higher test scores might be spurious. Unfortunately, only the PISA-Ethnic questionnaire has appropriate response categories to separate in organised leisure activities or paid work from participation up to four hours a week. The following results on non-participation are therefore based on the PISA-Ethnic subsample alone. It is found that 31%
do not engage in organised leisure activities at all17, 35% spend up to four hours a week in organised leisure activities, 14% spend 5 or 6 hours, while the remaining 20% spend more than that. Table 4.5 reports frequencies for participation in organised leisure activities and time spent in paid work. While more than 80% of boys engage in organised leisure activities, only 60% of girls do. Likewise, roughly 60% of boys and 50% of girls have ever had a job. Boys also spend more hours engaging in organised leisure activities and on a job than girls (the gender gap is larger for leisure activities than for jobs). Mother’s education influences students’ propensity to engage in organised leisure activities and paid job: while 33% and 48% of students with low educated mothers do not engage in organised leisure activities and a paid job, only 26% and 39% of students with mothers with more than compulsory schooling do not. Ex-Yugoslavians participate less in leisure activities, while Pakistanis less often take up paid work. Ex-Yugoslavians spend more time on paid work than their reference category
17
The results for how many students do not participate (both in organised leisure activities and paid job) at all are based
on the PISA-Ethnic subsample alone, because PISA-Copenhagen did not have this category in its student questionnaire (up to four hours was the minimum category) – and the questions were not asked at all in the PISA-2000 study.
28

29
(Turks), while there is no difference between countries of origin for time spent on leisure ac-tivities. There are no significant differences by family structure, father’s education, occupa-tion, income and immigrant generation, but having more than two siblings increases partici-pation in the job market, while decreasing the number of hours worked. Neither time spent in organised leisure activities nor time on job is associated with reading test scores, though (see Table 4.5, lower panel). Yet, when I look at participation (yes/no), having ever had a job is significantly associated with higher reading scores, while the correlation with participation (yes/no) in organised leisure activities is not significant.
4.3.4 Help with schoolwork
Students have been asked how often they receive help from their mother and father with their schoolwork. Table 4.6 illustrates the frequency with which parents help their children.
Roughly 40% of immigrant students never or only rarely receive help from their parents18, and another roughly 40% get help only once in a while. Only 20% of immigrant students are helped regularly by both parents, i.e. several times a month at least.
Differences in how often students are helped by their parents are evident by parental education (in particular, mother’s education), family structure, and parental occupation, but not by income, see Table 4.6. While about 40% of students with low educated mothers never or only rarely receive any help, only 30% of students with mothers with more than compul-sory schooling do; the same numbers apply for low and high occupational status, respec-tively. Also, almost 50% of students in non-nuclear families do not receive any help, but only 35% of students in two-parent families. There are no significant differences by country of ori-gin. Fewer second generation immigrants never receive any help and more are helped more than a few times a year/once a month. When no parent has a job, children are helped less regularly than when both parents have a job.
Perhaps surprisingly, the frequency of being helped with schoolwork by parents is nega-tively related to test score (Table 4.6, lower panel). When parental help with schoolwork is included as a set of dummy variables to describe the frequency of being helped, the results show that only the highest category, i.e. being helped several times a week, is associated with lower test scores compared to not or rarely being helped.
The pattern of estimates including and excluding SES shows that the absolute size of the negative coefficient is larger when SES is included. This means that in the regression without SES, there are at least two processes at work: on the one hand, students who do not do well are helped more (driving the coefficient towards a negative sign), and on the other hand, stu-dents with higher educated parents are helped more often, which drives the coefficient into a positive direction, when parental education is not controlled for. Once parental education is included in the model, the effect driving the estimate towards a positive sign is eliminated, which is mirrored in a decrease of the estimate size by about 70%. Thus, since I would not be-lieve that it is frequent parental help that is causing low achievement, I would tend to con-clude that while causality may run in both directions, the effect that low achievement causes parents to help more seems to dominate. Yet, without a more stringent model setup, i.e. prior test scores, I cannot investigate this any further.
18
This is the case for only 16% of Danes.

Table 4.6 Results for help with school work, missing school and immigrant concentration at school
Help with school work (parents)
Miss school (last 2 weeks)
Percentage immigrants in school
Never A few times a year /once
a month
Several times a
month/week
Not once 1 or 2 times
3 times or more
0-10% 10-25% 25-50% 50-100%
All 38% 42% 20% 64% 27% 9% 6% 20% 28% 46%
Boys 40% 40% 20% 69% 24% 7% 6% 21% 29% 45%
Girls 37% 43% 20% 60% 29% 11% 5% 19% 29% 48%
Mother's education:
Max compulsory schooling 42% 40% 18% 63% 28% 9% 4% 18% 29% 50%
More than compulsory schooling 32% 45% 22% 66% 25% 9% 8% 23% 26% 42%
Father's education:
Max compulsory schooling 40% 41% 19% 65% 26% 10% 4% 18% 27% 51%
More than compulsory schooling 36% 43% 21% 65% 28% 8% 6% 22% 29% 44%
Nuclear family 35% 44% 21% 59% 28% 12% 5% 19% 29% 47%
Not nuclear family 46% 38% 17% 66% 26% 8% 8% 22% 24% 46%
Max 2 siblings 39% 42% 19% 65% 26% 9% 6% 21% 30% 43%
More than 2 siblings 37% 41% 22% 63% 27% 10% 4% 17% 23% 56%
Low occupational status 42% 38% 20% 61% 25% 14% 8% 20% 22% 50%
High occupational status 31% 45% 24% 60% 32% 8% 11% 27% 22% 40%
Low income 38% 41% 21% 65% 26% 9% 3% 20% 32% 46%
High income 35% 47% 18% 69% 25% 6% 5% 18% 34% 44%
Both parents in job 33% 45% 22% 69% 23% 8% 8% 23% 27% 42%
No parent in job 42% 40% 19% 64% 28% 9% 4% 19% 25% 52%
Only father in job 38% 43% 19% 64% 28% 8% 4% 17% 29% 51%
Only mother in job 32% 45% 23% 63% 25% 12% 7% 19% 35% 39%
Country of origin:
Turkey 39% 41% 20% 61% 29% 10% 5% 18% 32% 44%
Ex-Yugoslavia 33% 43% 23% 60% 30% 10% 9% 24% 22% 45%
Pakistan 39% 47% 14% 72% 25% 4% 2% 21% 24% 54%
Lebanon 39% 36% 25% 66% 28% 6% 3% 21% 20% 56%
First generation immigrant 40% 39% 21% 67% 26% 7% 8% 24% 27% 42%
Second generation immigrant 37% 45% 19% 61% 28% 11% 4% 17% 28% 51%

Help with school work (parents)
Miss school (last 2 weeks)
Percentage immigrants in school
Never A few times a year /once
a month
Several times a
month/week
Not once 1 or 2 times
3 times or more
0-10% 10-25% 25-50% 50-100%
Regression results
Without SES-controls
Coef 11,42 -13,94 -23,79 -48,42 -22,38 -30,31 -48,04
Se Ref. 5,16 6,38 Ref. 5,23 8,13 Ref. 10,78 10,45 10,09
Adj. R-sq 0,01 0,03 0,02
With SES-controls
Coef 3,66 -19,84 -24,40 -43,42 -17,04 -26,57 -38,91
Se Ref. 5,01 6,22 5,05 7,91 Ref. 10,41 10,17 9,86
Adj. R-sq 0,10 0,13 0,10

4.3.5 Missing school
Students have been asked, how many times they missed school with their parents’ accept-ance/knowledge during the last two weeks of school. Parental acceptance of their child miss-ing school may be an indicator of how high a priority education has in students’ homes. Also, of course, frequent absence from school may hinder learning. Two out of three students an-swer that they have not missed school during the last four weeks, while one out of four has missed one or two days of school. 9% have missed three or more days of school (Table 4.6). Interestingly, girls miss school more than boys, and students from nuclear families miss school less often than students who do not live with both parents as do students whose par-ents belong to the 50% with lowest occupational status. Pakistani students miss school less often than students from the other three countries of origin.
As expected, missing school is negatively related to test scores (Table 4.6, lower part)19. A dummy-specification of the variable of interest shows that missing school once or twice out of two weeks decreases test scores by 0.24 SD, while missing three or more schooldays is re-lated to a test score decrease in the order of 0.50 SD.
4.3.6 Ethnic school composition
As a last dimension of parental involvement and attitudes, I consider the immigrant concen-tration in the child’s school. Since parents have some degree of school choice, they implicitly (or explicitly) choose the ethnic concentration as one dimension of school choice – either di-rectly by choosing school or indirectly by residential choice. I have grouped all schools into four categories, delineated by the percentage of immigrant children in the school. Table 4.6 shows the distribution of students across these four categories of immigrant concentration. 6% of the students in our sample attend schools without important shares of immigrant stu-dents (0-10%), 20% attend schools with 10-25% immigrants, 28% with 25-50% immigrants and the remaining 46% attend schools with a majority of immigrant students. The high per-centage of students attending immigrant-majority schools is of course partly due to the sam-pling scheme: in Copenhagen, schools are polarised (60% of immigrant students attend im-migrant-majority schools in the PISA-Copenhagen subsample) and PISA-Ethnic directly samples students from schools with high immigrant concentrations (46% of students in this sample attend immigrant-majority schools). The only subsample being drawn representa-tively from all schools is the PISA-2000 sample. In this sample, only 10% of immigrant stu-dents attend immigrant-majority schools, while 25% attend schools with only up to 10% im-migrants.
There are differences by parental education in the immigrant concentration in a child’s school (42% and 50% of students with high vs. low educated mothers attend immigrant ma-jority schools and similarly for father’s education) and occupational status (40% and 50% for high and low status, respectively), Table 4.6. Also, students with more siblings and with mothers who are not working tend to attend schools with more immigrant students. Students from Ex-Yugoslavia attend schools with lower concentrations than students from the other three countries. Contrary to what one might expect, second generation students attend immi-grant majority schools at higher rates than the first generation. This may partly be due to an
19
There is a mistake in the 2000 PISA-questionnaire for Denmark: instead of asking about absence during the last two
weeks of school, the period asked about was four weeks. When the estimation is rerun without PISA2000 students, the results hardly change.
32

33
immigrant dispersion policy for refugees, which aimed at promoting better integration of refugees by means of geographic dispersal of refugees.
When I regress the school composition categories on reading scores, I find a negative as-sociation between the percentage of immigrant students in the child’s school and reading scores (Table 4.6, lower panel). When differences in SES are controlled for, the coefficients are reduced, but for two highest categories, 25-50% and more than 50%, the estimates stay negative and significant. Thus, controlling for selection by SES into schools with different immigrant shares, more immigrants are associated with lower reading scores for immigrant students when the immigrant percentage exceeds 25% (by 0.27 SD). For immigrant majority schools, the disadvantage is even larger (0.39 SD) compared to schools with very few immi-grants (0-10%).
Yet, the existing empirical literature on this issue for Denmark is ambiguous about at
what point of immigrant concentration student achievement starts to fall20. Thus, while there is no doubt that high immigrant percentages harm academic achievement, it is not clear where the turning point of immigrant concentration after which performance starts to dete-riorate is located.
Also, Rangvid (2008) shows that it is probably another – yet closely correlated – dimen-sion of peer quality that is the key for student achievement. When average parental education of the peers in school is added to a model including the immigrant concentration in the schools (and the usual battery of student and family controls), the estimate of the immigrant concentration decreases substantially and turn insignificant suggesting that the socioeco-nomic composition of schools might be more important than the ethnic composition.
4.4 Checking the robustness of the estimates
4.4.1 Including immigration-specific variables
A material issue of relevance in interpreting the estimated impact of home culture, parental involvement and attitudes over and above the effect of socioeconomic dimensions, is the abil-ity to fully control for differences in students’ socioeconomic status. In the regressions above, I included the usual suspects regarding socioeconomic dimensions as controls in the estima-tions. Yet, one might argue that whether the student was born in Denmark or immigrated (as a child) and the country of origin also might be proxies for observed and unobserved differ-ences that are exogenous. However, they might be correlated with measures of student home background. If this is so, not including these variables might lead to over- or underestimated coefficients on the variables of interest. Therefore, as a robustness check, I present results from regressions which include these variables as additional controls. For comparison, I also include the results from the main analysis in section 4.2 in Table 4.7 (column 1).
20
Jensen & Smith (2008); Jensen & Rasmussen (2008); DØRS (2007); Rangvid (2006).

Table 4.7 Results from regressions including immigrant-specific variables and school fixed effect
With SES With SES + IM-specific With SES + SFE
(1) (2) (3)
Robust Robust Robust
Coef. Std. Err Adj. R2 Coef. Std. Err Adj. R2 Coef. Std. Err Adj. R2
Cultural communication 13,1 2,3 0,12 12,9 2,3 0,14 10,5 2,4 0,20
Social communication 6,8 1,9 0,10 7,1 1,9 0,12 7,0 1,9 0,19
Home educational resources 6,6 2,1 0,10 6,2 2,0 0,12 5,0 2,1 0,18
Cultural possessions 8,8 2,6 0,10 8,9 2,6 0,12 7,8 2,7 0,18
Joint estimation
Cultural communication 10,7 2,5
0,12
10,3 2,5
0,14
7,7 2,6
0,20 Social communication 2,0 2,0 2,4 2,0 3,5 2,1
Home educational resources 4,5 2,1 4,0 2,1 2,8 2,2
Cultural possessions 3,6 2,7 3,8 2,7 3,5 2,8
Speak Danish at home 13,1 6,0 0,11 8,5 6,0 0,13 10,4 6,3 0,19
Mother-tongue lessons 5,8 4,8 0,09 4,7 4,8 0,11 6,8 4,9 0,18
Org. leisure activities 0,4 3,2 0,09 0,6 3,2 0,11 2,2 3,2 0,18
Paid job -1,8 2,8 0,09 -0,9 2,8 0,11 -0,4 2,9 0,18
Help schoolwork -6,2 1,8 0,11 -5,9 1,8 0,13 -5,3 1,8 0,19
Miss school -22,7 3,4 0,12 -21,4 3,4 0,13 -22,7 3,6 0,20
Percentage immigrants in school:
0-10% - -
0,10
- -
0,12
- -
- 10-25% -17,0 10,4 -21,5 10,4 - -
25-50% -26,6 10,2 -32,6 10,2 - -
50-100% -38,9 9,9 -43,5 9,9 - -
34
Generally, the results show that the coefficients for the home culture indicators hardly
change when I add immigrant generation and country of origin as controls21. Only the coeffi-cient for speaking mainly Danish at home falls noticeable by 28% and is now only marginally significant, indicating that immigrant generation or country of origin (or both) is correlated with speaking Danish at home. Thus, the significant association between speaking Danish and reading scores is at least partly due to the fact that second generation immigrants do bet-ter in the reading test, and they also speak more Danish at home, since e.g. students from Lebanon underperform compared to the immigrant average and also have a low propensity to speak Danish at home. Also, when including immigrant characteristics, the association be-tween attending a school with 10-25% immigrant student increases and is now marginally significant.
4.4.2 School fixed effects
Above, it was argued that which school to attend is a choice variable for parents. Thus, I would expect that parents with different home culture, involvement and attitudes and SES choose different schools, i.e. that these dimensions are correlated. If which school they attend matters for students’ reading scores, and home culture and these school (fixed) effects are correlated, omitting school fixed effects from the regression might bias the estimates on home culture (and SES). To be safe, I present results on regressions taking account of school fixed effects as a robustness check. Including school fixed effects allow me to remove any ob-servable as well as unobservable effects that are fixed within schools. In particular, as we saw above, the ethnic student composition in schools attended differs by parental education, im-migrant generation and country of origin. This suggests systematic differences between schools attended by different groups of immigrants. This might affect reading scores if peer effects matter. The following school fixed effects estimations control for such systematic dif-ferences.
The coefficient estimates for home culture and the parental involvement and attitudes indicators from a regression including socioeconomic characteristics and school fixed effects
are reported in Table 4.7, column 322. The pattern shows that, as one would expect, including school fixed effects reduces the
estimates for most (significant) home culture indicators. This suggests that schools fre-quented by immigrants with lower levels of home culture, parental involvement and attitudes are less conducive to academic achievement than schools frequented by immigrants with higher levels of home culture. Moreover, adding school fixed effects adds substantial explana-tory power to the model: adjusted R-sq is at least twice as large as in the model with SES con-trols alone.
21
I include indicator variables for the ten countries of origin with the largest number of observations in the dataset. These
are Turkey, Lebanon, Ex-Yugoslavia, Morocco, Somalia, Iraq, Pakistan, Vietnam, Afghanistan and Iran. The remaining observations are gathered in a residual group.
22 Due to perfect collinearity, we cannot include the percentage of immigrant students in the school together with school
fixed effects.
35

Table 4.8 Regression results for math and science test scores
MATH SCIENCE
With SES With SES + IM-specific
With SES + SFE With SES With SES + IM-specific
With SES + SFE
(1) (2) (3) (1) (2) (3)
Robust Robust Robust Robust Robust Robust
Coef. Std. Err
Adj. R2 Coef. Std. Err
Adj. R2 Coef. Std. Err
Adj. R2 Coef. Std. Err
Adj. R2 Coef. Std. Err
Adj. R2 Coef. Std. Err
Adj. R2
Cultural communication 12,5 3,0 0,11 12,6 3,0 0,11 13,0 3,1 0,19 6,2 3,2 0,06 6,1 3,2 0,06 3,8 3,5 0,11
Social communication 5,8 2,4 0,09 5,8 2,4 0,09 5,4 2,6 0,17 3,2 2,6 0,05 3,4 2,7 0,06 3,2 2,9 0,11
Home educational resources 7,1 2,6 0,09 6,9 2,6 0,09 6,0 2,9 0,16 5,3 2,9 0,05 5,0 2,9 0,06 5,1 3,2 0,11
Cultural possessions 12,5 3,3 0,09 12,7 3,3 0,10 12,8 3,6 0,17 9,9 3,6 0,06 10,0 3,6 0,07 9,8 4,0 0,11
Joint estimation
Cultural communication 9,7 3,4 0,11 9,8 3,4 0,12 11,1 3,6 0,19 4,0 3,5 0,06 3,8 3,5 0,07 1,1 3,9 0,11
Social communication 0,0 2,7 0,0 2,7 -0,7 2,9 0,2 2,9 0,4 2,9 1,1 3,1
Home educational resources 5,0 2,7 4,9 2,7 4,7 2,9 3,8 3,0 3,5 3,0 3,4 3,3
Cultural possessions 7,6 3,4 7,9 3,4 7,3 3,8 6,7 3,8 6,9 3,8 7,5 4,2
Speak Danish at home 18,6 7,9 0,09 16,1 7,9 0,10 9,4 8,7 0,16 12,9 8,2 0,05 9,9 8,3 0,06 9,0 9,2 0,11
Mother-tongue lessons -1,6 6,3 0,08 -3,8 6,4 0,08 -7,5 6,7 0,16 5,7 6,7 0,05 6,4 6,8 0,06 16,3 7,4 0,11
Org. leisure activities 1,4 4,1 0,08 1,1 4,2 0,08 2,8 4,5 0,17 0,2 4,6 0,05 0,6 4,6 0,06 -1,3 5,0 0,11
Paid job 1,3 3,7 0,08 2,2 3,7 0,08 0,6 3,9 0,16 -0,7 4,1 0,05 0,1 4,0 0,06 -1,8 4,4 0,11
Help schoolwork -4,0 2,3 0,10 -3,6 2,3 0,10 -4,2 2,5 0,18 -4,1 2,5 0,06 -4,1 2,5 0,06 -4,9 2,8 0,08
Miss school -14,8 4,5 0,09 -13,8 4,5 0,10 -11,9 5,1 0,16 -19,4 4,8 0,06 -18,6 4,8 0,07 -24,8 5,4 0,13
Percentage immigrants in school*:
10-25% -23,4 13,4 0,08 -25,0 13,4 0,09 - - - -18,9 15,1 0,07 -19,8 15,1 0,07 - - -
25-50% -25,0 13,0 -28,2 13,1 - - -31,1 14,9 -34,0 15,0 - -
50-100% -39,3 12,6 -42,4 12,6 - - -48,8 14,5 -49,2 14,4 - -

4.4.3 Math and science results: suggestive evidence
The relevant reading sample to compare to the math sample is not the full sample used above, but only those students who have been tested in both subjects. Therefore, as a robust-ness check, I present results for reading test scores for two subsamples (Table A2 in the ap-pendix): the math sample and the science sample (i.e. only students, who have also been tested in math/science). The general picture is the same as in the full reading sample, no matter whether regressions are run on the full sample or either subsample: of the home cul-ture indicators, cultural communication has the most convincing impact on reading scores (at
least in the joint estimation)23 help with schoolwork and missing school has generally a nega-tive and significant association with reading scores and having an immigrant percentage in schools of 10-25% is just on the verge of being significant at the 5% level compared to the ref-erence category of 0-10%, while the estimates for immigrant percentages of more than 25%, and in particular above 50%, are large and highly significant. Thus, we can safely conclude that the math and science subsamples are not systematically different.
Table 4.8 shows regression results for math and science scores. The model explains a similar share of the total variation in math scores as it does for reading scores (about 20% when school fixed effects are included), while the amount explained is much lower for science scores. Just as for reading scores, in the joint estimation, cultural communication is the strongest predictor of math scores of the four home culture indicators, while this is not the case for science scores. Cultural possessions turn out to be more important for math and sci-ence scores than for reading scores, but are only marginally significant. Also for math and science, missing school is negatively related to test scores, but for math scores, this effect is only half the size as for reading and science. For both math and science scores, results for the percentage of immigrant students are similar to those for reading scores.
4.5 Discussion and conclusion
This study is an exploratory investigation of the roles of home culture and parental involve-ment and attitudes for immigrant students’ test scores. The results indicate that among the four dimensions of home culture, cultural communication is closest related to higher reading and math scores, while none of the four dimensions is convincingly related to science scores. When included one at a time, the other three dimensions of home culture are significantly re-lated to reading and math scores, though, indicating that the high correlation between some of the home culture dimensions makes it difficult to single out isolated effects.
Frequent parental help with schoolwork and frequently missing school are generally negatively related to test scores, but the direction of causation is ambiguous. The percentage of immigrant peers in the school is negatively related to test scores in all subjects. The re-maining factors of parental involvement and attitudes examined here, such as language at home, participation in mother-tongue lessons and leisure activities cannot be shown to be consistently related to test scores, while (ever) having had a paid job is related to higher read-ing scores.
These results point at the importance of home culture, and in particular the cultural di-mension. Parents engaging in discussions, not only about everyday life, but more sophisti-cated, cultural issues frequently with their children are crucial for students’ academic compe-tencies. 23
Yet, the coefficient is not significant for the science sample, model (3).
37

5 References
Angrist, J.D. & V. Lavy (1999): Using Maimonides' Rule to Estimate the Effect of Class Size on Student Achievement. Quarterly Journal of Economics, 114 (2): 533-575.
DØRS, Secretariat of the Economic Councils – Det Økonomiske Råds Sekretariat (2007): In-tegration of immigrants and descendants (Danish title: Integration af indvandrere og efterkommere). Chapter 4 in: Danish economy (“Dansk økonomi”).
Hanushek, E. (1992): The Trade-off between Child Quantity and Quality. Journal of Political Economy, 100 (1): 84-117.
Hanushek, E. (1996): School Resources and Student Performance. In G. Burtless (Ed.): Does Money Matter? The Effect of School Resources on Student Achievement and Adult Suc-cess. 43–73. Washington, D.C.: Brookings Institution Press.
Hanushek, E., J. Kain, J. Markman & S. Rivkin (2003): Does Peer Ability Affect Student Achievement? Journal of Applied Econometrics, 18 (5): 527-44.
Houtenville, A.J. & K. Smith Conway (2008): Parental Effort, School Resources, and Student Achievement. Journal of Human Resources, 43(2):383-412.
Jensen, P. & A.W. Rasmussen (2008): Immigrant and native children’s cognitive outcomes and the effect of ethnic concentration in Danish schools. Study paper No. 20, University Press of Southern Denmark.
Jensen, P. & N. Smith (2008): Ethnic concentration in public schools (Danish title: Etnisk koncentration i folkeskolen). In N. Egelund & T. Tranæs (Eds.) PISA Etnisk 2005.
Krueger, A. (1999): Experimental Estimates of Education Production Functions. Quarterly Journal of Economics 64 (2): 497-532.
Rangvid, B.S. (2006): School composition in Copenhagen public schools. (In Danish – Elevsammensætning i Københavns Kommunes folkeskoler belyst ved PISA-København-data). AKF, Copenhagen.
Rangvid, B.S. (2007): Living and Learning Separately: Ethnic Segregation of School Children in Copenhagen. Urban Studies, 44 (7): 1329–1354.
Rangvid, B. S. (2008): Source country differences in test score gaps: Evidence from Den-mark. Study Paper No. 22, Rockwool Foundation Research Unit, University of Southern Denmark Press.
Rivkin, S.; E. Hanushek & J. Kain (2005): Teachers, Schools, and Academic Achievement. Econometrica, 73 (2): 417–458.
Schnepf, S.V. (2007): Immigrants' educational disadvantage: an examination across ten countries and three surveys. Journal of Population Economics, 20 (3): 527-545.
38
6 Dansk sammenfatning
Dette arbejdspapir undersøger, hvilken rolle en række indikatorer for hjemmekultur samt forældrenes engagement og holdninger til barnets uddannelse og integration spiller for ind-vandrerelevers boglige færdigheder (målt ved PISA-testene).
Resultaterne viser, at i blandt de fire forskellige dimensioner af hjemmekultur er det kul-turel kommunikation, der betyder mest for niveauet i læsning og matematik. For eksempel får indvandrerbørn (med en gennemsnitlig social baggrund), der næsten aldrig taler om kul-turelle emner derhjemme, kun 380 point i læsetesten, mens ellers socialt lignende indvan-drerbørn, der af og til taler om kulturelle emner med deres forældre, scorer 20-30 point høje-re. Og børn, der ofte taler med deres forældre om kulturelle emner, scorer hele 35-50 point højere.
Derimod findes der for ingen af de fire dimensioner en overbevisende sammenhæng med testscorer i naturvidenskab. Sammenhængen med testscorer for de tre øvrige dimensioner af hjemmekultur er svagere, og den forsvinder, når effekten af alle fire dimensioner vurderes samtidig.
Desuden er det at have prøvet at have et fritidsjob relateret til højere læsescorer, hvor-imod elever, som har hyppige fravær fra skolen, eller som går i en skole med en høj indvan-drerkoncentration, klarer sig dårligere i PISA-testene. De øvrige dimensioner af forældreen-gagement og -holdninger, der er undersøgt, såsom sprog talt i hjemmet, deltagelse i moders-målsundervisning og fritidsaktiviteter, samvarierer ikke systematisk med elevernes testsco-rer.
39

40
7 Appendix

Table A1 Full regression results with and without single dimensions of home culture
coef se coef se coef se coef se coef se
Cultural communication 13,06 2,29
Social communication 6,85 1,86
Home educational resources 6,60 2,05
Cultural possessions 8,84 2,59
Females 18,59 4,57 16,11 4,52 16,44 4,56 18,32 4,56 17,48 4,57
Years of education: father 2,53 0,52 2,26 0,52 2,38 0,52 2,49 0,52 2,40 0,52
Years of education: mother 1,03 0,48 1,04 0,48 0,93 0,48 0,97 0,48 0,97 0,48
Nuclear family 9,47 5,65 8,32 5,58 7,02 5,65 8,86 5,64 10,04 5,64
Number of siblings -4,90 1,56 -4,21 1,54 -4,92 1,55 -4,68 1,56 -4,57 1,56
Parental occupation 0,52 0,22 0,39 0,22 0,50 0,22 0,50 0,22 0,42 0,22
Parental income ('000 DKK) 0,03 0,02 0,03 0,02 0,03 0,02 0,03 0,02 0,02 0,02
Father's labour-market status* (PISA2000 & PISA-Copenhagen samples):
Full time Reference
Part time -9,32 13,96 -13,98 12,13 -12,97 12,24 -14,18 12,27 -12,98 12,27
Unemployed 2,23 11,76 -21,45 11,09 -21,70 11,18 -19,47 11,24 -19,76 11,23
Out of labour force 9,26 8,85 1,85 8,46 3,40 8,53 3,98 8,56 5,32 8,57
Mother's labour-market status* (PISA2000 & PISA-Copenhagen samples):
Full time Reference
Part time -13,78 12,30 -8,12 13,77 -7,35 13,88 -8,47 13,93 -8,26 13,93
Unemployed -21,76 11,24 0,91 11,60 4,45 11,70 2,23 11,74 1,48 11,73
Out of labour force 3,32 8,58 8,53 8,73 8,87 8,80 8,67 8,84 9,72 8,83
Father's labour-market status** (PISA-ethnic sample):
Self-employed Reference
High occupational status 80,01 20,28 75,12 20,02 79,41 20,16 79,84 20,23 77,87 20,24
Middle/low occupational status 21,10 11,08 23,79 10,93 22,82 11,02 22,36 11,06 22,47 11,06
Not working 15,04 10,75 16,54 10,60 17,73 10,71 16,27 10,73 15,94 10,73
Mother's labour-market status** (PISA-ethnic sample):
Self-employed Reference
High occupational status 44,96 32,52 39,02 32,09 41,04 32,35 44,96 32,44 41,63 32,45
Middle/low occupational status -16,46 16,50 -18,15 16,28 -19,07 16,44 -15,88 16,46 -15,54 16,46
Not working -43,33 15,94 -42,83 15,72 -45,68 15,87 -42,83 15,90 -43,42 15,90
Number of observations 2047 2047 2047 2047 2047
Adj R-squared 0,09 0,12 0,10 0,10 0,10
* The category of reference is full time employment. ** The category of reference is self-employed.

Table A2 Reading scores results for the math and science subsamples
READ (Math sample)
READ (Science sample)
With SES With SES + IM-specific With SES + SFE With SES With SES + IM-specific With SES + SFE
(1) (2) (3) (1) (2) (3)
Robust Robust Robust Robust Robust Robust
Coef. Std. Err Adj. R2 Coef. Std. Err Adj. R2 Coef. Std. Err Adj. R2 Coef. Std. Err Adj. R2 Coef. Std. Err Adj. R2 Coef. Std. Err Adj. R2
Cultural communication 13,8 3,3 0,12 13,9 3,3 0,13 11,5 3,6 0,17 11,1 3,2 0,10 10,8 3,2 0,12 8,8 3,5 0,18
Social communication 8,8 2,7 0,10 9,1 2,7 0,12 7,7 2,9 0,16 6,4 2,7 0,10 6,4 2,7 0,11 7,3 2,8 0,17
Home educational resources 5,1 2,9 0,09 5,2 2,9 0,11 1,0 3,2 0,16 5,1 2,9 0,09 4,5 2,9 0,11 3,3 3,2 0,17
Cultural possessions 5,6 3,7 0,09 6,0 3,7 0,11 6,3 4,1 0,16 8,8 3,6 0,09 9,0 3,6 0,11 6,9 4,0 0,17
Joint estimation
Cultural communication 11,3 3,8
0,12
11,0 3,8
0,14
8,5 4,1
0,17
8,6 3,5
0,10
8,2 3,5
0,12
5,8 3,9
0,17
Social communication 4,1 3,0 4,5 3,0 4,6 3,3 2,7 2,9 2,8 2,9 4,9 3,1
Home educational re-sources
2,9 3,0 2,9 3,0 -0,8 3,3 2,8 3,0 2,2 3,0 0,9 3,3
Cultural possessions -0,1 3,9 0,3 3,8 2,1 4,3 4,2 3,8 4,6 3,8 3,4 4,2
Speak Danish at home 20,6 8,8 0,10 16,2 8,8 0,12 17,8 9,7 0,17 13,3 8,2 0,10 9,2 8,3 0,11 8,5 9,1 0,18
Mother-tongue lessons 5,6 7,0 0,09 3,6 7,1 0,10 0,4 7,6 0,16 6,9 6,8 0,09 5,6 6,8 0,10 8,8 7,3 0,17
Org. leisure activities 4,1 4,6 0,09 4,2 4,6 0,10 5,8 5,0 0,16 2,3 4,6 0,09 2,6 4,6 0,10 3,2 5,0 0,17
Paid job 1,1 4,1 0,09 2,5 4,1 0,10 3,6 4,4 0,16 -6,5 4,1 0,09 -5,3 4,1 0,10 -6,7 4,3 0,17
Help schoolwork -6,5 2,6 0,10 -5,8 2,6 0,12 -4,0 2,9 0,16 -5,1 2,5 0,10 -4,9 2,5 0,11 -4,6 2,7 0,18
Miss school -24,6 5,0 0,11 -23,9 5,0 0,13 -25,7 5,6 0,18 -22,3 4,8 0,11 -20,7 4,8 0,12 -22,7 5,4 0,18
Percentage immigrants in school*:
10-25% -23,8 14,9
0,10
-25,7 14,9 - - -25,6 15,2
0,11
-27,3 15,1
0,12
- - -
25-50% -33,0 14,6 -37,6 14,6 - - -35,0 15,0 -40,4 15,0 - -
50-100% -44,0 14,0 -47,7 14,0 0,12 - - -54,2 14,6 -57,0 15,1 - -


Using data from three Danish PISA-studies, I conduct an exploratory in-vestigation of the relation between home culture and parental involve-ment and attitudes towards integration and school on immigrants’ test scores. The result indicates that only a few of the indicators investigated in this study can be shown to influence students’ test scores. Cultural communication is shown to be the factor of home culture that is most closely related to higher test scores.