the impact of hiv/aids and arv treatment on worker ...cp2124/papers/arv.pdf · the impact of...
TRANSCRIPT

The Impact of HIV/AIDS and ARV Treatment on
Worker Absenteeism: Implications for African Firms∗
James Habyarimana†, Bekezela Mbakile‡and Cristian Pop-Eleches§
First Draft - February 2007This Draft -August 2009
Abstract
In 2001, the Debswana Diamond Company started the first firm-based pro-
gram in Africa to provide free anti-retroviral treatment (ARVs) to HIV+ employees.
We link individual health information from the firm’s treatment program to a unique
panel dataset of all the doctor sanctioned and non-medical episodes of absenteeism
at the firm’s two main mines between the period 1998-2006. This dataset allows us
to characterize medium and long-run impacts of the disease and ARV treatment that
existing data cannot address. Compared to workers that never enroll in the treatment
program, there is no statistically significant difference in the absenteeism rate of en-
rolled workers in the period 15 months to 5 years prior to treatment start. Next we
present robust evidence of an inverse-V shaped pattern in worker absenteeism around
the time of ARV treatment inception. Enrolled workers are absent about 20 days in
the year leading up to treatment initiation with a peak of 5 days in the last month.
This is about five times the annual absence duration due to illness among non-enrolled
workers. The introduction of ARV treatment is followed by a large reduction in ab-
senteeism 6-12 months following treatment inception. Absenteeism 1 to 4 years after
treatment start is low and similar to non-enrolled workers at the firm.
Next we present a simple model to understand the conditions under which it is
optimal for profit-maximizing firms to establish workplace treatment programs for
HIV positive workers. Under plausible assumptions about the labor market and the
efficacy of treatment, our results suggest that for the typical manufacturing firm across
East and Southern Africa, the benefits of treatment to the firm cover 8-22% of the
cost of treatment. Without large increases in worker productivity, sizeable subsidies
or declines in the cost of treatment, workplace treatment programs are not a feasible
avenue for addressing the epidemic in high prevalence African economies.
∗We would like to thank the editor, two referees, Janet Currie, Mark Duggan, Bill Evans, Josh GraffZivin, Michael Hislop, Ted Joyce, Sarah Reber, Andrei Shleifer, Harsha Thirumurthy, Eric Verhoogen and
seminar participants at the BREAD, Brookings Institution, Case Western, Cuny-NBER Health Seminar,
Columbia, and NBER Summer Institute for helpful comments.†Georgetown University, Public Policy Institute, e-mail: [email protected]‡Debswana Diamond Company, HR Planning Superintendent, e-mail: [email protected]§Columbia University, Department of Economics and SIPA, e-mail: [email protected]
1

1 Introduction
In this paper we focus on the effect of HIV/AIDS on firms in the most affected African
economies and try to understand whether, in an environment where the costs of the disease
are high and treatment using anti-retroviral therapy (ARVs) is available and effective, it is
economically beneficial for firms to provide treatment to their workers. Understanding the
implications of HIV/AIDS and its treatment is an interesting case study in human resource
management given the high prevalence of the disease in the working age population. While
the positive health effects of anti-retroviral treatments (ARVs) around the world are by
now well established (Hammer et al. (1997), Duggan and Evans (2005), Floridia et al.
(2002), Lichtenberg (2006), Koenig et al. (2004), Wools-Kaloustian et al (2006)), the existing
evidence has been limited to analyzing only the short run impact of HIV/AIDS and ARV
treatment on labor market outcomes (Thirumuthy et al (2005), Fox et al (2004) and Larson
et al. (2008)).
We take advantage of a unique dataset that permits a description of the medium and long
term economic impacts of HIV/AIDS and the benefits of ARV treatment to workers and
firms. More specifically we analyze the pattern of labor market absenteeism of workers with
HIV/AIDS in the years prior to and following the start of ARV treatment, using detailed
human resource data spanning a period of almost 10 years from a large private mining
firm in Botswana. Secondly, we evaluate the feasibility of workplace programs for ARV
treatment in Africa using our empirical results, data from recent manufacturing surveys on
compensation and assumptions about worker productivity and wage setting behavior. We
develop a framework to predict the conditions under which firms will provide ARV treatment
to their workers. We find that although ARV treatment is extremely effective in reducing
absenteeism in the medium and long run, firms’ willingness to pay for treatment is only a
small fraction of treatment costs.
In the first part of our analysis we estimate the impact of HIV/AIDS and ARV treatment
2

on worker absenteeism using data from the Debswana Diamond Company, an enterprise
that employs over 6500 workers, and which started one of the first free firm-based ARV
treatment programs in Africa. The decision to provide treatment came as a response to an
HIV prevalence rate among its workforce of 28% in 1999 and increases in HIV/AIDS related
deaths, early retirement and absenteeism (UNAIDS, 2006). We carry out our analysis by
linking a database of the entire universe of regular and illness related spells of absenteeism
at the firm’s two main mining sites with information about the health status and timing
of ARV treatment initiation for a group of almost 500 workers enrolled in the company’s
treatment program. Since the absence data covers such a long time span, we are in a unique
position to observe the labor market behavior of workers with HIV/AIDS up to 5 years prior
to and following the initiation of ARV therapy. A limitation of our data is that we are unable
to measure productivity losses due to presenteeism: losses associated with lower effort while
on the job or worker re-assignment in response to illness.1
Firstly, we use the staggered timing of worker treatment initiation between May 2001 and
April 2006 to estimate the patterns of absenteeism around the start of ARV treatment. The
four main results of our empirical analysis are the following: (1) compared to non-enrolled
workers in the firm, we find no difference in the rate of absenteeism of workers enrolled in the
HIV/AIDS treatment program in the period of 1-5 years prior to the start of treatment; (2)
about 12-15 month prior to the start of treatment we observe a sharp increase in absenteeism
equivalent to about 20 days in the year prior to the start of treatment and with a peak of 5
days in the month of treatment initiation; (3) the recovery after the beginning of treatment
happens quickly within the first year and (4) 1-4 years after treatment start, treated workers
display very low rates of absenteeism, similar to the non-enrolled workers at the mining
company.
Our main empirical strategy does not allow us to identify the causal effect of ARV
1While the labor market effects of the epidemic include worker turnover due to voluntary and involuntary
separation such as early retirements and death, we focus here on worker absence which is much more reliably
measured.
3

treatment on absenteeism since we do not observe labor market outcomes in the absence
of treatment. Therefore we develop a strategy for identifying a counterfactual for enrolled
workers and present the results of a simple simulation of the health dynamics of untreated
late-stage AIDS patients and a productivity-health mapping that draws from our analysis.2
The results of this strategy suggest large but plausible long term treatment effects.
We also provide evidence on the link between the health status of a worker (measured by
his/her CD4 count) and worker absenteeism in a given month, using measurements of the
CD4 count at 0, 6 and 12 months after treatment start.3 Our estimate suggests that within
the first year of treatment, an increase equal to 100 cells/μl of the CD4 count (the average
improvement in health after 6 months of therapy in this program) causes illness-related
absence to decrease by roughly 1 day per month.
The second part of our analysis develops a framework to provide a rationale for when,
where and how much a typical firm in Sub-Saharan Africa is willing to pay towards the cost
of treatment. Building on the literature on firm-based skills development (Becker (1964),
Acemoglu and Pischke (1999)) and the prevailing cost and efficacy of ARV treatment, we
outline the tradeoff firms face in retaining a skilled but infected worker against the cost of
treatment and the opportunity cost of not replacing that worker. Our calibration shows that
given the current costs of provision of ARVs and a number of plausible assumptions about
the labor market, the firm’s willingness to pay for treatment covers only 8-22% of the cost of
ARV treatment across a number of affected countries. Our results suggest that without the
2The World Health Organization has defined a primary infection stage and four clinical stages associated
with progression from HIV infection to AIDS. The progression of the disease follows the decline (increase)
of crucial immune response CD4 cells (HIV density). Clinical stage 1 is asymptomatic stage which can last
a long time. Stage 2 of the disease is characterized by minor weight loss (<10%) and respiratory and fungal
infections. Stage 3 is characterized by significant weight loss (>10%), chronic diarrhoea, persistent fever and
severe infections. Stage 4 (late stage) is characterized by severe wasting and a wide range of severe bacterial,
fungal and viral infections (Revised World Health Organization (WHO) Clinical Staging of HIV/AIDS For
Adults and Adolescents (2005)).3The CD4 count is a measure of the density of CD4 cells — cells that are crucial in the body’s immune
response mechanism. While there is no reference normal range, CD4 counts >500 cells/μl are considered
healthy (Kaufmann et. al. 2002). This is a suitable measure of underlying health as it provides direct
measure of the susceptibility of the body to infection.
4

provision of public subsidies,4 large increases in worker productivity or sizable reductions
in the costs of treatment, ARV treatment programs financed by private companies are not
economically beneficial to the typical African firm.
Our analysis proceeds as follows. We describe the treatment program in Section 2. In
Section 3, we discuss the data, empirical strategy and regression framework. Section 4
presents the results of the main analysis. Section 5 discusses a plausible strategy to establish
a counterfactual for the absenteeism rate of enrolled workers. Section 6 presents the results
and limitations of a simple model to understand the impact of HIV/AIDS and ARV treatment
and provides a rationale for firm-based treatment provision. Section 7 concludes.
2 The ARV treatment program at the Debswana Dia-
mond Company
Our analysis evaluates the impact of HIV/AIDS and ARV treatment on labor market
outcomes of infected workers at the Debswana Diamond Company in Botswana, a country
that has been hard hit by the HIV/AIDS epidemic with an adult HIV prevalence rate of
24% and a life expectancy at birth of only 36 years in 2005 (UNAIDS, 2006).
The country’s economic success is closely linked to the fact that Botswana is the largest
producer of diamonds in the world. The company that is responsible for the diamond mining
activities is the Debswana Diamond Company, a 50-50 joint venture between the Government
of Botswana and the De Beers Corporation. Employing more than 6,500 workers, it provides
about 60% of the government’s revenue, accounts for approximately 33% of Botswana’s GDP
and over 80% of the country’s export earnings.5
Relative to other large firms in Africa, Debswana has been a pioneer in sustained and
4Public subsidies could be justified given the child health and schooling benefits to the households of
those who receive treatment (see Thirumurthy et. al 2005).5Debswana is unusually large even in the broader African context. The average firm in manufacturing
sectors across much of Africa is about 80 employees with a median of 20-50 employees (World Bank 2003,
2004a, 2004b, 2005).
5
effective firm-based responses to the HIV/AIDS epidemic. Following the report of the first
AIDS case at the Jwaneng Mine Hospital in 1987, the company started an HIV/AIDS ed-
ucation and awareness program in 1988. In the mid 1990’s, the effect of the epidemic on
the morbidity and mortality of the company’s workforce became increasingly conspicuous
as the percentage of retirements due to HIV/AIDS rose to 75% of ill-health retirements in
1999 and the share of deaths due to AIDS increased to 59% in the same year. In 1999, the
company conducted the first of a number of voluntary, anonymous prevalence surveys that
revealed an HIV prevalence rate of 28%. The prevalence rate in 2003 remained high (19.9%)
and was higher among workers aged 30-39 (26%) and among the unskilled and semi-skilled
workforce (23%).
In May 2001, Debswana Diamond Company started an ambitious treatment program that
provides free anti-retroviral therapy (ARVs) to the company’s workforce and their spouses.
Enrollment is determined as a consequence of regular health visits in which tests for HIV
might be required.6 The uptake of voluntary counseling and testing has been low and enroll-
ment is largely driven by the timing of an individuals infection, their history of health shocks
and the robustness of their immune system. The program has been extremely successful.
158 patients were enrolled in the first year of operation and that number had increased to
721 by April 2006. According to recent data from the company, the treatment program
has contributed significantly to the productivity and health of the workforce in the period
2003-2005, with reductions in death rates, ill-health retirements, and the number of sick day
leaves (Mbakile, 2005).7
6The firm has been careful to maintain strict confidentiality of health status given the high levels of stigma.
As such, the enrollment decision is primarily determined by the interaction of the worker and his/her doctor.7These estimates are from a presentation given at the Center for Global Development, Washington DC
in October 2005.
6
3 Data and empirical strategy
3.1 Data
We use two main sources of data for this research. The first is a dataset containing
the complete records of all the worker absence episodes from Debswana’s two main mines.
The Jwaneng data covers the period April 1998 to March 2006, while the data from the
Orapa mine only starts from January 1st 2001. The human resource records also provide
information on gender, age, worker bands as well as the date and reason for discharge in case
of job separation.8 The absence data distinguishes between two different types of leaves:
medical (sick) leaves and ordinary leaves. The administrative data used in this paper is of
much higher quality than the data cited in other studies of absence in developing countries
(see Chaudhry et.al. (2006)). Firstly, a worker must get a note from a doctor at one of the
mine hospitals before he can take a paid sick leave.9 Secondly, since a large fraction of full
time and contract workers are paid on a daily basis, the human resource records are very
reliable. Overall the dataset contains almost 200,000 absenteeism spells for 7661 workers, of
which 21% are illness-related leaves and 79% are ordinary leaves.
We aggregate all leave information by employee and month. On average, a worker is
absent just a little over one day a month (1.12) from work and the breakdown by leave-
type is .32 days for sick leaves and .8 days for ordinary leave. The level of absenteeism
at Debswana is comparable to survey evidence from manufacturing firms in South Africa
(World Bank (2005)), where the average self-reported duration of illness-related absence is
.3 days per month.
The second source of data is a medical database of the ARV treatment program described
in the previous section.10 We have information from 721 workers and spouses who ever
8Worker bands are analogous to occupation categories. The five worker bands are Band A through E,
with A corresponding to unskilled production/non-production workers, and E to highly skilled managerial
positions.9Workers can take up to a maximum of 184 sick days in a three year cycle. Regular or non-paid leave
can then be used if a worker exceeds this limit.10Triple therapy with a combination of two Nucleoside Reverse Transcriptase Inhibitors (NRTIs) (either
7

enrolled in the program in the period May 2001 - April 2006. This dataset has information
on the timing of enrollment in the program and the start of ARV therapy.11 In addition
we have information about the status of the patient at the end in April 2006: 81% are
still in the program, 11% are deceased, and the rest have either left the program or the
company.12 Finally CD4 counts at 0, 6 and 12 months after ARV treatment initiation are
collected for all patients on treatment. Appendix Table 1 provides summary statistics for
the treatment program: among the 721 patients enrolled, there are 538 workers and 183
spouses. We were able to match 530 of the 538 workers in the program to their human
resource records. Among these 530 workers with matched records, 441 (83%) started ARVs
at some point during the study period. While the program has been a success in terms of
enrollment levels compared to other company based treatment programs in Africa (Rosen et
al. 2006), the high proportion of workers on ARVs among those enrolled in the treatment
program suggests that workers are enrolling in the treatment program and starting ARV
treatment much later than is medically recommended. About 60% of enrolled workers are
diagnosed with WHO clinical stage 4 at the time of enrollment. Appendix Table 1 shows
that the average CD4 count at ARV treatment start is only 163 cells/μl and almost 70% of
patients have a CD4 count at treatment that is lower than the WHO (and the program’s)
guideline of 200 CD4 cells/μl.13 Moreover, about 25% of patients have a CD4 count of under
50 at treatment start and are very close to death. For this group of workers, the patterns of
absenteeism prior to ARV treatment start represents a close description of absenteeism for
workers until very close to death.
Combivir or Duovir) and a Protease Inhibitor (PI) (such as Lopinavir/Ritonavir) is the typical course of
treatment in the Debswana treatment program.11These two dates do not necessarily coincide. A worker who enrolls well before becoming symptomatic is
likely to start treatment later.12For those workers who left the company, the treatment program provides medication for another 3
months and also helps with the transition to other treatment programs available in the country.13Enrollment and ARV therapy start at very advanced stages of the disease is common in other ARV
treatment programs in Africa (Wools-Kaloustian (2006)).
8

3.2 Empirical strategy
In our analysis we use two approaches to document the relationship between HIV/AIDS,
ARV treatment and worker absence. The first approach we employ characterizes monthly
worker absence duration due to sickness around the time of ARV treatment onset. We use
information provided by the treatment program to define the month and year of treatment
initiation of each enrolled worker. Of the 441 workers with complete human resource data
(see Figure 1A) who were at some point on ARVs, 91 enrolled in 2001, 84 in 2002, 51 in
2003, 63 in 2004, 113 in 2005 and 39 in 2006. Thus, there is substantial variation in the
timing of the initiation of ARV treatment.
Our main empirical strategy uses the variation resulting from the staggered timing of the
start of treatment as a way to estimate the patterns of absenteeism of HIV infected workers
around the time of ARV therapy inception. In our main specification we control for month
and person fixed effects and moreover we also include as controls the large sample of workers
from the company who are not enrolled in the program, which should help us better account
for other unobservable factors that might be slowly changing at the firm level over time.
We estimate OLS regressions of the following form:
outcomept = β0 +Xi
αidist from treatmentipt + β1δp + β2τ t + ²pt , (1)
where outcomept is the duration of absences due to sickness and/or ordinary leaves,
measured in days for each month and person cell. The variables dist from treatmenti are a
set of dummy variables equal to one if a person had started ARV therapy i months ago. We
restrict i to be +/- 12 months in the main specification but we also show graphical results
that extend the time interval to +/- 36 months. In our preferred specifications, we control
for person effects (δp) and month effects (τ t). Note that for workers who are not enrolled in
9

the treatment program dist from treatmenti is undefined and observations corresponding
to these non-enrolled workers are not used to identify αi. Rather, enrolled workers i months
from treatment onset identify αi.
The second approach uses a direct measure of health (a person’s CD4 count) to better
understand the effect of health on labor market outcomes in the first year of treatment. We
estimate a regression of the form:
outcomept = β0 + β1healthpt + β2δp + β3τ t + ²pt , (2)
where healthpt is measured by the CD4 count of person p at time t , and our outcome
variable is duration of illness-related absences in the month that the CD4 count was taken.
This regression is restricted to those individuals who have started treatment. For the 441
workers on ARVs with matched human resource records we have up to three CD4 counts per
worker (at 0, 6 and 12 months after treatment start), resulting in 845 observations.14 While
this sample contains a limited number of observations, it has the advantage of offering a direct
measure of the health status of the workers enrolled in the ARV treatment program. All
specifications include month fixed effects (τ t) and in some of the specifications we also include
person fixed effects (δp) since we observe up to three observations per patient in the data.
In the specifications without person fixed effects we control for age, gender, occupational
categories and mining site. One important concern is that mean reversion could explain
improved health outcomes after the onset of ARV therapy. This worry is diminished since
the natural progression of the disease in the absence of treatment is one of continuous
decrease of the CD4 count. Nevertheless, it is possible that the timing of ARV treatment
start is influenced by an interaction of the condition of a person’s immune system and a
14Not all patients have three CD4 measurements. This is due to missing data and the fact that some of
the recently enrolled patients had not been scheduled for the second and/or third measurement by the end
of the sample period.
10
random shock to health.
The two empirical strategies are similar given that in both cases the source of variation
used comes from the timing of when workers enroll in the ARV program. The fixed effects
model in the first strategy estimates the reduced form patterns of absenteeism over a long
time window, but also includes healthy/never treated workers to identify time effects. The
fixed effects model in the second strategy, which uses only workers on ARV treatment,
measures the rate of absenteeism and the CD4 count of the same person at up to three
points in time (0, 6 and 12 months).
There are two main reasons why these strategies do not identify the impact of ARV
treatment on absenteeism. Firstly we do not have a reliable control group. In our model,
the “no treatment” comparison group is composed of other HIV workers infected at a different
time and workers who were never enrolled in the program. As a result, our estimated effects
are almost certainly smaller than the “average treatment effect of receiving ARV therapy”,
given that in the absence of treatment, many of the workers would have died. Morgan et.
al. (2002) estimate a median duration of 9.2 months between the development of AIDS and
death. We explore an alternative strategy to establish a counterfactual in section 5 below.
Secondly, the decision to start treatment is certainly affected by health (and potentially
absenteeism) trends in the period immediately prior to treatment start. In the program-
evaluation literature, this source of bias is usually addressed by modelling the selection
process (e.g. Ashenfelter and Card, 1985). We have decided against this approach since
the estimation of the selection process generally requires an exclusion restriction and in our
particular case there are no plausible exclusion restrictions across the selection into treatment
and labor market outcome equations.
As discussed above, we expect that estimates around treatment initiation are biased
since workers who start treatment are likely to have an unusually low error term associated
with treatment start. The importance of these biases for the estimates further away from
the treatment start date depends critically on the time series properties of the error term;
11

biases will be larger if the correlation of the error terms over time is significant. Heckman
and Robb (1985) in a context similar to ours have shown that as long as the error process
is stationary15, the spurious effect is symmetric around the date of treatment. Thus the
comparison of the absenteeism rate of a person three years before and after treatment start
will not be biased by the possibly endogenous treatment start date. Moreover, since we
know from the medical literature that an HIV infected individual is generally asymptomatic
three years prior to treatment start, the difference in absences three years before and after
treatment will identify the extent to which ARV drugs restore a person’s ability to supply
labor (on the extensive margin) compared to a healthy person.
We have performed a number of alternative specifications in order to test the validity of
our results. We present figures based on non-parametric Fan locally weighted regressions to
show the pattern of absences before and after the introduction of ARV treatment. Since some
of our workers exit the sample due to death or separation from the company, in our main
unbalanced sample not all persons have data available for each month relative to the starting
date of treatment. Thus the number of persons identifying a particular dist from treatmenti
coefficient is not constant and these compositional changes could give rise to possible trends
in the data around the starting date. Therefore, we also include results using a “balanced”
panel of workers that have at least 12 (36) months of post treatment data. Since the data from
one of the mines (Jwaneng) extends over a much longer time period, we can additionally
use intervals that are 5 years before and 4 years after the onset of ARV treatment. We
also performed a number of additional robustness checks: we re-ran our specification to
compare outcomes by early vs. late enrollment, gender, worker band and mine. Except
in the specifications that include person fixed effects (where we use Huber-White standard
errors), we cluster our standard errors at the person level (Bertrand, Duflo and Mullainathan
(2004)).
15In the absence of treatment, the stationarity assumption will not hold. However, given that treatment
is effective in restoring a patient’s ability to fight health shocks, we are comfortable assuming stationarity of
error terms.
12

3.3 Accounting for Attrition
In this section we discuss the patterns of attrition in our data and describe the approach
that we take to correct for the potentially selective attrition of participants in the ARV
program. While selective attrition is a concern in all longitudinal datasets, it is particularly
important in the context of a terminal disease in which attrition as a result of death is likely
considerable. In Figure 1B we plot monthly attrition rates for the first three years after
the start of ARV therapy. The increase in overall attrition is relatively linear over time and
averages below 10% per year. The same graph also breaks down the distribution of attrition
due to death at the time of exit or regular separation from the company. Roughly 60% of
separations are due to death while working at the company, although we cannot accurately
measure mortality since the company does not track former workers after they separate from
the company.16
We present results that use three different samples to address a number of estimation
concerns. The balanced sample includes only those individuals for whom we have labor
supply information for all the months in the sample window. The sample windows are
12 or 36 months for the regressions that measure the pattern of absenteeism around ARV
treatment start and we use a one year interval for the health/CD4 sample.17 The second is the
unrestricted unbalanced sample and includes all available monthly absenteeism observations
for as long as the individual is observed in the HR database. If selective attrition is severe,
we expect the results from the balanced and unbalanced samples to be different. The third
sample uses the inverse probability weights (IPW) (Fitzgerald, Gottschalk and Moffitt (1998)
and Wooldridge (2002)) to adjust for attrition bias due to observable characteristics. We
use background as well as absence duration information at the time of ARV treatment
start to predict the probability (pi) that an individual i will still be observed at the end
16The average annual attrition rate for non-enrolled workers in the period 2001-2006 is about 5%.17Additionally, we balance the data from the Jwaneng mine using a sample window of 5 years prior to and
4 years after ARV treatment start.
13

of the sample period. This individual receives a weight equal to 1/pi in the regression
analysis, therefore giving more weight in the regression to those individuals whose observable
characteristics predict higher attrition rates. The observable characteristics used for this
exercise are gender, age, worker band, date of treatment start and absenteeism in the month
prior to treatment start. While the background characteristics have little explanatory power,
higher absenteeism in the month prior to treatment start has a positive impact on attrition.
This method, while useful, cannot account for possible differential attrition due to unobserved
characteristics. In the absence of an exclusion restriction that would predict attrition due
to health without a direct impact on worker absenteeism, we will assume that attrition does
not depend on unobservables.18
4 Results
4.1 Pattern of Absenteeism around ARV Treatment Start
A simple way to depict the main results of the paper is by graphical illustration. Figure
2 plots the relationship between the average number of sick days taken per month and
the distance from treatment start measured in months for a three year window. Panel A
uses a non-parametric Fan local regression model while the next three panels come from
regressions that contain worker and month fixed effects for the three sampling strategies
outlined above. In panels E and F we do not include person fixed effects in order to allow a
comparison of workers on treatment to non-enrolled workers. In all panels, one can observe
a gradual increase in absenteeism in the 12 months before treatment initiation. The increase
in absenteeism is particularly steep in the six months prior to therapy onset and peaks in
the final month at roughly 5 days, which is equivalent to an absence rate of roughly 22%.
The positive effect of treatment on labor market outcomes is equally stark: absenteeism
falls sharply in the first six months following ARV therapy initiation, so that the shape of
18The concept of selection on observables in the context of attrittion is due to Fitzgerald, Gottschalk
and Moffitt (1998) and and is similar to the “ignorability condition” (Wooldridge (2002)) or the concept of
“missing at random” (Little and Rubin (1987)).
14

absences around treatment implementation is almost symmetric.
We present regression results of the basic equation (1) in Table 1. Column (1), which
uses an unbalanced sample and includes only month fixed effects, presents estimates of αi,
the coefficients for the treatment dummies corresponding to a twelve month window around
the onset of treatment. Compared to workers who are not enrolled in the treatment pro-
gram, workers enrolled in the treatment program have a higher duration of illness-related
absenteeism (.484 days per month) even a year prior to the start of treatment. The coeffi-
cients from this regression display the familiar inverse-V patterns seen in the non-parametric
graphs, peaking at 5.13 days and then declining to less than a day twelve months after-
wards.19 Column (2) in the same table shows similar patterns from a regression that also
includes person fixed effects. Introducing personal fixed effects requires that we drop one
more parameter (-11 months) since knowing the month and patient perfectly predicts the
time to/since treatment. The remaining columns show the same regressions using the bal-
anced and the inverse probability weight samples.20 The size and significance of the results
is very similar across specifications allaying concerns of attrition bias. The same patterns
emerge when we use the sum of regular and illness-related absences and they suggest that
enrolled workers do not use additional regular leave days during episodes of poor health.21
Next, we present the results of the analysis for the widest interval possible. Figure 3 plots
illness-related absences using the longer data series from the Jwaneng mine; 5 years prior to
and 4 years after ARV treatment start. As in Figure 2, most of the changes in absenteeism
occur within a one year window. Workers who are on treatment recover remarkably quickly
and display very low rates of absenteeism in the medium and long term (1-4 years after
treatment initiation). Similarly, an enrolled worker displays a pattern of labor supply that
19Diagnosis and treatment is carried out in the on-site mine hospitals. According to the treatment program
rules, workers who start ARVs do not receive an automatic sick leave and the opening hours of the treatment
program allow workers not to miss work on the day they start ARVs.20The small reduction in the inverse probability weight sample is due to the fact that some of the obser-
vations have missing observable characteristics.21See Table 2 in working paper version (Habyarimana, Mbakile and Pop-Eleches, 2009). The results are
unchanged when we exclude the HIV+ workers enrolled in the program who are not taking ARVs.
15

is similar to non-enrolled workers throughout a large part of the post-infection period, a
finding that challenges recent estimates in the literature (Fox et al. 2004). In panels E and
F of Figure 3, we have re-run our analysis without any person fixed effects: the coefficients
outside the one year window are all small and usually statistically indistinguishable from
zero, suggesting that outside the short one year window around treatment initiation, enrolled
infected workers take similar absence durations as other workers at the company who are
not enrolled in the treatment program.22
In graphs not reported in the paper we have examined differences in absence patterns
across worker types. We find that workers whose enrollment in the treatment program
coincided with the start of ARV treatment have higher absenteeism rates than workers who
started treatment after program enrollment. This is consistent with the fact that we find
lower absenteeism rates in the year prior to treatment for workers with a higher CD4 count
at treatment start. In addition, we find no differences in absenteeism between women and
men.23
In sum, given the unusual length of the absenteeism panel of almost 10 years and the
fact that Debswana’s ARV program was one of the first in Africa, we were able to map out
the short, medium and long run patterns of absenteeism of HIV infected workers who receive
ARV treatment. Our main results are as follows: (1) infected workers are as productive in
terms of absence from work for most of the period when they are HIV positive, (2) about
one year around the time of ARV treatment start, we see a steep inverse-V shaped pattern of
absenteeism that peaks at about 5 days of absence a month, and (3) in the period 1-4 years
after treatment start, patterns of absenteeism are similar to non-enrolled workers suggesting
that ARV’s are extremely effective in improving workers health and ability to work.
22In panels E and F of Figure 2 where we use the three year windows with data from both mines, the
coefficients become statistically insignificant only about 18 months after treatment start.23These results are presented in detail in an earlier version (Habyarimanam, Mbakile and Pop-Eleches,
2009).
16

4.2 CD4 counts and Worker Absenteeism
Finally we use the health information of the treated workers to characterize the rela-
tionship between underlying health (measured by CD4 counts) and worker absenteeism in
the first year of ARV treatment. Figure 4 shows this relationship using non-parametric Fan
locally weighted regressions with bootstrapped standard errors clustered at the person level
for an unbalanced sample. For CD4 counts over 400 (employee is relatively healthy) there
is little evidence of a health-absenteeism link, although due to the limited amount of data,
the estimates are relatively imprecise. In the CD4 count range of 100-400, one can observe a
clear increase in absenteeism with deteriorating health and this effect is particularly strong
for the sickest employees with CD4 counts below 100. An employee with a CD4 count of 50
is absent from work due to illness about a week a month.
Regression results of the effect of health on worker absenteeism is provided in Table 2.
Columns (1)-(3) present simple OLS regressions for the three samples (unbalanced, balanced,
ipw-weights) and include controls for a number of observable characteristics, such as age,
gender, worker band and time effects. Columns (4)-(6) also use the same samples but
include person fixed effects. The results indicate that workers with a higher CD4 count are
less likely to be absent from work: the estimates across all six specifications are large and
highly significant and vary between -.0072 (standard error .0015) and -.0111 (standard error
.0021). These estimates suggest that a difference in CD4 count of 100 points (which is the
average improvement in health after 6 months of ARV therapy in this treatment program)
is associated with a decrease in illness-related absenteeism of roughly one day per month.24
Two main conclusions can be drawn from an analysis of Figure 4 and Table 2: (1) we find
additional evidence that the overall impact of ARV treatment of an HIV infected individual
on worker absenteeism is economically large and (2) the effect is particularly strong for those
who are extremely sick (CD4 counts below 100).
24Other studies in a similar setting find a similar CD4 response to ARV treatment. See for example
Coetzee et. al (2004) and Wools-Kaloustian et. al. (2006)
17

5 Thinking about a Counterfactual
Figures 2 and 3 present the absence dynamics of workers who enroll in the treatment
program between May 2001 and April 2006. As we discuss in the empirical strategy, the
point estimates that trace out the inverse-V shaped trajectory around treatment start are
identified using other HIV workers who start treatment at different times. This empirical
strategy does not identify the effect of treatment on productivity since this requires observ-
ing the productivity dynamics of similar workers in the absence of treatment. As with other
program evaluations, this exercise faces the same ‘missing data’ problem that treated units
are observed in one state and the counterfactual is never observed. In our case, this problem
is made even harder since we do not know the HIV status of any worker who is not enrolled
in the treatment program. In this section we explore one approach to construct a counter-
factual. We use information on health status at enrollment, the relationship between health
and productivity and assumptions about the rate of disease progression in the absence of
treatment.25
We know that in the absence of treatment, the health of infected workers would deterio-
rate further culminating in death in a short period. In order to generate the counterfactual
trajectory of labor supply, we need to specify a time-path of health in the absence of treat-
ment and predict corresponding productivity from the health-productivity mapping shown
in figure 4. We use the results in Morgan et. al. (2002) on the median time to death
for untreated late stage HIV patients to specify a very simple linear time path of health:
25We also tried a propensity score matching approach (Dehejia and Wahba (1999)) but the results are
quite disappointing. While we do a good job in matching pre-treatment absence patterns, our post-treatment
absence profile is not consistent with a permanent decline in health. We conjecture three reasons for our
inability to generate a counterfactual based on the workers who exit the firm prior to 2001. Firstly, there is
a lot of heterogeneity and noise in the absenteeism patterns of workers in the two years prior to treatment
start. Therefore it is hard to generate a “typical” profile of absences for a person in the latter stages of
HIV/AIDS that can then be matched to workers who retire or exit prior to 2001. Secondly, it is likely that
the firm’s decision to introduce treatment is optimal with respect to a rising epidemic: that is, the program
is introduced at a time when the health of most infected workers has reached a point where treatment is
necessary. Finally, it is possible that early victims of the epidemic exit before we can observe their absence
profiles in the ‘post-treatment’ period.
18

late stage patients lose 12 CD4 cells/μl every month and death occurs at a CD4 count of
30 cells/μl.2627 The health-productivity-mapping is drawn from a cross-sectional regression
of absence on a quadratic of CD4 count using information of workers at treatment onset
(t = 0). This relationship tells us the marginal effect on absence of a decline in health of 1
CD4 cell/μl but predictably cannot provide any guidance on how to treat death. We assign
100% absence to all workers at or below our CD4 threshold of 30 cells/μl.28 The results of
this exercise are shown in Figure 5. The dashed line shows the expected trajectory of worker
absence durations under the no-treatment condition for the three year window corresponding
to the balanced panel of figure 2. Under these assumptions, all enrolled workers would be
dead within 26 months of their treatment start dates. The difference between this trajectory
and the actual time path (dark line) in Figure 5 confirms the large effect of treatment on
productivity.
6 Is it Cost Effective for Firms To Provide ARVs?
Our results suggest that to the extent that worker absenteeism is a good proxy for produc-
tivity, the ARV treatment program evaluated here is effective in restoring the productivity of
infected workers over a considerable duration. But is this evidence enough to motivate firms
to provide ARV treatments? In this section, we present a simple framework that models a
representative firm’s decision to extend health coverage to include a terminal disease such as
HIV/AIDS.29 This framework captures the human resource management problem facing a
26The Morgan et. al (2002) sample from which our estimates of health decline are drawn is very similar to
the treatment program sample studied here. Set in rural Uganda, the median CD4 count for those subjects
developing AIDS (Stage 4 of the WHO classification) was 126 (Median CD4 count for enrolled workers is
144). Median CD4 count within 6 months of death was 61; 20% of these subjects had a CD4 count <10.27The linearity assumption likely generates the most conservative ‘treatment’ effects. It is likely that the
rate of decline is much higher at lower levels of CD4 count which would reduce working time considerably.28An alternative assumption would be to assign a company absence ceiling beyond which the employment
contract is terminated and a new worker is hired. Modeling the productivity implications of this would
require further assumptions on the costs (in days worked) of replacing this worker and getting the new
worker to the same level of productivity.29In choosing a representative firm approach, we abstract from inter-firm strategic considerations which
would require us to consider the full panoply of benefits of extending coverage rather than a narrow focus
on the immediate beneficiaries of these treatment programs.
19

large number of firms in Sub-Saharan Africa that have to choose between providing/financing
treatment for infected experienced workers and hiring new recruits.30
The details of this exercise are laid out in Appendix A. We begin by showing the condi-
tions under which a representative firm will provide treatment in a context with no alternative
sources of ARV treatment. Firstly, we show the conditions under which treatment of workers
with HIV/AIDS is preferred to non-treatment and secondly we delineate the conditions un-
der which a firm prefers to hire an inexperienced worker instead of providing treatment to an
infected (and experienced) worker. Our main treatment condition (equation 5 in Appendix
A) provides useful intuition: firms compare the productivity benefits of treatment against
the cost of treatment and the opportunity cost of keeping the infected worker. If the net
benefits of retaining a treated worker exceed the expected gains of a novice worker staying
healthy and becoming highly productive, then firms prefer to retain the treated worker.
Finally using the willingness-to-pay-for-treatment condition (equation 6), we attempt to
estimate the share of actual treatment costs that manufacturing firms in Africa are willing
to pay. In doing so, we try to account for the additional benefits of treatment along the
intensive margin of labor supply. The best evidence comes from a Kenyan study of tea
pluckers (Larson et. al. (2008)) which indicates that conditional on being present at work,
the productivity of treated women on treatment is 10-15% lower while the productivity of
treated men is similar to a control group. In order to obtain a non-negative willingness-to-
pay, two conditions need to be satisfied. Firstly, we require that there is a wedge between
the marginal product of labor and wages.31 Secondly, we require a positive correlation
between the size of the marginal product-wage gap and worker tenure. Given the limited
empirical evidence on the shape of worker productivity-wage relationship, we use the firm-
30This framework builds on the rich literature started by Becker (1964) and extended most recently by
Acemoglu and Pischke (1999), that explores the rationale for why firms provide a number of human-capital
enhancing investments to their employees.31Theoretically this wedge has been posited in different types of models, such as the presence of labor mar-
ket imperfections (Burdett and Mortensen (1998), in competitive implicit contract models such as (Lazear,
1979) or in models with symmetric imperfect information (Harris and Holmstrom, 1982).
20
based estimates in Postel-Vinay and Robin (2002) for our calibration. The description of
the parameter values used in the calibration are discussed in Appendix A and the results of
this exercise are presented in Appendix Table 2. Our estimates indicate that manufacturing
firms in Africa can finance between 7-21% of the costs of ARV treatment when treatment
efficacy is low and the productivity-tenure profile is shallow (column (4)) and 13-50% when
treatment efficacy is high and we assume a steep productivity-tenure profile (column (1)).
Our preferred estimates from column (3) suggest a willingness-to-pay range of 8-22%. In
sum, despite the evidence that ARV treatment is able to restore the productivity of workers
in the medium and long term, the benefits to firms of providing ARV treatment are too small
for most firms in Africa to be economically feasible.32
6.1 Limitations of the model
Below we discuss some of the important limitations of our modelling framework. First,
our analysis assumes uniformity across and within countries on the labor market frictions
that give rise to positive marginal product-wage gaps. Secondly, our model does not fully
account for a possible adverse selection effect that might arise if riskier types of workers select
to work for a firm that offers ARV treatment. Thirdly, the decision of the firm to provide
treatment might also be influenced by the availability of alternative treatment options. Our
analysis in the appendix shows that these two latter factors generally would induce firms to
be less inclined to offer treatment to their workers.
At the same time, our model and calibration does not account for a number of mechanisms
that could make the provision of treatment profitable for the firm. Firstly the production
function assumed exhibits no major complementarities between workers. A production func-
tion with strong complementarities would likely increase the firm’s willingness to pay for
32As mentioned earlier, we are not considering the socioeconomic benefits from ARV treatment that
extend well beyond labor supply. As Graff Zivin et al. (2006) show large gains to the health and schooling of
children in households with adults receiving treatment, gains in worker productivity are likely accompanied
by substantial benefits at the household level.
21

treatment.33 Secondly our assumption of a representative firm precludes important strate-
gic considerations that would have to incorporate the full range of treatment benefits (such
as reciprocity effects on uninfected workers and consumers, (Akerlof and Yellen (1990) and
Fehr and Gachter (2002)). Depending on how big these additional benefits are and the rel-
ative pay-off to treatment provision, multiple equilibria may exist that include one in which
some/all firms finance ARV treatment.
In sum, while we acknowledge some of the limitations of our modelling and calibration
exercise, our main finding that the benefits of treatment to African firms is unlikely to cover
a large fraction of costs is consistent with the conjecture in Rosen (2006) and projections
from recent firm survey data from Sub-Saharan Africa. Using data from the World Bank’s
Enterprise Survey web-portal, across 17 African countries surveyed in 2005/6, an average of
only 12% of manufacturing firms provide HIV-testing services.34 Less than 1 in 6 firms in
South Africa provides HIV-testing and Tanzania and Rwanda are outliers with more than
a quarter of firms providing HIV testing. Since the provision of treatment requires HIV
testing, these estimates represent an upper bound of the share of firms providing treatment.
7 Discussion and Conclusion
In this paper we exploit an unusually long panel dataset of worker absenteeism from the
Debswana Diamond Company as well as information on one of Africa’s first firm-based ARV
treatment programs to understand the effect of HIV/AIDS and ARV treatment on worker
productivity. We find evidence that compared to other workers at the firm, individuals who
are infected with HIV/AIDS display similar patterns of absenteeism until approximately
one year prior to treatment start, when absenteeism starts to increase sharply. From an
absenteeism peak of 5 days in the month of treatment onset, the workers quickly recover
33Two recent cross-country studies show that countries or sectors with a high proportion of long tenure
workers have higher productivity (Auer, Berg and Coulibaly (2004)) and that economies with a larger share
of 40-49 year olds have higher growth rates (Feyrer 2007).34Reliable firm survey evidence is only limited to HIV prevention activities
(http://www.enterprisesurveys.org/).
22

within the first year of treatment and then continue for the next three years to have patterns
of absenteeism that are similar to those of healthy workers. Our results suggest that in an
African context, ARVs are effective in the short, medium and long run in improving the
health and productivity of workers and challenge recent claims that global support of ARV
treatment will create health pensioners (The Economist, August 2006).
In the final section of the paper, we discuss a simple model in order to understand when
the establishment of workplace AIDS treatment programs is optimal for firms in high preva-
lence economies. We first show that the decision to provide treatment to an experienced sick
worker depends crucially on the assumption that the marginal product-wage gap be larger
for workers with longer tenure than newly hired inexperienced workers. Using a plausible
positive measure of the marginal product-wage gap, data from a range of manufacturing
firm surveys in Africa and assumptions on the efficacy of treatment, our preferred estimates
suggest that firms are willing to pay 8-22% of current treatment costs. Since the cost of treat-
ment exceeds the benefits of treatment across a range of economies in Eastern and Southern
Africa, widespread firm-based ARV provision is an unlikely policy option. Moreover, it is
unlikely that the rationale for treatment by firms would change if other possible benefits
of ARV treatment to the firm are taken into consideration, such as reductions in medical
and health insurance costs, death benefits, funeral costs as well as the benefits to the firm’s
reputation from investing in socially responsible programs.
Our conclusions are consistent with the fact that the majority of firms in Africa that
have established ARV treatment workplace programs for their employees are very special
companies, similar to Debswana. And while relatively recent developments, such as the cre-
ation of the Global Business Coalition on HIV/AIDS, foreshadow an increasing involvement
of the private sector in combating HIV/AIDS, some of the recent success stories rely on
the provision of significant public subsidies to ARV treatment programs administered by
private companies as exemplified by the success of the public-private partnership between
DaimlerCrysler and GTZ in South Africa.
23

References
Acemoglu, Daron., and Jorn-Steffen Pischke (1999) “Beyond Becker: Training in Imperfect
Labor Markets” Economic Journal 109: 112-142
Akerlof, G. and Yellen, J. 1990. “The fair wage-effort hypothesis and unemployment”,
Quarterly Journal of Economics 105, pp. 254—283.
Auer, Peter and Janine Berg and Ibrahim Coulibaly, 2004. “Is a stable workforce good for
the economy? Insights into the tenure-productivity-employment relationship,” Employ-
ment strategy papers 2004-15, International Labour Office.
Becker, Gary (1964) Human capital. Chicago: The University of Chicago Press
Bertrand Marianne and Esther Duflo and Sendhil Mullainathan, 2004. “How Much Should
We Trust Differences-in-Differences Estimates?”, The Quarterly Journal of Economics,
MIT Press, 119(1) 249-275
Burdett, Kenneth and Mortensen, Dale, 1978. “Labor Supply Under Uncertainty”. In
Research in Labor Economics, ed. Ronald G. Ehrenberg. Greenwhich, CT: JAI Press.
. 1998. “Wage Differentials, Employer Size, and Unemployment”. International
Economic Review 39 (2): 257-73.
Canning, David, 2006, “The Economics of HIV/AIDS in Low-Income Countries: The Case
for Prevention”, The Journal of Economic Perspectives 20(3)
Carmichael, Lorne,1983. “Firm-Specific Human Capital and Promotion Ladders,” Bell
Journal of Economics, 14(1):251-258.
Chaudhury, N., Hammer, J., Kremer, M., Karthik M., and Rogers, H. 2006. “Missing
in Action: Teacher and Health Worker Absence in Developing Countries,” Journal of
Economic Perspectives, American Economic Association, vol. 20(1), pages 91-116, Winter.
Cleary S, McIntyre D, Boulle A. 2006. “The cost-effectiveness of Antiretroviral Treatment
in Khayelitsha, South Africa — a primary data analysis”, Cost Effectiveness and Resource
Allocation. Vol. 4:20
Coetzee, D., Hildebrand, K., Boulle, A., Maartens, G., Louis, F., Labatala, V., Reuter, H.,
Ntwana, N., and Goemare, E. (2004) “Outcomes after two years of providing antiretroviral
treatment in Khayelitsha, South Africa”, AIDS 18: 887-895
Crepon, B., Deniau, N., and Perez-Duarte, S. 2002. “Wages, Productivity and Worker
Characteristics” Institut National De La Statistique et des Etudes Economiques (INSEE)
WP #2003-04.
Dehejia, Rajeev, and Sadek Wahba (1999). “Causal Effects in Nonexperimental Studies:
Reevaluating the Evaluation of Training Programs”, Journal of the American Statistical
Association, 94, 1053-1062.
24

Duggan, Mark andWilliam N. Evans, 2005. “Estimating the Impact of Medical Innovation:
A Case Study of HIV Antiretroviral Treatments,” NBER Working Papers 11109, National
Bureau of Economic Research, Inc.
Fehr, E. and Gachter, S. 2000. Fairness and retaliation: the economics of reciprocity,
Journal of Economic Perspectives 14, pp. 159—181
Feyrer, James, (2007) “Demographics and Productivity”, forthcoming in Review of Eco-
nomics and Statistics
Fitzgerald, John, and Peter Gottschalk and Robert Moffitt, (1998). “An Analysis of the
Impact of Sample Attrition on the Second Generation of Respondents in the Michigan
Panel Study of Income Dynamics”. Journal of Human Resources, Spring 1998
Floridia, M., et al., 2002. “HIV-Related Morbidity and Mortality in Patients Starting
Protease Inhibitors in Very Advanced HIV Disease”, HIV Medicine, 3(2): 75-84.
Fox MP and Rosen S and MacLeod WB et al. (2004) “The impact of HIV/AIDS on labour
productivity in Kenya”. Tropical Medicine and International Health 9: 318-324.
Graff Zivin, Joshua and Harsha Thirumurthy and Markus Goldstein, 2006. “AIDS Treat-
ment and Intrahousehold Resource Allocations: Children’s Nutrition and Schooling in
Kenya,” NBER Working Papers 12689, National Bureau of Economic Research, Inc.
Habyarimana, J., Mbakile, B., and Pop-Eleches, C. 2009. “The Impact of HIV/AIDS and
ARV Treatment on Worker Absenteeism: Implications for African Firms” mimeo Columbia
University.
Hammer, S.M., et al., 1997. “A Controlled Trial of Two Nucleoside Analogues Plus In-
dinavir in Persons with Human Immunodeficiency Virus Infection and CD4 Cell Counts
of 200 per Cubic Millimeter or Less”, The New England Journal of Medicine 337(11):
725-33.
Harris, Milton and Holmstrom, Bengt. 1982. “A Theory of Wage Dynamics”. Review of
Economic Studies July 49 : 315-33
Hellerstein, Judith K and Neumark, David and Troske, Kenneth R, 1999. “Wages, Pro-
ductivity, and Worker Characteristics: Evidence from Plant-Level Production Functions
and Wage Equations,” Journal of Labor Economics, University of Chicago Press, 17(3):
409-46
Heckman, James, and Robb, Richard (1985), “Alternative Methods for Evaluating the
Impact of Interventions.” In longitudinal Analysis of the Labor Market Data, ed., J.J.
Heckman and B. Singer. Cambridge: Cambridge University Press.
Hutchens, Robert M, 1987. “A Test of Lazear’s Theory of Delayed Payment Contracts,”
Journal of Labor Economics, 5(4):S153-70.
25

Kaufmann GR, Bloch M, Finlayson R, et al. (2002). “The extent of HIV-1-
relatedimmunodeficiency and age predict the long-term CD4 T lymphocyte response to
potent antiretroviral therapy.” AIDS. 16:367.
Koenig, Serena P., Fernet Leandre, and Paul E. Farmer. 2004. “Scaling-up HIV Treatment
Programmes in Resource-limited Settings: The Rural Haiti Experience”. AIDS 18:S21-S25
Kotlikoff, Laurence, and Jagadeesh Gokhale, 1992, “Estimating a Firm’s Age-Productivity
Profile Using the Present Value of Workers’ Earnings”, The Quarterly Journal of Eco-
nomics, Vol. 107, No. 4:1215-1242
Larson, Bruce A., Fox, Matthew P., Rosen, Sydney., Bii, Margaret., Sigei, Carolyne.,
Shaffer, Douglas., Sawe, Fredrick., Wasunna, Monique., Simon, Jonathon L. 2008. “Early
effects of antiretroviral therapy on work performance: preliminary results from a cohort
study of Kenyan agricultural workers”. AIDS 22(3) p. 421-425.
Lazear, Edward. 1979. “Why is there Mandatory Retirement?” Journal of Political Econ-
omy 87(6) : 1261-84.
Lazear, Edward P, 1981. “Agency, Earnings Profiles, Productivity, and Hours Restric-
tions,” American Economic Review, 71(4): 606-20.
Lichtenberg, Frank. 2006. “The Impact of Increased Utilization of HIV Drugs on Longevity
and Medical Expenditure: An Assesment Based on Aggregate US Time-series Data” Expert
Review of Pharmacoeconomics and Outcomes Research 6(4):425-436.
Little, R and D Rubin. 1987. Statistical Analysis with Missing Data, New York, Wiley.
Manning, Alan. 2003. Monopsony in Motion. Princeton University Press, Princeton New
Jersey.
Marins, Jose Ricardo P. et al. 2003. “Dramatic Improvement in Survival Among Adult
Brazilian AIDS patients.” AIDS 17:1675-1682.
Mbakile, Bekezela (2005). Presentation given at the Center for Global Development, Oc-
tober 2005
Medoff, James L & Abraham, Katharine G, 1980. “Experience, Performance, and Earn-
ings,” The Quarterly Journal of Economics, 95(4):703-36.
Morgan, Dilys et al. 2002. “HIV-1 Infection in Rural Africa: Is There a Difference in
Median Time to AIDS and Survival Compared With That in Industrialized Countries?”
AIDS 16:597-603.
Postel-Vinay, Fabien and Jean-Marc Robin, (2002). “Equilibrium Wage Dispersion with
Worker and Employer Heterogeneity,” Econometrica, Econometric Society, 70(6):2295-
2350
26

Ramachandran. Vijaya and Manju Kedia Shah and Ginger Turner, (2007). “Does the
Private Sector Care About AIDS? Evidence from Investment Climate Surveys in East
Africa,” AIDS. 21 Suppl 3:S61-S72.
Rosen, Sydney. 2006. quoted in Financial Times, December 1 2006.
Rosen, Sydney, Rich Feeley, Patrick Connelly and Jonathan Simon, (2006), “The private
Sector and HIV/AIDS in Africa: Taking Stock of Six Years of Applied Research,” Center
for International Health and Development Discussion Paper No.7, 2006.
Rosenbaum, P., and D. Rubin (1983). The Central Role of the Propensity Score in Obser-
vational Studies for Causal Effects, Biometrika, 70, 41-55
Shapiro, Carl and Joseph E. Stiglitz (1984), “Equilibrium Unemployment as a Worker
Discipline Device”, American Economic Review, (74): 433-444.
Shelton, JD, Halperin DT, and Wilson, D (2006), “Has global HIV incidence peaked?”,
Lancet 367 : 1120—1122.
Thirumurthy, Harsha and Johsua Graff-Zivin and Markus Goldstein, 2005. “The Economic
Impact of AIDS Treatment: Labor Supply in Western Kenya,” NBER Working Papers
11871, National Bureau of Economic Research, Inc.
UNAIDS. (2002). “The Private Sector Responds to the Epidemic: Debswana -a Global
Benchmark. Geneva: Joint United Nations Program on HIV/AIDS (UNAIDS Case Study)
The Economist. “Look to the Future: The War Against AIDS”. August 19th 2006. The
Economist Newspapers Ltd. London, UK.
UNAIDS. (2006). Report on the global AIDS epidemic 2006. Geneva: Joint United Nations
Program on HIV/AIDS (UNAIDS)
Wooldridge, Jeffrey, (2002). “Inverse probability weighted M-estimators for sample se-
lection, attrition and stratification,” CeMMAP working papers CWP11/02, Centre for
Microdata Methods and Practice, Institute for Fiscal Studies.
Wools-Kaloustian, Kara, et al. 2006. “Viability and Effectiveness of Large-scale HIV Treat-
ment Initiatives in Sub-Saharan Africa: Experience from Western Kenya”. AIDS 20(1):
41-48
World Bank. 2005. “South Africa: An Assessment of the Investment Climate”. Washington
DC: World Bank.
World Health Organization. 1990. “Interim proposal for a WHO Staging System for HIV
infection and Disease”. Wkly Epidemiol Rec. 65 (29): 221-224. Updated September 2005.
World Health Organization. 2002. “The World Health Report”. Geneva, Switzerland.
WHO.
Young, Alwyn, (2005) “The Gift of the Dying: The Tragedy of AIDS and the Welfare of
Future African Generations”, Quarterly Journal of Economics Vol 120 No. 2
27

A Appendix
To motivate the representative firm’s choice we assume that firms are infinitely lived. Workers
differ in two attributes: experience and health status. There are three types of representative
workers: healthy workers h, sick workers s, and inexperienced workers n. The healthy and sick
workers are assumed to have considerably more firm-specific experience than new recruits.
Using asset equations, we can model the firm’s problem as solving the following program.35
rVn = θn + ρ(Vd − Vn) + μ(Vh − Vn) (3a)
rVh = θg + ρ(Vd − Vh) + b(Vn − Vh) (3b)
rV ts = (θts − c) + q(Vn − V ts ) (3c)
rV us = θus + δ(Vn − V us ) (3d)
Vd = max{Vn, V ts , V us }
In writing out this program, we have replaced the net instantaneous payoff to the firm
(MPLij − wj) as θij.36 θij ≥ 0 represents the wedge between the marginal product of workerof type j ∈ {h, s, n} and treatment condition i ∈ {u, t}, and wage wij.37 At recruitment, the
firm does not know the status of the worker but knows the distribution of disease incidence.38
A worker has a probability ρ of contracting a potentially terminal, but treatable chronic
disease. If the worker becomes ill, the firm has a choice of whether to keep the infected
worker with no treatment, whether to provide treatment to the worker or whether to replace
the ill worker with a new worker. More formally, we define Vd = max{V ts , V us , Vn} as thefirm’s choice problem conditional on a worker revealing her disease status, where V ts is the
value to the firm of a treated worker, V us is the value to the firm of an untreated infected
worker and Vn is the value to the firm of a new recruit. While the provision of treatment
is likely to affect separation rates, we assume a constant non-illness related worker turnover
rate of b per unit of time.39 Firms bear the cost of treatment c, and the probability of
illness-related separation is lower under treatment q < δ.40
We solve this program sequentially. We consider the firms preference over treatment
35We borrow the modelling of the firm’s problem from Shapiro and Stiglitz (1984). We abstract from
other human-capital enhancements such ast training that the firm might choose to provide. In our simple
framework, productivity increases through the process of learning-by-doing. Incorporating firm-specific
training into the model likely strengthens the case for firm-based treatment.36Implicit in this set up is a simple additive production function with minimal or no complementarities.
We discuss the implications of relaxing this implicit assumption in the discussion section.37We assume that the firm earns rents on a worker as a result of frictions in the labor market that make
the firm a wage setter (Burdett and Mortensen (1978), Manning (2003), Postel-Vinay and Robin (2002)).
Labor market imperfections are likely to be more relevant in developing country settings (see Agenor, 1995
for a detailed review).38While most firms have a pre-employment examination of some kind (Ramachandran et al. (2006)), it
usually does not include an HIV-test. Note that even a one-time pre-employment HIV-test would not be
sufficient to establish the health status of an individual since he/she can be infected after the pre-employment
check.39Using the data from Jwaneng that goes back to 1998, we do not find any statistically significant changes
in the pattern of exits after 2001.40We assume that the wage paid to a treated and untreated ill worker is the same ws. We abstract from
28

conditional on infection and then between a treated worker and a novice. Solving equations
3c and 3d above, the firm decides to provide treatment if V ts − V us > 0. This treatment
condition can be stated as follows:
(q + r)(θts − c− θus ) + (δ − q)(θts − c− rVn) > 0 (4)
There are two parts to the left hand side of the treatment condition. The first captures
the net productivity effects of treatment over the duration that an untreated worker would be
in employment.41 The second captures the benefit associated with keeping a more productive
worker longer (δ−q) per unit of time and delaying the hiring a new worker [θts−c−rVn]. Thistreatment condition illustrates that the firm will face different incentives to offer treatment
to different types of workers. In particular, workers for whom the costs of illness (in terms
of foregone productivity) are very high relative to treatment costs or workers for whom the
returns to tenure are very high are more likely to satisfy the treatment condition.
To complete the model we need to determine the firm’s choice between hiring a new worker
or providing treatment when treatment is preferred to non-treatment. We assume that the
likelihood that a new worker becomes ill is the same as the likelihood of an experienced
worker contracting the disease.42 If a worker reveals him/herself to be ill, then the firm
chooses whether they should provide treatment or wait and replace. Learning by doing is
the primary channel of productivity increases: with probability μ per unit of time the novice
becomes a healthy experienced worker with value to the firm Vh. Given these parameters,
the choice between treated and novice workers is given by the solution to of equations 3a,
3b and 3c: if Vn > Vts , then Vd = Vn, otherwise Vd = V
ts .
Assuming that equation 4 holds and solving the three simultaneous equations above,
firms provide treatment rather than hire a new worker if:
(r + ρ+ b)(θts − c− θn) > μ[θh − (θts − c)] (5)
Firms compare the net productivity benefits of treatment against the expected gains of
replacing the infected worker. In addition to our assumption of positive θij, the magnitude
of (θts− c− θn) depends on the differential slopes of the marginal product of labor and wage
profiles for a given worker over his/her tenure in the firm.43
Assuming that the productivity of a treated worker is not fully restored to pre-illness
levels (so that θts = αβθh), where α represents the relative productivity effect of treatment
on attendance and β represents the relative productivity effect conditional on attendance,
(α, β ∈ [0, 1]), we can state the firm’s willingness to pay for treatment c∗ as:44
within-firm deployment responses such as re-assignment which could lower infected worker wages (as in
Larson et. al. (2008)).41Since we assume that healthy and unhealthy workers with the same characteristics earn the same wages,
differences in θts− θus are driven by differences in productivity induced by treatment efficacy.42This might not be a realistic assumption given that new workers are generally younger than older workers
and prevalence rates are lower amongst younger (particularly male) workers.43We abstract from heterogeneity in worker productivity so that the within worker comparison is analogous
to the cross-worker comparison.44β < 1 can represent lower productivity on the regular task the worker is assigned to or re-deployment
29

c∗ =1
r + b+ ρ+ μ{[αβ(r + b+ ρ)(θh − θn)] + [(1− αβ)(μθh − (r + b+ ρ)θn)]} (6)
Equation 6 provides the basis for thinking about the implications of employee sorting
and a public treatment option. Firstly note that if treatment restores attendance and pro-
ductivity at work sufficiently (αβ → 1), then the willingness to pay is determined primarily
by the productivity-tenure relationship [θh − θn]. How does the possibility of adverse selec-
tion in vacancy applications affect the firm’s willingness to pay? An implicit differentiation
of equation 6 with respect to ρ suggests that adverse sorting in vacancy applications re-
duces the willingness to pay for treatment unless (2αβ − 1)θh − θn > 0. Since the product
αβ represents the efficacy of treatment, low efficacy of treatment combined with a shallow
productivity-tenure trajectory will in general, reduce the likelihood of firm-based treatment.
In addition, the existence of an alternative albeit poor public treatment option (in which
firms no longer bear the direct cost of treatment c) alters the firm’s preference-for-treated
workers condition: the firm will prefer to keep a treated worker if
(r + ρ+ b)(cαβθh − θn) > (1− cαβ)μθh (7)
Where cαβ represents the efficacy of public treatment programs. In general, if the publictreatment option is a close substitute to the firm-based program, then firms will prefer to
retain infected workers if condition 5 holds. However, a poor treatment program captured
by a large (αβ−cαβ) > 0 can alter the firm’s preference for retaining treated workers and/ormotivate firm-based provision.
Finally we turn to a calibration of the willingness to pay for ARV treatment using equation
6. A major challenge in this exercise is estimating reliable productivity-wage profiles so as
to determine the relative magnitudes of θh and θn. The empirical evidence on the shape of
the productivity-wage profile over a worker’s tenure is thin and not very informative for our
purposes as it focuses on middle-aged workers.4546 If the findings for middle-aged workers
extend to the comparison between an experienced worker and a new recruit, then firms would
not provide treatment in equilibrium since θts − θn ≤ 0.Generating estimates for the magnitude of θh and θn is not straightforward given the
limited empirical estimates. Postel-Vinay and Robin (2002) is the only paper with plausibly
usable estimates for this calibration. We make the following assumption: a new worker is
analogous to the typical worker of a firm at the 25th percentile in the firm productivity dis-
to a less productive task.45Two recent contributions, Hellerstein, Neumark and Troske (1999) and Crepon, Deniau and Perez-
Duarte (2003), attempt to estimate the relative marginal productivity of different types of labor. Hellerstein
et. al. (1999) using US data conclude that the marginal productivity of middle aged workers rises at the
same rate as earnings. Conversely Crepon et. al.(2003) using French data find that earnings rise faster
than productivity for middle-aged workers, suggesting a declining marginal productivity-wage gap over some
range of tenure.46An older literature includes Lazear (1979, 1981), Medoff and Abraham (1980), Hutchens (1987),
Carmichael (1983) and Kotlikoff and Gokhale (1992).
30

tribution, and an experienced worker is the typical worker of a firm at the 75th percentile.
Using their results for unskilled workers and expressing these productivity wedges as a func-
tion of the median wage implies that θh ≈ 0.45w and θn ≈ 0.13w.47 Note that in using theestimates below, we assume uniform labor market frictions across economies and even more
unrealistically uniform productivity-wage gaps across countries.
We assume a discount rate r = 0.08. Firm data from the South Africa investment climate
survey (2003) yields an average tenure of 7 years which implies that b = 0.14 (South Africa
Investment Climate Report (2004)). Our HIV incidence data comes from Shelton et. al.
(2006). We take as our estimate of ρ, the high end of his estimates of HIV incidence rates
over a duration of one year: ρ = 0.06. Our estimate of μ depends on the share of individuals
who would be revealed to be high-productivity types in time interval t. We assume that
12% of new workers reach high productivity levels in their first year. This implies that
μ = (1 − ρ) (1− b) ∗ 0.12 = 0.1. Using our empirical results and those from Larson et. al.
(2008) we assume that α = 0.95 and β = 0.9.48
Using these estimates implies that under our baseline scenario, c∗ = 0.12w. A firm is
willing to contribute just under 1/8 of the workers’ wage for ARV treatment. We assume that
the cost of treating a worker is uniform across the central and eastern African countries at
$360/year or $30/month. We use the typical therapy prescribed for the Debswana treatment
program to estimate the monthly cost of treatment in Botswana, Namibia and Swaziland at
$100 and $141 in South Africa.49 Wages are drawn from the South Africa investment climate
report (World Bank, 2005). The results of this calibration are shown in Appendix Table 2.
We show the results for two levels θh [0.45w, 0.33w] and two assumptions about the
efficacy of treatment on presenteeism β [0.9, 0.6]. Assuming that θh ≈ 0.45w and that
β = 0.9, willingness to pay as a fraction of total annual treatment costs ranges from 13% in
Botswana to just under 50% in South Africa. Assuming that treatment is not as efficacious,
β = 0.6, reduces this range to 10-40%. Furthermore assuming a shallower productivity-
wage-tenure relationship ( θh = 0.33w, β = 0.6), reduces this range even further to 7-21%.
47These numbers come from Figure 1 in Postel-Vinay and Robin(2002).48It is difficult to derive reliable estimates of β from Larson et. al. (2008), since workers choose when
to undertake the piece-rate task. In their results, conditional on choosing the piece-rate task, there is no
difference in productivity for treated males, but a 10-15% negative gap for treated female workers. We use
the lower bound estimate for women as our estimate of β.49These numbers are based on costs of the AMPATH treatment program in Kenya. The breakdown is
about $150 for first line ARV drugs and $200 are the remaining treatment related costs (such clinic, medical
and lab expenditures). The Botswana estimate is derived from Debswana’s per patient costs. The estimate
for South Africa comes from Cleary, McIntyre and Boulle (2006).
31

Source: Authors' calculations based on HR and ART program data.
Source: Authors' calculations based on HR and ART program data.
Figure 1B: Attrition since start of ARV's
0
0.05
0.1
0.15
0.2
0.25
0.3
0 5 10 15 20 25 30 35
Months since start of ARV's
Att
riti
on
rat
e
attrition
death relatedattrition
Appendix Figure 1: Timing of program enrollment and ARV
treatment start
0
20
40
60
80
100
120
140
160
2001 2002 2003 2004 2005 2006
Year
Num
ber
of
Wo
rker
s
Year of program enrollment
Year of ARV start

Note: Panels A is from a Non-parametric Fan locally weighted regression with bootstrapped standard errors clustered by worker. Panels B, C and D are from a fixed effect regression that includes worker and month fixed effects. Panels E and F are based on OLS regressions that include month fixed effects. Sickness-related absence duration data comes from the company's HR database. The interval used is three years before and after the onset of ARV treatment. Panels A, B and E use an unbalanced sample, panels C and F a balanced sample and panel D a sample with weights based on inverse probability weights (IPW).
02
46
Day
s ab
sent
per
mon
th
-36 -24 -12 0 12 24 36Months before treatment
Panel A: non-parametric
02
46
Day
s ab
sent
per
mon
th-36 -24 -12 0 12 24 36
Months before treatment
Panel B: unbalanced sample
02
46
Day
s ab
sent
per
mon
th
-36 -24 -12 0 12 24 36Months before treatment
Panel C: balanced sample
02
46
Day
s ab
sent
per
mon
th
-36 -24 -12 0 12 24 36Months before treatment
Panel D: ipw sample
02
46
Day
s ab
sent
per
mon
th
-36 -24 -12 0 12 24 36Months before treatment
Panel E: unbalanced- no fixed eff.
02
46
Day
s ab
sent
per
mon
th
-36 -24 -12 0 12 24 36Months before treatment
Panel F: balanced- no fixed effect
Figure 2 : Effect of ARV treatment - Three year window

Note: Panels A is from a Non-parametric Fan locally weighted regression with bootstrapped standard errors clustered by worker. Panels B, C and D are from a fixed effect regression that includes worker and month fixed effects. Panels E and F are based on OLS regressions that include month fixed effects. Sickness-related absence duration data comes from the company's HR database for the Jwaneng mine. The intervals used are 5 years before and 4 years after the onset of ARV treatment. Panels A, B and E use an unbalanced sample, panels C and F a balanced sample and panel D a sample with weights based on inverse probability weights (IPW).
02
46
Day
s ab
sent
per
mon
th
-60 -24 -12 0 12 24 48Months before treatment
Panel A: non-parametric
02
46
Day
s ab
sent
per
mon
th-60 -24 -12 0 12 24 48
Months before treatment
Panel B: unbalanced sample
02
46
Day
s ab
sent
per
mon
th
-60 -24 -12 0 12 24 48Months before treatment
Panel C: balanced sample
02
46
Day
s ab
sent
per
mon
th
-60 -24 -12 0 12 24 48Months before treatment
Panel D: ipw sample
02
46
Day
s ab
sent
per
mon
th
-60 -24 -12 0 12 24 48Months before treatment
Panel E: unbalanced - no fixed effect
02
46
Day
s ab
sent
per
mon
th
-60 -24 -12 0 12 24 48Months before treatment
Panel F: balanced - no fixed eff.
Figure 3 : Effect of ARV treatment - Jwaneng mine
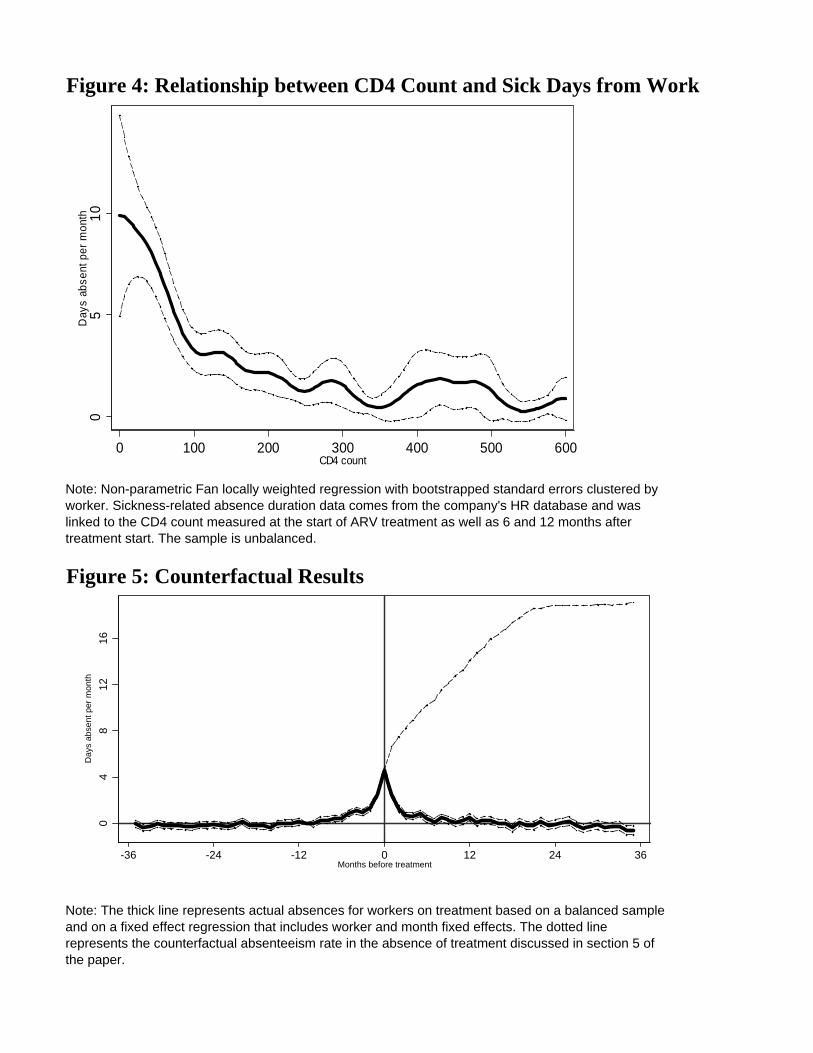
Figure 4: Relationship between CD4 Count and Sick Days from Work
Figure 5: Counterfactual Results
Note: Non-parametric Fan locally weighted regression with bootstrapped standard errors clustered by worker. Sickness-related absence duration data comes from the company's HR database and was linked to the CD4 count measured at the start of ARV treatment as well as 6 and 12 months after treatment start. The sample is unbalanced.
Note: The thick line represents actual absences for workers on treatment based on a balanced sample and on a fixed effect regression that includes worker and month fixed effects. The dotted line represents the counterfactual absenteeism rate in the absence of treatment discussed in section 5 of the paper.
05
10
Day
s ab
sent
per
mon
th
0 100 200 300 400 500 600CD4 count
04
812
16
Day
s ab
sent
per
mon
th
-36 -24 -12 0 12 24 36Months before treatment
pp g

Table 1: Sick Related Absenteeism around the Start of ARV treatment(Dependent variable: Number of days absent from work due to sickness in a month)
Unbalanced Panel Balanced Panel IPW Panel(1) (2) (3) (4) (5) (6)
Months since ARV treatment-11 months 0.484*** ---- 0.484*** ---- 0.485*** ----
[0.161] ---- [0.172] ---- [0.161] -----10 months 0.474*** -0.009 0.466*** -0.017 0.475*** -0.008
[0.160] [0.138] [0.170] [0.144] [0.160] [0.283]-9 months 0.745*** 0.250* 0.750*** 0.269* 0.746*** 0.251
[0.195] [0.138] [0.211] [0.143] [0.195] [0.298]-8 months 0.775*** 0.283** 0.716*** 0.248* 0.775*** 0.284
[0.193] [0.137] [0.204] [0.143] [0.193] [0.288]-7 months 0.920*** 0.412*** 0.891*** 0.411*** 0.920*** 0.417
[0.197] [0.137] [0.198] [0.142] [0.197] [0.289]-6 months 1.034*** 0.477*** 0.979*** 0.435*** 1.034*** 0.481*
[0.210] [0.136] [0.213] [0.141] [0.210] [0.288]-5 months 1.481*** 0.927*** 1.321*** 0.782*** 1.481*** 0.933***
[0.255] [0.135] [0.258] [0.141] [0.255] [0.314]-4 months 1.721*** 1.159*** 1.534*** 0.986*** 1.721*** 1.167***
[0.282] [0.135] [0.286] [0.141] [0.282] [0.326]-3 months 1.562*** 1.004*** 1.435*** 0.892*** 1.562*** 1.012***
[0.268] [0.135] [0.271] [0.141] [0.268] [0.315]-2 months 1.966*** 1.416*** 1.894*** 1.360*** 1.966*** 1.424***
[0.274] [0.135] [0.286] [0.141] [0.274] [0.318]-1 months 3.113*** 2.561*** 2.926*** 2.390*** 3.113*** 2.568***
[0.351] [0.135] [0.365] [0.141] [0.351] [0.366]0 months 5.132*** 4.556*** 4.975*** 4.413*** 5.132*** 4.563***
[0.430] [0.136] [0.446] [0.141] [0.430] [0.430]1 months 3.082*** 2.467*** 2.921*** 2.321*** 3.423*** 2.716***
[0.366] [0.137] [0.379] [0.143] [0.415] [0.400]2 months 1.792*** 1.215*** 1.816*** 1.260*** 1.957*** 1.306***
[0.303] [0.138] [0.324] [0.144] [0.334] [0.337]3 months 1.226*** 0.710*** 1.073*** 0.591*** 1.332*** 0.753**
[0.267] [0.140] [0.275] [0.146] [0.293] [0.314]4 months 1.102*** 0.593*** 1.011*** 0.541*** 1.197*** 0.625**
[0.228] [0.141] [0.230] [0.148] [0.254] [0.287]5 months 1.308*** 0.795*** 1.266*** 0.797*** 1.414*** 0.840**
[0.302] [0.143] [0.325] [0.150] [0.329] [0.327]6 months 0.919*** 0.407*** 0.913*** 0.453*** 1.012*** 0.44
[0.262] [0.145] [0.280] [0.153] [0.288] [0.307]7 months 0.616*** 0.16 0.530** 0.14 0.636*** 0.13
[0.209] [0.148] [0.213] [0.156] [0.219] [0.292]8 months 0.984*** 0.506*** 0.918*** 0.516*** 1.043*** 0.516*
[0.266] [0.150] [0.280] [0.159] [0.289] [0.304]9 months 0.829*** 0.340** 0.613** 0.204 0.880*** 0.348
[0.255] [0.152] [0.244] [0.161] [0.274] [0.304]10 months 0.543*** 0.069 0.427** 0.04 0.570*** 0.055
[0.195] [0.153] [0.213] [0.163] [0.209] [0.273]11 months 0.728*** 0.229 0.772*** 0.361** 0.753*** 0.212
[0.240] [0.154] [0.283] [0.164] [0.249] [0.306]12 months 0.996*** 0.485*** 0.853*** 0.430*** 1.039*** 0.485*
[0.252] [0.155] [0.257] [0.165] [0.269] [0.291]Observations 369916 369916 368898 368898 369869 369869Controls month fixed person & month month fixed person & month month fixed person & month
effects fixed effects effects fixed effects effects fixed effectsNotes: The unit of observation is a person month. Huber-White standard errors in parentheses, except for columns (1) (3) and (5) where thestandard errors are clustered at the person level. The unbalanced panel uses all available person month observations, the balanced panelincludes only those workers on ARV treatment for at least 12 months. Columns (5) and (6) use a sample with weights based on inverseprobability weights (IPW). All regressions also add the rest of the workers at the company as controls.*** significant at 1% level. ** significantat 5% level. * significant at 10% level.

Table 2: CD4 Counts and Absenteeism from Work
Number of Sick Days per MonthOLS OLS OLS Fixed Effects Fixed Effects Fixed Effects
unbalanced balanced ip-weights unbalanced balanced ip-weights(1) (2) (3) (4) (5) (6)
CD4 count -0.0109*** -0.0071*** -0.0103*** -0.0111*** -0.0098*** -0.0103***[0.0015] [0.0015] [0.0023] [0.0021] [0.0027] [0.0031]
Mean of dep. variable 3.22 2.16 2.39 3.22 2.16 2.39
Observations 845 414 844 845 414 844
Notes: Sick days from work data comes from the company's HR database and was linked to the CD4 count measured at the start of ARV treatment as well as 6 and 12 months after treatment start. All regressions in columns (1)-(3) include controls for age, worker band, gender and month and year of treatment start and the standard errors are clustered at the person level. Results in columns (4)-(6) are based person fixed effects regressions. The regressions in columns (1) and (4) use an unbalanced sample, the regressions in columns (2) and (5) use a balanced sample that includes only patients with three CD4 mesures and the regressions in columns (3) and (6) use inverse probability weights (IPW).*** significant at 1% level. ** significant at 5% level. * significant at 10% level.

Appendix Table 1
Panel A: Summary statistics Mean SD N
Information for those receiving ARV treatment
CD4 at treatment start 163 136 427 CD4 after 6 months 268 183 237 CD4 after 12 months 296 192 181 Age 42.65 8.28 441 Percent Male 0.82 0.39 441Absenteeism Information (everyone)
Monthly sickdays 0.32 2.07 369916 Monthly ordinary leave 0.80 2.02 369916
Panel B: Treatment program statistics (May 2001 - April 2006)
Number
Enrollment in Treatment Program - Total 721 - Spouses 183 - Workers 538 - Workers (with matched HR data) 530
Patients ever on ARVs among those enrolled in program
- Total 606 - Spouses 157 - Workers 449 - Workers (with matched HR data) 441
Appendix Table 2: Share of Annual Treatment Costs Firms Willing to PayCountry
Monthly Wage in 2005$
Treatment Efficacy: β=0.9
Treatment Efficacy: β=0.6
Treatment Efficacy: β=0.9
Treatment Efficacy: β=0.6
Tanzania 53 14.8 11.7 8.5 8.2Eritrea 62 17.2 13.6 9.9 9.6Uganda 73 20.3 16.1 11.7 11.3Zambia 79 22.0 17.4 12.7 12.3Kenya 110 30.7 24.3 17.7 17.1Nigeria 136 37.9 30.0 21.8 21.1Botswana 157 13.0 10.3 7.5 7.3Swaziland 189 15.7 12.4 9.1 8.7Namibia 299 24.9 19.7 14.3 13.9South Africa 412 49.4 39.1 19.8 19.1
Notes: Column (1) shows median monthly wages for production workers using manufacturing firm surveys conducted between 2002 and 2005. Column (2) provides estimates of the percentage of treatment costs a firm would be willing to pay under the baseline scenario. Column (3) shows how changing beta affects willingness to pay. In Columns (4) and (5) present corresponding estimates when productivity-tenure profile is not as steep θh=0.33w).
Notes: SD is the standard deviation and N is the sample size. The information on absences are based on the sample included in Table 2.
θh=0.45w, θn =0.13w θh=0.33w, θn =0.13w