the impact of heavy metals on the aerobic biodegradation
TRANSCRIPT

THE IMPACT OF HEAVY METALS ON THE AEROBIC BIODEGRADATION OF
1,2-DICHLOROETHANE IN SOIL
BY
ADHIKA BALGOBIND
Submitted in fulfilment of the academic requirements for the degree of Master of Science (MSc) in
the Discipline of Microbiology, School of Biochemistry, Genetics and Microbiology, Faculty of
Science and Agriculture at the University of KwaZulu-Natal (Westville Campus).
As the candidate’s supervisor, I have approved this dissertation for submission.
Signed: Name: Date:

i
ACKNOWLEDGEMENTS
The author wishes to extend her sincere gratitude to the following person(s) and organizations:
Her Guru, Swami Ganesh Dutta Shukla, International Religious Preacher, for his guidance;
Dr. A. O. Olaniran, Discipline of Microbiology, UKZN (Westville campus) for his time, supervision and
contribution during the course of this study;
Prof. B. Pillay, Discipline of Microbiology, UKZN (Westville campus) for project supervision;
Mr. and Mrs. A. Balgobind (parents of the author) for their support and assistance;
National Research Foundation for financial support;
Umgeni Water Laboratory Services for soil chemical analysis;
Dr. A. Govender (Microbiology) for technical assistance;
Mrs. T. Naidoo (Chemistry) for assistance with ICP-OES;
The staff and postgraduate students of the Discipline of Microbiology, UKZN (Westville campus) with
special reference to Mr. B. Naidoo, Ms. D. A. Rajpal and Ms. S. Moodley;
Her brother, Mr. Y. Balgobind, and all friends, in particular Ms. T. Behari and Ms. K. Naicker for their
support, encouragement and love;
God, for guiding and granting her the strength to complete the study.

ii
ABSTRACT
1,2-Dichloroethane (1,2-DCA), a short chain chlorinated aliphatic compound, is one of the most
hazardous toxic pollutant of soil and groundwater, with an annual production in excess of 5.44 × 10⁹ kg.
The major concern over soil contamination with 1,2-DCA stems largely from health risks. Owing to their
toxicity, persistence and potential for bioaccumulation, there is a growing interest in technologies for their
removal. Many sites are, however, co-contaminated with a complex mixture of 1,2-DCA and heavy metal
contaminants. Co-contaminated environments are considered difficult to remediate because of the mixed
nature of the contaminants and the fact that the two components often must be treated differently.
Therefore, the objective of this study was to evaluate the aerobic biodegradation of 1,2-DCA by
autochthonous microorganisms in soil co-contaminated with 1,2-DCA and heavy metals, namely; arsenic
(As3+
), cadmium (Cd2+
), mercury (Hg2+
) and lead (Pb2+
), via a direct and quantitative measurement of the
inhibitory effects of heavy metals in a microcosm setting. Effects of various metal concentrations and
their combinations were evaluated based on the following: (i) degradation rate constants; (ii) estimated
minimal inhibitory concentrations (MICs) of metals; (iii) concentrations of heavy metals that caused
biodegradation half-life doublings (HLDs); and (iv) heavy metal concentrations that caused a significant
effect on biodegradation (> 10% increase in t½ of 1,2-DCA). The effects of biostimulation,
bioaugmentation and the addition of treatment additives on the biodegradation process were evaluated.
The presence of heavy metals was observed to have a negative impact on the biodegradation of 1,2-DCA
in both clay and loam soil samples, with the toxic effect being more pronounced in loam soil for all heavy
metal concentrations except for Hg2+
, after 15 days. Heavy metal concentrations of 75 mg/kg As3+
,
840 mg/kg Hg2+
, and 420 mg/kg Pb2+
, resulted in 34.24%, 40.64%, and 45.94% increases in the t½ of
1,2-DCA, respectively, in loam soil compared to clay soil. Moreover, the combination of four heavy
metals in loam soil resulted in 6.26% less degradation of 1,2-DCA compared to clay soil, after 15 days.
Generally, more than 127.5 mg/kg Cd2+
, 840 mg/kg Hg2+
and 420 mg/kg of Pb2+
was able to cause a >
10% increase in the t½ of 1,2-DCA in clay soil, while less than 75 mg/kg was required for As3+
. An
increased reduction in 1,2-DCA degradation was observed with increasing concentration of the heavy
metals. In clay soil, a dose-dependant relationship between k1 and metal ion concentrations in which k1
decreased with higher initial metal concentrations was observed for all the heavy metals tested except
Hg2+
. Ammonium nitrate-extractable fractions of bioavailable As3+
and Cd2+
concentrations varied
greatly, with approximately < 2.73% and < 0.62% of the total metal added to the system being
bioavailable, respectively. Although bioavailable heavy metal fractions were lower than the total metal
concentration added to the system, indigenous microorganisms were sensitive to the heavy metals.
Biostimulation, bioaugmentation and amendment with treatment additives were all effective in enhancing

iii
the biodegradation of 1,2-DCA in the co-contaminated soil. In particular, biostimulation with fertilizer,
dual-bioaugmentation and amendment with CaCO3 were most efficient in enhancing 1,2-DCA
degradation resulting in 41.93%, 59.95% and 51.32% increases in the degradation rate constant of
1,2-DCA in the As3+
co-contaminated soil, respectively, after 20 days. Among all the treatments, dual-
bioaugmentation produced the highest 1,2-DCA degrading population of up to 453.33 × 10⁷ cfu/ml in the
Cd2+
co-contaminated soil. On comparison of the As3+
and Cd2+
co-contaminated soil undergoing either
biostimulation or dual-bioaugmentation, similarity in the denaturing gradient gel electrophoresis (DGGE)
banding patterns was observed. However, the banding patterns for the different bioremediation options
demonstrated a difference in bacterial diversity between the fertilized and dual-bioaugmented samples.
DGGE profiles also indicate that while numerous bands were common in the fertilized co-contaminated
soils, there were also changes in the presence and intensity of bands due to treatment and temporal
effects. Dehydrogenase and urease activities provided a more accurate assessment of the negative impact
of heavy metals on the indigenous soil microorganisms, resulting in up to 87.26% and 69.58% decreases
in activities, respectively. In both the biostimulated and bioaugmented soil microcosms, dehydrogenase
activity appeared biphasic with an initial decrease followed by an increase in the treated soils over time.
Results from this study provide relevant information on some alterations that could be introduced to
overcome a critical bottle-neck of the application of bioremediation technology. In conclusion, the
bioremediation strategies adopted in this study may be used as a rational methodology for remediation of
sites co-contaminated with 1,2-DCA and heavy metals, subject to a thorough understanding of the
microbial ecology and physico-chemical parameters of the site.

iv
LIST OF FIGURES
Figure 1.1: Proposed catabolic pathway of 1,2-DCA in X. autotrophicus GJ10. (A), 1,2-DCA; (B), 2-
Chloroethanol; (C), 2-Chloroacetaldehyde; (D), Monochloroacetic acid; (E), Glycolic acid (Song
et al., 2004). 10
Figure 2.1: Biodegradation profiles of 1,2-DCA in (a) clay soil and (b) loam soil co-contaminated with
various concentrations of heavy metals. A = autoclaved soil control + 1,2-DCA; B = unautoclaved
soil control + 1,2-DCA; C = soil + 1,2-DCA + 75 mg/kg As3+; D = soil + 1,2-DCA + 150 mg/kg
As3+; E = soil + 1,2-DCA + 85 mg/kg Cd2+; F = soil + 1,2-DCA + 170 mg/kg Cd2+; G = soil + 1,2-
DCA + 840 mg/kg Hg2+; H = soil + 1,2-DCA + 1680 mg/kg Hg2+; I = soil + 1,2-DCA + 420
mg/kg Pb2+; J = soil + 1,2-DCA + 840 mg/kg Pb2+. Bars indicate the average of triplicate samples
while the error bars show the standard deviation. 55
Figure 2.2: Inhibitory effects of (a) As3+, (b) Cd2+, (c) Hg2+ and (d) Pb2+ on pseudo-first-order 1,2-DCA
biodegradation rates in clay soil. The slopes of regression lines of the natural logarithms of 1,2-
DCA concentration versus time equal the rate coefficients, k1. Treatments shown are: ( )
Unautoclaved soil control, ( ) Low concentration of HM, ( ) Moderate concentration of HM and
( X ) High concentration of HM. 59
Figure 2.3: Biodegradation profiles of 1,2-DCA in (a) clay and (b) loam soil co-contaminated with binary
combinations of heavy metals (As3+ = 112.5 mg/kg, Cd2+ = 127.5 mg/kg, Hg2+ = 1260 mg/kg, and
Pb2+ = 630 mg/kg). A = autoclaved soil control + 1,2-DCA; B = unautoclaved soil control + 1,2-
DCA; C = soil + 1,2-DCA + As3+ + Cd2+; D = soil + 1,2-DCA + As3+ + Hg2+; E = soil + 1,2-DCA
+ As3+ + Pb2+; F = soil + 1,2-DCA + Cd2+ + Hg2+; G = soil + 1,2-DCA + Cd2+ + Pb2+; H = soil +
1,2-DCA + Hg2+ + Pb2+. Bars indicate the average of triplicate samples while the error bars show
the standard deviation. 61
Figure 2.4: Biodegradation profiles of 1,2-DCA in (a) clay and (b) loam soil co-contaminated with
combinations of three and four heavy metals (As3+ = 112.5 mg/kg, Cd2+ = 127.5 mg/kg, Hg2+ =
1260 mg/kg, and Pb2+ = 630 mg/kg). A = autoclaved soil control + 1,2-DCA; B = unautoclaved
soil control +1,2-DCA; C = soil + 1,2-DCA + As3+ + Cd2+ + Hg2+; D = soil + 1,2-DCA + As3+ +
Cd2+ + Pb2+; E = soil + 1,2-DCA + As3+ + Hg2+ + Pb2+; F = soil + 1,2-DCA + Cd2+ + Hg2+ + Pb2+;
G = soil + 1,2-DCA + As3+ + Cd2+ + Hg2+ + Pb2+. Bars indicate the average of triplicate samples
while the error bars show the standard deviation. 62
Figure 3.1: Effects of biostimulation and bioaugmentation on the biodegradation of 1,2-DCA in soil co-
contaminated with (a) 150 mg/kg As3+ and (b) 170 mg/kg Cd2+. A = autoclaved soil control + 1,2-
DCA; B = unautoclaved soil control + 1,2-DCA; C = unautoclaved soil control + 1,2-DCA + HM;
D = soil + 1,2-DCA + HM + glucose; E = soil + 1,2-DCA + HM + fructose; F = soil + 1,2-DCA +
HM + fertilizer; G = soil + 1,2-DCA + HM + X. autotrophicus GJ10; H = soil + 1,2-DCA + HM +
dual-bioaugmentation. Bars indicate the average of triplicate samples while the error bars show the
standard deviation. 75

v
Figure 3.2: DGGE profiles of 16S rRNA gene fragments from co-contaminated loam soil samples
biostimulated with fertilizer. Lanes: a1, a2, a3, a4 and a5 represent days 0, 5, 10, 15 and 20 of the
As3+ co-contaminated soil and a6, a7, a8, a9 and a10 represent days 0, 5, 10, 15 and 20 of the Cd2+
co-contaminated soil. 79
Figure 3.3: DGGE profiles of 16S rRNA gene fragments from co-contaminated loam soil samples undergoing
dual-bioaugmentation. Lanes: b1 represents X. autotrophicus GJ10, b2 represents native HM
resistant strain, b3, b4, b5, b6 and b7 represent days 0, 5, 10, 15 and 20 of the As3+ co-
contaminated soil and b8, b9, b10, b11 and b12 represent days 0, 5, 10, 15 and 20 of the Cd2+ co-
contaminated soil. 79
Figure 3.4: Effects of 1,2-DCA and (a) As3+; (b) Cd2+ on soil microbial dehydrogenase activity in microcosms
undergoing biostimulation. A = unautoclaved soil control + 1,2-DCA; B = unautoclaved soil
control + 1,2-DCA + HM; C = soil + 1,2-DCA + HM + glucose; D = soil + 1,2-DCA + HM +
fructose; E = soil + 1,2-DCA + HM + fertilizer. The results indicate the average of triplicate
samples while the error bars show the standard deviation. 81
Figure 3.5: Effects of 1,2-DCA and (a) As3+; (b) Cd2+ on soil microbial dehydrogenase activity in microcosms
undergoing bioaugmentation. A = unautoclaved soil control + 1,2-DCA; B = unautoclaved soil
control + 1,2-DCA + HM; C = soil + 1,2-DCA + HM + X. autotrophicus GJ10; D = soil + 1,2-
DCA + HM + dual-bioaugmentation. The results indicate the average of triplicate samples while
the error bars show the standard deviation. 82
Figure 3.6: Effects of 1,2-DCA and (a) As3+; (b) Cd2+ on soil microbial urease activity in microcosms
undergoing biostimulation. A = unautoclaved soil control + 1,2-DCA; B = unautoclaved soil
control + 1,2-DCA + HM; C = soil + 1,2-DCA + HM + glucose; D = soil + 1,2-DCA + HM +
fructose; E = soil + 1,2-DCA + HM + fertilizer. The results indicate the average of triplicate
samples while the error bars show the standard deviation. 83
Figure 3.7: Effects of 1,2-DCA and (a) As3+; (b) Cd2+ on soil microbial urease activity in microcosms
undergoing bioaugmentation. A = unautoclaved soil control + 1,2-DCA; B = unautoclaved soil
control + 1,2-DCA + HM; C = soil + 1,2-DCA + HM + X. autotrophicus GJ10; D = soil + 1,2-
DCA + HM + dual-bioaugmentation. The results indicate the average of triplicate samples while
the error bars show the standard deviation. 84
Figure 4.1: Degradation profiles of 1,2-DCA in soil co-contaminated with (a) 150 mg/kg As3+
and (b) 170
mg/kg Cd2+ in the presence of treatment additives. A = autoclaved soil control + 1,2-DCA; B =
unautoclaved soil control + 1,2-DCA; C = unautoclaved soil control + 1,2-DCA + HM; D = soil +
1,2-DCA + HM + CaCO3; E = soil + 1,2-DCA + HM + Na2HPO4 + NaCl; F = soil + 1,2-DCA +
HM + CaSO4.2H2O. Bars indicate the average of triplicate samples while the error bars show the
standard deviation. 95
Figure 4.2: Effects of 1,2-DCA and (a) As3+; (b) Cd2+ on soil microbial dehydrogenase activity in microcosms
containing treatment additives. A = unautoclaved soil control + 1,2-DCA; B = unautoclaved soil
control + 1,2-DCA + HM; C = soil + 1,2-DCA + HM + CaCO3; D = soil + 1,2-DCA + HM +
Na2HPO4 + NaCl; E = soil + 1,2-DCA + HM + CaSO4.2H2O. The results are average of triplicate
samples while the error bars show the standard deviation. 100

vi
Figure 4.3: Effects of 1,2-DCA and (a) As3+; (b) Cd2+ on soil microbial urease activity in microcosms
containing treatment additives. A = unautoclaved soil control + 1,2-DCA; B = unautoclaved soil
control + 1,2-DCA + HM; C = soil + 1,2-DCA + HM + CaCO3; D = soil + 1,2-DCA + HM +
Na2HPO4 + NaCl; E = soil + 1,2-DCA + HM + CaSO4.2H2O. The results are average of triplicate
samples while the error bars show the standard deviation. 101

vii
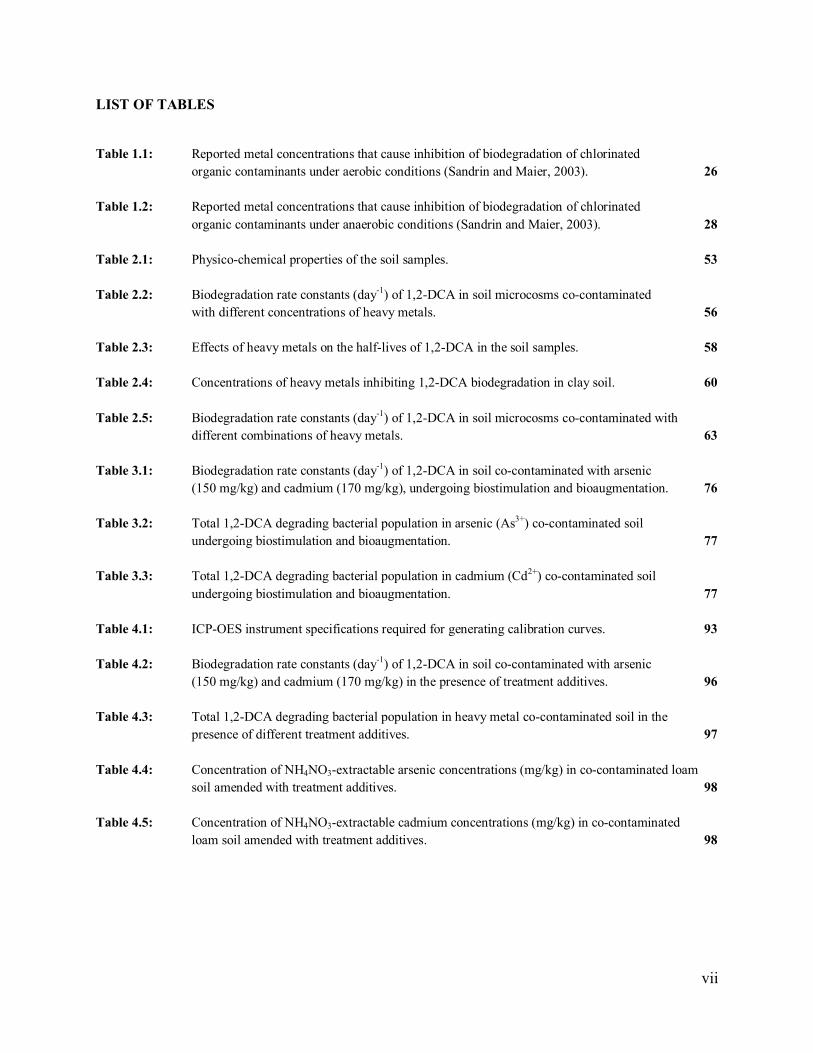
LIST OF TABLES
Table 1.1: Reported metal concentrations that cause inhibition of biodegradation of chlorinated
organic contaminants under aerobic conditions (Sandrin and Maier, 2003). 26
Table 1.2: Reported metal concentrations that cause inhibition of biodegradation of chlorinated
organic contaminants under anaerobic conditions (Sandrin and Maier, 2003). 28
Table 2.1: Physico-chemical properties of the soil samples. 53
Table 2.2: Biodegradation rate constants (day-1) of 1,2-DCA in soil microcosms co-contaminated
with different concentrations of heavy metals. 56
Table 2.3: Effects of heavy metals on the half-lives of 1,2-DCA in the soil samples. 58
Table 2.4: Concentrations of heavy metals inhibiting 1,2-DCA biodegradation in clay soil. 60
Table 2.5: Biodegradation rate constants (day-1) of 1,2-DCA in soil microcosms co-contaminated with
different combinations of heavy metals. 63
Table 3.1: Biodegradation rate constants (day-1) of 1,2-DCA in soil co-contaminated with arsenic
(150 mg/kg) and cadmium (170 mg/kg), undergoing biostimulation and bioaugmentation. 76
Table 3.2: Total 1,2-DCA degrading bacterial population in arsenic (As3+) co-contaminated soil
undergoing biostimulation and bioaugmentation. 77
Table 3.3: Total 1,2-DCA degrading bacterial population in cadmium (Cd2+) co-contaminated soil
undergoing biostimulation and bioaugmentation. 77
Table 4.1: ICP-OES instrument specifications required for generating calibration curves. 93
Table 4.2: Biodegradation rate constants (day-1) of 1,2-DCA in soil co-contaminated with arsenic
(150 mg/kg) and cadmium (170 mg/kg) in the presence of treatment additives. 96
Table 4.3: Total 1,2-DCA degrading bacterial population in heavy metal co-contaminated soil in the
presence of different treatment additives. 97
Table 4.4: Concentration of NH4NO3-extractable arsenic concentrations (mg/kg) in co-contaminated loam
soil amended with treatment additives. 98
Table 4.5: Concentration of NH4NO3-extractable cadmium concentrations (mg/kg) in co-contaminated
loam soil amended with treatment additives. 98

PREFACE
The experimental work described in this dissertation was carried out in the School of Biochemistry,
Genetics and Microbiology, University of KwaZulu-Natal (Westville Campus), Durban, South Africa
from January 2008 to December 2009, under the supervision of Dr. A. O. Olaniran and the co-supervision
of Professor B. Pillay.
These studies represent original work by the author and have not otherwise been submitted in any form
for any degree or diploma to any tertiary institution. Where use has been made of the work of others it is
duly acknowledged in the text.

FACULTY OF SCIENCE AND AGRICULTURE
DECLARATION 1 – PLAGIARISM
I, ……………………………………….……………………………………………………...., declare that
1. The research reported in this dissertation, except where otherwise indicated, is my original
research.
2. This dissertation has not been submitted for any degree or examination at any other university.
3. This dissertation does not contain other persons’ data, pictures, graphs or other information,
unless specifically acknowledged as being sourced from other persons.
4. This dissertation does not contain other persons' writing, unless specifically acknowledged as
being sourced from other researchers. Where other written sources have been quoted, then:
a. Their words have been re-written but the general information attributed to them has been
referenced
b. Where their exact words have been used, then their writing has been placed in italics and
inside quotation marks, and referenced.
5. This dissertation does not contain text, graphics or tables copied and pasted from the Internet,
unless specifically acknowledged, and the source being detailed in the thesis and in the
References sections.
Signed
…………………………………………………………………………… Declaration Plagiarism 22/05/08 FHDR Approved

FACULTY OF SCIENCE AND AGRICULTURE
DECLARATION 2 – PUBLICATIONS
DETAILS OF CONTRIBUTION TO PUBLICATIONS that form part and/or include research presented
in this dissertation (include publications in preparation, submitted, in press and published and give details
of the contributions of each author to the experimental work and writing of each publication)
Publication 1
NOT APPLICABLE
Publication 2
Publication 3
Etc.
Signed:
…………………………………………………………………………… Declaration Publications FHDR 22/05/08 Approved

TABLE OF CONTENTS
CONTENTS PAGE
ACKNOWLEDGEMENTS i
ABSTRACT ii
LIST OF FIGURES iv
LIST OF TABLES vii
CHAPTER ONE: INTRODUCTION AND LITERATURE REVIEW
1.1 Introduction 1
1.2 Chlorinated hydrocarbons 4
1.2.1 Classes 4
1.2.2 Properties and uses 4
1.2.3 Environmental and health effects 5
1.3 1,2-Dichloroethane 5
1.3.1 Properties 5
1.3.2 Production and uses 5
1.3.3 Release 6
1.3.4 Human exposure 7
1.3.5 Environmental and health effects 7
1.3.6 Biodegradation of 1,2-dichloroethane 8
1.3.6.1 Abiotic transformation of 1,2-dichloroethane 9
1.3.6.2 Aerobic biodegradation of 1,2-dichloroethane 9
1.3.6.3 Anaerobic biodegradation of 1,2-dichloroethane 10
1.3.6.4 Halorespiration of 1,2-dichloroethane 11
1.4 Metal toxicity and microbial resistance mechanisms 11
1.4.1 Toxic effects of heavy metals 11
1.4.2 Mechanisms of microbial resistance to metals 12
1.4.2.1 Arsenic 13
1.4.2.2 Cadmium 14
1.4.2.3 Mercury 15
1.4.2.4 Lead 16

1.5 Metal speciation and bioavailability 16
1.5.1 Binding components and physico-chemical characteristics in medium
and soil 18
1.5.2 pH and redox potential 19
1.6 Measurement of bioavailable metal 21
1.6.1 Bacterial biosensors 22
1.6.2 Immunoassays and bioreporters 22
1.6.3 Geochemical modeling software 23
1.6.4 Diffusive gradients in thin-films 23
1.7 Influence of heavy metals on microbiological processes involved in the
biodegradation of chlorinated organic compounds 23
1.8 Relationships between metal concentration and inhibition of biodegradation 29
1.8.1 Semi-Dose Dependent Pattern 1: low metal concentrations stimulate
biodegradation; high metal concentrations inhibit biodegradation 29
1.8.2 Semi-Dose Dependent Pattern 2: low metal concentrations inhibit
biodegradation; high metal concentrations inhibit less 30
1.9 Bioremediation 30
1.9.1 Natural attenuation 31
1.9.2 Biostimulation 31
1.9.3 Bioaugmentation 32
1.10 Bioremediation strategies for increasing biodegradation in co-contaminated
environments 33
1.10.1 Metal-resistant bacteria 33
1.10.2 Treatment amendments 35
1.10.3 Clay minerals 36
1.10.4 Chelating agents 37
1.10.5 Biosurfactants 38
1.10.6 Phytoremediation 39
1.11 Assessment of microbial diversity in contaminated soil environments 41
1.12 Denaturing gradient gel electrophoresis 42
1.12.1 Advantages 43
1.12.2 Disadvantages 43
1.13 Scope of the present study 44
1.13.1 Hypothesis tested 45

1.13.2 Objectives 45
1.13.3 Experimental design 45
CHAPTER TWO: QUANTITATIVE ASSESSMENT OF THE TOXIC EFFECTS
OF HEAVY METALS ON THE AEROBIC BIODEGRADATION
OF 1,2-DICHLOROETHANE IN CO-CONTAMINATED SOIL
2.1 Introduction 47
2.2 Materials and methods 50
2.2.1 Sample collection and handling 50
2.2.2 Experimental design and microcosms set-up 50
2.2.3 Analytical procedures 51
2.2.4 Quantitative analysis 51
2.2.5 Soil analysis 52
2.2.5.1 Moisture content 52
2.2.5.2 pH 52
2.2.5.3 Nutrients 52
2.3 Results 52
2.3.1 Soil characterization 52
2.3.2 Impact of different concentrations of heavy metals on 1,2-DCA
biodegradation in soil 53
2.3.3 Kinetics of 1,2-DCA degradation in the presence of heavy metals 57
2.3.4 Impact of different combinations of heavy metals on 1,2-DCA
biodegradation in soil 60
2.4 Discussion 63
CHAPTER THREE: ENHANCED BIODEGRADATION OF 1,2-DICHLOROETHANE
IN SOIL CO-CONTAMINATED WITH HEAVY METALS
UNDER DIFFERENT BIOREMEDIATION STRATEGIES
3.1 Introduction 67
3.2 Materials and methods 69
3.2.1 Enrichment cultures and isolation of heavy metal-resistant bacteria 69
3.2.2 Bacterial cultures 69
3.2.3 Standardization of the bacterial cultures 69
3.2.4 Experimental design and microcosm set-up 70

3.2.5 Enumeration of total 1,2-DCA degrading populations 70
3.2.6 Soil analysis 70
3.2.7 Soil enzyme assays 71
3.2.7.1 Dehydrogenase activity 71
3.2.7.2 Urease activity 71
3.2.8 DNA extraction and PCR 72
3.2.8.1 DNA extraction and PCR amplification of 16S rDNA region 72
3.2.8.2 PCR amplification of V3 to V5 region 72
3.2.9 Denaturing Gradient Gel Electrophoresis (DGGE) 73
3.2.10 Statistical analysis 73
3.3 Results 73
3.3.1 Effect of biostimulation and bioaugmentation on the biodegradation of
1,2-DCA in co-contaminated soil 73
3.3.2 Total 1,2-DCA degrading bacterial population dynamics in the
co-contaminated soil 76
3.3.3 PCR-DGGE analysis of bacterial community diversity 78
3.3.4 The combined effect of 1,2-DCA and heavy metals on soil
microbial activities 80
3.4 Discussion 85
CHAPTER FOUR: EVALUATION OF THE IMPACTS OF DIFFERENT
TREATMENT ADDITIVES ON METAL BIOAVAILABILITY
AND 1,2-DICHLOROETHANE DEGRADATION IN CO-
CONTAMINATED SOIL
4.1 Introduction 90
4.2 Materials and methods 92
4.2.1 Sample collection and handling 92
4.2.2 Experimental design and microcosm set-up 92
4.2.3 Analytical procedures 92
4.2.4 Enumeration of total 1,2-DCA degrading populations 92
4.2.5 Soil analysis 92
4.2.6 Dehydrogenase and urease activity 93
4.2.7 Bioavailability of heavy metals 93
4.2.8 Statistical analysis 93

4.3 Results 94
4.3.1 Effect of treatment additives on 1,2-DCA biodegradation in
co-contaminated soil 94
4.3.2 Total 1,2-DCA bacterial population dynamics in the
co-contaminated soil 96
4.3.3 Concentrations of soil bioavailable heavy metals 97
4.3.4 Combined effects of 1,2-DCA and heavy metals on soil microbial
enzyme activities 99
4.4 Discussion 102
CHAPTER FIVE: GENERAL DISCUSSION AND CONCLUSION
5.1 The research in perspective 106
5.2 Potential for future development of the study 111
REFERENCES 113
APPENDIX A: COMPOSITION OF MEDIA AND REAGENTS 163
APPENDIX B: STANDARD CURVES AND NUMERICAL DATA 168

i
ACKNOWLEDGEMENTS
The author wishes to extend her sincere gratitude to the following person(s) and organizations:
Her Guru, Swami Ganesh Dutta Shukla, International Religious Preacher, for his guidance;
Dr. A. O. Olaniran, Discipline of Microbiology, UKZN (Westville campus) for his time, supervision and
contribution during the course of this study;
Prof. B. Pillay, Discipline of Microbiology, UKZN (Westville campus) for project supervision;
Mr. and Mrs. A. Balgobind (parents of the author) for their support and assistance;
National Research Foundation for financial support;
Umgeni Water Laboratory Services for soil chemical analysis;
Dr. A. Govender (Microbiology) for technical assistance;
Mrs. T. Naidoo (Chemistry) for assistance with ICP-OES;
The staff and postgraduate students of the Discipline of Microbiology, UKZN (Westville campus) with
special reference to Mr. B. Naidoo, Ms. D. A. Rajpal and Ms. S. Moodley;
Her brother, Mr. Y. Balgobind, and all friends, in particular Ms. T. Behari and Ms. K. Naicker for their
support, encouragement and love;
God, for guiding and granting her the strength to complete the study.

ii
ABSTRACT
1,2-Dichloroethane (1,2-DCA), a short chain chlorinated aliphatic compound, is one of the most
hazardous toxic pollutant of soil and groundwater, with an annual production in excess of 5.44 × 10⁹ kg.
The major concern over soil contamination with 1,2-DCA stems largely from health risks. Owing to their
toxicity, persistence and potential for bioaccumulation, there is a growing interest in technologies for their
removal. Many sites are, however, co-contaminated with a complex mixture of 1,2-DCA and heavy metal
contaminants. Co-contaminated environments are considered difficult to remediate because of the mixed
nature of the contaminants and the fact that the two components often must be treated differently.
Therefore, the objective of this study was to evaluate the aerobic biodegradation of 1,2-DCA by
autochthonous microorganisms in soil co-contaminated with 1,2-DCA and heavy metals, namely; arsenic
(As3+), cadmium (Cd2+), mercury (Hg2+) and lead (Pb2+), via a direct and quantitative measurement of the
inhibitory effects of heavy metals in a microcosm setting. Effects of various metal concentrations and
their combinations were evaluated based on the following: (i) degradation rate constants; (ii) estimated
minimal inhibitory concentrations (MICs) of metals; (iii) concentrations of heavy metals that caused
biodegradation half-life doublings (HLDs); and (iv) heavy metal concentrations that caused a significant
effect on biodegradation (> 10% increase in t½ of 1,2-DCA). The effects of biostimulation,
bioaugmentation and the addition of treatment additives on the biodegradation process were evaluated.
The presence of heavy metals was observed to have a negative impact on the biodegradation of 1,2-DCA
in both clay and loam soil samples, with the toxic effect being more pronounced in loam soil for all heavy
metal concentrations except for Hg2+, after 15 days. Heavy metal concentrations of 75 mg/kg As3+,
840 mg/kg Hg2+, and 420 mg/kg Pb2+, resulted in 34.24%, 40.64%, and 45.94% increases in the t½ of
1,2-DCA, respectively, in loam soil compared to clay soil. Moreover, the combination of four heavy
metals in loam soil resulted in 6.26% less degradation of 1,2-DCA compared to clay soil, after 15 days.
Generally, more than 127.5 mg/kg Cd2+, 840 mg/kg Hg2+ and 420 mg/kg of Pb2+ was able to cause a >
10% increase in the t½ of 1,2-DCA in clay soil, while less than 75 mg/kg was required for As3+. An
increased reduction in 1,2-DCA degradation was observed with increasing concentration of the heavy
metals. In clay soil, a dose-dependant relationship between k1 and metal ion concentrations in which k1
decreased with higher initial metal concentrations was observed for all the heavy metals tested except
Hg2+. Ammonium nitrate-extractable fractions of bioavailable As3+ and Cd2+ concentrations varied
greatly, with approximately < 2.73% and < 0.62% of the total metal added to the system being
bioavailable, respectively. Although bioavailable heavy metal fractions were lower than the total metal
concentration added to the system, indigenous microorganisms were sensitive to the heavy metals.
Biostimulation, bioaugmentation and amendment with treatment additives were all effective in enhancing

iii
the biodegradation of 1,2-DCA in the co-contaminated soil. In particular, biostimulation with fertilizer,
dual-bioaugmentation and amendment with CaCO3 were most efficient in enhancing 1,2-DCA
degradation resulting in 41.93%, 59.95% and 51.32% increases in the degradation rate constant of
1,2-DCA in the As3+ co-contaminated soil, respectively, after 20 days. Among all the treatments, dual-
bioaugmentation produced the highest 1,2-DCA degrading population of up to 453.33 × 10⁷ cfu/ml in the
Cd2+ co-contaminated soil. On comparison of the As3+ and Cd2+ co-contaminated soil undergoing either
biostimulation or dual-bioaugmentation, similarity in the denaturing gradient gel electrophoresis (DGGE)
banding patterns was observed. However, the banding patterns for the different bioremediation options
demonstrated a difference in bacterial diversity between the fertilized and dual-bioaugmented samples.
DGGE profiles also indicate that while numerous bands were common in the fertilized co-contaminated
soils, there were also changes in the presence and intensity of bands due to treatment and temporal
effects. Dehydrogenase and urease activities provided a more accurate assessment of the negative impact
of heavy metals on the indigenous soil microorganisms, resulting in up to 87.26% and 69.58% decreases
in activities, respectively. In both the biostimulated and bioaugmented soil microcosms, dehydrogenase
activity appeared biphasic with an initial decrease followed by an increase in the treated soils over time.
Results from this study provide relevant information on some alterations that could be introduced to
overcome a critical bottle-neck of the application of bioremediation technology. In conclusion, the
bioremediation strategies adopted in this study may be used as a rational methodology for remediation of
sites co-contaminated with 1,2-DCA and heavy metals, subject to a thorough understanding of the
microbial ecology and physico-chemical parameters of the site.

iv
LIST OF FIGURES
Figure 1.1: Proposed catabolic pathway of 1,2-DCA in X. autotrophicus GJ10. (A), 1,2-DCA; (B), 2-
Chloroethanol; (C), 2-Chloroacetaldehyde; (D), Monochloroacetic acid; (E), Glycolic acid (Song et al., 2004). 10
Figure 2.1: Biodegradation profiles of 1,2-DCA in (a) clay soil and (b) loam soil co-contaminated with various concentrations of heavy metals. A = autoclaved soil control + 1,2-DCA; B = unautoclaved soil control + 1,2-DCA; C = soil + 1,2-DCA + 75 mg/kg As3+; D = soil + 1,2-DCA + 150 mg/kg As3+; E = soil + 1,2-DCA + 85 mg/kg Cd2+; F = soil + 1,2-DCA + 170 mg/kg Cd2+; G = soil + 1,2-DCA + 840 mg/kg Hg2+; H = soil + 1,2-DCA + 1680 mg/kg Hg2+; I = soil + 1,2-DCA + 420 mg/kg Pb2+; J = soil + 1,2-DCA + 840 mg/kg Pb2+. Bars indicate the average of triplicate samples while the error bars show the standard deviation. 55
Figure 2.2: Inhibitory effects of (a) As3+, (b) Cd2+, (c) Hg2+ and (d) Pb2+ on pseudo-first-order 1,2-DCA
biodegradation rates in clay soil. The slopes of regression lines of the natural logarithms of 1,2-DCA concentration versus time equal the rate coefficients, k1. Treatments shown are: ( ) Unautoclaved soil control, ( ) Low concentration of HM, ( ) Moderate concentration of HM and ( X ) High concentration of HM. 59
Figure 2.3: Biodegradation profiles of 1,2-DCA in (a) clay and (b) loam soil co-contaminated with binary
combinations of heavy metals (As3+ = 112.5 mg/kg, Cd2+ = 127.5 mg/kg, Hg2+ = 1260 mg/kg, and Pb2+ = 630 mg/kg). A = autoclaved soil control + 1,2-DCA; B = unautoclaved soil control + 1,2-DCA; C = soil + 1,2-DCA + As3+ + Cd2+; D = soil + 1,2-DCA + As3+ + Hg2+; E = soil + 1,2-DCA + As3+ + Pb2+; F = soil + 1,2-DCA + Cd2+ + Hg2+; G = soil + 1,2-DCA + Cd2+ + Pb2+; H = soil + 1,2-DCA + Hg2+ + Pb2+. Bars indicate the average of triplicate samples while the error bars show the standard deviation. 61
Figure 2.4: Biodegradation profiles of 1,2-DCA in (a) clay and (b) loam soil co-contaminated with
combinations of three and four heavy metals (As3+ = 112.5 mg/kg, Cd2+ = 127.5 mg/kg, Hg2+ = 1260 mg/kg, and Pb2+ = 630 mg/kg). A = autoclaved soil control + 1,2-DCA; B = unautoclaved soil control +1,2-DCA; C = soil + 1,2-DCA + As3+ + Cd2+ + Hg2+; D = soil + 1,2-DCA + As3+ + Cd2+ + Pb2+; E = soil + 1,2-DCA + As3+ + Hg2+ + Pb2+; F = soil + 1,2-DCA + Cd2+ + Hg2+ + Pb2+; G = soil + 1,2-DCA + As3+ + Cd2+ + Hg2+ + Pb2+. Bars indicate the average of triplicate samples while the error bars show the standard deviation. 62
Figure 3.1: Effects of biostimulation and bioaugmentation on the biodegradation of 1,2-DCA in soil co-
contaminated with (a) 150 mg/kg As3+ and (b) 170 mg/kg Cd2+. A = autoclaved soil control + 1,2-DCA; B = unautoclaved soil control + 1,2-DCA; C = unautoclaved soil control + 1,2-DCA + HM; D = soil + 1,2-DCA + HM + glucose; E = soil + 1,2-DCA + HM + fructose; F = soil + 1,2-DCA + HM + fertilizer; G = soil + 1,2-DCA + HM + X. autotrophicus GJ10; H = soil + 1,2-DCA + HM + dual-bioaugmentation. Bars indicate the average of triplicate samples while the error bars show the standard deviation. 75

v
Figure 3.2: DGGE profiles of 16S rRNA gene fragments from co-contaminated loam soil samples biostimulated with fertilizer. Lanes: a1, a2, a3, a4 and a5 represent days 0, 5, 10, 15 and 20 of the As3+ co-contaminated soil and a6, a7, a8, a9 and a10 represent days 0, 5, 10, 15 and 20 of the Cd2+ co-contaminated soil. 79
Figure 3.3: DGGE profiles of 16S rRNA gene fragments from co-contaminated loam soil samples undergoing
dual-bioaugmentation. Lanes: b1 represents X. autotrophicus GJ10, b2 represents native HM resistant strain, b3, b4, b5, b6 and b7 represent days 0, 5, 10, 15 and 20 of the As3+ co-contaminated soil and b8, b9, b10, b11 and b12 represent days 0, 5, 10, 15 and 20 of the Cd2+ co-contaminated soil. 79
Figure 3.4: Effects of 1,2-DCA and (a) As3+; (b) Cd2+ on soil microbial dehydrogenase activity in microcosms
undergoing biostimulation. A = unautoclaved soil control + 1,2-DCA; B = unautoclaved soil control + 1,2-DCA + HM; C = soil + 1,2-DCA + HM + glucose; D = soil + 1,2-DCA + HM + fructose; E = soil + 1,2-DCA + HM + fertilizer. The results indicate the average of triplicate samples while the error bars show the standard deviation. 81
Figure 3.5: Effects of 1,2-DCA and (a) As3+; (b) Cd2+ on soil microbial dehydrogenase activity in microcosms
undergoing bioaugmentation. A = unautoclaved soil control + 1,2-DCA; B = unautoclaved soil control + 1,2-DCA + HM; C = soil + 1,2-DCA + HM + X. autotrophicus GJ10; D = soil + 1,2-DCA + HM + dual-bioaugmentation. The results indicate the average of triplicate samples while the error bars show the standard deviation. 82
Figure 3.6: Effects of 1,2-DCA and (a) As3+; (b) Cd2+ on soil microbial urease activity in microcosms
undergoing biostimulation. A = unautoclaved soil control + 1,2-DCA; B = unautoclaved soil control + 1,2-DCA + HM; C = soil + 1,2-DCA + HM + glucose; D = soil + 1,2-DCA + HM + fructose; E = soil + 1,2-DCA + HM + fertilizer. The results indicate the average of triplicate samples while the error bars show the standard deviation. 83
Figure 3.7: Effects of 1,2-DCA and (a) As3+; (b) Cd2+ on soil microbial urease activity in microcosms
undergoing bioaugmentation. A = unautoclaved soil control + 1,2-DCA; B = unautoclaved soil control + 1,2-DCA + HM; C = soil + 1,2-DCA + HM + X. autotrophicus GJ10; D = soil + 1,2-DCA + HM + dual-bioaugmentation. The results indicate the average of triplicate samples while the error bars show the standard deviation. 84
Figure 4.1: Degradation profiles of 1,2-DCA in soil co-contaminated with (a) 150 mg/kg As3+ and (b) 170
mg/kg Cd2+ in the presence of treatment additives. A = autoclaved soil control + 1,2-DCA; B = unautoclaved soil control + 1,2-DCA; C = unautoclaved soil control + 1,2-DCA + HM; D = soil + 1,2-DCA + HM + CaCO3; E = soil + 1,2-DCA + HM + Na2HPO4 + NaCl; F = soil + 1,2-DCA + HM + CaSO4.2H2O. Bars indicate the average of triplicate samples while the error bars show the standard deviation. 95
Figure 4.2: Effects of 1,2-DCA and (a) As3+; (b) Cd2+ on soil microbial dehydrogenase activity in microcosms
containing treatment additives. A = unautoclaved soil control + 1,2-DCA; B = unautoclaved soil control + 1,2-DCA + HM; C = soil + 1,2-DCA + HM + CaCO3; D = soil + 1,2-DCA + HM + Na2HPO4 + NaCl; E = soil + 1,2-DCA + HM + CaSO4.2H2O. The results are average of triplicate samples while the error bars show the standard deviation. 100

vi
Figure 4.3: Effects of 1,2-DCA and (a) As3+; (b) Cd2+ on soil microbial urease activity in microcosms containing treatment additives. A = unautoclaved soil control + 1,2-DCA; B = unautoclaved soil control + 1,2-DCA + HM; C = soil + 1,2-DCA + HM + CaCO3; D = soil + 1,2-DCA + HM + Na2HPO4 + NaCl; E = soil + 1,2-DCA + HM + CaSO4.2H2O. The results are average of triplicate samples while the error bars show the standard deviation. 101
vii
LIST OF TABLES
Table 1.1: Reported metal concentrations that cause inhibition of biodegradation of chlorinated
organic contaminants under aerobic conditions (Sandrin and Maier, 2003). 26
Table 1.2: Reported metal concentrations that cause inhibition of biodegradation of chlorinated organic contaminants under anaerobic conditions (Sandrin and Maier, 2003). 28
Table 2.1: Physico-chemical properties of the soil samples. 53 Table 2.2: Biodegradation rate constants (day-1) of 1,2-DCA in soil microcosms co-contaminated
with different concentrations of heavy metals. 56 Table 2.3: Effects of heavy metals on the half-lives of 1,2-DCA in the soil samples. 58 Table 2.4: Concentrations of heavy metals inhibiting 1,2-DCA biodegradation in clay soil. 60 Table 2.5: Biodegradation rate constants (day-1) of 1,2-DCA in soil microcosms co-contaminated with
different combinations of heavy metals. 63 Table 3.1: Biodegradation rate constants (day-1) of 1,2-DCA in soil co-contaminated with arsenic
(150 mg/kg) and cadmium (170 mg/kg), undergoing biostimulation and bioaugmentation. 76 Table 3.2: Total 1,2-DCA degrading bacterial population in arsenic (As3+) co-contaminated soil
undergoing biostimulation and bioaugmentation. 77 Table 3.3: Total 1,2-DCA degrading bacterial population in cadmium (Cd2+) co-contaminated soil undergoing biostimulation and bioaugmentation. 77 Table 4.1: ICP-OES instrument specifications required for generating calibration curves. 93 Table 4.2: Biodegradation rate constants (day-1) of 1,2-DCA in soil co-contaminated with arsenic
(150 mg/kg) and cadmium (170 mg/kg) in the presence of treatment additives. 96 Table 4.3: Total 1,2-DCA degrading bacterial population in heavy metal co-contaminated soil in the
presence of different treatment additives. 97 Table 4.4: Concentration of NH4NO3-extractable arsenic concentrations (mg/kg) in co-contaminated loam
soil amended with treatment additives. 98 Table 4.5: Concentration of NH4NO3-extractable cadmium concentrations (mg/kg) in co-contaminated
loam soil amended with treatment additives. 98

CHAPTER ONE INTRODUCTION AND LITERATURE REVIEW

1
1.1 Introduction
In tandem with rapid industrial and economic advancement, human activities have lead to
widespread pollution of the natural global environment (Ang et al., 2005). In recent years, concern about
the presence, disposition, and persistence of chlorinated organic pollutants in the environment (air, soil,
and water systems) has increased since most of the important classes of these chemicals have been shown
to be carcinogenic in experimental animals thus posing a potential human health risk (Cerniglia, 1984;
Cerniglia and Heitkamp, 1989). In addition, some have been shown to be toxic and carcinogenic to
humans (van den Wijngaard et al., 1993). Chlorinated organic solvents are among the most widespread
organic contaminants present in the groundwaters and subsurface soils of many contaminated sites. The
physico-chemical properties of these compounds, particularly when they are classified as dense non-
aqueous phase liquids (DNAPLs), make them difficult to remove once they have entered the subsurface
and they remain among the most complex contaminants to remediate in the environment (Yoshida et al.,
2005).
Among the short chained chlorinated aliphatic compounds, 1,2-dichloroethane (1,2-DCA)
represents one of the world‟s most important toxic chlorinated aquifer pollutant (Marzorati et al., 2007),
and it is produced industrially in larger volumes than any other halogenated compound (Laturnus, 2003).
The major use of 1,2-DCA (more than 90% of production) is as a chemical intermediate in the synthesis
of a number of chlorinated hydrocarbons, in particular; vinyl chloride which is used in making a variety
of plastic and vinyl products including polyvinyl chloride (PVC) pipes (De Wildeman and Verstrate,
2003; IARC, 1999), trichloroethylene and tetrachloroethane (DEA, 2002; Hage and Hartmans, 1999). The
widespread use of 1,2-DCA has resulted in serious environmental contamination (Hughes et al., 1994),
and has resulted in its inclusion in the E. U. and U. S. priority lists of contaminants (Marzorati et al.,
2005; USEPA, 1982). In addition, 1,2-DCA has been found in at least 570 of the 1585 National Priorities
List sites identified by the U. S. Environmental Protection Agency (USEPA). Depending on
environmental conditions, the estimated half-life of 1,2-DCA can range from months to decades due to its
relatively high water solubility, potential for migration in soil, and very long persistence in anoxic
groundwater (Barbee, 1994; Vogel et al., 1987). There is therefore, a growing interest in technologies for
its removal. Bioremediation is a possible option to destroy contaminants completely or render them
innocuous by using natural biological activity (Singh et al., 2008; Vidali, 2001). Microbial degradation
has been proposed as an efficient strategy for organic waste removal, with distinct advantages over
physico-chemical remediation methods; it uses relatively low cost, low technology techniques, and may
be carried out on site to achieve the complete degradation of organic pollutants without collateral
destruction of the site material or its indigenous flora and fauna (Timmis and Pieper, 1999). Also,
biological processes and biodegradation of organic contaminants to innocuous end products (CO2, cell

2
mass, water) minimizes the environmental impact and residual contamination (Kovalick Jr, 1992; NRC,
1994). Microorganisms have evolved several pathways for the biodegradation and/or transformation of
various toxic pollutants (Singh et al., 2008). However, the presence of heavy metals in the environment
can negatively influence the effectiveness of bioremediation strategies (Baldrian et al., 2000).
Forty percent of hazardous waste sites on the Environmental Protection Agency‟s (EPA‟s)
National Priority List (NPL) are characterized by the concomitant presence of both organic contaminants
and heavy metals, and bioremediation of these sites poses a complex problem because of the multiplicity
of contaminants (Sandrin and Maier, 2003). Co-contamination often causes a synergistic cytotoxic effect
on microorganisms, and the two components often must be treated differently (Hoffman et al., 2005;
Sandrin et al., 2000; Sandrin and Maier, 2003). Such concerns have heightened the need for novel and
advanced bioremediation techniques to effectively remove organic pollutants from a variety of co-
contaminated environmental media including water, sediments and soil (Ang et al., 2005; Duran and
Esposito, 2000). Metals most frequently found at USEPA Superfund sites are divided into two categories:
cationic metals (metallic elements in soil with positively charged cations) and anionic compounds
(elements in soil which are combined with oxygen and are negatively charged). The most common
problem-causing cationic metals are mercury, cadmium, lead, nickel, copper, zinc and chromium,
whereas the most common anionic compound is arsenic (NRCS, 2000). Common organic pollutants at
these sites include petroleum, polycyclic aromatic hydrocarbons (PAH), chlorinated solvents, herbicides
and pesticides (Amor et al., 2001; Hoffman et al., 2005). Few reports have focused on the adverse effects
of heavy metals on biodegradation in co-contaminated environments under both aerobic and anaerobic
conditions. These effects include extended acclimation periods, reduced biodegradation rates and failure
of the degradation of the target compound (Kuo and Genthner, 1996; Said and Lewis, 1991).
Complications of the effects of metal toxicity on organic pollutant biodegradation in co-contaminated soil
and water environments stem from the fact that heavy metals may be present in a variety of chemical and
physical forms, namely, ionic solutes, soluble complexed species and soil adsorbed species (Sandrin and
Maier, 2003). Further impediments arise due to the effect of environmental conditions on the physical and
chemical state of the metals. These conditions include pH, redox potential of the water phase as well as
soil properties (ion exchange capacity, clay type and organic matter content) (Sandrin and Maier, 2003).
The clean-up of soil contaminated with both 1,2-DCA and heavy metals is a contemporary
remediation issue as most of the current techniques are directed at the removal of individual contaminants
(Gregor, 2001; Hirschorn et al., 2007; Janssen et al., 2005). Previous studies have focused extensively on
the biodegradation of 1,2-DCA in several contaminated soil and water environments (van der Wijngaard
et al., 1993), and toxic effects of heavy metals on soil microorganisms have also been studied
(Rajapaksha et al., 2004). However, few reports exist on the biodegradation of 1,2-DCA in the presence

3
of heavy metals (Olaniran et al., 2009). Since heavy metals and 1,2-DCA are found together in most co-
contaminated sites, it is necessary to evaluate the biodegradation of 1,2-DCA in co-contaminated soil and
ascertain the effects of heavy metals on 1,2-DCA degradation. Also, due to the widespread use and
release of organic pollutants and heavy metals, determining the combined effect on microbial activity and
community composition is essential.

4
1.2 Chlorinated hydrocarbons
1.2.1 Classes
Chlorinated hydrocarbons are an important class of chemicals containing one or more chlorines in
their molecular structures (Ma and Wang, 2009). In particular, chlorinated aliphatic compounds are a
diverse group of synthetic industrial chemicals which play a significant role as environmental pollutants
in subsurface soils and groundwaters of many contaminated sites. These chlorinated hydrocarbons are
subdivided into chloroalkanes, chloroalkenes and chloroalkynes. Among the chloroalkanes, chloroethanes
are further divided into the lower and higher chlorinated ethanes based on the differences in
biodegradability (Sutherson, 1997). Examples of lower chlorinated ethanes include 1,1-dichloroethane
and 1,2-dichloroethane which may be utilized as primary growth substrates by aerobic microorganisms
but only cometabolized by anaerobic microorganisms (Sutherson, 1997). Higher chlorinated ethanes
include 1,1,2-trichloroethane and tetrachloromethane (Sutherson, 1997). Most prominent with regard to
industrial use, environmental persistence, toxicity and potential carcinogenicity are the chlorinated one-
carbon, two-carbon and three-carbon compounds (Leisinger, 1996).
1.2.2 Properties and uses
Chlorinated hydrocarbons comprise the strong C-Cl bond, which confers high stability to these
organic compounds. They have general physico-chemical characteristics: denser than and minimally
soluble in water and volatile with variable vapor pressure (Sutherson, 1997). Most chlorinated compounds
are classified as DNAPLs which tend to sink and accumulate on the non-permeable layer at the bottom of
confined aquifers (Sutherson, 1997). This property in particular makes them complex to remove once they
have entered the subsurface and they remain among the most difficult contaminants to remediate in the
environment. When released to surface or subsurface systems, DNAPLs migrate through unsaturated
zones until they reach groundwater tables. They then disperse throughout the saturated soils, sorbing
strongly with soil organics and minerals and dissolving in groundwater (Ferguson and Pietari, 2000),
creating long-term sources of contaminant plumes moving in the general direction of groundwater flow,
thus potentially entering drinking-water supplies and threatening human health. Owing to their stability,
several chlorinated hydrocarbons have been synthesized and used extensively for many years in
industrial, commercial and agricultural applications (Fetzner, 1998). These compounds have widespread
use in industry as solvents, degreasing agents, chemical feedstocks, and in some cases as pesticides.

5
1.2.3 Environmental and health effects
Chlorinated hydrocarbons are of major environmental concern since these contaminants are often
found in groundwater, soil and the atmosphere due to improper disposal of wastes, accidental spillage, or
deliberate release. Many of the chlorinated compounds are of public health concern since they are
considered as suspected carcinogens or mutagens and potentially toxic to humans and microorganisms
(Bouwer and McCarty, 1983). This concern is further compounded by the ability of these organochlorines
to accumulate in the tissues of living organisms, a phenomenon known as bioaccumulation (Philips,
1993). Relatively small amounts of organochlorines present in water may be preferentially transferred and
accumulated in the fats of aquatic plants and animals, with resulting concentrations being as much as 500
000 times or more than the surrounding waters. Living organisms may also accumulate chlorinated
hydrocarbons through the food chain via a process termed biomagnification. As a result, concentrations of
organochlorines may increase with trophic levels, with the highest concentrations being observed in
higher consumers including certain fish, marine mammals, birds, or humans (Phillips, 1993).
1.3 1,2-Dichloroethane
1.3.1 Properties
1,2-Dichloroethane, commonly known as ethane dichloride, is a short chained chlorinated
aliphatic compound which appears colourless and oily with a sweet taste and pleasant chloroform like
odour (IPCS, 1995). The chemical formula for 1,2-DCA is C2H4Cl2 and it has a molecular weight of 98.96
g/mol. It is a volatile liquid with a density of 1.2351 and vapour pressure of 8.5 kPa at 20 C, i.e., it
evaporates quickly (ATSDR, 1993; IPCS, 1995). As a pure phase, 1,2-DCA is a DNAPL with moderate
solubility in water (8,624 g/L at 20°C) and soluble in most organic solvents (HSDB, 2000; IARC, 1999;
IPCS, 1998).
1.3.2 Production and uses
1,2-Dichloroethane is generally considered to be largely produced from anthropogenic sources,
i.e., a synthetic manufactured chemical. However, 1,2-DCA can in low concentrations originate from
natural sources (de Rooij et al., 1998). It was reported as the first chlorinated hydrocarbon to be
synthesized (IARC, 1979), and is manufactured via the catalytic vapor-phase or liquid-phase chlorination
of ethylene, or by oxychlorination of ethylene (Archer, 1979). In commercial ethylene oxychlorination
reactors, gaseous ethylene, hydrogen chloride, and air react with catalysts at a temperature range of 473-
573K and a pressure of 0.4-0.6 MPa (Magistro and Cowfer, 1986; Mallikarjunan and Hussain, 1983;
Naworski and Velez, 1983). Currently, more than 17.5 million tons are produced annually in the United

6
States, Western Europe and Japan (Field and Sierra-Alvarez, 2004), and with a global capacity for vinyl
chloride monomer of 35 million metric tons in 2005, production continues.
1,2-Dichloroethane is used almost exclusively as a feedstock for the manufacture of vinyl
chloride (VC) monomers, primarily PVC (ATSDR, 2006; Bejankiwar et al., 2005; Davis et al., 2009).
Polyvinyl chloride is one of the most mass produced thermoplastics in chemical industries of the world
(Go et al., 2010), and hence the increased production of 1,2-DCA across the globe. Smaller amounts of
1,2-DCA are used in the production of vinylidene chloride, 1,1,1-trichloroethane, trichloroethene,
tetrachloroethene, ziridines, ethylene diamines and chlorinated solvents (ATSDR, 2001). In the past it has
been widely used as an insect fumigant for stored grains and in mushroom houses, a soil fumigant in
peach and apple orchards, metal degreasers, varnish removers and soaps (IARC, 1999). 1,2-
Dichloroethane has also been used as a lead scavenger in fuels to prevent engine lead fouling (Falta,
2004).
1.3.3 Release
The widespread use of 1,2-DCA in a variety of products and in manufacturing processes has
resulted in its frequent occurrence in sites contaminated with organic chemicals (DEA, 2002; Hage and
Hartmans, 1999). The largest fraction of all releases of 1,2-DCA into the environment is the result of
atmospheric emissions from industrial processes, manufacturing, handling, storage, and inappropriate
disposal of the compound (IARC, 1999; van den Wijngaard et al., 1993). In addition, fugitive emissions
contribute significantly. In the air, 1,2-DCA degradation proceeds mainly by reaction with hydroxyl
radicals, or by reacting with other compounds formed by sunlight. However, it can stay in the air for more
than 5 months (between 47-182 days) before being broken down. It may also be removed from air by rain
or snow. Releases to soils and surface waters are frequently detected at several tens of micromolars
(ATSDR, 1999; Gotz et al., 1998; IPCS, 1995; Yamamoto et al., 1997), which is above the natural
background level of 5 μmol in non-industrialized areas (de Rooij et al., 1998). In these environmental
settings, 1,2-DCA is expected to volatilize rapidly into the atmosphere, with subsequent photo-oxidation,
typically within four months (WHO, 1996). The presence of methane can increase the rate of aerobic
degradation of 1,2-DCA in soils, although, where volatilization is restricted, the lifetime in groundwater is
expected to be in the order of years (ATSDR, 2001; IPCS, 1998). It has been estimated that 1,2-DCA has
an environmental half-life of approximately 50 years (Vogel et al., 1987).

7
1.3.4 Human exposure
Human exposure to 1,2-DCA has usually occurred when the chemical has been improperly
disposed of, or spilled onto the ground. Humans are exposed to 1,2-DCA mainly by inhalation or by
drinking water that contains 1,2-DCA. Numerous factors determine whether an individual will be harmed
after contact with 1,2-DCA. These factors include the dose, duration, the way in which the contact
occurred, as well as the presence of other chemicals (ATSDR, 2001). Humans can also be exposed to low
levels of 1,2-DCA through the skin or air by contact with old products made with 1,2-DCA, such as
pesticides, cleaning agents, and adhesives used to glue wallpaper and carpets. Besides these
environmental exposures, occupational exposures may occur for workers involved in the manufacture or
use of chemicals containing 1,2-DCA (NPI, 2005).
1.3.5 Environmental and health effects
1,2-Dichloroethane is one of the most prevalent xenobiotic compounds present in industrial
wastewater discharges, groundwater and soil (Kocamemi and Çeçen, 2009). Because of the impact on the
environment and human health, 1,2-DCA has been placed on the USEPA Priority List of Pollutants
(USEPA, 1982) and on the United Kingdom „„Red list‟‟ of priority pollutants (Edwards, 1992). Industrial
emissions of 1,2-DCA can produce elevated, but still low-level concentrations in the atmosphere around
the source, however, it can travel for long distances. Spillages to the ground result in soil contamination
and secondary contamination of groundwater via 1,2-DCA leaching. 1,2-Dichloroethane has slight acute
(short-term) toxicity and slight chronic (long-term) toxicity to aquatic life. However, it is not expected to
concentrate in fish. 1,2-Dichloroethane has also been found to cause injury to woody trees (ATSDR,
1999).
1,2-Dichloroethane is a toxic and potentially carcinogenic compound, and so its emissions have
to be minimized by following strict environmental regulations (Baptista et al., 2006; IARC, 1999). The
maximum contaminant level (MCL) for 1,2-DCA in drinking water is 5.0 μg/L (Henderson et al., 2008).
Based on its physical properties and on case reports of deaths arising from oral or inhalation exposures,
1,2-DCA is likely to be absorbed by humans through any form of exposure (ATSDR, 2001). The analysis
of „several‟ tissues of oral poisoning victims indicated a wide distribution of 1,2-DCA throughout the
body (IARC, 1999). 1,2-Dichloroethane also appeared in the placenta, and has been detected in human
milk following occupational exposure (WHO, 2003). The lethal oral dose in humans is estimated to be in
the range of 20-50 ml (about 300-750 mg/kg bw) (IPCS, 1998). According to the ATSDR, the “minimal
risk level” (MRL) for oral exposure to 1,2-DCA for a year is 0.2 mg/kg bw per day.
In acute toxicity, the ingestion of large single doses results in pulmonary edema, heart
arrhythmias, bronchitis, depression, and changes in the brain tissue which eventually lead to death in most

8
cases (IPCS, 1995). Acute inhalation exposure of humans to 1,2-DCA can induce neurotic, nephrotoxic,
and hepatoxic effects, as well as respiratory distress (ATSDR, 1993). From case studies of poisoning
incidents, the lethal dose of 1,2-DCA is estimated to be 40-80 ml (ATSDR 1992). Other toxic symptoms
include central nervous system depression, vomiting, and diarrhoea, and the consequences associated with
kidney and liver injury (ATSDR, 2001; IPCS, 1995; 1998). In animals, clouding of the cornea and eye
irritation have also been observed and are thought to be the result of vapour contact with the eyes. Acute
animal tests, such as the lethal concentration (LC50) and lethal dose (LD50) tests in rats, mice and rabbits,
have demonstrated that 1,2-DCA has moderate acute toxicity from inhalation or dermal exposure and
moderate to high acute toxicity from oral exposure (USDHHS, 1993). In rodents and rabbits, 1,2-DCA
demonstrated a moderate acute oral toxicity with LD50 values in the range of 413-860 mg/kg bw (IPCS,
1995).
Female workers who were using 1,2-DCA as solvents in a rubber processing plant were reported
to have an increase in spontaneous abortions, premature births and pre-eclamptic toxaemia (GDCh-BUA,
1997). Also, increased rates of premature births were observed in female workers and in the wives of
male workers in a synthetic fibre factory. In inhalation studies of rats, decreased fertility and increased
embryo mortality have been observed (ATSDR, 1993). Human studies on 1,2-DCA as a cause of cancer
have been considered inadequate. In 1999, an IARC Working Group assigned 1,2-DCA a Group 2B
cancer classification (“possibly carcinogenic to humans”) (IARC, 1999). However, in men over 55 years
of age exposed to 1,2-DCA in drinking water an increased incidence of colon and rectal cancer has been
reported (ATSDR, 1993). In animals, increases in the occurrence of stomach, mammary gland, liver,
lung, and endometrium cancers have been seen following inhalation, oral, and dermal exposure (ATSDR,
2001). Administration by stomach tube to groups of 50 male and 50 female rats and mice, 5 day/week for
78 weeks produced multiple tumor (including alveolar/bronchiolar adenomas, endometrial stromal polyps
and sarcomas, hepatocellular carcinomas, and mammary adenocarcinomas) types in both species
(ATSDR, 1993; ATSDR, 2001).
1.3.6 Biodegradation of 1,2-dichloroethane
There is sufficient evidence that confirms that 1,2-DCA is susceptible to both abiotic (Gerritse,
1999; Lee et al., 1999; Nobre and Nobre, 1998; 1999; Stucki and Thuer, 1995) and biological
transformation (Barbash and Reinhard, 1989; Belay and Daniels, 1987; Egli et al., 1987; Holliger et al.,
1990a,b; Janssen et al., 1985; Jeffers et al., 1989; Stucki et al., 1987; 1983; Vandenbergh and Kunka,
1988; van den Wijngaard et al., 1992). However, microbial enzyme systems capable of its degradation
have not evolved sufficiently to make the compound widely biodegradable (van der Zaan et al., 2009).

9
1.3.6.1 Abiotic transformation of 1,2-dichloroethane
Abiotic degradation has been well documented, however, under these conditions, dissolved 1,2-
DCA is transformed slowly and the resulting products may even be more toxic than 1,2-DCA itself
(Gallegos et al., 2007). Under abiotic and alkaline hydrolysis, 1,2-DCA is transformed to vinyl chloride,
whereas reactions at neutral pH favor a hydrolytic substitution reaction, yielding ethylene glycol as a
product (Jeffers et al., 1989; Lehmicke and Mukherjee, 1999). The half-life for the reaction at pH 7 and
25°C has been reported to be > 72 years (Jeffers et al., 1989). It has been documented, however, that
abiotic reaction rates can be enhanced by the presence of certain anions frequently encountered in
aqueous environments. For example, Barbash and Reinhard (1989) reported that the half-life of 1,2-DCA
at 25ºC decreased to 37 years in the presence of 50 mM phosphate buffer, and to 6 years in reactions
containing 50 mM phosphate buffer and 0.67 mM sodium sulfide.
1.3.6.2 Aerobic biodegradation of 1,2-dichloroethane
To date, most studies on aerobic biodegradation of 1,2-DCA have employed enriched or pure
cultures (Hage and Hartmans, 1999; Hirschorn et al., 2007; Hunkeler and Aravena, 2000; Inguva and
Shreve, 1999; Janssen et al.,1985; Klečka et al., 1998; Stucki et al.,1983), rather than soils from
contaminated sites. The aerobic transformations are usually biotic and occur through oxidation. Several
members of the genera Xanthobacter, Ancylobacter and Pseudomonas that are able to utilize 1,2-DCA
have been isolated under laboratory conditions from polluted sites.
The aerobic biodegradation of 1,2-DCA has been comprehensively studied with cultures of
Xanthobacter autotrophicus GJ10, Ancylobacter aquaticus AD20, AD25, and AD27, Pseudomonas sp.
strain DCA1. These microorganisms are capable of utilizing 1,2-DCA as a sole carbon and energy source
resulting in complete mineralization of the compound, forming carbon dioxide, inorganic chloride and
water (Janssen et al., 1985; Stucki et al., 1983; Vandenbergh and Kunka, 1988; van den Wijngaard et al.,
1992). The best-studied 1,2-DCA degrading organism is X. autotrophicus GJ10, was reported to degrade
1,2-DCA via hydrolytic dehalogenation as illustrated in Figure 1.1 (Janssen et al., 1989). In this
microorganism, 1,2-DCA is initially dehalogenated by the substitution of one of the two terminal chlorine
atoms by a hydroxyl group to form 2-chloroethanol. This reaction is catalyzed by the constitutively
produced haloalkane dehalogenase (DhlA) enzyme (Janssen et al., 1994; 1989; 1985). The intermediate
2-chloroethanol is then oxidized via two sequential dehydrogenation steps to monochloroacetic acid,
catalysed by two inducible dehydrogenases, the pyrrolo-quinoline quinone-containing alcohol
dehydrogenase (Mox) and NAD-dependent aldehyde dehydrogenase (Ald) (Janssen et al., 1987; 1985).
The rate at which X. autotrophicus can degrade 1,2-DCA is limited by the rate at which the
2-chloroacetaldehyde and monochloroacetic acid is metabolized as these intermediates are more toxic

10
than 1,2-DCA and are utilized poorly (Baptista et al., 2006; Tardiff et al., 1991; Van der Ploeg et al.,
1994; 1995). Although monochloroacetic acid may be potentially highly toxic to the bacterium, it is
converted to glycolic acid by a second, constitutively produced hydrolytic dehalogenase, haloacetate
dehalogenase (DhlB) (Van der Ploeg et al., 1991). Glycolic acid is taken up in the central metabolic route
and used for the generation of energy and cell components. A similar catabolic pathway is present in the
other 1,2-DCA degraders. Interestingly, the two enzymes, namely the alcohol dehydrogenase and the
haloacetate dehalogenase, appear to be common in nature, and the haloalkane dehalogenase and aldehyde
dehydrogenase appear to be specifically adapted for the degradation of xenobiotic substrates (Klečka et
al., 1998). Based on several extensive biochemical as well as genetic analysis of the enzymes involved,
the authors speculate that evolution of organisms with the ability to grow on 1,2-DCA requires a number
of steps (Janssen et al., 1995). However, in some cases at concentrations above 5 mM 1,2-DCA, the
bacteria produce extracellular polysaccharides as a protective barrier to reduce uptake (van den Wijngaard
et al., 1993) thus limiting their use for in situ bioremediation.
Figure 1.1: Proposed catabolic pathway of 1,2-DCA in X. autotrophicus GJ10. (A), 1,2-DCA; (B), 2-
Chloroethanol; (C), 2-Chloroacetaldehyde; (D), Monochloroacetic acid; (E), Glycolic acid (Song et al., 2004). 1.3.6.3 Anaerobic biodegradation of 1,2-dichloroethane
The biotransformation of 1,2-DCA has also been reported under anaerobic conditions. The
anaerobic biotic processes are generally reductions that involve either hydrogenolysis reductive
dechlorination, the substitution of a chlorine atom from the molecule by a hydrogen atom, or
dihaloelimination, where two adjacent chlorine atoms are removed, leaving a double bond between the
respective carbon atoms (Bosma et al., 1998; McCarty and Semprini, 1994). Belay and Daniels (1987)
and Egli et al. (1987), have described the biotransformation of 1,2-DCA to ethene by pure cultures of
sulfate reducing or methanogenic bacteria. In contrast, Holliger et al. (1990b) observed that cell
suspensions of methanogenic bacteria reductively dechlorinated 1,2-DCA via two different reaction
mechanisms: a dihaloelimination reaction yielding ethene as well as two consecutive hydrogenolysis
reactions yielding chloroethane and ethane. 1,2-Dichloroethane may also be oxidized anaerobically under

11
nitrate reducing conditions, with nitrate as the electron acceptor (Gerritse et al., 1999). Abiotic
transformation of 1,2-DCA under anaerobic conditions includes hydrolytic substitution yielding ethylene
glycol (Lehmicke and Mukherjee, 1999). Furthermore, anaerobic bacteria can also reductively
dechlorinate 1,2-DCA to chloroethane which can either be further dechlorinated to ethane or abiotically
hydrolyzed to ethanol (Vogel et al., 1987).
1.3.6.4 Halorespiration of 1,2-dichloroethane
Halorespiration of 1,2-DCA was demonstrated using Dehalococcoides ethenogens strain 195 and
Dehalococcides strain BAV1. The growth of these halorespiring bacteria occurred on 1,2-DCA, which
served as a terminal electron acceptor and hydrogen as the electron donor (He et al., 2003; Maymo-Gatell
et al., 1999). Additionally, the bacterium Desulfobacterium dichloroeliminans strain DCA1was isolated
and reported to utilize 1,2-DCA as a terminal electron acceptor with formate or hydrogen as the electron
donor (De Wildeman et al., 2003). In these transformation pathways ethane was the primary product of
the conversion, and traces of vinyl chloride were also present (De Wildeman et al., 2003; Maymo-Gatell
et al., 1999).
1.4 Metal toxicity and microbial resistance mechanisms
1.4.1 Toxic effects of heavy metals
Metals play an essential role in the life processes of microorganisms. Some metals, such as
calcium, chromium, cobalt, copper, iron, magnesium, manganese, nickel, potassium, sodium and zinc,
serve as micronutrients and are used for redox-processes: to stabilize molecules through electrostatic
interactions; as cofactors in various enzymes and electron transport chains; and for regulation of osmotic
pressure (Bruins et al., 2000). Thus, metal ions may play important roles as “trace elements” in
sophisticated biochemical reactions. Many other metals (e.g. silver, aluminium, arsenic, cadmium, gold,
lead and mercury) have no biological role, are non-essential (Bruins et al., 2000), and are potentially toxic
to microorganisms. At higher concentrations these heavy metal ions form unspecific complex compounds
within the cell, which leads to toxic effects, making them too dangerous for any physiological function
(Nies, 1999). Toxic levels of metals may result in the production of free radicals that disrupt nucleic
acids, proteins, and phospholipids (Halliwell and Gutteridge, 1984; 1985). Metals may also displace metal
enzyme cofactors, disrupting the structural integrity and function of enzymes (Stadtmann, 1993; Stohs
and Bagchi, 1995). Toxicity of non-essential metals occurs through the displacement of essential metals
from their native binding sites or through ligand interactions (Bruins et al., 2000; Nies, 1999). For
example, Hg2+, Cd2+ and Ag2+ tend to bind to sulfhydryl (SH-) groups of enzymes essential for microbial

12
metabolism, and thus inhibit the activity of sensitive enzymes (Nies, 1999). To have a physiological or
toxic effect, most metal ions have to enter the microbial cell. Many divalent heavy metal cations (e.g.
Mn2+, Fe2+, Co2+, Ni2+, Cu2+ and Zn2+) are structurally very similar. Also, the structure of oxyanions such
as chromate resembles that of sulfate, and the same is true for arsenate and phosphate (Nies, 1999). In
such cases, these toxic metal cations may substitute for physiological essential cations within an enzyme
rendering the enzyme non-functional. Thus, to be able to differentiate between structurally similar metal
ions, the microbial uptake systems have to be tightly regulated.
Most microorganisms have solved this problem by using two types of uptake mechanisms for
heavy metal ions. One is quick, unspecific, constitutively expressed and driven by the chemiosmotic
gradient across the cytoplasmic membrane of bacteria (Nies, 1999). The second is inducible, has high
substrate specificity, is slower, often uses ATP hydrolysis as the energy source, and is only produced by
the cell in times of need, starvation or a special metabolic situation (Nies and Silver, 1995). Even though
the constitutively expressed unspecific system is more energy efficient, it results in an influx of a wider
variety of heavy metals. When these metals are present in high concentrations, they are more likely to
have toxic effects once inside the cell (Nies and Silver, 1995). High levels of both essential and non-
essential metals can damage cell membranes; alter enzyme specificity; disrupt cellular functions; and
damage the structure of DNA (Bruins et al., 2000). In addition, concentrations of elevated levels of heavy
metals impose oxidative stress on microorganisms (Kachur et al., 1998).
1.4.2 Mechanisms of microbial resistance to metals
To survive under metal-stressed conditions, some microorganisms have been forced to develop
metal-ion homeostasis factors and metal-resistance determinants to tolerate the uptake of virtually all
toxic metals via selective pressures from the metal containing environment (Hoostal et al., 2008; Bruins
et al., 2000; Nies, 1999; Nies and Silver, 1995; Rouch et al., 1995). Bacteria have adapted to metals
through a variety of chromosomal, transposon, and plasmid-mediated resistance systems which are
capable of being spread throughout a bacterial community by lateral gene transfer through conjugation
and transduction (Coombs and Barkay, 2004; Martínez et al., 2006). The primary difference between
chromosomal and plasmid based metal resistance systems is that chromosome based systems are more
complex and are usually required for essential metal resistance. On the other hand, plasmid-encoded
systems are usually toxic ion efflux mechanisms (Bruins et al., 2000). This suggests that ion efflux
mechanisms are more likely to be plasmid-borne because they can be quickly mobilized to other
organisms, and they reduce the gene carrying load since they are only needed on certain occurrences
(Silver and Walderhaug, 1992). The extent of resistance in a microorganism is determined by several
factors: the role each metal plays in normal metabolism; the type and number of mechanisms for metal

13
uptake; and the presence of genes located on plasmids, chromosomes, or transposons that control metal
resistance (Bruins et al., 2000). The main mechanism by which microorganisms affect changes in the
speciation and mobility of metals is well described by van Hullebusch et al. (2005).
Six possible metal resistance mechanisms exist: exclusion by permeability barrier; intra- and
extra-cellular sequestration; active transport efflux pumps; enzymatic detoxification; and reduction in the
sensitivity of cellular targets to metal ions (Bruins et al., 2000; Carine et al., 2009; Ji and Silver, 1995;
Nies, 1999; Nies and Silver, 1995; Rensing et al., 1999). One or a combination of these resistance
mechanisms allows microorganisms to function in metal co-contaminated environments.
1.4.2.1 Arsenic
Arsenic, which is a heavy metalloid with metallic and non-metallic properties, is toxic to bacteria,
as well as other domains of life (Bruins et al., 2000; Nies, 1999). Arsenic commonly occurs as As(V) in
AsO43-, arsenate, and as As(III) in AsO2
-, arsenite (Nies, 1999). Arsenate is an analogue of phosphate,
thus, its main toxicity results from its interference with the metabolism of the major bio-element
phosphorus via phosphate transporters (Nies, 1999; Nies and Silver, 1995). Arsenate usually enters the
cell in periods of phosphate abundance through the Pit system, which is a constitutively expressed,
nonspecific, nutrient transport system (Bruins et al., 2000). In times of phosphate depletion, a more
specific Pst system is induced. This system is 100 times more specific for phosphate than arsenate. The
microorganism has the capacity to increase As(V) tolerance by inactivating the Pit system in favor of Pst
(Nies and Silver, 1995). Several mechanisms for resistance to arsenic have been identified. The best
studied example is the plasmid mediated efflux mechanism of the arsenical resistance of E. coli (Chen et
al., 1986). Expression of the As(V) efflux pump is coded for by a family of genes called the ars operon
(Tsutomu and Kobayashi, 1998). The number of genes in this operon can vary from three to five (arsR,
arsA, arsD, arsB, and arsC) (Rouch et al., 1995). Operons in Staphylococcus plasmids and the
chromosome of E. coli do not contain the arsD and arsR genes. The gene products of arsR and arsD
regulate the operon. Therefore, loss of arsD does not seem to affect resistance to arsenicals (Rouch et al.,
1995; Tsutomu and Kobayashi, 1998). The nucleotide sequence of a fragment of DNA containing the ars
operon was studied (Chen et al., 1986), and three genes, arsA, arsB and arsC, were found to encode for
the proteins ArsA, ArsB and ArsC, respectively. ArsA is a protein with ATPase activity and thus is
involved in translocation of the metal ions across the cell membrane. ArsB interacts with ArsA to form an
ArsA2B complex on the inner membrane of the cell, and the two proteins form the arsenite pump which is
driven chemiosmotically and by ATP (Dey and Rosen, 1995). Since anion export from bacterial cells is
always driven by the chemiosmotic gradient, simple arsenic efflux systems may be composed of just one
efflux protein, the ArsB product (Wu et al., 1992). Typical examples are the plasmid-encoded system

14
from S. xylosus (Rosenstein et al., 1992) and the chromosomally encoded system in E. coli (Diorio et al.,
1995). Detoxification of arsenate is the initial step required to differentiate it between phosphates. This
step involves the reduction of arsenate to arsenite (Ji et al., 1994; Ji and Silver, 1992). For the resistance
determinant in E. coli, arsenate reduction by the ArsC protein is coupled to glutathione (Oden et al.,
1994) via glutaredoxin (Gladysheva et al., 1994; Liu and Rosen, 1997). For ArsC from S. aureus, the
electron donor is thioredoxin and NADPH (Ji et al., 1994). Thus, ArsC is only required for tolerance to
arsenate, and ArsA and ArsB are required for tolerance to both species of arsenic.
1.4.2.2 Cadmium
Cadmium is a non-essential heavy metal that is toxic at low concentration (Bruins et al., 2000).
Numerous studies have demonstrated the toxicity of cadmium to microorganisms, however, specific
mechanisms have yet to be defined (Dopson et al., 2003). The toxic effects of cadmium generally include
thiol-binding and protein denaturation, interaction with calcium and zinc metabolism, loss of a protective
function (Bruins et al., 2000; Nies, 1999) and single-strand breakage of DNA in E. coli (Trevors et al.,
1986). Sensitive bacteria have been reported to accumulate 3 to 15 times more Cd2+ than resistant bacteria
(Laddaga et al., 1985; Trevors et al., 1986). Several bacteria such as Staphylococcus aureus, Bacillus
subtillis, and Escherichia coli demonstrate resistance to Cd2+ (Cohen et al., 1991; Laddaga and Silver,
1985; Smith and Novick, 1972). Cadmium resistance occurs through all of the biochemical resistance
mechanisms with the exception of enzymatic detoxification (Bruins et al., 2000). Resistance to Cd2+ in
bacteria is based mainly on cadmium efflux pumps (Nies, 1999), a system widely distributed in a number
of microorganisms. For example, the Czc system is driven by a resistance, nodulation, cell division
(RND-driven) system and a P-type ATPase pump (CadA) in Gram-negative and Gram-positive bacteria,
respectively (Dopson et al., 2003; Nies, 1999). Bacteria that naturally form an extracellular
polysaccharide coating also demonstrate the ability to bioabsorb metal ions and prevent them from
interacting with fundamental cellular components (Scott and Palmer, 1990; Scott et al., 1988). A
protective layer of exopolysaccharide improved the survival of K. aerogenes strains in Cd2+ solutions
(Scott and Palmer, 1990). The extracellular capsule of K. aerogenes prevented the entry of up to 1 nM of
Cd2+ when compared to non-encapsulated forms (Mergeay, 1991). P. putida can bind 100% of Cd2+ added
to broth at a concentration of 2.5 mg/L (Scott et al., 1988). Strains of A. viscous can accumulate 30 mg/g
of Cd2+ when added to broth at 100 mg/L (Scott and Palmer, 1988). In both cases, binding was pH
dependent and the optimum was between pH 4 and 9 (Scott et al., 1988). This protective layer appears to
prevent uptake, keeping metal ions away from sensitive cellular components. Metal resistance based on
extracellular sequestration has been demonstrated in S. cerevisiae whereby cadmium is bound by
glutathione, and the resulting cadmium-bisglutathionato complex is transported via an ABC transporter

15
into the vacuole (Li et al., 1997; 1996). Other organisms, such as yeast or Citrobacter sp., form insoluble
complexes of cadmium phosphate to confer resistance (McEntee et al., 1986). A strain of K. aerogenes
has been shown to exhibit the ability to remove Cd2+ ions from the surrounding environment by excreting
sulfur to limit metal influx by external precipitation (Scott and Palmer, 1990). In some species of S.
aureus, penicillinase plasmids can mediate resistance by changing cell membrane permeability to Cd2+ as
well as to other metals (Bruins et al., 2000). This is usually low-level resistance in the range 0.01 to 0.1
nM of Cd2+ (McEntee et al., 1986). Furthermore, cyanobacteria contain metallothioneins (Olafson et al.,
1979). The metal resistance system in Synechococcus sp. consists of two genes: smtA and smtB.
Amplification of the smt metallothionein locus increases cadmium resistance (Gupta et al., 1992), and
deletion of it decreases resistance (Gupta et al., 1993; Turner et al., 1993; 1995). The SmtB protein acts
as a transacting transcriptional repressor turning off smtA expression and metallothionein production
(Huckle et al., 1993; Morby et al., 1993; Turner et al., 1996). Since cyanobacteria contain a diversity of
RNA- and P-type transport systems, transport may also be important for cadmium resistance in these
bacteria (Nies, 1999).
1.4.2.3 Mercury
Mercury is considered the heavy metal with the strongest toxicity (Nies, 1999). Due to the strong
affinity of Hg2+ to thiol groups, mercury is most commonly found in cinnabar (HgS). The solubility
product of HgS is 6.38 × 10-53, indicating it is a highly insoluble compound (Dopson et al., 2003; Nies,
1999). Resistance to mercury is based, however, on its unique peculiarities: metallic mercury has an
extraordinarily low melting/boiling point for a metal (melting point -39°C, boiling point 357°C) and the
electrochemical potential of Hg2+/Hg0 at pH 7 is +430 mV (Weast, 1984). Mercury resistance is based
primarily on enzymatic detoxification of the metal to a less toxic form, and this system is regarded as a
model example of resistance via detoxification in microorganisms (Bruins et al., 2000). Resistance to
mercury has been demonstrated in both Gram-positive (S. aureus, Bacillus sp.) and Gram-negative
bacteria (Escherichia coli, Pseudomonas aeruginosa, Serratia marcescens, and Acidithiobacillus
ferrooxidans) (Misra, 1992). A mercury resistance system involves the reduction of Hg2+ via a Hg2+-
reducing flavoprotein producing Hg0 which volatilizes out of the cell by passive diffusion (Silver, 1996;
Silver and Phung, 1996). Some bacteria contain a set of five to six genes that form an Hg2+ (mer)
resistance operon, which has been studied extensively in the plasmids of several microorganisms (Misra,
1992). This operon not only detoxifies Hg2+ but also transports and self-regulates resistance (Ji and Silver,
1995; Misra, 1992; O'Halloran, 1993). The mer transport genes consist of merC, merT and merP; which
code for proteins that manage Hg2+ transport within the bacteria. MerP is a periplasmic protein whereas
MerT and MerC gene products are cytoplasmic membrane proteins. It has been demonstrated that both

16
merT and merP are required for full Hg2+ resistance (Hamlett et al., 1992). In Gram-negative bacteria, the
first step in detoxification is the binding of Hg2+ to the MerP (Qian et al., 1998). Thereafter, MerP
possibly delivers the toxic cation to the mercury transporter MerT for transport into the cytoplasm
(Hobman and Brown 1996). Once inside the cell, Hg2+ is reduced with NADPH to Hg0 by the MerA
protein (Schiering et al., 1991). In addition to MerTP, another uptake route which involves the MerC
protein exists (Hamlett et al., 1992; Sahlman et al., 1997). Although it has been linked to transport of
Hg2+, the function of MerC remains unclear (Hamlett et al., 1992). Furthermore, mercury-resistant
organisms can be divided into two categories: narrow spectrum and broad spectrum. Narrow spectrum
organisms lack the gene which encodes for MerB organomercurial lyase and, therefore, are not resistant
to most organomercurials. Broad-spectrum organisms have both enzymes and are resistant to most
mercury-containing compounds (Bruins et al., 2000). However, it has been postulated that the high
toxicity of organomercurials and other methylated and alkylated heavy metal compounds makes it very
unlikely that these kinds of chemical modification of heavy metals are metal-resistance mechanisms
(Nies, 1999).
1.4.2.4 Lead
In the natural world, lead is a ubiquitous but biologically non-essential element (Ewers and
Schlipköter, 1991). Contamination of the environment with lead has increased as it has become an
essential material for many industries. Due to its low solubility (especially in the form of lead phosphate),
its biologically available concentration is low (Nies, 1999). Furthermore, Heinrichs and Mayer (1980)
considered lead as one of the least soluble metals with a very long retention time. The toxicity of lead is a
consequence of the ability of Pb2+ to interfere with several enzymes (Ewers and Schlipköter, 1991).
Isolation of lead-tolerant bacteria has been reported (Trajanovska et al., 1997), and precipitation of lead
bound phosphate within bacterial cells has also been observed (Levinson and Mahler 1998; Levinson et
al., 1996). Resistance to lead has also been postulated to be based predominantly on metal efflux (Nies,
1999), since in Ralstonia sp. CH34 it has been shown that resistance to lead is mediated by a P-type
ATPase (Borremans and van der Lelie, unpublished observation). In addition, the CadA P-type ATPase is
also able to transport Pb2+ (Rensing et al., 1998).
1.5 Metal speciation and bioavailability
Heavy metals may inhibit organic pollutant biodegradation through the interaction with enzymes
involved in general metabolism or those directly involved in biodegradation (Sandrin and Maier, 2003).
The ionic form of the metal mediates inhibition of enzymes involved in pollutant degradation in heavy
metal contaminated environments (Angle and Chanley, 1989), indicating that metal toxicity is related to

17
the concentration of bioavailable metal rather than the total or even total soluble metal concentration.
Metals have been reported to inhibit organic pollutant biodegradation and affect degradation rates;
however, widely varying degrees and patterns of inhibition have been reported, due to the lack of
consistent methods to characterize metal toxicity (Hoffman et al., 2005). Most commonly, reports on
metal inhibition of biodegradation have been related to the total concentration of a metal in the test
system. However, this may not be the most appropriate measure as it has been well established that some
metal species are more bioavailable than others (Hughes and Poole, 1991; Knotek-Smith et al., 2003;
Roane et al., 2001; Traina and Laperche, 1999).
Speciation can broadly be defined as the identification and quantification of the different, defined
species, forms or phases in which an element occurs (Tack and Verloo, 1995), while bioavailability is the
fraction of the total amount of a metal in a specific environmental compartment that, within a given time
span, is either available or can be made available for uptake by microorganisms from the direct
surrounding of the organism. Metal speciation and the resulting bioavailability rather than total metal
concentration determine the overall physiological and toxic effects of a metal on biological systems
(Hughes and Poole, 1991; Morrison et al., 1989; Traina and Laperche, 1999). Unfortunately, few studies
investigating the impact of metals on biodegradation have provided metal speciation and bioavailability
data (Sandrin and Maier, 2003). Traditionally, the environmental risk caused by heavy metal pollution is
determined by quantification of total metal concentration using conventional analytical methods
(Rodriguez-Mozaz et al., 2004). However, conventional analytical procedures are not able to distinguish
between available (potentially hazardous) and non-available (potentially non-hazardous) fractions of
metals to biological systems (Rasmussen et al., 2000). This is of particular interest with respect to solid
environments, e.g. soils, because of the great adsorption capability of heavy metals to solid phase
(Vanhala and Ahtiainen, 1994). In the water phase, the chemical form of a metal determines the
biological availability and chemical reactivity (sorption/desorption, precipitation/dissolution) to other
components of a system. Often overlooked in metal toxicity studies is the importance of the pH of buffer
used in microbiological media and the time at which a metal is added to a given medium (Lage et al.,
1996; Vasconcelos et al., 1998). Also, the level of inhibition depends on the concentration and
availability of the heavy metals which in turn are dependent on complex processes controlled by multiple
factors including the nature of the metals and microbial species (Amor et al., 2001; Goblenz et al., 1994;
Hashemi et al., 1994; Olasupo et al., 1993; Tomioka et al., 1994). Some of the factors affecting metal
speciation and bioavailability will be discussed below.

18
1.5.1 Binding components and physico-chemical characteristics in medium and soil
Many pH buffers are often present at higher concentrations than other medium components used
in test systems (Hughes and Poole, 1991; Teresa et al., 2000; Vasconcelos and Leal, 2002), and are able
to complex and precipitate metals, thus affecting metal speciation and bioavailability. For example,
phosphate, probably the most common buffer used in the majority of studies (Amor et al., 2001; Benka-
Coker and Ekundayo, 1998; Birch and Brandl, 1996; Nakamura and Sawada, 2000), is well known for its
ability to precipitate many metals and reduce their bioavailability (Hughes and Poole, 1991). Phosphate
readily sequesters metals and reduces their bioavailability via the formation of insoluble metal phosphate
species, even at neutral to mildly acidic pH values (Sandrin and Hoffman, 2007). In a predictive model of
the concentrations of free ionic metals as a function of phosphate concentration in the Bushnell Haas
medium (Difco™, Sparks, MD), commonly used in biodegradation studies, 44% less free ionic cadmium
existed in the medium containing a relatively low phosphate concentration of 2.27 mM compared to the
same medium not containing phosphate. Some metals are more sensitive to phosphate precipitation than
others. Cobalt bioavailability was predicted to remain high (95%) in the free, ionic form as the phosphate
concentration was raised to 15 mM; while free, ionic nickel was predicted to fall to 21% of its
concentration in the medium free of phosphate (Sandrin and Hoffman, 2007).
The metal-complexing capabilities of some zwitterionic buffers incorporated into microbiological
media [e.g., HEPES (4-2-hydroxyethyl-1-piperazine-ethanesulfonic acid), MES (2-4-morpholino-
ethanesulfonic acid), MOPS (3-N-morpholino-propansulfonic acid), PIPES (1,4-piperazine-bis-
ethanesulfonic acid)] have been reported (Hoffman et al., 2005). However, metals tend to remain more
bioavailable in the presence of zwitterionic buffers than in the presence of phosphate buffers, due to the
fact that former buffers do not interact with metals as strongly as phosphate buffers. Mash et al. (2003)
indicated that MES and MOPS (50 mM) did not complex copper, while HEPES (35 mM) strongly
complexed copper at pH 7.2. PIPES buffer has been reported to complex lead but not cadmium or copper
(Soares and Conde, 2000; Vasconcelos et al., 1998).
Although available data suggests that Tris-base (2-amino-2-hydroxymethyl-1,3-propanediol)
complexes many metals, limited quantitative complexation data has been gathered (Twiss et al., 2001).
Hoffman et al. (2005) reported that the degrees of inhibition of cadmium on naphthalene (NAPH)
biodegradation by Comamonas testosteroni were different in each of three chemically-defined minimal
salts medium (MSM) tested. Biodegradation was completely inhibited by 100 M total cadmium in
PIPES-buffered MSM and by 500 M total cadmium in Tris- and PIPES-buffered MSM. However,
neither of the cadmium concentrations completely inhibited biodegradation in Bushnell-Haas medium.
The physico-chemical properties of soil can widely influence metal speciation and consequently,
its mobility, bioavailability and toxicity (Irha et al., 2003; McLean and Bledsoe, 1992). Metals may be

19
distributed among many components of soil solids and may be associated with them in different ways
(ion exchange, adsorption, precipitation, complexation or present in the structure of minerals). Irha et al.
(2003) modified the dehydrogenase enzyme activity (DHA) assay using resazurin (oxidoreduction dye)
for toxicity analysis of combined mixture of heavy metals and polycyclic aromatic hydrocarbons in soil.
The method was modified to take into account possible interaction of resazurin with complex soil matrix
(adsorption on the soil components, influence of inorganic substances and humic acids). Results showed
that the sensitivity of soils to contamination correlated reasonably well with organic matter, calcium and
amorphous phase content. These tallied with the investigations of other researchers (Alexander and
Alexander, 2000; Bååth, 1989; Eriksson, 1988; Sauve et al., 2000). In soil with relatively low organic
matter content and significant quantity of amorphous phase, high sensitivity to contamination by heavy
metals and persistence of organic pollutants were observed. Organic matter content has a strong influence
on cation exchange capacity, buffer capacity as well as on the retention of heavy metals. Thus, metals
present in organic soils contaminated with a combination of heavy metals are less mobile and less
bioavailable than metals present in mineral soils (Balasoiu et al., 2001). Time and moisture effects are
also important factors that need to be considered when interpreting short-term toxicity studies and when
making predictions concerning possible long-term effects of heavy metals in the soil environment, as the
retention of copper in dry soil has been observed to be much less pronounced in soils with higher
moisture content (Tom-Petersen et al., 2004).
1.5.2 pH and redox potential
At high pH, metals tend to form insoluble metal mineral phosphates and carbonates, whereas at
low pH they tend to be found as free ionic species or as soluble organo-metals and are more readily
bioavailable (Naidu et al., 1997; Rensing and Maier, 2003; Sandrin and Hoffman, 2007; Twiss et al.,
2001). At acidic pH, more protons (H+) are available to saturate metal-binding sites; therefore metals are
less likely to form insoluble precipitates with phosphates when the pH of the system is lowered because
much of the phosphate has been protonated (Hughes and Poole, 1991). Under basic conditions, metal ions
can replace protons to form other species such as hydroxo-metal complexes (Babich and Stotzky, 1985;
Collins and Stotzky, 1992; Ivanov et al., 1997). In some cases the hydroxo-metal complexes, such as
those formed with cadmium, nickel, and zinc, are soluble; while those formed with chromium and iron
are insoluble. A small change in pH can decrease metal solubility and bioavailability by several orders of
magnitude, e.g., the solubility of cadmium was reduced 8.8-fold by an increase in pH from 6 to 7 in 1.3
mM phosphate (Rensing and Maier, 2003). The dependence of metal bioavailability on pH varies between
different metals. For example, a rapid decline in the concentrations of the free, ionic species of copper

20
and zinc in minimal media was observed at pH values higher than 5, while the free, ionic form of cobalt
remained prevalent until the pH value was higher than 8 (Sandrin and Hoffman, 2007).
Many studies have shown that pH mediates metal toxicity (Babich et al., 1985; Franklin et al.,
2000; Korkeala and Pekkanen, 1978). Babich and Stotzky (1982; 1983) found that increasing pH reduces
the toxicity of nickel to a variety of different organisms, including bacteria (Serratia marcescens),
filamentous fungi (Arthrobotrys conoides, Penicillium vermiculatum, Rhizopus stolonifer), and yeast
(Cryptococcus terreus). Under mildly basic conditions (pH 8.5), much of the nickel may not be
bioavailable because it forms complexes with various ligands. More commonly, increasing pH has been
shown to increase the toxicity of zinc, copper, and uranium to certain algal species (Franklin et al., 2000;
Hargreaves and Whitton, 1976) and of cadmium to various bacteria (Bacillus subtilis, Escherichia coli,
Micrococcus luteus, Streptococcus bovis), actinomycetes (Micromonospora chalcea, Nocardia corallina,
Streptomyces flavovirens), and fungi (Saccharomyces cerevisiae, Schizosaccharomyces octosporus)
(Korkeala and Pekkanen, 1978). This may be due to cells being able to take up or adsorb more of the
metal ions under high pH conditions (Rudd et al., 1983; Sandrin and Maier, 2002). Also, various
functional groups associated with the membrane of microorganisms would be protonated under acidic
conditions, reducing the electrostatic attraction between the metal cations and the membrane. A third
possibility is that metals are removed from the cell more efficiently under acidic conditions by efflux
pumps that are driven by the proton motive force (Sandrin and Maier, 2002). Studies examining the effect
of metal toxicity on biodegradation usually use a buffer that has a neutral to mildly acidic pH range
(Amor et al., 2001; Sandrin and Maier, 2003; Said and Lewis, 1991). The operational pH range is
determined by the pKa of the buffer, which is the pH at which half of the weak acid used for buffering is
protonated. When the pH is beyond the operational range of a buffer, even small additions of acid, such as
the excretion of acidic metabolic end products by microbes, may drastically change the pH and can result
in unanticipated metal speciation events (Hughes and Poole, 1991; Twiss et al., 2001).
The redox potential (Eh) of an environment also influences metal speciation. Redox potential is
established by oxidation-reduction reactions that tend to be relatively slow, particularly in soil
environments (Rensing and Maier, 2003). However, microbial activity can dramatically influence the rate
and establishment of redox potential in soil. Reducing conditions (negative Eh) found in anaerobic media
can result in metal precipitation with media components. Kong (1998) reported that the soluble metal
concentration in sediment slurries initially amended with 20 mg/L cadmium, copper, or chromium were
below detection limits of 0.03-0.04 mg/L. Furthermore, at 100 mg/L added metal, only 1 mg/L cadmium
and < 0.12 mg/L copper and chromium were found in the aqueous phase. Under positive Eh (oxidizing)
conditions, metals are more likely to exist in their free ionic form and exhibit increased water solubility.

21
Moreover, pH may decrease slightly or even dramatically under oxidizing conditions (Rensing and Maier,
2003).
1.6 Measurement of bioavailable metal
Measurement of bioavailable metal concentrations is a vital step towards determining the effects
of metals on organic pollutant biodegradation, since the environmental risk caused by heavy metal
pollution is traditionally determined by quantification of total metals (Liao et al., 2006; Sandrin and
Hoffman, 2007). The development of sensitive, effective, and inexpensive methods that can efficiently
monitor and determine the presence and amount of hazardous heavy metals is still in its infancy. Common
analytical techniques used are ion chromatography, ion-selective electrodes and polarography (Durrieu
and Tran-Minh, 2002). However, these methods are not able to distinguish between available and non-
available fractions of metals to biological systems (Rasmussen et al., 2000). According to the standards,
measurements and testing programme of the European Commission, the most suitable approach for
certification of a soil sample to characterize the bioavailable fraction of metals was a single step
procedure using EDTA and acetic acid. Conventionally, single step extraction procedures are mainly
applied to soil samples to identify the bioavailable fraction, using a number of different reagents able to
extract all or part of the metals from soil (Žemberyová et al., 2007). Conventional methods are reaching
the highest accuracy with low detection limits (Rodriguez-Mozaz et al., 2004), but are expensive, time
consuming, and require highly trained personnel. However, the main drawback of chemical methods is
the question of the transfer of the results obtained on non-biological systems to biological ones (Liao et
al., 2006). The current tendency to carry out field monitoring has driven the development of bioassays,
biomarkers, and biosensors as new analytical tools able to provide fast, reliable, and sensitive
measurements with lower cost, many of them aimed at on-site analysis. These tools have also gained
much attention since they integrate all aspects of bioavailability, including exposure, accumulation, and
toxic effects at the receptor level (Peijnenburg and Jager, 2003). Risk assessments of metal contaminated
soils obviously require a comprehensible protocol for testing metal bioavailability and mobility. Such a
test should ideally be applicable with minimum perturbation of the soil, without disrupting the
equilibrium between solid and solution phases and that is sensitive to prevailing conditions (Editorial,
2003).

22
1.6.1 Bacterial biosensors
Recombinant bacterial sensors have been constructed and used for the determination of the
bioavailability of specific metals. Ivask et al. (2002) used recombinant luminescent bacterial sensors for
the determination of the bioavailable fraction of cadmium, zinc, mercury, and chromium in soil. In their
study, two bacterial recombinant heavy metal sensors were constructed based on two different receptor-
reporter systems: one was inducible by Zn2+, Cd2+, and Hg2+, and the other by Cr6+ and Cr3+. The bacterial
sensors used were not perfectly specific to one heavy metal, but responded to some “non-target” metals as
well (Ivask et al., 2002). In another example, the mer-lux gene fusion in E. coli was used to estimate
bioavailable mercury in soil. The mer-promoter was activated when Hg2+, present in the cytoplasm of the
biosensor bacterium, binds to MerR, resulting in transcription of the lux genes and subsequent light
emission (Rasmussen et al., 2000). The luminescence-based bacterial sensor strains, Pseudomonas
fluorescens OS8 (pTPT11) and Pseudomonas fluorescens OS8 have also been used for mercury and
arsenite detection, respectively, in soil extracts (Petanen and Romantschuk, 2002). Other biosensors have
been designed, based on bioengineered proteins. In these cases, the biosensor monitors conformational
changes caused by the binding of the metal ion to the engineered protein (Ziegler and Göpel, 1998).
Bontidean et al. (2003) used mercuric ion-binding regulatory proteins as the biological component of the
biosensor, MerR. The conformational change resulting from the binding of the metal ion to the protein
caused a change in the capacitance, which was proportional to the concentration of the metal ions
determined.
1.6.2 Immunoassays and bioreporters
Numerous promising tools are being developed that use biological systems to quantify solution
phase and bioavailable metal concentrations. One of the most attractive features of these tools is that they
can be used in complex systems such as microbiological media and soil. Immunoassays, which can detect
solution phase metal concentrations in the low µg/L range, have been developed for cadmium, lead,
cobalt, nickel, and zinc. An immunoassay for mercury is commercially available (Blake et al., 1998;
Khosraviani et al., 1998). Bioavailable metal fractions have also been measured using whole cell
bioreporters that produce a protein with measurable activity (e.g., LacZ) or light in response to
bioavailable metal. Bioreporters for detection of mercury have been produced using both the lacZ system
(Rouch et al., 1995) and the luminescent lux system (Corbisier et al., 1999; Selifonova et al., 1993).
However, it should be emphasized that measurement of bioavailable metal can vary, as it is dependant on
the metal resistance mechanisms of the bioreporter system used. A review of applications, advantages and
limitations of immunoassays and bioreporters for metal detection is available (Neilson and Maier, 2001).

23
1.6.3 Geochemical modeling software
In addition to biological-based approaches, geochemical modeling software, such as MINEQL+
(Environmental Research Software, Hallowell, ME) or MINTEQA2, has been employed to predict metal
speciation patterns as a function of ionic strength and pH (Pardue et al., 1996). These programs take into
account equilibrium constants for each ion in solution and accurately calculate the concentration of any
metal species under specified conditions. The accuracy of programs such as MINEQL+ has been verified
experimentally. For example, Sandrin and Maier (2002) used a cadmium ion-selective electrode to
determine the concentration of divalent cadmium ion in a minimal salts medium over the pH range from 4
to 7. The experimental concentrations were comparable to those predicted by the modeling software.
These programs do not take into account all organic ligands present in complex media, so they are more
comparable to experimental situations in minimal media (Sandrin and Maier, 2002). In complex media, it
is difficult to calculate the concentrations of all components because the composition of complex
ingredients (e.g., yeast extract, beef extract) differs slightly in every batch (Sandrin and Maier, 2002). At
least three computational models have been developed to predict the impact of metals on organic
biodegradation (Amor et al., 2001; Jin and Bhattacharya, 1996; Nakamura and Sawada, 2000). None of
these models incorporates metal speciation and bioavailability. Thus, data generated by these models may
only be meaningful for the medium or soil that was used to develop the model (Sandrin and Hoffman,
2007).
1.6.4 Diffusive gradients in thin-films
Recently, a diffusion-based in situ technique known as diffusive gradients in thin-films (DGT)
has been proposed for the measurement of labile metal species in soils (Hooda et al., 1999). DGT has
been developed on the premise that metal speciation in conventional methods of testing soil solutions may
change during sampling and extraction. The potential of DGT use in assessing metal bioavailability was
further demonstrated when Cu uptake by plants grown on a large number of soils was linearly correlated
to DGT measurements, while soil solution concentrations predicted a non-linear relationship (Zhang et
al., 2001).
1.7 Influence of heavy metals on microbiological processes involved in the biodegradation of
chlorinated organic compounds
The influence of heavy metals on microbial processes, of individual strains and communities,
such as respiration (Codina et al., 2000; Fliessbach et al., 1994; Hattori, 1992; Insam et al., 1996; Khan
and Scullion, 1999; Witter et al., 2000), luminescence (Campbell et al., 2000; Chaudri et al., 2000;
Lappalainen et al., 2000; Paton et al., 1995; Sousa et al., 1998; Villaescusa et al., 2000), and N2

24
transformations (Heckman et al., 1986; Ibekwe et al., 1995; McGrath et al., 1988; Obbard and Jones,
1993) has been extensively reviewed. The impact of heavy metals on microorganisms has also been
reviewed (Bååth, 1989; Giller et al., 1998; Tyler, 1981; Weiner et al., 1999; Wright and Mason, 2000).
However, there is a marked dearth of information on the impacts of heavy metals on the biodegradation of
chlorinated organic pollutants. Thus, additional studies that incorporate a variety of benchmark
chlorinated organic chemicals and various manipulations of environmental factors that affect metal
speciation and bioavailability are necessary.
A few research efforts that aimed at addressing the issue of co-contamination under aerobic
conditions are listed in Table 1.1. below. Van Zwieten et al. (2003) reported that the natural breakdown of
1,1,1-trichloro-2,2-bis (4-chlorophenyl) ethane (DDT), a persistent organochlorine pesticide, was
inhibited in an arsenic co-contaminated soil resulting in an increased persistence of DDT in the soil
environment studied. The intrinsic breakdown of DDT to 1,1-dichloro-2,2-bis (4-chlorophenyl) ethane
(DDD) in the presence of 2000 mg/kg arsenic resulted in a 50% reduction in the concentration of DDD
compared to background arsenic of 5 mg/kg. Thus, it was demonstrated that arsenic co-contamination has
an inhibitory effect on the breakdown of DDT via DDD, and that, as arsenic concentrations increased, the
DDT:DDD and DDT:1,1-dichloro-2,2-bis (4-chlorophenyl) ethylene (DDE) ratios also increased (Van
Zwieten et al., 2003). The biodegradation of 2,4-dichloro-phenoxyacetic acid methyl ester (2,4-DME) in
two microbial samples, namely, sediment and aufwuchs (floating mats of filamentous algae), from
lakewater was inhibited in the presence of Cu, Hg, Zn, Cd and Cr (Said and Lewis, 1991). Minimal
inhibitory concentrations (MIC) varied according to the metals and the type of microbial sample tested
and did not necessarily follow the toxicity patterns observed for the metal concentrations required for
significant effects on maximum degradation rates (Vmax) and half-lives (t½). Zinc was the most toxic in
sediment samples with an MIC of 0.006 mg total zinc/L, whereas mercury was most toxic in Aufwuch
samples with an MIC of 0.002 mg total mercury/L. Metal inhibition has also been observed during the
biodegradation of 2,4-dichlorophenoxyacetic acid (2,4-D) in cadmium contaminated systems (Roane et
al., 2001). Degradation by Ralstonia eutropha JMP134, a cadmium-sensitive 2,4-degrader, occurred in
the presence of up to 24 mg/L cadmium in mineral salts medium containing cadmium-resistant isolate and
0.060 mg/g cadmium in amended soil microcosms and field-scale soil bioreactors (Roane et al., 2001).
Experiments also indicated that 104 colony forming units of Ralstonia eutropha JMP134/ml alone in the
presence of > 3 mg/L cadmium in mineral salts medium did not degrade 2,4-D due to cadmium toxicity
(Roane et al., 2001).
Reported metal concentrations that cause inhibition of anaerobic biodegradation of halogenated
organic contaminants are listed in Table 1.2. below. Kuo and Genther (1996) demonstrated three effects
of Cd2+, Cu 2+, Cr6+ and Hg2+ ions on dechlorination and biodegradation of 2-chlorophenol (2-CP) and 3-

25
chlorobenzoate (3-CB), including extended acclimation periods, reduced dechlorination or biodegradation
rates, and failure to dechlorinate or biodegrade the target compound. It was suggested that the
concentration at which these effects were observed was characteristic of the metal ion added, the target
compound studied and the consortium being used. The biodegradation of 3-CB was shown to be most
sensitive to Cd2+ and Cr6+ whereas 2-CP consortium was considered most sensitive to added Cd2+ and
Cu2+. Since 2-CP and 3-CB were dechlorinated by distinct bacterial species, differences in metal
sensitivity may have been specific to the dechlorinating species or the dechlorinating enzymes
themselves. Interestingly, with Hg2+ at 1.0 to 2.0 ppm, 2-CP and 3-CP were biodegraded 133 to 154%
faster than controls after an extended acclimation period, suggesting adaptation to Hg2+, perhaps via
removal or transformation of mercury by mercury-resistant bacterial species (Kuo and Genther, 1996).

26
Table 1.1: Reported metal concentrations that cause inhibition of biodegradation of chlorinated organic contaminants under aerobic conditions (Sandrin and Maier, 2003).
Metal Organic
Lowest metal concentration
reported to reduce
biodegradation
Microbe(s) studied Environment pH Reference
As3+ DDT 5 mg/kga Indigenous community
Former co-contaminated soil NR Van Zwieten
et al. (2003)
Cu2+ 2,4-DME 0.027 mg/La Indigenous community
Aufwuchs (microcosm) 5.0 Said and
Lewis (1991)
Cu2+ 2,4-DME 0.076 mg/La Indigenous community
Sediment (microcosm) 6.1 Said and
Lewis (1991)
Cu2+ 4-CP, 3-CB, 2,4-D
< 14.3-71.6 mg/La, b
Alcaligenes sp., Pseudomonas
spp., Moraxella sp.
Tris-buffered minimal medium
plates 7.0 Springael
et al. (1993)
Cd2+ 2,4-D 0.060 mg/ga Ralstonia eutropha JMP134 Soil microcosms 8.2 Roane et al.
(2001)
Cd2+ 2,4-D 0.060 mg/ga Ralstonia eutropha JMP134
Field-scale bioreactors 8.2 Roane et al.
(2001)
Cd2+ 2,4-DME 0.100 mg/La Indigenous community
Sediment (microcosm) 6.5 Said and
Lewis (1991)
Cd2+ 2,4-DME 0.629 mg/La Indigenous community
Aufwuchs (microcosm) 5.6 Said and
Lewis (1991)
Cd2+ 2,4-D > 3 mg/La Ralstonia eutropha JMP134
Mineral salts medium 6.0 Roane et al.
(2001)
Cd2+ 2,4-D 24 mg/La Ralstonia eutropha JMP134
Mineral salts medium containing cadmium-resistant
isolate
6.0 Roane et al. (2001)
Cd2+ 4-CP, 3-CB, 2,4-D
< 25.3-50.6 mg/La, b
Alcaligenes spp., Pseudomonas
spp., Moraxella sp.
Tris-buffered minimal medium
plates 7.0 Springael et
al. (1993)
Co2+ 4-CP, 3-CB, 2,4-D
< 13.3-1.330 mg/La, b
Alcaligenes spp., Pseudomonas
spp., Moraxella sp.
Tris-buffered minimal medium
plates 7.0 Springael
et al. (1993)
Cr3+ 2,4-DME 0.177 mg/La Indigenous community
Aufwuchs (microcosm) 6.1
Said and Lewis (1991)
Cr6+ 4-CP, 3-CB, 2,4-D
< 131 mg/La, b
Alcaligenes spp., Pseudomonas
spp., Moraxella sp.
Tris-buffered minimal medium
plates 7.0
Springael et al. (1993)

27
Hg2+ 2,4-DME 0.002 mg/La Indigenous community
Aufwuchs (microcosm) 6.8 Said and
Lewis (1991)
Hg2+ 4-CP, 3-CB, 2,4-D
< 45.2-226 mg/La, b
Alcaligenes sp., Pseudomonas
spp., Moraxella sp.
Tris-buffered minimal medium
plates 7.0 Springael
et al. (1993)
Ni2+ 4-CP, 3-CB, 2,4-D
5.18-10.3 mg/La, b
Alcaligenes sp., Pseudomonas
spp., Moraxella sp.
Tris-buffered minimal medium
plates 7.0 Springael
et al. (1993)
Zn2+ 2,4-DME 0.006 mg/La Indigenous community
Sediment (microcosm) 6.4 Said and
Lewis (1991)
Zn2+ 2,4-DME 0.041 mg/La Indigenous
community Aufwuchs
(microcosm) 5.6 Said and Lewis (1991)
Zn2+ 4-CP, 3-CB, 2,4-D
< 29.5-736 mg/La, b
Alcaligenes sp., Pseudomonas
spp., Moraxella sp.
Tris-buffered minimal medium
plates 7.0 Springael
et al. (1993)
Abbreviations: 3-CB, 3-chlorobenzoate; 4-CP, 4-chlorophenol; 2,4-D, 2,4-dichlorophenoxyacetic acid; DDT, 1,1,1-trichloro-2,2-bis (4-chlorophenyl) ethane; 2,4-DME, 2,4-dichloro-phenoxyacetic acid methyl ester; MTC, maximum total concentration; NR, not reported. aValue represents total metal added to system. bValue represents MIC calculated by multiplying MTC by a factor of 2.25 (Sandrin and Maier, 2003).

28
Table 1.2: Reported metal concentrations that cause inhibition of biodegradation of chlorinated organic contaminants under anaerobic conditions (Sandrin and Maier, 2003).
Metal Organic
Lowest metal concentration
reported to reduce
biodegradation
Microbe(s)
studied Environment pH Reference
Cd2+ TCA 0.01 mg/La Indigenous community
Laboratory soil microcosms containing
rice paddy and bottomland hardwood
soils
6.9-7.4
Pardue et al. (1996)
Cd2+ TCA 0.2 mg/La Indigenous community
Laboratory soil microcosms containing organic matter- rich soil
6.8 Pardue et al. (1996)
Cd2+ 2-CP, 3-CB 0.5-1.0 mg/Lb Indigenous
community
Aqueous sediment enriched in anaerobic
growth medium 7.0 Kuo and
Genther (1996)
Cd2+ 2-CP, 3-CP 20 mg/Lb Indigenous
community Sediment slurry 7.0 Kong (1998)
Cr 6+ 2-CP, 3-CB 0.01-0.5 mg/Lb Indigenous
community
Aqueous sediment enriched in anaerobic
growth medium 7.0 Kuo and
Genther (1996)
Cu2+ 2-CP, 3-CB 0.1-1.0 mg/Lb Indigenous
community
Aqueous sediment enriched in anaerobic
growth medium 7.0 Kuo and
Genther (1996)
Cu2+ 2-CP, 3-CP 20 mg/Lb Indigenous
community Sediment slurry 7.0 Kong (1998)
Cr 6+ 2-CP, 3-CP 20 mg/Lb Indigenous
community Sediment slurry 7.0 Kong (1998)
Pb2+ HCB 0.001 mg/gb Indigenous community
Microcosms containing contaminated sediment NR Jackson and
Pardue (1998)
Hg2+ 2-CP, 3-CB 0.1-1.0 mg/Lb Indigenous
community
Aqueous sediment enriched in anaerobic
growth medium 7.0 Kuo and
Genther (1996)
Zn2+ PCP 2 mg/Lb Indigenous community
Anaerobic digester sludge in a liquid
medium containing 0.6 mM phosphate
NR Jin and
Bhattacharya (1996)
Zn2+ PCP 8.6 mg/Lb Indigenous community
Anaerobic enrichment cultures in serum bottles NR Majumdar
et al. (1999) Abbreviations: 3-CB, 3-chlorobenzoate; 2-CP, 2-chlorophenol; 3-CP, 3-chlorophenol; HCB, Hexachlorobenzene; PCP, Pentachlorophenol; NR, not reported; TCA, Trichloroaniline. aValue represents solution-phase concentration of metal present in system. bValue represents total metal added to system (Sandrin and Maier, 2003).

29
1.8 Relationships between metal concentration and inhibition of biodegradation
The total metal concentration in a system has been the most commonly employed indicator of
metal inhibition of biodegradation. Clearly, other factors are also involved, considering the large
disparities between minimum inhibitory concentrations among studies (Sandrin and Hoffman, 2007). The
most common trend observed in most of the data presented indicates that inhibition increases
progressively as the concentration of bioavailable metal in co-contaminated system increases. Numerous
research efforts have indicated that this is not always the case, and literature contains reports that metals
do not inhibit some biodegradative processes (Baldrian et al., 2000; Delaune et al., 1998; Riis et al.,
2002). When metals inhibit biodegradation, their effects are not always dose-dependent and there is
evidence for two semi-dose dependent patterns of metal effects on organic biodegradation.
1.8.1 Semi-Dose Dependent Pattern 1: low metal concentrations stimulate
biodegradation; high metal concentrations inhibit biodegradation
Several studies suggest that metals stimulate activity until a maximum level of stimulation is
reached and, thereafter, metal toxicity increases with increasing metal concentration (Sandrin and Maier,
2003). It is important to note that all of these studies used consortia, not single isolates. Thus, it is likely
that this pattern results from differential toxicity effects, where one population that is sensitive to metal
stress competes in some way with a second metal-tolerant population expressing the activity of interest
(e.g., biodegradation). Inhibition of the more sensitive population reduces competition for resources
needed by the metal tolerant population expressing the activity of interest. Capone et al. (1983) provided
evidence supporting this explanation, and reported that copper and cadmium (both at 0.01 mg total
metal/L) increased 2-chlorophenol biodegradation rate by 168%, while mercury (1-2 mg total mercury/L)
increased the biodegradation rates of 2-CP and 3-CP by 133-154%. Hughes and Poole (1989) and Sterritt
and Lester (1980) reported similar results with various consortia, and suggested that the stimulatory effect
may be due to reduced competition for reducing equivalents or nutrients between metal-resistant
degraders and metal-sensitive non-degraders. Capone et al. (1983), Kuo and Genthner (1996) and Roberts
et al. (1998) also reported that the impact of metals on microbially mediated processes may be due mainly
to effects of metals on a population other than the one carrying out the process of interest.

30
1.8.2 Semi-Dose Dependent Pattern 2: low metal concentrations inhibit
biodegradation; high metal concentrations inhibit less
Some studies have shown a second semi-dose dependent pattern, in which low concentrations of
metals increasingly inhibit activity until a maximum level of inhibition is reached and, thereafter, metal
toxicity decreases with increasing metal concentration. The data published by Said and Lewis (1991)
generally showed that 2,4-DME biodegradation decreased in a dose-dependent trend. A closer
examination of the data revealed that the maximal degradation rate (Vmax) of 2,4-DME was less in the
presence of 10 μM cadmium (0.61 ± 0.03 Mg 2,4-DME/L/min) than in the presence of 100 μM cadmium
(0.74 ± 0.00 Mg 2,4-DME/L/min). In a later study, Roane and Pepper (1997) identified a similar pattern
of inhibition as populations of 2,4-D degraders in a cadmium contaminated soil were more resistant to
cadmium toxicity at a higher concentration of cadmium (40 mg total cadmium/L) than at a lower
concentration of cadmium (20 mg total cadmium/L). The pattern 2 responses to metals might be
explained by microbial community dynamics. High metal concentrations may create selective pressure for
metal-resistant, organic-degrading microorganisms that reduced competition from metal-sensitive non-
degrading microorganisms, thus increasing biodegradation at higher metal concentrations. It has been
suggested that at the level of single cells, it is possible that high metal concentrations may more rapidly
induce a metal resistance mechanism important in cadmium detoxification (e.g., an efflux pump) than low
metal concentrations (Sandrin and Hoffman, 2007).
In summary, the existence of semi-dose dependent patterns of metal effects on biodegradation
complicates understanding and predicting metal toxicity in the environment. As demonstrated by the
patterns described above, metals may impact both the physiology and ecology of pollutant degrading
microorganisms. For this reason, models designed to predict the impact of metals on biodegradation may
fail to do so accurately unless they include both physiological and ecological effects of metals on organic-
degrading microorganisms (Sandrin and Hoffman, 2007).
1.9 Bioremediation
By definition, bioremediation is the employment of biological activities to degrade and/or
detoxify contaminants for alleviation (and wherever possible complete elimination) of the noxious effects,
both to human health and the environment, caused by organic and inorganic pollutants in contaminated
sites (Iwamoto and Nasu, 2001). It is a managed treatment process whereby organic wastes are
biologically degraded under controlled conditions to an innocuous state, or to levels below concentration
limits established by regulatory authorities (Smets and Prichard, 2003). de Lorenzo (2008) noted that
bioremediation is an intervention aimed at mitigating pollution, and therefore stated that the field belongs
to the sphere of biotechnology. Depending on the extent of such intervention, bioremediation is

31
commonly considered to include natural attenuation (little or no human action on the contaminated site),
biostimulation (addition of nutrients, and electron donors/acceptors to promote the growth or metabolism
of particular microorganisms), or bioaugmentation (the deliberate addition of natural or engineered
microorganisms with the desired catalytic capabilities) (El Fantroussi and Agathos, 2005; Van Dillewijn
et al., 2007). Bioremediation is gradually making inroads for applications in environmental clean-up of
co-contaminated environments because it has been established as a versatile, efficient, economical, easy
to apply, simple to maintain, environmentally sound treatment and leads to complete destruction of a wide
variety of contaminants with little secondary pollution compared to other techniques (Lee et al., 2008;
Norris, 1994; Park et al., 2008).
1.9.1 Natural attenuation
Natural attenuation, as a management approach for contaminated environments, hinges on the
notion that there exist in situ transformation processes (involving dispersion, sorption, biotic and abiotic
degradation of target compounds) that are possibly, self-sustaining, appropriate with regard to type and
sufficient in magnitude to control the risk associated with the resident pollutants (Davis et al., 2003;
Smets and Pritchard, 2003). In virtually all situations, microbial reactions are the dominant processes
driving the natural attenuation of both organic and inorganic contaminants (Smets and Pritchard, 2003).
Numerous case studies have reported natural attenuation of soil (Chaineau et al., 2003; Kastanek et al.,
1999; Margesin and Schinner, 2001). For example, Chaineau et al. (2003) noted a 56% removal of the
hydrocarbons via natural attenuation in a 480-day field experiment contaminated with 18,000 mg
hydrocarbon/kg soil, compared to 70% to 81% with fertilization. Natural attenuation is advantageous as it
avoids damaging ecologically sensitive microbial habitats (Dowty et al., 2001). Intrinsic bioremediation,
however, is often a long term process because of low population sizes of the indigenous degrading
microorganisms (Forsyth et al., 1995; Yu et al., 2005).
1.9.2 Biostimulation
Biostimulation is considered the most extensively used bioremediation procedure. This practice is
employed for the proliferation of indigenous microorganisms by addition of nutrients and/or a terminal
electron acceptor as well as making appropriate pH adjustments (Margesin and Schinner, 2001; Salanitro
et al., 1997). However, prior to initiating biostimulation protocols, it is important to establish the potential
of indigenous microorganisms and to assess the limiting factors to be controlled during treatment
(Menendez-Vega et al., 2007). It has been established that the nutrient requirements for microbes are
approximately the same as the composition of their cells (Sutherson, 1997), with carbon being an
exception as it is required at larger quantities and can be supplied by the contaminant for heterotrophic

32
microorganisms (Liebeg and Cutright, 1999). Nutrient requirements of microorganisms are divided into
three categories (macro, micro, and trace nutrients) which are based largely on the essential need and
quantity required by the microorganism. For example, the macronutrients carbon, nitrogen, and
phosphorus comprise approximately 50, 14, and 3% dry weight of a typical microbial cell, respectively
(Liebeg and Cutright, 1999). Based on this criterion, the optimal C:N:P mole-ratio recommended for
bioremediation applications is 100:10:1 (Cookson Jr, 1995; Norris et al., 1994). Contaminated sites
consisting of large quantities of organic pollutants tend to depletion of the available pools of major
macronutrients, N and P. It is not surprising; therefore, that numerous studies of the effects of
biostimulation with N-P-K fertilizers have reported positive effects (Margesin and Schinner, 2001).
Moreover, redox potential is another important aspect which must be considered prior to supplementation
with nutrients. It defines electron availability and affects the oxidation states of hydrogen, carbon,
nitrogen, oxygen, sulfur, manganese, iron, etc. (Liebeg and Cutright, 1999). Therefore, careful
consideration must be taken in determining the quantity and type of nutrients to add so that the optimal
redox potential is maintained. For an optimal aerobic environment, the redox potential must be greater
than 50 millivolts (Norris et al., 1994). Currently, there are no precise protocols for determining the exact
nutrient sources to employ at a contaminated site. The specific ratio depends, inter alia, on the rate and
extent of degradation of the chemicals present, the bioavailability of soil nutrients, the soil types, and the
presence of oxygen or other electron acceptors (Liebeg and Cutright, 1999). The nutrients inherent to the
particular environment, as well as those supplemented, can interact with the contaminant, bacteria, soil,
and terminal electron acceptor. These interactive effects will significantly impact the successful
implementation of biostimulation. However, understanding the effects of various nutrients and quantity
may enable comparisons to be drawn across different sites, hence accelerating the bioremediation process
(Liebeg and Cutright, 1999).
1.9.3 Bioaugmentation
Bioaugmentation entails the addition of indigenous and/or non-indigenous laboratory grown
microorganisms capable of biodegrading the target contaminant (Vogel, 1996; Widada et al., 2002) or
serving as donors of catabolic genes (Top et al., 2002). In cases where indigenous communities of
bacteria are unable to carry out the desired reactions, degrading the contaminant at rates that are too low,
inhibited by the presence of multiple contaminants or killed as a result of drastic (abiotic) remediation
techniques, bioaugmentation can be introduced to hasten the degradation process (Widada et al., 2002).
An extensive review by Gentry et al. (2004) details several new approaches that may increase the
persistence and activity of exogenous microorganisms and/or genes following introduction into the
environment. The major advantage of bioaugmentation over other techniques is that when a specific

33
microbial population is injected the degradation process can start immediately, whereas during
biostimulation, for example, a delay after injection of nutrients occurs as the microbial population
propagates and also nutrients are not specific, so that all microbes will potentially propagate, diluting the
effect of the nutrients (Weston and Balba, 2003). The success/failure of most bioaugmentation
experiments depends highly on the survival of the inoculated cells under stress conditions inherent in the
soil environment, including competition from indigenous microorganisms. Bento et al. (2003) concluded
that the best approach for bioremediation was the bioaugmentation performed by inoculating indigenous
microorganisms pre-selected from their own environment, as these microbes are more likely to survive
and propagate when reintroduced into the site. Inoculating the contaminated site with microorganisms
carrying self-transmissible plasmids containing genes involved in resistance and/or degradation is an
alternative approach to bioaugmentation (Newby et al., 2000a). These plasmids may be transferred to
indigenous microorganisms that possess the characteristics necessary for growth and survival in the soil
environment and, thus, establish a stable array of hosts for the plasmids (Daane et al., 1996; Newby et al.,
2000b; Top et al., 1998). This bioremediation approach may be of particular interest for sites that contain
both organic and metal contaminants, as the presence of metals has been shown to significantly reduce, if
not inhibit, organic degradation (Said and Lewis, 1991; Olaniran et al., 2009)
1.10 Bioremediation strategies for increasing biodegradation in co-contaminated
environments
Several approaches aimed at reducing the extent to which metals inhibit chlorinated organic
biodegradation have focused specifically on lowering bioavailable metal concentrations and/or increasing
metal resistance. Approaches include inoculation with metal-resistant microorganisms and the addition of
treatment amendments that can reduce metal bioavailability. Phytoremediation has also shown promise as
an emerging alternative clean-up technology for co-contaminated environments, and is currently under
investigation. The various approaches are discussed below.
1.10.1 Metal-resistant bacteria
In the case of co-contamination, the double stress imposed on the soil bacterial communities
means that for effective in situ bioremediation of the organic contaminant, there must be metal-resistant
microbes with appropriate degradative genes, or consortia of metal-resistant microbes with suitable
catabolic capabilities (Pepper et al., 2002). Previously, bioaugmentation studies focused on the
introduction of a microorganism that was both metal-resistant and capable of organic degradation.
However, under environmental conditions such an approach is often unsuccessful, probably due to the
high energy requirements needed to maintain concurrent metal resistance and organic degradation (Roane

34
et al., 2001). Recent approaches have demonstrated the use of a dual-bioaugmentation strategy and the
role of cell bioaugmentation in the remediation of co-contaminated systems (Pepper et al., 2002; Roane et
al., 2001).
Unlike organics, metals cannot be degraded, and thus most biological heavy metal remediation
approaches rely on the detoxification and immobilization of the metal both to reduce the biological
toxicity and to retard metal transport (Roane et al., 2001). Many factors influence the survival of
organisms exposed to toxic levels of heavy metals, including lateral gene transfer (LGT) for the
dissemination of resistance phenotypes throughout microbial communities (Coombs and Barkay, 2004;
2005; Osborn et al., 1997) and changes in active-site residues that influence substrate specificity of metal
homeostasis proteins (Tong et al., 2002). Although metals are thought to inhibit the ability of
microorganisms to degrade chlorinated organic pollutants, several microbial systems of resistance to
metals are known to exist (Nies, 1992; 1999; Rosen, 1996; Saier Jr et al., 1994; Silver, 1996; Silver and
Phung, 1996). However, there are only three possible mechanisms by which these systems operate.
Firstly, the accumulation of the particular ion can be diminished by efflux, an active extrusion of the
heavy metal from the cell (Nies and Silver, 1995), which include: members of the resistance-nodulation-
cell division (RND) protein family-export superfluous cations; cation diffusion facilitators (CDF family)
which serve as secondary cation filters in bacteria; P-type ATPases-basic defence against heavy metal
cations; and CHR protein family, NreB, CnrT. Secondly, cations, especially the “sulfur lovers”, can be
separated into complex compounds by thiol-containing molecules; and thirdly, some metal ions may be
reduced to a less toxic oxidation state. A detailed review is available that describes modes of efflux-
mediated heavy metal resistance in prokaryotes (Nies, 2003).
Most aerobic cells have a physiological redox range (-421 mV to + 808 mV); therefore, to be
detoxified by reduction the redox potential of a given heavy metal should be between this range. Thus,
heavy metals such as Hg2+ (+430 mV), arsenate (+139 mV), and Cu2+ (-268 mV) may be reduced by the
cell, but Zn2+ (-1.18 V), Cd2+ (-824 mV), and Ni 2+ (-678 mV) may not (Nies, 1999). In the case of many
metals, resistance and homeostasis involve a combination of two or three of the basic mechanisms
mentioned. Roane et al. (2001) investigated dual-bioaugmentation involving inoculation with both metal-
detoxifying and organic-degrading bacteria to facilitate organic degradation within a co-contaminated
system. Soil microcosms were constructed using uncontaminated sandy loam soil amended with 500 g
of 2,4-D/ml, and co-contaminated with 60 g of cadmium to a final concentration of 60 g/ml. This was
followed by inoculation with Ralstonia eutropha JMP134, a 2,4-D degrader and Pseudomonas H1, a
cadmium-resistant strain. Based on the results obtained, it was concluded that dual-bioaugmentation with
metal-detoxifying and organic-degrading microbial populations is effective for remediation of co-
contaminated soil; however, reducing bioavailable metal concentrations via sequestration prior to

35
inoculation with the organic-degrading population will promote increased degradation. In another study,
Pepper et al. (2002) investigated the role of cell bioaugmentation and gene bioaugmentation in the
remediation of co-contaminated soil. Escherichia coli D11, which contains plasmid pJP4, but does not
have the chromosomal genes necessary for the transformation of 2-chloromaleylacetate to succinic acid,
was used for gene bioaugmentation. The observation from this study suggests that the indigenous
transconjugant population generated from E. coli D11 inoculation was better suited for subsequent 2,4-D
degradation than the R. eutropha JMP134-inoculated soil, in which the presence of the 2,4-D degrading
inoculant repressed transconjugant growth. However, the ultimate choice of cell or gene bioaugmentation
will depend on the relative health potential of the recipient population, the degree of contamination and
the time frame available for remediation.
1.10.2 Treatment amendments
Many studies have been carried out to evaluate the ability of different chemical amendments to
immobilize heavy metals in polluted environments. These additives include organic materials, phosphate
rocks, iron and manganese oxides and oxy-hydroxides, and waste by-products rich in these oxides as well
as alkaline agents such as lime and zeolite (Basta et al., 2001; Boisson et al., 1998; Chen et al., 2000;
Edwards et al., 1999; García-Sánchez et al., 1999; Gworek, 1992; Hodson et al., 2000; Lehoczky et al.,
2000; Li et al., 2000; Mench et al., 2000; Shuman et al., 2002). In general, these treatments prove to have
an ameliorative effect on reducing the metal mobility or bioavailability. Panuccio et al. (2009) evaluated
cadmium sorption in three different minerals (vermiculite, zeolite and pumice). Results indicated that
zeolite and vermiculite reduced soluble cadmium concentrations by 90% and that the metal sorbed on
zeolite was mainly present in the non-exchangeable form (70%) at the lowest cadmium concentration (30-
120 μM). Furthermore, it was reported that the percentage of cadmium sorption in zeolite and vermiculite
was independent of the initial cadmium concentration, and the mineral sorption capacity was closely
dependent upon pH. In particular, cadmium adsorption on pumice was raised from 20% to 90% with an
increase of pH from 4 to 7.5. Phosphate amendments, in particular, have been given much attention for
the treatment of Pb-contaminated environments (Brown et al., 2005; Chen et al., 2000; 2003; Li et al.,
2000; Shuman et al., 2002). Despite the well-documented ability of treatment amendments to reduce
metal mobility and bioavailability, not much attention has been directed towards determining microbial
endpoints after the treatment of contaminated environments. Brown et al. (2005) examined the effect of
lime, phosphorus, red mud, cyclonic ashes, biosolids and water treatment residuals on the toxicity of
cadmium, lead and zinc in an international inter-laboratory study. Each participating laboratory selected a
common soil material from mine wastes and common treatments. Nitrogen (N) transformation and a
measure of the total soil microbial biomass were chosen as microbial endpoints. The N transformation test

36
was designed to measure nitrate formation in soils after the addition of an organic substrate. The
formation of nitrate is an indicator of microorganisms degrading the C-N bonds in the organic substrate
and recycling nutrients within the soil. Of the amendments tested by the participating laboratories, P
added as either triple sugar phosphate or H3PO4 appeared to be the most effective. Phosphorus addition to
the soil resulted in reduced soil solution and extractable metals, reduced bioavailability of soil Pb, and
increased microbial activity based on the two measures. These promising results suggest that the use of
treatment amendments may be an effective means to increase chlorinated organic pollutant
biodegradation in the presence of toxic levels of heavy metals.
1.10.3 Clay minerals
The use of clay minerals to reduce metal bioavailability and resulting toxicity in groundwater and
sub-soils has been successful for the remediation of heavy metal polluted environments (Boenigk et al.,
2005; Sandrin and Maier, 2003). Clays differ in chemical and physical properties and have a
comparatively high ion exchange capacity of 5 to > 50 meq/100 g clay (montmorillonite > illite >
kaolinite). Charged substances attach easily to clay particles. Sorption of heavy metals on clays has been
studied for montmorillonite (Barbier et al., 2000), illite (Echeverria et al., 2002), kaolinite (Coles and
Yong, 2002; Sarkar et al., 2002), and bentonite and vermiculite (Kamel, 1986; Panuccio et al., 2009).
These clays are chosen to avoid pollutant release into the environment owing to their high specific surface
areas, low cost and ubiquitous presence in most soils (Bailey et al., 1999). In particular, the evaluation of
the total capacity of Na-montmorillonite shows that this clay is a good sorbent towards a variety of metals
(Abollino et al., 2003), and generally has a higher sorption of heavy metals than kaolinite (Barbier et al.,
2000). This clay mineral adsorbs heavy metals via two different mechanisms: (1) cation exchange in the
inter layers resulting from the interactions between ions and negative permanent charge; and (2)
formation of inner-sphere complexes through Si-O- and Al-O- groups at the clay particle edges (Kraepiel
et al., 1999; Mercier and Detellier, 1995; Schindler et al., 1976). Abollino et al. (2003) reported that the
adsorption of metal ions on Na-montmorillonite decreases with decreasing pH and is also influenced by
the presence of ligands. At low pH values (2.5-3.5), the hydrogen ion competes with the heavy metals
towards the superficial sites and, moreover, the Si-O- and Al-O- groups are less deprotonated and they
form complexes with bivalent and trivalent ions in solution with greater difficulty (Abollino et al., 2003).
This effect was particularly evident for Cu2+ (as aqua ion [Cu (H2O) 6]2+) which has a distorted geometry,
and for Pb2+ and Cd2+ that have a lower electrostatic attraction versus the clay because of their lower
charge density (Abollino et al., 2003). For these reasons, the adsorption of these ions is unsupported by
cation exchange mechanism and, hence, they are influenced more by pH variations. Therefore, the pH
effect on each metal tested was different and, at pH ≤ 3.5, the studied metals were adsorbed in increasing

37
entity in the following order: Cu2+ < Pb2+ < Cd2+ < Zn2+ ≤ Mn2+ ≈ Cr3+ ≈ Ni2+ (Abollino et al., 2003). This
result was a function of the ligand and metal considered but the formation of metal-ligand complexes in
solution altogether hinders the adsorption of the metal ions on the clay. In this case, the metal adsorption
increased in the following order: Cr3+ < Cu2+ < Ni2+ < Zn2+ ≤ Cd2+ ≤ Pb2+ ≤ Mn2+ (Abollino et al., 2003).
The result indicated that the sorption capability of Na-montmorillonite towards each metal ion examined
was different under various conditions, and was a function of both pH and of the ligand present in
solution. It is therefore necessary to consider both these factors in studying a real soil/solution system and
effectively predicting the fate of heavy metals in the environment. From the results it was evident that the
total capacity of Na-montmorillonite towards the investigated metals increases in the order: Pb2+ = Cd2+ <
Cu2+ < Zn2+ < Mn2+ < Ni2+ < Cr3+ (Abollino et al., 2003). In a similar study, Boenigk et al. (2005) reported
that LC50 of Spumella sp in solution systems contaminated with Cd 2+ decreased by 71% and 64% in the
presence of clay and silicate beads, respectively.
1.10.4 Chelating agents
Chelating agents increase metals diffusion in the soil solution and keep them in plant available
forms by forming large, less reactive ions, by increasing the concentration of these larger chelated ions in
solution, and by decreasing the ability of the free ions to react with the soil (Žemberyová et al., 2007).
Chelating agents offer great promise for assessing readily available micronutrient cations in soils
(Žemberyová et al., 2007). These agents adhere with free metal ions in solution forming soluble
complexes and thereby reduce the activities of the free metal ions in solution. In response, metal ions
desorb from soil particles or dissolve from labile solid phases to replenish the free metal ions in solution.
Chelating agents, such as ethylenediamine-tetraacetic acid (EDTA), have been employed to reduce metal
toxicity to organic-degrading microorganisms. EDTA was shown to reduce the toxicity of cadmium to
Chlorella sp. (Upitis et al., 1973), of nickel to algae (Spencer and Nichols, 1983), and of copper to
bacteria and algae (Sunda and Guillard, 1976). However, the toxicity of EDTA to many microorganisms
and its limited biodegradability reduce its suitability for application to the bioremediation of co-
contaminated environments (Borgmann and Norwood 1995; Braide, 1984; Ogundele, 1999). For this
reason, the development of several surfactant-modified clay complexes to reduce metal toxicity has
sparked greater interest.
Malakul et al. (1998) have demonstrated the potential application of surfactant-modified clay
adsorbents in mixed-waste biotreatment, in which toxic organics and heavy metals co-exist. In this study,
the toxicity of cadmium to Pseudomonas putida was greatly reduced by the addition of a surfactant
modified-clay complex and a commercially available chelating resin (Chelex 100; Biorad, Hercules, CA)
during the biodegradation of naphthalene. Surfactant modified-clay complexes are prepared through a

38
simple surface modification method of grafting metal-chelating ligands in order to impart a higher metal
capturing capacity and selectivity to the base clays.
1.10.5 Biosurfactants
Biosurfactants are amphiphilic compounds which can reduce surface and interfacial tensions by
accumulating at the interface of immiscible fluids and increase the solubility, mobility, bioavailability and
subsequent biodegradation of hydrophobic or less soluble organic compounds (Makker and Rochne,
2003), such as polychlorinated biphenyls (Van Hamme et al., 2006). Biosurfactants are produced
extracellularly or as part of the cell membrane by bacteria, yeasts and fungi, from various substrates
including sugars, alkanes, oils and waste (Mulligan, 2005). Many studies of biosurfactant-enhanced
bioremediation have employed small, well-characterized biosurfactants such as Pseudomonas aeruginosa
rhamnolipids (Maier and Soberon-Chavez, 2000; Mulligan, 2005), Candida apicola sophorose lipids
(Hommel et al., 1994), Rhodococcus erythropolis trehalose dimycolipids (Kanga et al., 1997), Bacillus
sp. lichenysins (Jenny et al., 1991), and Bacillus subtilis surfactin (Awashti et al., 1999; Makker and
Cameotra, 1997; Mulligan et al., 2001a).
Important here is the advantage of such compounds at co-contaminated sites, since
microorganisms have long been shown to produce potent surface-active compounds that enhance the rate
of degradation by emulsification or solubilization of the hydrophobic hydrocarbon (Noriyuki et al., 2002).
Exploiting this property, Berg et al. (1990) described the potential use of a P. aeruginosa UG2-produced
biosurfactant to significantly increase the solubility and dissolution of hexachlorobiphenyl into the
aqueous phase. In tests with the emulsifying agent in soil slurries, 31% of the added hexachlorobiphenyl
was recovered in the aqueous phase. In a similar study, Van Dyke et al. (1993) surveyed a variety of
biosurfactants for removal of hexachlorobiphenyl from soil. Out of 13 biosurfactants tested, seven
removed hexachlorobiphenyl more efficiently compared to controls. Two strains of P. aeruginosa and
one strain of A. calcoaceticus RAG-1 produced the most efficient biosurfactant.
Furthermore, biosurfactants may also enhance the desorption of heavy metals from soils via 2
approaches: firstly, complexation of the free form of the metal residing in solution which decreases the
solution phase activity of the metal and, therefore, promotes desorption according to Le Chatelier‟s
principle; secondly, direct contact of biosurfactant to sorbed metal at solid solution interface under
conditions of reduced interfacial tension, which allows biosurfactants to accumulate at solid solution
interface (Miller, 1995). Considerable work has been done on rhamnolipid biosurfactant produced by
various P. aeruginosa strains capable of selectively complexing cationic metal species such as Cd2+, Pb2+,
and Zn2+ (Herman et al., 1995; Tan et al., 1994; Torrens et al., 1998), thus increasing the bioavailability
of substrates with limited aqueous solubilities (Herman et al., 1997; Zhang et al., 1997; Zhang and Miller,

39
1995), and also increasing cell surface hydrophobicity (Al-Tahhan et al., 2000; Zhang and Miller, 1994).
Research has shown that rhamnolipids complexes more preferentially with toxic metals such as Cd and
Pb than with normal soil metal cations such as Ca and Mg, for which it has a much lower affinity (Said
and Lewis, 1991). Also, metals such as lead and cadmium have stronger affinities for rhamnolipids than
for many of the soil components to which they are bound in contaminated soils (Sandrin et al., 2000).
Due to the foaming property of the biosurfactant, metal-biosurfactant complexes can be removed
by addition of air to cause foaming and then the biosurfactant can be recycled through precipitation by
reducing the pH to 2 (Wang and Mulligan, 2004). Anionic biosurfactants were found to be more effective
where metals are the agents to be sequestered. Surfactin, rhamnolipid, and sophorolipids, all anionic
biosurfactants, were able to remove copper and zinc from a hydrocarbon-contaminated soil (Mulligan et
al., 1999). One advantage in case of co-contaminated soil is that biosurfactants can potentially be
produced in situ using the organic contaminants as substrates for their production, which subsequently
would lead to both the remediation of the contaminants and a great reduction in remediation costs
(Abraham et al., 2002). The efficiency of biosurfactants for stimulating biodegradation of contaminants is
uncertain given the specificity observed between biosurfactant and organism. Addition of biosurfactant
can stimulate some organisms but also can inhibit some microorganisms; a strategy suitable for effective
remediation would therefore be to stimulate biosurfactants produced by indigenous population, or to use
commercial biosurfactants produced by organisms found to be already present at the contaminated site
(Abraham et al., 2002). Furthermore, delivery of a biosurfactant into co-contaminated sites for in situ
treatment may be more environmentally compatible and more economical than using modified clay
complexes or metal chelators such as EDTA (Gray and Wilkinson, 1965; Kamel, 1986; Sandrin et al.,
2000).
1.10.6 Phytoremediation
In situ bioremediation is gaining momentum as a low-cost and effective method for restoration
and remediation of many contaminated sites. In particular, the use of plants for rehabilitation of heavy
metal contaminated environments is an emerging area of interest because it is ecologically sound and safe
(Lin et al., 2008; Wu et al., 2006). Although phytoremediation is a slow process, improvement of
efficiency and thus increased stabilization or removal of heavy metals from soils is an important goal
(Göhre and Paszkowski, 2006), especially in the case of co-contamination. Plants use the following
mechanisms to facilitate remediation, these include: phytostabilization, phytoextraction,
phytovolatilization, phytopumping, phytotransformation/degradation, and rhizodegradation (Singh and
Jain, 2003; Susarla et al., 2002). The biomass production of a few hyperaccumulator plants has been
judged sufficient for phytoremediation; for example, the brake fern Pteris vittata accumulated up to 7500

40
μg/g As on a contaminated site without showing toxicity symptoms (Ma et al., 2001). Numerous research
efforts have focused on the use of these techniques as viable alternatives to mechanical and chemical
approaches in remediation of metal contaminated soils or as a final, consummating step in high-level
organic contamination (Jones, 1991; Leigh et al., 2002; Singh et al., 2004; Zhu et al., 2001). However, an
alternative approach, which focussed on the dissipation mechanisms by Lolium perenne L (ryegrass) and
Raphanus sativus (radish) for pentaphlorophenol (PCP) in copper co-contaminated soil, indicated that
with an initial PCP concentration of 50 mg/kg, plants grew better with the increment of soil Cu level (0,
150, 300 mg/kg). This inferred that combinations of inorganic and organic pollutants sometimes exerted
antagonistic effects on plant cytotoxicity (Lin et al., 2006). In copper co-contaminated soil with an initial
PCP concentration of 100 mg/kg, however, both plant growth and microbial activity were inhibited with
the increment of soil Cu level, implying that the soil phytotoxicity was increased in the presence of Cu
(Lin et al., 2006). The reduced mass flow and lowered degrading activity of microorganisms were
probably responsible for the significantly lower levels of PCP dissipation in the soil co-contaminated with
copper. As mentioned previously, heavy metals are bound to soil components in varying degrees,
depending on soil conditions such as pH, clay content, organic matter, redox potential (Sandrin and
Hoffman, 2007; Sandrin and Maier, 2003). Natural chelating agents, such as citric and acetic acid,
released by plant roots make the ions of both nutrients and contaminants more mobile in the soil. Plants
can usually break the chelation bond, take up the metal, and release the chelant back into the soil solution.
Since most organic-degrading microorganisms are sensitive to the toxic effects of heavy metals, a
successful strategy to address this mixed-waste situation requires the use of microorganisms that will
survive and thrive in soil polluted with heavy metals. An attractive feature of using rhizoremediation in
such a situation is the flexibility of utilizing different engineered rhizobacteria to remediate mixed-waste
co-contaminated soil (Khan, 2005). To provide a modified rhizoremediation system, the rhizosphere
bacterial community can be specifically engineered to target various pollutants at co-contaminated sites
(Wu et al., 2006). Furthermore, specific plant species and biodegradation genes can be selected in
accordance with the contaminants present and plant growth conditions at the toxic sites (Wu et al., 2006).

41
1.11 Assessment of microbial diversity in contaminated soil environments
Traditionally, characterization of microbial ecosystems in contaminated soils focused mainly on
analyzing numbers of culturable bacteria, measuring biomass and processes such as respiration (Bloem et
al., 1995; De Leij et al., 1993; Evdokimova, 2001). Unfortunately, these methods only provide data about
processes or bacterial numbers and are not suitable for the analysis of microbial community composition
or diversity. Culturing colony forming units on different media was the most popular method for
investigating microbial diversity. However, most bacteria targeted for isolation from environmental
samples are difficult to culture due to constraints imposed by the selectivity of artificial media and
conditions at which they are to be grown (Kirk et al., 2004). It has been estimated that the microbial
community in one gram of soil may contain over one thousand different bacterial species (Rossello-Mora
and Amann, 2001), but less than 1% of these have been reported to grow on artificial media (Kirk et al.,
2004; McCaig et al., 1999; Sekiguchi et al., 2002; Stephen et al., 1999; Von Wintzingerode et al., 2002;
Wayne et al., 1987).
Modern molecular techniques offer an exciting opportunity to overcome the requirement for
culturing microorganisms and have therefore greatly increased our understanding of microbial diversity
and activity in the environment (Malik et al., 2008). These methods rely on the characterization of
cellular constituents such as nucleic acids, fatty acids, proteins, and other taxonomic specific compounds
(Borneman et al., 1996; Nakatsu et al., 2000; Rossello-Mora and Amann, 2001). The first culture-
independent estimate of prokaryotic organisms in soil indicated the presence of 4600 distinct genomes in
one gram of soil (Kent and Triplett, 2002). Extracted DNA or RNA can, via molecular genetic techniques,
facilitate coupling of microbial community analysis with phylogeny (Blackwood et al., 2003). The
uncultured diversity reflects species closely related to known cultured organisms and also species from
virtually uncultured lineages (Blackwood et al., 2003). Molecular methods usually involve the separation
of polymerase chain reaction (PCR) amplicons on the bases of DNA nucleotide sequence differences,
most often the 16S rRNA gene. The 16S rDNA regions are useful for such studies since these genes are
present in all bacteria and comparison of sequences of 16S rDNA fragments has been well established as
a standard method for the identification of species of bacteria (Gürtler and Stanisich, 1996). The success
of this method does not depend on the physiological state of the cells from which the DNA is extracted.
The only requisites are that cells are lyzed by the extraction buffer and that all the 16S rRNA genes are
equally accessible for amplification (Li et al., 2006). Culture-independent approaches include denaturing
gradient gel electrophoresis (DGGE), temperature gradient gel electrophoresis (TGGE), single strand
conformation polymorphism (SSCP), restriction fragment length polymorphism (RFLP)/amplified
ribosomal DNA restriction analysis (ARDRA), terminal restriction fragment length polymorphism (T-

42
RFLP), and ribosomal intergenic spacer analysis (RISA)/automated ribosomal intergenic spacer analysis
(ARISA).
The application of molecular fingerprinting techniques holds great promise in assessing microbial
diversity in co-contaminated environments. The presence of multiple contaminants presents extreme
challenges to the maintenance of a phylogenetically and functionally diverse microbial community (Shi et
al., 2002), therefore, only microbes that tolerate both heavy metals and toxic levels of hydrocarbons may
survive. However, the combined effect of metals and organic carbon pollutants on microbial diversity and
activity are unclear since few studies have addressed this issue (Nakatsu et al., 2005).
1.12 Denaturing gradient gel electrophoresis
Denaturing gradient gel electrophoresis (DGGE) is a highly sensitive technique which provides
information on the diversity and composition of mixed microbial communities (Banks and Allemen,
2002; Hayes et al., 1999; Koizumi et al., 2002). This molecular technique allows a high number of
samples to be screened simultaneously, thus facilitating much broad-spectrum analysis of microbiological
diversity (Muyzer, 1999). The technique is based upon differential melting of double-stranded DNA
molecules in a polyacrylamide gel with an increasing gradient concentration of denaturant (urea and
formamide) (Hayes et al., 1999). DNA is extracted from the environmental samples and amplified using
PCR with universal primers targeting part of the 16S or 18S rRNA sequences. The 16S rRNA genes are
most commonly used to give an overall indication of the bacterial species composition of the sample
(Muyzer, 1999). The PCR-amplified DNA fragments are generally limited in size to 500 bp and are
separated on the basis of sequence differences, not variation in length (Malik et al., 2008). To prevent
complete strand dissociation and to facilitate the detection of mutations in the higher melting domains, the
5 -́end of the forward primer contains a GC-clamp of 35-40 base pairs. The GC-clamp theoretically
increases the percentage of single base changes detectable by DGGE to 100% (Abrams et al., 1990;
Sheffield et al., 1989). DGGE separates DNA fragments according to their melting behaviour; therefore
the absence of a GC-clamp would result in the DNA denaturing into single strands. On denaturation,
DNA melts in domains which are sequence specific, and will migrate differentially through the
polyacrylamide gel (Muyzer, 1999). Theoretically, double stranded DNA molecules differing by only a
single base substitution in their lowest melting domain show different melting behaviour patterns (Miller
et al., 1999). As a consequence, melting at different positions along a denaturing gradient gel generates a
genetic fingerprint of the entire community being examined (Gillan, 2004). Resulting gel images can be
digitally captured and used for species identification when samples are run against known standards
(Temmerman et al., 2003). Analysis of DGGE profiles often involves the use of principal component
analysis (Ogino et al., 2001; Widmer et al., 2001) or hierarchical cluster analysis to demonstrate

43
similarities in the data, and the results are invariably presented in the form of dendrograms (Boon et al.,
2000; 2002; Eichner et al., 1999; Van Der Gucht et al., 2001).
DGGE has been widely used for the assessment of microbial community structure in
contaminated soil, and is primarily aimed at studying the evolution of microbial communities (Avrahami
and Conrad, 2003; Morris et al., 2002; Nicol et al., 2003). Kourtev et al. (2006) reported on the selection
of microorganisms in a soil microcosm setting. Glucose and protein amendments were selected for
different bacterial communities, and this selection was modified by the addition of Cr(VI), since some
DGGE bands were intensified and new bands appeared in Cr(VI)-amended microcosms. DGGE allows
for determining total community as well as specific community or gene diversity without further analysis
and without elucidating particular individuals. It has been used in the identification of sequence variations
in multiple genes among several organisms simultaneously (Muyzer et al., 1993). Moreover, functional
genes, having more sequence variation, can be used to discriminate between closely related but
ecologically different communities. For example, catabolic genes, such as methane manooxygenase has
been targeted for DGGE analysis (Fjeilbirkeland et al., 2001; Knief et al., 2003). This provided
information on the diversity of specific groups of microorganisms competent in a defined function such as
pollutant degradation. For environmental or contaminated source samples where microbial diversity is
largely unknown (Amann et al., 1995), DGGE provides the opportunity for the identification of the
microbial population through the excision and sequencing of bands (Forney et al., 2004).
1.12.1 Advantages
The main advantage of DGGE is that it enables the monitoring of the spatial/temporal changes in
microbial community diversity and provides a simple view of the dominant microbial species
within a sample (Malik et al., 2008).
It is relatively easy to use and amenable to the rapid comparison of multiple samples (Neufeld
and Mohn, 2005) i.e. large number of samples can be analyzed simultaneously.
It is a rapid technique and relatively inexpensive (Neufeld and Mohn, 2005).
1.12.2 Disadvantages
Sequence information derived from microbial populations is limited to 500 bp fragments of 16S
rRNA sequences, which may lack the specificity required for phylogenetic inferences as well as
for probe design (Gilbride et al., 2006).
Due to the existence of multiple copies of rRNA in an organism, multiple bands for a single
species may occur (Nubel et al., 1997).

44
Band intensity may not truly reflect the abundance of microbial population (strong band may just
mean more copies) and perceived community diversity may be underestimated (Malik et al.,
2008).
Co-migration of DNA fragments can be a problem for retrieving clean sequences from individual
bands (Muyzer and Smalla, 1998).
There is a lack of consensus regarding standards for normalization as gradients formed in
different gels are somewhat variable making gel-to-gel comparisons difficult (Ferrari and
Hollibaugh, 1999; Moeseneder et al., 1999).
1.13 Scope of the present study
1,2-Dichloroethane incessantly enters the soil environment mainly due to atmospheric emissions
from industrial processes and inappropriate disposal of the compound. The major concern over soil
contamination with 1,2-DCA stems primarily from health risks, both of direct contact and from secondary
contamination of water supplies. Furthermore, heavy metals are routinely introduced into the environment
through the discharge of toxic metal wastes from defence-related activities, municipal waste disposal in
landfill sites or by accidental release. These practices have inspired a growing interest in bioremediation
strategies for their removal. However, co-contamination poses serious challenges worldwide, as it is
considered complicated to remediate because of the mixed nature of the contaminants and the fact that the
two components often must be treated differently.
Previous research efforts have focused extensively on the biodegradation of 1,2-DCA in several
contaminated soil and water environments and several microorganisms have been characterized for their
ability to metabolize 1,2-DCA under various conditions. Furthermore, the toxic effects of heavy metals on
soil microorganisms have also been studied. Although research based on single-pollutant exposures
provides fundamental knowledge about individual pollutants under carefully controlled conditions, they
do not mimic real world exposures. Moreover, approximately 40% of the hazardous waste sites currently
on the National Priorities List of the USEPA are co-contaminated with organic and metal pollutants. Few
studies have addressed the issue of co-contamination, and the impact of heavy metals on organic pollutant
biodegradation. Accordingly, this study was undertaken to assess the impact of heavy metals on the
aerobic biodegradation of 1,2-DCA by autochthonous microorganisms in soil co-contaminated with 1,2-
DCA and heavy metals, via a direct and quantitative measure of the inhibitory effects of heavy metals in a
microcosm setting. Denaturing gradient gel electrophoresis, dehydrogenase activity and urease activity
were used to assess the impact of heavy metals on the microbial population, biodiversity and activity
during 1,2-DCA degradation in the co-contaminated soil. The potential of biostimulation,
bioaugumentation and treatment additives to enhance the degradation process was also investigated.

45
1.13.1 Hypotheses tested
It was hypothesized that the presence of heavy metals will have a negative impact on 1,2-DCA
degradation in co-contaminated soil. It was further hypothesized that the addition of nutrients, treatment
additives and heavy metal-resistant and 1,2-DCA-degrading microorganisms may accelerate the
degradation of 1,2-DCA in such co-contaminated soils.
1.13.2 Objectives
The following objectives were established to test the above hypothesis:
a) To evaluate the biodegradation of 1,2-DCA in soil co-contaminated with 1,2-DCA and heavy
metals and ascertain the effects of heavy metals on 1,2-DCA degradation.
b) To investigate the effects of biostimulation, bioaugmentation and treatment additives on the
biodegradation of 1,2-DCA in the co-contaminated soil samples.
c) To profile 1,2-DCA degrading microbial populations, monitor microbial activity and diversity in
the co-contaminated soil microcosms during 1,2-DCA degradation in the co-contaminated soil.
1.13.3 Experimental design
In order to achieve the stated objectives, this research was divided into the relevant chapters
described below.
Chapter Two
This chapter focuses on the quantitative assessment of the toxic effects of various metal
concentrations (singly and in combination) on the biodegradation of 1,2-DCA. Toxic effects were
evaluated based on the following: (i) degradation rate constants; (ii) estimated MICs; (iii) concentrations
that caused biodegradation half-life doublings (HLDs); and (iv) heavy metal concentrations that caused a
significant effect on biodegradation (> 10% increase in t½ of 1,2-DCA).
Chapter Three
This chapter investigated the effects of biostimulation and bioaugmentation on the aerobic
biodegradation of 1,2-DCA in soil co-contaminated with As3+ and Cd2+. Both traditional methods of soil
dehydrogenase and urease enzyme assays and advanced molecular PCR-DGGE techniques were used to
evaluate soil microbiological activity and diversity in the co-contaminated soils.

46
Chapter Four
This chapter specifically addresses the efficiency of different inorganic treatment additives, to reduce
the bioavailability of heavy metals and to assess its impact on 1,2-DCA degradation in soil co-
contaminated with arsenic and cadmium. Moreover, the effects of such treatment additives on soil urease
and dehydrogenase activities were also investigated.
Chapter Five
This chapter places the entire research in perspective, thereby providing an overview of the
significant findings reported in each of the various chapters of this dissertation. It also identifies the
possible limitations or shortcomings of the study and provides a scope for future directions of the study.

CHAPTER TWO QUANTITATIVE ASSESSMENT OF THE TOXIC
EFFECTS OF HEAVY METALS ON THE AEROBIC
BIODEGRADATION OF 1,2-DICHLOROETHANE IN
CO-CONTAMINATED SOIL

47
2.1 Introduction
The increase in agricultural, industrial and urban activities, many of which inevitably involve the
use of chemicals has given rise to a number of environmental problems due to the release of large
quantities of toxic organic pollutants (Bhattacharya et al., 2002; Collins and Stotzky, 1992; Laturnus,
2003; Mulligan et al., 2001b; Weissenhorn et al., 1995). In particular, chlorinated organic pollutants are
introduced into the environment by effluent from pulp and paper industries, bleaching plants and
chlorination procedures used in the treatment of water (Yu and Welander, 1995). Among the short-
chained chlorinated aliphatic compounds, 1,2-dichloroethane (1,2-DCA) is one of the world’s most
hazardous toxic chlorinated aquifer pollutant (Marzorati et al., 2007). Its annual production is in excess of
5.443 × 10⁹ kg, a quantity larger than that of any other industrial halogenated chemical (Janssen et al.,
1989; Laturnus, 2003). As was noted in Chapter one, the widespread use of 1,2-DCA in a variety of
products and manufacturing processes has resulted in its ubiquitous presence in most sites contaminated
with organic pollutants (DEA, 2002; Hage and Hartmans, 1999) and it has been found in at least 570 of
the 1585 National Priorities List (NPL) sites identified by the U. S. Environmental Protection Agency
(USEPA). Soil contaminated with 1,2-DCA poses serious health risks, and its toxicity, persistence and
potential for bioaccumulation (Squillace et al., 1999) has inspired a growing interest in technologies for
their removal (Baptista et al., 2006). Remediation of hydrocarbon contaminated soils is usually difficult,
due to a number of limiting factors such as inappropriate pH and moisture content, nutrient and oxygen
content and availability, and, importantly, bioavailability and bioaccessibility of the chemicals (Ehlers
and Luthy, 2003; Semple et al., 2004; 2003).
Metals are also routinely introduced into the environment through the discharge of toxic metal
wastes from defence-related activities, industry, and municipal waste disposal in landfill sites or by
accidental release (Stephen et al., 1998). These practices have resulted in surface contamination
problems, transport to groundwater, and/or bioaccumulation of radionuclides and toxic metals in soils
(Stephen et al., 1998). Heavy metals (HMs) include a range of metals and metalloids which are
commonly associated with pollution and toxicity, but also include elements (e.g., Zn, Cu and Ni) which
are essential for the metabolism of living organisms, albeit at low concentrations (Wong et al., 2005). All
heavy metals are known to be potentially toxic to soil microorganisms at high concentrations and can
hinder the biodegradation of organic contaminants (Amor et al., 2001; Bååth, 1989; Benka-Coker and
Ekundayo, 1998; Riis et al., 2002, Roane et al., 2001; Sokhn et al., 2001; White and Knowles, 2000;
2003). Thus, co-contaminated matrices represent a further problem in bioremediation processes (Said and
Lewis, 1991). Heavy metals appear to affect organic pollutant biodegradation through interference with
both the physiology and ecology of organic degrading microorganisms, thus imposing a double stress on
the microbial populations (Roane et al., 2001). Therefore, the presence of multiple contaminants may

48
present extreme challenges to the maintenance of a phylogenetically and functionally diverse microbial
community required for the degradation process.
Sites co-contaminated with organic and metal pollutants raise far more serious concerns as the
two components often causes a synergistic effect on cytotoxicity to microorganisms (Lin et al., 2006).
Previous studies assessing toxicity of heavy metals have typically relied on physiologically restrictive
processes such as, sulfate reduction, methanogenesis, [14C] glucose uptake, and [3H]thymidine
incorporation, all of which may not relate to organic chemical biodegradation rates (Said and Lewis,
1991). Therefore, the effects of metal toxicity on organic pollutant biodegradation in co-contaminated soil
environments have not been adequately defined quantitatively or qualitatively (Sandrin and Maier, 2003).
This is partly due to the fact that metals can exist in a range of different physical and chemical forms such
as colloidal solutions, soluble complexed species or organic solutes. Moreover, complications arise
because the physical and chemical state of metals is affected by environmental conditions such as pH and
ionic strength of the water phase, as well as soil properties including clay type and content, ion exchange
capacity, and organic matter content (Sandrin and Maier, 2003). Metal toxicity is most commonly
attributed to the tight binding of metal ions to sulfhydryl (-SH) groups of enzymes essential for microbial
metabolism (Sandrin and Maier, 2003). Pollutant biodegradation may be inhibited through interaction
with enzymes directly involved in biodegradation or those involved in general metabolism, thus rendering
the enzyme non-functional (Angel and Chaney, 1989).
The effects of metals on biodegradation processes have not been well-characterized, although
broad ranges of heavy metal concentrations have been reported to inhibit biodegradation. In addition,
different patterns of inhibition have also been reported (Kuo and Genthner, 1996; Roane and Pepper,
1997; Sandrin et al., 2000). Delaune et al. (1998) reported that chromium (0-5000 μg/g) and lead (0-2500
μg/g) had no effect on the biodegradation of petroleum hydrocarbons from clay sediments. Other studies
indicated that metals inhibited biodegradation specifically in a dose dependant manner; higher metal
concentrations inhibited biodegradation more than lower concentrations. For example, the rate of toluene
biodegradation by a Bacillus sp. was reduced by 55%, 61%, and 100% by 0.4, 0.8, and 1 mM nickel,
respectively (Amor et al., 2001). Furthermore, non-dose-dependent inhibitions in which higher metal
concentrations are less inhibitory than lower metal concentrations have also been reported (Chang et al.,
2004; Gonzalez-Gil et al., 1999, Kuo and Genthner, 1996; Said and Lewis, 1991). For example, Chang et
al. (2004) reported that the lag phase of Desulfovibrio vulgaris during sulfate respiration was 20 h shorter
when exposed to 1 mM copper than when exposed to 0.1 mM. The existence of different degrees and
patterns of inhibition may be due to lack of standardized protocols to characterize metal toxicity to the
microorganisms (Hoffman et al., 2005).

49
Approximately 40% of the hazardous waste sites currently on the NPL of the USEPA are co-
contaminated with organic and metal pollutants (Cheng, 2003; Fierens et al., 2003; Norena-Barroso et al.,
2004; Sandrin et al., 2000; Sandrin and Maier, 2003). Co-contaminated environments are considered
difficult to remediate because of the mixed nature of the contaminants and the fact that the two
components often must be treated differently (Roane et al., 2001). Therefore, the issue of co-
contamination is regarded as a serious one. Previous research efforts have focused extensively on the
biodegradation of 1,2-DCA in several contaminated soil and water environments (van den Wijngaard et
al., 1993), and several microorganisms have been characterized for their ability to metabolize 1,2-DCA
under various conditions (De Wildeman et al., 2003; He et al., 2003; Janssen et al., 1985; Maymo-Gatell
et al., 1999; Stucki and Leisinger, 1983). Furthermore, the toxic effects of heavy metals on soil
microorganisms have also been studied separately (Rajapaksha et al., 2004). Also, most of the knowledge
about the ecological effects of heavy metals on soil microorganisms is based on data collected for a few
metals such as Cu and Zn or on data collected from sewage sludge that contains a broad mixture of heavy
metals at relatively low concentrations for a relatively short period of time. Most studies incorporated
axenic cultures isolated from environmental samples and determined the effects of heavy metal toxicities
on these organisms in defined media (Said and Lewis, 1991). Such methods are limited in their
application to field situations, because very rarely, if ever, are conditions in the environment such that
only one microbial species is active nor are conditions in nature comparable with the conditions on
defined laboratory media. Since heavy metals and 1,2-DCA are found together in most co-contaminated
sites there is a need to evaluate the biodegradation profiles of 1,2-DCA in co-contaminated soil to
ascertain the effects of heavy metals on 1,2-DCA degradation. The objective of this study, therefore, was
to evaluate the aerobic biodegradation of 1,2-DCA by autochthonous microorganisms, in soil co-
contaminated with 1,2-DCA and heavy metals, via a direct and quantitative measure of the inhibitory
effects of the heavy metals in a microcosm setting. Four of the eight heavy metals of concern in the
USEPA's priority list of pollutants (Sandrin and Maier, 2003); arsenic, cadmium, mercury and lead were
used in this study. Effects of various metal concentrations and their combinations were evaluated based
on the following: (i) degradation rate constants; (ii) estimated minimal inhibitory concentrations (MICs);
(iii) concentrations that caused biodegradation half-life doublings (HLDs); and (iv) heavy metal
concentrations that caused a significant effect on biodegradation (> 10% increase in t½ of 1,2-DCA).

50
2.2 Materials and methods
2.2.1 Sample collection and handling
Clay and loam soils were collected from specific sites in the Westville area in Durban, KwaZulu-
Natal, to obtain a representative sample of the autochthonous microbial community living attached to the
sand grains. The soil samples were collected from the surface to a depth of about 0.4 m in an
approximately 2 m2 plot. These soils had no known history of chlorinated hydrocarbon contamination.
Thereafter, the soils were sieved using a 1.7 mm lab test sieve to obtain a homogeneous texture, and
stored at 4°C prior to use in the microcosm set-up (Olaniran et al., 2006).
2.2.2 Experimental design and microcosms set-up
Microcosms were set-up by artificially co-contaminating the soil sample with 1,2-DCA and
heavy metals to study the effects of four heavy metals, individually and in combination, on the
biodegradation of 1,2-DCA. Sixteen treatments were used in total, comprising positive and negative
controls, three concentrations of metals and eleven different combinations, with each treatment conducted
in triplicate. For the experiments, soil microcosms were constructed in a laminar flow cabinet using sterile
screw-capped 250 ml serum bottles (Wheaton). The synthetic groundwater was prepared as described by
Klier et al. (1999), and contained 1.5 mM MgCl2, 0.12 mM KCl, 0.03 mM NH4NO3, 1.0 mM CaCl2, 1.5
mM Ca(OH)2, and 8.5 mM NaHCO3, in de-ionized water at pH 7.8. The reaction mixtures were prepared
in the sterile bottles by combining 100 g of soil and 75 ml of synthetic groundwater. The heavy metals
were added as salts, i.e., As2O3 (> 99.0%, Fluka), CdCl2 (98%, Sigma), HgCl2 (99.6%, Sigma) and
Pb(NO3)2 (98%, Merck). Heavy metal concentrations used were based on the regulatory limit (RM)
stipulated by the Natural Resources Conservation Services (NRCS), United States Department of
Agriculture, Soil Quality-Urban Technical Note No. 3 (NRCS, 2000). Three levels of heavy metal
contamination were incorporated; RM was referred to as low concentration, 1.5 × RM the moderate
concentration and 2 × RM the high concentration. The eleven combinations were prepared using the
moderate concentration of heavy metals. The soils were mixed manually using a sterile glass rod to
distribute the heavy metals as homogeneously as possible. The headspace in each bottle was made up of
approximately 75 ml of air. An aerobic condition was maintained by purging the reaction mixture with
pure oxygen gas during the preparation, using a 0.2 µm filter. The microcosms were quickly sealed with
sterile Teflon-lined butyl-rubber stoppers immediately after spiking with 20 µl of 1,2-DCA [% purity
(GC) ≥ 99.5%, Merck]. In order to determine the initial concentration of 1,2-DCA, the bottles were
shaken for 2 h on a rotary shaker at 150 rpm at 25°C to allow for the equilibration of 1,2-DCA between
the gas and aqueous phases. Thereafter, the bottles were incubated at 25°C with no shaking for the course
of the experiment. Biological inhibited controls were prepared using soil samples which were autoclaved

51
four times prior to microcosms set-up at 121ºC and 120 kPa for 20 min, to measure abiotic losses of 1,2-
DCA. The microcosms were sampled every 5 days to measure 1,2-DCA degradation, as described below.
2.2.3 Analytical procedures
1,2-Dichloroethane is a volatile organic compound and equilibrium between its gas and liquid
concentrations is maintained through rapid mass transfer between the gas and aqueous phases. Changes in
liquid-phase concentration due to biological reactions are slow when compared to the mass transfer rate
between the gas and liquid phase (Lin et al., 2007). Therefore, gas-phase measurements closely reflect
liquid substrate concentrations for biodegradation experiments (Coleman et al., 2002). As such, 500 µl
headspace samples were periodically collected from each microcosm using a gas tight syringe (Hamilton)
and injected into a gas chromatograph (GC) (Varian model 3700) equipped with a flame ionization
detector. The samples were analyzed with the injector and flame ionization detector at 200 C and a
packed capillary column at 100 C. Ultra high purity nitrogen was used as the carrier gas at a flow rate of
10 ml/min. The 1,2-DCA concentrations were quantified by comparison with standard curves derived
from known quantities of the compounds in serum bottles with the same gas and liquid volumes as the
experimental bottles. The GC peak areas were substituted into the linear regression equation to obtain the
concentration of 1,2-DCA at the different sampling times.
2.2.4 Quantitative analysis
Pseudo-first-order transformation rate coefficients, k1, were calculated from plots of the natural
logarithm of substrate concentration versus time according to the integrated first-order rate equation:
ln (Ct/C0) = -k1 . t
where C0 and Ct are the concentrations at time 0 and t, respectively (Said and Lewis, 1991). Percentage
reductions in microbial degradation rate coefficients were calculated on the basis of comparisons with
control clay and loam samples (unamended with the metal salts) as follows.
% Reduction in k1 = [(control k1 - treatment k1)/control kl] × 100 (Said and Lewis, 1991).
Half-lives were calculated as 0.693/k1. The metal concentrations at which a doubling in 1,2-DCA
degradation half-lives (t½) occurred were calculated from linear regressions of the percentages of
reductions in k1 versus logarithms of metal salt concentrations, i.e., a 50% reduction in k1 equaled one
doubling of t½. These values were referred to as half-life doubling concentrations (HLDs). Minimal
inhibitory concentrations (MICs) were determined from abscissa intercepts of plots of percent reduction
in pseudo-first-order rate coefficients versus logarithmic concentrations (mg/kg) of metals (Said and
Lewis, 1991).

52
2.2.5 Soil analysis
2.2.5.1 Moisture content
The moisture content was determined by drying a known quantity of the soil samples at 70ºC for
72 h, until a constant weight was obtained. The difference between the initial and final dry weight of the
soil gave the moisture content of the soil (Olaniran et al., 2009).
2.2.5.2 pH
Ten grams of soil sample were added to 25 ml of distilled water in one beaker, while another 10 g
of soil sample was added to 25 ml of 0.01 M calcium chloride in a separate beaker. Both were stirred for
one minute and left to stand for one hour (Black et al., 1965). The pH of the soil samples was determined
using a Beckman 50 pH meter.
2.2.5.3 Nutrients
Soil samples were analyzed for calcium, magnesium, sodium, potassium, iron, nitrate, sulphate,
soluble organic carbon, phosphate and total Kjeldhal nitrogen at Umgeni Water Laboratory Services using
standard methods.
2.3 Results
2.3.1 Soil characterization
The physico-chemical properties of both clay and loam soil samples used for the microcosm
experiments are shown in Table 2.1. The pH of the two soil samples was slightly acidic and ranged from
6.10 to 6.59, while the moisture content of the clay soil was found to be about 20% higher than that of the
loam soil. Soluble nitrate was estimated to be approximately < 0.5 μg/g in both clay and loam soil
samples. Calcium concentration was found to be about 22.41%, soluble organic carbon about 34.23%,
iron about seven-hundred and ninety-eight-fold, phosphate about two-fold and sulphate about fifteen-fold
higher in loam soil than in clay soil. However, magnesium concentration was found to be about 78.35%,
sodium about 40%, potassium about two-fold and Total Kjeldahl nitrogen concentration about nineteen-
fold higher in clay soil than in loam soil.

53
Table 2.1: Physico-chemical properties of the soil samples.
Determinant Clay soil Loam soil
Calcium (μg/g)
Magnesium (μg/g)
Sodium (μg/g)
Potassium (μg/g)
Iron (μg/g)
Nitrate (soluble) (μg/g)
Phosphate (mg/g)
Sulphate (soluble) (μg/g)
Soluble organic carbon (μg/g)
Total Kjeldahl nitrogen (μg/g)
pH
Moisture content (%)
6047
2035
273
1510
< 3.88
< 0.5
647.2
83.9
1110
115
6.10
17.05
7402
1141
< 195
662
3097
< 0.5
1400
1225
1490
2125
6.59
14.20
2.3.2 Impact of different concentrations of heavy metals on 1,2-DCA biodegradation in
soil
The biodegradation profiles of 1,2-DCA in both contaminated soil types, in the presence and
absence of heavy metals, are illustrated in Figure 2.1. 1,2-Dichloroethane was observed to be readily
degraded in both contaminated soil samples with up to 66.05% degradation (above that of the autoclaved
soil) observed in loam soil after 20 days in the absence of heavy metals (Figure 2.1b), which is, about
17.60% more than the degradation observed in clay soil (Figure 2.1a), at the same period. The
degradation rate constants of 1,2-DCA, as indicated in Table 2.2, ranged between 0.049 – 0.078 day-1 in
clay soil and between 0.074 – 0.114 day-1 in loam soil. In all cases, except for soil co-contaminated with
1,2-DCA and 420 mg/kg Pb2+, higher degradation rate constants were observed in loam soil compared to
the clay soil. Furthermore, a decline in 1,2-DCA degradation rate constant was observed from the lower
to the higher concentration of each of the heavy metals in clay soil. However, this trend was observed
only in the presence Hg2+ in loam soil. The presence of heavy metals was observed to have a negative
impact on the biodegradation of 1,2-DCA, with the toxic effect being more pronounced in loam soil for
all heavy metal concentrations except for mercury, after 15 days. An increased reduction in 1,2-DCA
degradation was observed with increasing concentration of the heavy metals. In clay soil, 11.88%, 5.50%,
6.62% and 5.46% decrease in 1,2-DCA degradation occurred in the presence of 150 mg/kg As3+, 170
mg/kg Cd2+, 1680 mg/kg Hg2+ and 840 mg/kg Pb2+, respectively, compared to the lower concentration of

54
75 mg/kg As3+, 85 mg/kg Cd2+, 840 mg/kg Hg2+ and 420 mg/kg Pb2+. Similarly, in loam soil the same
trend was observed. For example, a 24.38% reduction in 1,2-DCA degradation was observed in the
presence of 150 mg/kg As3+ after 15 days, while a 23.28% reduction occurred at 75 mg/kg As3+
concentration. Thus, inhibitory effects increased with increasingly higher concentrations of the metal
salts.

55
Figure 2.1: Biodegradation profiles of 1,2-DCA in (a) clay soil and (b) loam soil co-contaminated with various concentrations of heavy metals. A = autoclaved soil control + 1,2-DCA; B = unautoclaved soil control + 1,2-DCA; C = soil + 1,2-DCA + 75 mg/kg As3+; D = soil + 1,2-DCA + 150 mg/kg As3+; E = soil + 1,2-DCA + 85 mg/kg Cd2+; F = soil + 1,2-DCA + 170 mg/kg Cd2+; G = soil + 1,2-DCA + 840 mg/kg Hg2+; H = soil + 1,2-DCA + 1680 mg/kg Hg2+; I = soil + 1,2-DCA + 420 mg/kg Pb2+; J = soil + 1,2-DCA + 840 mg/kg Pb2+. Bars indicate the average of triplicate samples while the error bars show the standard deviation.
0102030405060708090
100
A B C D E F G H I J
1,2-
DC
A d
egra
datio
n (%
)
Treatment
aDay 5 Day 10 Day 15 Day 20
0102030405060708090
100
A B C D E F G H I J
1,2-
DC
A d
egra
datio
n (%
)
Treatment
bDay 5 Day 10 Day 15 Day 20

56
Table 2.2: Biodegradation rate constants (day-1) of 1,2-DCA in soil microcosms co-contaminated with different concentrations of heavy metals.
Treatment Clay soil Loam soil
Autoclaved soil control
Unautoclaved soil control
As3+ (75 mg/kg)
As3+ (112.5 mg/kg)
As3+ (150 mg/kg)
Cd2+ (85 mg/kg)
Cd2+ (127.5 mg/kg)
Cd2+ (170 mg/kg)
Hg2+ (840 mg/kg)
Hg2+ (1260 mg/kg)
Hg2+ (1680 mg/kg)
Pb2+ (420 mg/kg)
Pb2+ (630 mg/kg)
Pb2+ (840 mg/kg)
0.015 ± 0.004
0.076 ± 0.000
0.066 ± 0.009
0.065 ± 0.018
0.053 ± 0.015
0.070 ± 0.011
0.071 ± 0.013
0.056 ± 0.009
0.069 ± 0.006
0.056 ± 0.007
0.049 ± 0.011
0.078 ± 0.010
0.072 ± 0.020
0.069 ± 0.006
0.014 ± 0.003
0.114 ± 0.013
0.075 ± 0.003
0.081 ± 0.009
0.076 ± 0.002
0.075 ± 0.005
0.082 ± 0.007
0.075 ± 0.001
0.075 ± 0.007
0.074 ± 0.007
0.074 ± 0.005
0.077 ± 0.006
0.100 ± 0.027
0.086 ± 0.005

57
2.3.3 Kinetics of 1,2-DCA degradation in the presence of heavy metals
The effects of the different concentrations of the heavy metals on the half-lives (t½) of 1,2-DCA
are represented in Table 2.3. The relative t½ in clay soil ranged from 0.99 – 1.63 days, whereas in loam
soil it ranged from 1.17 – 1.53 days in the presence of the different concentrations of the heavy metals.
Generally, more than 127.5 mg/kg Cd2+, 840 mg/kg Hg2+ and 420 mg/kg of Pb2+ was able to cause > 10%
increase in the t½ of 1,2-DCA in clay soil, while less than 75 mg/kg was required for As3+. In clay soil,
Cd2+ at 127.5 mg/kg resulted in an 8.66% increase in the t½ of 1,2-DCA, whereas the t½ was increased by
38.50% in loam soil, at the same concentration, indicating a much more pronounced effect of Cd2+ in
loam soil compared to clay soil. Similarly, the presence of 75 mg/kg As3+, 840 mg/kg Hg2+ and 420
mg/kg Pb2+ resulted in 34.24%, 40.64% and 45.94% increase in the t½ of 1,2-DCA, respectively, in loam
soil compared to clay soil. Therefore, t½ determinations indicated that various metals caused different
levels of inhibitory effects on biodegradation rates depending on the metal and soil type. By using these
criteria as a measure of significant effects, indigenous microorganisms in loam soil were more sensitive to
heavy metals than in clay soil samples. Since a non-linear response for higher metal concentrations was
observed in loam soil, percentage decreases in k1 values plotted as a function of the logarithms of metal
concentrations could not be subjected to linear regression analysis to estimate the MICs and HLDs.
However, in clay soil, a dose-dependant relationship between k1 and metal ion concentrations in which k1
decreased with higher initial metal concentrations was observed for all the heavy metals tested except
Hg2+ (Figure 2.2). When percentage decreases in k1 were plotted as a function of the logarithms of metal
concentrations, a linear relationship was obtained for a range of the metal concentrations tested in clay
soil. Because HLDs were not within the linear range of observed inhibition levels, non-linear regression
analysis of the data was carried out in this study. Percentage decreases in k1 values plotted as a function of
the logarithms of metal concentrations were subjected to linear regression analysis to estimate HLDs and
MICs and to compare correlation (r) and regression coefficients (slopes) and the data summarized in
Table 2.4. The MIC was lowest for As3+ (62.78 mg/kg) and highest for Hg2+ (665.73 mg/kg). In clay soil,
MICs were below the stipulated regulatory limit for all of the heavy metals except for Pb2+. The MICs
varied according to the metals tested, and did not necessarily follow the toxicity patterns observed for the
metal concentrations required for significant effects on t½. Moreover, biodegradation rates were very
sensitive to increases in the concentration of some heavy metals.

58
Table 2.3: Effects of heavy metals on the half-lives of 1,2-DCA in the soil samples.
Metal iona, soil type, and metal concn.
(mg/kg)
t½ (days) (Average ± SD) Relative t½
b Untreated soil Treated soil
Clay 9.12 As3+ 75 10.58 ± 1.42 1.16 112.5 11.18 ± 2.77 1.23 150 13.61 ± 3.38 1.49 Cd2+ 85c 10.01 ± 1.58 1.10 127.5c 9.91 ± 1.61 1.09 170 12.52 ± 2.07 1.37 Hg2+ 840 10.04 ± 0.83 1.10 1260 12.45 ± 1.74 1.37 1680 14.84 ± 3.88 1.63 Pb2+ 420c 9.04 ± 1.29 0.99 630 10.21 ± 2.92 1.12 840 10.04 ± 0.83 1.10 Loam 6.13 ± 0.67 As3+ 75 9.21 ± 0.38 1.50 112.5 8.62 ± 0.88 1.41 150 9.16 ± 0.19 1.49 Cd2+ 85 9.27 ± 0.63 1.51 127.5 8.49 ± 0.76 1.38 170 9.24 ± 0.12 1.51 Hg2+ 840 9.24 ± 0.80 1.51 1260 9.39 ± 0.98 1.53 1680 9.35 ± 0.56 1.53 Pb2+ 420 9.00 ± 0.78 1.47 630 7.20 ± 1.66 1.17 840 8.11 ± 0.47 1.32
a As3+ added as an oxide salt; Pb2+ added as nitrate salt; Cd2+ and Hg2+ added as the chloride salts. b Value for metal-treated soil divided by value for untreated soil. c Did not cause >10% increase in t½.

59
Figure 2.2: Inhibitory effects of (a) As3+, (b) Cd2+, (c) Hg2+ and (d) Pb2+ on pseudo-first-order 1,2-DCA
biodegradation rates in clay soil. The slopes of regression lines of the natural logarithms of 1,2-DCA concentration versus time equal the rate coefficients, k1. Treatments shown are: ( ) Unautoclaved soil control, ( ) Low concentration of HM, ( ) Moderate concentration of HM and ( X ) High concentration of HM.
0.0
0.5
1.0
1.5
2.0
2.5
3.0
0 5 10 15 20 25 30
a
0.0
0.5
1.0
1.5
2.0
2.5
3.0
0 5 10 15 20 25 30
b
0.0
0.5
1.0
1.5
2.0
2.5
3.0
0 5 10 15 20 25 30
c
0.0
0.5
1.0
1.5
2.0
2.5
3.0
0 5 10 15 20 25 30
d
Ln
1,2-
DC
A (μ
l/100
g c
lay
soil)
Time (days)

60
Table 2.4: Concentrations of heavy metals inhibiting 1,2-DCA biodegradation in clay soil.
Metal iona Correlation coefficient
(r) Slope MICb (mg/kg)
Average ± SD HLDc (mg/kg) Average ± SD
As3+
0.91
72.81
62.78 ± 10.91
305.14 ± 2.48
Cd2+ 0.98 60.28 65.54 ± 39.86 442.59 ± 35.83 Hg2+ 0.10 90.78 665.73 ± 132.39 2,366.46 ± 618.19 Pb2+ 0.98 36.97 469.79 ± 167.33 10,575.48 ± 521.81
a As3+ added as an oxide salt; Pb2+ added as nitrate salt; Cd2+ and Hg2+ added as the chloride salts. b MICs caused no reduction in k1 values. Numerically, these are abscissa intercepts. c HLD, concentration that caused half-life doubling.
2.3.4 Impact of different combinations of heavy metals on 1,2-DCA biodegradation in soil
The patterns of biodegradation of 1,2-DCA in both soil types, co-contaminated with different
combinations of heavy metals, are illustrated in Figures 2.3 and 2.4. The degradation rate constants of
1,2-DCA, as indicated in Table 2.5, ranged between 0.045 – 0.115 day-1 in clay soil and between 0.050 –
0.078 day-1 in loam soil, in the presence of the different combinations of heavy metals. In clay soil,
combinations of As3+ + Hg2+ and As3+ + Cd2+ were observed to be the most toxic, resulting in 32.46% and
21.14% decrease in 1,2-DCA degradation after 15 days, respectively (Figure 2.3a). However, in loam soil
the combinations of As3+ + Pb2+ and As3+ + Hg2+ resulted in the greatest reduction in 1,2-DCA
degradation with 21.90% and 15.50% decrease, respectively, observed over the same time period (Figure
2.3b). Furthermore, an increase of 21.08% and 14.50% in 1,2-DCA degradation was observed for As3+ +
Cd2+ + Hg2+ and As3+ + Hg2++Pb2+, respectively, compared to As3+ + Hg2+, in clay soil. A similar trend
occurred in loam soil with the combination of As3+ + Pb2+, where a corresponding increase of 11.45% and
13.74% was observed for As3+ + Cd2+ + Pb2+ and As3+ + Hg2+ + Pb2+. In addition, the effect of the
combination of four heavy metals in both clay and loam soils were less pronounced than the combinations
of two heavy metals which resulted in the most significant decreases in 1,2-DCA degradation. In clay
soil, the combination of four heavy metals resulted in a 28.66% increase in 1,2-DCA degradation
compared to the combination of As3+ + Hg2+. The same trend was observed in loam soil whereby an
11.84% increase in 1,2-DCA degradation was observed in the presence of four heavy metals compared to
the combination of As3+ + Pb2+. Moreover, the combination of four heavy metals in loam soil resulted in
6.26% less degradation of 1,2-DCA compared to clay soil, after 15 days.

61
Figure 2.3: Biodegradation profiles of 1,2-DCA in (a) clay and (b) loam soil co-contaminated with binary
combinations of heavy metals (As3+ = 112.5 mg/kg, Cd2+ = 127.5 mg/kg, Hg2+ = 1260 mg/kg, and Pb2+ = 630 mg/kg). A = autoclaved soil control + 1,2-DCA; B = unautoclaved soil control + 1,2-DCA; C = soil + 1,2-DCA + As3+ + Cd2+; D = soil + 1,2-DCA + As3+ + Hg2+; E = soil + 1,2-DCA + As3+ + Pb2+; F = soil + 1,2-DCA + Cd2+ + Hg2+; G = soil + 1,2-DCA + Cd2+ + Pb2+; H = soil + 1,2-DCA + Hg2+ + Pb2+. Bars indicate the average of triplicate samples while the error bars show the standard deviation.
0102030405060708090
100
A B C D E F G H
1,2-
DC
A d
egra
datio
n (%
)
Treatment
aDay 5 Day 10 Day 15 Day 20
0102030405060708090
100
A B C D E F G H
1,2-
DC
A d
egra
datio
n (%
)
Treatment
bDay 5 Day 10 Day 15 Day 20

62
Figure 2.4: Biodegradation profiles of 1,2-DCA in (a) clay and (b) loam soil co-contaminated with
combinations of three and four heavy metals (As3+ = 112.5 mg/kg, Cd2+ = 127.5 mg/kg, Hg2+ = 1260 mg/kg, and Pb2+ = 630 mg/kg). A = autoclaved soil control + 1,2-DCA; B = unautoclaved soil control +1,2-DCA; C = soil + 1,2-DCA + As3+ + Cd2+ + Hg2+; D = soil + 1,2-DCA + As3+ + Cd2+ + Pb2+; E = soil + 1,2-DCA + As3+ + Hg2+ + Pb2+; F = soil + 1,2-DCA + Cd2+ + Hg2+ + Pb2+; G = soil + 1,2-DCA + As3+ + Cd2+ + Hg2+ + Pb2+. Bars indicate the average of triplicate samples while the error bars show the standard deviation.
0102030405060708090
100
A B C D E F G
1,2-
DC
A d
egra
datio
n (%
)
Treatment
aDay 5 Day 10 Day 15 Day 20
0102030405060708090
100
A B C D E F G
1,2-
DC
A d
egra
datio
n (%
)
Treatment
bDay 5 Day 10 Day 15 Day 20

63
Table 2.5: Biodegradation rate constants (day-1) of 1,2-DCA in soil microcosms co-contaminated with different combinations of heavy metals.
Treatment Clay soil Loam soil Autoclaved soil
Unautoclaved soil
As3+ + Cd2+
As3+ + Hg2+
As3+ + Pb2+
Cd2+ + Hg2+
Cd2+ + Pb2+
Hg2+ + Pb2+
As3+ + Cd2+ + Hg2+
As3+ + Cd2+ + Pb2+
As3+ + Hg2+ + Pb2+
Cd2+ + Hg2+ + Pb2+
As3+ + Cd2+ + Hg2+ + Pb2+
0.015 ± 0.004
0.076 ± 0.000
0.057 ± 0.010
0.045 ± 0.005
0.059 ± 0.018
0.070 ± 0.013
0.080 ± 0.012
0.072 ± 0.006
0.069 ± 0.013
0.069 ± 0.006
0.062 ± 0.005
0.088 ± 0.036
0.115 ± 0.046
0.014 ± 0.003
0.114 ± 0.013
0.073 ± 0.005
0.059 ± 0.016
0.050 ± 0.002
0.071 ± 0.003
0.077 ± 0.002
0.075 ± 0.005
0.066 ± 0.025
0.057 ± 0.006
0.074 ± 0.005
0.078 ± 0.012
0.069 ± 0.003
As3+ = 112.5 mg/kg; Cd2+ = 127.5 mg/kg, Hg2+ = 1260 mg/kg, and Pb2+ = 630 mg/kg.
2.4 Discussion
Microcosms were constructed to gain a better understanding of the effects of heavy metals on the
aerobic biodegradation of 1,2-DCA by indigenous microorganisms in clay and loam soil samples. The
results obtained indicate that 1,2-DCA was readily degraded by indigenous microbial populations in both
soil types without heavy metal contamination, with loam soil exhibiting greater degradation than clay
soil. The presence of As3+, Cd2+, Hg2+ and Pb2+ was observed to have adverse effects on the
biodegradation of 1,2-DCA in both soil samples. Metals exert their toxic effects on microorganisms via
different mechanisms, including substitution of toxic metal ions for physiologically essential ions within
an enzyme, thus rendering the enzyme non-functional (Nies, 1999); and imposition of oxidative stress on
microorganisms (Kachur et al., 1998). Furthermore, heavy metal ions are able to form unspecific complex
compounds in microbial cells, resulting in inhibitory toxic effects on microbial activities (Roane et al.,
2001). Thus, co-contamination with metal ions may inhibit microorganisms involved in the degradation
of organic compounds and consequently affect biodegradation rates (Amor et al., 2001; Hattori, 1992).
The level of inhibition, by heavy metals, depends on the concentration and availability of the heavy metal
and the action of complex processes controlled by several factors, including the nature of metals, and
indigenous microbial species (Chen and Lin, 2001). When considering inhibition data, it is also important
to take into account the possible effects of various environmental factors such as nutrient availability,

64
oxygen, pH, temperature, water retention, quantity and bioavailability of contaminants, salinity, and soil
properties (Margesin et al., 2000; Olaniran et al., 2006; Said and Lewis, 1991). Since such confounding
factors often manifested in contaminated sites, it is essential to understand the influence they have on
contaminant removal and partitioning with respect to assessing bioremediation potential (Hickman et al.,
2008). Interestingly, it was observed that the degradation rates were higher in loam soil, compared to clay
soil, in the absence of heavy metals. This could be attributed to the higher concentrations of inorganic
trace elements (e.g., nitrogen, iron and calcium) in loam soil, as increased levels of trace elements have
been demonstrated to enhance biodegradation rates in both marine and terrestrial ecosystems considerably
(Atlas and Bartha, 1992). Clay has been shown to decrease metal bioavailability and toxicity to bacteria
(Boenigk et al., 2005), due to the high cation exchange capacity and adsorption of the metals to the clay
particles causing uneven distribution of the heavy metals within the soil matrix. It is therefore not
surprising that the presence of the heavy metals in clay soil has a lesser impact on the biodegradation of
1,2-DCA.
In this study, all the heavy metals tested had an inhibitory effect on 1,2-DCA degradation in both
soil types, with mercury found to have the highest inhibitory effect in clay soil, and arsenic in loam soil.
Mercury is well known to have no beneficial function in biological processes and it is the heavy metal
with the strongest toxicity due to the strong affinity of Hg2+ to thiol groups (Nies, 1999). Hong et al.
(2007) reported that the growth of Sphingomonas wittichi RW1 and the degradation of dibenzofuran were
strongly inhibited by 1 mg/L of mercury. The biodegradation of 2,4-dichloro-phenoxyacetic acid methyl
ester in two microbial samples, namely, sediment and aufwuchs, from lakewater was inhibited in the
presence of Hg and Cd (Said and Lewis, 1991). Mercury in the ionic form (Hg2+) was most toxic in
aufwuch samples, with a MIC of 0.002 mg total mercury/L. Van Zwieten et al. (2003) reported that the
natural breakdown of 1,1,1-trichloro-2,2-bis (4-chlorophenyl) ethane (DDT) was inhibited in arsenic co-
contaminated soil resulting in an increased persistence of DDT in the soil environment studied. The
intrinsic breakdown of DDT to 1,1-dichloro-2,2-bis (4-chlorophenyl) ethane (DDD) in the presence of
2000 mg/kg arsenic resulted in a 50% reduction in the concentration of DDD compared to background
arsenic of 5 mg/kg. Thus, it was demonstrated that arsenic co-contamination has an inhibitory effect on
the breakdown of DDT via DDD, and that, as arsenic concentrations increases, the DDT:DDD and
DDT:1,1-dichloro-2,2-bis (4-chlorophenyl) ethylene (DDE) ratios also increased. Furthermore, Roane et
al. (2001), reported that degradation by Ralstonia eutropha JMP134, a cadmium-sensitive 2,4-
dichlorophenoxyacetic acid (2,4-D)-degrader, occurred in the presence of up to 24 mg/L cadmium in
mineral salts medium containing cadmium-resistant isolate and 60 mg/kg cadmium in amended soil
microcosms. Experiments also indicated that 104 colony forming units of Ralstonia eutropha JMP134/ml
alone in the presence of > 3 mg/L cadmium in mineral salts medium did not degrade 2,4-D due to
cadmium toxicity.

65
A non-linear response for higher metal concentrations was observed for mercury and lead in clay
and loam soil, respectively, after 20 days. This could be due to the non-availability of these metals in the
soil matrix at high concentrations as they can either exist in precipitates, bound to the soil matrix (by
adsorption or cation exchange) (Riis et al., 2002), or are masked by organic or inorganic materials in the
soil sample (Konopka et al., 1999). This corroborates the findings of Baldrian et al. (2000), who found no
inhibitory effect on polycyclic aromatic hydrocarbon degradation in soil containing 10-100 mg/kg Cd or
Hg. Furthermore, some studies have shown that low concentrations of metals increasingly inhibit activity
until a maximum level of inhibition is reached, and thereafter, metal toxicity decreases with increasing
metal concentration (Said and Lewis, 1991). Roane and Pepper (1997) reported that populations of 2,4-D
degraders in cadmium-contaminated soil were more resistant to cadmium toxicity at a higher
concentration (40 mg total cadmium/L) than at a lower concentration (20 mg total cadmium/L). These
responses to heavy metals may be explained by microbial community dynamics wherein high metal
concentrations create selective pressure for metal-resistant, organic-degrading microorganisms. This
selective pressure might have reduced competition from metal-sensitive, non-degrading microorganisms,
thus increasing biodegradation at higher metal concentrations (Sandrin and Maier, 2003). The
combinations of metals also resulted in non-linear responses, whereby combinations of two heavy metals
resulted in a greater negative impact on 1,2-DCA degradation compared to the combinations of three or
four heavy metals. A similar trend was observed by Benka-Coker and Ekundayo (1998) who reported that
the toxicity of 0.5 mg total zinc/L on crude oil biodegradation was reduced by addition of 0.5 mg total
copper, lead, and manganese/L.
In both clay and loam soil, lead (840 mg/kg) had the least inhibitory effect on 1,2-DCA
degradation, thus confirming that Pb2+ has a less adverse effect on biodegradation processes. Lead is also
a heavy metal toxic to a range of microorganisms, and is one of the most ubiquitous pollutants; released
from chemical industry and various other inventories (Nies, 1999). However, owing to its low solubility,
(especially as lead phosphate) its biologically available concentration is low (Hughes and Poole, 1991).
This could be a possible reason for lower toxicity of Pb2+ to indigenous bacteria, since both soils
contained high concentrations of phosphate. This is in agreement with other recent studies which showed
that dibenzofuran degradation by S. wittichii RW1 remained unaffected even at a relatively high
concentration of lead in the phosphate buffered condition (Hong et al., 2007). Moreover, Shi et al. (2002)
reported that much larger inputs of Pb were required to inhibit microbial activity in soil than that found
when microbes were removed from soil particles. Approximately 10,000 mg of Pb per kg of soil was
required to reduce 14CO2 production by a factor of 2 in soil, whereas only about 400 mg of Pb per kg of
soil could reduce microbial activity by 50% in a suspension of bacteria. This tallies with the results
obtained in this study as the concentration of Pb2+, approximately 10,575.48 mg/kg, caused a HLD of 1,2-
DCA degradation in clay soil.

66
In summary, it can be inferred that the rate of 1,2-DCA biodegradation in co-contaminated soils was
retarded by the presence of As3+, Cd2+, Hg2+, and Pb2+, and that the level of inhibition is dependent on soil
types and their nutritional composition. Based on the MICs, As3+ and Cd2+ were the most toxic to
indigenous soil microorganisms. Therefore, these two heavy metals were used to establish effective
strategies in abating the toxic effects of heavy metals on 1,2-DCA degradation in such co-contaminated
soils and results are presented in Chapter Three. However, reporting bioavailable metal concentrations to
characterize metal inhibition represents a key step in standardizing methods to quantify metal impacts on
biodegradation. Thus, relating inhibition results to dissociated metal concentrations may be needed for
enhanced correlations of metal concentrations with toxicity effects.

CHAPTER THREE ENHANCED BIODEGRADATION OF 1,2-
DICHLOROETHANE IN SOIL CO-CONTAMINATED
WITH HEAVY METALS UNDER DIFFERENT
BIOREMEDIATION STRATEGIES

67
3.1 Introduction
Advances in science and technology have resulted in the exploitation of natural resources by
humans to a great extent, generating unprecedented disturbances in the natural global environment (Lin et
al., 2006). In many countries, attempts are underway to control the release of contaminants (Schnoor et
al., 1995) and to accelerate the removal or breakdown of existing contaminants by appropriate
remediation techniques, since accumulation of pollutants is of concern for both human and ecosystem
exposures. In particular, the clean-up of soil co-contaminated with both chlorinated aliphatic
hydrocarbons and heavy metals (HMs) is a contemporary subject of remediation efforts considering the
fact that most of the current techniques are directed towards the removal of a specific group of
contaminants (Ehsan et al., 2007). Bioremediation, the use of biological activity for remediation, is one
such highly appealing technology (Farhadian et al., 2008; Volpe et al., 2009; Widada et al., 2002), and
some promising results suggest that these techniques might become feasible alternatives to mechanical
and chemical approaches in remediating soils co-contaminated with chlorinated organics and heavy
metals (Mulligan et al., 2001b; Romantschuk et al., 2000; Singh et al., 2008; Watanabe, 2001).
Indigenous microorganisms with natural degradation potentials are widely distributed in soil
media; therefore the activation of the degradation potentials of these organisms is currently the challenge
facing the implementation of bioremediation strategies, in addition to the fact that these microbes are
usually present in very small numbers (Alexander, 1999). Moreover, autochthonous microorganisms
capable of degrading specific organic contaminants often needs to be induced and the presence of heavy
metals often inhibits the biodegradation processes in co-contaminated matrices (Alisi et al., 2009).
Biostimulation and/or bioaugmentation are such technologies which offer possible ways to overcome
these limitations. Biostimulation involves the alteration of physico-chemical parameters to stimulate the
growth of indigenous degraders by the addition of nutrients or other growth-limiting co-substrates. In
particular, the presence of dissolved oxygen and nutrients, such as nitrate and phosphate, is essential (Li
et al., 2007). Previous studies have demonstrated that nitrogen concentrations ranging from 2.0 to 10.0
mg/L are sufficient for near-maximum growth of hydrocarbon-degrading microorganisms (Boufadel et
al., 1999; Wrenn et al., 2006). On the other hand, bioaugmentation offers to provide specific microbes, a
known degrader and/or heavy metal-resistant bacteria, in sufficient numbers to supplement the existing
indigenous microbial population. A review by Gentry et al. (2004) provides an extensive survey of new
bioaugmentation strategies. However, due to the site-specific characteristics of remediation technologies,
numerous research efforts have come to heterogeneous results regarding the most feasible approach in
enhancing the degradation of chlorinated organic pollutants in co-contaminated environments. More
recently, bioaugmentation of contaminated sites using microorganisms pre-selected from their own
environment showed great promise, as these microbes are more likely to survive and propagate when re-
introduced into the site (Alisi et al., 2009; Bento et al., 2003).

68
Soil enzymatic activities have been recognized as sensitive indicators of any natural and
anthropogenic disturbance (Hinojosa et al., 2004). Moreover, soil enzyme assays have been considered as
one of the easiest and cheapest techniques used to integrate information concerning microbiological
community status in contaminated environments (Baum et al., 2003; Shen et al., 2005). In particular, the
dehydrogenase and urease enzyme assays have been established and recognized as a reliable indicator of
the overall measure of the intensity of microbial metabolism, in soils contaminated with both organic and
inorganic contaminants (Mathew and Obbard 2001; Rossel et al., 1997; Shen et al., 2005; von Mersi and
Schinner 1991). Dehydrogenases are intracellular enzymes of the parent microbial cell, and could provide
an indication of the oxidative potential of a soil which in turn provides a good overall indication of
microbial activity (Gianfreda et al., 2005; Obbard, 2001; Trasar-Cepeda et al., 2000). Although the origin
of ureases is also microbial, its activity is extracellular (Bremner and Mulvaney, 1978). Soil microbial
activity and its products, such as intra and/or extracellular enzymes, have shown considerable differences
associated with their sensitivity to heavy metal toxicity (Giller et al., 1998). Nannipieri et al. (1990)
suggested that the simultaneous assessment of various enzymes in soil may be more valid than that of a
single enzyme to evaluate overall microbial activity and its response to environmental stress. However, a
few studies have focused on the combined effects of organic and inorganic pollutants on soil enzymes
(Irha et al., 2003; Maliszewska-Kordybach and Smreczak, 2003). In addition, investigating the link
between soil enzymatic activities and microbial community structure changes using advanced molecular
biological techniques is necessary in order to provide a proper understanding of microbial dynamics in the
co-contaminated soil environment (Trasar-Cepeda et al., 2000). Polymerase chain reaction-denaturing
gradient gel electrophoresis (PCR-DGGE) has recently received much attention in assessing changes in
soil microbial community structure (Demanou et al., 2006; He et al., 2005; Li et al., 2006; Ros et al.,
2008; Shi et al., 2005). This technique is based on the decreased electrophoretic mobility of a partially
melted double stranded DNA molecule in polyacrylamide gels containing a linear gradient of DNA
denaturants (a mixture of urea and formamide) (Muyzer and Smalla, 1998). DGGE of PCR amplified 16S
rDNA fragments are used to profile microbial community complexity and changes in response to
environmental stresses (Li et al., 2006; Mette and Neils, 2002).
Accordingly, the present study investigated the effects of biostimulation and bioaugmentation on
the aerobic biodegradation of 1,2-DCA in soil co-contaminated with As3+ and Cd2+ in a soil microcosm
setting. Furthermore, the structural diversity of bacterial communities in such treated soils was assessed
by analyzing the 16S rDNA fingerprints, resolved by DGGE. In addition, the functional status of the
microbial community was investigated by measuring the soil microbial urease and dehydrogenase
activities.

69
3.2 Materials and methods
3.2.1 Enrichment cultures and isolation of heavy metal-resistant bacteria
One gram of co-contaminated loam soil sample was added to a 1000 ml flask containing 200 ml
of a culture medium, comprising; 2.5 g of D-glucose (Merck, Saarchem), 2.5 g of yeast extract (Merck,
Biolab) and 5 g tryptone (Difco), per litre of double-distilled water (Pepi et al., 2007). Stock solutions of
arsenic oxide (As3+) (> 99.0%, Fluka) and cadmium chloride (Cd2+) (98%, Sigma) were added separately
to each flask to obtain a final concentration of 300 mg/kg and 340 mg/kg, respectively. Control flasks
containing the heavy metals with no inoculum were also included. Flasks were mixed and incubated at
30°C, without shaking, in the dark. After two weeks of incubation, cultures showing turbidity were
subcultured by streaking onto agar plates containing the same enrichment culture medium but solidified
with 1.6% of agar (Bacto-Agar, Difco), and amended with increasing concentrations of As3+ and Cd2+
(ranging from 75 mg/kg up to 340 mg/kg) to determine the minimal inhibitory concentration (MIC) of the
heavy metal-resistant microorganisms. The inoculated culture media plates were incubated at 30°C for
72 h. MIC was defined as the lowest concentration of the heavy metals that causes the total growth
inhibition of the organisms. In order to discriminate among resistant and sensitive strains, a reference
heavy metal sensitive Escherichia coli strain was used. Colonies different in colour, shape, and margins
appearing on inoculated plates were 4-way streak purified on the same culture medium, in the presence of
the same concentrations of heavy metals, and used for dual-bioaugmentation studies.
3.2.2 Bacterial cultures
Bioaugmentation was performed using Xanthobacter autotrophicus GJ10, a well-known
1,2-DCA degrader, and a native heavy metal-resistant strain (selected as described above). The bacterial
strain, Xanthobacter autotrophicus GJ10, was obtained from the culture collection of the Department of
Microbiology, University of KwaZulu-Natal (Westville), and thereafter preserved on nutrient agar
(Merck, Biolab) plates at 4 C as a working stock culture.
3.2.3 Standardization of the bacterial cultures
Pure cultures of the above-mentioned microorganisms were inoculated into 40 ml sterile nutrient
broth and incubated for 72 h at 30 C on a rotary shaker at 150 rpm. Thereafter, the cultures were
centrifuged (Beckman, USA, Model J2-21) at 4000 rpm for 15 min, followed by washing twice in 20 ml
phosphate buffered saline (pH 7.4) containing 8 g NaCl, 0.2 g KCl, 3.58 g Na2HPO4.12H20 and 0.24 g
KH2PO4 per litre of double-distilled water and re-suspended in the same solution. The cultures were then
standardized to an optical density value of 1.0 at an absorbance of 600 nm (Sarret et al., 2005), using the
biochrom, Libra S12 UV-Visible Spectrophotometer.

70
3.2.4 Experimental design and microcosm set-up
Soil samples were collected and used in setting up the microcosms as described in Chapter Two
with the following amendments. Microcosm experiments were designed using artificially co-
contaminated loam soil to study the effects of arsenic and cadmium on the biodegradation of 1,2-DCA
over a 20 day period. Arsenic and cadmium stock solutions were incorporated into the groundwater, prior
to the microcosm set-up, to obtain final concentrations of 150 mg/kg and 170 mg/kg, respectively. For the
biostimulation experiments one and a half grams of D-glucose (Merck, Saarchem), fructose (Merck,
Saarchem) and KOMPEL fertilizer (Chemicult products, Pty Ltd.), an agricultural fertilizer with N:P:K
ratio of 3:1:6 were added separately to the microcosms. Bioaugmentation was carried out by inoculating 1
ml of standardized X. autotrophicus GJ10, and dual-bioaugmentation by adding 1 ml of a mixed culture
inoculum prepared from the standardized pure cultures of both X. autotrophicus GJ10 and the isolated
native heavy metal-resistant strain to the respective bottles. In addition to autoclaving, the biological
inhibited controls prepared for each series of reaction mixtures were amended with HgCl2 to achieve a
final concentration of 500 mg/kg. The degradation profile of 1,2-DCA under the different conditions was
determined using gas chromatographic analysis of the headspace as described in Chapter Two.
3.2.5 Enumeration of total 1,2-DCA degrading populations
Total 1,2-DCA degrading bacterial populations was determined at different sampling times using
a standard spread plate technique (Gerhardt et al., 1991). The co-contaminated soil was homogenized
manually using a sterile glass rod prior to pipetting 1 ml of the slurry for the initial 10-fold dilution.
Appropriate culture dilutions were carried out using normal physiological saline solution (0.85% NaCl),
thereafter 100 μl of the culture dilutions were plated on a minimal salts medium containing 1.36 g
KH2PO4, 5.37 g Na2HPO4.12H2O, 0.5 g (NH4)2SO4, 0.2 g MgSO4.7H20 and 12 g Bacteriological agar
(Bacto-Agar, Difco) per litre of double-distilled water (Janssen et al., 1984) spiked with 5 μl 1,2-DCA as
the carbon source. The plates were incubated at 30°C for 48 h prior to estimating the bacterial population.
3.2.6 Soil analysis
The physico-chemical properties of the loam soil sample were determined as described in
Chapter Two.
71
3.2.7 Soil enzyme assays
3.2.7.1 Dehydrogenase activity
Soil dehydrogenase activity was determined using 1 g of homogenized co-contaminated soil
slurry and 5 ml of sterile distilled water. The samples for metabolic measurements were vortexed and
incubated at room temperature for 30 min (Mosher et al., 2003). Thereafter, 5 ml of 1.08 mM 2-(p-
iodophenyl)-3(p-nitrophenyl)-5-phenyl tetrazolium chloride (INT) solution was added and vortexed; these
were incubated at room temperature for 60 min. All activity measurements were performed under dark
room conditions, as the INT is light sensitive. Metabolic activity was stopped by adding 30 ml of
acetonitrile (Merck, Germany) and INT formazan (INTF) was extracted at room temperature for 10 min.
The samples were filtered through a 0.45 μm filter and the sediment washed with 10 ml of acetonitrile.
The absorbance of the combined filtrate was determined with a biochrom, Libra S12 UV-Visible
Spectrophotometer at 490 nm. Control samples were killed with 30 ml acetonitrile before the addition of
INT to prevent reduction. Then, 5 ml of 1.08 mM INT was added and allowed to extract for 10 min prior
to filtering. INTF (red-colored formazan) concentrations were determined from the linear least squares
best-fit line from a standard curve of INTF solutions in acetonitrile. Dehydrogenase activity was
expressed as μg INTF/g dwt soil/h (von Mersi and Schinner, 1991).
3.2.7.2 Urease activity
Soil urease activity was determined by the buffered method of Kandeler and Gerber (1988). In
this procedure, 2.5 ml of 0.48% urea solution and 20 ml of borate buffer (pH 10) were added to 5 g of soil
in 100 ml hermetically sealed Erhlenmeyer flasks in triplicate, and incubated for 2 h at 37°C. This was
followed by a shaking incubation at 150 rpm for 30 min subsequent to the addition of 30 ml 1 M KCl
solution. The ammonium content of the filtered (0.45 μm) extracts was determined using a colorimetric
method. Briefly, 5 ml freshly prepared Na-salicylate/NaOH, 2 ml of 0.1% Na-dichloroisocyanide and 9
ml of sterile distilled water was added to 1 ml of clear filtrate and allowed to stand at room temperature
for 30 min prior to measuring the optical density at 690 nm. The Na-salicylate solution was prepared by
dissolving 17 g Na-salicylate and 0.12 g sodium nitroprusside in distilled water and brought up to 100 ml
with distilled water. Na-salicylate/NaOH solution was prepared by mixing equal volumes of NaOH, Na-
salicylate solutions, and distilled water. Blank controls were prepared with 2.5 ml sterile distilled water to
determine the ammonium produced in the absence of added urea. The calibration curve was constructed
using appropriate dilutions of a stock solution of ammonium chloride (100 μg NH4-N/ml) using 1 M KCl
and sterile distilled water to obtain final concentrations between 0.1-5 μg NH4-N/ml. Urease activity was
expressed as μg NH4-N/g dwt soil/2h (Kandeler and Gerber, 1988).

72
3.2.8 DNA extraction and PCR
3.2.8.1 DNA extraction and PCR amplification of 16S rDNA region
Total DNA from the co-contaminated loam soil was isolated at different sampling times using an
UltraCleanTM Soil DNA Isolation Kit (MOBIO, USA), following the manufacturer’s protocol for
maximum yields, but slightly modified, due to high humic acid content in the soil samples. The DNA was
washed times with an ethanol based solution to remove residues of salts and humic acids, prior to eluting
the DNA. DNA concentration was quantified using the NanoDrop 1000 Spectrophotometer (Thermo
Scientific) and appropriate dilutions thereafter were carried out to standardize the DNA prior to PCR.
This was subsequently used as template for the amplification of the 16S rDNA region using the 63F (5’-
CAGGCCTAACACATGCAAGTC-3’) and 1387R (5’- GGCGGWGTGTACAAGGC-3’) universal
bacterial primer sets (Marchesi et al., 1998). Each amplification reaction mixture (25 µl) contained 2.5 µl
of 10 × PCR buffer, 1 µl of 25 mM MgCl2, 1 µl each of the forward and reverse primers (10 µM), 1 µl of
1 mM deoxynucleoside triphosphate (dNTPs), 0.5 U of SuperTherm Taq DNA polymerase (Southern
Cross Biotech), 1 µl of template DNA (0.2-3.8 ng/μl) and 17 µl of sterile double-distilled water. PCR was
performed using the PE Applied Biosystems GeneAmp PCR System 9700 (Perkin-Elmer) and was
programmed to implement an initial denaturation at 95°C for 5 min followed by 30 cycles of annealing
and extension at 95°C for 1 min, 55°C for 1 min, 72°C for 1.5 min and a final extension at 72°C for 5
min. The amplicons were analyzed by electrophoresis on 1% (w/v) agarose (SeaKem) gels in 1 × TAE
running buffer with an applied voltage of 90 V for 90 min. After electrophoresis, the gel was stained in
0.5 μg/ml ethidium bromide (Sigma) for 20 min and visualized by UV transillumination (Chemi-Genius2
BioImaging System, Syngene).
3.2.8.2 PCR amplification of V3 to V5 region
PCR for bacterial 16S rDNA region was performed using the universal DGGE primer set F341-
357-GC (CCTACGGGAGGCAGCAG) with a 5′ GC-clamp: CGCCCGCCGCGCCCCGCGCCC
GTCCCGCCGCCCCCGCCCG and R907-926 (CCGTCAATTCMTTTGAGTTT) (Casamayor et al.,
2000). A GC-clamp was attached to the forward primer to prevent complete separation of the strands
during DGGE (Muyzer et al., 1993). For PCR, 2 μl DNA extract (between 0.2-3.8 ng/μl) was added to the
PCR amplification reaction mixture (50 µl) containing 5 μl 10 × PCR-buffer, 2 μl of 25 mM MgCl2, 2.5
μl each of F341-GC and 907R (10 μM), 5 μl of 2 mM dNTPs, 30.5 μl sterile double-distilled water and
0.5 U of SuperTherm Taq DNA polymerase (Southern Cross Biotech). PCR was performed using the
GeneAmp PCR System (Version 2.25, Perkin Elmer). A modified form (Muyzer et al., 1993) of the
touchdown thermal profile technique (Watanabe et al., 1998) was used: an initial denaturation (94°C, 5
min), followed by annealing via 10 cycles of 94°C, 1 min; 65°C, 1 min with a decrease in temperature of

73
1°C per cycle; and 72°C, 3 min. This was followed by 20 cycles of 94°C, 1 min; 55°C, 1 min; 72°C, 3
min and a final 5 min extension step at 72°C. The amplification of the correct product size of 585 bp was
confirmed by electrophoresis in a 2% (w/v) agarose gel in a 1 × TAE running buffer with an applied
voltage of 90 V for 120 min. After electrophoresis, the gel was stained in 0.5 μg/ml ethidium bromide and
visualized by UV transillumination (Chemi-Genius2 BioImaging System, Syngene).
3.2.9 Denaturing Gradient Gel Electrophoresis (DGGE)
PCR amplicons were separated by DGGE using the D-Code Universal Mutation Detection
System (BioRad) (Muyzer et al., 1997). Firstly, 0% and 100% denaturing solutions were prepared,
filtered through 0.45 µm pore size GN-6 Metricel membrane filters (Pall, 47 mm) and stored in brown
bottles at 4°C. The DGGE gel was cast by preparing 20 ml each of low (40%) and high (70%) density
solutions containing 20 µl TEMED and 200 µl of 10% ammonium persulphate, for gradient formation.
The density solutions were applied to the gradient delivery system to cast the perpendicular 6%
acrylamide DGGE gels (dimensions: 200 mm by 200 mm by 1 mm). Prior to sample loading, a pre-run
was performed at a constant voltage of 150 V at 60°C for 30 min to facilitate sample migration out of the
wells during the electrophoretic run. Following the pre-run, samples were loaded into the gel (5 µl gel
loading buffer : 20 µl PCR amplicons) and DGGE was conducted at a constant voltage of 60 V in 1 ×
TAE buffer at 60°C for 16 hrs. After electrophoresis, the gel was stained in 0.5 μg/ml ethidium bromide
(BioRad) for 20 min, destained in the same volume of 1 × TAE buffer for a further 20 min and thereafter
visualized by UV transilluminator (Chemi-Genius2 BioImaging System, Syngene).
3.2.10 Statistical analysis
Analysis of the biodegradation results was carried out using student’s (paired) t-test, 2 tails
distribution with significance level of p < 0.05.
3.3 Results
3.3.1 Effect of biostimulation and bioaugmentation on the biodegradation of
1,2-DCA in co-contaminated soil
Microcosm studies using co-contaminated loam soil moistened with synthetic groundwater were
performed to evaluate the biodegradation profiles of 1,2-DCA upon the addition of supplemental
substrates/nutrients or inoculation with bioaugmentation cultures. The biodegradation profile of 1,2-DCA
in co-contaminated soil microcosms undergoing biostimulation and bioaugmentation, in the presence of
As3+ and Cd2+ are illustrated in Figures 3.1 (a) and (b), respectively. In the autoclaved soil control
amended with HgCl2, abiotic loss of 1,2-DCA was observed, but to a lesser extent. In the unautoclaved

74
positive control not contaminated with heavy metals, the initial 1,2-DCA concentration of 15.79 μl/100 g
soil was reduced to 1.64 μl/100 g soil, corresponding to 89.78% elimination of 1,2-DCA, a value which is
significantly (p < 0.05) higher than that of the sterile control, correlating with up to 60% above that of the
sterile control, after 20 days. The presence of heavy metals was observed to have a negative impact on the
biodegradation of 1,2-DCA resulting in a significant (p < 0.05) decrease of 9.30% and 5.86% in
degradation, in soil co-contaminated with As3+ and Cd2+, respectively, indicating the more pronounced
toxic effect of As3+ compared to Cd2+, after 20 days. The degradation rate constants of 1,2-DCA, ranged
between 0.081 – 0.204 day-1 and between 0.091 – 0.216 day-1 in As3+ and Cd2+ co-contaminated soils,
respectively (Table 3.1). The degradation rate constants of 1,2-DCA in the biostimulated and
bioaugmented co-contaminated microcosms were higher than in the unautoclaved soil control containing
no heavy metals. In all cases, except for biostimulation with fructose, higher degradation rate constants
were observed in soil co-contaminated with Cd2+ compared to As3+. In addition, the degradation rate
constants of 1,2-DCA in bioaugmented soil samples were higher than the biostimulated microcosms in
both As3+ and Cd2+ co-contaminated soil samples. Bioaugmentation with X. autotrophicus GJ10 resulted
in a 2.5-fold and 2.3-fold increase in the rate of 1,2-DCA degradation in As3+ and Cd2+ co-contaminated
soil, respectively compared to the untreated co-contaminated soil. All supplemented substrates which
included; glucose, fructose and fertilizer, enhanced the biodegradation of 1,2-DCA in soil co-
contaminated with both heavy metals. After 15 days, biostimulation with fertilizer resulted in the greatest
increase in 1,2-DCA degradation with 4.94% and 6.85% achievd in both the As3+ and Cd2+ co-
contaminated soil, respectively. In the Cd2+ co-contaminated soil a significant (p < 0.05) increase of
12.02%, 10.37% and 12.37% in 1,2-DCA degradation occurred in the presence of glucose, fructose and
fertilizer, respectively after 20 days. Compared to the Cd2+ co-contaminated soil, an additional 3.01%,
4.50% and 2.55% increase in degradation was observed in the As3+ co-contaminated soil in the presence
of glucose, fructose and fertilizer, respectively over the same period. 1,2-Dichloroethane degradation was
significantly (p < 0.05) lower in unfertilized than in fertilized soil resulting in up to 14.92% increase in
degradation in As3+ co-contaminated soil after 20 days. Both amendments and time had a significant
influence on soil decontamination. After 5 days, 10.40% and 5.03% more degradation occurred in the
dual-bioaugmented soil compared to that bioaugmented with only X. autotrophicus GJ10, in the As3+ and
Cd2+ co-contaminated soil, respectively. Thereafter, a similar profile was observed in both the As3+ and
Cd2+ co-contaminated soil up until day 15.

75
Figure 3.1: Effects of biostimulation and bioaugmentation on the biodegradation of 1,2-DCA in soil co-
contaminated with (a) 150 mg/kg As3+ and (b) 170 mg/kg Cd2+. A = autoclaved soil control + 1,2-DCA; B = unautoclaved soil control + 1,2-DCA; C = unautoclaved soil control + 1,2-DCA + HM; D = soil + 1,2-DCA + HM + glucose; E = soil + 1,2-DCA + HM + fructose; F = soil + 1,2-DCA + HM + fertilizer; G = soil + 1,2-DCA + HM + X. autotrophicus GJ10; H = soil + 1,2-DCA + HM + dual-bioaugmentation. Bars indicate the average of triplicate samples while the error bars show the standard deviation.
0102030405060708090
100
A B C D E F G H
1,2-
DC
A d
egra
datio
n (%
)
Treatment
aDay 5 Day 10 Day 15 Day 20
0102030405060708090
100
A B C D E F G H
1,2-
DC
A d
egra
datio
n (%
)
Treatment
bDay 5 Day 10 Day 15 Day 20

76
Table 3.1: Biodegradation rate constants (day-1) of 1,2-DCA in soil co-contaminated with arsenic (150 mg/kg) and cadmium (170 mg/kg), undergoing biostimulation and bioaugmentation.
Treatment Arsenic Cadmium
Controls
Autoclaved soil
Unautoclaved soil
Unautoclaved soil + HM
Biostimulation
Glucose
Fructose
Fertilizer
Bioaugmentation
X. autotrophicus GJ10
Dual-bioaugmentation
0.016 ± 0.001
0.111 ± 0.003
0.081 ± 0.003
0.139 ± 0.008
0.138 ± 0.003
0.140 ± 0.010
0.204 ± 0.012
0.203 ± 0.007
0.016 ± 0.001
0.111 ± 0.003
0.091 ± 0.003
0.142 ± 0.004
0.127 ± 0.006
0.154 ± 0.003
0.216 ± 0.007
0.213 ± 0.003
3.3.2 Total 1,2-DCA degrading bacterial population dynamics in the co-contaminated soil
The total 1,2-DCA degrading bacterial population dynamics in the As3+ and Cd2+ co-
contaminated loam soil undergoing biostimulation and bioaugmentation is shown in Tables 3.2 and 3.3,
respectively. An alteration in the population of the autochthonous 1,2-DCA degrading microbial
community was observed subsequent to the addition of As3+ and Cd2+, resulting in an approximate
seventeen-fold and thirteen-fold decrease in population after 10 days, respectively. In the As3+ co-
contaminated soil biostimulated with glucose and fertilizer an ten-fold and three-fold increase in the total
1,2-DCA degrading bacterial population was observed after 10 days, correspondingly. In the dual-
bioaugmented treatments, the total number of culturable 1,2-DCA degraders detected increased from the
initial inoculum level of 6.47 × 10⁶ to 111.67 and 403.33 × 10⁶ in the As3+ and Cd2+ co-contaminated soil,
respectively after 10 days. In the biostimulation experiment, the highest 1,2-DCA degrading population of
36.33 × 10⁷ cfu/ml (in the fertilizer-amended microcosm) was obtained and 34.86 × 10⁷ cfu/ml (in the
glucose-amended microcosm) for the soil co-contaminated with As3+ and Cd2+, respectively after 20 days.
In both cases, dual-bioaugmentation produced the highest 1,2-DCA degrading population.

77
Table 3.2: Total 1,2-DCA degrading bacterial population in arsenic (As3+) co-contaminated soil undergoing biostimulation and bioaugmentation.
Treatment 1,2-DCA degrading bacterial population
Day 10 (cfu/ml × 106) Day 20 (cfu/ml × 107)
Controls
Autoclaved soil
Unautoclaved soil
Unautoclaved soil + As3+
Biostimulation
Glucose
Fructose
Fertilizer
Bioaugmentation
X. autotrophicus GJ10
Dual-bioaugmentation
0
48.33 ± 7.77
2.90 ± 0.34
28.98 ± 13.55
2.87 ± 0.52
7.37 ± 1.11
31.03 ± 4.98
111.67 ± 3.51
0
2.91 ± 0.10
0.26 ± 0.06
33.90 ± 3.77
2.83 ± 0.06
36.33 ± 5.51
291.50 ± 23.34
430.00 ± 91.65
Values are averages of triplicate data ± standard deviation. The initial 1,2-DCA degrading bacterial population was 6.47 × 10⁶ cfu/ml.
Table 3.3: Total 1,2-DCA degrading bacterial population in cadmium (Cd2+) co-contaminated soil
undergoing biostimulation and bioaugmentation.
Treatment 1,2-DCA degrading bacterial population
Day 10 (cfu/ml × 106) Day 20 (cfu/ml × 107)
Controls
Autoclaved soil
Unautoclaved soil
Unautoclaved soil + Cd2+
Biostimulation
Glucose
Fructose
Fertilizer
Bioaugmentation
X. autotrophicus GJ10
Dual-bioaugmentation
0
48.33 ± 7.77
3.75 ± 0.83
3.33 ± 0.69
1.91 ± 0.20
4.20 ± 0.36
82.00 ± 10.15
403.33 ± 80.21
0
2.91 ± 0.10
0.29 ± 0.02
34.86 ± 10.62
2.74 ± 0.11
32.90 ± 5.93
410.00 ± 56.57
453.33 ± 105.04
Values are averages of triplicate data ± standard deviation. The initial 1,2-DCA degrading bacterial population was 6.47 × 10⁶ cfu/ml.

78
3.3.3 PCR-DGGE analysis of bacterial community diversity
In addition to the culture-dependent approach in assessing total 1,2-DCA degrading bacterial
population dynamics, DGGE analysis of PCR-amplified 16S rDNA fragments was used to investigate the
effect of biostimulation and bioaugmentation on the co-contaminated loam soil microbial communities.
Fertilizer treatments which appeared to cause significant increases in 1,2-DCA degradation, as reflected
in 1,2-DCA biodegradation profile, were selected for DGGE analysis. Distinct DGGE profiles were
observed for both the fertilized and dual-bioaugmentated samples as shown in Figures 3.2 and 3.3,
respectively. The bands denoted by the arrow (except band A3) were all shown to be present throughout
the degradation period. On comparison of the As3+ and Cd2+ co-contaminated soil undergoing either
biostimulation or dual-bioaugmentation, the banding patterns observed seemingly exhibited a great
similarity. However, the banding patterns for the different bioremediation options, demonstrated much
difference in bacterial diversity between the fertilized and dual-bioaugmented samples. DGGE profiles
indicate that while numerous bands were common in the fertilized co-contaminated soils, there were also
changes in band presence and relative intensity due to treatment and temporal effects. In both the As3+ and
Cd2+ co-contaminated soil biostimulated with fertilizer, bands A5 and A6 representing dominant
degrading populations became brighter by day 20, indicating that these organisms where involved in the
degradation of 1,2-DCA in such co-contaminated environments. These bands were present on day 0,
albeit at very low concentrations, thus appearing faintly. On the other hand, band A3 was absent on day 0
and was observed on day 5 in both the As3+ and Cd2+ co-contaminated soils, whereas bands A1, A2 and
A4 were present throughout the degradation period, however the band intensity remained unchanged. All
the bands mentioned above maintained its dominance (as indicated by the brightness of the band) until
day 20 of the degradation process. Meanwhile, in the dual-bioaugmented microcosms, the native heavy
metal-resistant strain band intensity increased on day 15 in the As3+ co-contaminated soil, however, in the
Cd2+ co-contaminated soil, band intensity remained relatively unchanged up until day 15. In both the As3+
and Cd2+ co-contaminated soil, X. autotrophicus GJ10 (B3) band brightness increased slightly over time.

79
a1 a2 a3 a4 a5 a6 a7 a8 a9 a10
Figure 3.2: DGGE profiles of 16S rRNA gene fragments from co-contaminated loam soil samples biostimulated with fertilizer. Lanes: a1, a2, a3, a4 and a5 represent days 0, 5, 10, 15 and 20 of the As3+ co-contaminated soil and a6, a7, a8, a9 and a10 represent days 0, 5, 10, 15 and 20 of the Cd2+ co-contaminated soil.
b1 b2 b3 b4 b5 b6 b7 b8 b9 b10 b11 b12
Figure 3.3: DGGE profiles of 16S rRNA gene fragments from co-contaminated loam soil samples undergoing dual-bioaugmentation. Lanes: b1 represents X. autotrophicus GJ10, b2 represents native HM resistant strain, b3, b4, b5, b6 and b7 represent days 0, 5, 10, 15 and 20 of the As3+ co-contaminated soil and b8, b9, b10, b11 and b12 represent days 0, 5, 10, 15 and 20 of the Cd2+ co-contaminated soil.
A1
A2 A3 A4 A5 A6
B1
B2
B3

80
3.3.4 The combined effect of 1,2-DCA and heavy metals on soil microbial activities
The combined effect of 1,2-DCA and heavy metals on soil microbial enzyme activities varied
depending on the heavy metal tested. The changes in dehydrogenase activity in all treatments are shown
in Figures 3.4 and 3.5. In both the As3+ and Cd2+ co-contaminated soil there was a significant decrease of
87.26% (Figure 3.4a) and 86.33% (Figure 3.4b) in the dehydrogenase activity after 20 days, respectively.
In both the biostimulated and bioaugmented soil microcosms, dehydrogenase activity appeared biphasic
with an initial decrease followed by a progressive increase in the treated soils over time. Due to the
different supplemental substrates, dehydrogenase activity differed in the three biostimulated microcosms.
In all cases, except for the Cd2+ co-contaminated soil amended with fructose, higher dehydrogenase
activity was observed in the biostimulated soil compared to the untreated co-contaminated soil. The
greatest increase in dehydrogenase activity, in both the As3+ and Cd2+ co-contaminated soil was observed
in the glucose amended soil, resulting in 86.52% and 84.18% increase, respectively after 20 days,
compared to the untreated co-contaminated soil (Figure 3.4). Moreover, the supplemental substrates
appeared to follow a similar pattern in both As3+ and Cd2+co-contaminated soil; the trend, in ascending
order of increased dehydrogenase activity was fructose, fertilizer and glucose. In addition, 2.41% and
6.42% increase in dehydrogenase activity was observed in the As3+ co-contaminated soil amended with
glucose and fructose, respectively after 20 days, compared to Cd2+. Bioaugmentation with only X.
autotrophicus GJ10 resulted in a greater increase in dehydrogenase activity compared to dual-
bioaugmentation, with an increase of 85.18% (Figure 3.5a) and 80.95% (Figure 3.5b) observed in the
As3+ and Cd2+ co-contaminated soil, respectively after 20 days. However, these values are 1.34% and
3.23% less than the dehydrogenase activity observed in the soil microcosms biostimulated with glucose in
the As3+ and Cd2+ co-contaminated soil, respectively. Soil urease activity was inhibited in the presence of
heavy metals, resulting in a 7.66% (Figure 3.6a) and 20.17% (Figure 3.6b) decrease in the presence of
As3+ and Cd2+, respectively after 20 days. In the case of supplemental substrates/nutrients, a decline in
urease activity was observed in the glucose and fructose amended soil microcosms in both heavy metal
co-contaminated soils. On the other hand, fertilizer was observed to significantly (p < 0.05) increase
urease activity resulting in approximately 79% increase in both heavy metal co-contaminated soils after
20 days compared to the untreated soil. Both bioaugmentation and dual-bioaugmentation was observed to
result in higher urease activity within the first 10 days in As3+, followed by a decrease. Bioaugmentation
with X. autotrophicus GJ10 was also noted to decrease urease activity in both As3+ and Cd2+ co-
contaminated soil resulting in 25.35% (Figure 3.7a) and 35.95% (Figure 3.7b) decrease, respectively after
20 days. These values correspond to a 2.57% and 10.95% less pronounced effect on urease activity in
dual-bioaugmented soil.

81
Figure 3.4: Effects of 1,2-DCA and (a) As3+; (b) Cd2+ on soil microbial dehydrogenase activity in microcosms
undergoing biostimulation. A = unautoclaved soil control + 1,2-DCA; B = unautoclaved soil control + 1,2-DCA + HM; C = soil + 1,2-DCA + HM + glucose; D = soil + 1,2-DCA + HM + fructose; E = soil + 1,2-DCA + HM + fertilizer. The results indicate the average of triplicate samples while the error bars show the standard deviation.
0
50
100
150
200
250
0 5 10 15 20
Deh
ydro
gena
se a
ctiv
ity
(µg
INT
F/g
dwt/h
)
Incubation period (days)
a
A B C D E
0
50
100
150
200
250
0 5 10 15 20
Deh
ydro
gena
se a
ctiv
ity
(μg
INT
F/g
dwt/h
)
Incubation period (days)
b
A B C D E

82
Figure 3.5: Effects of 1,2-DCA and (a) As3+; (b) Cd2+ on soil microbial dehydrogenase activity in microcosms
undergoing bioaugmentation. A = unautoclaved soil control + 1,2-DCA; B = unautoclaved soil control + 1,2-DCA + HM; C = soil + 1,2-DCA + HM + X. autotrophicus GJ10; D = soil + 1,2-DCA + HM + dual-bioaugmentation. The results indicate the average of triplicate samples while the error bars show the standard deviation.
0
50
100
150
200
250
0 5 10 15 20
Deh
ydro
gena
se a
ctiv
ity
(µg
INT
F/g
dwt/h
)
Incubation period (days)
a
A B C D
0
50
100
150
200
250
0 5 10 15 20
Deh
ydro
gena
se a
ctiv
ity
(μg
INT
F/g
dwt/h
)
Incubation period (days)
b
A B C D

83
Figure 3.6: Effects of 1,2-DCA and (a) As3+; (b) Cd2+ on soil microbial urease activity in microcosms
undergoing biostimulation. A = unautoclaved soil control + 1,2-DCA; B = unautoclaved soil control + 1,2-DCA + HM; C = soil + 1,2-DCA + HM + glucose; D = soil + 1,2-DCA + HM + fructose; E = soil + 1,2-DCA + HM + fertilizer. The results indicate the average of triplicate samples while the error bars show the standard deviation.
0
50
100
150
200
250
300
350
400
0 5 10 15 20
Ure
ase
activ
ity(μ
g N
H4-
N/g
dw
t/2 h
)
Incubation period (days)
a
A B C D E
0
50
100
150
200
250
300
350
400
0 5 10 15 20
Ure
ase
activ
ity(μ
g N
H4-
N/g
dw
t/2 h
)
Incubation period (days)
b
A B C D E

84
Figure 3.7: Effects of 1,2-DCA and (a) As3+; (b) Cd2+ on soil microbial urease activity in microcosms
undergoing bioaugmentation. A = unautoclaved soil control + 1,2-DCA; B = unautoclaved soil control + 1,2-DCA + HM; C = soil + 1,2-DCA + HM + X. autotrophicus GJ10; D = soil + 1,2-DCA + HM + dual-bioaugmentation. The results indicate the average of triplicate samples while the error bars show the standard deviation.
0102030405060708090
100
0 5 10 15 20
Ure
ase
activ
ity(μ
g N
H4-
N/g
dw
t/2 h
)
Incubation period (days)
a
A B C D
0102030405060708090
100
0 5 10 15 20
Ure
ase
activ
ity(μ
g N
H4-
N/g
dw
t/2 h
)
Incubation period (days)
b
A B C D

85
3.4 Discussion
Results from this study revealed the capability of the indigenous soil microbial populations to
remove 1,2-DCA from co-contaminated soil, with both bioaugmentation and biostimulation approaches
playing a fundamental role in enhancing 1,2-DCA degradation, and dual-bioaugmentation having the
greatest effect in both As3+ and Cd2+ contaminated soils. However, the observed degradation profiles
obtained varied depending on the heavy metal co-contaminant present in the soil.
The physico-chemical parameters of soil samples have been shown to have a major influence on
aeration, water retention, nutrient availability, and consequently on microbial activity and community
dynamics (Olaniran et al., 2006). In general, a ratio of carbon to nitrogen to phosphorus of 100:10:1
(Norris et al., 1994) has been extensively used in the biodegradation processes (Button et al., 1992). In
addition, bioremediation studies have demonstrated that nitrogen concentrations ranging from 2.0 to 10.0
mg/L are sufficient for near-maximum growth of hydrocarbon-degrading microorganisms (Boufadel et
al., 1999; Wrenn et al., 2006). In this study, the loam soil used in the construction of the microcosms
contained relatively low concentrations of soluble organic carbon with fairly high concentrations of
nitrogen and phosphorus (mainly in the form of phosphate). Phosphate has a high affinity for most soils
which lessens its transport, thus causing it to be unavailable for biological activity (Liebeg and Cutright,
1999).The carbon to nitrogen ratio was considerably low (0.7:1) in the loam soil compared to that
recommended for soil hydrocarbon bioremediation which varies greatly and ranges from 100:1 to 10:1
(Atlas and Bartha, 1992; Song and Bartha, 1990). However, it should be noted that these average values
depend on the type of microorganisms present in the soil. Thus, in this study, the addition of supplemental
substrates such as glucose, fructose and nitrogen fertilizers were shown to enhance 1,2-DCA degradation
in the heavy metal co-contaminated soil samples to varying degrees.
In both the As3+ and Cd2+ co-contaminated soil, biostimulation with fertilizer resulted in the
greatest increase in 1,2-DCA degradation after 15 days. It has been demonstrated that biodegradation of
large quantities of organic carbon sources by indigenous microorganisms tends to result in a depletion of
inorganic nutrients such as nitrogen and phosphorus (Margesin et al., 2000), thus limiting the rate of
biodegradation. This study demonstrated that under favourable conditions, via the addition of inorganic
amendments, biostimulation can enhance the degradation of 1,2-DCA in polluted soils even in the
presence of co-contaminants. These findings correlate well with several other research reports on the
positive effects of biostimulation with mainly N:P:K fertilizers (Atlas and Bartha, 1992; Margesin et al.,
2000; Margesin and Schinner, 2001; Olaniran et al., 2006; 2009). Siddiqui and Adams (2001) also
observed that the best response obtained for diesel oil degradation was also in soil amended with N and P.
Biostimulation with glucose also resulted in high 1,2-DCA degradation rates in the presence of As3+ and
Cd2+, thereby also providing very promising results for effective bioremediation of such co-contaminated
soils. Gao and Skeen (1998) reported that glucose, being a simple sugar, is highly soluble in water and

86
therefore easily metabolized by microorganisms. Similarly, enhanced biodegradation of 1,2-DCA
following the addition of glucose to co-contaminated soil has been recently reported (Olaniran et al.,
2009).
Bioaugmentation, in particular dual-bioaugmentation, was observed to significantly increase the
rate of 1,2-DCA biodegradation. Previous studies have demonstrated that, under certain conditions,
addition of known degrading organism accelerates the rate and the degree of organic biodegradation
(Bento et al., 2003; Mueller et al., 1992). In particular, the finding in this study correlates well with that
of Roane et al. (2001) who reported that dual-bioaugmentation, involving inoculation with both metal-
detoxifying (Ralstonia eutropha JMP134) and organic-degrading (Pseudomonas H1) bacteria, facilitates
the degradation of 2,4-dichlorophenoxyacetic acid (2,4-D) in the presence of cadmium co-contamination.
Based on the results obtained, it was concluded that dual-bioaugmentation with metal-detoxifying and
organic-degrading microbial populations is effective for remediation of co-contaminated soil.
Implementation of dual-bioaugmentation strategies rely primarily on metal detoxification so that organic-
degrading microbial populations are prevented from metal stress and inhibition. This strategy was also
found successful at pilot scale with a soil bioreactor, resulting in significant reductions in 2,4-D levels
within six weeks. On the other hand, Doelman et al. (1994) hypothesized that in soils contaminated with
heavy metals, indigenous microorganisms with resistance to these inorganic contaminants may reduce the
bacterial bioremediation capability towards chlorinated hydrocarbons. This is in contrast to the results
obtained in this study. Inoculation of soil with native microorganisms, provided in a sufficient number to
enhance the biodegradation process, has been proposed as a generic bioremediation approach to
ameliorate the clean-up of polluted areas (Alisi et al., 2009). The bioaugmentation approach assumed in
this study was based on strengthening a portion of the native microbial community with an indigenous
microorganism resistant to the heavy metals tested. This strain was incorporated in order to indirectly
increase 1,2-DCA degradation, by protecting X. autotrophicus GJ10 or the other indigenous metal
sensitive organic-degrading strains from metal toxicity. In principle, the native strains of co-contaminated
matrices, already shaped by selective pressure for heavy metal resistance, are expected to take advantage
with respect to sensitive strains in enhancing biodegradation. In this way, they help to overcome an
important limitation in bioremediation applications, namely the co-occurrence of toxic heavy metals,
which inhibit microbial processes in general (Alisi et al., 2009).
Numerous limitations, such as difficulty in delivery of the inoculant to the desired location
(Streger et al., 2002), rapid decline in introduced microbial numbers and death of the exogenous
microorganisms (Goldstein et al., 1985), have been reported with the use of bioaugmentation as a
bioremediation strategy. However, in this study, the effect of bioaugmentation was more pronounced
resulting in a marked increase in 1,2-DCA degradation in both the As3+ and Cd2+ co-contaminated soils,
compared to biostimulation. In addition, a significant increase in the total number of 1,2-DCA degrading

87
bacterial populations was observed in the bioaugmentated microcosms compared to those biostimulated.
These increases in total 1,2-DCA degrading populations correspond to a boost in 1,2-DCA degradation in
the bioaugmentated soil samples. This correlates with the reports of Lendvay et al. (2003) who conducted
a side-by-side comparison of bioaugmentation and biostimulation; with Dehalococcoides and lactate,
respectively, in a chloroethene contaminated aquifer. The authors reported that bioaugmentation resulted
in a near-stoichiometric dechlorination of both sorbed and dissolved chloroethenes. In addition, the
Dehalococcoides populations increased by three-to-four orders of magnitude. However, biostimulation
with continuous lactate and nutrient injection did result in dechlorination, but only after a prolonged lag
period.
The microbial dehydrogenase and urease activity increased in the presence of 1,2-DCA, a readily
available carbon source. Dehydrogenase activity plays a central role in the soil environment, primarily in
the oxidation of organic matters (Dick et al., 1996), therefore it has been considered as an attractive
indicator for monitoring various impacts on soil organisms (Maila and Cloete, 2005). In this study,
dehydrogenase activity was significantly (p < 0.05) inhibited by heavy metals confirming the results from
previous studies (Chander and Brookes, 1991; García-Gil et al., 2000). The rapid and continuous
inhibition in dehydrogenase activity in both the As3+ and Cd2+ co-contaminated soils throughout the
degradation period could be due to the indirect effect of heavy metals, whereby heavy metals alter the
microbial community which synthesizes the enzymes (Kandeler et al., 2000; Nannipieri, 1994). The
decrease in dehydrogenase activity observed in this study may be attributed to the toxic effects of heavy
metals on the microorganisms, as evidenced by the decrease in total 1,2-DCA degrading bacterial
populations in both heavy metal polluted soils. In addition, it is well documented that the heavy metals
react with sulfhydryl groups of enzymes and inhibit and/or inactivate the enzymatic activities. The
toxicity of As3+ on soil dehydrogenase activity was higher than that of Cd2+, with a corresponding greater
inhibitory effect on 1,2-DCA degradation as well as a significant decrease in total 1,2-DCA degrading
population. Neither amendment with carbon, nitrogen or phosphorus was able to increase microbial
activity to levels obtained prior to co-contamination of the soil. These results suggest that the high soil
microbial activity was mainly associated with the presence of the chlorinated hydrocarbon. Shi et al.
(2005) also stated that the presence of heavy metals may retard enzyme activity in co-contaminated
environments, without necessarily preventing aromatic catabolism in soils. Interestingly, the addition of
glucose and fructose resulted in a decrease in urease activity below that observed in the untreated co-
contaminated soil, whereas the addition of fertilizer resulted in significantly higher increases in urease
activity. Urease is a key extracellular enzyme in soil responsible for nitrogen transformation (Xuexia et
al., 2006). Basically, the enzyme catalyses the hydrolysis of urea to CO2 and NH4+, a significant by-
product of the reaction, which can reflect nitrogen availability in soil (Sun et al., 2003). Therefore, it is
not surprising that addition of fertilizer, which provides a rich source of nitrogen, resulted in a marked

88
increase in urease activity in both co-contaminated soils. Li et al. (2009) recently observed that
application of chemical N:P:K fertilizers to As contaminated soil can lead to the release of arsenic from
inactive fractions which are bound to mineral matrices to relatively available fractions which may be
water soluble or bound to carbonates, iron and manganese oxides. This may explain why rich sources of
carbon, nitrogen and phosphorus have a stimulatory effect on microbial activities, leading to the
redistribution of arsenic among the fractions (Brouwere et al., 2004; Signes-Pastor et al., 2007). Harvey et
al. (2002), Jackson et al. (2006) and Rowland et al. (2006) also reported that arsenic solubility was
positively correlated with organic carbon in soils and sediments, while the leaching of arsenic to soil
solution was enhanced by the added carbon sources (Turpeinen et al., 1999).
Denaturing gradient gel electrophoresis has proven invaluable for comparative community
profiling (Fromin et al., 2002; Muyzer et al., 1993). Although a number of methodological limitations
have been identified, PCR-DGGE is generally accepted to provide a fingerprint of the dominant
phylotypes in natural habitats (Jensen et al., 1998; Murray et al., 1996; Teske et al., 1996; Vallaeys et al.,
1997) and it has been successfully applied to monitor spatial and temporal differences in bacterial
communities (Casamayor et al., 2002; Giovannoni et al., 1990; Muyzer and Smalla, 1998). DGGE
produces a unique DNA community fingerprint, where the number, position, and intensity of the bands
reflect the number and relative abundance of a particular species in the population, thereby facilitating a
comparison of different microbial communities (Casamayor et al., 2002; Muyzer and Smalla, 1998). It
has been suggested that DGGE in most cases does not reveal diversity unless the community is very
simple. Therefore, it should be kept in mind that DGGE profiles only represent the most numerically
dominant genospecies, whereas less abundant species are often not represented (Muyzer and deWaal,
1994). The presence of multiple contaminants, including chlorinated organic pollutants and heavy metals,
presents extreme challenges to the maintenance of a phylogenetically and functionally diverse microbial
community (Shi et al., 2002), since only microbes that tolerate both heavy metals and toxic levels of
hydrocarbons may survive. Therefore, the application of this technique holds great promise in assessing
microbial diversity in co-contaminated environments. The relative change in the banding patterns
between the As3+ and Cd2+ treated co-contaminated soil, revealed few differences in the bacterial
communities, suggesting the same organisms were able to withstand the toxic effects of these metals as
well as utilize 1,2-DCA. Similarly, the changes in DGGE patterns observed in soil contaminated with cis-
and trans-dichloroethene also indicated a significant effect of these compounds on indigenous microbial
communities and, subsequently, leading to the selection of several microbial populations well-adapted to
the contaminants (Olaniran et al., 2007). In general, the community structure produced altered PCR-
DGGE profiles during the time-course of the degradation process, in which the number of bands was
reduced, the intensity of certain bands increased, and new bands appeared. This is indicative of the

89
selection of microorganisms capable of tolerating the toxic effects of As3+ and Cd2+ as well as utilizing
and/or surviving the toxicity of 1,2-DCA.
These results indicate that the use of dual-bioaugmentation and fertilizer may efficiently speed-up
the bioremediation of soil matrices co-contaminated with 1,2-DCA and heavy metals. However, the
properties of the contaminated soil should be taken into consideration, as the success of any
bioremediation approach is site-specific. The results of this study are encouraging and allow for the
identification of some adjustments that could be introduced prior to implementation of such remediation
strategies in enhancing the degradation of 1,2-DCA in co-contaminated soils. In particular, the dual-
bioaugmentation strategy using strains pre-selected from the co-contaminated soil environment may be
used to overcome a critical bottle-neck of the bioremediation technology.

CHAPTER FOUR EVALUATION OF THE IMPACTS OF DIFFERENT
TREATMENT ADDITIVES ON METAL
BIOAVAILABILITY AND 1,2-DICHLOROETHANE
DEGRADATION IN CO-CONTAMINATED SOIL

90
4.1 Introduction
The growing awareness and concern regarding the adverse effects induced by elevated levels of
arsenic (As) and cadmium (Cd) on soil microorganisms have prompted recent research efforts in
evaluating the speciation, mobility and stability of these heavy metals (HM) in soil (Bhattacharyya et al.,
2008; Kavamura and Esposito, 2010; Száková et al., 2009). The total contaminant levels are not
necessarily indicative of essentially occurring adverse effects, as the toxic effects are determined not only
by their intrinsic toxicity and concentration but also by their physico-chemical forms (Guéguen et al.,
2004; Sandrin and Maier, 2003). Arsenic and cadmium are potentially hazardous pollutants in the
environment and are highly toxic to plants, microorganisms, animals and human beings even at a very
low concentration (Flick et al., 1971; Vaughan, 2006). Although inorganic arsenic and cadmium in soils
are in themselves harmful, immobile heavy metals can be easily transformed into mobile phases as a
result of changes in environmental conditions, thereby posing an additional potential environmental
hazard (Lee et al., 2010; Vig et al., 2003). Thus, the toxicity of these heavy metals is related to its
oxidation state in the soil environment (Jain and Ali, 2000; Slotnick et al., 2006; Vig et al., 2003; Zhao
and Masaihiko, 2007).
Generally, most analytical measurements deal with the total content of heavy metals or metalloids
in an analyzed sample to assess its impact on the environment (Lin et al., 2002; Topcuoğlu et al., 2002).
When considering microorganisms, the chemical form or the oxidation state in which that element is
introduced into the environment is crucial. Metals are essentially bioavailable in free ionic and labile
forms for microorganisms, whereas particle-bound or ligand-complexed metals are not considered as
being directly available for uptake by microorganisms (Campbell, 1995). It has been well documented
that the toxicity of these heavy metals are dependent on countless abiotic and biotic factors such as soil
pH value, organic matter content, clay minerals and redox conditions (Kavamura and Esposito, 2010;
Naidu et al., 1997; Vig et al., 2003). These complex processes affect heavy metal speciation and
distribution, including adsorption onto and desorption from mineral surfaces, incorporation into
precipitates, release through the dissolution of minerals, and interactions with microorganisms (Brown Jr
et al., 1999).
Bioavailability is not deemed a universal attribute; it can be organism and, in some cases, species-
specific (Giller et al., 1998). Heavy metals that are considered to be bioavailable have the potential to
interact with biological vectors. In soil, these vectors may include microorganisms (Langdon et al., 2003);
thus evaluating uptake of a metal/metalloid (Wolt, 1994), or the impact on growth or activity of the target
organism can be used as a sensitive indicator of the effect of pollutants (Giller et al., 1998). Microbial
parameters appear to be very useful in monitoring soil pollution caused by both chlorinated organic and
heavy metal pollutants, since they are more dynamic and often more sensitive than the physical or
chemical soil properties (Brookes, 1995). According to Tyler (1974) and Kızılkaya et al. (2004), soil

91
enzymatic activities diminish with increasing concentrations of available heavy metals. Microbial
activities (urease and dehydrogenase) and active population densities in such co-contaminated
environments appear to provide more sensitive indications of soil pollution by heavy metals than either
activity or population measurements alone (Nannipieri et al., 1990). It is difficult, however, to select the
most sensitive enzymatic response to heavy metals, because the enzyme activity is dependent on the
surrounding edaphic microenvironment (Schloter et al., 2003).
Due to the complexity of soil-metal interactions and transformations, predicting soil metal
bioavailability, mobility and retention is often difficult. To date, there is no generally accepted method of
estimating the bioavailability of heavy metals in soil. A single extraction procedure using 1M NH4NO3
has been suggested as a simple, cheap and environmentally friendly technique (Meers et al., 2007).
Moreover, the extracting solution matches the soil solution with respect to pH, concentration and
composition. In comparison with divalent exchangeable bases such as Ca, the monovalent cation NH4 is
less competitive for desorption of heavy metals from the soil matrix (Gommy et al., 1998). Also, the use
of nitrate as a counter ion does not cause additional complexation and mobilization of heavy metals, as is
the case for chloride-based extractants (Meers et al., 2007). Heavy metal concentrations in soils
determined by this extraction procedure give a better indication of bioavailability than total soil contents.
Typical remediation strategies for heavy metal polluted soils have focused on extraction and
immobilization of the heavy metals (Montinaro et al., 2008). However, given the high risk and cost
involved in excavation techniques, the latter process by the action of precipitation, complexation and
adsorption are generally preferred as cost a effective technique for treating heavy metal contaminated
soils (Lee et al., 2004; Montinaro et al., 2008). Immobilization procedures are aimed at preventing the
migration of heavy metals in the soil environment, either by improving soil physical characteristics, or by
limiting the solubility or toxicity of the bioavailable heavy metal (Chen et al., 2007; Lombi et al., 2004;
McGowen et al., 2001). The process of immobilizing heavy metals involves mixing contaminated soils
with suitable treatment additives which are able to decrease their bioavailability by inducing various
sorption processes: formation of stable complexes, promoting ion exchange, adsorption and/or
precipitation of the heavy metals (Kumpiene et al., 2008). A variety of treatment additives has been
investigated to immobilize heavy metals in soils; in particular, application of lime materials, clays,
carbonates and phosphates have shown promising results in remediating arsenic and/or cadmium
contaminated soils (Brown et al., 2005; García-Sanchez et al., 2002; Thakur et al., 2006; Zhao and
Masaihiko, 2007). The most widely used remediation treatment for heavy metal contaminated soils is the
application of lime materials. Liming significantly increases the soil pH due to the release of hydroxyl
ions by the hydrolysis reaction of calcium carbonate. Consequently, liming can lead to the precipitation of
heavy metals as metal-carbonate, resulting in significant decrease in the bioavailable fraction of metals in
the contaminated soil (Knox et al., 2001).

92
In view of the above, the aim of this study was therefore to assess the effect of different inorganic
treatment additives (calcium carbonate, gypsum and disodium phosphate) on the bioavailability of arsenic
and cadmium in soil and the consequent impact on 1,2-DCA degradation in a co-contaminated soil
microcosm setting. Moreover, the effects of such treatment additives on selected soil microbial
parameters were also investigated.
4.2 Materials and methods
4.2.1 Sample collection and handling
Soil samples were collected and handled as described in Chapter Two; however, only loam soil
was used in this section of the study, since the inhibition of 1,2-DCA degradation by the heavy metals
was much more pronounced in this soil type.
4.2.2 Experimental design and microcosm set-up
The methodology for experimental design and microcosm set-up is the same as that described in
Chapter Two with the following amendments. Microcosms were set-up by artificially co-contaminating
loam soil sample with 1,2-DCA and heavy metals. To study the effects of different treatment additives on
the bioavailability of arsenic and cadmium, nine treatments were used in total, comprising positive and
negative controls, two heavy metals and three treatment additives, with each test conducted in triplicate.
Arsenic oxide (As3+) and cadmium chloride (Cd2+) stock solutions were incorporated into the
groundwater, prior to the microcosm set-up, to obtain final concentrations of 150 mg/kg and 170 mg/kg,
respectively. Each microcosm was amended with either 5 g calcium carbonate (CaCO3) (Ruby et al.,
1994), 2 g gypsum (CaSO4.2H2O) (Lombi et al., 2004) or a combination of 1.12 g disodium phosphate
(Na2HPO4) and 0.046g sodium chloride (NaCl) (Ruby et al., 1994). Thereafter, the reaction mixtures were
manually mixed with a glass rod to allow for even distribution of the treatment additives within the soil.
In addition to autoclaving, the biological inhibited controls prepared for each series of reaction mixtures
were amended with HgCl2 to achieve a final concentration of 500 mg/kg.
4.2.3 Analytical procedures
The analytical procedures involved in assessing the degradation of 1,2-DCA using gas
chromatographic analysis of headspace samples are as described in Chapter Two.
4.2.4 Enumeration of total 1,2-DCA degrading populations
Total 1,2-DCA degrading bacterial populations was determined at different sampling times using
a standard spread plate technique (Gerhardt et al., 1991), as described in Chapter Three.

93
4.2.5 Soil analysis
The methodologies used in assessing the physico-chemical properties of the soil sample are
described in Chapter Two.
4.2.6 Dehydrogenase and urease activity
The assay procedures used for assessing the microbial dehydrogenase and urease activities in the
co-contaminated soil containing the different treatment additives are as described in Chapter Three.
4.2.7 Bioavailability of heavy metals
The bioavailable fraction of heavy metals in the soil microcosms was estimated by extracting 8 g
of co-contaminated soil with 1 M NH4NO3 (1:2.5 w/v) (Wang et al., 2007). The soil suspensions were
centrifuged at 4000 rpm for 10 min and filtered through 0.45 μm membrane filters (Whatman). Contents
of As and Cd in each filtrate were measured using an inductively coupled plasma-optical emission
spectrometer (ICP-OES) 5300 DV and 2100 DV (Perkin-Elmer). Fifteen millilitres of the filtrate were
transferred to centrifuge tubes and concentrations of bioavailable heavy metals were estimated by
extrapolating from known concentrations of heavy metals. All the extractions were carried out in
triplicate, including the analytical blanks which were processed simultaneously with the samples. The
specifications of the ICP-OES used for generating calibration curves are indicated in Table 4.1.
Table 4.1: ICP-OES instrument specifications required for generating calibration curves.
4.2.8 Statistical analysis
Analysis of the biodegradation results was carried out using student’s (paired) t-test, 2 tails
distribution with significance level of p < 0.05.
Element Wavelength (nm)
BEC (mg/l)
Detection limit
(mg/L)
Signal/Noise (S & T)
Intensity (W)
Arsenic 197.197 2.56 0.0760 - 5.8
Cadmium 226.502 0.11 0.0034 293.1 1000

94
4.3 Results
4.3.1 Effect of treatment additives on 1,2-DCA biodegradation in co-contaminated soil
The degradation profiles of 1,2-DCA, both in the presence and absence of treatment additives in
loam soil co-contaminated with As3+ and Cd2+, are illustrated in Figures 4.1a and 4.1b, respectively. 1,2-
Dichloroethane was observed to be degraded significantly (p < 0.05) by indigenous soil microorganisms
with up to 89.78% elimination of 1,2-DCA being achieved in the absence of heavy metals after 20 days.
The presence of As3+ and Cd2+ resulted in a significant (p < 0.05) decrease of 9.30% and 5.86% in 1,2-
DCA degradation after 20 days, respectively. Addition of treatment additives effectively resulted in an
increase in 1,2-DCA degradation with up to 15.84% (p < 0.05) and 9.14% in the As3+ and Cd2+ co-
contaminated soil, respectively, within the first 5 days of the incubation period. After 15 days, CaCO3
proved to be the most efficient in the As3+ co-contaminated soil, resulting in a significant (p < 0.05)
increase of 13.52% in 1,2-DCA degradation, compared to Na2HPO4 + NaCl and CaSO4.2H2O which
resulted in a 7.29% and 8.83% increase in 1,2-DCA degradation, respectively (Figure 4.1a). However, in
Cd2+ co-contaminated soil, similar increases in 1,2-DCA degradation were observed for all treatment
additives throughout the degradation period. Calcium carbonate was observed to be more effective in
enhancing 1,2-DCA in the As3+ co-contaminated soil compared to the Cd2+ co-contaminated microcosms,
as indicated by an increase of 5.24% in 1,2-DCA degradation after 20 days. The degradation rate
constants of 1,2-DCA, as indicated in Table 4.2, ranged variously between 0.081 – 0.167 day-1 and 0.091
– 0.152 day-1, in the As3+ and Cd2+ co-contaminated soil, respectively. The presence of As3+ and Cd2+
resulted in a decrease of 26.76% and 18.02% in 1,2-DCA degradation rate constant, indicating that the
presence of As3+ has a greater inhibitory effect on 1,2-DCA degradation. In all microcosms amended with
treatment additives, higher degradation rate constants were observed compared to the untreated positive
controls (Table 4.2). Moreover, the addition of CaCO3 resulted in an approximately two-fold increase in
1,2-DCA degradation rate constant in both the As3+ and Cd2+ co-contaminated soil. The effect of all
treatment additives were more pronounced in the As3+ co-contaminated soil resulting in a 11.19%, 9.25%
and 5.63% increase in 1,2-DCA degradation rate constant in the presence of CaCO3, Na2HPO4 + NaCl
and CaSO4.2H2O, respectively, compared to the Cd2+ co-contaminated soil.

95
Figure 4.1: Degradation profiles of 1,2-DCA in soil co-contaminated with (a) 150 mg/kg As3+ and (b) 170
mg/kg Cd2+ in the presence of treatment additives. A = autoclaved soil control + 1,2-DCA; B = unautoclaved soil control + 1,2-DCA; C = unautoclaved soil control + 1,2-DCA + HM; D = soil + 1,2-DCA + HM + CaCO3; E = soil + 1,2-DCA + HM + Na2HPO4 + NaCl; F = soil + 1,2-DCA + HM + CaSO4.2H2O. Bars indicate the average of triplicate samples while the error bars show the standard deviation.
0102030405060708090
100
A B C D E F
1,2-
DC
A d
egra
datio
n (%
)
Treatment
aDay 5 Day 10 Day 15 Day 20
0102030405060708090
100
A B C D E F
1,2-
DC
A d
egra
datio
n (%
)
Treatment
bDay 5 Day 10 Day 15 Day 20
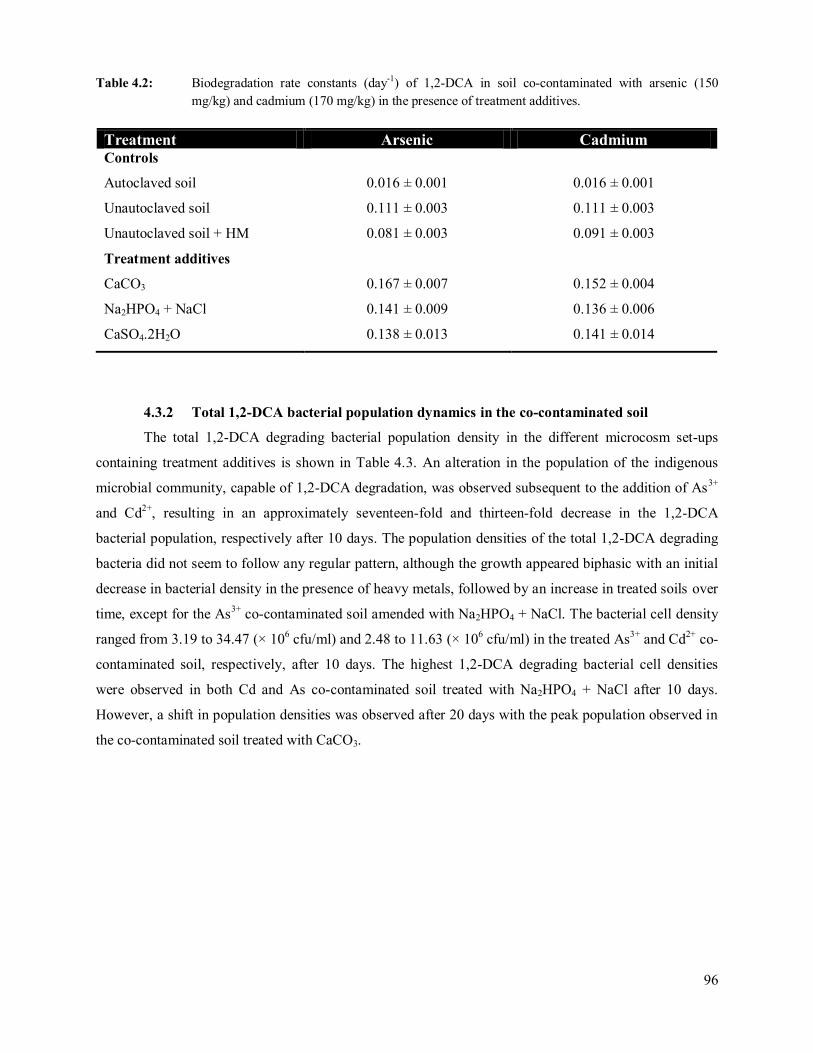
96
Table 4.2: Biodegradation rate constants (day-1) of 1,2-DCA in soil co-contaminated with arsenic (150 mg/kg) and cadmium (170 mg/kg) in the presence of treatment additives.
Treatment Arsenic Cadmium Controls
Autoclaved soil
Unautoclaved soil
Unautoclaved soil + HM
Treatment additives
CaCO3
Na2HPO4 + NaCl
CaSO4.2H2O
0.016 ± 0.001
0.111 ± 0.003
0.081 ± 0.003
0.167 ± 0.007
0.141 ± 0.009
0.138 ± 0.013
0.016 ± 0.001
0.111 ± 0.003
0.091 ± 0.003
0.152 ± 0.004
0.136 ± 0.006
0.141 ± 0.014
4.3.2 Total 1,2-DCA bacterial population dynamics in the co-contaminated soil
The total 1,2-DCA degrading bacterial population density in the different microcosm set-ups
containing treatment additives is shown in Table 4.3. An alteration in the population of the indigenous
microbial community, capable of 1,2-DCA degradation, was observed subsequent to the addition of As3+
and Cd2+, resulting in an approximately seventeen-fold and thirteen-fold decrease in the 1,2-DCA
bacterial population, respectively after 10 days. The population densities of the total 1,2-DCA degrading
bacteria did not seem to follow any regular pattern, although the growth appeared biphasic with an initial
decrease in bacterial density in the presence of heavy metals, followed by an increase in treated soils over
time, except for the As3+ co-contaminated soil amended with Na2HPO4 + NaCl. The bacterial cell density
ranged from 3.19 to 34.47 (× 106 cfu/ml) and 2.48 to 11.63 (× 106 cfu/ml) in the treated As3+ and Cd2+ co-
contaminated soil, respectively, after 10 days. The highest 1,2-DCA degrading bacterial cell densities
were observed in both Cd and As co-contaminated soil treated with Na2HPO4 + NaCl after 10 days.
However, a shift in population densities was observed after 20 days with the peak population observed in
the co-contaminated soil treated with CaCO3.

97
Table 4.3: Total 1,2-DCA degrading bacterial population in heavy metal co-contaminated soil in the presence of different treatment additives.
Treatment 1,2-DCA degrading bacterial population (cfu/ml × 106)
Day 10 Day 20 Controls Autoclaved soil 0 0 Unautoclaved soil 48.33 ± 7.77 29.07 ± 1.00
Arsenic (As3+) Unautoclaved soil + As3+ 2.90 ± 0.34 2.54 ± 0.65 CaCO3 3.19 ± 0.27 275.67 ± 10.69 Na2HPO4 + NaCl 34.47 ± 6.92 33.00 ± 5.66 CaSO4.2H2O 9.30 ± 1.11 31.23 ± 2.62
Cadmium (Cd2+) Unautoclaved soil + Cd2+ 3.75 ± 0.83 2.85 ± 0.21 CaCO3 4.43 ± 0.61 46.00 ± 4.58 Na2HPO4 + NaCl 11.63 ± 0.80 29.00 ± 1.41 CaSO4.2H2O 2.48 ± 0.58 5.37 ± 1.36
Values are averages of triplicate data ± standard deviation. The initial 1,2-DCA degrading bacterial population was 6.47 × 10⁶ cfu/ml.
4.3.3 Concentrations of soil bioavailable heavy metals
The bioavailable concentrations of As3+ and Cd2+ in the soil solutions over time are indicated in
Tables 4.4 and 4.5, respectively. The concentrations of bioavailable heavy metals varied greatly, with
approximately < 2.72% and < 0.62% of the total arsenic and cadmium added to the system being
available in NH4NO3-extractable fractions. After 5 days, bioavailable Cd2+ concentrations were further
reduced to undetectable levels in both the CaCO3 and Na2HPO4 + NaCl treated soil. In the As3+ co-
contaminated soil treated with CaCO3 and CaSO4.2H2O, a 23.91% and 51.028% reduction in the
bioavailable fraction was observed after 15 days, respectively. However, treatment with Na2HPO4 + NaCl
resulted in higher bioavailable fractions compared to the As3+ positive control.

98
Table 4.4: Concentration of NH4NO3-extractable arsenic concentrations (mg/kg) in co-contaminated loam soil amended with treatment additives.
Day 0 Day 5 Day 10 Day 15 Day 20
Positive control 4.09 ± 0.38 1.71 ± 0.05 1.34 ± 0.05 0.78 ± 0.02 0.77 ± 0.06
CaCO3 4.09 ± 0.38 1.47 ± 0.33 1.23 ± 0.07 0.59 ± 0.04 0.81 ± 0.08
Na2HPO4 + NaCl
4.09 ± 0.38 3.36 ± 0.08 2.77 ± 0.23 2.69 ± 0.07 2.14 ± 0.01
CaSO4.2H2O
4.09 ± 0.38 1.25 ± 0.03 0.97 ± 0.09 0.38 ± 0.02
0.29 ± 0.03
Values are averages of triplicate data ± standard deviation. Table 4.5: Concentration of NH4NO3-extractable cadmium concentrations (mg/kg) in co-contaminated loam
soil amended with treatment additives.
Day 0 Day 5 Day 10 Day 15 Day 20 Positive control 1.05 ± 0.28 0.25 ± 0.18 0.09 ± 0.05 ND ND
CaCO3 1.05 ± 0.28 ND ND ND ND
Na2HPO4 + NaCl
1.05 ± 0.28 ND ND 0.02 ± 0.01 ND
CaSO4.2H2O 1.05 ± 0.28 0.62 ± 0.22 0.01 ± 0.02 ND ND
Values are averages of triplicate data ± standard deviation; ND-Not detectable.

99
4.3.4 Combined effects of 1,2-DCA and heavy metals on soil microbial enzyme activities
The activity of soil enzymes was used to estimate the adverse effects of various pollutants on soil
quality. Significant variations in urease and dehydrogenase enzyme activities in the co-contaminated soil
were observed in this study (Figures 4.2 and 4.3). Dehydrogenase activity was lower in all heavy metal
amended samples than those in the control (Figure 4.2). After 20 days, soil dehydrogenase activity was
significantly inhibited by 87.26% and 86.33% in the As3+ and Cd2+ co-contaminated soil, respectively.
The combined effect of 1,2-DCA and heavy metals on dehydrogenase activity at the different incubation
times was significantly lower than the control sample containing no heavy metals. Overall soil
dehydrogenase activities were lower in the heavy metal co-contaminated sample compared to the treated
soil, with the exception at day 5, in the Cd2+ co-contaminated soil. Moreover, in the As3+ co-contaminated
soil, an increase in dehydrogenase activity of 67.56%, 76.48% and 45.93% was observed in the presence
of CaCO3, Na2HPO4 + NaCl and CaSO4.2H2O after 20 days, respectively, compared to the untreated co-
contaminated soil. The alleviation of the inhibitory effect was more pronounced in As3+ co-contaminated
soil for both CaCO3 and Na2HPO4 + NaCl with up to 7.92% increase in dehydrogenase activity compared
to soil co-contaminated with Cd2+. However, the positive effect of CaSO4.2H2O in the Cd2+ co-
contaminated soil resulted in a 6.23% increase in dehydrogenase activity compared to the As3+ co-
contaminated soil. Soil urease activity was significantly inhibited in the presence of heavy metals,
resulting in a 31.37% (Figure 4.3a) and 69.58% (Figure 4.3b) decrease in the presence of As3+ and Cd2+,
respectively. In the case of treatment additives, a 74.15%, 69.50% and 70.07% increase in urease activity
occurred in the Cd2+ co-contaminated soil in the presence of CaCO3, Na2HPO4 + NaCl and CaSO4.2H2O
after 15 days, respectively. These values correspond to an increased urease activity of 25.38%, 11.31%
and 29.22% compared to As3+ co-contaminated soil, over the same period. In addition, a slight decrease in
urease activity was observed at day 15 in all additives-treated co-contaminated soil samples.

100
Figure 4.2: Effects of 1,2-DCA and (a) As3+; (b) Cd2+ on soil microbial dehydrogenase activity in microcosms
containing treatment additives. A = unautoclaved soil control + 1,2-DCA; B = unautoclaved soil control + 1,2-DCA + HM; C = soil + 1,2-DCA + HM + CaCO3; D = soil + 1,2-DCA + HM + Na2HPO4 + NaCl; E = soil + 1,2-DCA + HM + CaSO4.2H2O. The results are average of triplicate samples while the error bars show the standard deviation.
0
50
100
150
200
250
0 5 10 15 20
Deh
ydro
gena
se a
ctiv
ity
(µg
INT
F/g
dwt/h
)
Incubation period (days)
a
A B C D E
0
50
100
150
200
250
0 5 10 15 20
Deh
ydro
gena
se a
ctiv
ity
(µg
INT
F/g
dwt/h
)
Incubation period (days)
b
A B C D E

101
Figure 4.3: Effects of 1,2-DCA and (a) As3+; (b) Cd2+ on soil microbial urease activity in microcosms
containing treatment additives. A = unautoclaved soil control + 1,2-DCA; B = unautoclaved soil control + 1,2-DCA + HM; C = soil + 1,2-DCA + HM + CaCO3; D = soil + 1,2-DCA + HM + Na2HPO4 + NaCl; E = soil + 1,2-DCA + HM + CaSO4.2H2O. The results are average of triplicate samples while the error bars show the standard deviation.
0102030405060708090
100
0 5 10 15 20
Ure
ase
activ
ity(μ
g N
H4-
N/g
dw
t/2 h
)
Incubation period (days)
a
A B C D E
0102030405060708090
100
0 5 10 15 20
Ure
ase
activ
ity(μ
g N
H4-
N/g
dw
t/2 h
)
Incubation period (days)
b
A B C D E

102
4.4 Discussion
In the present study, the measured bioavailable concentrations of As3+ and Cd2+ were significantly
lower than the total concentration of the heavy metals added to the system. Metal complexation may be
attributed to several physical and chemical properties which affect the sorption of these heavy metals in
soil, as they are generally not mobile and strongly adsorbed in soil. This correlates with similar reports,
for example, total concentrations of As in the water-extractable fractions of two soil types have been
reported to be < 1.2% and < 0.3% of the initial concentration added to the soil (Kavenagh et al., 1997). A
similar conclusion was drawn by Tye et al. (2002) who reported that labile As was between 1.4% and
19% of the total As in soil.
The loam soil used in the construction of the microcosms contained relatively high concentrations
of calcium, iron, phosphate, sulphate and soluble organic carbon with a moderate pH value of 6.59. The
presence of iron, phosphate, and soluble organic carbon have all been attributed to immobilize free As3+
and Cd2+ fractions in soils (Hartley et al., 2009; Kumpiene et al., 2008; Thakur et al., 2006; Zhao and
Masaihiko 2007). Moreover, the accumulation of both Cd2+ and As3+ in soils may be distributed among
the different soil components, as soil characteristics (pH, adsorption capacity and moisture) affect the
mobility, bioavailability and subsequently its toxicity in the complicated soil matrix (deLemos et al.,
2006; Islam et al., 2004; Jiang et al., 2005; Song et al., 2006; Tang et al., 2006). Soil pH generally has the
greatest impact on the bioavailability or retention of metals in soil, with a greater retention and lower
solubility of metal ions occurring at high soil pH (Marin et al., 1993; Martínez and Motto, 2000; Mitchell
and Barr, 1995). In general, it has been observed that the adsorption of Cd2+ decreases with decreasing pH
(Bolan et al., 1999; Naidu et al., 1994). However, in the case of As3+, the opposite has been observed due
to the adsorption effect on iron oxide surfaces (Madejón and Lepp, 2007). A possible reason for arsenic
toxicity on indigenous microorganisms is the slightly acidic soil pH, as values in the range of 6.5-7.6 can
enhance the risk of As3+ mobility (Hartley et al., 2009). As shown in this study, the toxic effects of both
As3+ and Cd2+ on indigenous microorganisms involved in the degradation of 1,2-DCA and soil microbial
activities were still apparent, albeit at low concentrations.
The application of CaCO3 and CaSO4.2H2O to the co-contaminated soil proved to be effective in
reducing the bioavailable fractions of As3+, resulting in an increase in 1,2-DCA degradation relative to the
untreated control. This result correlates with the findings of several researches suggesting that As
immobilization is mainly controlled by the formation of Ca-As precipitates (Dutré and Vandercasteele,
1995; 1998; Dutré et al., 1999; Mahuli et al., 1997; Vandercasteele et al., 2002). These studies have
shown that the precipitation of calcium arsenate (Ca3(AsO4)2) and calcium hydrogen arsenate (CaHAsO3)
controls the immobilization of As in contaminated soils which have been treated with lime among other
raw materials. Complexes such as these are precipitated in the presence of Ca under highly oxidizing and
moderate pH conditions (Porter et al., 2004; Wenzel et al., 2001). Hartley et al. (2004) observed that lime

103
reduces As leaching in soil by 8%, and suggested that this phenomenon may be due to the same
mechanism of As binding with Ca2+ forming As-Ca complexes, thus reducing the mobility and resulting
bioavailable fraction.
Treatment with Na2HPO4 + NaCl proved to be the most effective in increasing the degradation of
1,2-DCA in the presence of Cd2+, as observed after 5 days. The decrease in the bioavailable concentration
of Cd2+ in the water soluble fraction (Table 4.4) with a corresponding increase in 1,2-DCA degradation
provided indirect evidence for the formation of Cd compounds with low solubility. The possibility of
forming Cd3(PO4)2 upon the addition of phosphate based compounds to Cd contaminated soils has been
proposed (Cotter-Howells and Caporn, 1996; Ma et al., 1993). The phosphate-induced decrease of Cd2+ in
the water soluble fraction infers that the addition of phosphate to the soil resulted in a decrease in the
bioavailability of Cd, which in turn progressively intensified the Cd immobilization capacity of the soil
(Olaniran et al., 2009). Furthermore, it has been observed by Bolan et al. (1999) that Cl- forms a complex
with Cd as CdCl+ which reduces the adsorption of Cd by solid phase. Since it is a well-accepted premise
that microorganisms derive most of their nutrients from the water soluble fraction, a decrease in
bioavailable Cd2+ in the water soluble fraction will thus lead to decreased uptake by microorganisms.
However, an increase in the bioavailable fraction of Cd2+ was observed in soil treated with Na2HPO4 +
NaCl after 15 days, followed by a decrease by day 20. Investigations have also shown that calcium
carbonate and exchangeable Ca2+ are important phosphate sorbents in soils (Kuo and Lotse, 1972;
Tekchand and Tomar, 1994). These suggest that Cd and phosphate may influence the absorption of each
other, either by competing for the Ca2+ sorption sites or by influencing the surface charge potential. The
high Ca2+ ion concentration in the soil may have contributed to the phenomenon of increased bioavailable
Cd2+ observed in this study. Thakur et al. (2006) demonstrated an increase in bioavailable Cd2+ with a
decreasing Ca:P ratio, indicating that affinity of CaCO3 for surface to Cd2+ decreased due to
phosphatization. Moreover, phosphate induces variation in soil pH thereby influencing the solubility of
Cd2+ in soils (Levi-Minzi and Petruzzelli, 1984). However, the effect of phosphate addition on soil pH
depends on the buffering capacity of the soil, the extent of phosphate adsorption and the nature of
phosphate compounds (Havlin et al., 1999).
Lime treatment, which increases soil pH, resulted in a decrease in the bioavailable fraction of
Cd2+ to undetectable limits after 5 days. Thakur et al. (2006) demonstrated that Cd2+ is sorbed on CaCO3
by more than one mechanism of action, depending on the concentration of Cd and the presence of
phosphate. The high affinity of calcite surface for Cd has been attributed to similarity between the ionic
radii of Cd2+ and Ca2+ (McBride, 1980; Pickering, 1983). At low initial Cd levels, the dominant reaction
mechanism is the replacement of Ca2+ with Cd2+ from accessible surface sites. When all CaCO3 surface
sites are covered by chemi-sorbed Cd, nucleation–precipitation of CdCO3 as a surface coating on CaCO3

104
becomes the dominant mechanism (Thakur et al., 2006). Zhao and Masaihiko (2007) reported that the
addition of 2% CaCO3 increased Cd bound to carbonate by 56% as compared to those of the control.
An increase in bioavailable As3+ concentrations was observed after treatment with Na2HPO4 +
NaCl. However, this did not result in decreased degradation of 1,2-DCA. The aerobic conditions
maintained in this study may have resulted in the oxidation of As3+ to As5+ which in turn may have
enhanced the sorption and immobilization of As, since the oxidized form As5+ adsorbs more strongly to
solid phases than As3+ (Wang and Mulligan, 2006). Phosphate and arsenate are chemical analogues that
demonstrate similar chemical behaviour, competing directly for binding sites within the soil (Davenport
and Peryea, 1991; Zhang and Selim, 2008). It has also been demonstrated that phosphate can suppress the
adsorption of As3+, while As5+ is more strongly affected than As3+ (Jain and Loeppert, 2000). In the
present study, addition of phosphate as Na2HPO4 resulted in a two-fold increase in bioavailable As
compared to untreated soil following extraction using NH4NO3. It has been reported that As may be
mobilized in soils after amendment with phosphorus based chemicals, mainly due to competitive anion
exchange (Peryea, 1998; Qafoku et al., 1999). Cao and Ma (2004) reported that addition of phosphate to
soils increased soil water-soluble arsenic via replacement of arsenate by phosphate in soil. In some cases,
sulphate may also compete with As3+ adsorption when the pH is below 7 (Jain and Loeppert, 2000; Meng
et al., 2000; Wilkie and Hering, 1996). In addition, 1,2-DCA degrading bacterial populations decreased
by 7.80% in As3+ co-contaminated soil treated with Na2HPO4 + NaCl from day 10 to day 20. A possible
explanation is that these oxyanions may have competed with microbial uptake systems (Nies, 1999), in
which case the up-take of arsenate may have out-competed that of phosphate.
The untreated co-contaminated soils, with higher bioavailable metal fractions, showed
significantly lower enzyme activities and microbial growth, which indicated the inhibitory effect of
metals on total 1,2-DCA degrading population and on the microbial urease and dehydrogenase enzymes
activities. Upon the addition of treatment amendments, increases in total 1,2-DCA degrading populations
were observed on day 10 for all treatments, except for the Cd2+ co-contaminated soil treated with
CaSO4.2H2O. Gypsum is known to create air and moisture slots that loosen and break-up the soil
structure, thereby creating a greater surface area to which these microorganisms may adhere (Viator et al.,
2002). Treatment amended soils resulted in an increase in dehydrogenase enzyme activities. However,
urease activity was higher compared to the control containing no treatment amendments within the first
10 days followed by a decrease in activity. An explanation for this trend is that, as the microorganisms
degrade organic carbon sources, depletion of inorganic nutrients such as nitrogen may occur (Margesin et
al., 2000). Bioavailable heavy metal fractions are generally more toxic than the other forms because they
can be easily released into water as ions (Ghosh et al., 2004; Roy et al., 2004). Metal ions react with
sulfhydryl (-SH) groups of enzymes, a reaction analogous to the formation of metallic sulfide. This
reaction inactivates enzymes since -SH groups serve as integral parts of the catalytically active sites or as

105
groups involved in maintaining the correct structural relationship of the enzyme protein (Juma and
Tabatabai, 1977). Heavy metals can also reduce enzyme activity by interacting with the enzyme-substrate
complex, denaturing the enzyme protein, interacting with its active sites (Dick, 1997; Nannipieri, 1994) or
by affecting the synthesis of the enzymes within the microbial cells (Vig et al., 2003). Moreno et al.
(2001) reported that the toxicity of Cd on urease and dehydrogenase activities decreased in soil with low
pH and high soluble organic carbon, which is apparent in the soil used in this study. The degree of
inhibition of urease enzymatic activity with As3+ and Cd2+ was higher after 5 days than after 20 days of
incubation. This indicates a recovery of the extracellular enzyme activities despite heavy metal
contamination. The reverse trend was observed with the intracellular dehydrogenase enzymatic activities.
In addition, besides being an enzyme inhibitor, heavy metals can have deleterious effects on membrane
structure and function by binding to the ligands such as phosphate and the cysteinyl and histidyl groups of
proteins (Collins and Stotzky, 1989). The addition of treatment amendments which ultimately lowered the
bioavailable fraction of heavy metals increased the activity of soil microorganisms.
In general, amendment of soil with treatment additives increases the residual fraction of heavy
metals due probably both to the formation of strong bonds between the metals and the adsorbing surface
or metal precipitation in the limed soil (Lombi et al., 2002). Among the three amendments, CaCO3 was
the most efficient at increasing the degradation of 1,2-DCA in co-contaminated soil. It seems clear that
the increased degradation of 1,2-DCA by the indigenous microorganism in the treated soils was related to
the decrease of the bioavailable fraction of metals. As shown in this study, bioavailable As3+ and Cd2+ can
reduce the degradation rate of 1,2-DCA, the model organic compound in soil under investigation.
Application of treatment additives can be used as a means of reducing bioavailable fractions of these
heavy metals, thereby limiting microbial toxicity and ultimately leading to increased degradation of 1,2-
DCA in such co-contaminated soil environments. This is important for many industrialized countries as a
large proportion of agricultural land is contaminated with both heavy metal and organic compounds
(Suhadolc et al., 2004). As a consequence, any kind of additive which may lead to increased
bioavailability of heavy metals should be avoided, as heavy metals such as As3+ and Cd2+ interfere with
microbial activities. Results from this study suggest that efficacy of treatment additives addition to co-
contaminated soil environments for improved organic compound degradation can vary depending on the
particular combination of elements present in the soil as well as the range of biological endpoints of
concern. In addition, the retention of heavy metals in soils within a given time can be achieved by the
addition of sorbing phases and complexing agents. However, the sustainability of maintaining reduced
solubility conditions is the key to the long-term success of the treatment (Wang and Mulligan, 2006) in
co-contaminated soil.

CHAPTER FIVE GENERAL DISCUSSION AND CONCLUSION

106
5.1 The research in perspective
Numerous advanced technologies have emerged in the field of environmental biotechnology to
tackle the challenges of cleaning up contaminated sites. Bioremediation is one such emerging technology
which takes advantage of the astounding catabolic versatility of microorganisms to degrade and/or
detoxify contaminants for alleviation of the noxious effects. In situ bioremediation in particular, has
shown enormous potential for remediating highly contaminated environments. However, varying degrees
of inconsistencies in their application on the field have been reported, raising fundamental questions, viz.,
(i) how to clarify the biological involvement in the effectiveness of bioremediation and (ii) how to
evaluate the environmental impact of bioremediation. In order to address these questions, it is essential to
carry out laboratory feasibility tests to determine the effectiveness of bioremediation at a small scale,
prior to implementation on a full-scale field application.
Approximately 40% of the hazardous waste sites currently on the National Priorities List sites
identified by the U. S. Environmental Protection Agency are co-contaminated with organic and heavy
metal pollutants (Cheng, 2003; Fierens et al., 2003; Norena-Barroso et al., 2004; Sandrin et al., 2000;
Sandrin and Maier, 2003). Co-contaminated environments are considered difficult to remediate because
of the mixed nature of the contaminants and the fact that the two components often must be treated
differently (Roane et al., 2001). Moreover, all heavy metals are known to be potentially toxic to soil
microorganisms at high concentrations and can hinder the biodegradation of organic contaminants (Amor
et al., 2001; Bååth, 1989; Benka-Coker and Ekundayo, 1998; Riis et al., 2002, Roane et al., 2001; Sokhn
et al., 2001; White and Knowles, 2000; 2003). Heavy metals appear to affect organic pollutant
biodegradation through interference with the ecophysiology of organic degrading microorganisms, thus
imposing a double stress on the microbial populations (Roane et al., 2001). Pollutant biodegradation may
be inhibited through interaction with enzymes directly involved in biodegradation or those involved in
general metabolism, thus rendering the enzyme non-functional (Angel and Chaney, 1989; Sandrin and
Maier, 2003). Although broad ranges of heavy metal concentrations have been reported to inhibit
biodegradation, the effects of metals on biodegradation processes have not been well-characterized, and
different patterns of inhibition have also been reported (Kuo and Genthner, 1996; Roane and Pepper,
1997; Sandrin et al., 2000). Also, the effects of metal toxicity on organic pollutant biodegradation in co-
contaminated soil environments have not been adequately defined, quantitatively or qualitatively (Sandrin
and Maier, 2003). In addition, the presence of multiple contaminants may present extreme challenges to
the maintenance of a phylogenetically and functionally diverse microbial community required for the
degradation process. The objective of this study, therefore, was to assess the impact of heavy metals on
the aerobic biodegradation of 1,2-dichloroethane (1,2-DCA) in soil, on a small scale laboratory test
system.

107
This study incorporated the use of soil microcosms as practical testing systems, to obtain
important preliminary information on the biodegradation of 1,2-DCA in heavy metal co-contaminated soil
as well as determined the effects of biostimulation, bioaugmentation and treatment additives on the
biodegradation process prior to a full-scale field application. Microcosms have previously been used to
mimic real world exposures, revealing promising results. Such methods, however, are limited in their
direct application to field situations. By using microcosms, soils could be homogenized to evenly
distribute both the microbial populations and toxicants, and thereby reduce spatial variability. Prior to
implementing in situ bioremediation protocols, it is also important to establish the indigenous microbial
potential and to assess the limiting factors to be controlled during treatment. This information is crucial,
especially in the case of implementing bioremediating strategies such as biostimulation and
bioaugmentation. In addition, feasibility tests should reveal that removal of the target compound is due to
the effect of biodegradation and that the rate at which this occurs is greater than the natural rate of
decontamination (Bento, 2005). In order to establish this, it is important to incorporate and differentiate
between non-biological dissipation mechanisms and biodegradation. This involves comparing loss of the
compound in sterile treatments with non-sterile treatments. In this study, autoclaved soil amended with
mercuric chloride was used to measure abiotic losses of 1,2-DCA. Autoclaving soil samples for sterile
controls have been widely used in bioremediation feasibility studies (Carter et al., 2007); however, it has
been reported to induce changes on the physico-chemical properties of soils. These changes include
aggregation of clay particles which leads to a decrease in soil surface area and significant changes in
adsorption of organic compounds (Lotrario et al., 1995). These factors could account for alterations in
solvent extractability or abiotic transformation of 1,2-DCA in the autoclaved soil control.
In this study, 1,2-DCA was readily degraded by indigenous microorganisms in the soil samples
tested. It was observed that more degradation occurred in loam soil compared to clay soil over the same
period of the degradation process. Thus, it is evident that the soils harboured different microorganisms
capable of biodegrading 1,2-DCA at various rates. Moreover, the different physico-chemical properties of
the soils such as pH, moisture content and nutrient bioavailability are known to affect the rate of organic
biodegradation (Olaniran et al., 2009; 2006). In this case, the higher degradation rate of 1,2-DCA in loam
soil compared to clay soil could be attributed to the increased levels of inorganic trace elements (e.g.,
nitrogen, iron and calcium) in loam soil, as increased levels of trace elements have been demonstrated to
enhance biodegradation rates in both marine and terrestrial ecosystems considerably (Atlas and Bartha,
1992). The presence of As3+, Cd2+, Hg2+ and Pb2+ was observed to negatively impact the degradation of
1,2-DCA, with Hg2+ having the highest inhibition effect in clay soil and As3+ in loam soil. An increase in
the half-lives (t½) of 1,2-DCA was also observed, thus confirming the toxic effects of the heavy metals on
indigenous microorganisms involved in 1,2-DCA degradation. Moreover, in clay soil, a dose-dependent

108
relationship between pseudo-first-order transformation rate coefficient (k1) and metal ion concentrations
in which k1 decreased with higher initial metal concentrations was observed for all the heavy metals tested
except for Hg2+. Of interest were that combinations of metals resulted in non-linear responses, whereby
combinations of two heavy metals resulted in a greater negative impact on 1,2-DCA degradation
compared to the combinations of three or four heavy metals.
Most reports on the effects of metal toxicity on organic pollutant biodegradation in soil
environments have not focused on quantitatively assessing the impact of heavy metals. This is mainly due
to related complications which stem from the fact that the physical and chemical state of the metals is
affected by environmental conditions (Said and Lewis, 1991). Moreover, the total contaminant levels are
not indicative of essentially occurring adverse effects, as the toxic effects are determined not only by their
intrinsic toxicity and concentration but also by their physico-chemical forms (Guéguen et al., 2004;
Sandrin and Maier, 2003). Therefore, when considering inhibition data, it is important to take into
account the possible effects of various environmental factors, such as nutrient availability, quality and
bioavailability of contaminants, and soil properties. Bioavailable fractions of heavy metals in free ionic
and labile forms have the potential to interact with biological vectors such as microorganisms. When
measuring bioavailable concentrations of heavy metals, it was noted that this fraction was significantly
lower than the total metal concentration of heavy metals added to the system. Several physical and
chemical properties affect the adsorption, complexation and distribution of heavy metals among the
different soil components. Soil characteristics such as pH, adsorption capacity, moisture content and the
presence of certain anions contribute significantly to the mobility, bioavailability and subsequently their
toxicity in the complicated soil matrix (deLemos et al., 2006; Islam et al., 2004; Jiang et al., 2005; Song
et al., 2006; Tang et al., 2006). In particular, the presence of iron, phosphate and soluble organic carbon
has been attributed to immobilizing free fractions of heavy metals in soils. Generally, soil pH has the
greatest impact on the bioavailability or retention of metals in soil, with greater retention and lower
solubility of metal ions occurring at high soil pH (Martínez and Motto, 2000; Mitchell and Barr, 1995).
Metals exert their toxic effects on microorganisms by substituting the toxic metal ions for
physiologically essential ions within an enzyme, thus rendering the enzyme non-functional (Nies, 1999),
and imposition of oxidative stress on microorganisms (Kachur et al., 1998). In this regard, the impact of
heavy metals on growth or activity of the target organisms can be used as a sensitive indicator of the
effects of pollutants (Giller et al., 1998). Nannipieri et al. (1990) stated that measuring a combination of
microbial activities and active population densities provides a more sensitive indication of the effects of
heavy metals. However, measuring enzyme activities in soil has a disadvantage as it can be associated
with active cells, entirely dead cells, and cell debris which may be complexed with clay minerals and
humic colloids (Taylor et al., 2002). Activity of many extracellular hydrolases such as urease is probably

109
a result of enzymes associated with some or all of these components. Ureases are involved in the
biogeochemical transformation of nitrogen and are likely to be an essential component of substrate
mineralization (Taylor et al., 2002). On the other hand, dehydrogenase is present in all microorganisms
and provides a more accurate measure of intracellular catalysis. It is considered as an accurate measure of
the microbial oxidative activity of the soil and has a direct relationship to total viable microorganisms
(Dick, 1997). Measuring both enzyme activities in the co-contaminated soil samples provided a more
accurate assessment of the impact of heavy metals on the indigenous soil microorganisms. Interestingly,
dehydrogenase enzyme activities were negatively correlated with the presence of heavy metals,
confirming the toxicity of heavy metals on indigenous soil microorganisms. Moreover, an accurate and
direct correlation between dehydrogenase and total 1,2-DCA degrading populations was observed in the
unautoclaved soil control. Since the method for assessing enzyme activity is critical, the buffered method
of Kandeler and Gerber (1988) was used in this study. This method measures enzyme activity at the
natural pH of the soil, which provides a more realistic indication of the activities likely to occur in situ. In
the first 5 days of incubation, heavy metals reduced urease activity and thereafter an increase in urease
activity was observed. This trend has been attributed to the increased abundance of tolerant
microorganisms in co-contaminated environments, due to genetic changes and physiological adaptations
involving no alterations in the genotype (Bruins et al., 2000; Shen et al., 2006). Another interesting
observation was the relatively low urease activity in the presence of glucose and fructose, which can be
attributed to the depletion/decrease in nitrogen sources. It has been reported that addition of large
quantities of organic carbon sources may deplete macronutrients such as nitrogen (Margesin et al., 2000).
Overall, soil urease activity has been shown to be more sensitive to pollution than that of other soil
enzymes (Shen et al. 2006). In this study, urease and dehydrogenase activity proved to be sensitive
indicators of soil pollution in the co-contaminated environment, with concomitant lower net degradation
rates, in the microcosms.
The bioaugmentation strategy employed in this study was effective in enhancing the
biodegradation of 1,2-DCA in the co-contaminated soil. In order to overcome some of the problems or
limitations which relate to the survival of selected strains, an alternative generic bioremediation approach
was adopted, namely dual-bioaugmentation. This technique was based on strengthening a portion of the
native microbial community, which in turn inferred multiple resistance to heavy metals, thereby indirectly
protecting metal sensitive 1,2-DCA degrading strains from metal toxicity. This is supported by increased
proliferation of total 1,2-DCA degrading populations in the dual-bioaugmented microcosms. In particular,
the finding in this study correlates well with that of Roane et al. (2001) who reported that dual-
bioaugmentation, involving inoculation with both metal-detoxifying (Ralstonia eutropha JMP134) and
organic-degrading (Pseudomonas H1) bacteria, facilitates the degradation of 2,4-dichlorophenoxyacetic

110
acid in the presence of cadmium co-contamination. Alisi et al. (2009) reported that bioaugmentation with
a microbial formula tailored with selected native strains, in the presence of heavy metals, resulted in an
overall reduction of about 75% of the total diesel hydrocarbons in co-contaminated soil. However,
monitoring the survival of the heavy metal-resistant strain in the co-contaminated soil will provide a more
promising indication of the effectiveness of such an approach.
When considering biostimulation as an option to ameliorate contaminated environments, it is
necessary to first determine the physico-chemical parameters of the target compound. In the As3+ and
Cd2+ co-contaminated soil, biostimulation with fertilizer proved most effective in enhancing the
degradation of 1,2-DCA. Contradictory opinions about the effect of nutrients on biodegradation of
chlorinated organic pollutants have been documented, in particular, conflicting results regarding the
impact of nitrogen application. Results showed that nitrogen addition either enhanced microbial activity
thus accelerating degradation, or altered enzymatic systems responsible for the degradation (Demoling et
al., 2007; Ruppel et al., 2007). However, in co-contaminated soils, addition of nutrients which are aimed
at accelerating the breakdown of the target compound may have a stimulatory effect on microbial
activities, leading to redistribution and in most cases leaching of the heavy metal to the soil solution
(Browere et al., 2004; Signes-Pastor et al., 2007). Alternatively, phosphates which are used mainly as a
treatment additive may have a two-fold effect by reducing bioavailable concentrations, as well as
providing a low source of phosphorus (Liebeg and Cutright, 1999). Moreover, in co-contaminated soil,
the presence and fate of nutrients is the key factor determining the overall success of the biostimulation
regime. In this regard, amendment with slow-release fertilizers, such as Inipol EAP-22 (Lessard et al.,
1995) and inorganic fertilizers may be a suitable alternative. Slow-release inorganic fertilizers provide a
sustained release of nutrients while being slowly dissolved or degraded by continual or intermittent
contact with water (Xu et al., 2005).
In general, amendment of soil with treatment additives increased the residual fraction of heavy
metals, due probably both to the formation of strong bonds between the metals and the adsorbing surface
or metal precipitation in the limed soil (Lombi et al., 2002). Among the three amendments, CaCO3 was
the most efficient at increasing the degradation of 1,2-DCA in co-contaminated soil. It seems clear that
the increased degradation of 1,2-DCA by the indigenous microorganism in the treated soils was related to
the decrease in the bioavailable fraction of metals. It was also observed that some treatment additives
resulted in increased levels of bioavailable fractions of heavy metals. However, this did not result in an
increase in 1,2-DCA degradation. Due to the dynamic nature of metals to interact with various soil
components and macronutrients, it is important to consider these factors prior to implementing such
strategies to bioremediate co-contaminated soils.

111
DGGE profiles of PCR-amplified 16S rDNA region revealed close similarities in the banding
patterns between the As3+ and Cd2+ treated co-contaminated soil, suggesting that the same organisms were
able to withstand the toxic effects of these metals as well as utilize 1,2-DCA. In the co-contaminated
microcosms amended with fertilizer, numerous lighter bands were observed on the gel profile. It could
therefore be suggested that the addition of fertilizer led to the enrichment of a small number of
genospecies. These observations corroborate with previous studies on community structures in fertile
soils which harbour an equitable distribution of a large number of phylotypes which produces a DGGE
profile with diffuse staining and few distinct bands (Nakatsu et al., 2000).
In co-contaminated soil environments, microbial communities are undoubtedly the key driving
force behind the biological treatment of pollutants. As indicated in this study, heavy metals reduced the
activity of indigenous microorganisms, thus decreasing the degradation rate of 1,2-DCA. The study
emphasizes the toxic effects of heavy metals by quantitatively assessing the possible interference of the
metallic species on 1,2-DCA degradation. Application of dual-bioaugmentation strategy and
biostimulation with fertilizer was most efficient at enhancing the degradation of 1,2-DCA. Treatment
additives, in particular CaCO3 were also effective, and can be used as a means of reducing bioavailable
fractions of heavy metals, thereby limiting microbial toxicity and ultimately leading to increased
degradation of 1,2-DCA in soil co-contaminated with heavy metals. However, a more thorough
understanding of the extent and mechanisms by which metals inhibit 1,2-DCA degradation is needed.
These results are encouraging and allow for the identification of some alterations that could be introduced
to overcome a critical bottle neck of the bioremediation technology. In this regard, the bioremediation
strategies adopted in this study may be used as a rational methodology for remediation of sites co-
contaminated with 1,2-DCA and heavy metals, subject to a thorough understanding of the site’s ecology
and of the local physico-chemical constraints. This is important for many industrialized nations, as a large
proportion of agricultural land is co-contaminated with heavy metals and organic pollutants.
5.2 Potential for future development of the study
Firstly, the difficulties inherent in studying the effect of heavy metals on chlorinated organic
pollutants may be associated with the methodological choices for devising protocols and the methods
used for data treatment (Ren et al., 2004). Since application of bioremediation strategies is time
consuming, it is essential to design experiments which can cut experimental time and improve the
efficiency of experiments. In this respect, experimental uniform design can provide an important
contribution to research development in this area (Shen et al., 2006). Basically, this design is aimed at
distributing the experimental points evenly in the factor space so as to have fewer trials and with each
point having full representation. This design has been applied successfully in many other facets of

112
research (Cheng et al., 2002; Liang et al., 2001), and has brought about results closer to the facts of
combined pollution of organic and heavy metals in real-world exposures (Shen et al., 2006). Case studies
using the approach employed in this study may be used to large scale treatment of 1,2-DCA co-
contaminated soil. Also, it is imperative that feasibility studies incorporate various environmental samples
prior to implementing bioremediation strategies in situ. Since this study focused primarily on co-
contaminated soil microcosms, more research incorporating water microcosm set-up should be conducted.
In addition, the effects of co-contaminated soil conditions, such as moisture content and pH, should be
investigated as these properties play significant roles on metal bioavailability.
In addition to DGGE, various other culture-independent techniques such as single strand
conformation polymorphism (SSCP) and terminal restriction fragment length polymorphism (T-RFLP),
along with numerous other techniques, have provided a wealth of information regarding the dominant
microbial species as well as detection of specific microorganisms involved in the biodegradation of
organic pollutants. Some of these molecular fingerprinting methods were observed to be too sensitive,
giving high resolution to provide reliable and robust genotypic characterization at the community level
(Torsvik et al., 1998) in single pollutant contaminated sites. Therefore, approaches such as these hold
great promise for assessing microbial diversity in co-contaminated environments. Combination of
different methods that complement each other is a useful strategy for monitoring changes in microbial
communities and ecosystems, and should definitely be considered when assessing microbial diversity in
co-contaminated environments, such as in the present study. In addition, catabolic gene-specific primers
may be used to confirm the direct roles of organisms in 1,2-DCA degradation, thus providing a possible
link between phylogeny and function. High-throughput approaches are also making in-roads for
characterization of microbial communities in co-contaminated sites. Metagenomics is one such
technology which has the potential to provide direct access to the entire pool of environmental genomes,
leading to the construction of metagenomic libraries. Such techniques are expected to boost the discovery
of new catabolic activities, and provide valuable information for the management and sustainable clean-
up of co-contaminated sites.

APPENDIX A COMPOSITION OF MEDIA AND REAGENTS

163
Table 1: Composition of synthetic groundwater per litre of deionized water (pH 7.8).
Adjust the pH to 7.8 using NaOH or HCl
Table 2: Composition of minimal salts medium (MMZ) per litre of deionized water (pH 7).
Table 3: Composition of trace element solution per litre of deionized water.
Filter sterilized solution using 0.2 μm filter
Reagent Quantity (mg) MgCl2. 6H2O 304.95 KCl 8.95 NH4NO3 2.40 CaCl2 110.99 Ca(OH)2 111.15 NaHCO3 714.09
Reagent Quantity KH2PO4 1.36 g Na2HPO4.12H2O 5.37 g (NH4)2SO4 0.50 g MgSO4.7H2O 0.20 g Trace element solution 5.00 ml Bacteriological agar 12.00 g
Reagent Quantity (mg) CaCl2 530 FeSO4.7H2O 200 ZnSO4.7H2O 10 H3BO3 10 CoCl2.6H2O 10 MnSO4.5H2O 4 Na2MoO4.2H2O 3 NiCl2.6H2O 2

164
Table 4: Chemical composition of fertilizer (Chemicult).
Table 5: Preparation of heavy metal stock solutions per litre of deionized water.
Table 6: Percentage moisture in clay and loam soil samples.
Element Quantity N 146 g/kg P 43 g/kg K 274 g/kg Mg 29 g/kg B 240 g/kg Fe 1800 mg/kg Cu 20 mg/kg Zn 50 mg/kg Mo 10 mg/kg Mu 240 mg/kg
Heavy metal salt Quantity (mg) Arsenic oxide (As2O3) – 150 mg/kg 198.05 Cadmium chloride (CdCl2) – 170 mg/kg 277.20 Mercuric chloride (HgCl2) – 500 mg/kg 676.80
Clay Loam Weight prior to drying (g) 150 150 120.86 134.86 Weight after drying (g) 134.27 124.87 118.17 126.35
Average 124.43 128.70 Moisture content (%) 17.05 14.20

165
Urea solution (0.48%) (prepare fresh) Urea (Saarchem) 2.4 g Distilled water (bring up) 500 ml
Potassium chloride solution Potassium chloride (KCl) (Saarchem) 74.6 g 1 M Hydrochloric acid (32% HCl = 10 M) (Merck) 10 ml Distilled water (bring up) 1000 ml
Sodium hydroxide solution (0.3 M) Sodium hydroxide (NaOH) (Saarchem) 12 g Distilled water (bring up) 1000 ml
Sodium salicylate solution Sodium salicylate (Na-salicylate) (Fluka) 17 g Sodium nitroprusside (Merck) 0.12 g Distilled water (bring up) 100 ml
Sodium salicylate/Sodium hydroxide solution (prepare fresh) Sodium hydroxide stock solution 100 ml Sodium salicylate stock solution 100 ml Distilled water 100 ml
Sodium dichloroisocyanide solution (0.1%) (prepare fresh) Sodium dichloroisocyanide (Merck) 0.1 g Distilled water 100 ml
Borate buffer (pH 10) Disodium tetraborate 56.85 g Distilled water (warm) 1500 ml pH adjustment - after cooling (20% sodium hydroxide) pH 10 Distilled water (bring up) 2000 ml
Ammonium standard solution Solution I (1000 μg NH4-N/ml) Ammonium chloride (NH4Cl) (Saarchem) 3.82 g Distilled water (bring up) 1000 ml Solution II Solution I stock solution (varying concentrations) 0.01 - 0.5 ml Potassium chloride solution (bring up) 100 ml
2-(p-iodophenyl)-3(p-nitrophenyl)-5-phenyl tetrazolium chloride (INT) INT (Sigma) 0.03 g N,N-dimethylformamide (N,N-DMF) (Merck, Germany) 100 μl Distilled water (bring up) 50 ml Sonicate with gentle heating

166
0.5 M Disodium ethylenediaminetetraacetate (EDTA) EDTA (Saarchem) 186.12 g Double distilled water (bring up) 1000 ml pH adjustment (sodium hydroxide pellets ~20 g) pH 8
50 × Tris-acetate EDTA buffer (TAE) Tris base 242 g Glacial acetic acid (Merck) 57.1 ml 0.5 M EDTA (pH 8) 100 ml Double distilled water (bring up) 1000 ml pH adjustment (sodium hydroxide pellets/glacial acetic acid) pH 8
Phosphate buffered saline (PBS) Sodium chloride (KCl) (Saarchem) 8 g Potassium chloride (KCl) (Saarchem) 0.20 g Disodium hydrogen phosphate (Na2HPO4.12H2O) (Saarchem) 3.58 g Potassium dihydrogen phosphate (KH2PO4) (Saarchem) 0.24 g Double distilled water (bring up) 1000 ml pH adjustment (hydrochloric acid) pH 7.4
Sodium chloride solution (0.85%) Sodium chloride (NaCl) (Saarchem) 8.5 g Distilled water (bring up) 1000 ml
Ethidium bromide stain (EtBr)
Ethidium bromide (Sigma) 50 µl Double distilled water 500 ml
Primer stocks (16S rDNA region) (Inqaba Biotec) Double distilled water added to 63F primer 408.73 µl Double distilled water added to 1387R primer 250.81 µl Final concentration 100 µM
Primer stocks (V3 – V5 region) (Inqaba Biotec) Double distilled water added to 341F-GC primer 280.36 µl Double distilled water added to 907R primer 343.99 µl Final concentration 100 µM
Denaturing solution (0%) 40% Acrylamide/bisacrylamide (BioRad) 15 ml 50 × TAE buffer (pH 8) (BioRad) 2 ml Double distilled water 83 ml

167
Denaturing solution (100%) 40% Acrylamide/bisacrylamide 15 ml 50 × TAE buffer (pH 8) 2 ml 40% (v/v) Deionized formamide (BioRad) 40 ml 7 M Urea (BioRad) 42 g Double distilled water (bring up) 100 ml
Ammonium persulphate (APS) APS (10%) (Promega) 0.05 g Double distilled water 500 µl

APPENDIX B STANDARD CURVES AND NUMERICAL DATA

168
Table 1: Gas chromatographic peak area values used for construction of 1,2-DCA standard curve in clay soil.
1,2-DCA (μl) Sample 1 Sample 2 Sample 3 Average Standard deviation
5 5 188 8 257 9 096 7 514 2 057 10 17 149 18 711 18 522 18 127 853 15 25 917 16 037 24 774 22 243 5 405 20 31 887 28 945 32 833 31 222 2 028 25 29 043 37 525 35 397 33 988 4 413
Figure 1: Standard curve for determination of 1,2-DCA concentration in clay soil. Table 2: Gas chromatographic peak area values used for construction of 1,2-DCA standard curve in loam
soil.
1,2-DCA (μl) Sample 1 Sample 2 Sample 3 Average Standard deviation
5 4 072 3 910 3 907 3 963 94 10 7 072 8 408 7 534 7 671 679 15 10 097 11 192 10 361 10 550 571 20 14 242 14 202 14 222 14 222 20 25 16 657 17 965 17 474 17 365 661
Figure 2: Standard curve for determination of 1,2-DCA concentration in loam soil.
y = 0.0007x - 1.5338R² = 0.9655
0
5
10
15
20
25
30
0 5000 10000 15000 20000 25000 30000 35000
1,2-
DC
A co
ncen
trat
ion
(μl/1
00 g
soil)
GC Peak Area
y = 0.0015x - 1.1004R² = 0.9987
0
5
10
15
20
25
30
0 5000 10000 15000 20000 25000
1,2-
DC
A co
ncen
trat
ion
(μl/1
00 g
soil)
GC Peak Area

169
Table 3: Gas chromatographic peak area values used for construction of 1,2-DCA standard curve in loam soil undergoing bioremediation treatments.
1,2-DCA (μl) Sample 1 Sample 2 Sample 3 Average Standard deviation
5 4270 4092 3963 4108 154 10 8487 8907 9700 9031 616 15 14041 13273 12637 13317 703 20 16959 18476 19442 18292 1252 25 22993 22730 20910 22211 1134
Figure 3: Standard curve for determination of 1,2-DCA concentration in loam soil undergoing
bioremediation treatments. Table 4: Optical density values used for dehydrogenase activity standard curve.
INTF (μg per test) Sample 1 Sample 2 Sample 3 Average Standard
deviation 10 0.043 0.032 0.036 0.037 0.006 20 0.076 0.084 0.092 0.084 0.008 50 0.199 0.196 0.208 0.201 0.006 70 0.266 0.272 0.296 0.278 0.016 100 0.303 0.387 0.394 0.361 0.051 150 0.563 0.539 0.541 0.548 0.013 200 0.756 0.726 0.722 0.735 0.019 250 0.927 0.898 0.905 0.910 0.015 300 1.067 1.058 1.051 1.059 0.008
Figure 4: Standard curve for determining INTF concentration in the dehydrogenase activity test.
y = 0.001x + 0.292R² = 0.998
0
5
10
15
20
25
30
0 5000 10000 15000 20000 25000
1,2-
DC
A co
ncen
trat
ion
(μl/1
00 g
soil)
GC Peak Area
y = 0.003x + 0.016R² = 0.999
0
0.2
0.4
0.6
0.8
1
1.2
0 100 200 300 400
Opt
ical
den
sity
(A49
0nm
)
INTF concentration (μg per test)

170
Table 5: Optical density values used for urease activity standard curve.
NH4 (μg NH4-N/ml) Sample 1 Sample 2 Sample 3 Average Standard
deviation 0.1 0.069 0.071 0.079 0.073 0.005 0.2 0.121 0.153 0.114 0.129 0.021 0.3 0.178 0.183 0.196 0.186 0.009 0.4 0.220 0.246 0.262 0.243 0.021 0.5 0.285 0.294 0.286 0.288 0.005 1.0 0.564 0.576 0.593 0.578 0.015 1.5 0.876 0.886 0.907 0.890 0.016 2.5 1.334 1.458 1.401 1.398 0.062 3.5 1.978 1.986 1.972 1.979 0.007 4.5 2.532 2.549 2.539 2.540 0.009 5 2.772 2.848 2.845 2.822 0.043
Figure 5: Standard curve for determining ammonium concentration in the urease activity test.
y = 0.560x + 0.018R² = 0.999
0
0.5
1
1.5
2
2.5
3
0 2 3 5 6
Opt
ical
den
sity
(A69
0nm
)
Ammonium concentration (μg NH4-N/ml)

171
Table 6: Gas chromatographic peak area values used for clay soil samples co-contaminated with different concentrations of heavy metals.
Microcosm Day 0 Day 5 Day 10 Day 15 Day 20 Day 25 Day 30
Autoclaved soil control 19 103 16 278 15 704 14 906 14 106 13 583 13 411 21 244 19 859 17 553 15 856 14 956 14 617 13770
- - - - - - -
Unautoclaved soil control
19 307 12 230 9 780 6 061 5 475 4 388 3 938 22 339 15 046 11 803 6 999 6 496 5 054 4 233
- - - - - - -
[As3+
] mg/
kg
75 18 283 12 847 11 571 6 813 6 525 4 651 3 770 21 305 14 918 12 192 5 017 7 292 6 032 4 642 21 771 15 557 12 635 8 599 8 409 6 576 5 403
112.5 20 475 14 867 12 873 8 979 8 738 7 027 5 686 22 805 16 161 13 576 8 869 9 228 7 299 5 379 22 122 13 185 9 374 6 909 5 763 4 221 2 385
150 17 531 14 411 12 265 8 612 8 377 6 883 5 714 21 129 16 602 14 448 10 857 10 454 8 866 7 120 20 682 13 823 10 878 6 676 6 613 4 929 4 485
[Cd2+
] mg/
kg
85 18 849 13 820 11 787 8 149 7 794 5 997 4 858 19 648 12 216 9 716 6 035 5 802 4 399 3 649 18 314 12 812 11 236 6 450 6 628 5 051 3 897
127.5 21 111 13 112 11 705 7 749 6 808 5 526 4 662 21 115 12 653 10 922 8 872 7 084 5 559 4 676 18 266 10 886 9 656 6 242 5 396 4 148 3 227
170 20 049 12 538 10 869 8 642 8 406 6 767 6 012 19 937 11 927 9 476 6 731 6 386 5 080 4 429 17 494 14 289 11 657 8 159 7 320 5 963 4 980
[Hg2+
] mg/
kg
840 20 795 15 314 13 940 11 087 10 850 7 502 6 390 18 905 15 265 13 144 11 269 10 587 7 983 6 277 18 073 14 324 12 243 8 356 10 015 6 148 4 905
1260 19 987 12 514 10 638 7 098 8 781 5 465 4 445 17 999 15 335 14 315 10 680 9 137 6 097 4 846 18 415 12 432 12 317 8 149 9 897 6 374 5 480
1680 18 313 15 842 13 499 12 041 11 176 8 524 7 538 18 331 17 265 15 591 12 254 10 647 6 476 5 069 19 139 15 226 11 212 8 521 7 983 6 539 5 734
[Pb2+
] mg/
kg
420 19 074 10 671 9 528 7 146 6 730 4 016 3 426 18 496 11 497 9 021 5 521 6 079 3 897 3 266 19 749 11 663 10 870 6 986 6 472 5 044 4 411
630 19 044 10 317 10 411 7 214 7 069 6 036 5 048 19 938 13 496 10 678 7 944 7 234 4 955 4 131 19 299 11 281 8 937 5 193 4 733 3 971 3 134
840 19 887 12 392 10 077 6 097 7 209 4 717 3 910 18 533 12 039 9 811 7 943 6 908 4 682 3 836 18 807 12 736 11 115 8 204 7 583 5 393 4 462

172
y = -0.012x + 2.398R² = 0.911
y = -0.017x + 2.567R² = 0.961
0.0
0.5
1.0
1.5
2.0
2.5
3.0
0 5 10 15 20 25 30 35
Ln 1
,2-D
CA
(μl
/100
g cl
ay s
oil)
Time (days)
Autoclaved soil controlSample 1 Sample 2
y = -0.076x + 2.372R² = 0.979
y = -0.076x + 2.589R² = 0.983
0.0
0.5
1.0
1.5
2.0
2.5
3.0
0 5 10 15 20 25 30 35
Ln 1
,2-D
CA
(μl
/100
g cl
ay s
oil)
Time (days)
Unautoclaved soil controlSample 1 Sample 2
y = -0.076x + 2.463R² = 0.976
y = -0.065x + 2.447R² = 0.809
y = -0.058x + 2.553R² = 0.981
0.0
0.5
1.0
1.5
2.0
2.5
3.0
0 5 10 15 20 25 30 35
Ln 1
,2-D
CA
(μl
/100
g cl
ay s
oil)
Time (days)
Arsenic (75 mg/kg)Sample 1 Sample 2 Sample 3
y = -0.052x + 2.496R² = 0.981
y = -0.057x + 2.615R² = 0.965
y = -0.086x + 2.545R² = 0.990
-0.5
0.0
0.5
1.0
1.5
2.0
2.5
3.0
0 5 10 15 20 25 30 35
Ln 1
,2-D
CA
(μl
/100
g cl
ay s
oil)
Time (days)
Arsenic (112.5 mg/kg)Sample 1 Sample 2 Sample 3
y = -0.048x + 2.377R² = 0.982
y = -0.042x + 2.551R² = 0.983
y = -0.070x + 2.461R² = 0.970
0.0
0.5
1.0
1.5
2.0
2.5
3.0
0 5 10 15 20 25 30 35
Ln 1
,2-D
CA
(μl
/100
g cl
ay s
oil)
Time (days)
Arsenic (150 mg/kg)Sample 1 Sample 2 Sample 3
y = -0.059x + 2.436R² = 0.985
y = -0.080x + 2.413R² = 0.982
y = -0.072x + 2.418R² = 0.967
0.0
0.5
1.0
1.5
2.0
2.5
3.0
0 5 10 15 20 25 30 35
Ln 1
,2-D
CA
(μl
/100
g cl
ay s
oil)
Time (days)
Cadmium (85 mg/kg)Sample 1 Sample 2 Sample 3

173
y = -0.065x + 2.477R² = 0.983
y = -0.063x + 2.467R² = 0.985
y = -0.086x + 2.394R² = 0.983
-0.5
0.0
0.5
1.0
1.5
2.0
2.5
3.0
0 5 10 15 20 25 30 35
Ln 1
,2-D
CA
(μl
/100
g cl
ay s
oil)
Time (days)
Cadmium (127.5 mg/kg)Sample 1 Sample 2 Sample 3
y = -0.047x + 2.339R² = 0.951
y = -0.065x + 2.335R² = 0.970
y = -0.057x + 2.397R² = 0.992
0.0
0.5
1.0
1.5
2.0
2.5
3.0
0 5 10 15 20 25 30 35
Ln 1
,2-D
CA
(μl
/100
g cl
ay s
oil)
Time (days)
Cadmium (170 mg/kg)Sample 1 Sample 2 Sample 3
y = -0.047x + 2.549R² = 0.965
y = -0.043x + 2.481R² = 0.967
y = -0.055x + 2.452R² = 0.922
0.0
0.5
1.0
1.5
2.0
2.5
3.0
0 5 10 15 20 25 30 35
Ln 1
,2-D
CA
(μl
/100
g cl
ay s
oil)
Time (days)
Mercury (840 mg/kg)Sample 1 Sample 2 Sample 3
y = -0.062x + 2.411R² = 0.923
y = -0.059x + 2.571R² = 0.945
y = -0.048x + 2.359R² = 0.906
0.0
0.5
1.0
1.5
2.0
2.5
3.0
0 5 10 15 20 25 30 35
Ln 1
,2-D
C (μ
l/100
g cl
ay s
oil)
Time (days)
Mercury (1260 mg/kg)Sample 1 Sample 2 Sample 3
y = -0.036x + 2.448R² = 0.979
y = -0.058x + 2.665R² = 0.906
y = -0.052x + 2.419R² = 0.982
0.0
0.5
1.0
1.5
2.0
2.5
3.0
0 5 10 15 20 25 30 35
Ln 1
,2-D
CA
(μl
/100
g cl
ay s
oil)
Time (days)
Mercury (1680 mg/kg)Sample 1 Sample 2 Sample 3
y = -0.081x + 2.419R² = 0.953
y = -0.086x + 2.385R² = 0.963
y = -0.066x + 2.375R² = 0.973
-0.5
0.0
0.5
1.0
1.5
2.0
2.5
3.0
0 5 10 15 20 25 30 35
Ln 1
,2-D
CA
(μl
/100
g cl
ay s
oil)
Time (days)
Lead (420 mg/kg)Sample 1 Sample 2 Sample 3

174
Figure 6: Graphical representation of the degradation rate constants of 1,2-DCA in clay soil co-contaminated with different concentrations of heavy metals.
y = -0.052x + 2.233R² = 0.925
y = -0.071x + 2.496R² = 0.986
y = -0.092x + 2.386R² = 0.981
-1.0
-0.5
0.0
0.5
1.0
1.5
2.0
2.5
3.0
0 5 10 15 20 25 30 35Ln 1
,2-D
CA
(μl
/100
g cl
ay s
oil)
Time (days)
Lead (630 mg/kg)Sample 1 Sample 2 Sample 3
y = -0.052x + 2.233R² = 0.925
y = -0.071x + 2.496R² = 0.986
y = -0.092x + 2.386R² = 0.981
-1.0
-0.5
0.0
0.5
1.0
1.5
2.0
2.5
3.0
0 5 10 15 20 25 30 35Ln 1
,2-D
CA
(μl
/100
g cl
ay s
oil)
Time (days)
Lead (630 mg/kg)Sample 1 Sample 2 Sample 3

175
Figure 7: Regression lines representing the effects of the As3+, Cd2+, Hg2+, and Pb2+ concentrations in clay soil on 1,2-DCA biodegradation rate coefficients (k1) relative to k1 for samples unamended with heavy metals.
y = 72.81x - 130.9R² = 0.911
05
101520253035404550
0.0 0.8 1.6 2.4 3.2
% R
educ
tion
in k
1
Log [As3+] (mg/kg)
y = 60.28x - 109.5R² = 0.976
05
101520253035404550
0.0 0.8 1.6 2.4 3.2
% R
educ
tion
in k
1
Log [Cd2+] (mg/kg)
y = 90.78x - 256.3R² = 0.997
05
101520253035404550
0.0 0.8 1.6 2.4 3.2
% R
educ
tion
in k
1
Log [Hg2+] (mg/kg)
y = 36.97x - 98.78R² = 0.977
-505
101520253035404550
0.0 0.8 1.6 2.4 3.2
% R
educ
tion
in k
1
Log [Pb2+] (mg/kg)

176
Table 7: Gas chromatographic peak area values used for loam soil samples co-contaminated with different concentrations of heavy metals.
Microcosm Day 0 Day 5 Day 10 Day 15 Day 20 Day 25 Day 30
Autoclaved soil control 14 683 13 895 12 894 12 213 11 932 10 977 10 519 12 675 12 111 11 195 10 256 9 782 9 422 8 560 13 518 13 033 11 709 10 403 9 607 8 878 8 603
Unautoclaved soil control 17 819 9 970 5 943 2 294 1 914 1 694 1 038 17 195 8 100 5 422 2 773 2 418 1 806 1 242 16 860 8 404 5 623 2 690 2 375 1 844 1 370
[As3+
] mg/
kg
75 14 854 12 187 7 548 5 782 3 368 2 809 2 325 15 727 9 906 7 758 5 911 3 577 3 069 2 490 14 105 10 558 6 719 5 173 3 168 2 678 2 236
112.5 17 092 11 590 7 788 5 974 3 903 2 962 2 534 15 523 9 374 5 702 4 606 2 629 2 092 1 707 13 564 8 562 6 312 4 933 3 112 2 470 2 000
150 12 014 9 374 6 347 5 024 2 954 2 488 2 004 14 282 9 669 7 123 5 313 3 225 2 736 2 060 13 628 8 616 6 739 5 243 3 270 2 500 2 144
[Cd2+
] mg/
kg
85 16 049 8 862 7 495 4 785 3 618 2 946 2 447 15 989 9 391 6 404 5 025 3 166 2 428 2 079 14 117 8 793 6 154 5 206 3 260 2 758 2 146
127.5 15 467 8 220 5 634 4 417 2 813 2 237 1 693 14 399 8 428 6 118 4 939 3 208 2 518 2 184 13 603 7 154 4 853 4 119 2 426 1 924 1 715
170 15 595 9 243 6 271 4 855 3 315 2 708 2 179 14 668 9 048 6 177 4 886 3 418 2 728 2 164 13 385 8 304 5 712 4 740 3 196 2 511 1 977
[Hg2+
] mg/
kg
840 14 836 8 987 6 504 5 083 3 498 2 743 2 126 14 092 8 861 6 268 5 192 3 315 3 048 2 257 15 239 7 604 5 041 4 223 2 762 2 519 1 702
1260 14 485 8 128 5 734 4 696 3 094 2 392 1 846 15 752 9 761 6 886 5 924 4 101 3 103 2 712 15 526 8 907 5 785 5 124 3 358 2 439 2 124
1680 14 455 7 852 3 382 4 297 3 065 2 140 1 756 14 961 8 901 6 496 5 620 3 959 2 502 2 505 14 844 8 966 6 081 5 196 3 438 2 611 2 194
[Pb2+
] mg/
kg
420 14082 7412 5731 4057 2567 2429 1703 15 825 9 109 5 284 5 358 3 720 2 880 2 347 15 865 8 367 6 043 4 726 3 138 2 389 1 986
630 15 139 7 838 5 568 4 552 2 889 2 195 1 678 14 864 7 847 5 513 4 498 2 840 2 308 1 705 14 609 7 470 5 113 3 999 2 657 1 984 858
840 14 881 8 058 5 744 4 723 2 758 2 243 1 757 14 058 7 649 5 380 4 459 2 848 2 257 1 779 14 653 7 024 4 858 3 923 2 794 1 755 1 543

177
y = -0.011x + 3.035R² = 0.99
y = -0.015x + 2.921R² = 0.945
y = -0.017x + 2.967R² = 0.980
0
0.5
1
1.5
2
2.5
3
0 5 10 15 20 25 30 35
Ln 1
,2-D
CA
(μl
/100
g lo
am s
oil)
Time (days)
Autoclaved soil controlSample 1 Sample 2 Sample 3
y = -0.129x + 3.214R² = 0.969
y = -0.109x + 3.041R² = 0.982
y = -0.104x + 3.007R² = 0.976
-1
-0.5
0
0.5
1
1.5
2
2.5
3
0 5 10 15 20 25 30 35Ln 1
,2-D
CA
(μl
/100
g lo
am s
oil)
Time (days)
Unautoclaved soil controlSample 1 Sample 2 Sample 3
y = -0.078x + 3.116R² = 0.984
y = -0.072x + 3.052R² = 0.987
y = -0.076x + 2.997R² = 0.987
0
0.5
1
1.5
2
2.5
3
0 5 10 15 20 25 30 35
Ln 1
,2-D
CA
(μl
/100
g lo
am s
oil)
Time (days)
Arsenic (75 mg/kg)Sample 1 Sample 2 Sample 3
y = -0.075x + 3.158R² = 0.993
y = -0.091x + 3.026R² = 0.989
y = -0.077x + 2.909R² = 0.993
0
0.5
1
1.5
2
2.5
3
0 5 10 15 20 25 30 35
Ln 1
,2-D
CA
(μl
/100
g lo
am s
oil)
Time (days)
Arsenic (112.5 mg/kg)Sample1 Sample 2 Sample 3
y = -0.076x + 2.885R² = 0.988
y = -0.077x + 3.011R² = 0.993
y = -0.074x + 2.924R² = 0.99
0
0.5
1
1.5
2
2.5
3
0 5 10 15 20 25 30 35
Ln 1
,2-D
CA
(μl
/100
g lo
am s
oil)
Time (days)
Arsenic (150 mg/kg)Sample 1 Sample 2 Sample 3
y = -0.071x + 2.983R² = 0.980
y = -0.081x + 3.024R² = 0.989
y = -0.073x + 2.912R² = 0.989
0
0.5
1
1.5
2
2.5
3
0 5 10 15 20 25 30 35
Ln 1
,2-D
CA
(μl
/100
g lo
am s
oil)
Time (days)
Cadmium (85 mg/kg)Sample 1 Sample 2 Sample 3

178
y = -0.087x + 2.961R² = 0.991
y = -0.074x + 2.898R² = 0.986
y = -0.085x + 2.793R² = 0.977
0
0.5
1
1.5
2
2.5
3
0 5 10 15 20 25 30 35
Ln 1
,2-D
CA
(μl
/100
g lo
am s
oil)
Time (days)
Cadmium (127.5 mg/kg)Sample 1 Sample 2 Sample 3
y = -0.076x + 2.972R² = 0.989
y = -0.074x + 2.934R² = 0.992
y = -0.075x + 2.858R² = 0.993
0
0.5
1
1.5
2
2.5
3
0 5 10 15 20 25 30 35
Ln 1
,2-D
CA
(μl
/100
g lo
am s
oil)
Time (days)
Cadmium (170 mg/kg)Sample 1 Sample 2 Sample 3
y = -0.075x + 2.963R² = 0.995
y = -0.069x + 2.897R² = 0.984
y = -0.082x + 2.868R² = 0.972
0
0.5
1
1.5
2
2.5
3
0 5 10 15 20 25 30 35
Ln 1
,2-D
CA
(μl
/100
g lo
am s
oil)
Time (days)
Mercury (840 mg/kg)Sample 1 Sample 2 Sample 3
y = -0.080x + 2.911R² = 0.991
y = -0.066x + 2.998R² = 0.985
y = -0.077x + 2.960R² = 0.982
0
0.5
1
1.5
2
2.5
3
0 5 10 15 20 25 30 35
1,2-
DC
A (μ
l/100
g lo
am s
oil)
Time (days)
Mercury (1260 mg/kg)Sample 1 Sample 2 Sample 3
y = -0.079x + 2.749R² = 0.911
y = -0.070x + 2.951R² = 0.970
y = -0.074x + 2.943R² = 0.988
0
0.5
1
1.5
2
2.5
3
0 5 10 15 20 25 30 35
Ln 1
,2-D
CA
(μl
/100
g lo
am s
oil)
Time (days)
Mercury (1680 mg/kg)Sample 1 Sample 2 Sample 3
y = -0.082x + 2.850R² = 0.980
y = -0.070x + 2.921R² = 0.961
y = -0.080x + 2.963R² = 0.986
0
0.5
1
1.5
2
2.5
3
0 5 10 15 20 25 30 35
Ln 1
,2-D
CA
(μl
/100
g lo
am s
oil)
Time (days)
Lead (420 mg/kg)Sample 1 Sample 2 Sample 3

179
Figure 8: Graphical representation of the degradation rate constants of 1,2-DCA in loam soil co-contaminated with different concentrations of heavy metals.
y = -0.086x + 2.940R² = 0.989
y = -0.084x + 2.915R² = 0.988
y = -0.131x + 3.225R² = 0.867
-2
-1.5
-1
-0.5
0
0.5
1
1.5
2
2.5
3
0 5 10 15 20 25 30 35
Ln 1
,2-D
CA
(μl
/100
g lo
am s
oil)
Time (days)
Lead (630 mg/kg)Sample 1 Sample 2 Sample 3
y = -0.085x + 2.938R² = 0.987
y = -0.081x + 2.859R² = 0.988
y = -0.091x + 2.866R² = 0.980
0
0.5
1
1.5
2
2.5
3
0 5 10 15 20 25 30 35
Ln 1
,2-D
CA
(μl
/100
g lo
am s
oil)
Time (days)
Lead (840 mg/kg)Sample 1 Sample 2 Sample 3

180
Table 8: Gas chromatographic peak area values used for clay soil samples co-contaminated with different combinations of heavy metals.
Microcosm Day 0 Day 5 Day 10 Day 15 Day 20 Day 25 Day 30
Autoclaved soil control 19 103 16 278 15 704 14 906 14 106 13 583 13 411 21 244 19 859 17 553 15 856 14 956 14 617 13770
- - - - - - -
Unautoclaved soil control 19 307 12 230 9 780 6 061 5 475 4 388 3 938 22 339 15 046 11 803 6 999 6 496 5 054 4 233
- - - - - - -
As3++Cd2+ 22 905 20 248 12 240 12 415 8 614 8 225 6 143 22 100 16 634 9 439 9 402 6 799 6 284 4 380 20 503 18 342 11 487 10 899 8 879 7 816 6 139
As3++Hg2+ 22 582 18 832 12 227 12 471 9 273 8 854 6 754 15 761 13 368 12 957 11 170 8 597 7 679 6 293 18 982 16 368 10 756 10 670 8 031 7 432 5 949
As3++Pb2+ 18 362 9 881 8 350 10 486 7 886 7 123 5 770 21 196 15 213 6 807 8 204 6 341 5 565 4 147 20 144 14 482 10 684 8 836 6 339 5 292 4 197
Cd2++Hg2+ 21 029 16 081 9 291 8 374 6 323 5 696 4 342 22 400 15 866 10 380 8 221 5 872 5 153 3 744 17 001 14 272 9 303 9 758 7 069 6 041 4 668
Cd2++Pb2+ 20 768 15 899 9 699 9 042 6 798 5 838 4 409 20 707 14 116 8 584 7 388 5 595 4 466 3 352 20 051 13 427 8 373 6 930 5 186 4 307 3 426
Hg2++Pb2+ 21 727 17 754 11 751 9 450 6 848 6 616 4907 20 503 13 065 9 702 7 638 5 518 5 086 3 817 22 148 16 229 10 749 8 915 5 837 5 488 4 198
As3++Cd2++Hg2+ 21 145 16 683 11 975 9 940 7 994 7 263 5 558 22 037 16 838 11 972 8 787 7 002 5 700 4 090 24 911 17 689 11 881 8 946 6 569 5 627 4 270
As3++Cd2++Pb2+ 24 478 16 890 11 983 9 437 7 209 6 311 4 621 22 130 17 238 12 431 9 982 7 548 6 660 5 035 22 473 16 601 11 206 9 270 6 554 5 609 4 307
As3++Hg2++Pb2+ 20 799 16 611 12 429 10 002 7 570 6 838 5 389 21 140 17 207 15 249 9 893 7 873 7 134 5 355 19 479 15 635 16 549 9 275 6 446 5 935 4 820
Cd2++Hg2++Pb2+ 21 578 13 859 10 621 5 553 4 582 3 650 2 478 21 345 17 810 14 515 10 015 7 552 6 943 5 371 21 772 14 279 10 379 7 823 5 746 5 222 4 097
As3++Cd2++Hg2++Pb2+ 19 030 14 777 11 474 8 372 5 963 4 758 3 402 17 582 13 542 9 069 6 183 4 881 3 989 3 088 17 620 9 452 8 780 5 041 3 449 3 073 2 233
As3+ = 112.5 mg/kg; Cd2+ = 127.5 mg/kg, Hg2+ = 1260 mg/kg, and Pb2+ = 630 mg/kg.

181
y = -0.012x + 2.398R² = 0.911
y = -0.017x + 2.567R² = 0.961
0.0
0.5
1.0
1.5
2.0
2.5
3.0
0 5 10 15 20 25 30 35
Ln 1
,2-D
CA
(μl
/100
g cl
ay s
oil)
Time (days)
Autoclaved soil controlSample 1 Sample 2
y = -0.076x + 2.372R² = 0.979
y = -0.076x + 2.589R² = 0.983
0.0
0.5
1.0
1.5
2.0
2.5
3.0
0 5 10 15 20 25 30 35
Ln 1
,2-D
CA
(μl
/100
g cl
ay s
oil)
Time (days)
Unautoclaved soil controlSample 1 Sample 2
y = -0.054x + 2.685R² = 0.960
y = -0.068x + 2.577R² = 0.961
y = -0.050x + 2.552R² = 0.970
0.0
0.5
1.0
1.5
2.0
2.5
3.0
0 5 10 15 20 25 30 35
Ln 1
,2-D
CA
(μl
/100
g cl
ay s
oil)
Time (days)
As3+ + Cd2+
Sample 1 Sample 2 Sample 3
y = -0.047x + 2.620R² = 0.959
y = -0.039x + 2.316R² = 0.966
y = -0.049x + 2.450R² = 0.970
0.0
0.5
1.0
1.5
2.0
2.5
3.0
0 5 10 15 20 25 30 35
Ln 1
,2-D
CA
(μl
/100
g cl
ay s
oil)
Time (days)
As3+ + Hg2+
Sample 1 Sample 2 Sample 3
y = -0.039x + 2.141R² = 0.791
y = -0.069x + 2.410R² = 0.895
y = -0.071x + 2.531R² = 0.996
0.0
0.5
1.0
1.5
2.0
2.5
3.0
0 5 10 15 20 25 30 35
Ln 1
,2-D
CA
(μl
/100
g cl
ay s
oil)
Time (days)
As3+ + Pb2+
Sample 1 Sample 2 Sample 3
y = -0.070x + 2.521R² = 0.977
y = -0.082x + 2.645R² = 0.992
y = -0.057x + 2.362R² = 0.967
0.0
0.5
1.0
1.5
2.0
2.5
3.0
0 5 10 15 20 25 30 35
Ln 1
,2-D
CA
(μl
/100
g cl
ay s
oil)
Time (days)
Cd2+ + Hg2+
Sample 1 Sample 2 Sample 3

182
y = -0.067x + 2.533R² = 0.981
y = -0.087x + 2.541R² = 0.987
y = -0.087x + 2.541R² = 0.987
-0.5
0.0
0.5
1.0
1.5
2.0
2.5
3.0
0 5 10 15 20 25 30 35
Ln 1
,2-D
CA
(μl
/100
g cl
ay s
oil)
Time (days)
Cd2+ + Pb2+
Sample 1 Sample 2 Sample 3
y = -0.065x + 2.621R² = 0.983
y = -0.076x + 2.472R² = 0.989
y = -0.076x + 2.622R² = 0.987
0.0
0.5
1.0
1.5
2.0
2.5
3.0
0 5 10 15 20 25 30 35
Ln 1
,2-D
CA
(μl
/100
g cl
ay s
oil)
Time (days)
Hg2+ + Pb2+
Sample 1 Sample 2 Sample 3
y = -0.055x + 2.556R² = 0.99
y = -0.075x + 2.680R² = 0.991
y = -0.078x + 2.746R² = 0.996
0.0
0.5
1.0
1.5
2.0
2.5
3.0
0 5 10 15 20 25 30 35
Ln 1
,2-D
CA
(μl
/100
g cl
ay s
oil)
Time (days)
As3+ + Cd2+ + Hg2+
Sample 1 Sample 2 Sample 3
y = -0.070x + 2.695R² = 0.992
y = -0.063x + 2.642R² = 0.994
y = -0.074x + 2.653R² = 0.995
0.0
0.5
1.0
1.5
2.0
2.5
3.0
0 5 10 15 20 25 30 35
Ln 1
,2-D
CA
(μl
/100
g cl
ay s
oil)
Time (days)
As3+ + Cd2+ + Pb2+
Sample 1 Sample 2 Sample 3
y = -0.058x + 2.571R² = 0.994
y = -0.060x + 2.652R² = 0.980
y = -0.067x + 2.625R² = 0.945
0.0
0.5
1.0
1.5
2.0
2.5
3.0
0 5 10 15 20 25 30 35
Ln 1
,2-D
CA
(μl
/100
g cl
ay s
oil)
Time (days)
As3+ + Hg2+ + Pb2+
Sample 1 Sample 2 Sample 3
y = -0.129x + 2.830R² = 0.945
y = -0.061x + 2.659R² = 0.986
y = -0.075x + 2.537R² = 0.991
-2.0
-1.5
-1.0
-0.5
0.0
0.5
1.0
1.5
2.0
2.5
3.0
0 5 10 15 20 25 30 35
Ln 1
,2-D
CA
(μl
/100
g cl
ay s
oil)
Time (days)
Cd2+ + Hg2+ + Pb2+
Sample 1 Sample 2 Sample 3

183
Figure 9: Graphical representation of the degradation rate constants of 1,2-DCA in clay soil co-contaminated with different combinations of heavy metals
y = -0.085x + 2.622R² = 0.978
y = -0.093x + 2.472R² = 0.993
y = -0.168x + 2.826R² = 0.857
-4.0
-3.0
-2.0
-1.0
0.0
1.0
2.0
3.0
0 5 10 15 20 25 30 35
Ln 1
,2-D
CA
(μl
/100
g cl
ay s
oil)
Time (days)
As3+ + Cd2+ + Hg2+ + Pb2+
Sample 1 Sample 2 Sample 3

184
Table 9: Gas chromatographic peak area values used for loam soil samples co-contaminated with different combinations of heavy metals.
Microcosm Day 0 Day 5 Day 10 Day 15 Day 20 Day 25 Day 30
Autoclaved soil control 14 683 13 895 12 894 12 213 11 932 10 977 10 519 12 675 12 111 11 195 10 256 9 782 9 422 8 560 13 518 13 033 11 709 10 403 9 607 8 878 8 603
Unautoclaved soil control 17 819 9 970 5 943 2 294 1 914 1 694 1 038 17 195 8 100 5 422 2 773 2 418 1 806 1 242 16 860 8 404 5 623 2 690 2 375 1 844 1 370
As3++Cd2+ 17 434 11 517 6 894 3 755 3 480 2 864 2 369 17 384 12 457 8 024 4 545 4 378 3 387 3 099 17 453 11 600 7 238 4 058 3 669 3 108 2 719
As3++Hg2+ 17 282 10 142 6 225 3 503 3 231 2 576 2 372 18 816 15 607 10 689 6 734 6 945 5 540 4 932 19 295 11 217 10 299 6 348 6 040 5 014 4 646
As3++Pb2+ 16 395 14 407 10 214 6 225 6 563 5 379 4 695 17 640 14 301 10 557 6 381 5 980 5 311 4 660 17 418 13 622 9 183 5 885 5 780 4 918 4 410
Cd2++Hg2+ 17 417 10 534 6 383 3 982 3 630 3 054 2 569 16 168 11 021 7 251 4 443 4 363 3 215 2 748 17 403 10 232 6 534 3 877 3 580 2 994 2 517
Cd2++Pb2+ 16 075 10 038 5 950 3 760 3 412 2 633 2 352 16 812 9 458 5 918 3 708 3 120 2 545 2 189 15 398 9 693 5 782 3 667 3 615 2 490 2 239
Hg2++Pb2+ 16 760 9 357 5 192 3 232 3 271 2 208 2 208 17 916 10 576 6 147 3 738 3 361 2 709 2 645 17 693 10 577 6 560 4 049 3 666 2 938 2 941
As3++Cd2++Hg2+ 15 968 11 975 8 172 4 345 5 155 4 684 4 488 17 940 8 095 4 564 2 567 2 014 1 787 1 815 16 590 11 342 7 764 5 169 4 038 4 174 4 043
As3++Cd2++Pb2+ 16 848 12 457 8 522 5 485 4 199 4 572 4 264 16 879 12 676 8 378 2 587 3 680 4 814 4 489 17 802 11 543 5 176 4 839 3 290 3 494 3 342
As3++Hg2++Pb2+ 17 662 10 003 6 255 4 144 3 296 3 171 2 647 16 502 9 806 5 963 3 836 3 299 2 910 2 550 15 546 9 202 5 130 3 447 2 878 2 382 2 023
Cd2++Hg2++Pb2+ 18 013 10 357 6 220 3 323 2 884 2 295 2 056 17 329 9 135 5 398 4 101 3 862 3 234 2 859 15 054 7 930 4 474 2 956 2 607 2 040 1 883
As3++Cd2++Hg2++Pb2+ 16 275 9 486 6 141 4 083 3 857 3 098 2 704 15 995 8 905 5 347 3 825 3 437 2 742 2 520 14 810 9 108 5 903 3 834 3 491 2 718 2 386
As3+ = 112.5 mg/kg; Cd2+ = 127.5 mg/kg, Hg2+ = 1260 mg/kg, and Pb2+ = 630 mg/kg.

185
y = -0.011x + 3.035R² = 0.99
y = -0.015x + 2.921R² = 0.945
y = -0.017x + 2.967R² = 0.980
0
0.5
1
1.5
2
2.5
3
3.5
0 5 10 15 20 25 30 35
Ln 1
,2-D
CA
(μl
/100
g lo
am s
oil)
Time (days)
Autoclaved soil controlSeries1 Series2 Series3
y = -0.129x + 3.214R² = 0.969
y = -0.109x + 3.041R² = 0.982
y = -0.104x + 3.007R² = 0.976
-1
-0.5
0
0.5
1
1.5
2
2.5
3
3.5
0 5 10 15 20 25 30 35
Ln 1
,2-D
CA
(μl
/100
g lo
am s
oil)
Time (days)
Unautoclaved soil controlSample 1 Sample 2 Sample 3
y = -0.078x + 3.068R² = 0.950
y = -0.068x + 3.100R² = 0.946
y = -0.073x + 3.059R² = 0.941
0
0.5
1
1.5
2
2.5
3
3.5
0 5 10 15 20 25 30 35
Ln 1
,2-D
CA
(μl
/100
g lo
am s
oil)
Time (days)
As3+ + Cd2+
Sample 1 Sample 2 Sample 3
y = -0.078x + 2.981R² = 0.936
y = -0.050x + 3.241R² = 0.941
y = -0.050x + 3.124R² = 0.927
0
0.5
1
1.5
2
2.5
3
3.5
0 5 10 15 20 25 30 35
Ln 1
,2-D
CA
(μl
/100
g lo
am s
oil)
Time (days)
As3+ + Hg2+
Sample 1 Sample 2 Sample 3y = -0.048x + 3.130
R² = 0.933
y = -0.051x + 3.174R² = 0.942
y = -0.052x + 3.115R² = 0.933
0
0.5
1
1.5
2
2.5
3
3.5
0 5 10 15 20 25 30 35
Ln 1
,2-D
CA
(μl
/100
g lo
am s
oil)
Time (days)
As3+ + Pb2+
Sample 1 Sample 2 Sample 3y = -0.072x + 2.997
R² = 0.943
y = -0.068x + 3.020R² = 0.964
y = -0.073x + 2.994R² = 0.944
0
0.5
1
1.5
2
2.5
3
3.5
0 5 10 15 20 25 30 35
Ln 1
,2-D
CA
(μl
/100
g lo
am s
oil)
Time (days)
Cd2+ + Hg2+
Sample 1 Sample 2 Sample 3

186
y = -0.075x + 2.944R² = 0.954
y = -0.079x + 2.957R² = 0.959
y = -0.076x + 2.918R² = 0.958
0
0.5
1
1.5
2
2.5
3
3.5
0 5 10 15 20 25 30 35
Ln 1
,2-D
CA
(μl
/100
g lo
am s
oil)
Time (days)
Cd2+ + Pb2+
Sample 1 Sample 2 Sample 3y = -0.080x + 2.903
R² = 0.925
y = -0.075x + 2.992R² = 0.921
y = -0.070x + 2.989R² = 0.920
0
0.5
1
1.5
2
2.5
3
3.5
0 5 10 15 20 25 30 35
Ln 1
,2-D
CA
(μl
/100
g lo
am s
oil)
Time (days)
Hg2+ + Pb2+
Sample 1 Sample 2 Sample 3y = -0.048x + 2.937
R² = 0.807
y = -0.094x + 2.852R² = 0.902
y = -0.055x + 2.973R² = 0.888
0
0.5
1
1.5
2
2.5
3
3.5
0 5 10 15 20 25 30 35
Ln 1
,2-D
CA
(μl
/100
g lo
am s
oil)
Time (days)
As3+ + Cd2+ + Hg2+
Sample 1 Sample 2 Sample 3
y = -0.054x + 3.034R² = 0.886
y = -0.053x + 2.881R² = 0.543
y = -0.063x + 2.937R² = 0.842
0
0.5
1
1.5
2
2.5
3
3.5
0 5 10 15 20 25 30 35
Ln 1
,2-D
CA
(μl
/100
g lo
am s
oil)
Time (days)
As3+ + Cd2+ + Pb2+
Sample 1 Sample 2 Sample 3
y = -0.071x + 2.970R² = 0.931
y = -0.071x + 2.920R² = 0.934
y = -0.080x + 2.878R² = 0.956
0
0.5
1
1.5
2
2.5
3
3.5
0 5 10 15 20 25 30 35
Ln 1
,2-D
CA
(μl
/100
g lo
am s
oil)
Time (days)
As3+ + Hg2+ + Pb2+
Sample 1 Sample 2 Sample 3y = -0.087x + 3.044
R² = 0.950
y = -0.064x + 2.868R² = 0.896
y = -0.083x + 2.768R² = 0.939
0
0.5
1
1.5
2
2.5
3
3.5
0 5 10 15 20 25 30 35
Ln 1
,2-D
CA
(μl
/100
g lo
am s
oil)
Time (days)
Cd2+ + Hg2+ + Pb2+
Sample 1 Sample 2 Sample 3

187
Figure 10: Graphical representation of the degradation rate constants of 1,2-DCA in loam soil co-contaminated with different combinations of heavy metals.
y = -0.066x + 2.906R² = 0.940
y = -0.069x + 2.846R² = 0.930
y = -0.071x + 2.862R² = 0.960
0
0.5
1
1.5
2
2.5
3
3.5
0 5 10 15 20 25 30 35
Ln 1
,2-D
CA
(μl
/100
g lo
am s
oil)
Time (days)
As3+ + Cd2+ + Hg2+ + Pb2+
Sample 1 Sample 2 Sample 3

188
Table 10: Gas chromatographic peak area values used for arsenic co-contaminated loam soil samples undergoing various bioremediation strategies.
Microcosm Day 0 Day 5 Day 10 Day 15 Day 20
Autoclaved soil control 11 603 10 814 9 686 9 526 8 234 14 495 12 729 11 534 11 255 10 009 11 743 11 042 10 147 9 295 8 186
Unautoclaved soil control 15 499 14 685 5 633 5 792 1 352 15 060 13 231 6 336 3 785 1 373 15 521 11 499 5 442 4 021 1 193
Unautoclaved soil control+As3+ 12 835 11 973 5 365 4 977 2 291 14 635 13 833 6 710 6 326 2 344 11 765 10 490 5 118 4 155 2 267
Biostimulation
Glucose 13 581 12 142 5 839 5 374 340 13 965 13 293 6 804 6 739 455 13 691 10 099 5 684 4 710 221
Fructose 15 257 13 650 6 432 5 599 406 15 205 13 647 7 080 6 795 426 14 997 11 872 5 890 5 171 447
Fertilizer 14 674 12 892 5 734 5 117 343 14 921 13 659 6 718 6 079 583 15 938 11 282 5 336 4 337 328
Bioaugmentation
X. autotrophicus GJ10 13 512 9 307 1 057 451 0 14 646 9 392 599 215 0 12 864 8 522 473 868 0
Dual-bioaugmentation 12 380 4 933 366 182 0 11 091 7 517 849 201 0 13 213 7 856 434 155 0
Treatment additives
CaCO3 17 194 13 532 5 615 4 255 178 18 795 15 284 7 131 5 843 240 17 886 12 306 5 399 3 826 117
Na2HPO4 + NaCl 16 184 12 980 5 944 4 824 368 16 181 13 788 6 558 5 981 658 15 873 11 414 5 563 4 614 362
CaSO4.2H2O 15 369 12 268 5 480 4 399 500 14 900 12 741 6 450 5 684 707 16 826 11 562 5 147 4 089 368

189
y = -0.015x + 2.480R² = 0.959
y = -0.016x + 2.670R² = 0.962
y = -0.017x + 2.505R² = 0.983
0
0.5
1
1.5
2
2.5
3
3.5
0 5 10 15 20 25
Ln 1
,2-D
CA
(μl
/100
g so
il)
Time (days)
Autoclaved soil control y = -0.108x + 2.994R² = 0.870
y = -0.112x + 2.956R² = 0.953
y = -0.114x + 2.913R² = 0.953
0
0.5
1
1.5
2
2.5
3
3.5
0 5 10 15 20 25
Ln 1
,2-D
CA
(μl
/100
g so
il)
Time (days)
Unautoclaved soil control y = -0.081x + 2.704R² = 0.926
y = -0.084x + 2.876R² = 0.898
y = -0.079x + 2.594R² = 0.958
0
0.5
1
1.5
2
2.5
3
3.5
0 5 10 15 20 25
Ln 1
,2-D
CA
(μl
/100
g so
il)
Time (days)
Unautoclaved soil control + As3+
y = -0.139x + 3.040R² = 0.782
y = -0.131x + 3.088R² = 0.739
y = -0.146x + 3.010R² = 0.794
-1
-0.5
0
0.5
1
1.5
2
2.5
3
3.5
0 5 10 15 20 25
Ln 1
,2-D
CA
(μl
/100
g so
il)
Time (days)
Glucose + As3+ y = -0.141x + 3.153R² = 0.8
y = -0.136x + 3.164R² = 0.751
y = -0.137x + 3.060R² = 0.823
-1
-0.5
0
0.5
1
1.5
2
2.5
3
3.5
0 5 10 15 20 25
!,2-D
CA
(μl/1
00 g
soil)
Time (days)
Fructose + As3+ y = -0.144x + 3.105R² = 0.809
y = -0.129x + 3.103R² = 0.794
y = -0.148x + 3.092R² = 0.857
-1
-0.5
0
0.5
1
1.5
2
2.5
3
3.5
0 5 10 15 20 25
Ln 1
,2-D
CA
(μl
/100
g so
il)
Time (days)
Fertilizer + As3+

190
Figure 11: Graphical representation of the degradation rate constants of 1,2-DCA in arsenic co-contaminated loam soil samples undergoing various
bioremediation strategies. ( ) = sample 1; ( ) = sample 2; ( ) = sample 3.
y = -0.205x + 2.785R² = 0.957
y = -0.216x + 2.753R² = 0.920
y = -0.192x + 2.609R² = 0.871
-2-1.5
-1-0.5
00.5
11.5
22.5
33.5
0 5 10 15 20 25
Ln 1
,2-D
CA
(μl
/100
g so
il)
Time (days)
X. autotrophicus GJ10 + As3+y = -0.198x + 2.347
R² = 0.916
y = -0.201x + 2.554R² = 0.948
y = -0.211x + 2.583R² = 0.905
-2.5
-1.5
-0.5
0.5
1.5
2.5
3.5
0 5 10 15 20 25
Ln 1
,2-D
CA
(μl
/100
g so
il)
Time (days)
Dual-bioaugmentation + As3+ y = -0.166x + 3.273R² = 0.846
y = -0.161x + 3.394R² = 0.802
y = -0.174x + 3.280R² = 0.859
-1.5
-1
-0.5
0
0.5
1
1.5
2
2.5
3
3.5
0 5 10 15 20 25
Ln 1
,2-D
CA
(μl
/100
g so
il)
Time (days)
CaCO3 + As3+
y = -0.147x + 3.164R² = 0.840
y = -0.130x + 3.134R² = 0.823
y = -0.145x + 3.092R² = 0.847
-1
-0.5
0
0.5
1
1.5
2
2.5
3
3.5
0 5 10 15 20 25
Ln 1
,2-D
CA
(μl
/100
g so
il)
Time (days)
Na2HPO4 + NaCl + As3+ y = -0.139x + 3.060R² = 0.870
y = -0.124x + 3.041R² = 0.825
y = -0.150x + 3.115R² = 0.882
-1
-0.5
0
0.5
1
1.5
2
2.5
3
3.5
0 5 10 15 20 25
Ln 1
,2-D
CA
(μl
/100
g so
il)
Time (days)
CaSO4.2H2O + As3+

191
Table 11: Gas chromatographic peak area values used for cadmium co-contaminated loam soil samples undergoing various bioremediation strategies.
Microcosm Day 0 Day 5 Day 10 Day 15 Day 20
Autoclaved soil control 11 603 10 814 9 686 9 526 8 234 14 495 12 729 11 534 11 255 10 009 11 743 11 042 10 147 9 295 8 186
Unautoclaved soil control 15 499 14 685 5 633 5 792 1 352 15 060 13 231 6 336 3 785 1 373 15 521 11 499 5 442 4 021 1 193
Unautoclaved soil control+Cd2+ 15 124 13 898 5 644 4 967 2 176 13 853 13 233 6 463 5 986 1 766 14 923 11 327 5 114 4 073 2 395
Biostimulation
Glucose 14 691 11 065 5 326 4 841 275 13 544 11 094 5 759 5 977 294 14 219 9 621 4 986 4 262 309
Fructose 11 419 10 569 5 944 5 692 429 14 398 11 000 5 983 5 839 414 11 023 9 998 5 869 5 132 405
Fertilizer 13 623 11 645 5 174 3 331 219 14 393 13 371 6 594 5 200 248 13 451 10 491 4 861 2 897 225
Bioaugmentation
X. autotrophicus GJ10 14 358 8 220 264 0 0 11 468 6 295 339 0 0 14 659 7 558 319 168 0
Dual-bioaugmentation 12 643 6 951 296 0 0 12 087 5 429 258 0 0 12 964 6 244 341 0 0
Treatment additives
CaCO3 10 771 9 861 5 265 4 660 357 17 747 14 616 6 798 2 399 0 11 942 9 243 5 043 4 204 396
Na2HPO4 + NaCl 16 137 12 506 5 729 4 801 509 14 818 12 216 5 929 5 480 586 15 647 11 810 5 399 4 397 485
CaSO4.2H2O 14 742 12 113 5 569 4 598 321 15 903 12 823 6 415 5 583 756 15 011 11 380 5 243 4 233 264

192
y = -0.015x + 2.480R² = 0.959
y = -0.016x + 2.670R² = 0.962
y = -0.017x + 2.505R² = 0.983
0
0.5
1
1.5
2
2.5
3
3.5
0 5 10 15 20 25
Ln 1
,2-D
CA
(μl
/100
g so
il)
Time (days)
Autoclaved soil control y = -0.108x + 2.994R² = 0.870
y = -0.112x + 2.956R² = 0.953
y = -0.114x + 2.913R² = 0.953
0
0.5
1
1.5
2
2.5
3
3.5
0 5 10 15 20 25
Ln 1
,2-D
CA
(μl
/100
g so
il)
Time (days)
Unautoclaved soil control y = -0.093x + 2.877R² = 0.935
y = -0.092x + 2.869R² = 0.875
y = -0.088x + 2.754R² = 0.972
0
0.5
1
1.5
2
2.5
3
3.5
0 5 10 15 20 25
Ln 1
,2-D
CA
(μl
/100
g so
il)
Time (days)
Unautoclave soil control + Cd2+
y = -0.146x + 3.054R² = 0.813
y = -0.138x + 3.016R² = 0.748
y = -0.142x + 2.957R² = 0.841
-1
-0.5
0
0.5
1
1.5
2
2.5
3
3.5
0 5 10 15 20 25
Ln 1
,2-D
CA
(μl
/100
g so
il)
Time (days)
Glucose + Cd2+ y = -0.123x + 2.861R² = 0.738
y = -0.133x + 3.018R² = 0.779
y = -0.124x + 2.824R² = 0.754
-1
-0.5
0
0.5
1
1.5
2
2.5
3
3.5
0 5 10 15 20 25
Ln 1
,2-D
CA
(μl
/100
gso
il)
Time (days)
Fructose + Cd2+ y = -0.156x + 3.045R² = 0.864
y = -0.150x + 3.167R² = 0.782
y = -0.155x + 2.983R² = 0.889
-1
-0.5
0
0.5
1
1.5
2
2.5
3
3.5
0 5 10 15 20 25
Ln 1
,2-D
CA
(μl
/100
g so
il)
Time (days)
Fertilizer + Cd2+

193
Figure 12: Graphical representation of the degradation rate constants of 1,2-DCA in cadmium co-contaminated loam soil samples undergoing various
bioremediation strategies. ( ) = sample 1; ( ) = sample 2; ( ) = sample 3.
y = -0.224x + 2.596R² = 0.863
y = -0.210x + 2.387R² = 0.885
y = -0.214x + 2.594R² = 0.889
-2.5
-1.5
-0.5
0.5
1.5
2.5
3.5
0 5 10 15 20 25Ln 1
,2-D
CA
(μl
/100
g so
il)
Time (days)
X. autotrophicus GJ10 + Cd2+ y = -0.215x + 2.468R² = 0.875
y = -0.209x + 2.333R² = 0.878
y = -0.214x + 2.456R² = 0.889
-2.5
-1.5
-0.5
0.5
1.5
2.5
3.5
0 5 10 15 20 25Ln 1
,2-D
C=A
(μl
/100
gso
il)
Time (days)
Dual-bioaugmentation + Cd2+ y = -0.127x + 2.798R² = 0.774
y = -0.199x + 3.454R² = 0.877
y = -0.130x + 2.814R² = 0.827
-1.5-1
-0.50
0.51
1.52
2.53
3.5
0 5 10 15 20 25Ln 1
,2-D
CA
(μl
/100
g so
il)
Time (days)
CaCO3 + Cd2+
y = -0.139x + 3.102R² = 0.860
y = -0.129x + 3.031R² = 0.823
y = -0.139x + 3.056R² = 0.872
-0.5
0
0.5
1
1.5
2
2.5
3
3.5
0 5 10 15 20 25
Ln 1
,2-D
CA
(μl
/100
g so
il)
Time (days)
Na2HPO4 + NaCl + Cd2+ y = -0.146x + 3.085R² = 0.830
y = -0.125x + 3.071R² = 0.847
y = -0.151x + 3.079R² = 0.843
-1
-0.5
0
0.5
1
1.5
2
2.5
3
3.5
0 5 10 15 20 25
Ln 1
,2-D
CA
(μl
/100
g so
il)
Time (days)
CaSO4.2H2O + Cd2+

194
Table 12: Optical density values used for dehydrogenase activity in arsenic co-contaminated loam soil undergoing various bioremediation strategies.
Microcosm Day 0 Day 5 Day 10 Day 15 Day 20
Autoclaved soil control 0.023 0.028 0.025 0.031 0.023 0.018 0.024 0.021 0.038 0.031 0.029 0.019 0.027 0.026 0.033
Unautoclaved soil control 0.361 0.496 0.571 0.506 0.531 0.426 0.583 0.628 0.616 0.575 0.415 0.546 0.659 0.624 0.598
Unautoclaved soil control + As3+ 0.361 0.124 0.096 0.082 0.049 0.426 0.163 0.129 0.069 0.089 0.415 0.247 0.161 0.123 0.155
Biostimulation
Glucose 0.361 0.309 0.567 0.506 0.568 0.426 0.225 0.519 0.564 0.571 0.415 0.321 0.386 0.447 0.476
Fructose 0.361 0.186 0.209 0.271 0.389 0.426 0.306 0.189 0.213 0.354 0.415 0.223 0.204 0.447 0.439
Fertilizer 0.361 0.198 0.249 0.368 0.425 0.426 0.284 0.197 0.395 0.362 0.415 0.237 0.368 0.406 0.445
Bioaugmentation
X. autotrophicus GJ10 0.361 0.376 0.393 0.469 0.525 0.426 0.434 0.365 0.463 0.489 0.415 0.426 0.439 0.391 0.463
Dual-bioaugmentation 0.361 0.401 0.396 0.423 0.431 0.426 0.433 0.31 0.384 0.446 0.415 0.421 0.343 0.392 0.381
Treatment additives
CaCO3 0.361 0.252 0.21 0.221 0.273 0.426 0.245 0.224 0.197 0.236 0.415 0.223 0.208 0.187 0.213
Na2HPO4 + NaCl 0.361 0.243 0.221 0.289 0.268 0.426 0.292 0.268 0.32 0.349 0.415 0.238 0.207 0.262 0.346
CaSO4.2H2O 0.361 0.183 0.142 0.133 0.164 0.426 0.186 0.153 0.121 0.149 0.415 0.194 0.163 0.146 0.155

195
Table 13: Optical density values used for dehydrogenase activity in cadmium co-contaminated loam soil undergoing various bioremediation strategies.
Microcosm Day 0 Day 5 Day 10 Day 15 Day 20
Autoclaved soil control 0.023 0.028 0.025 0.031 0.023 0.018 0.024 0.021 0.038 0.031 0.029 0.019 0.027 0.026 0.033
Unautoclaved soil control 0.361 0.496 0.571 0.506 0.531 0.426 0.583 0.628 0.616 0.575 0.415 0.546 0.659 0.624 0.598
Unautoclaved soil control+Cd2+ 0.361 0.201 0.221 0.198 0.047 0.426 0.191 0.083 0.079 0.138 0.415 0.341 0.208 0.194 0.123
Biostimulation
Glucose 0.361 0.346 0.298 0.482 0.467 0.426 0.414 0.446 0.483 0.552 0.415 0.309 0.404 0.497 0.465
Fructose 0.361 0.179 0.138 0.268 0.352 0.426 0.143 0.091 0.167 0.306 0.415 0.287 0.162 0.191 0.305
Fertilizer 0.361 0.229 0.315 0.363 0.411 0.426 0.321 0.363 0.351 0.392 0.415 0.364 0.393 0.422 0.463
Bioaugmentation
X. autotrophicus GJ10 0.361 0.392 0.398 0.404 0.398 0.426 0.469 0.389 0.433 0.44 0.415 0.376 0.384 0.423 0.409
Dual-bioaugmentation 0.361 0.382 0.324 0.345 0.352 0.426 0.397 0.331 0.354 0.396 0.415 0.432 0.369 0.392 0.426
Treatment additives
CaCO3 0.361 0.197 0.161 0.191 0.215 0.426 0.232 0.205 0.179 0.213 0.415 0.223 0.289 0.316 0.325
Na2HPO4 + NaCl 0.361 0.242 0.223 0.252 0.264 0.426 0.309 0.258 0.221 0.287 0.415 0.176 0.227 0.207 0.239
CaSO4.2H2O 0.361 0.103 0.184 0.171 0.154 0.426 0.324 0.209 0.191 0.212 0.415 0.169 0.121 0.171 0.183

196
Table 14: Optical density values used for urease activity in arsenic co-contaminated loam soil undergoing various bioremediation strategies.
Microcosm Day 0 Day 5 Day 10 Day 15 Day 20
Autoclaved soil control 0.125 0.053 0.072 0.134 0.131 0.105 0.048 0.07 0.147 0.135 0.116 0.052 0.07 0.128 0.123
Unautoclaved soil control 0.304 0.188 0.289 0.431 0.448 0.208 0.194 0.299 0.38 0.435 0.284 0.195 0.287 0.41 0.433
Unautoclaved soil control+As3+ 0.304 0.146 0.25 0.323 0.445 0.208 0.15 0.191 0.31 0.423 0.284 0.148 0.175 0.298 0.377
Biostimulation
Glucose 0.304 0.147 0.155 0.24 0.404 0.208 0.186 0.161 0.259 0.333 0.284 0.191 0.18 0.259 0.313
Fructose 0.304 0.064 0.117 0.27 0.242 0.208 0.052 0.153 0.23 0.231 0.284 0.054 0.139 0.203 0.236
Fertilizer 0.304 1.116 1.498 1.201 1.513 0.208 1.078 1.216 1.169 1.63 0.284 1.112 1.284 1.326 1.409
Bioaugmentation
X. autotrophicus GJ10 0.304 0.231 0.256 0.374 0.359 0.208 0.242 0.259 0.312 0.283 0.284 0.209 0.265 0.361 0.386
Dual-bioaugmentation 0.304 0.186 0.228 0.193 0.341 0.208 0.177 0.206 0.248 0.336 0.284 0.176 0.238 0.301 0.373
Treatment additives
CaCO3 0.304 0.246 0.288 0.238 0.294 0.208 0.234 0.287 0.266 0.317 0.284 0.241 0.284 0.29 0.292
Na2HPO4 + NaCl 0.304 0.277 0.286 0.246 0.237 0.208 0.286 0.261 0.234 0.259 0.284 0.286 0.261 0.278 0.387
CaSO4.2H2O 0.304 0.215 0.27 0.228 0.394 0.208 0.209 0.295 0.211 0.317 0.284 0.221 0.307 0.242 0.346

197
Table 15: Optical density values used for urease activity in cadmium co-contaminated loam soil undergoing various bioremediation strategies.
Microcosm Day 0 Day 5 Day 10 Day 15 Day 20
Autoclaved soil control 0.125 0.053 0.072 0.134 0.131 0.105 0.048 0.070 0.147 0.135 0.116 0.052 0.070 0.128 0.123
Unautoclaved soil control 0.304 0.188 0.289 0.431 0.448 0.208 0.194 0.299 0.380 0.435 0.284 0.195 0.287 0.410 0.433
Unautoclaved soil control + Cd2+ 0.304 0.082 0.168 0.301 0.382 0.208 0.098 0.286 0.303 0.410 0.284 0.102 0.224 0.291 0.337
Biostimulation
Glucose 0.304 0.125 0.166 0.247 0.226 0.208 0.089 0.104 0.219 0.289 0.284 0.076 0.113 0.222 0.227
Fructose 0.304 0.061 0.108 0.170 0.308 0.208 0.06 0.112 0.171 0.265 0.284 0.085 0.096 0.183 0.307
Fertilizer 0.304 1.367 1.603 1.377 1.306 0.208 1.359 1.348 1.388 1.478 0.284 1.354 1.643 1.271 1.218
Bioaugmentation
X. autotrophicus GJ10 0.304 0.237 0.259 0.223 0.276 0.208 0.223 0.298 0.227 0.278 0.284 0.228 0.242 0.224 0.309
Dual-bioaugmentation 0.304 0.105 0.162 0.225 0.275 0.208 0.096 0.233 0.203 0.336 0.284 0.104 0.154 0.194 0.333
Treatment additives
CaCO3 0.304 0.228 0.273 0.258 0.243 0.208 0.227 0.294 0.268 0.363 0.284 0.197 0.287 0.228 0.326
Na2HPO4 + NaCl 0.304 0.179 0.236 0.270 0.244 0.208 0.201 0.210 0.294 0.205 0.284 0.196 0.299 0.293 0.292
CaSO4.2H2O 0.304 0.193 0.231 0.276 0.339 0.208 0.189 0.230 0.231 0.330 0.284 0.202 0.288 0.231 0.370

198
Table 16: ICP-OES values used for determining the bioavailable concentrations of arsenic in co-contaminated loam soil.
Microcosm Day 0 Day 5 Day 10 Day 15 Day 20
Unautoclaved soil + As3+ 3.788 1.756 1.283 0.788 0.729 3.958 1.706 1.348 0.788 0.833 4.513 1.654 1.375 0.757 0.743
Average 4.09 1.71 1.34 0.78 0.77 Standard deviation 0.38 0.05 0.05 0.02 0.06
CaCO3 3.788 1.832 1.306 0.642 0.716 3.958 1.369 1.236 0.574 0.83 4.513 1.199 1.161 0.559 0.88
Average 4.09 1.47 1.23 0.59 0.81 Standard deviation 0.38 0.33 0.07 0.04 0.08
Na2HPO4 + NaCl 3.788 3.295 2.53 2.764 2.131 3.958 3.341 2.987 2.665 2.137 4.513 3.447 2.799 2.63 2.14
Average 4.09 3.36 2.77 2.69 2.14 Standard deviation 0.38 0.08 0.23 0.07 0.01
CaSO4.2H2O 3.788 1.245 1.048 0.377 0.295 3.958 1.225 0.99 0.359 0.306 4.513 1.276 0.879 0.407 0.258
Average 4.09 1.25 0.97 0.38 0.29 Standard deviation 0.38 0.03 0.09 0.02 0.03

199
Table 17: ICP-OES values used for determining the bioavailable concentrations of cadmium in co-contaminated loam soil.
Microcosm Day 0 Day 5 Day 10 Day 15 Day 20
Unautoclaved soil + Cd2+ 0.745 0.183 0.039 -0.052 -0.069 1.302 0.122 0.138 -0.066 -0.058 1.112 0.456 0.102 -0.067 -0.057
Average 1.05 0.25 0.09 -0.06 -0.06 Standard deviation 0.28 0.18 0.05 0.01 0.01
CaCO3 0.745 -0.061 -0.068 -0.078 -0.081 1.302 -0.07 -0.07 -0.079 -0.081 1.112 -0.071 -0.071 -0.079 -0.081
Average 1.05 -0.07 -0.07 -0.08 -0.08 Standard deviation 0.28 0.01 0.00 0.00 0.00
Na2HPO4 + NaCl 0.745 -0.042 -0.047 0.013 -0.012 1.302 -0.039 -0.044 0.019 -0.012 1.112 -0.047 -0.04 0.027 -0.014
Average 1.05 -0.04 -0.04 0.02 -0.01 Standard deviation 0.28 0.00 0.00 0.01 0.00
CaSO4.2H2O 0.745 0.372 0.009 -0.079 -0.081 1.302 0.722 -0.012 -0.079 -0.08 1.112 0.767 0.03 -0.078 -0.081
Average 1.05 0.62 0.01 -0.08 -0.08 Standard deviation 0.28 0.22 0.02 0.00 0.00

200
Table 18: Enumeration of the total 1,2-DCA degrading bacterial population in loam soil co-contaminated with arsenic.
Total 1,2-DCA degrading population (cfu/ml × 106) Day 0
Autoclaved soil control Unautoclaved soil control 0 7.60 0 6.20 0 5.60
Average 0 6.47 SD 0 1.03
Day 10
Autoclaved soil control Unautoclaved soil control Unautoclaved soil + As3+ Glucose + As3+ 0 42.00 2.67 21.80 0 46.00 2.79 20.90 0 57.00 2.75 18.20 3.40 51.00 33.00
Average 0 48.33 2.90 28.98 SD 0 7.77 0.34 13.55
Fructose + As3+ Fertilizer + As3+ X. autotrophicus GJ10 + As3+ Dual bioaugmentation + As3+ 2.42 8.40 26.70 115.00 2.63 7.50 28.40 112.00 2.81 6.20 31.00 108.00 3.60 38.00
Average 2.87 7.37 31.03 111.67 SD 0.52 1.11 4.98 3.51
CaCO3 + As3+ Na2HPO4 + NaCl + As3+ CaSO4.2H2O + As3+ 2.98 28.40 10.50 3.50 42.00 8.30 3.10 33.00 9.10
Average 3.19 34.47 9.30 SD 0.27 6.92 1.11
SD – standard deviation; cfu/ml – colony forming units per milliliter

201
Table 19: Enumeration of the total 1,2-DCA degrading bacterial population in loam soil co-contaminated with cadmium.
Total 1,2-DCA degrading population (cfu/ml × 106) Day 0
Autoclaved soil control Unautoclaved soil control 0 7.60 0 6.20 0 5.60
Average 0 6.47 SD 0 1.03
Day 10
Autoclaved soil control Unautoclaved soil control Unautoclaved soil + Cd2+ Glucose + Cd2+ 0 42.00 2.94 3.81 0 46.00 4.60 3.58 0 57.00 3.70 3.63 2.30
Average 0 48.33 3.75 3.33 SD 0 7.77 0.83 0.69
Fructose + Cd2+ Fertilizer + Cd2+ X. autotrophicus GJ10 + Cd2+ Dual-bioaugmentation + Cd2+ 2.08 4.60 84 480 1.69 3.90 91 410 1.97 4.10 71 320
Average 1.91 4.20 82.00 403.33 SD 0.20 0.36 10.15 80.21
CaCO3 + Cd2+ Na2HPO4 + NaCl + Cd2+ CaSO4.2H2O + Cd2+ 5.10 12.40 1.98 4.30 10.80 2.46 3.90 11.70 2.18 3.30
Average 4.43 11.63 2.48 SD 0.61 0.80 0.58
SD – standard deviation; cfu/ml – colony forming units per milliliter

202
Table 20: Enumeration of the total 1,2-DCA degrading bacterial population in loam soil treatments co-contaminated with arsenic after 20 days.
Total 1,2-DCA degrading population (cfu/ml × 107) Autoclaved soil control Unautoclaved soil control Unautoclaved soil + As3+ Glucose + As3+ 0 3.01 0.23 29.7 0 2.81 0.21 35.00 0 2.90 0.23 37.00 0.35
Average 0 2.91 0.26 33.90 SD 0 0.10 0.06 3.77
Fructose + As3+ Fertilizer + As3+ X. autotrophicus GJ10 + As3+ Dual bioaugmentation + As3+ 2.85 40.00 275 330.00 2.82 39.00 308 450.00 2.76 30.00 510.00 2.90
Average 2.83 36.33 291.50 430.00 SD 0.06 5.51 23.34 91.65
Total 1,2-DCA degrading population (cfu/ml × 106) CaCO3 + As3+ Na2HPO4 + NaCl + As3+ CaSO4.2H2O + As3+ 285.00 37 29.50 264.00 29 29.40 278.00 31.00 35.00
Average 275.67 33.00 31.23 SD 10.69 5.66 2.62
SD – standard deviation; cfu/ml – colony forming units per milliliter

203
Table 21: Enumeration of the total 1,2-DCA degrading bacterial population in loam soil treatments co-contaminated with cadmium after 20 days.
Total 1,2-DCA degrading population (cfu/ml × 107) Autoclaved soil control Unautoclaved soil control Unautoclaved soil + Cd2+ Glucose + Cd2+ 0 3.01 0.27 29.10 0 2.81 0.30 23.20 0 2.90 31.00 41.00 50.00
Average 0 2.91 0.29 34.86 SD 0 0.10 0.02 10.62
Fructose + Cd2+ Fertilizer + Cd2+ X. autotrophicus GJ10 + Cd2+ Dual bioaugmentation + Cd2+ 2.63 26.40 370 560 2.84 28.10 450 350 2.76 41.00 450 36.00 33.00
Average 2.74 32.90 410 453.33 SD 0.11 5.93 56.57 105.04
Total 1,2-DCA degrading population (cfu/ml × 106) CaCO3 + Cd2+ Na2HPO4 + NaCl + Cd2+ CaSO4.2H2O + Cd2+ 45.00 30.00 6.80 42.00 28.00 4.10 51.00 5.20
Average 46.00 29.00 5.37 SD 4.58 1.41 1.36
SD – standard deviation; cfu/ml – colony forming units per milliliter

REFERENCES

113
Abollino, O., M. Aceto, M. Malandrino, C. Sarzanini, and E. Mentasti. 2003. Adsorption of heavy metals on Na-montmorillonite. Effect of pH and organic substances. Water Research 37:1619-1627. Abraham, W. R., B. Nogales, P. N. Golyshin, D. H. Pieper, and K. N. Timmis. 2002. Polychlorinated biphenyl-degrading microbial communities in soils and sediments. Current Opinion in Microbiology 5:246-253. Abrams, E. S., S. E. Murdaugh, and L. S. Lerman. 1990. Comprehensive detection of single base changes in human genomic DNA using denaturing gradient gel electrophoresis and a GC clamp. Genomics 7:463-475. Alexander, M. 1999. Biodegradation and bioremediation. 2nd edn. Academic Press, London. Alexander, R. R., and M. Alexander. 2000. Bioavailability of genotoxic compounds in soil. Environmental Science and Technology 34:1589-1593. Alisi, C., R. Musella, F. Tasso, C. Ubaldi, S. Manzo, C. Cremisini, and A. R. Sprocati. 2009. Bioremediation of diesel oil in a co-contaminated soil by bioaugmentation with a microbial formula tailored with native strains selected for heavy metals resistance. Science of the Total Environment 407:3024-3032. Al-Tahhan, R., T. Sandrin, A. Bodour, and R. Maier. 2000. Cell surface hydrophobicity of P. aeruginosa: effect of monorhamnolipid on fatty acid and lipopolysaccharide content. Applied and Environmental Microbiology 66:3262-3268. Amann, R. I., W. Ludwig, and K. H. Schleifer. 1995. Phylogenetic identification and in situ detection of individual microbial cells without cultivation. Microbiological Reviews 59:143-169. Amor, L., C. Kennes, and M. C. Veiga. 2001. Kinetics of inhibition in the biodegradation of monoaromatic hydrocarbons in presence of heavy metals. Bioresource Technology 78:181-185. Ang, E. L., H. Zhao, and J. P. Obbard. 2005. Recent advances in the bioremediation of persistant organic pollutants via biomolecular engineering. Enzyme and Microbial Technology 37:487-496. Angle, J. S., and R. L. Chaney. 1989. Cadmium resistance screening in nitrilotriacetate-buffered minimal media. Applied and Environmental Microbiology 55:2101-2104. Archer, W. J. 1979. Chlorocarbons and chlorohyrdrocarbons, p. 723-743. In: Encyclopedia of Chemical Technology, J. Kirk and D. F. Othmer (eds.). John Wiley and Sons, NY. Atlas, R. M., and R. Bartha. 1992. Hydrocarbon biodegradation and oil spill bioremediation. Advances in Microbial Ecology 12:287-338.

114
ATSDR, Agency for Toxic Substances and Disease Registry. 1992. Toxicological profile for 1,2-Dichloroethane. Agency for Toxic Substances and Disease Registry, U. S. Public Health Service, Atlanta, US. ATSDR, Agency for Toxic Substances and Disease Registry. 1993. Toxicological profile for 1,2-dichloroethane (draft). Department of Health and Human Services, U. S. Public Health Service, Atlanta, US. ATSDR, Agency for Toxic Substances and Disease Registry. 1999. Toxicological profile for 1,2-dichloroethane. Department of Health and Human Services, U. S. Public Health Service, Atlanta, US. ATSDR, Agency for Toxic Substances and Disease Registry. 2001. Toxicological profile for 1,2-dichloroethane. Department of Health and Human Services, U. S. Public Health Service, Atlanta, US. ATSDR, Agency for Toxic Substances and Disease Registry. 2006. Toxicological profile for 1,2-dichloroethane. Department of Health and Human Services, U. S. Public Health Service, Atlanta, US. Avrahami, S., and R. Conrad. 2003. Patterns of community change among ammonia oxidizers in meadow soils upon long-term incubation at different temperatures. Applied and Environmental Microbiology 69:6152-6164. Awashti, N., A. Kumar, R. Makkar, and S. Cameotra. 1999. Enhanced biodegradation of endosulfan, a chlorinated pesticide in presence of a biosurfactant. Journal of Environmental Science and Health B 34:793-803. Bååth, E. 1989. Effects of heavy metals in soil on microbial processes and populations (a review). Water, Air and Soil pollution 47:335-379. Babich, H., M. A. Devanas, and G. Stotzky. 1985. The mediation of mutagenicity and clastogenicity of heavy metals by physicochemical factors. Environmental Research 37:253-286. Babich, H., and G. Stotzky. 1982. Nickel toxicity to microbes: influence of pH and implications for acid rain. Environmental Research 29:335-350. Babich, H., and G. Stotzky. 1983. Temperature, pH, salinity, hardness, and particulates mediate nickel toxicity to eubacteria, an actinomycete, and yeasts in lake, simulated estuarine, and sea waters. Aquatic Toxicology 3:195-208. Babich, H., and G. Stotzky. 1985. Heavy-metal toxicity to microbe-mediated ecologic processes-a review and potential application to regulatory policies. Environmental Research 26:111-137. Bailey, S. E., T. J. Olin, R. M. Bricka, and D. D. Adrian. 1999. A review of potentially low-cost sorbents for heavy metals. Water Research 33:2469-2479.

115
Balasoiu, C. F., G. J. Zagury, and L. Deschênes. 2001. Partitioning and speciation of chromium, copper, and arsenic in CCA-contaminated soils: influence of soil composition. The Science of the Total Environment 280:239-255. Baldrian, P., C. I. Der Wiesche, J. Gabriel, F. Nerud, and F. Zadrazil. 2000. Influence of cadmium and mercury on activities of ligninolytic enzymes and degradation of polycyclic aromatic hydrocarbons by Pleurotus ostreatus in soil. Applied and Environmental Microbiology 66:2471-2478. Banks, M. K., and J. Alleman. 2002. Microbial indicators of bioremediation potential and success. In: Hazardous Substance Research Centers. Georgia Technical Research Corporation. http://www.hsrc.org/mw-microbial.html. Cited 4 October 2008. Baptista, I. R., L. G. Peeva, N. Y. Zhou, D. J. Leak, A. Mantalaris, and A. G. Livingstone. 2006. Stability and performance of Xanthobactor autotrophicus GJ10 during 1,2-dichloroethane biodegradation. Applied and Environmental Microbiology 72:4411-4418. Barbash, J. E., and M. Reinhard. 1989. Abiotic dehalogenation of 1,2-dichloroethane and 1,2-dibromoethane in aqueous solution containing hydrogen sulfide. Environmental Science and Technology 23:1349-1358. Barbee, G. C. 1994. Fate of chlorinated hydrocarbons in the vadose zone and groundwater. Ground Water Monitoring Remediation 14:129-140. Barbier, F., G. Duc, and M. Petit-Ramel. 2000. Adsorption of lead and cadmium ions from aqueous solution to the montmorillonite/water interface. Colloids and Surfaces A 166:153-159. Basta, N. T., R. Gradwohl, K. L. Snethen, and J. L. Schroder. 2001. Chemical immobilization of lead, zinc and cadmium in smelter contaminated soils using biosolids and rock phosphate. Journal of Environmental Quality 30:1222-1230. Baum, C., P. Linweber, and A. Schlichting. 2003. Effects of chemical conditions in re-wetted peats temporal variation in microbial biomass and acid phosphatase activity within the growing season. Applied Soil Ecology 22:167-174. Bejankiwar, R., J. A. Lalman, R. Seth, and N. Biswas. 2005. Electrochemical degradation of 1,2-dichloroethane (DCA) in a synthetic groundwater medium using stainless-steel electrodes. Water Research 39:4715-4724. Belay, N., and L. Daniels. 1987. Production of ethane, ethylene, and acetylene from halogenated hydrocarbons by methanogenic bacteria. Applied and Environmental Microbiology 53:1604-1610. Benka-Coker, M. O., and J. A. Ekundayo. 1998. Effects of heavy metals on growth of species of Micrococcus and Pseudomonas in Crude Oil/ Mineral Salts Medium. Bioresource Technology 66:241-245.

116
Bento, F. M., F. A. O. Camargo, and B. C. Okeke. 2003. Bioremediation of soil contaminated by diesel oil. Brazilian Journal of Microbiology 34:65-68. Bento, F. M., F. A. O. Camargo, B. C. Okeke, and W. T. Frankenberger. 2005. Comparative bioremediation of soils contaminated with diesel oil by natural attenuation, biostimulation and bioaugmentation. Bioresource Technology 96:1049-1055. Berg, G., A. Seech, H. Lee, and J. Trevors. 1990. Identification and characterization of bacterium with emulsifying activity. Journal of Environmental Science and Health 7:753-764. Bhattacharya, P., A. B. Mukherjee, G. Jacks, and S. Nordqvist. 2002. Metal contamination at a wood preservation site: Characterization and experimental studies on remediation. The Science of the Total Environment 290:165-180. Bhattacharyya, P., S. Tripathy, K. Chakrabarti, A. Chakraborty, and P. Banik. 2008. Fractionation and bioavailability of metals and their impacts on microbial properties in sewage irrigated soil. Chemosphere 72:543-550. Birch, L., and H. Brandl. 1996. A rapid method for the determination of metal toxicity to the biodegradation of water insoluble polymers. Analytical Chemistry 354:760-762. Black, C. A., D. D. Evans, J. L. White, L. E. Ensminger, and F. E. Clark. 1965. Methods of soil analysis. American Society for Agronomy. Madison, WI. Blackwood, C. B., T. Marsh, S. H. Kim, and E. A. Paul. 2003. Terminal restriction fragment length polymorphism data analysis for quantitative comparison of microbial communities. Applied and Environmental Microbiology 69:926-932. Blake, D. A., R. C. Blake, M. Khosraviani, and A. R. Pavlov. 1998. Immunoassays for metal ions. Analytica Chimica Acta 376:13-19. Bloem, J., M. Veninga, and J. Sheppard. 1995. Fully automated determination of soil bacterium numbers, cell volumes, and frequencies of dividing cells by confocal laser scanning microscopy and image analysis. Applied and Environmental Microbiology 61:926-936. Boenigk, J., A. Wiedlroither, and K. Pfandl. 2005. Heavy metal toxicity and bioavailability of dissolved nutrients to a bacterivorous flagellate are linked to suspended particle physical properties. Aquatic Toxicology 71:249-259. Boisson, J., M. Mench, V. Didier, P. Solda, and J. Vangronsveld. 1998. Short-term in situ immobilization of Cd and Ni by beringite and steel shots application to long-term sludged plots. Agronomie 18:347-359.

117
Bolan, N. S., R. Naidu, M. A. R. Khan, R. W. Tillman, and J. K. Syers. 1999. The effects of anion sorption on sorption and leaching of cadmium. Australian Journal of Soil Research 37:445-460. Bontidean, I., J. Ahlqvist, A. Mulchandani, W. Chen, W. Bae, R. K. Mehra, A. Mortari, and E. Csöregi. 2003. Novel synthetic phytochelatin-based capacitive biosensor for heavy metal ion detection. Biosensors and Bioelectronics 18:547-553. Boon, N., W. De Windt, W. Verstraete, and E. M. Top. 2002. Evaluation of nested PCR-DGGE (denaturing gradient gel electrophoresis) with group specific 16S rRNA primers for the analysis of bacterial communities from different wastewater treatment plants. FEMS Microbiology Ecology 39:101-112. Boon, N., C. Marle, E. M. Top, and W. Verstraete. 2000. Comparison of the spatial homogeneity of physico-chemical parameters and bacterial 16S rRNA genes in sediment samples from a dumping site for dredging sludge. Applied Microbiology and Biotechnology 53:742-747. Borgmann, U., and W. P. Norwood. 1995. EDTA toxicity and background concentrations of copper and zinc in Hyalella azteca. Canadian Journal of Fisheries and Aquatic Sciences 52:875-881. Borneman, J., P. W. Skroch, K. M. O’Sullivan, J. A. Palus, N. G. Rumjanek, J. L. Jansen, J. Nienhuis, and E. W. Triplett. 1996. Molecular microbial diversity of an agricultural soil in Wisconism. Applied and Environmental Microbiology 62:1935-1943. Bosma, T. M. P., J. Gerritse, and E. van Heiningen. 1998. Intrinsic dechlorination of 1,2-dichloroethane at an industrial site, p. 197-202. T. Telford (ed.). Contaminated Soil ’89, London. Boufadel, M. C., M. T. Suidan, A. D. Venosa, and M. T. Bowers. 1999. Steady seepage in trenches and dams: effect of capillary flow. Journal of Hydraulic Engineering 125:286-294. Bouwer, E. J., and P. L. McCarty. 1983. Transformations of halogenated organic compounds under denitrification conditions. Applied and Environmental Microbiology 45:1295-1299. Braide, V. B. 1984. Calcium EDTA toxicity-renal excretion of endogenous trace metals and the effect of repletion on collagen degradaton in the rat. General Pharmacology 15:3741. Bremner, J. M., and R. L. Mulvaney. 1978. Urease activity in soils, p. 149-187. In: Soil Enzymes, R. G. Burns (ed.). Academic Press, NY. Brookes, P. C. 1995. The use of microbial parameters in monitoring soil pollution. Biology and Fertility of Soils 19:269-279. Brouwere, K. D., E. Smolders, and R. Merckx. 2004. Soil properties affecting solid-liquid distribution of As(V) in soils. European Journal of Soil Science 55:165-173.

118
Brown, S., B. Christensen, E. Lombi, M. McLaughlin, S. McGrath, J. Colpaert, and J. Vangronsveld. 2005. An inter-laboratory study to test the ability of amendments to reduce the availability of Cd, Pb, and Zn in situ. Environmental Pollution 138:34-45. Brown Jr., G. E., A. L. Foster, and J. D. Ostergren. 1999. Mineral surfaces and bioavailability of heavy metals: A molecular-scale perspective. Proceedings of the National Academy of Science USA 96:3388-3395. Bruins, M. R., S. Kapil, and F. W. Oehme. 2000. Microbial resistance to metals in the environment. Ecotoxicology and Environmental Safety 45:198-207. Button, D. K., B. R. Robertson, D. McIntosh, and F. Jüttner. 1992. Interactions between marine bacteria and dissolved phase and beached hydrocarbons after the Exxon Valdez oil spill. Applied and Environmental Microbiology 58:243-251. Campbell, P. G. C. 1995. Interactions between trace metals and aquatic organisms: a critique of the free-ion activity model, p. 45-102. In: Metal Speciation and Bioavailability in Aquatic Systems, A. Tessier, and D. R. Turner (eds.). Wiley, Chichester. Campbell, C. D., M. Hird, D. G. Lumsdon, and J. C. L. Meeussen. 2000. The effect of EDTA and fulvic acid on Cd, Zn, and Cu toxicity to a bioluminescent construct (pUCD607) of Escherichia coli. Chemosphere 40:319-325. Cao, X., and L. Q. Ma. 2004. Effects of compost and phosphate on plant arsenic accumulation from soils near pressure-treated wood. Environmental Pollution 132:435-442 Capone, D. G., D. Reese, and R. P. Kiene. 1983. Effects of metals on methanogenesis, sulfate reduction, carbon dioxide evolution, and microbial biomass in anoxic salt marsh sediments. Applied and Environmental Microbiology 45:1586-1591. Carine, F., A. G. Enrique, and C. Stéven. 2009. Metal effects on phenol oxidase activities of soil. Ecotoxicology and Environmental Safety 72:108-114. Carter, D. O., D. Yellowlees, and M. Tibbett. 2007. Autoclaving kills soil microbes yet soil enzymes still remain active. Pedo Biologia 51:295-299. Casamayor, E. O., C. Pedros-Alio, G. Muyzer, and R. Amann. 2002. Microheterogeneity in 16S ribosomal DNA-defined bacterial populations from a stratified planktonic environment is related to temporal changes and to ecological adaptations. Applied and Environmental Microbiology 68:1706-1714. Casamayor, E. O., H. Schäfer, L. Bañeras, C. Pedrós-Alió, and G. Muyzer. 2000. Identification of and spatio-temporal differences between microbial assemblages from two neighboring sulfurous lakes: comparison by microscopy and denaturing gradient gel electrophoresis. Applied and Environmental Microbiology 66:499-508.

119
Cerniglia, C. E. 1984. Microbial transformation of aromatic hydrocarbons, p. 99-128. In: Petroleum Microbiology, R. M. Atlas (ed.). Macmillan Publishing Company, NY. Cerniglia, C. E., and M. A. Heitkamp. 1989. Microbial degradation of polycyclic aromatic hydrocarbons (PAH) in the aquatic environment, p. 41-68. In: Metabolism of Polycyclic Aromatic Hydrocarbons in the Aquatic Environment, U. Varanasi (ed.). CRC Press, Boca Raton, Florida. Chaineau, C. H., C. Yepremian, J. F. Vidalie, J. Ducreaux, and D. Ballerini. 2003. Bioremediation of a crude oil-polluted soil: biodegradation, leaching and toxicity assessments. Water, Air, and Soil Pollution 144:419-440. Chander, K., and P. C. Brookes. 1991. Is the dehydrogenase assay invalid as a method to estimate microbial activity in copper contaminated soils?. Soil Biology and Biochemistry 23:909-915. Chang, I. S., J. L. Groh, M. M. Ramsey, J. D. Ballard, and L. R. Krumholz. 2004. Differential expression of Desulfovibrio vulgaris genes in response to Cu(II) and Hg(II) toxicity. Applied and Environmental Microbiology 70:1847-1851. Chaudri, A. M., K. Lawlor, S. Preston, G. I. Paton, K. Killham, and S. P. McGrath. 2000. Response of a Rhizobium based luminescence biosensor to Zn and Cu in soil solutions from sewage sludge treated soils. Soil Biology and Biochemistry 32:383-388. Chen, Z. S., G. J. Lee, and J. C. Liu. 2000. The effects of chemical remediation treatments on the extractability and speciation of cadmium and lead in contaminated soils. Chemosphere 41:235-242. Chen, S. Y., and J. G. Lin. 2001. Effect of substrate concentration on bioleaching of metal-contaminated sediment. Journal of Hazardous Materials B82:77-89. Chen, M., L. Q. Ma, S. P. Singh, R. X. Cao, and R. Melamed. 2003. Field demonstration of in situ immobilization of soil Pb using P amendments. Advances in Environmental Research 8:93-102. Chen, C. M., T. K. Misra, S. Silver, and B. P. Rosen. 1986. Nucleotide sequence of the structural genes for an anion pump: the plasmid-encoded arsenical resistance operon. Biological Chemistry 261:15030-15038. Chen, S., M. Xu, Y. Ma, and J. Yang. 2007. Evaluation of different phosphate amendments on availability of metals in contaminated soils. Ecotoxicology and Environmental Safety 67:278-285. Cheng, S. P. 2003. Heavy metal pollution in China: origin, pattern, and control. Environmental Science and Pollution Research International 10:192-198. Cheng, B. J., N. Zhu, R. L. Fan, C. X. Zhou, G. N. Zhang, W. K. Li, and K. J. Ji. 2002. Computer aided optimum design of rubber recipe using uniform design. Polymer Testing 21:83-88.

120
Codina, J. C., F. M. Cazorla, A. Pérez-García, and A. De Vicente. 2000. Heavy metal toxicity and genotoxicity in water and sewage determined by microbiological methods. Environmental Toxicology and Chemistry 19:1552-1558. Cohen, I., R. Biton, and N. Yeshagahu. 1991. The effect of zinc and cadmium ions on Escherchia coli B. Microbios 68:157-168. Coleman, N. V., T. E. Mattes, J. M. Gossett, and J. C. Spain. 2002. Biodegradation of cis-dichloroethene as the sole carbon source by a β-proteobacterium. Applied and Environmental Microbiology 68:2726-2730. Coles, C. A., and R. N. Yong. 2002. Aspects of kaolinite characterization and retention of Pb and Cd. Applied Clay Science 22:39-45. Collins, Y. E., and G. Stotzky. 1989. Factors affecting the toxicity of heavy metals to microbes, p. 31-90. In: Metal Ions and Bacteria, T. J. Beveridge, and R. J. Doyle (eds.).Wiley, NY. Collins, Y. E., and G. Stotzky. 1992. Heavy metals alter the electrokinetic properties of bacteria, yeasts, and clay minerals. Applied and Environmental Microbiology 58:1592-1600. Cookson Jr., J. R. 1995. Bioremediation Engineering: Design and Application. McGraw-Hill, NY. Coombs, J. M., and T. Barkay. 2004. Molecular evidence for the evolution of metal homeostasis genes by lateral gene transfer in bacteria from deep terrestrial subsurface. Applied and Environmental Microbiology 70:1698-1707. Coombs, J. M., and T. Barkay. 2005. New findings on evolution of metal homeostasis genes: Evidence from comparative genome analysis of bacteria and archaea. Applied and Environmental Microbiology 71:7083-7091. Corbisier, P., D. Van Der Lelie, B. Borremans, A. Provoost, V. De Lorenzo, N. L. Brown, J. R. Lloyd, J. L. Hobman, E. Csoregi, G. Johansson, and B. Mattiasson. 1999. Whole cell and protein-based biosensors for the detection of bioavailable heavy metals in environmental samples. Analytica Chimica Acta 387:235-244. Cotter-Howells, J., and S. Caporn. 1996. Remediation of contaminated land by formation of heavy metal phosphates. Applied Geochemistry 11:335-342. Daane, L. L., J. A. E. Molina, E. C. Berry, and M. J. Sadowsky. 1996. Influence of earthworm activity on gene transfer from Pseudomonas fluorescens to indigenous soil bacteria. Applied and Environmental Microbiology 62:515-521. Davenport, J. R., and F. J. Peryea. 1991. Phosphate fertilizers influence leaching of lead and arsenic in a soil contaminated with lead arsenate. Water Air and Soil Pollution 57-58:101-110.

121
Davis, A., G. G. Fennemore, C. Peck, C. R. Walker, J. McIlwraith, and S. Thomas. 2003. Degradation of carbon tetrachloride in a reducing groundwater environment: implications for natural attenuation. Applied Geochemistry 18:503-525. Davis, G. B., B. M. Patterson, and C. D. Johnston. 2009. Aerobic bioremediation of 1,2-dichloroethane and vinyl chloride at field scale. Journal of Contaminant Hydrology 107:91-100. DEA, Defra and Environment Agency. 2002. Potential contaminants for the assessment of land, R and D Publication. CLR 8. Delaune, R. D., C. Mulbah, I. Devai, and C. W. Lindau. 1998. Effect of chromium and lead on degradation of South Louisiana crude oil in sediment. Journal of Environmental Science and Health Part A 33:527-546. De Leij, F. A. A. M., J. M. Whipps, and J. M. Lynch. 1993. The use of colony development for the characterization of bacterial communities in soil and on roots. Microbial Ecology 27:81-97. deLemos, J. L., B. C. Bostick, C. E. Renshaw, S. Sturup, and X. H. Feng. 2006. Landfill-stimulated iron reduction and arsenic release at the Coakley Superfund Site (NH). Environmental Science and Technology 40:67-73. de Lorenzo, V. 2008. Systems biology approaches to bioremediation. Current Opinion in Biotechnology 19:579-589. Demanou, J., S. Sharma, U. Dörfler, R. Schroll, K. Pritsch, T. Njine, U. Bausenwein, A. Monkiedje, J.C. Munch, and M. Schloter. 2006. Structural and functional diversity of soil microbial communities as a result of combined applications of copper and mefenoxam. Soil Biology and Biochemistry 38:2381-2389. Demoling, F., D. Figueroa, and E. Bååth. 2007. Comparison of factors limiting bacterial growth in different soils. Soil Biology and Biochemistry 39:2485-2495. de Rooij, C., J. C. Boutonnet, C. Defourny, V. Garny, A. Lecloux, R. Papp, R. S. Thompson, and D. van Wijk. 1998. Euro-chlor risk assessment for the marine environment osparcom region: North Sea 1,1,2-Trichloroethane. Environmental Monitoring and Assessment 53:447-466. De Wildeman, S., G. Diekerk, H. van Langenhove, and W. Verstraete. 2003. Stereoselective microbial dehalorespiration with vicinal dichlorinated alkanes. Applied and Environmental Microbiology 69:5643-5647. De Wildeman, S., and W. Verstraete. 2003. The quest for microbial reductive dechlorination of C(2) to C(4) chloroalkanes is warranted. Applied and Environmental Microbiology 61:94-102.

122
Dey, S., and B. P. Rosen. 1995 Dual mode of energy coupling by the oxyanion-translocating ArsB protein. Journal of Bacteriology 177:385-389. Dick, R. P. 1997. Soil enzyme activities as integrative indicators of soil health, p. 121-156. In: Biological Indicators of Soil Health, C. E. Pankhurst, B. M. Doube, and V. V. S. R. Gupta (eds.). CAB International, NY. Dick, R. P., D. P. Breakwell, and R. F. Turco. 1996. Soil enzyme activities and biodiversity measurements and integrative microbial indicators, p. 247-271. In: Methods of assessing soil quality. Soil Science Society of America Publication, Madison, WI. Diorio, C., J. Cai, J. Marmor, R. Shinder, and M. S. DuBow. 1995. An Escherichia coli chromosomal ars operon homolog is functional in arsenic detoxification and is conserved in gram-negative bacteria. Journal of Bacteriology 177:2050-2056. Doelman, P., E. Jansen, M. Michels, and M. Van Til. 1994. Effects of heavy metals in soil on microbial diversity and activity as shown by the sensitivity-resistance index, an ecologically relevant parameter. Biology and Fertility of Soils 17:177-184. Dopson, M., C. Baker-Austin, P. R. Koppineedi, and P. L. Bond. 2003. Growth in sulfidic mineral environments: metal resistance mechanisms in acidophilic micro-organisms. Microbiology 149:1959-1970. Dowty, R. A., G. P. Shaffer, M. W. Hester, G. W. Childers, F. M. Campo, and M. C. Greene. 2001. Phytoremediation of small-scale oil spills in fresh marsh environments: a mesocosm simulation. Marine Environmental Research 52:195-211. Duran, N., and E. Esposito. 2000. Potential applications of oxidative enzymes and phenoloxidase-like compounds in wastewater and soil treatments: a review. Applied Catalysis B: Environmental 28:83-99. Durrieu, C., and C. Tran-Minh. 2002. Optical algal biosensor using alkaline phosphatase for determination of heavy metals. Ecotoxicology and Environmental Safety 51:206-209. Dutré, V., and C. Vandercasteele. 1995. Solidification/stabilization of hazardous arsenic containing waste from a copper refining process. Journal of Hazardous Materials 40:55-68. Dutré, V., and C. Vandercasteele. 1998. Immobilization of arsenic in waste solidified using cement and lime. Environmental Science and Technology 32:2782-2787. Dutré, V., C. Vandercasteele, and S. Opdenakker. 1999. Oxidation of arsenic bearing fly ash as a pretreatment before solidification. Journal of Hazardous Materials B68:205-215. Echeverria, J. C., E. Churio, and J. J. Garrido. 2002. Retention mechanisms of Cd on illite. Clays and Clay Minerals 50:614-623.

123
Editorial. 2003. A special issue on heavy metals in soils: editorial foreword. Advances in Environmental Research 8:1-3. Edwards, P. 1992. Dangerous substances in water: a practical guide. London Environmental Data Services. Edwards, R., I. Rebedea, N. W. Lepp, and A. J. Lovell. 1999. An investigation into the mechanism by which synthetic zeolites reduce labile metal concentrations in soils. Environmental Geochemistry and Health 21:157-173. Egli, C., R. Scholtz, A. M. Cook, and T. Leisinger. 1987. Anaerobic dechlorination of tetrachloromethane and 1,2-dichloroethane to degradable products by pure cultures of Desulfobacterium sp. and Methanobacterium sp. FEMS Microbiology Letters 43:257-261. Ehlers, L. J., and R. G. Luthy. 2003. Contaminant bioavailability in soil and sediment. Environmental Science and Technology 37:295A-302A. Ehsan, S., S. O. Prasher, and W. D. Marshall. 2007. Simultaneous mobilization of heavy metals and polychlorinated biphenyl (PCB) compounds from soil with cyclodextrin and EDTA in admixture. Chemosphere 68:150-158. Eichner, C. A., R. W. Erb, K. N. Timmis, and I. Wagner-Dobler. 1999. Thermal gradient gel electrophoresis analysis of bioprotection from pollutant shocks in the activated sludge microbial community. Applied and Environmental Microbiology 65:102-109. El Fantroussi, S., and S. N. Agathos. 2005. Is bioaugmentation a feasible strategy for pollutant removal and site remediation?. Current Opinion in Microbiology 8:268-275. Eriksson, J. E. 1988. The effects of clay, organic matter and time on adsorption and plant uptake of cadmium added to the soil. Water, Air, and Soil Pollution 40:359-373. Evdokimova, G. A. 2001. Fluorine in the soils of the White Sea Basin and bioindication of pollution. Chemosphere 42:35-42. Ewers, U., and H. W. Schlipköter. 1991. Lead. In: Metals and their compounds in the environment, E. Merian (ed.). VCH, Weinheim. Falta, R. W. 2004. The potential for ground water contamination by the gasoline lead scavengers ethylene dibromide and 1,2-dichloroethane. Ground Water Monitoring and Remediation 24:76-87. Farhadian, M., C. Vachelard, D. Duchez, and C. Larroche. 2008. In situ bioremediation of monoaromatic pollutants in groundwater: a review. Bioresource Technology 99:5296-5308.

124
Ferguson, J. F., and J. M. H. Pietari. 2000. Anaerobic transformations and bioremediation of chlorinated Solvents. Environmental Pollution 107:209-215. Ferrari, V. C., and J. T. Hollibaugh. 1999. Distribution of microbial assemblages in the Central Arctic Ocean basin studied by PCR/DGGE: analysis of a large data set. Hydrobiologia 401:55-68. Fetzner, S. 1998. Bacterial dehalogenation. Applied Microbiology and Biotechnology 50:633-657. Field, J. A., and R. Sierra-Alvarez. 2004. Biodegradability of chlorinated solvents and related chlorinated aliphatic compounds. Reviews in Environmental Science and Biotechnology 3:185-254. Fierens, S., H. Mairesse, J. F. Heilier, C. De Burbure, J. F. Focant, G. Eppe, and E. De Pauw. 2003. Dioxin/polychlorinated biphenyl body burden, diabetes and endometriosis: findings in a population-based study in Belgium. Biomarkers 8:529-534. Fjeilbirkeland, A., V. Torsvik, and L. Ovreas. 2001. Methanotrophic diversity in an agricultural soil as evaluated by denaturing gradient gel electrophoresis profiles of pmuA, mxaF and 16S rDNA sequences. Antonie van Leeuwenhoek 79:209-217. Flick, D. F., H. F. Kray bill, and J. M. Dimitroff. 1971. Toxic effects of cadmium: a review. Environmental Research 4:71-85. Fliessbach, A., R. Martens, and H. H. Reber. 1994. Soil microbial biomass and microbial activity in soils treated with heavy metal contaminated sewage sludge. Soil Biology and Biochemistry 26:1201-1205. Forney, L. J., X. Zhou, and C. J. Brown. 2004. Molecular microbial ecology: land of the one-eyed king. Current Opinion in Microbiology 7:210-220. Forsyth, J. V., Y. M. Tsao, and R. D. Bleam. 1995. Bioremediation: when is augmentation needed, p. 1-14. In: Bioaugmentation for Site Remediation, R. E. Hinchee, J. Fredrickson and B. C. Alleman (eds.). Battelle Press, Columbus. Franklin, N. M., J. L. Stauber, S. J. Markich, and R. P. Lim. 2000. pH-dependent toxicity of copper and uranium to a tropical freshwater alga (Chlorella sp.). Aquatic Toxicology 48:275-289. Fromin, N., J. Hamelin, S, Tarnawski, D. Roesti, K. Jourdain-Miserez, N. Forestier, S. Teyssier-Cuvelle, F. Gillet, M. Arango, and P. Rossi. 2002. Statistical analysis of denaturing gel electrophoresis (DGE) fingerprinting patterns. Environmental Microbiology 4:634-643. Gallegos, P., J. Lutz, J. Markwiese, R. Ryti, and R. Mirenda. 2007. Wildlife ecological screening levels for inhalation of volatile organic chemicals. Environmental Toxicology and Chemistry 26:1299-1303.
125
Gao, J., and R. S. Skeen. 1998. Glucose induced biodegradation of cis-dichloroethylene under aerobic conditions. Water Research 33:2789-2798. García-Gil, J. C., C. Plaza, P. Soler-Rovira, and A. Polo. 2000. Long-term effects of municipal solid waste compost application on soil enzyme activities and microbial biomass. Soil Biology and Biochemistry 32:1907-1913. García-Sánchez, A., A. Alastuey, and X. Querol. 1999. Heavy metal adsorption by different minerals: application to the remediation of polluted soils. Science of the Total Environment 242:179-188. Garcia-Sanchez, A., E. Alvarez-Ayuso, and F. Rodriguez-Martin. 2002. Sorption of As(V) by some oxyhydroxides and clay minerals. Application to its immobilization in two polluted mining soils. Clay minerals 37:187-194. GDCh-BUA, Gesellschaff Deutscher Chemiker e. V. 1997. German chemical society, committee on existing chemicals of environment relevance. In: 1,2-Dichloroethane, S. H. Stuttgart. BUA Report 163 (December 1994). Gentry, T. J., C. Rensing, and I. L. Pepper. 2004. New approaches for bioaugmentation as a remediation technology. Critical Reviews in Environmental Science and Technology 34:447-94. Gerhardt, P., R. Murray, R. Costilow, E. Nester, W. Wood, N. Krieg, and G. B. Phillips. 1991. Manual of methods for general bacteriology. American Society for Microbiology, Washington, DC. Gerritse, J., A. Borger, E. Heiningen, H. H. M. Rijnaarts, and N. P. Bosma. 1999. Assessment and monitoring of 1,2-dichloroethane dechlorination. In: Proceedings of the Fifth Symposium on In situ and On-site Bioremediation, San Diego, CA. Ghosh, A. K., P. Bhattacharyya, and R. Pal. 2004. Effect of arsenic contamination on microbial biomass and its activities in arsenic contaminated soils of Gangetic West Bengal, India. Environmental International 30:491-499. Gianfreda, L., M. A. Rao, A. Piotrowska, G. Palumbo, and C. Colombo. 2005. Soil enzyme activities as affected by anthropogenic alterations: intensive agricultural practices and organic pollution. Science of the Total Environment 341:265-279. Gilbride, K. A., D. Y. Lee, and L. A. Beaudette. 2006. Molecular techniques in wastewater: understanding microbial communities, detecting pathogens, and real-time process control. Journal of Microbiological Methods 66:1-20. Gillan, D. C. 2004. The effect of an acute copper exposure on the diversity of a microbial community in North Sea sediments as revealed by DGGE analysis-the importance of the protocol. Marine Pollution Bulletin 49:504-513.

126
Giller, K. E., E. Witter, and S. P. McGrath. 1998. Toxicity of heavy metals to microorganisms and microbial processes in agricultural soils: a review. Soil Biology and Biochemistry 30:1389-1414. Giovannoni, S. J., T. B. Britschgi, C. L. Moyer, and K. G. Field. 1990. Genetic diversity in Sargasso sea bacteriplanton. Nature 345:60-63. Gladysheva, T. B., K. L. Oden, and B. P. Rosen. 1994. Properties of the arsenate reductase of plasmid R773. Biochemistry 33:7288-7293. Go, K. S., Y. Kim, S. R. Son, and S. D. Kim. 2010. 1,2-Dichloroethane production by two-step oxychlorination reactions in a fluidized bed reactor. Chemical Engineering Science 65:499-503 Goblenz, A., K. Wolf, and P. Banda. 1994. The role of gluthathione biosynthesis in heavy metal resistance in the fission yeast Schizosaccharomyces pombe. Metals and microorganisms: relationships and applications. FEMS Microbiology Reviews 14:303-308. Göhre, V., and U. Paszkowski. 2006. Contribution of the arbuscular mycorrhizal symbiosis to heavy metal phytoremediation. Planta 223:1115-1122. Goldstein, M. G., L. M. Mallory, and M. Alexander. 1985. Reasons for possible failure of inoculation to enhance biodegradation. Applied and Environmental Microbiology 50:977-983. Gommy, C., E. Perdrix, J. C. Galloo, and R. Guillermo. 1998. Metal speciation in soil: extraction of exchangeable cations from a calcareous soil with a magnesium nitrate solution. International Journal of Environmental Analytical Chemistry 72:27-45. Gonzalez-Gil, G., R. Kleerebezem, and G. Lettinga. 1999. Effects of nickel and cobalt on kinetics of methanol conversion by methanogenic sludge as assessed by on-line CH4 monitoring. Applied and Environmental Microbiology 65:1789-1793. Gotz, R., O. H. Bauer, P. Friesel, and K. Roch. 1998. Organic trace compounds in the water of the river Elbe near Hamburg part I. Chemosphere 36:2085-2101. Gray, G. W., and G. Wilkinson. 1965. The action of EDTA on Pseudomonas aeruginosa. Journal of Applied Bacteriology 28:153-164. Gregor, J. 2001. Arsenic removal during conventional aluminium-based drinking-water treatment. Water Research 35:1659-1664. Guéguen, C., R. Gilbin, M. Pardos, and J. Dominik. 2004. Water toxicity and metal contamination assessment of a polluted river: the Upper Vistula River (Poland). Applied Geochemistry 19:153-162.

127
Gupta, A., A. P. Morby, J. S. Turner, B. A. Whitton, and N. J. Robinson. 1993. Deletion within the metallothionein locus of cadmium-tolerant Synechococcus PCC 6301 involving a highly iterated palindrome (HIP1). Molecular Microbiology 7:189-195. Gupta, A., B. A. Whitton, A. P. Morby, J. W. Huckle, and N. J. Robinson. 1992. Amplification and rearrangement of a prokaryotic metallothionein locus smt in Synechococcus PCC-6301 selected for tolerance to cadmium, p. 273-281. In: Proceedings of the Royal Society of London. Series B, Biological sciences. Royal Society, Great Britain. Gürtler, V., and V. A. Stanisich. 1996. New approaches to typing and identification of bacteria using the 16S-23S rDNA spacer region. Microbiology 142:3-16. Gworek, B. 1992. Inactivation of cadmium in contaminated soil using synthetic zeolites. Environmental Pollution. 75:269-271. Hage, J. C., and S. Hartmans. 1999. Monooxygenase-mediated 1,2-dichloroethane degradation by Pseudomonas sp. strain DCA1. Applied and Environmental Microbiology 65:2466- 2470. Halliwell, B., and J. M. Gutteridge. 1984. Oxygen toxicity, oxygen radicals, transition metals and disease. Biochemical Journal 219:1-14. Halliwell, B., and J. M. Gutteridge. 1985. The importance of free radicals and catalytic metal ions in human diseases. Molecular Aspects of Medicine 8:89-193. Hamlett, N. V., E. C. Landale, B. W. Davis, and A. O. Summers. 1992. Roles of the Tn21, mer¹, merP, and merC gene products in mercury resistance and mercury binding. Journal of Bacteriology 174:6377-6385. Hargreaves, J. W., and B. A. Whitton. 1976. Effect of pH on tolerance of Hormidium rivulare to zinc and copper. Oecologia 26:235-243. Hartley, W., N. M. Dickinson, R. Clemente, C. French, T. G. Piearce, S. Sparke, and N. W. Lepp. 2009. Arsenic stability and mobilization in soil at an amenity grassland overlying chemical waste (St. Helens, UK). Environmental Pollution 157:847-856. Hartley,W., R. Edwards, and N. W. Lepp. 2004. Arsenic and heavy metal mobility in iron oxide-amended contaminated soils as evaluated by short- and long-term leaching tests. Environmental Pollution 131:495-504. Harvey C. F., C. H. Swartz, A. B. M. Badruzzaman, N. Keon-Blute, W. Yu, M. Ashraf Ali, J. Jay, R. Beckie, V. Niedan, D. J. Brabander, P. M. Oates, K. N. Ashfaque, S. Islam, H. F. Hemond, and M. F. Ahmed. 2002. Arsenic mobility and groundwater extraction in Bangladeshi aquifer. Science 298:1602-1606.

128
Hashemi, F., G. G. Leppard, and D. J. Kushner. 1994. Copper resistance in Anabaena variabilis: effects of phosphate nutrition and polyphosphate bodies. Microbial Ecology 27:159-176. Hattori, H. 1992. Influence of heavy metals on soil microbial activities. Soil Science and Plant Nutrition 38:93-100. Havlin, J. L., S. L. Tisdale, W. L. Nelson, and J. D. Beaton. 1999. Soil fertility and fertilizers: an introduction to nutrient management, p. 499. Prentice-Hall, NJ. Hayes, V. M., Y. Wu., J. Osinga, I. M. Mulder, P. van der Vlies, P. Elfferich, C. H. C. M. Buys, and R. M. W. Hofstra. 1999. Improvements in gel composition and elecrophoretic conditions for broad-range mutation analysis by denaturing gradient gel electrophoresis. Nucleic Acids Research 27:e29. He, J. Z., K. M. Ritalahti, K. L. Yang, S. S. Koenigsberg, and F. E. Löffler. 2003. Detoxification of vinyl chloride to ethane coupled to growth of an anaerobic bacterium. Nature 424:62-65. He, J. Z., Z. H. Xu, and J. Hughes. 2005. Analyses of soil fungal communities in adjacent natural forest and hoop pine plantation ecosystems of subtropical Australia using molecular approaches based on 18S rRNA genes. FEMS Microbiology letters 247:91-100. Heckman, J. R., J. S. Angle, and R. L. Chaney. 1986. Soyabean nodulation and nitrogen fixation on soil previously amended with sewage sludge. Biology of Fertile Soils 2:181-185. Heinrichs, H., and R. Mayer. 1980. The role of forest vegetation in the biogeochemical cycle of heavy metals. Journal of Environmental Quality 9:111-118. Henderson, J. K., D. L. Freedman, R. W. Falta, T. Kuder, and J. T. Wilson. 2008. Anaerobic biodegradation of ethylene dibromide and 1,2-dichloroethane in the presence of fuel hydrocarbons. Environmental Science and Technology 42:864-870. Herman, D. C., J. F. Artiola, and R. M. Miller. 1995. Removal of cadmium, lead, and zinc from soil by a rhamnolipid biosurfactant. Environmental Science Technology 29:2280-2285. Herman, D. C., Y. M. Zhang, and R. M. Miller. 1997. Rhamnolipid (biosurfactant) effects on cell aggregation and biodegradation of residual hexadecane under saturated flow conditions. Applied and Environmental Microbiology 63:3622-3627. Hickman, Z. A., A. L. Swindell, I. J. Allan, A. H. Rhodes, R. Hare, K. T. Semple, and B. J. Reid. 2008. Assessing biodegradation potential of PAHs in complex multi-contaminant matrices. Environmental Pollution 156:1041-1045. Hinojosa, B. M., J. A. Carreira, R. García-Ruíz, and P. R. Dick. 2004. Soil moisture pre-treatment effects on enzyme activities as indicators of heavy metal-contaminated and reclaimed soils. Soil Biology and Biochemistry 36:1559-1568.

129
Hirschorn, S. K., M. J. Dinglasan-Panlilio, E. A. Edwards, G. Lacrampe-Couloume, and B. Sherwood Lollar. 2007. Isotope analysis as a natural reaction probe to determine mechanisms of biodegradation of 1,2-dichloroethane. Environmental Microbiology 9:1651-1657. Hobman, J. L., and N. L. Brown. 1996. Overexpression of MerT, the mercuric ion transport protein of transposon Tn501, and genetic selection of mercury hypersensitivity mutations. Molecular and General Genetics 250:129-134. Hodson, M. E., E. Valsami-Jones, and J. D. Cotter-Howells. 2000. Bone meal additions as a remediation treatment for metal contaminated soil. Environmental Science and Technology 34:3501-3507. Hoffman, D. R., J. L. Okan, and T. R. Sandrin. 2005. Medium composition affects the degree and pattern of cadmium inhibition of naphthalene biodegradation. Chemosphere 59:919-927. Holliger, C., G. Schraa, A. J. M. Stams, E. Stupperich, and A. J. M. Zehnder. 1990a. Cofactor-dependent reductive dechlorination of 1,2-dichloroethane by Methanosarcina barkeri. Abstract. Annual Meeting American Society of Microbiology. Holliger, C., G. Schraa, A. J. M. Stams, and A. J. M. Zehnder. 1990b. Reductive dechlorination of 1,2-dichloroethane and chloroethane by cell suspensions of methanogenic bacteria. Biodegradation 1:253-261. Hommel, R., L. Weber, A. Weiss, O. Rilke, and H. Kleber. 1994. Production of sophorose lipid by Candida apicola grown on glucose. Biotechnology 33:147-155. Hong, H. B., I. H. Nam, Y. M. Kim, Y. S. Chang, and S. Schmidt. 2007. Effect of heavy metals on the biodegradation of dibenzofuran in liquid medium. Journal of Hazardous Materials 140:145-148. Hooda, P. S., H. Zhang, W. Davison, and A. C. Edwards. 1999. DGT- a new in situ procedure for measuring bioavailable trace metals in soils. European Journal of Soil Science 50:285-294. Hoostal, M. J., M. G. Bidart-Bouzat, and J. L. Bouzat. 2008. Local adaptation of microbial communities to heavy metal stress in polluted sediments of Lake Erie. FEMS Microbiology Ecology 65:56-168. HSDB, Hazardous Substances Data Base. 2000. National Library of Medicine. http://toxnet.nlm.nih.gov/cgi-bin/sis/htmlgen?HSDB. Huckle, J. W., A. P. Morby, J. S. Turner, and N. J. Robinson. 1993. Isolation of a prokaryotic metallothionein locus and analysis of transcriptional control by trace metal ions. Journal of Molecular Microbiology 7:177-187.

130
Hughes, K., M. E. Meek, and I. Caldwell. 1994. 1,2-Dichloroethane: evaluation of risks and health from environment exposure in Canada. Environmental Carcinogen Review 12:293-303. Hughes, M. N., and R. K. Poole. 1989. Metal toxicity, p. 252-302. In: Metals and Microorganisms, M. N. Hughes and R. K. Poole (eds.). Chapman and Hall, NY. Hughes, M. N., and R. K. Poole. 1991. Metal speciation and microbial growth-the hard (and soft) facts. Journal of General Microbiology 137:725-734. Hunkeler, D., and R. Aravena. 2000. Evidence of substantial carbon isotope fractionation among substrate, inorganic carbon, and biomass during aerobic mineralization of 1,2-dichloroethane by Xanthobacter autotrophicus. Applied and Environmental Microbiology 66:4870-4876. IARC, International Agency for Research on Cancer. 1979. Some halogenated hydrocarbons, IARC monographs of the evolution of the carcinogenic risk of chemicals to humans. International Agency for Research on Cancer, Lyon. 20. IARC, International Agency for Research on Cancer. 1999. 1,2-Dichloroethane. IARC monographs on the evaluation of carcinogenic risks to humans. International Agency for Research on Cancer, Lyon. 71. Ibekwe, A. M., J. S. Angle, R. L. Chaney, and P. Van Berkum. 1995. Sewage sludge and heavy metal effects on nodulation and nitrogen fixation in legumes. Journal of Environmental Quality 24:1199-1204. Inguva, S., and G. S. Shreve. 1999. Biodegradation kinetics of trichloroethylene and 1,2-dichloroethane by Burkholderia (Pseudomonas) cepacia PR131 and Xanthobacter autotrophicus GJ10. International Biodeterioration and Biodegradation 43:57-61. Insam, H., T. C. Hutchinson, and H. H. Reber. 1996. Effects of heavy metals stress on the metabolic quotient of the soil microflora. Soil Biology Biochemistry 28:691-694. IPCS, International Programme on Chemical Safety. 1995. 1,2-Dichloroethane, 2nd edn. Environment Health Criteria Document No. 176, WHO, Geneva. IPCS, International Programme on Chemical Safety. 1998. 1, 2-Dichloroethane, Concise Internation Chemical Assessment Document (CICAD), WHO, Geneva. Irha, N., J. Slet, and V. Petersell. 2003. Effect of heavy metals and PAH on soil assessed via dehydrogenase assay. Environmental International 28:779-782. Islam, F. S., A. G. Gault, C. Boothman, D. A. Polya, J. M. Charnock, D. Chatterjee, and J. R. Lloyd. 2004. Role of metal-reducing bacteria in arsenic release from Bengal Delta sediments. Nature 430:68-71.

131
Ivanov, A. Y., V. M. Fomchenkov, L. A. Khasanova, and A. V. Gavryushkin. 1997. Toxic effect of hydroxylated heavy metal ions on the plasma membrane of bacterial cells. Microbiology 66:490-495. Ivask, A., M. Virta, and A. Kahru. 2002. Construction and use of specific luminescent recombinant bacterial sensors for the assessment of bioavailable fraction of cadmium, zinc, mercury and chromium in the soil. Soil Biology and Biochemistry 34:1439-1447. Iwamoto, T., and M. Nasu. 2001. Current bioremediation practice and perspective. Journal of Bioscience and Bioengineering 92:1-8. Jackson, W. A., and J. H. Pardue. 1998. Assessment of metal inhibition of reductive dechlorination of hexachlorobenzene at a Superfund site. Environmental Toxicology and Chemistry 17:1441-1446. Jackson, B. P., J. C. Seaman, and P. M. Bertsch. 2006. Fate of arsenic compounds in poultry litter upon land application. Chemosphere 65:2028-2034. Jain, C. K., and I. Ali. 2000. Arsenic: occurrence, toxicity and speciation techniques. Water Research 34:4304-4312. Jain, A., and R. H. Loeppert. 2000. Effect of competing anions on the adsorption of arsenate and arsenite by ferrihydrite. Journal of Environmental Quality 29:1422-1430. Janssen, D. B., I. J. T. Dinkla, G. J. Poelarends, and P. Terpstra. 2005 Bacterial degradation of xenobiotic compounds: evolution and distribution of novel enzyme activities. Environmental Microbiology 7:1868-1882. Janssen, D. B., S. Keuning, and B. Witholt. 1987. Involvement of a quino-protein alcohol dehydrogenase and an NAD-dependent aldehyde dehydrogenase in 2-chloroethanol metabolism in Xanthobacter autotrophicus GJ10. Journal of General Microbiology 133:85-92. Janssen, D. B., F. Pries, and J. R. van der Ploeg. 1994. Genetics and biochemistry of dehalogenating enzymes. Annual Review of Microbiology 48:163-191. Janssen, D. B., F. Pries., J. R. van der Ploeg, B. Kazemier, P. Terpstra, and B. Witholt. 1989. Cloning of 1,2-dichloroetane degrading genes of Xanthobacter autotrophicus GJ10 and expression and sequencing of the dhlA Gene. Journal of Bacteriology 171:6791-6799. Janssen, D. B., A. Scheper, L. Dijkhuizen, and B.Witholt. 1985. Degradation of halogenated aliphatic compounds by Xanthobacter autotrophicus GJ10. Applied and Environmental Microbiology 49:673-677. Janssen, D. B., A. Scheper, and B. Witholt. 1984. Biodegradation of 2-chloroethanol and 1,2-dichloroethane by pure bacterial cultures, p. 169-178. In: Innovations in Biotechnology, E. H. Houwink and R. R. van der Meer (eds.). Elsevier Science Publishers B. V., Amsterdam, Netherlands.

132
Janssen, D. B., J. R. van der Ploeg, and F. Pries. 1995. Genetic adaptation of bacteria to halogenated aliphatic compounds. Environmental Health Perspectives 103:29-32. Jeffers, P. M., L. M. Ward, L. M. Woytowitch, and N. L. Wolfe. 1989. Homogeneous hydrolysis rate constants for selected chlorinated methanes, ethanes, ethenes, and propanes. Environmental Science and Technology 23:965-969. Jenny, K., O. Kappeli, and A. Fiechter. 1991. Biosurfactants from Bacillus licheniformis, structural analysis and characterization. Applied Microbiology and Biotechnology 36:5-13. Jensen, S., L. Øvreas, F. L. Daae, and V. Torsvik. 1998. Diversity in methane enrichments from an agricultural soil revealed by DGGE seperation of PCR amplified 16S rDNA fragments. FEMS Microbiology Ecology 26:17-26. Ji, G. Y., E. A. E. Garber, L. G. Armes, C. M. Chen, J. A. Fuchs, and S. Silver. 1994. Arsenate reductase of Staphylococcus aureus plasmid pI258. Biochemistry 33:7294-7299. Ji, G. Y., and S. Silver. 1992. Reduction of arsenate to arsenite by the ArsC protein of the arsenic resistance operon of Staphylococcus aureus plasmid pI258. In: Proceedings of the National Academy of Sciences, USA 89:9474-9478. Ji, G. Y., and S. Silver. 1995. Bacterial resistance mechanisms for heavy metals of environmental concern. Industrial Microbiology 14:61-75. Jiang, W., S. Z. Zhang, X. Q. Shan, M. H. Feng, Y. G. Zhu, and R. G. McLaren. 2005. Adsorption of arsenate on soils. Part 2: Modeling the relationship between adsorption capacity and soil physiochemical properties using 16 Chinese soils. Environmental Pollution 138:285-289. Jin, P. K., and S. K. Bhattacharya. 1996. Anaerobic removal of pentachlorophenol in presence of zinc. Journal of Environmental Engineering 122:590-598. Jones, K. C. 1991. Organic contaminants in the environment: Environmental pathways and effects, p. 338. Elsevier Applied Science, NY. Juma, N. G., and M. A. Tabatabai. 1977. Effects of trace elements on phosphatase activity in soils. Soil Science Society of America Journal 41:343-346. Kachur, A. V., C. J. Koch, and J. E. Biaglow. 1998. Mechanism of copper catalyzed oxidation of glutathione. Free Radical Research 28:259-269. Kamel, Z. 1986. Toxicity of cadmium to two Streptomyces species as affected by clay minerals. Plant Soil 93:193-205.

133
Kandeler, E., and H. Gerber. 1988. Short-term assay of soil urease activity using colorimetric determination of ammonium. Biology and Fertility of Soils 6:68-72. Kandeler, E., D. Tscherko, K. D. Bruce, M. Stemmer, P. J. Hobbs, R. D. Bardgett, and W. Amelung. 2000. Structure and function of the soil microbial community in microhabitats of a heavy metal polluted soil. Biology and Fertility of Soils 32:390-400. Kanga, S., J. Bonner, C. Page, M. Millis, and R. Autenrieth. 1997. Solubilization of naphthalene and methyl substituted naphthalene from crude oil using biosurfactants. Environmental Science and Technology 31:556-561. Kastanek, F., K. Demnerova, J. Pazlarova, J. Burkhard, and Y. Maleterova. 1999. Biodegradation of polychlorinated biphenyls and volatile chlorinated hydrocarbons in contaminated soils and groundwater in field condition. International Biodeterioration and Biodegradation 44:39-47. Kavamura, V. N., and E. Esposito. 2010. Biotechnological strategies applied to the decontamination of soils polluted with heavy metals. Biotechnology Advances 28:61-69. Kavenagh, P. J., M. E. Farago, I. Thornton, and R. S. Braman. 1997. Bioavailability of arsenic in soil and mine wastes of the Tamar Valley. Chemical Speciation and Bioavailability 9:77-81. Kent, A. D., and E. W. Triplett. 2002. Microbial communities and their interactions in soil and rhizosphere ecosystems. Annual Review of Microbiology 56:211-236. Khan, A. G. 2005. Role of soil microbes in the rhizospheres of plants growing on trace metal contaminated soils in phytoremediation. Trace Elements in Medicine and Biology 18:355-364. Khan, M., and J. Scullion. 1999. Microbial activity in grassland soil amended with sewage sludge containing varying rates and combinations of Cu, Ni and Zn. Biology and Fertility of Soils 30:202-209. Khosraviani, M., A. R. Pavlov, G. C. Flowers, and D. A. Blake. 1998. Detection of heavy metals by immunoassay: optimization and validation of a rapid, portable assay for ionic cadmium. Environmental Science and Technology 32:137-142. Kirk, J. L., L. A. Beaudette, M. Hart, P. Moutoglis, J. N. Klironomos, H. Lee, and J. T. Trevors. 2004. Methods of studying soil microbial diversity. Journal of Microbiological Methods 58:169-188. Kızılkaya, R., T. Aşkın, B. Bayrakli, and M. Sağlam. 2004. Microbiological characteristics of soils contaminated with heavy metals. European Journal of Soil Biology 40:95-102. Klečka, G. M., C. L. Carpenter, and S. J. Gonsior. 1998. Biological transformations of 1,2-dichloroethane in subsurface soils and groundwater. Journal of Contaminant Hydrology 34:139-154.

134
Klier, N. J., R. J. West, and P. A. Donberg. 1999. Aerobic biodegradation of dichloroethylenes in surface and subsurface soils. Chemosphere 38:1175-1188. Knief, C., A. Lipski, and P. F. Dunfield. 2003. Diversity and activity of methanotrophic bacteria in different upland soils. Applied and Environmental Microbiology 69:6703-6714. Knotek-Smith, H. M., L. A. Deobald, M. Ederer, and D. L. Crawford. 2003. Cadmium stress studies: media development, enrichment, consortia analysis, and environmental relevance. BioMetals 16:251-261. Knox, A. S., J. C. Seaman, M. J. Mench, and J. Vangronsveld. 2001. Remediation of metal-and radionuclides-contaminated soils by in situ stabilization techniques, p. 21. In: Environmental Restoration of Metals-contaminated Soils, I. K. Iskandar (ed.). Lewis Publishers, Boca Raton, Florida, USA. Kocamemi, B. A., and F. Çeçen. 2009. Biodegradation of 1,2-dichloroethane (1,2-DCA) by cometabolism in a nitrifying biofilm reactor. International Biodeterioration and Biodegradation 63:717-726. Koizumi, Y., J. J. Kelly, T. Nakagawa, H. Urakawa, S. El-Fantroussi, S. Al-Muzaini, M. Fukui, Y. Urushigawa, and D. A. Stahl. 2002. Parallel characterization of anaerobic toluene- and ethylbenzene-degrading microbial consortia by PCR denaturing gradient gel electrophoresis, RNA-DNA membrane hybridisation, and DNA microarray technology. Applied and Environmental Microbiology 68:3215-3225. Kong, I. C. 1998. Metal toxicity on the dechlorination of monochlorophenols in fresh and acclimated anaerobic sediment slurries. Water Science and Technoogy l38:143-I50. Konopka, A., T. Zakharova, M. Bischoff, L. Oliver, C. Nakatsu, and R. F. Turco. 1999. Microbial biomass and activity in lead-contaminated soil. Applied and Environmental Microbiology 65:2256-2259. Korkeala, H., and T. J. Pekkanen. 1978. The effect of pH and potassium phosphate buffer on the toxicity of cadmium for bacteria. Acta Veterinaria Scandinavica 19:93-101. Kourtev, P. S., C. H. Nakatsu, and A. Konopka. 2006. Responses of the anaerobic bacterial community to addition of organic C in chromium(VI)- and iron(III)-amended microcosms. Applied and Environmental Microbiology 72:628-637. Kovalick Jr., W. W. 1992. Trends in innovative treatment technologies at contaminated sites. Water Science Technology 26:99-106. Kraepiel, A. M. L., K. Keller, and F. M. M. Morel. 1999. A model for metal adsorption on montmorillonite. Colloid and Interface Science 210:43-54. Kumpiene, J., A. Lagerkvist, and C. Maurice. 2008. Stabilization of As, Cr, Cu, Pb and Zn in soil using amendments-A review. Waste Management 28:215-225.

135
Kuo, C. W., and B. R. S. Genthner. 1996. Effect of added heavy metal ions on biotransformation and biodegradation of 2-chlorophenol and 3-chlorobenzoate in anaerobic bacteria consortia. Applied and Environmental Microbiology 62:2317-2323. Kuo, S., and E. G. Lotse. 1972. Kinetics of phosphate adsorption by calcium carbonate and Ca-kaolinite. Soil Science Society of America Journal 48:1040-1044. Laddaga, R. A., R. Bessen, and S. Silver. 1985. Cadmium resistant mutant of Bacillus subtilis 168 with reduced cadmium transport. Journal of Bacteriology 162:1106-1110. Laddaga, R. A., and S. Silver. 1985. Cadmium uptake in Escherichia coli K-12. Journal of Bacteriology 162:1100-1105. Lage , O. M., H. M. V. M. Soares, M. T. S. D. Vasconcelos, A. M. Parente, and R. Salema. 1996. Toxicity effects of Cu (II) on the marine dinoflagellate Amphidinium carterae: influence of metal speciation. European Journal of Phycology 31:341-348. Langdon, C. J., T. G. Piearce, A. A. Meharg, and K. T. Semple. 2003. Interactions between earthworms and arsenic in the soil environment: a review. Environmental Pollution 124:361-373. Lappalainen, J. O., M. T. Karp, J. Nurmi, R. Juvonen, and M. P. J. Virta. 2000. Comparison of the total mercury content in sediment samples with a mercury sensor bacteria test and Vibrio fischeri toxicity test. Environmental Toxicology 15:443-448. Laturnus, F. 2003. Natural sources of volatile organohalogens: Impact on the biosphere. Ph.D. thesis, University of Copenhagen Denmark. Lee, K. Y., K. W. Kim, and S. O. Kim. 2010. Geochemical and microbial effects on the mobilization of arsenic in mine tailing soils. Environmental Geochemistry and Health 32:31-34. Lee, T. M., H. Y. Lai, and Z. S. Chen. 2004. Effect of chemical amendments on the concentration of cadmium and lead in long-term contaminated soils. Chemosphere 57:1459-1471. Lee, S. H., B. I. Oh, and J. Kim. 2008. Effect of various amendments on heavy mineral oil bioremediation and soil microbial activity. Bioresource Technology 99:2578-2587. Lee, M. D., L. Sehayek, B. E. Sleep, and T. D. Vandell. 1999. Investigation and remediation of a 1,2-dichloroethane spill, p. 82-88. Part II. Documentation of natural attenuation, Ground Monitoring and Remediation. Lehmicke, L., and N. Mukherjee. 1999. Natural attenuation of chlorinated methanes and 1,2-DCA at a site in southern California. In: Proceedings of the Fifth Symposium on In situ and On-site Bioremediation, San Diego, CA.

136
Lehoczky, E., P. Marth, I. Szabados, and A. Szomolanyi. 2000. The cadmium uptake by lettuce on contaminated soils as influenced by liming. Communications in Soil Science and Plant Analysis 31:2433-2438. Leigh, M. B., J. S. Fletcher, X. Fu, and F. J. Schmitz. 2002. Root turnover: an important source of microbial substrates in rhizosphere remediation of recalcitrant contaminants. Environmental Science and Technology 36:1579-1583. Leisinger, T. 1996. Biodegradation of chlorinated aliphatic compounds. Current Opinion in Biotechnology 7:295-300. Lendvay, J. M., F. E. Loffler, M. Dollhopf, M. R. Aiello, G. Daniels, B. Z. Fathepure, M. Gebhard, R. Heine, R. Helton, J. Shi, R. Krajmalnik-Brown, C. L. Major Jr., M. J. Barcelona, E. Petrovskis, R. Hickey, J. M. Tiedje, and P. Adriaens. 2003. Bioreactive barriers: a comparison of bioaugmentation and biostimulation for chlorinated solvent remediation. Environmental Science and Technology 37:1422-1431. Lessard, P. E., J. B. Wilkinson, R. C. Prince, J. R. Bragg, J. R. Clark, R. M. Atlas. 1995. Bioremediation application in the cleanup of the 1989 Alaska oil spill, p. 207-225. In: Bioremediation of Pollutants in Soil and Water, ASTM STP1235, B. S. Schepart. (ed.), Philadelphia, PA, USA. Levi-Minzi, R., and G. Petruzzelli. 1984. The influence of phosphate fertilizers on Cd solubility in soil. Water, Air and Soil Pollution 23:423-429. Levinson, H. S., and I. Mahler. 1998. Phosphatase activity and lead resistance in Citrobacter freundii and Staphylococcus aureus. FEMS Microbioloy Letters 161:135-138. Levinson, H. S., I. Mahler, P. Blackwelder, and T. Hood. 1996. Lead resistance and sensitivity in Staphylococcus aureus. FEMS Microbiology Letters 145:421-425. Li, Y. M., R. L. Chaney, G. Siebielec, and B. A. Kerschner. 2000. Response of four turfgrass cultivars to limestone and biosolids-compost amendment of a zinc and cadmium contaminated soil at Palmerton, Pennsylvania. Journal of Environmental Quality 29:1440-1447. Li, Z. S., Y. P. Lu, R. G. Zhen, M. Szczypka, D. J. Thiele, and P. A. Rea. 1997. A new pathway for vacuolar cadmium sequestration in Saccharomyces cerevisiae: YCF1-catalyzed transport of bis(glutathionato)cadmium. Proceeding of the National Academy of Sciences, USA 94:42-47. Li, Z. S., M. Szczypka, Y. P. Lu, D. J. Thiele, and P. A. Rea. 1996. The yeast cadmium factor protein (YCF1) is a vacuolar glutathione-S-conjugate pump. Journal of Biological Chemistry 271:6509-6517. Li, Z., J. Xu, C. Tang, J. Wu, A. Muhammad, and H. Wang. 2006. Application of 16S rDNA-PCR amplification and DGGE fingerprinting for detection of shift in microbial community diversity in Cu-, Zn-, and Cd-contaminated paddy soils. Chemosphere 62:1374-1380.
137
Li, H., Q. Zhao, M. C. Boufadel, and A. D. Venosa. 2007. A universal nutrient application strategy for the bioremediation of oil-polluted beaches. Marine Pollution Bulletin 54:1146-1161. Li, F., Y. M. Zhenga, and J. Z. Hea. 2009. Microbes influence the fractionation of arsenic in paddy soils with different fertilization regimes. Science of the Total Environment 407:2631-2640. Liang, Y. Z., K. T. Fang, and Q. S. Xu. 2001. Uniform design and its applications in chemistry and chemical engineering. Chemometrics and Intelligent Laboratory Systems. 58:43-57. Liao, V. H. C., M. T. Chien, Y. Y. Tseng, and K. I. Ou. 2006. Assessment of heavy metal bioavilability in contaminated sediments and soils using green florescent protein-based bacterial biosensors. Environmental Pollution 142:17-23. Liebeg, E. W., and T. J. Cutright. 1999. The investigation of enhanced bioremediation through the addition of macro and micro nutrients in a PAH contaminated soil. International Biodeterioration and Biodegradation 44:55-64 Lin, S., I. J. Hsieh, K. M. Huang, and C. H. Wang. 2002. Influence of the Yangtze River and grain size on the spatial variations of heavy metals and organic carbon in the East China Sea continental shelf sediments. Chemical Geology 182:377-394. Lin, C. W., H. C. Lin, and C. Y. Lai. 2007. MTBE biodegradation and degrader microbial community dynamics in MTBE, BTEX, and heavy metal-contaminated water. International Biodeterioration and Biodegradation 59:97-102. Lin, Q., K. L. Shen, H. M. Zhao, and W. H. Li. 2008. Growth response of Zea mays L. in pyrene-copper co-contaminated soil and the fate of pollutants. Hazardous Materials 150:515-521. Lin, Q., Z. Wang, S. Ma, and Y. Chen. 2006. Evaluation of dissipation mechanisms by Lolium perenne L, and Raphanus sativus for pentachlorophenol (PCP) in copper co-contaminated soil. Science of the Total Environment 36:814-822. Linderman, R. G. 1988. Mycorrhizal interactions with the rhizosphere microflora: the mycorrhizosphere effect. Phytopathology 78:366-371. Liu, J., and B. P. Rosen. 1997. Ligand interactions of the ArsC arsenate reductase. Journal of Biological Chemistry 272:21084-21089. Lombi, E., R. E. Hamon, G. Wieshammer, M. J. McLaughlin, and S. P. McGrath. 2004. Assessment of the use of industrial by-products to remediate a copper- and arsenic-contaminated soil. Journal of Environmental Quality 33:902-910.

138
Lombi, E., F. J. Zhao, G. Zhang, B. Sun, W. Fitz, H. Zhang, and S. P. McGrath. 2002. In situ fixation of metals in soil using bauxite residue: chemical assessment. Environmental Pollution 118:435-443. Lotrario, J. B., B. J. Stuart, T. Lam, R. R. Arands, A. O. O’Connor, and D. S. Kosson. 1995. Effects of sterilization methods on the physical characteristics of soil implications for sorption isotherm analyses. Bulletin of Environmental Contamination and Toxicology 54:668-675. Ma, L. Q., K. M. Komar, C. Tu, W. Zhang, Y. Cai, and E. D. Kennelley. 2001. A fern that hyperaccumulates arsenic. Nature 409:579. Ma, L. Q., S. J. Traina, T. J. Logan, and J. A. Ryan. 1993. In situ lead immobilization by apatite. Environmental Science and Technology 27:1803-1810. Ma, X., and C. Wang. 2009. Impacts of the physiochemical properties of chlorinated solvents on the sorption of trichloroethylene to the roots of Typha latifolia. Environmental Pollution 157:1019-1023. Madejón, P., and N. W. Lepp. 2007. Arsenic in soils and plants of woodland regenerated on an arsenic-contaminated substrate: a sustainable natural remediation?. The Science of the Total Environment 379:256-262. Magistro, A. J., and J. A. Cowfer. 1986. Oxychlorination of ethylene. Journal of Chemical Education 63:1056. Mahuli, S., R. Agnihotri, S. Chauk, A. Ghosh-Dastidar, and L. S. Fan. 1997. Mechanism of arsenic sorption by hydrated lime. Environmental Science and Technology 31:3226-3231. Maidak, B. L., J. R. Cole, T. G. Lilburn, C. T. Jr. Parker, P. R. Saxman, R. J. Farris, G. M. Garrity, G. J. Olsen, T. M. Schmidt, and J. M. Tiedie. 2001. The RDP-II (Ribosomal Database Project). Nucleic Acids Research 29:173-174. Maier, R., and G. Soberon-Chavez. 2000. Pseudomonas aeruginosa rhamnolipids: Biosynthesis and potential applications. Applied Microbiology and Biotechnology 54:625-633. Maila, M. P., and T. E. Cloete. 2005. The use of biological activities to monitor the removal of fuel contaminants-perspective for monitoring hydrocarbon contamination: a review. International Biodeterioration and Biodegradation 55:1-8. Majumdar, P., S. Bandyopadhyay, and S. K. Bhattacharya. 1999. Effects of heavy metals on the biodegradation of organic compounds, p. 354-359. In: Applied Biotechnology for Site Remediation, R. E. Hinchee (ed.). Lewis Publishers, Boca Raton, FL. Makkar, R., and S. Cameotra. 1997. Biosurfactant production by a thermophilic Bacillus subtilis strain. Industrial Microbiology and Biotechnology 18:37-42.

139
Makker, R. S., and K. J. Rochne. 2003. Comparison of synthetic surfactants and biosurfactants in enhancing biodegradation of polycyclic aromatic hydrocarbons. Environmental Toxicology and Chemistry 22:2280-2292. Malakul, P., K. R. Srinivasan, and H. Y. Wang. 1998. Metal toxicity reduction in naphthalene biodegradation by use of metal chelating adsorbents. Applied and Environmental Microbiology 64:4610-4613. Malik, S., M. Beer, M. Megharaj, and R. Naidu. 2008. The use of molecular techniques to characterize the microbial communities in contaminated soil and water. Environment International 34:265-276. Maliszewska-Kordybach, B., and B. Smreczak. 2003. Habitat function of agricultural soils as affected by heavy metals and polycyclic aromatic hydrocarbons contamination. Environmental International 28:719-728. Mallikarjunan, M. M., and S. Z. Hussain. 1983. Oxychlorination of some lower hydrocarbons. Journal of Scientific and Industrial Research 42:209. Marchesi, J. R., T. Sato, A. J. Weightman, J. C. Fry, and S. J. Hiom. 1998. Design and evaluation of useful bacterial-specific PCR primers that amplify genes coding for bacterial 16s rRNA. Applied and Environmental Microbiology 64:795-799. Margesin, R., and F. Schinner. 2001. Bioremediation (natural attenuation and biostimulation) of diesel-oil-contaminated soil in an alpine glacier skiing area. Applied and Environmental Microbiology 67:3127-3133. Margesin, R., A. Zimmerbauer, and F. Schinner. 2000. Monitoring of bioremediation by soil biological activities. Chemosphere 40:339-346. Marin, A. R., S. R. Pezeshki, P. H. Masscheleyn, and H. S. Choi. 1993. Effect of dimethylarsenic acid (DMAA) on growth, tissue arsenic, and photosynthesis of rice plants. Journal of Plant Nutrition 16:865-880. Martínez, C. E., and H. L. Motto. 2000. Solubility of lead, zinc and copper added to mineral soils. Environment Pollution 107:153-158. Martínez, R. J., Y. Wang, M. A. Raimondo, J. M. Coombs, T. Barkay, and P. A. Sobecky. 2006. Horizontal gene transfer of PIB-Type ATPases isolated from radionuclide- and metal-contaminated subsurface soils. Applied and Environmental Microbiology 72:3111-3318. Marzorati, M., S. Borin, L. Brusetti, D. Daffonchio, C. Marsilli, G. Carpani, and F. de Ferra. 2005. Response of 1,2-dichloroethane-adapted microbial communities to ex-situ biostimulation of polluted groundwater. Biodegradation 17:41-56.

140
Marzorati, M., F. de Ferra, H. Van Raemdonck, S. Borin, E. Allifranchini, G. Carpani, L. Serbolisca, W. Verstraete, N. Boon, and D. Daffonchio. 2007. A novel reductive dehalogenase, identified in a contaminated groundwater enrichment culture and in Desulfitobacterium dichloroeliminans strain DCA1, is linked to dehalogenation of 1,2-dichloroethane. Applied and Environmental Microbiology 73:2990-2999. Mash, H. E., Y. P. Chin, L. Sigg, R. Hari, and H. B. Xue. 2003. Complexation of copper by zwitterionic aminosulfonic (good) buffers. Analytical Chemistry 75:671-677. Mathew, M., and J. P.Obbard. 2001. Optimisation of the dehydrogenase assay for measurement of indigenous microbial activity in beach sediments contaminated with petroleum. Biotechnology 23:227-230. Maymo-Gatell, X., T. Anguish, and S. H. Zinder. 1999. Reductive dechlorination of chlorinated ethenes and 1,2-dichloroethane by ‘Dehalococcoides ethenogenes’ 195. Applied and Environmental Microbiology 65:3108-3113. McBride, M. B. 1980. Chemisorption of Cd2+ on calcite surfaces. Soil Science Society of America Journal 44:26-28. McCaig, A. E., L. A. Glover, and J. I. Prosser. 1999. Molecular analysis of bacterial community structure and diversity in unimproved and improved upland grass pastures. Applied and Environmental Microbiology 65:1721-1730. McCarty, P. L., and L. Semprini. 1994. Groundwater treatment for chlorinated solvents, p. 87-116. In: Handbook of Bioremediation, R. D. Norris (ed.). Lewis Publishers, Boca Raton, FL. McEntee, J. D., J. R. Woodrow, and A. V. Quirk. 1986. Investigation of cadmium resistance in Alcaligenes sp. Applied and Environmental Microbiology 51:515-520. McGowen, S. L., N. T. Basta, and G. O. Brown. 2001. Use of diammonium phosphate to reduce heavy metal solubility and transport in smelter-contaminated soil. Journal of Environmental Quality 30:493-500. McGrath, S. P., P. F. Brookes, and K. E. Giller. 1988. Effects of potentially toxic metals in soil derived from past applications of sewage sludge on nitrogen fixation by Trifolium repens L. Soil Biology and Biochemistry 20:415-424. McLean J. E., and B. E. Bledsoe. 1992. Behaviour of metals in soils. Technical research document, EPA/540/S-92018, Office of Research and Development, U. S. Environmental Protection Agency. Environmental Research Laboratory. Ada, Oklahoma, USA. Meers, E., G. Du Laing, V. Unamuno, A. Ruttens, J. Vangronsveld, F. M. G. Tack, and M. G. Verloo. 2007. Comparison of cadmium extractability from soils by commonly used single extraction protocols. Geoderma 141:247-259.

141
Mench, M. J., A. Manceau, J. Vangronsveld, H. Clijsters, and B. Mocquot. 2000. Capacity of soil amendments in lowering the phytoavailability of sludge-borne zinc. Agronomie 20:383-397. Menendez-Vega, D., J. L. R. Gallego, A. I. Pelaez, G. Fernandez de Cordoba, J. Moreno, D. Munoz, and J. Sanchez. 2007. Engineered in situ bioremediation of soil and groundwater polluted with weathered hydrocarbons. European Journal of Soil Biology 43:310-321. Meng, X., S. Bang, and G. P. Korfiatis. 2000. Effects of silicate, sulfate, and carbonate on arsenic removal by ferric chlorite. Water Research 34:1255-1261. Mercier, L., and C. Detellier. 1995. Preparation, characterization, and applications as heavy metals sorbents of covalently grafted thiol functionalities on the interlamellar surface of montmorillonite. Environmental Science and Technology 29:1318-1323. Mergeay, M. 1991. Towards an understanding of the genetics of bacterial metal resistance. Trends in Biotechnology 9:17-24. Mette, H. N., and B. R. Neils. 2002. Denaturing gradient gel electrophoresis (DGGE) approaches to study the diversity of ammonia-oxidizing bacteria. Journal of Microbiological Methods 50:189-203. Miller, R. M. 1995. Biosurfactant facilitated remediation of contaminated soil. Environmental Health Perspective 103:59-62. Miller, K. M., T. J. Ming, A. D. Schulze, and R. E. Withler. 1999. Denaturing Gradient Gel Electrophoresis (DGGE): a rapid and sensitive technique to screen nucleotide sequence variation in populations. BioTechniques 27:1016-1030. Misra, T. K. 1992. Bacterial resistance to inorganic mercury salts and organomercurials. Plasmid 27:4-16. Mitchell, P., and D. Barr. 1995. The nature and significance of public exposure to arsenic: a review of its relevance to South West England. Environmental Geochemistry and Health 17:57-82. Moeseneder, M. M., J. M. Arrieta, G. Muyzer, C. Winter, and G. J. Herndl. 1999. Optimization of terminal-restriction fragment length polymorphism analysis for complex marine bacterioplankton communities and comparison with denaturing gradient gel electrophoresis. Applied and Environmental Microbiology 65:3518-3525. Montinaro, S., A. Concas, M. Pisu, and G. Cao. 2008. Immobilization of heavy metals in contaminated soils through ball milling with and without additives. Chemical Engineering Journal 142:271-284. Morby, A. P., J. S. Turner, J. W. Huckle, and N. J. Robinson. 1993. SmtB is a metal-dependent repressor of the cyanobacterial metallothionein gene smtA: identification of a Zn inhibited DNA-protein complex. Nucleic Acids Research 21:921-925.

142
Moreno, J. L., C. Garcia, L. Landi, L. Falchini, G. Pietramellara, and P. Nannipieri. 2001. The ecological dose value (ED50) for assessing Cd toxicity on ATP content and DHA and urease activities of soil. Soil Biology and Biochemistry 33:483-489. Morris, S. A., S. Radajewski, T. W. Willison, and J. C. Murrell. 2002. Identification of the functionally active methanotroph population in a peat soil microcosm by stable-isotope probing. Applied and Environmental Microbiology 68:1446-1453. Morrison, G. M., G. E. Batley, and T. M. Florence. 1989. Metal speciation and toxicity. Chemistry in Britain 8:791-795. Mosher, J. J., B. S. Levison, and G. G. Johnston. 2003. A simplified dehydrogenase enzyme assay in contaminated sediment using 2-(p-iodophenyl)-3(p-nitrophenyl)-5-phenyl tetrazolium chloride. Journal of Microbiological Methods 53:411-415. Mueller, J. G., S. M. Resnick, M. E. Shelton, and P. H. Pritchard. 1992. Effect of inoculation on the biodegradation of weathered Prudhoe Bay crude oil. Journal of Industrial Microbiology 10:95-102. Mulligan, C. N. 2005. Environmental applications for biosurfactants. Environmental Pollution 133:183-198. Mulligan, C. N., R. N. Yong, and B. F. Gibbs. 1999. On the use of biosurfactants for the removal of heavy metals from oil contaminated soil. Environment Programme 18:31-35. Mulligan, C. N., R. N. Yong, and B. F. Gibbs. 2001a. Surfactant-enhanced remediation of contaminated soil: a review. Engineering Geology 60:371-380. Mulligan, C. N., R. N. Yong, and B. F. Gibbs. 2001b. Remediation technologies for metal-contaminated soils and groundwater: an evaluation. Engineering Geology 60:193-207. Murray, A. E., J. T. Hollibaugh, and C. Orrego. 1996. Phylogenetic compositions of bacterioplankton from two California estuaries compared by denaturing gradient gel electrophoresis of 16S rDNA fragments. Applied and Environmental Microbiology 62:2676-2680. Muyzer, G. 1999. DGGE/TGGE a method for identifying genes from natural ecosystems. Current Opinion in Microbiology 2:317-322. Muyzer, G., T. Brinkhoff, U. Nübel, C. Santegoeds, H. Schäfer, and C. Wawer. 1997. Denaturing gradient gel electrophoresis (DGGE) in microbial ecology, p. 1-27. In: Molecular Microbial Ecology Manual, A. D. L. Akkermans, J. D. van Elsas, and F. J. deBruijn (eds.). Kluwer Academic Publishers, Dordrecht, The Netherlands.

143
Muyzer, G., and E. C. de Waal. 1994. Determination of the genetic diversity of microbial communities using DGGE analysis of PCR amplified 16S rRNA. NATO Advanced Science Institutes Series G 35:207-214. Muyzer, G., E. C. de Waal, and A. G. Uitterlinden. 1993. Profiling of complex microbial communities by denaturing gradient gel electrophoresis analysis of polymerase chain reaction-amplified genes coding for 16S rRNA. Applied and Environmental Microbiology 59:695-700. Muyzer, G., and K. Smalla. 1998. Application of denaturing gradient electrophoresis (DGGE) and temperature gradient gel electrophoresis (TGGE) in microbial ecology. Antonie Van Leeuwenhoek 73:127-141. Naidu, R., N. S. Bolan, R. S. Kookana, and K. G. Tiller. 1994. Ionic strength and pH effects on the adsorption of cadmium and the surface charge of soils. European Journal of Soil Science 45:419-429. Naidu, R., R. S. Kookana, M. E. Sumner, R. D. Harter, and K. G. Tiller. 1997. Cadmium sorption and transport in variable charge soils: a review. Journal of Environmental Quality. 26:602-607. Nakamura, Y., and T. Sawada. 2000. Biodegradation of phenol in the presence of heavy metals. Chemical Technology and Biotechnology 75:137-142. Nakatsu, C. H., N. Carmosini, B. Baldwin, F. Beasley, P. Kourtev, and A. Konopka. 2005. Soil microbial community responses to additions of organic carbon substrates and heavy metals (Pb and Cr). Applied and Environmental Microbiology 71:7679-7689. Nakatsu, C. H., V. Torsvik, and L. Øvreås. 2000. Soil community analysis using DGGE of 16S rDNA polymerase chain reaction products. Soil Science Society of America Journal 64:1382-1388. Nannipieri, P. 1994. The potential use of soil enzymes as indicators of productivity, sustainability and pollution, p. 238-244. In: Soil biota management in sustainable farming systems, C. E. Pankhurst, B. M. Double, V. V. S. R. Gupta, and P. R. Grace (eds.). Victoria, Australia: CSIRO, East Melbourne. Nannipieri, P., S. Greco, and B. Ceccanti. 1990. Ecological significance of the biological activity in soil, p. 233-355. In: Soil Biochemistry, G. Stotzky, and J. M. Bollag (eds.). Marcel Dekker Inc., NY. Naworski, J. S., and E. S. Velez. 1983. Oxychlorination of ethylene. Applied Industrial Catalysis 1:239. Neilson, J. W., and R. M. Maier. 2001. Biological techniques for measuring organic and metal contaminants in environmental samples p. 255-273. In: Humic Substances and Chemical Contaminants, C. E. Clapp, M. H. B. Hayes, N. Senesi, P. R. Bloom and P. M. Jardine (eds.). Soil Science Society of America, Madison, WI.
144
Neufeld, J. D, and W. W. Mohn. 2005. Fluorophore-labeled primers improve the sensitivity, versatility, and normalization of denaturing gradient gel electrophoresis. Applied and Environmental Microbiology 71:4893-4896. Newby, D. T., T. J. Gentry, and I. L. Pepper. 2000a. Comparison of 2,4-dichlorophenoxyacetic acid degradation and plasmid transfer in soil resulting from bioaugmentation with two different pJP4 donors. Applied and Environmetal Microbiology 66:3399-3407. Newby, D. T., K. L. Josephson, and I. L. Pepper. 2000b. Detection and characterization of plasmid pJP4 transfer to indigenous soil bacteria. Applied and Environmental Microbiology 66:290-296. Nicol, G. W., L. A. Glover, and J. I. Prosser. 2003. Spatial analysis of archaeal community structure in grassland soil. Applied and Environmental Microbiology 69:7420-7429. Nies, D. H. 1992. Resistance to cadmium, cobalt, zinc, and nickel in microbes. Plasmid 27:17-28. Nies, D. H. 1999. Microbial heavy metal resistance. Applied Microbiology and Biotechnology 51:730-750. Nies, D. H. 2003. Efflux-mediated heavy metal resistance in prokaryotes. FEMS Microbiology Reviews 27:313-339. Nies, D. H., and S. Silver. 1995. Ion efflux systems involved in bacterial metal resistances. Industrial Microbiology 14:186-199. Nobre, M. M. M, and R. C. M. Nobre. 1998. Remediation of a chlorinated organic contamination in a coastal lagoon region of Brazil. In: Proceedings of the First Conference on Remediation of Chlorinated and Recalcitrant Compounds, Battele Press, Monterey, CA. Nobre, R. C. M., and M. M. Nobre. 1999. Field evidence of 1,2-dichloroethane degradation, p. 400-408. In: Proceedings of the Fourth Brazilian Conference of Environmental Geotechnics, São José dos Campos, SP. Norena-Barroso, E., R. Sima-Alvarez, G. Gold-Bouchot, and O. Zapata-Perez. 2004. Persistent organic pollutants and histological lesions in Mayan catfish Ariopsis assimilis from the Bay of Chetumal. Marine Pollution Bulletin 48:263-269. Noriyuki, I., M. Sunairi, M. Urai, C. Itoh, H. Anzai, M. Nakajima, and S. Harayama. 2002. Extracellular polysaccharides of Rhodococcus rhodochrous S-2 stimulate the degradation of components in crude oil by indigenous marine bacteria. Applied and Environmental Microbiology 68:2337-2343. Norris, R. D. 1994. Handbook of bioremediation. CRC Press, Boca Raton, Florida.

145
NPI, National Pollutant Inventory. 2005. 1,2-Dichloroethane fact sheet. Australian Government. Department and Water Resources. NRC, National Research Council. 1994. Alternatives for groundwater cleanup. National Acedemy Press, Washington, DC. NRCS, Natural Resources Conservation Service. 2000. Heavy metal soil contamination. Soil quality institute, Auburn. United States Department of Agriculture. Urban technical note no. 3. Nubel, U., F. Garcia-Pichel, and G. Muyzer. 1997. PCR primers to amplify 16S rRNA genes from cyanobacteria. Applied and Environmental Microbiology 63:3327-3332. Obbard, J. P. 2001. Ecotoxicological assessment of heavy metals in sewage sludge amended soil. Applied Geochemistry 16:1405-1411. Obbard, J. P., and K. C. Jones. 1993. The effects of heavy metals on dinitrogen fixation by Rhizobium-white clover in a range of long-term sewage sludge amended and metal contaminated soils. Environmental Pollution 79:105-112. Oden, K. L., T. B. Gladysheva, and B. P. Rosen. 1994. Arsenate reduction mediated by the plasmid-encoded ArsC protein is coupled to glutathione. Molecular Microbiology 12:301-306. Ogino, A., H. Koshikawa, T. Nakahara, and H. Uchiyama. 2001. Succession of microbial communities during a biostimulation process as evaluated by DGGE and clone library analyses. Journal of Applied Microbiology 91:625-635. Ogundele, M. O. 1999. Cytotoxicity of EDTA used in biological samples: effect on some human breast-milk studies. Applied Toxicology 13:395-400. O'Halloran, T. 1993. Transition metals in control of gene expression. Science 261:715-725. Olafson, R. W., K. Abel, and R. S. Sim. 1979. Prokaryotic metallothionein: preliminary characterization of a blue-green algae heavy-metal binding protein. Biochemical and Biophysical Research Communications 89:36-43. Olaniran, A. O., A. Balgobind, and B. Pillay. 2009. Impacts of heavy metals on 1,2-dichloroethane biodegradation in co-contaminated soil. Journal of Environmental Sciences 21:661-666. Olaniran, A. O., D. Pillay, and B. Pillay. 2006. Biostimulation and bioaugmentation enhances aerobic biodegradation of dichloroethenes. Chemosphere 63:600-608. Olaniran, A. O., W. H. L. Stafford, D. A. Cowan, D. Pillay, and B. Pillay. 2007. Microbial community profiling in cis- and trans-dichloroethane enrichment systems using denaturing gradient gel electrophoresis. Journal of Microbiology and Biotechnology 17:560-570.
146
Olasupo, N. A., M. B. Scott-Emuakpor, and R. A. Ogunshola. 1993. Resistance to heavy metals by some Nigerian yeast strain. Folia Microbiologica 38:285-287. Osborn, A. M., K. D. Bruce, P. Strike, and D. A. Richie. 1997. Distribution, diversity and evolution of the bacterial mercury resistance (mer) operon. FEMS Microbiology Reviews 19:239-262. Panuccio, M. R., A. Sorgonà, M. Rizzo, and G. Cacco. 2009. Cadmium adsorption on vermiculite, zeolite and pumice: Batch experiment studies. Environmental Management 90:364-374. Pardue, J. H., S. Kongara, and W. J. Jones. 1996. Effect of cadmium on reductive dechlorination of trichloroaniline. Environmental Toxicology and Chemistry 15:1083-1088. Park, Y. J., J. J. Ko, S. L. Yun, E. Y. Lee, S. J. Kim, S. W. Kang, B. C. Lee, and S. K. Kim. 2008. Enhancement of bioremediation by Ralstonia sp. HM-1in sediment polluted by Cd and Zn. Bioresource Technology 99:7458-7463. Paton, G. I., C. D. Campbell, L. A. Glover, and K. Killham. 1995. Assessment of bioavailability of heavy metals using lux modified constructs Pseudomonas fluorescens. Letters in Applied Microbiology 20:52-56. Peijnenburg, W. J. G. M., and T. Jager. 2003. Monitoring approaches to assess bioaccessibility and bioavailability of metals: Matrix issues. Ecotoxicology and Environmental Safety 56:63-77. Pepi, M., M. Volterrani, M. Renzi, M. Marvasi, S. Gasperini, E. Franchi, and S. E. Focardi. 2007. Arsenic-resistant bacteria isolated from contaminated sediments of the Orbetello Lagoon, Italy, and their characterization. Journal of Applied Microbiology 103:2299-2308. Pepper, I. L., T. J. Gentry, D. T. Newby, T. M. Roane, and K. L. Josephson. 2002. The role of cell bioaugmentation and gene bioaugmentation in the remediation of co-contaminated soils. Environmental Health Perspectives 110:943-946. Peryea, F. J. 1998. Phosphate starter fertilizer temporarily enhances soil arsenic uptake by apple trees grown under field conditions. Hortscience 33:826-829. Petanen, T., and M. Romantschuk. 2002. Use of bioluminescent bacterial sensors as an alternative method for measuring heavy metals in soil extracts. Analytica Chimica Acta 456:55-61. Philips, D. J. H. 1993. ‘Bioaccumulation’. In: Handbook on Ecotoxicology, P. Calow (ed.). Blackwell Scientific Publications, London. Pickering, W. F. 1983. Extraction of copper, lead, zinc and cadmium ions sorbed on calcium carbonate. Water, Air and Soil Pollution 20:299-309.

147
Porter, S. K., K. G. Scheckel, C. A. Impellitteri, and J. A. Ryan. 2004. Toxic metals in the environment: thermodynamic considerations for possible immobilization strategies for Pb, Cd, As, and Hg. Critical Reviews in Environmental Science and Technology 34:495-604. Qafoku, N. P., U. Kukier, M. E. Sumner, W. P. Miller, and D. E. Radcliffe. 1999. Arsenate displacement from fly ash in amended soils. Water Air and Soil Pollution 114:185-198. Qian, H., L. Sahlman, P. O. Eriksson, C. Hambraeus, U. Edlund, and I. Sethson. 1998. NMR solution structure of the oxidized form of MerP, a mercuric ion binding protein involved in bacterial mercuric ion resistance. Biochemistry 37:9316-9322. Rajapaksha, R. M. C. P., M. A. Tobor-Kaplon, and E. Bååth. 2004. Metal toxicity affects fungal and bacterial activities in soil differently. Applied and Environmental Microbiology 70:2966-2973. Rasmussen, L. D., S. J. Sorensen, R. R. Turner, and T. Barkay. 2000. Application of a mer-lux biosensor for estimating bioavailable mercury in soil. Soil Biology and Biochemistry 32:639-646. Ren, S., R. W. Mee, and P. D. Frymier. 2004. Using factorial experiments to study the toxicity of metal mixtures. Ecotoxicology and Environmental Safety 59:38-43. Rensing, C., M. Ghosh, and B. Rosen. 1999. Families of soft-metal-ion-transporting ATPases. Journal of Bacteriology 181:5891-5897. Rensing, C., and R. M. Maier. 2003. Issues underlying use of biosensors to measure metal bioavailability. Ecotoxicology and Environmental Safety 56:140-147. Rensing C, Y. Sun, B. Mitra, and B. P. Rosen. 1998. Pb(II)-translocating P-type ATPases. Journal of Biological Chemistry 273:32614-32617. Riis, V., W. Babel, and O. H. Pucci. 2002. Influence of heavy metals on the microbial degradation of diesel fuel. Chemosphere 49:559-568. Roane, T. M., K. L. Josephson, and I. L. Pepper. 2001. Dual-bioaugmentation strategy to enhance remediation of co-contaminated soil. Applied and Environmental Microbiolgy 67:3208-3215. Roane, T. M., and I. L. Pepper. 1997. Microbial remediation of soils co-contaminated with 2,4-dichlorophenoxy acetic acid and cadmium, p. 343-356. In: 12th Annual Conference on Hazardous Waste Research Building Partnerships for Innovative Technologies, Kansas City, Missouri. KS: Great PLains/Rocky Mountain Hazardous Substance Research Center, Manhattan. Roberts, D. J., N. Venkataraman, and S. Pendharkar. 1998. The effect of metals on biological remediation of munitions-contaminated soil. Environmental Engineering Science 15:265-277.

148
Rodriguez-Mozaz, S., M. P. Marco, M. J. Lopez de Alda, and D. Barceló. 2004. Biosensors for environmental applications: Future development trends. Pure Applied Chemistry 76:723-752. Romantschuk, M., I. Sarand, T. Petanen, R. Peltola, M. Jonsson-Vihanne, T. Koivula, K. Yrjala, and K. Haahtela. 2000. Means to improve the effect of in situ bioremediation of contaminated soil: an overview of novel approaches. Environmental Pollution 107:179-185. Ros, M., M. Goberna, J. A. Pascual, S. Klammer, and H. Insam. 2008. 16S rDNA analysis reveals low microbial diversity in community level physiological profile assays. Journal of Microbiological Methods 72:221-226. Rosen, B. P. 1996. Bacterial resistance to heavy metals and metalloids. Biological Inorganic Chemistry 1:273-277. Rosenstein, R., A. Peschel, B. Wieland, and F. Gotz. 1992. Expression and regulation of the antimonite, arsenite, and arsenate resistance operon of Staphylococcus xylosus plasmid pSX267. Journal of Bacteriology 174:3676-3683. Rossel, D., J. Tarradellas, G. Bitton, and J. L. Morel. 1997. Use of enzymes in ecotoxicology: a case for dehydrogenase and hydrolytic enzymes, p. 179-192. In: Soil Ecotoxicology, J. Tarradellas, G. Bitton, and D. Rossel (eds.). CRC Lewis Publishers, Boca Raton. Rossello-Mora, R., and R. Amann. 2001. The species concept for prokaryotes. FEMS Microbiology Reviews 25:39-67. Rouch, D. A., B. D. T. Lee, and A. P. Morby. 1995. Understanding cellular responses to toxic agents: A model for mechanism choice in bacterial metal resistance. Industrial Microbiology 14:132-141. Rowland, H. A. L., D. A. Polya, J. R. Lloyd, and R. D. Pancost. 2006. Characterisation of organic matter in a shallow, reducing, arsenic-rich aquifer, West Bengal. Organic Geochemistry 37:1101-1114. Roy, S., P. Bhattacharyya, and A. K. Ghosh. 2004. Influence of toxic heavy metals on activity of acid and alkaline phosphatase enzymes in metal contaminated landfill soils. Australian Journal of Soil Research 42:339-344. Ruby, M. V., A. Davis, and A. Nicholson. 1994. In situ formation of lead phosphates in soils as a method to immobilize lead. Environmental Science and Technology 28:646-654. Rudd, T., R. M. Sterritt, and J. N. Lester. 1983. Mass balance of heavy metal uptake by encapsulated cultures of Klebsiella aerogenes. Microbial Ecology 9:261-272. Ruppel, S., V. Torsvik, F. L. Daae, L. Øvreås, and J. Ruhlmann. 2007. Nitrogen availability decreases prokaryotic diversity in sandy soils. Biology and Fertility of Soils 43:449-459.
149
Sahlman, L., W. Wong, and J. Powlowski. 1997. A mercuric ion uptake role for the integral inner membrane protein, MerC, involved in bacterial mercuric ion resistance. Journal of Biological Chemistry 272:29518-29526. Said, W. A., and D. L. Lewis. 1991. Quantitative assessment of the effects of metals on microbial degradation of organic chemicals. Applied and Environmental Microbiology 57:1498-1503. Saier Jr., M. H., R. Tam, A. Reizer, and J. Reizer. 1994. Two novel families of bacterial membrane proteins concerned with nodulation, cell division and transport. Molecular Microbiology 11:841-847. Salanitro, J. P., H. L. Wisniewski, D. L. Byers, C. C. Neaville, and R. A. Schroder. 1997. Use of aerobic and anaerobic microcosms to assess BTEX biodegradation in aquifers. Ground Water Monitoring and Remediation 17:210-221. Sandrin, T. R., A. M. Chech, and R. M. Maier. 2000. A rhamnolipid biosurfactant reduces cadmium toxicity during biodegradation of naphthalene. Applied and Environmental Microbiology 66:4585-4588. Sandrin, T. R., and D. R. Hoffman. 2007. Bioremediation of organic and metal co-contaminated environments: Effects of metal toxicity, speciation, and bioavailability on biodegradation, p. 1-34. Environmental Bioremediation Techniologies. Sandrin, T. R., and R. M. Maier. 2003. Impact of metals on the biodegradation of organic pollutants. Environmental Health Perspectives 111:1093-1101. Sarkar, D., M. E. Essington, and K. C. Misra. 2002. Adsorption of mercury (II) by kaolinite. Soil Science Society of America Journal 64:1968-1975. Sarret, G., L. Avoscan, M. Carriere, R. Collins, N. Geoffroy, F. Carrot, J. Coves, and B. Gouget. 2005. Chemical forms of selenium in the metal-resistant bacterium Ralstonia metallidurans CH34 exposed to selenite and selenate. Applied and Environmental Microbiology 71:2331-2337. Sauve, S., W. Hendershot, and H. E. Allen. 2000. Solid-solution partitioning of metals in contaminated soils: dependence on pH, total metal burden, and organic matter. Environmental Science and Technology 34:1125-1131. Schiering, N., W. Kabsch, M. J. Moore, M. D. Distefano, C. T. Walsh, and E. F. Pai. 1991. Structure of the detoxification catalyst mercuric ion reductase from Bacillus sp. strain RC607. Nature 352:168-172. Schindler, P. W., B. Fürst, R. Dick, and P. U. Wolf. 1976. Ligand properties of surface silanol groups. I. Surface complex formation with Fe3+, Cu2+, Cd2+ and Pb2+. Colloid and Interface Science 55:469-475. Schloter, M., O. Dilly, and J. C. Munch. 2003. Indicators for evaluating soil quality. Agriculture, Ecosystems and Environment 98:255-262.

150
Schnoor, J. L., L. A. Licht, S. C. McCutcheon, N. L. Wolfe, and L. H. Carreira. 1995. Phytoremediation of organic and nutrient contaminants. Environmental Science and Technology 29:318A-323A. Scott, J. A., and S. J. Palmer. 1988. Cadmium bio-sorption by bacterial exopolysaccharide. Biotechnology Letters 10:21-24. Scott, J. A., and S. J. Palmer. 1990. Sites of cadmium uptake in bacteria used for biosorption. Applied and Environmental Microbiology 33:221-225. Scott, J. A., G. K. Sage, and S. J. Palmer. 1988. Metal immobilization by microbial capsular coatings. Biorecovery 1:51-58. Sekiguchi, H., M. Watanabe, T. Nakahara, B. Xu, and H. Uchiyama. 2002. Succession of bacterial community structure along the Changjiang River determined by denaturing gradient gel electrophoresis and clone library analysis. Applied and Environmental Microbiology 68:5142-5150. Selifonova, O., R. Burlage, and T. Barkay. 1993. Bioluminescent sensors for detection of bioavailable Hg (II) in the environment. Applied and Environmental Microbiology 59:3083-3090. Semple, K. T., K. J. Doick, K. C. Jones, P. Burauel, A. Craven, and H. Harms. 2004. Defining bioavailability and bioaccessibility of contaminated soil and sediment is complicated. Environmental Science and Technology 38:228A-231A. Semple, K. T., W. W. J. Morriss, and G. I. Paton. 2003. Bioavailability of hydrophobic organic contaminants in soils: fundamental concepts and techniques for analysis. European Journal of Soil Science 54:809-818. Sheffield, V. C., D. R. Cox, L. S. Lerman, and R. M. Myers. 1989. Attachment of a 40-base-pair G + C-rich sequence (GC-clamp) to genomic DNA fragments by the polymerase chain reaction results in improved detection of single-base changes. Proceedings of the National Academy of Sciences, USA 86:232-236. Shen, G., Y. Lu, and J. Hong. 2006. Combined effect of heavy metals and polycyclic aromatic hydrocarbons on urease activity in soil. Ecotoxicology and Environmental Safety 63:474-480. Shen, G. Q., Y. T. Lu, Q. X. Zhou, and J. B. Hong. 2005. Interaction of polycyclic aromatic hydrocarbons and heavy metals on soil enzymes. Chemosphere 61:1175-1182. Shi, W., J. Becker, M. Bischoff, R. F. Turco, and A. E. Konopka. 2002. Association of microbial community composition and activity with lead, chromium, and hydrocarbon contamination. Applied and Environmental Microbiology 68:3859-3866.

151
Shi, W., M. Bischoff, R. Turco, and A. Konopka. 2005. Microbial catabolic diversity in soils contaminated with hydrocarbons and heavy metals. Environmental Science and Technology 39:1974-1979. Shuman, L. M., S. Dudka, and K. Das. 2002. Cadmium forms and plant availability in compost-amended soil. Communities in Soil Science and Plant Analysis 33:737-748. Siddiqui, S., and W. A. Adams. 2001. The fate of diesel hydrocarbons in soils and their effect on the germination of perennial ryegrass. Environmental Toxicology 53:1479-1483. Signes-Pastor, A., F. Burlo, K. Mitra, and A. A. Carbonell-Barrachina. 2007. Arsenic biogeochemistry as affected by phosphorus fertilizer addition, redox potential and pH in a West Bengal (India) soil. Geoderma 137:504-510. Silver, S. 1996. Bacterial resistance to toxic metal ions-a review. Gene 179:9-19. Silver, S., and L. T. Phung. 1996. Bacterial heavy metal resistance: new surprises. Annual Reviews in Microbiology 50:753-789. Silver, S., and M. Walderhaug. 1992. Gene regulation and chromosome determined inorganic ion transport in bacteria. Microbiological Reviews 56:195-228. Singh, O. V., and R. K. Jain. 2003. Phytoremediation of toxic aromatic pollutants from soil. Applied Microbiology and Biotechnology 63:128-135. Singh, S., S. H. Kang, A. Mulchandani, and W. Chen. 2008. Bioremediation: environmental clean-up through pathway engineering. Current Opinion in Biotechnology 19:437-444. Singh, N., M. Megharaj, R. S. Kookana, R. Naidu, and N. Sethunathan. 2004. Atrazine and simazine degradation in Pennisetum rhizosphere. Chemosphere 56:257-263. Slotnick, M. J., J. R. Meliker, and J. O. Nriagu. 2006. Effects of time and point-of-use devices on arsenic levels in Southeastern Michigan drinking water, USA. The Science of the Total Environment 369:42-50. Smets, B. F., and P. H. Pritchard. 2003. Elucidating the microbial component of natural attenuation. Current Opinion in Biotechnology 14:283-288. Smith, K., and R. P. Novick. 1972. Genetic studies on plasmid-linked cadmium resistance in Staphylococcus aureus. Journal of Bacteriology 112:761-772. Soares, H. M. V. M., and P. C. F. L Conde. 2000. Electrochemical investigations of the effect of N-substituted aminosulfonic acids with a piperazinic ring pH buffers on heavy metal processes which may have implications on speciation studies. Analytica Chimica Acta 421:103-111.

152
Sokhn, J., F. A. A. M. De Leij, T. D. Hart, and J. M. Lynch. 2001. Effect of copper on the degradation of phenanthrene by soil microorganisms. Letters in Applied Microbiology 33:164-168. Song, H. G., and R. Bartha. 1990. Effects of jet fuel on the microbial community of soil. Applied and Environmental Microbiology 56:646-651. Song, J. S., D. H. Lee, K. Lee, and C. K. Kim. 2004. Genetic organization of the dhlA gene encoding 1,2-dichloroethane dechlorinase from Xanthobacter flavus UE15. The Journal of Microbiology 42:188-193. Song, J., F. J. Zhao, F. P. McGrath, and Y. M. Luo. 2006. Influence of soil properties and aging on arsenic phytotoxicity. Environmental Toxicology and Chemistry 25:1663-1670. Sousa, S., C. Duffy, H. Weitz, L. A. Glover, E. Bär, R. Henkler, and K. Killham. 1998. Use of a lux-modified bacterial biosensor to identify constraints to bioremediation of BTEX-contaminated soils. Environmental Toxicology Chemistry 17:1039-1045. Spencer, O. F., and L. H. Nichols.1983. Free nickel inhibits growth of two species of green algae. Environmental Pollution Control Services 31:97-104. Springael, D., L. Oiels, L. Hooyberghs, S. Krepsk, and M. Mergeay. 1993. Construction and characterization of heavy metal resistant haloaromatic degrading Alcaligenes eutrophus strains. Applied and Environmental Microbiology 59:334-339. Squillace, P. J., M. J. Moran, W. W. Lapham, C. V. Price, R. M. Clawges, and J. S. Zogorski. 1999. Volatile organic compounds in untreated ambient groundwater of the United States. Environmental Science and Technology 33:4176-4187. Stadtmann, E. R. 1993. Oxidation of free amino acids and amino acid residues in proteins by radiolysis and by metal-catalyzed reactions. Annual Review of Biochemistry 62:797-821. Stephen, J. R., Y. J. Chang, Y. D. Gan, A. Peacock, S. M. Pfiffner, M. J. Barcelona, D. C.White, and S. J. McNaughton. 1999. Microbial characterisation of a JP-4 fuel-contaminated site using a combined lipid biomarker/polymerase chain reaction-denaturing gradient gel electrophoresis (PCR-DGGE)-based approach. Environmental Microbiology 1:231-241. Stephen, J. R., Y.J. Chang, S. J. Macnaughton, G. A. Kowalchuk, K. T. Leung, C. A. Flemming, and D. C. White. 1998. Effect of toxic metals on indigenous soil -subgroup proteobacterium ammonia oxidizer community structure and protection against toxicity by inoculated metal-resistant bacteria. Applied and Environmental Microbiology 65:95-101. Sterritt, R. M., and J. N. Lester. 1980. Interactions of heavy metals with bacteria. Science of the Total Environment 14:5-17.

153
Stohs, S. J., and D. Bagchi. 1995. Oxidative mechanisms in the toxicity of metal ions. Free Radical Biology and Medicine 18:321-336. Streger, S. H., S. Vainberg, H. Dong, and P. B. Hartzinger. 2002. Enhancing transport of Hydrogenophaga flava ENV735 for bioaugmentation of aquifers contaminated with methyl tert-butyl ether. Applied and Environmental Microbiology 68:5571-5579. Stucki, G., W. Brunner, D. Staub, and T. Leisinger. 1987. Microbial degradation of chlorinated C1 and C2 hydrocarbons, p. 133-137. In: Microbial Degradation of Xenobiotics and Recalcitrant Compounds, T. Leisinger, A. M. Cook, J. Neusch, R. Hickes (eds.). Academic Press, NY. Stucki, G., U. Krebser, and T. Leisinger. 1983. Bacterial growth on 1,2-dichloroethane. Experentia 39: 1271-1273. Stucki, G., and T. Leisinger. 1983. Bacterial degradation of 2-chloroethanol proceeds via 2-chloroacetic acid. FEMS Microbiology Letters 16:123-126. Stucki, G., and M. Thuer. 1995. Experiences of a large-scale application of 1,2-dichloroethane degrading microorganisms for groundwater treatment. Environmental Science and Technology 29:2339-2345. Suhadolc, M., R. Schroll, A. Gattinger, M. Schloter, J. C. Munch, and D. Lestan. 2004. Effects of modified Pb-, Zn-, and Cd- availability on the microbial communities and on the degradation of isoproturon in a heavy metal contaminated soil. Soil Biology and Biochemistry 36:1943-1954. Sun, R. L., B. Q. Zhao, L. S. Zhu, J. Xu, and F. D. Zhang. 2003. Effects of long term fertilization on soil enzyme activities and its role in adjusting controlling soil fertility. Plant Nutrition and Fertilizer Science 9:406-410. Sunda, W., and R. R. C. Guillard. 1976. The relationship between cupric ion activity and the toxicity of copper to phytoplankton. Marine Research 34:511-529. Susarla, S., V. F. Medina, and S. C. McCutcheon. 2002. Phytoremediation: an ecological solution to organic chemical contamination. Ecological Engineering 18:647-658. Sutherson, S. S. 1997. Remediation engineering: Design concepts. Lewis Publishers. Száková, J., P. Tlustoš, W. Goessler, Z. Frková, and J. Najmanová. 2009. Mobility of arsenic and its compounds in soil and soil solution: The effect of soil pretreatment and extraction methods. Journal of Hazardous Materials 172:1244-1251. Tack, F. M., and M. G. Verloo. 1995. Chemical speciation and fractionation in soil and sediment heavy metal analysis: a review. International Journal of Environmental Analytical Chemistry 59:225-238.

154
Tan, H., J. T. Champion, J. F. Artiola, M. L. Brusseau, and R. M. Miller. 1994. Complexation of cadmium by a rhamnolipid biosurfactant. Environmental Science and Technology 28:2402-2406. Tang, X. Y., Y. G. Zhu, Y. S. Cui, J. Duan, and L. L. Tang. 2006. The effect of ageing on the bioaccessibility and fractionation of cadmium in some typical soils of China. Environmental International 32:682-689. Tardiff, G., C. W. Greer, D. Labbé, and P. C. K. Lau. 1991. Involvement of a large plasmid in the degradation of 1,2-dichloroethane by Xanthobacter autotrophicus GJ10. Applied and Environmental Microbiology 57:1853-1857. Taylor, J. P., B. Wilson, M. S. Mills, and R. G. Burns. 2002. Comparison of microbial numbers and enzymatic activities in surface soils and subsoils using various techniques. Soil Biology and Biochemistry 34:387-401. Tekchand, and N. K. Tomar. 1994. Correlation of the soil properties with phosphate fixation in some alkaline-calcareous soils of North-West Asia. Arid Soil Research and Rehabilitation 37:77-91. Temmerman, R., I. Scheirlinck, G. Huys, and J. Swings. 2003. Culture-independent analysis of probiotic products by denaturing gradient gel electrophoresis. Applied and Environmental Microbiology 69:220-226. Teresa, M., S .D. Vasconcelos, C. M. R. Almeida, O. M. Lage, and F. Sansonetty. 2000. Influence of zwitterionic pH buffers on the bioavailability and toxicity of copper to the alga Amphidinium carterae. Environmental Toxicology and Chemistry 19:2542-2550. Teske, A., C. Wawer, G. Muyzer, and N. B. Ramsing. 1996. Distribution of sulphate-reducing bacteria in a stratified fjord (Mariager fjord, Denmark) as evaluated by most-probable-number counts and denaturing gradient gel electrophoresis of PCR-amplified ribosomal DNA fragments. Applied and Environmental Microbiology 62:1405-1415. Thakur, S. K., N. K. Tomar, and S. B. Pandeya. 2006. Influence of phosphate on cadmium sorption by calcium carbonate. Geoderma 130:240-249. Timmis, K. N., and D. H. Pieper. 1999. Bacteria designed for bioremediation. Trends in Biotechnology 17:201-204. Tomioka, N. A., H. Uchiyama, and O. Yagi. 1994. Cesium accumulation and growth characteristics of Rhodoccus erythropolis CS98 and Rhodoccus sp. strain CS402. Applied and Environmental Microbiology 60:2227-2231. Tom-Petersen, A., H. C. B. Hansen, and O. Nybroe. 2004. Time and moisture effects on total and bioavailable copper in soil water extracts. Environmental Quality 33:505-512.

155
Tong, L., S. Nakashima, M. Shibasaka, M. Katsuhara, and K. Kasamo. 2002. Novel histidine-rich CPx-ATPase from the filamentous cyanobacterium Oscillatoria brevis related to multiple-heavy-metal cotolerance. Journal of Bacteriology 184:5027-5035. Top, E. M., D. Springael, and N. Boon. 2002. Catabolic mobile genetic elements and their potential use in bioaugmentation of polluted soils and waters. FEMS MicrobiologyEcology 42:199-208. Top, E. M., P. Van Daele, N. De Saeyer, and L. J. Forney. 1998. Enhancement of 2,4-dichlorophenoxyacetic acid (2,4-D) degradation in soil by dissemination of catabolic plasmids, Antonie Van Leeuwenhoek 73:87-94. Topcuoğlu, S., C. Kırbasoğlu, and N. Güngör. 2002. Heavy metals in organisms and sediments from Turkish Coast of the Black Sea, 1997-1998. Environment International 27:521-526. Torrens, J. L., D. C. Herman, and R. M. Miller-Maier. 1998. Biosurfactant (rhamnolipid) sorption and the impact on rhamnolipid-facilitated removal of cadmium from various soils under saturated flow conditions. Environmental Science and Technology 32:776-781. Torsvik, V., F. L. Daae, R. A. Sandaa, and L. Øvreås. 1998. Novel techniques for analysing microbial diversity in natural and perturbed environments. Journal of Biotechnology 64:53-62. Traina, S. J., and V. Laperche. 1999. Contaminant bioavailability in soils, sediments, and aquatic environments. Proceedings of the National Academy of Science, USA 96:3365-3371. Trajanovska, S., M. L. Britz, and M. Bhave. 1997. Detection of heavy metal ion resistance genes in gram-positive and gram-negative bacteria isolated from a lead-contaminated site. Biodegradation 8:113-124. Trasar-Cepeda, C., M. C. Leirós, S. Seoane, and F. Gil-Sotres. 2000. Limitation of soil enzymes as indicators of soil pollution. Soil Biology and Biochemistry 32:1867-1875. Trevors, J. T., G. W. Stratton, and G. M. Gadd. 1986. Cadmium transport, resistance, and toxicity in bacteria, algae, and fungi. Canadian Journal of Microbiology 32:447-464. Tsutomu, S., and Y. Kobayashi. 1998. The ars operon in the skin element of Bacillus subtilis confers resistance to arsenate and arsenite. Journal of Bacteriology 180:1655-1661. Turner, J. S., P. D. Glands, A. C. Samson, and N. J. Robinson. 1996. Zn2+-sensing by the cyanobacterial metallothionein repressor SmtB: different motifs mediate metal-induced protein-DNA dissociation. Nucleic Acids Research 24:3714-3721. Turner, J. S., A. P. Morby, B. A. Whitton, A. Gupta, and N. J. Robinson. 1993. Construction of Zn2+/Cd2+ hypersensitive cyanobacterial mutants lacking a functional metallothionein locus. Journal of Biological Chemistry 268:4494-4498.

156
Turner, J. S, N. J. Robinson, and A. Gupta. 1995. Construction of Zn2+/Cd2+-tolerant cyanobacteria with a modified metallothionein divergon: further analysis of the function and regulation of smt. Journal of Industrial Microbiology 14:259-264. Turpeinen, R., M. Pantsar-Kallio, M. Haggblom, and T. Kairesalo. 1999. Influence of microbes on the mobilization, toxicity and biomethylation of arsenic in soil. Science of the Total Environment 236:173-180. Twiss, M. R., O. Errecalde, C. Fortin, P. G. C. Campbell, C. Jumarie, F. Denizeau, E. Berkelaar, B. Hale, and K. Van Rees. 2001. Coupling the use of computer chemical speciation models and culture techniques in laboratory investigations of trace metal toxicity. Chemical Speciation and Bioavailability 13:9-24. Tye, A. M., S. D. Young, N. M. J. Crout, N. Zhang, S. Preston, E. H. Bailey, W. Davison, S. P. McGrath, G. L. Paton, and K. Kilham. 2002. Predicting arsenic solubility in contaminated soils using isotopic dilution techniques. Environmental Science and Technology 36:982-988. Tyler, G. 1974. Heavy metal pollution and soil enzymatic activity. Plant and Soil 41:303-311. Tyler, G. 1981. Heavy metals in soil biology and biochemistry, p. 371-414. In: Soil Biochemistry, E. A. Pau and J. N. Ladd (eds). Dekker, NY. Upitis, V. V., D. S. Pakalne, and A. F. Nollendorf. 1973. The dosage of trace elements in the nutrient medium as a factor in increasing the resistance of Chlorella to unfavorable conditions of culturing. Microbiology 42:758-762. USDHHS, U. S. Department of Health and Human Services. 1993. Registry of toxic effects of chemical substances (RTECS, online database). National Toxicology Information Program, National Library of Medicine, Bethesda, MD. USEPA, U. S. Environmental Protection Agency. 1982. An exposure and risk assessment for dichloroethanes, p. 175. U. S. Environmental Protection Agency, Office of Water Regulations and Standards, Washington, DC. Vallaeys, T., E. Topp, G. Muyzer, V. Macheret, G. Laguerre, A. Rigaud, and G. Soulas. 1997. Evaluation of denaturing gradient gel electrophoresis in the detection of 16S rDNA sequence variation in rhizobia and methanotrophs. FEMS Microbiology Ecology 24:270-285. Vandenbergh, P. A., and B. S. Kunka. 1988. Metabolism of volatile chlorinated aliphatic hydrocarbons by Pseudomonas fluorescens. Applied and Environmental Microbiology 54:2578-2579. van den Wijngaard, A. J., K. W. H. J. van der Kamp, J. van der Ploeg, F. Pries, B. Kazemier, and D. B. Janssen. 1992. Degradation of 1,2-dichloroethane by Ancylobacter aquaticus and other facultative methylotrophs. Applied and Environmental Microbiology 58:976-983.

157
van den Wijngaard, A. J., R. G. van der Klrij, R. E. Doornweerd, and D. B. Janssen. 1993. Influence of organic nutrients and co-cultures on the competitive behavior of 1,2-dicholroethane degrading bacteria. Applied and Environmental Microbiology 59:3400-3405. Vandercasteele, C., V. Dutré, D. Geysen, and G. Wauters. 2002. Solidification/stabilization of arsenic bearing fly ash from the metallurgical industry, immobilisation mechanism of arsenic. Waste Management 22:143-146. Van Der Gucht, K., K. Sabbe, L. De Meester, N. Vloemans, G. Zwart, M. Gillis, and W. Vyverman. 2001. Contrasting bacterioplankton community composition and seasonal dynamics in two neighbouring hypertrophic freshwater lakes. Environmental Microbiology 3:680-690. Van der Ploeg, J., M. P. Smidt, A. S. Landa, and D. B. Janssen. 1994. Identification of chloroacetaldehyde dehydrogenase involved in 1,2-dichloroethane degradation. Applied and Environmental Microbiology 60:1599-1605. Van der Ploeg, J., G. van Hall, and D. B. Janssen. 1991. Characterization of the haloacid dehalogenase from Xanthobacter autotrophicus GJ10 and sequencing of the dhlB gene. Journal of Bacteriology 173:7925-7933. Van der Ploeg, J., M. Willemsen, G. van Hall, and D. B. Janssen. 1995. Adaptation of Xanthobacter autotrophicus GJ10 to bromoacetate due to activation and mobilization of the haloacetate dehalogenase gene by insertion element IS1247. Journal of Bacteriology 177:1348-1356. van der Zaan, B., J. de Weert, H. Rijnaarts, W. M. de Vos, H. Smidt, and J. Gerritse. 2009. Degradation of 1,2-dichloroethane by microbial communities from river sediment at various redox conditions. Water Research 43:3207-3216. Van Dillewijn, P., A. Caballero, J. P. Paz, M. M. Gonzalez-Perez, J. M. Oliva, and J. L. Ramos. 2007. Bioremediation of 2,4,6-trinitrotoluene under field conditions. Environmental Science and Technology 41:1378-1383. Van Dyke, M., S. Gulley, H. Lee, and J. Trevors. 1993. Evaluation of microbial surfactants for recovery of hydrophobic compounds in soil. Industrial Microbiology and Biotechnology 11:163-170. Vanhala, P. T., and J. H. Ahtiainen. 1994. Soil respiration, ATP content, and photobacterium toxicity test as indicators of metal pollution in soil. Environmental Toxicology and Water Quality 9:115-121. Van Hamme, J. D., A. Singh, and O. P. Ward. 2006. Physiological aspects Part 1 in a series of papers devoted to surfactants in microbiology and biotechnology. Biotechnology Advances 24:604-620.

158
van Hullebusch, E. D., P. N. L. Lens, and H. H. Tabak. 2005. Developments in bioremediation of soils and sediments polluted with metals and radionuclides. 3. Influence of chemical speciation and bioavailability on contaminants immobilization/mobilization bio-processes. Reviews in Environmental Science and Biotechnology 4:185-212. Van Zwieten, L., M. R. Ayres, and S. G. Morris. 2003. Influence of arsenic co-contamination on DDT breakdown and microbial activity. Environmental Pollution 124:331-339. Vasconcelos, M. T. S. D., M. Azenha, and C. M. R. Almeida. 1998. Copper(II) complexation properties and surfactant activity of 3-[N,N-bis(2-hydroxyethyl)amino]-2-hydroxypropanesulfonic acid and N-(2-hydroxyethyl)piperazine-N0-2-hydroxypropanesulfonic acid pH buffers which may affect trace metal speciation in in vitro studies. Analytical Biochemistry 265:193-201 Vasconcelos, M. T. S. D., and M. F. C. Leal. 2002. Influence of N-2-hydroxyethylpiperazine-N0-2-ethanesulfonic acid pH buffer on the biological response of marine algae. Environmental Toxicology and Chemistry 21:404-412. Vaughan, D. J. 2006. Arsenic. Elements 2:71-75. Viator, R. P., J. L. Kovar, and W. B. Hallmark. 2002. Gypsum and compost effects on sugarcane root growth, yield, and plant nutrients. Agronomy Journal 94:1332-1336. Vidali, M. 2001. Bioremediation. An overview. Pure and Applied Chemistry 73:1163-1172. Vig, K., M. Megharaj, N. Sethunathan, and R. Naidu. 2003. Bioavailability and toxicity of cadmium to microorganisms and their activities in soil: a review. Advances in Environmental Research 8:121-135. Villaescusa, I., I. Casas, M. Martinez, and J. C. Murat. 2000. Effect of zinc chloro-complexes to photoluminescent bacteria: Dependence of toxicity on metal speciation. Bulletin of Environmental Contamination and Toxicology 64:729-734. Vogel, T. M. 1996. Bioaugmentation as a soil bioremediation approach. Current Opinion and Biotechnology 7:311-316. Vogel, T. M., C. S. Criddle, and P. L. McCarty. 1987. Transformations of halogenated aliphatic compounds. Environmental Science and Technology 21:722-736. Volpe, A., G. D. Moro, S. Rossetti, V. Tandoi, and A. Lopez. 2009. Enhanced bioremediation of methyl tert-butyl ether (MTBE) by microbial consortia obtained from contaminated aquifer material Chemosphere 75:149-155. von Mersi, W., and F. Schinner. 1991. An improved and accurate method for determining the dehydrogenase activity of soils with iodonitrotetrazolium chloride. Biology and Fertility of Soils 11:216-220.

159
Von Wintzingerode, F., S. Böcker, C. Schlötelburg, N. H. Chiu, N. Storm, C. Jurinke, C. R. Cantor, U. B. Göbel, and D. Van den Boom. 2002. Base-specific fragmentation of amplified 16S rRNA genes analysed by mass spectrometry: A tool for rapid bacterial identification. Proceedings of the National Academy of Sciences of the United States of America 99:7039-7044. Wang, S., and C. N. Mulligan. 2004. An evaluation of surfactant foam technology in remediation of contaminated soil. Chemosphere 57:1079-1089. Wang, S., and C. N. Mulligan. 2006. Natural attenuation processes for remediation of arsenic contaminated soils and groundwater. Journal of Hazardous Materials B138:459-470. Wang, Y. P., J. Y. Shi, H. Wang, Q. Lin, X. C. Chen, and Y. X. Chen. 2007. The influence of soil heavy metals pollution on soil microbial biomass, enzyme activity, and community composition near a copper smelter. Ecotoxicology and Environmental Safety 67:75-81. Watanabe, K. 2001. Microorganisms relevant to bioremediation. Current Opinion in Biotechnology 12:237-241. Watanabe, K., M. Teramoto, H. Futamata, and S. Harayama. 1998. Molecular detection, isolation, and physiological characterization of functionally dominant phenol-degrading bacteria in activated sludge. Applied and Environmental Microbiology 64:4396-4402. Wayne, L. G., D. J. Brenner, R. R. Colwell, P. A. D. Grimont, O. Kandler, M. I. Krichevsky, L. H. Moore, W. E. C. Moore, R. G. E. Murray, E. Tackebrandt, M. P. Starr, and H. G. Trüper. 1987. Report to the Ad Hoc committee on reconciliation of approaches to bacterial systematics. International Journal of Systematic Bacteriology 37:463-464. Weast, R. C. 1984. CRC handbook of chemistry and physics, 64 edn. CRC, Boca Raton, Florida. Weiner, R. M., E. Chang, S. Coon, and M. Walch. 1999. Microorganisms and the impact of heavy metals in marine ecosystems. Recent Research Developments in Microbiology 3:391-414. Weissenhorn, I., C. Leyval, and J. Berthelin. 1995. Bioavailability of heavy metals and abundance of arbuscular mycorrhiza in a soil polluted by atmospheric deposition from a smelter. Biology and Fertility of Soils 19:22-28. Wenzel, W. W., N. Kirchbaumer, T. Prohaska, G. Stingeder, E. Lombi, and D. C. Adriano. 2001. Arsenic fractionation in soils using an improved sequential extraction procedure. Analytica Chimica Acta 436:309-323. Weston, A., and T. Balba. 2003. Bioaugmentation. Innovation Technology Group 3:1-2. White, V. E., and C. J. Knowles. 2000. Effect of metal complexation on the bioavailability of nitrilotriacetic acid to Chelatobacter heintzii ATCC 29600. Archives of Microbiology 173:373-382.
160
White, V. E., and C. J. Knowles. 2003. Degradation of copper-NTA by Mesorhizobium sp. NCIMB 13524. International Biodeterioration and Biodegradation 52:143-150. WHO, World Health Organization. 1996. Guidelines for drinking water quality. Health criteria and other supporting information. 2nd edn. World Health Organization, Geneva. WHO, World Health Organisation. 2003. Guidelines for drinking water quality, draft monograph on 1,2-dichloroethane. 3rd edn. World Health Organization, Geneva. Widada, J., H. Nojiri, T. Yoshida, H. Habe, and T. Omori. 2002. Enhanced degradation of carbazole and 2,3-dichlorodibenzo-p-dioxin in soils by Pseudomonas resinovorans strain CA10. Chemosphere 49:485-491. Widmer, F., A. Bach, E. Laczko, J. Schulze-Aurich, and J. Zeyer. 2001. Assessing soil biological characteristics: a comparison of bulk soil community DNA-, PLFA-, and Biolog (TM)-analyses. Soil Biology and Biochemistry 33:1029-1036. Wilkie, J. A., and J. G. Hering. 1996. Adsorption of arsenic onto hydrous ferric oxide: effects of adsorbate/adsorbent ratios and co-occurring solutes. Colloids and Surfaces A 107:97-110. Witter, E., P. Gong, E. Bååth, and H. Marstorp. 2000. A study of the structure and metal tolerance of the soil microbial community six years after cessation of sewage sludge applications. Environmental Toxicology and Chemistry 19:1983-1991. Wolt, J. 1994. Soil solution chemistry: Applications to environmental science and agriculture, p. 345. In: Soil Solution Chemistry, John Wiley and Son, NY. Wong, K. W., B. A. Toh, Y. P. Ting, and J. P. Obbard. 2005. Biodegradation of phenanthrene by the indigenous microbial biomass in a zinc amended soil. Letters in Applied Microbiology 40:50-55. Wrenn, B. A., K. L. Sarnecki, E. S. Kohar, K. Lee, and A. D. Venosa. 2006. Effects of nutrient source and supply on crude oil biodegradation in continuous-flow beach microcosms. Journal of Environmental Engineering 132:75-84. Wright, D. A., and R. P. Mason. 2000. Biological and chemical influence on trace metal toxicity and bioaccumulation in the marine and estuarine environment. International Journal on Environmental Pollution 13:226-248. Wu, J., L. S. Tisa, and B. P. Rosen. 1992. Membrane topology of the ArsB protein, the membrane subunit of an anion-translocating AT-Pase. Journal of Biological Chemistry 267:12570-12576. Wu, C. H., T. K. Wood, A. Mulchandani, and W. Chen. 2006. Engineering plant-microbe symbiosis for rhizoremediation of heavy metals. Applied and Environmental Microbiology 72:1129-1134.

161
Xu, R., L. C. Yong, Y. G. Lim, and J. P. Obbard. 2005. Use of slow-release fertilizer and biopolymers for stimulating hydrocarbon biodegradation in oil-contaminated beach sediments. Marine Pollution Bulletin 51:1101-1110. Xuexia, Y., L. Xiangui, C. Haiyan, Y. Rui, Z. Huayong, H. Junli, and Z. Jianguo. 2006. Effects of elevate atmospheric CO2 on soil enzyme activities at different application treatments. Acta Ecologica Sinica 26:48-53. Yamamoto, K., M. Fukushima, N. Kakutani, and K. Kuroda. 1997. Volatile organic compounds in urban rivers and their estuaries in Osaka, Japan. Environmental Pollution 95:135-143. Yoshida, N., N. Takahashi, and A. Hiraishi. 2005. Phylogenetic characterization of a polychlorinated-dioxin-dechlorinating microbial community by use of microcosm studies. Applied and Environmental Microbiology 71:4325-4334. Yu, P., and T. Welander. 1995. Growth of an aerobic bacterium with TCP as the sole source of energy and carbon. Applied Microbiology and Biotechnology 42:769-774. Yu, K. S. H., A. H. Y. Wong, K. W. Y. Yau, Y. S. Wong, and N. F. Y. Tam. 2005. Natural attenuation, biostimulation and bioaugmentation on biodegradation of polycyclic aromatic hydrocarbons (PAHs) in mangrove sediments. Marine Pollution Bulletin 51:1071-1077. Ţemberyová, M., J. Barteková, M. Závadská, and M. Šišoláková. 2007. Determination of bioavailable fractions of Zn, Cu, Ni, Pb, and Cd in soils and sludges by atomic absorption spectrometry. Talanta 71:1661-1668. Zhang, Y. M., W. J. Maier, and R. M. Miller. 1997. Effect of rhamnolipids on the dissolution, bioavailability and biodegradation of phenanthrene. Environmental Science and Technology 3:2211-2217. Zhang, Y. M., and R. M. Miller. 1994. Effect of a Pseudomonas rhamnolipid biosurfactant on cell hydrophobicity and biodegradation of octadecane. Applied and Environmental Microbiology 60:2101-2106. Zhang, Y. M., and R. M. Miller. 1995. Effect of rhamnolipid (biosurfactant) structure on solubilization and biodegradation of n-alkanes. Applied and Environmental Microbiology 61:2247-2251. Zhang, H., and H. M. Selim. 2008. Competitive sorption-desorption kinetics of arsenate and phosphate in soils. Soil Science 173:3-12. Zhang, H., F. J. Zhao, B. Sun, W. Davison, and S. P. McGrath. 2001. A new method to measure effective soil solution concentration predicts copper availability to plants. Environmental Science and Technology 35:2602-2607.

162
Zhao, X., and S. Masaihiko. 2007. Fractionation and solubility of cadmium in paddy soils amended with porous hydrated calcium silicate. Journal of Environmental Sciences 19:343-347. Zhu, B. Z., S. Shechtman, and M. Chevion. 2001. Synergistic cytotoxicity between pentachlorophenol and copper in a bacterial model. Chemosphere 45:463-470. Ziegler, C., and W. Göpel. 1998. Biosensor development. Current Opinion in Chemical Biology 2:585-591.