the impact of glucose-based or lipid-based total
TRANSCRIPT

nutrients
Article
The Impact of Glucose-Based or Lipid-Based TotalParenteral Nutrition on the Free Fatty Acids Profile inCritically Ill Patients
Pavel Skorepa 1,2 , Ondrej Sobotka 2,3 , Jan Vanek 1, Alena Ticha 4, Joao Fortunato 2,Jan Manak 2, Vladimir Blaha 2, Jan M. Horacek 1,5 and Lubos Sobotka 2,*
1 Department of Military Internal Medicine and Military Hygiene, Faculty of Military Health Sciences,University of Defence in Brno, Trebesska 1575, 50001 Hradec Kralove, Czech Republic;[email protected] (P.S.); [email protected] (J.V.); [email protected] (J.M.H.)
2 3rd Department of Internal Medicine—Metabolic Care and Gerontology, University Hospital and Faculty ofMedicine in Hradec Kralove, Charles University in Prague, Sokolska 581, 50005 Hradec Kralove, CzechRepublic; [email protected] (O.S.); [email protected] (J.F.); [email protected] (J.M.);[email protected] (V.B.)
3 Department of Physiology, Faculty of Medicine in Hradec Kralove, Charles University in Prague, Simkova870, 50003 Hradec Kralove, Czech Republic
4 Department of Clinical Biochemistry and Diagnostics, University Hospital and Faculty of Medicine inHradec Kralove, Charles University in Prague, Sokolska 581, 50005 Hradec Kralove, Czech Republic;[email protected]
5 4th Department of Internal Medicine—Hematology, University Hospital Hradec Kralove, Sokolska 581,50005 Hradec Kralove, Czech Republic
* Correspondence: [email protected]; Tel.: +420-49-583-2231
Received: 3 April 2020; Accepted: 7 May 2020; Published: 11 May 2020�����������������
Abstract: Introduction: Our study aim was to assess how the macronutrient intake during totalparenteral nutrition (TPN) modulates plasma total free fatty acids (FFAs) levels and individual fattyacids in critically ill patients. Method: Adult patients aged 18–80, admitted to the intensive care unit(ICU), who were indicated for TPN, with an expected duration of more than three days, were includedin the study. Isoenergetic and isonitrogenous TPN solutions were given with a major non-proteinenergy source, which was glucose (group G) or glucose and lipid emulsions (Smof lipid; group L).Blood samples were collected on days 0, 1, 3, 6, 9, 14, and 28. Results: A significant decrease (p < 0.001)in total FFAs occurred in both groups with a bigger decrease in group G (p < 0.001) from day 0(0.41 ± 0.19 mmol·L−1) to day 28 (0.10 ± 0.07 mmol·L−1). Increased palmitooleic acid and decreasedlinoleic and docosahexaenoic acids, with a trend of increased mead acid to arachidonic acid ratio, onday 28 were observed in group G in comparison with group L. Group G had an insignificant increasein leptin with no differences in the concentrations of vitamin E, triacylglycerides, and plasminogenactivator inhibitor-1. Conclusion: Decreased plasma FFA in critically ill patients who receive TPNmay result from increased insulin sensitivity with a better effect in group G, owing to higher insulinand glucose dosing and no lipid emulsions. It is advisable to include a lipid emulsion at the latestfrom three weeks of TPN to prevent essential fatty acid deficiency.
Keywords: critical illness; parenteral nutrition; nonesterified fatty acids; essential fatty acidsdeficiency; adiponectin; alpha-Tocopherol; insulin resistance
1. Introduction
Nutritional support is an integral part of the complex treatment of critically ill patients, especiallyin those who are under long-term care at the intensive care unit (ICU). Total parenteral nutrition
Nutrients 2020, 12, 1373; doi:10.3390/nu12051373 www.mdpi.com/journal/nutrients

Nutrients 2020, 12, 1373 2 of 17
(TPN) is essential for the provision of the patient’s energy requirements together with macro andmicronutrients in critically ill patients when enteral feeding is contraindicated or not tolerated [1].Despite the efforts of many experts, the exact doses of glucose and lipids (or their ratios) during theprovision of nutritional support have not been completely elucidated and are still being rigorouslydiscussed [2,3]. Recent guidelines also admit that even lipid-free parenteral nutrition may be givenduring the first week of critical illness. In case there is a suspicion of an essential fatty acid deficiency(EFAD), lipids should be given at a maximum of 100 g per week [4]. Nevertheless, there is no preciseinformation about the dosage or timing of essential fatty acids supplementation [1]. In spite of the factthat some of the present nutritional recommendations are based on prospective randomized studiesand their meta-analyses, the pathophysiological context of such recommendations could, on occasion,be put into question [5].
The hydrolysis of triglycerides derived from both the diet and adipose tissue determine theconcentration and composition of plasma free fatty acids (FFAs). Elevated levels of FFAs are frequentin obese subjects and especially in those who are obese and insulin-resistant or in those who are alreadytype 2 diabetics [6]. Recently, Arabi et al., in their study, described a positive relationship between theelevated levels of FFAs and blood glucose with increased insulin requirements in critically ill patientswith diabetes and in older patients, thus suggesting a connection between elevated FFA levels andmetabolic syndrome [7]. It was previously shown that therapeutic procedures that indirectly influencethe levels of FFAs could be important in some clinical states. The increase of serum FFA levels due tothe administration of lipid emulsion in healthy volunteers led to an elevated inflammatory responseafter the infusion of endotoxins [8]. On the other hand, the decreased concentration of FFAs due toglucose and insulin infusion was found to be cardio-protective in patients undergoing aortocoronarybypass procedures [9].
Nutritional support plays an essential role in lipid metabolism and one could expect it to have aninfluence on both the quantitative and qualitative composition of serum FFA in critically ill patients.The FFA concentration in experimental animals being studied increased during the administrationof a low carbohydrate, high fat diet, irrespective of their total energy intake [10]. However, neitherthe total energy intake nor the amounts of macronutrients were found to influence the plasma FFAconcentration and the enzymes involved in lipid metabolism in the adipose tissue samples of criticalpatients who did not survive [11]. Nevertheless, the patients in this “post-mortem” study received amaximum dose of only 250 g of carbohydrates per day.
The question for us was how does nutritional support influence the levels of total plasma FFAsand their qualitative composition in critically ill patients? We also wanted to know what are the effectsof TPN on pro–inflammatory and anti–inflammatory FFA. We performed a prospective randomizedcontrol study to describe the changes in plasma FFA composition after the administration of twodifferent TPN systems for up to 28 days. The main difference between the TPN regimens that wereadministered during the course of the study was in the daily dosages of glucose and lipids, whichwere at the upper and lower limits of the clinical recommendations.
2. Materials and Methods
2.1. Study Design and Patients
Patients who were acute admissions to the ICU with an expected duration of TPN feeding formore than three days were included in the prospective randomized study. The patients were agedfrom 18 to 80 years. The ethnicity of the patients enrolled in this study was Caucasian (ethnic Czech).We excluded patients who had received any artificial enteral or parenteral nutrition three days priorto entry into the study. Other exclusion criteria were as follows: pregnancy, body mass index (BMI)less than 18 kg·m−2, terminal illness, and a baseline serum triglyceride concentration of >3 mmol·L−1.Patients were randomly divided (randomization using numbered and sealed envelopes) into twogroups based on the composition of the TPN admixtures. In the first group, a non-protein energy

Nutrients 2020, 12, 1373 3 of 17
needs consisted of glucose (group G) and, in the second group, non-protein energy was infused as afixed mixture of glucose and a lipid emulsion (group L).
The study protocol and the informed consent were approved by the ethical committee of theUniversity Hospital of Charles University in Prague, in the Czech Republic (the official trial number ofthe study is 1411S22P). Upon everything being explained to them, the patients signed informed consentforms prior to their participation in this study. The primary goal of this study was to determine theinfluence of TPN on the differences in the total plasma FFA as well as on the individual fatty acids (FA)profiles. The secondary objective of the study was to compare the differences in selected antioxidant(α–Tocopherol) and adipose tissue hormones, along with a detailed glycaemic profile and checking forsigns of EFAD in the patients being studied.
2.2. Composition of the TPN Admixtures
The nutritional regimes of both group G and L contained an identical amount of energy and aminoacids. The planned protein intake was 1.8 g·kg−1 of ideal body weight (IBW) per day (Neonutrin 15%,Fresenius Kabi, Prague, Czech Republic) and the energy intake at 30 kcal g·kg−1 of IBW per day. Theonly difference was the amount of lipid emulsion and glucose: group G received glucose at a dose of5.8 g·kg−1 IBW·day−1 (≈400 g per 70 kg BW) without any lipid emulsion. Group L received glucose ata dose of 2.9 g·kg−1 of IBW·day−1 (≈200 g per 70 kg BW) with lipid emulsion at a dose of 1.2 g·kg−1 ofIBW·day−1 (SMOF-lipid 20%, Fresenius Kabi, Uppsala, Sweden). The IBW was calculated according tothe Devine formula, which is often used in the ICU setting and is based on the height of the patient [12].The treating physicians, together with members of the nutritional support team, tailored the TPNtreatment according to the needs of the patient. The ICU team, in cooperation with the nutritionalsupport team, also determined the timing of the initiation and discontinuation of the TPN regimenand the commencement of enteral feeds. The study investigators themselves were not involved inmaking these decisions. The TPN admixture was continuously infused during a 24 hour period andthe timing of its administration was carefully controlled. The plasma glucose level was maintained atconcentrations between 8 and 10 mmol·L−1 and, if necessary, insulin was infused according to ourICU protocols. Electrolytes, vitamins, and trace elements were added in the hospital pharmacy to“all-in-one bags” according to the patient’s needs. The pharmacist also checked the compatibility ofthe TPN admixtures.
2.3. Blood Collection and Sample Analysis
Baseline blood samples were drawn and the results were analyzed 6 h before the start of TPN(day 0). Subsequent samples were taken in the mornings on days 1, 3, 6, 9, 14, and 28. If TPN wasceased or if any form of enteral feeding (enteral nutrition, sipping, and so on) was scheduled, bloodsamples were taken on the last day of TPN. Blood samples were no longer collected once the patientwas discharged from the ICU.
First, 5 mL blood samples were collected into tubes with potassium ethylenediaminetetraaceticacid (1.8 mg·mL−1; Vacutainer, BD Diagnostics, NJ, USA). The samples were transported to thelaboratory on ice and then immediately centrifuged at 4 ◦C at a relative centrifugal force of 2500 rpmfor 10 min. The plasma was separated and stored at a temperature of −20 ◦C. The use of heparin wasminimized, or the application was performed at intervals to minimize its effect on lipoprotein lipase.The plasma concentrations of total FFAs were analyzed using an FFA-HR kit (Wako chemicals GmbH,Neuss, Germany) with a Shimadzu UV-1700 spectrophotometer (produced in Kyoto, Japan). Theaccuracy of this method ranges from 3.3% to 5.1% and the precision is 4.9%. The normal serum range oftotal FFAs is between 0.1 and 0.45 mmol·L−1 in females and between 0.1 and 0.6 mmol·L−1 in males. FFAvalues above these ranges were considered to be abnormally high. Individual FAs were analyzed usingthe gas chromatography technique with a flame ionization detector (Dani Master, Dani InstrumentsS.p.A., Milan, Italy). Following its extraction from plasma by the usage of toluen–acetylchloride andits derivatization using methanol, chromatographic separation was performed in a Rtx-2330 column

Nutrients 2020, 12, 1373 4 of 17
(60 m, 0.25 mm ID, 0.2 um df; Restek, Bellefonte, PA, USA). The precision of the gas chromatographymethod was from 3% to 10%, depending on the low and high range and on the type of fatty acid. Theindividual FA composition was expressed as a weight percentage of the total FFAs (presented as %).The levels of markers affecting insulin resistance (resistin, leptin), plasminogen activator inhibitor1 (PAI-1), and insulin levels were measured by biochip array technology using chemiluminescentsandwich immunoassays (Metabolic Syndrome Array I, Randox, Crumlin, UK) that were applied to theevidence investigator analyzer [13]. For quality control in the monitoring of the accuracy and precisioncontrol assays (Metabolic Syndrome Multianalyte Controls), EV3757 was used. Assay precision wasdetermined from 4% to 11% depending on the type of hormone. The levels of α–tocopherol wereanalyzed using a prominence HPLC system (Schimadzu, Kyoto, Japan), as previously publishedby Solichova et al. [14]. Additional 5 mL blood samples were collected into tubes with silica clotactivator (Vacutainer, BD Diagnostics, NJ, USA) and used for further biochemical analysis ( for examplealbumin). These analytes were determined on a Cobas 8000 analyzer (Hoffmann-La Roche Ltd.,Manheim, Germany).
2.4. Statistical Analysis
We used the nonparametric analysis of longitudinal data of the F1-LD-F1 design [15] on datagenerated during the course of the study, and we applied Bonferroni–Holm correction for multipletesting [16]. The analysis was performed in R 3.5.3 2019 [17]. For the purpose of group comparison, thebaseline data of the 48 patients who were enrolled in the study were analyzed using the unpaired t-test.Significance was defined by a 5% level and the data were presented as means plus/minus standarddeviations (SDs), unless otherwise specified.
3. Results
3.1. Group Characteristics
A total of 48 patients (37 males and 11 females) with a mean age of 65 years were participantsin the study (Figure S1). The overview of the main diagnosis of our cohort at the beginning of studyis depicted in Table 1. In both study groups, there were no observable differences in their maincharacteristics prior to them receiving nutritional support (Table 2). The study population consisted ofseverely ill patients with a high acute physiology and chronic health evaluation (APACHE) II scorein addition to having a high risk of malnutrition according to the nutrition risk score (NRS)-2002scoring system.
Table 1. Diagnosis of the patients in the study.
Diagnosis Number of Patients
Acute pancreatitis 22Gastroinstestinal bleeding 8
Bowel perforation, enteric fistulas 5Bowel obstruction and ileus 4
Ischemic bowel disease 3Crohn’s disease 3
Vasculitis with ileus 2Chemical burns of the oesophagus and stomach 1
3.2. Macronutrient Intake and Plasma Glucose Control
TPN on average was started 2–3 days after admission to the ICU. Energy and amino acid intake didnot significantly differ between the groups and the predetermined nutritional goals were met for all ofthe patients (Table 3). Group G received 5.8 g of glucose·kg−1 of IBW·day−1 without receiving any lipids,whereas group L received 2.9 g of glucose·kg−1 of IBW·day−1 and 1.2 g of lipids·kg−1 of IBW·day−1. In

Nutrients 2020, 12, 1373 5 of 17
spite of the fact that the glucose and lipid intakes significantly differed between the groups, we didnot observe any statistically significant differences in the plasma glucose levels (8.9 ± 1.4 mmol·l−1 vs.8.0 ± 1.3 mmol·l−1) among the patients. Moreover, the rate of insulin administration was also higherfrom a negligible to a moderate level in group G, in comparison with group L (68 ± 57 mIU·day−1 vs.43 ± 36 mIU·day−1). There were two incidents where mild hypoglycaemic states were observed ingroup G versus none in group L.
Table 2. Group characteristics at day 0 (mean values with standard deviation).
Variable Group Gn = 25
Group Ln = 23 p-Value
Age (years) 65 ± 9 65 ± 13 0.609Male/Female 20/5 (M/F) 17/6 0.528Weight (kg) 82.4 ± 19.0 82.2 ± 16.0 0.115
BMI (kg·m−2) 28.3 ± 4.9 26.2 ± 3.8 0.105NRS-2002 4.2 ± 0.7 4.1 ± 0.9 0.404
APACHE II score 20.8 ± 5.9 18.4 ± 4.0 0.144Diabetic patients, # (% of total) 9 (36) 10 (43) 0.365
Serum albumin (g·L−1) 29.8 ± 8.2 29.3 ± 7.4 0.185Serum transthyretin (mmol·L−1) 0.13 ± 0.06 0.16 ± 0.06 0.185
Serum triacylglycerols (mmol·L−1) 1.5 ± 0.9 1.6 ± 0.9 0.704Serum total cholesterol (mmol·L−1) 3.1 ± 1.3 3.1 ± 1.2 0.378Serum HDL cholesterol (mmol·L−1) 0.7 ± 0.5 0.8 ± 0.5 0.905
Leukocyte count (cells·109·L−1) 12.6 ± 6.9 13.4 ± 7.0 0.840C-reactive protein [mg·L-1) 174.0 ± 163.3 91.0 ± 79.8 0.311
Serum ALT(µkat· L−1) 1.9 ± 2.3 1.0 ± 1.2 0.285Serum AST (µkat· L−1) 3.1 ± 4.7 1.1 ± 1.9 0.111Serum GMT(µkat·L−1) 4.7 ± 5.3 1.3 ± 2.6 0.178Serum ALP (µkat·L−1) 2.0 ± 1.4 1.8 ± 1.4 0.401
Group G, glucose-based total parenteral nutrition; Group L, lipid-based total parenteral nutrition; BMI, body massindex; NRS, nutrition risk score; APACHE, acute physiology and chronic health evaluation; HDL, high densitylipoprotein; ALT, Alanin–aminostransferase; AST, Aspartate–aminotransferase; GMT, Gamma–glutamyltransferase;ALP, Alanine-aminotransferase.
Table 3. Nutritional intake and glycaemic control throughout the course of total parenteral nutrition(mean values with standard deviation).
Variable Group Gn = 25
Group Ln = 23 p-Value
Duration of TPN (days) 14 ± 11 11 ± 8 0.704Starting TPN from the time of admission (days) 2.3 ± 0.8 2.1 ± 0.7 0.680
Energy (kcal·kg−1 IBW·day−1) 30.5 ± 1.8 30.4 ± 1.3 0.764Non-protein energy (kcal·kg−1 IBW·day−1) 23.2 ± 1.6 23.1 ± 1.0 0.788
Amino acids (g·kg−1 IBW·day−1) 1.8 ± 0.1 1.8 ± 0.1 0.775Glucose (g·kg−1 IBW·day−1) 5.8 ± 0.4 2.9 ± 0.2 <0.001Lipids (g·kg−1 IBW·day−1) 0 1.2 ± 0.1 <0.001
Oleic acid received (g·day−1) 0 21.7 ± 2.4 <0.001Linoleic acid received (g·day−1) 0 14.6 ± 1.6 <0.001
Blood glucose (mmol·L−1) 8.9 ± 1.4 8.0 ± 1.3 0.115Blood glucose in diabetic patients (mmol·L−1) 9.3 ± 1.1 9.1 ± 1.0 0.682
Presence of mild hypoglycaemia (3–3.8 mmol·L−1; cases) 2 0 0.345Dose of insulin (mIU·day−1) 68 ± 57 43 ± 36 0.205
Dose of insulin in diabetic patients (mIU·day−1) 82 ± 69 71 ± 43 0.418Administration of insulin (% of patients) 68 52 0.314
Serum insulin levels (µIU·mL−1) 40 ± 59 25 ± 44 0.215Serum insulin levels in diabetic patients (µIU·mL−1) 43 ± 71 36 ± 32 0.575
Group G, glucose-based total parenteral nutrition; Group L, lipid-based total parenteral nutrition; TPN, totalparenteral nutrition.

Nutrients 2020, 12, 1373 6 of 17
3.3. Plasma Concentrations of Total Free Fatty Acids
The baseline levels of total plasma FFAs were not significantly different between the study groupsand changed rapidly over time (Figure 1). Fourteen patients (29.2%) had higher levels of FFAs (median0.796 mmol·L-1) before the start of TPN. Plasma FFA levels changed rapidly after the onset of TPN andduring the study period (Figure 1). The significant decrease (p < 0.001) in the total FFA concentrationoccurred in both groups three days after the onset of TPN, but this decrease was significantly higher(p < 0.001) in the group that received glucose as the only source of non-protein energy. Over time, theFFA levels further decreased and the lowest serum levels of total FFAs was found on day 28 in bothgroups (0.12 ± 0.07 vs. 0.27 ± 0.07; Figure 1).
Nutrients 2020, 12, x FOR PEER REVIEW 6 of 17
3.3. Plasma Concentrations of Total Free Fatty Acids
The baseline levels of total plasma FFAs were not significantly different between the study groups and changed rapidly over time (Figure 1). Fourteen patients (29.2%) had higher levels of FFAs (median 0.796 mmol∙L-1) before the start of TPN. Plasma FFA levels changed rapidly after the onset of TPN and during the study period (Figure 1). The significant decrease (p < 0.001) in the total FFA concentration occurred in both groups three days after the onset of TPN, but this decrease was significantly higher (p < 0.001) in the group that received glucose as the only source of non-protein energy. Over time, the FFA levels further decreased and the lowest serum levels of total FFAs was found on day 28 in both groups (0.12 ± 0.07 vs. 0.27 ± 0.07; Figure 1).
The characteristic and composition of individual FA in plasma were assessed and significant differences were observed in the plasma levels of some individual FAs. Glucose-based TPN without lipid emulsions did not have any effect on the ratio between unsaturated and saturated FA in comparison with the lipid group (Table 4). On the other side, the gradual and significant increase in the fraction of the monounsaturated FA and palmitoleic acid (C16:1; Table 4; p < 0.001) was observed in group G. Furthermore, we observed lower levels of the relative fraction of linoleic acid (C18:2 ω-6; Table 4; p < 0.001) over time in group G, in comparison with group L. The significant increase of docosahexaenoic acid (C22:6 ω–3; Table 4; p = 0.003) over time in comparison with the baseline values and between the groups was observed, together with a significantly higher proportion of the sum of omega 3 and omega 6 FFAs in group L.
The mead acid to arachidonic acid ratio is characteristic for EFAD. This ratio was increased on day 28 in group G, but did not meet the diagnostic threshold that is typical for essential fatty acid deficiency (Figure 2A). This result did not reach significance owing to fewer measurements, although the graph looks more convincing. We did not observe any significant differences in the serum profiles of other FAs (Table 4) and plasma triglycerides (Figure 2B).
Figure 1. Plasma concentrations (mmol∙L−1) of total free fatty acids (FFAs) in patients receiving high glucose; lipid-free (glucose group); or low glucose, high lipid (lipid group) total parenteral nutrition (TPN) admixtures.
Figure 1. Plasma concentrations (mmol·L−1) of total free fatty acids (FFAs) in patients receiving highglucose; lipid-free (glucose group); or low glucose, high lipid (lipid group) total parenteral nutrition(TPN) admixtures.
The characteristic and composition of individual FA in plasma were assessed and significantdifferences were observed in the plasma levels of some individual FAs. Glucose-based TPN withoutlipid emulsions did not have any effect on the ratio between unsaturated and saturated FA incomparison with the lipid group (Table 4). On the other side, the gradual and significant increase inthe fraction of the monounsaturated FA and palmitoleic acid (C16:1; Table 4; p < 0.001) was observedin group G. Furthermore, we observed lower levels of the relative fraction of linoleic acid (C18:2ω-6;Table 4; p < 0.001) over time in group G, in comparison with group L. The significant increase ofdocosahexaenoic acid (C22:6ω–3; Table 4; p = 0.003) over time in comparison with the baseline valuesand between the groups was observed, together with a significantly higher proportion of the sum ofomega 3 and omega 6 FFAs in group L.

Nutrients 2020, 12, 1373 7 of 17
Table 4. Individual fatty acids (weight percentage of total fatty acids, %).
Variable Group Day 0 Day 1 Day 3 Day 6 Day 9 Day 14 Day 28 p-Value
C12:0GG 0.22 ± 0.23 0.13 ± 0.10 0.15 ± 0.11 0.14 ± 0.08 0.14 ± 0.06 0.14 ± 0.10 0.10 ± 0.02 n.s.LL 0.12 ± 0.05 0.11 ± 0.05 0.10 ± 0.04 0.11 ± 0.07 0.11 ± 0.10 0.11 ± 0.04 0.09 ± 0.03 n.s.
C14:0GG 1.69 ± 0.78 1.38 ± 0.86 1.69 ± 0.71 1.61 ± 0.60 1.79 ± 0.81 2.06 ± 1.35 1.57 ± 0.62 n.s.LL 1.21 ± 0.69 1.13 ± 0.56 1.16 ± 0.65 1.17 ± 0.71 1.05 ± 0.72 1.35 ± 0.93 0.97 ± 0.47 n.s.
C16:0GG 32.82 ± 4.87 30.96 ± 3.78 32.07 ± 4.81 31.09 ± 3.85 31.59 ± 4.87 31.85 ± 5.74 30.28 ± 4.17 n.s.LL 30.20 ± 4.62 29.39 ± 4.05 28.45 ± 4.55 27.78 ± 4.88 26.61 ± 3.86 27.08 ± 4.14 25.81 ± 2.20 n.s.
C16:1GG 3.91 ± 2.14 4.16 ± 2.09 4.73 ± 2.14 5.69 ± 2.10 5.97 ± 2.04 7.61 ± 2.28 8.23 ± 3.21 *LL 3.08 ± 1.53 3.05 ± 1.17 2.80 ± 1.00 2.43 ± 0.59 2.37 ± 0.69 2.36 ± 0.61 1.76 ± 0.57 *
C18:0GG 7.25 ± 1.46 8.03 ± 1.40 7.42 ± 1.32 7.33 ± 1.30 7.37 ± 1.70 6.73 ± 2.07 7.67 ± 1.65 n.s.LL 7.62 ± 1.65 7.94 ± 1.39 8.01 ± 1.37 7.65 ± 1.27 7.79 ± 0.93 8.22 ± 1.42 8.65 ± 1.24 n.s.
C18:1GG 29.31 ± 5.76 32.39 ± 6.08 32.00 ± 5.70 34.22 ± 4.89 33.83 ± 5.79 34.29 ± 4.50 35.29 ± 1.89 n.s.LL 29.96 ± 4.80 32.65 ± 4.86 31.12 ± 4.26 30.89 ± 3.34 30.53 ± 4.47 29.62 ± 2.80 29.38 ± 3.40 n.s.
C18:2 n6GG 17.22 ± 5.64 14.28 ± 7.78 13.36 ± 6.62 10.96 ± 4.90 10.54 ± 5.59 9.18 ± 4.13 8.29 ± 3.35 **LL 18.71 ± 7.59 16.75 ± 9.89 19.12 ± 6.73 21.45 ± 1.95 21.77 ± 1.92 21.91 ± 1.63 22.99 ± 2.88 **
C18:3 n6GG 0.34 ± 0.21 0.41 ± 0.30 0.74 ± 0.21 0.43 ± 0.23 0.48 ± 0.33 0.48 ± 0.36 0.43 ± 0.27 n.s.LL 0.30 ± 0.17 0.30 ± 0.20 0.34 ± 0.19 0.34 ± 0.20 0.33 ± 0.15 0.35 ± 0.18 0.31 ± 0.20 n.s.
C18:3 n3GG 0.30 ± 0.24 0.49 ± 0.30 0.71 ± 0.40 0.86 ± 0.47 0.71 ± 0.36 0.72 ± 0.33 0.64 ± 0.26 n.s.LL 0.42 ± 0.21 0.46 ± 0.23 0.46 ± 0.29 0.49 ± 0.33 0.45 ± 0.24 0.50 ± 0.18 0.59 ± 0.43 n.s.
C20:3 n6GG 0.79 ± 0.28 1.06 ± 0.39 1.28 ± 0.53 1.48 ± 0.58 1.51 ± 0.64 1.32 ± 0.60 1.54 ± 0.65 n.s.LL 1.10 ± 0.64 1.04 ± 0.46 1.01 ± 0.33 0.81 ± 0.28 0.86 ± 0.18 0.86 ± 0.35 0.82 ± 0.24 n.s.
C20:4 n6GG 4.59 ± 1.87 4.90 ± 1.97 4.62 ± 1.88 4.50 ± 1.81 4.45 ± 1.94 4.02 ± 2.28 4.33 ± 2.04 n.s.LL 5.22 ± 1.95 4.94 ± 1.51 4.82 ± 1.72 4.19 ± 1.50 4.74 ± 1.42 4.29 ± 1.47 4.31 ± 1.35 n.s.
C20:5 n3GG 0.69 ± 0.43 0.79 ± 0.48 0.73 ± 0.47 0.89 ± 0.46 0.81 ± 0.38 0.90 ± 0.29 0.89 ± 0.43 n.s.LL 0.88 ± 0.46 0.73 ± 0.32 0.89 ± 0.37 0.98 ± 0.40 0.99 ± 0.34 1.05 ± 0.52 1.02 ± 0.65 n.s.
C22:6 n3GG 0.89 ± 0.48 1.00 ± 0.52 0.79 ± 0.46 0.79 ± 0.47 0.80 ± 0.48 0.69 ± 0.42 0.74 ± 0.53 ***LL 1.19 ± 0.62 1.50 ± 0.87 1.73 ± 0.88 1.73 ± 1.00 2.40 ± 1.12 2.31 ± 1.23 3.29 ± 1.52 ***
AA to EPAGG 8.88 ± 5.61 8.29 ± 5.59 8.41 ± 5.02 6.17 ± 3.78 6.75 ± 4.84 4.71 ± 2.59 5.68 ± 2.78 n.s.LL 7.64 ± 4.41 11.2 ± 17.47 6.37 ± 4.38 4.93 ± 3.03 5.67 ± 3.54 5.26 ± 3.64 6.44 ± 5.29 n.s.
n3 + n6GG 24.52 ± 6.99 22.63 ± 7.31 21.55 ± 6.53 19.59 ± 5.03 18.94 ± 6.17 16.96 ± 5.62 16.64 ± 4.54 ****LL 27.65 ± 8.06 25.57 ± 8.71 28.17 ± 6.67 29.79 ± 4.16 31.38 ± 3.73 31.06 ± 3.96 33.17 ± 5.04 ****
GG = group G, glucose-based total parenteral nutrition; LG = group L, lipid-based total; mean values ± standard deviation; n.s., non-significant, AA to EPA = C20:4 n–6/C20:5 n–3; *p < 0.001 for differences between groups, p = n.s. for changes over time, p < 0.001 for group and time interaction; ** p < 0.001 for differences between groups, p = n.s. for changes over time,p < 0.001 for group and time interaction; *** p = 0.003 for differences between groups, p = n.s. for changes over time, p = n.s. for group and time interaction; **** p = 0.001 for differencesbetween groups, p = n.s. for changes over time, p = 0.001 for group and time interaction.

Nutrients 2020, 12, 1373 8 of 17
The mead acid to arachidonic acid ratio is characteristic for EFAD. This ratio was increased onday 28 in group G, but did not meet the diagnostic threshold that is typical for essential fatty aciddeficiency (Figure 2A). This result did not reach significance owing to fewer measurements, althoughthe graph looks more convincing. We did not observe any significant differences in the serum profilesof other FAs (Table 4) and plasma triglycerides (Figure 2B).Nutrients 2020, 12, x FOR PEER REVIEW 8 of 17
Figure 2. Mead acid to arachidonic acid ratio (A) and plasma concentrations (mmol∙L−1) of triglycerides (TAG). (B) in patients receiving high glucose; lipid-free (glucose group); or low glucose, high lipid (lipid group) TPN admixtures. n.s., non-significant.
3.4. Antioxidant and Adipose Tissue Hormones
The plasma concentrations of α-tocopherol are shown in Figure 3. We found a significant increase in α–tocopherols in group L with a maximum value on day 28 compared with the baseline and with their counterparts in group G (Figure 3, p < 0.001). In order to better understand the glucose homeostasis, we evaluated plasma hormonal levels of resistin, leptin, and PAI-1 in the whole group (Table S1) and the subset of diabetic patients (Table 5). We observed a non-significant increasing trend of leptin concentrations in group G, when the biggest difference was evident on the sixth day. We observed a high concentration of resistin in both groups (Table 5).
Figure 2. Mead acid to arachidonic acid ratio (A) and plasma concentrations (mmol·L−1) of triglycerides(TAG). (B) in patients receiving high glucose; lipid-free (glucose group); or low glucose, high lipid(lipid group) TPN admixtures. n.s., non-significant.
3.4. Antioxidant and Adipose Tissue Hormones
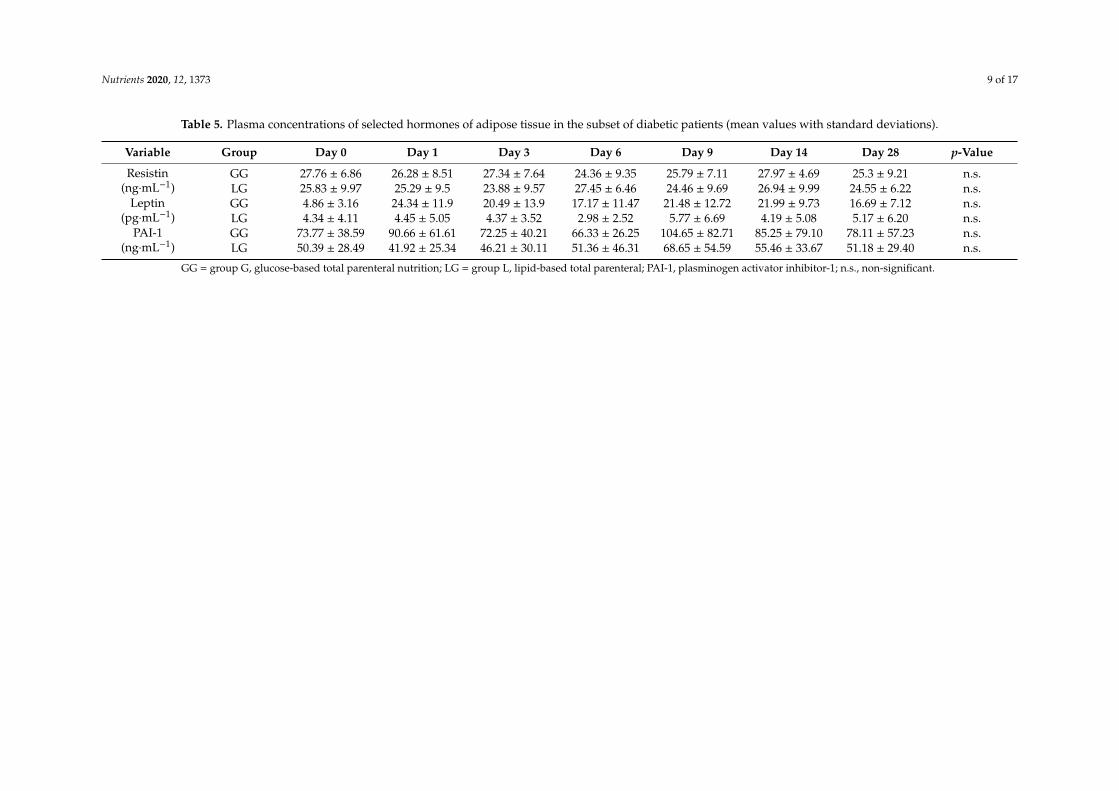
The plasma concentrations of α-tocopherol are shown in Figure 3. We found a significant increasein α–tocopherols in group L with a maximum value on day 28 compared with the baseline andwith their counterparts in group G (Figure 3, p < 0.001). In order to better understand the glucosehomeostasis, we evaluated plasma hormonal levels of resistin, leptin, and PAI-1 in the whole group(Table S1) and the subset of diabetic patients (Table 5). We observed a non-significant increasing trendof leptin concentrations in group G, when the biggest difference was evident on the sixth day. Weobserved a high concentration of resistin in both groups (Table 5).
Nutrients 2020, 12, 1373 9 of 17
Table 5. Plasma concentrations of selected hormones of adipose tissue in the subset of diabetic patients (mean values with standard deviations).
Variable Group Day 0 Day 1 Day 3 Day 6 Day 9 Day 14 Day 28 p-Value
Resistin(ng·mL−1)
GG 27.76 ± 6.86 26.28 ± 8.51 27.34 ± 7.64 24.36 ± 9.35 25.79 ± 7.11 27.97 ± 4.69 25.3 ± 9.21 n.s.LG 25.83 ± 9.97 25.29 ± 9.5 23.88 ± 9.57 27.45 ± 6.46 24.46 ± 9.69 26.94 ± 9.99 24.55 ± 6.22 n.s.
Leptin(pg·mL−1)
GG 4.86 ± 3.16 24.34 ± 11.9 20.49 ± 13.9 17.17 ± 11.47 21.48 ± 12.72 21.99 ± 9.73 16.69 ± 7.12 n.s.LG 4.34 ± 4.11 4.45 ± 5.05 4.37 ± 3.52 2.98 ± 2.52 5.77 ± 6.69 4.19 ± 5.08 5.17 ± 6.20 n.s.
PAI-1(ng·mL−1)
GG 73.77 ± 38.59 90.66 ± 61.61 72.25 ± 40.21 66.33 ± 26.25 104.65 ± 82.71 85.25 ± 79.10 78.11 ± 57.23 n.s.LG 50.39 ± 28.49 41.92 ± 25.34 46.21 ± 30.11 51.36 ± 46.31 68.65 ± 54.59 55.46 ± 33.67 51.18 ± 29.40 n.s.
GG = group G, glucose-based total parenteral nutrition; LG = group L, lipid-based total parenteral; PAI-1, plasminogen activator inhibitor-1; n.s., non-significant.

Nutrients 2020, 12, 1373 10 of 17Nutrients 2020, 12, x FOR PEER REVIEW 9 of 17
Figure 3. Plasma concentrations (µmol∙L−1) of a α-tocopherol in patients receiving high glucose; lipid-free (glucose group); or low glucose, high lipid (lipid group) TPN admixtures.
Figure 3. Plasma concentrations (µmol·L−1) of a α-tocopherol in patients receiving high glucose;lipid-free (glucose group); or low glucose, high lipid (lipid group) TPN admixtures.
4. Discussion
4.1. Plasma Total FFA and Individual FA
The physiological reference range for plasma FFA concentrations in our laboratory rangedfrom 0.100 to 0.600 mmol·L−1. In the ICU patients, Arabi et al. [7] considered a cut-off value to be0.45 mmol·L-1 in females and 0.6 mmol·L−1 in males, as the upper limits of normal. In accordancewith their cut off, 29.1% of the patients had elevated levels of FFAs at the start of the study, which wasalmost the same as the Arabi study (32.8%). The concentration of FFA before TPN was, for the mostpart, closer to the upper limit of the physiological range (Figure 1), which is in accordance with otherfindings that showed increased FFA turnover during critical illness [18,19]. The significant decrease intotal FFAs was observed after the initiation of TPN (Figure 1). As we observed, the higher dosage ofglucose in the TPN admixture led to a more marked decrease in plasma FFAs, so it is plausible thatglucose dosage plays an important role in the concentration of FFAs. The positive effect of glucose inpatients after cardiac surgery was explained by decreased FFA concentrations during glucose infusion.
In our study, the composition of the TPN admixtures influenced not only the total FFA plasmalevels, but also the relative levels of some individual FAs (Table 4 and Figure 2A) during the course ofcritical illness.
The turnover of plasma FFAs is affected by multiple factors in lipid metabolism in both healthy anddiseased states. Physiologically, the mobilization of FFAs from adipose tissue (lipolysis) is increasedby stress hormones (catecholamines, corticoids) owing to the activation of hormone sensitive lipasewith the subsequent release of FFAs into circulation [20,21]. This effect is typical during fasting, whenreleased FAs serve as an important energy source. Fatty acid mobilization also occurs during criticalillness, when the increased production of contra-regulatory hormones predominate [22]. On theother side, lipolysis is reduced mainly by the suppressing effects of insulin on hormone sensitivelipase [23,24].

Nutrients 2020, 12, 1373 11 of 17
Intravenous administration of nutrients also influences plasma FFA levels. The administration oflipid emulsion led to increased FFA concentrations in healthy volunteers [8]. The clearance of infusedFFAs in lipid emulsion is influence by the activation or inhibition of lipoprotein lipase, which releasesFAs from plasma lipoproteins. Many factors influence this important enzyme in ICU patients; a goodexample is heparin application, which releases lipoprotein lipase into the blood with rapid lipolysisoccurring for several hours [25]. The released FFAs are subsequently taken up by tissues, especiallyadipose tissue. In a post-mortem study, higher lipoprotein lipase activity was observed in samples ofadipose tissue in non-surviving critically ill patients in comparison with non-critically ill subjects [11].The lipoprotein lipase activity did not correlate with the total caloric intake of the patients, nevertheless,the effects of the individual energy substrates were not studied [11]. In the peripheral tissues, thereleased FFAs are either re-esterified with glycerol phosphate to triglycerides (especially in adiposetissue) or oxidized as a source of energy [19]. During esterification, the presence of glucose is essentialbecause glycerol-phosphate is synthetized from this substrate. In this way, glucose can directly affectthe capture of FFAs and their esterification to triglycerides in adipose tissue as well as FFA release [26].Studies with the aim to distinguish whether oxidized FFAs originate from adipose tissue or directlyfrom lipid emulsion (or both) in critically ill patients are limited. Wolfe et al. used stable isotope tracersin critical patients receiving TPN and showed that 70% of the fat component of adipose tissue energymetabolism could be accounted for by the oxidation of plasma FFA, even during the application ofexogenous lipid emulsion. His finding may imply that infused lipids are chiefly stored, rather thanbeing directly used as an energy substrate [20,27]. In that study, the exact quantity of oxidized lipids isnot clearly recognized, but as glucose oxidation in peripheral tissues decreases, lipolysis takes place ata rather rapid rate [27].
The amount and types of the major nutrients in the TPN admixtures may affect different metabolicpathways. Decreased glucose oxidation and increased FFA oxidation were observed in a studyinvolving septic animals. The authors hypothesized the important role of insulin resistance during theprogression of critical illness [19,28]. Lower plasma FFA concentrations in our study (Figure 1) canthus be explained by a decreased activity of hormone sensitive lipase and the inhibition of lipolysisin adipose tissue, together with an improvement in insulin sensitivity. Moreover, insulin-stimulatedactivity of lipoprotein lipase may enhance the clearance of lipoproteins and FFAs from circulation, andpossibly cause even larger decreases in plasma FFAs, owing to higher glucose doses in group G. It waspreviously shown that the scheme of insulin administration does not affect the concentration of insulinin circulation. An intensive insulin regimen (targeting lower glycaemia) led to lower endogenousinsulin secretion and to an increased adiponectin level and an improvement in insulin sensitivity [11,29].In our study, both groups of patients received TPN together with continuous insulin infusion via asyringe pump. Surprisingly, plasma insulin levels and the rate of insulin administration were notsignificantly different between both groups (Table 3) despite the fact that there was approximately a1.5-fold higher insulin dose in group G in comparison with group L. The high interindividual variationsin insulin dosage will require more comprehensive investigation in future. Our data demonstratedthat glucose and insulin infused together with lipid emulsion reduced the increase in plasma FFAsthat was observed in previous studies. Therefore, we suppose that both TPN admixtures in ourstudy can improve insulin sensitivity, with an even better effect in group G. The larger decrease ofplasma FFA in critically ill patients who received a glucose-based TPN could be a result of severalfactors; that is, moderately increased rate of insulin administration, the absence of lipid emulsion inthe TPN admixture, and a higher dose of infused glucose. We cannot determine whether the decreaseof plasma FFA was the result of the cessation of lipolysis, a change in lipogenesis, or the oxidation ofFFA. However, the decreased level of plasma FFA was a direct result of the parenteral nutrition itself,as during the early phase of critical illness, the spontaneous decrease in plasma FFAs is unlikely to bethe result of the inflammatory mediators and stress hormones mentioned above.
The storage and subsequent utilization of endogenous lipid stores for energy metabolisms appearsto be extremely important in critical disease states that are prolonged, because it protects proteins

Nutrients 2020, 12, 1373 12 of 17
and glucose for metabolic purposes not related to energy consumption [30]. According to our results,the decrease in FFA concentration was higher with a cumulative dosage of glucose. The differencebetween the G and L groups was most pronounced in the late state (day 28), whereas the early statewas not statistically significant (Figure 1).
It was previously suggested that administration of lipid emulsion to the critically ill can modulatethe immune response throughout the alteration of theω–3/ω–6 ratio. This modification is also affectedby the type and quantity of administered FAs. The lipid emulsion that was infused in our studycontained 30% soybean oil, 30% medium chain triglycerides, 25% olive oil, and 15% fish oil. Thislipid emulsion was designed specifically to modify the immune response during severe inflammatoryreactions through the reduction ofω–6 FFAs and an increase in the intake ofω–3 FFAs, with the aimto modify inflammatory reactions and subsequently decrease the incidence of nosocomial infections,improve survival rates, and decrease hospital stays [31,32]. Conversely, Umpierrez et al. did not findany benefits associated with a decreased intake of ω–6 fatty acids owing to the administration of oliveoil lipid emulsion in comparison with those receiving soybean oil lipid emulsion in a group of mixedICU patients [33].
In our study, neither the TPN given to group G nor to group L altered the mainω–6 arachidonicacid (C20:4)/ω–3 eicosapentaenoic acid (C20:5) ratios in circulating FFAs. We found, however, higherproportions of docosahexaenoic acid (C22:6ω–3) and α–linoleic acid (C18:2ω–6) in the lipid group(Table 4). The oleic acid concentration was not different between the groups, despite the fact thatgroup L received higher amounts of oleic acid (C18:1 ω–9) and group G did not receive any FFAs(Table 3). A possible explanation for this finding is that there is a large endogenous pool of fatty acidsin adipose tissue and these acids can be mobilized during physiological stress. Moreover, oleic acid canbe also synthesized in humans. The extended statistical analysis did not find any significant changesin the proportion of saturated or monounsaturated FAs between our groups. There was found to bea significantly higher proportion of the sums of ω–3 and ω–6 fatty acids in group L, and this wasmainly because of a higher proportion of linoleic acid (C18:2 ω–6) (Table 4). Experimental studieson rats showed thatω–3 andω–6 fatty acid supplementation can inhibit de novo lipogenesis [34,35],which is also increased by a fat-free diet [36]. Increased de novo lipogenesis is characterized by a highproportion of circulating palmitic and stearic acids and increased desaturase 9 activity [34]. No suchalterations were apparent in our study (Table 4).
The provision of specific types of TPN admixtures for several weeks significantly changed theconcentrations of total FFAs in plasma. From a clinical point of view, it has been reported that highconcentrations of FFA are present in patients with acute respiratory distress syndrome or sepsis [7,37].Thus, FFA modulation may be important in positively influencing the inflammatory markers; however,the exact mechanism is unclear. The relative proportions of a large majority of the monitored FFA,even when compared with modern lipid emulsions in the TPN admixtures, were without significantchanges. We also did not confirm the previous findings of a modification of the ω–3/ω–6 ratios bylipid emulsion. The heterogenity of the study populations, the types, and the dosage of the nutrients,as well as the treatment duration, are all potential confounders and sources of bias that potentiallycontributed to the variability of the result of the studies mentioned above. The complex metabolism ofpolyunsaturated FAs and the unpredictability of which pro-inflammatory and anti-inflammatory endproducts would result make the generalization of the results more difficult [38]. We hypothesize thatthe amount and composition of endogenous fat stores appear to be decisive for the composition of theindividual FAs pool during the first weeks of a critical disease state.
4.2. Adipose Tissue Derived Hormones and Glucose Homeostasis
Adipose tissue is an important endocrine organ that releases hormones and cytokines that affectboth the body’s metabolism and immune functions [39]. In this study, we measured the concentrationsof leptin and resistin, which are secreted by adipose tissue and play major roles in glucose metabolism;leptin increases, whereas resistin decreases insulin sensitivity [40]. However, there are only a few

Nutrients 2020, 12, 1373 13 of 17
studies showing the relationship between resistin and leptin in critically ill patients. Increased levelsof resistin were associated with poor outcomes in ICU patients and correlated with the presenceof inflammatory markers [39,41]. In our study, we found the plasma resistin concentrations in thesubset of diabetic patients higher than the physiological range (i.e., <10 ng·ml−1) (Table 5). Nostatistically significant difference of plasma resistin concentration was apparent during the course ofboth types of TPN. On the other side, we found a non-significant increase in plasma leptin in group Gin comparison with group L, for up to 28 days, the biggest difference was observed on day 6 of TPNadministration (Table 5). A similar result was made by McCowen et al., who described an increase inleptin concentration three days after the initiation of TPN [42]. These results may indicate a role of thishormone in insulin resistance in ICU patients.
Despite the big differences in glucose dosage during TPN, there were no significant differences inthe insulin infusion rates and the insulin plasma levels between both the G and L groups (Table 3). Thismay suggest that a majority of the provided glucose is metabolized in non-insulin dependent pathwaysand that glycaemia and insulin requirements are not closely connected with the actual glucose dosage.According to our data, glucose in TPN does not worsen the insulin resistance of ICU patients duringthe progression of critical illness for both diabetic as well as non-diabetic patients (Table 3).
4.3. Metabolic Alterations
There are several metabolic side effects that are associated with intravenous nutrition. Longperiods of a fat-free diet can lead to EFAD. This condition is very rare and more often seen in adultsafter having undergone complicated gastrointestinal tract surgery [43]. The development of EFAD isusually preceded by biochemical abnormalities, namely alterations in the triene/tetraene ratio (>0.4 forEFAD), the accumulation of mead acid (20:3ω-9), and decreased concentrations of linoleic acid (C18:2,ω-6) [44]. In our study, we found a gradual decrease in linoleic acid (C18:2, ω-6) in group G and atrend of increased triene/tetraene ratios up to the 28th day of the study (Table 4), suggesting a need forcaution when administering long-term TPN without a lipid component. Low doses of lipid emulsions(e.g., 100 g once per week) in the TPN admixture can potentially decrease the incidence of EFAD, asindicated in the guidelines [4].
Hypertriglyceridemia is a relatively frequent complication associated with the use of parenteralnutrition with high amounts of macronutrients. However, several simultaneous critical conditionsmake the distinction between the changes caused by organ hypoperfusion and the changes due to theside effects of TPN almost impossible to determine [45]. In our study, triglyceride concentrations werein the normal range during the whole period and there were no significant differences between thestudy groups (Figure 2B).
Parenteral nutrition can be also associated with coagulation disorders, such as fibrinolytic systemactivation. A correlation between LE and PAI-1 reduction was previously found [46]. In this study, weobserved only non-significant trends towards decreased PAI-1 in group L and towards an increase ingroup G (Table 5). This corresponded with the results of Van der Poll, who did not find a significanteffect of TPN on the PAI-1 level in plasma [47].
Low concentrations of vitamin E and other antioxidants have been reported in patients onTPN. Vitamin E protects against the oxidation of polyunsaturated FA, and thus may contribute tothe stabilization of cell membranes, and α-tocopherol is the compound with the highest vitamin Eactivity [48]. In our study, group L received an average of four times the dose of α-tocopherol comparedwith group G (86 mg vs. 20 mg), because of its inclusion in the lipid emulsion. We observed a gradualand statistically significant increase in α-tocopherol concentration with values ranging between 30 and40 µmol·L−1 on day 28 in group L (Figure 3). These values were well above the vitamin E deficiencythreshold of 11.6 µmol·L−1 [48]. Surprisingly, the α-tocopherol concentration in group G did notchange over time, and was above the deficiency threshold until day 28. These results indicate that therewas a sufficient supplementation of α-tocopherol in group G, who received vitamin supplementation

Nutrients 2020, 12, 1373 14 of 17
(Cernevit); however, we cannot exclude vitamin E deficiency in tissues despite normal serum levels,which were previously reported [49].
5. Conclusions
The administration of both glucose and lipid plus glucose TPN admixtures resulted in a significantdecrease in plasma FFAs. This decrease was more pronounced in lipid-free TPN. Glucose administrationdid not increase insulin resistance in critically ill patients. We also found changes in the types ofindividual FAs. After 28 days of lipid-free TPN, the biomarkers of EFAD were apparent. Therefore, weadvise to include a lipid emulsion at the latest from three weeks of TPN to prevent EFAD syndrome.Larger prospective, randomized trials with comparable TPN regimens are required to further evaluatethe influence of different glucose and lipid doses on the inflammatory markers and clinical outcomes.
Supplementary Materials: The following are available online at http://www.mdpi.com/2072-6643/12/5/1373/s1,Figure S1: Flow diagram for patients enrolled in the study, Table S1: Plasma concentrations of selected hormonesof the adipose tissue.
Author Contributions: Conceptualization, P.S., O.S., J.F., J.M., V.B., J.M.H., and L.S.; Data curation, P.S., O.S., A.T.,and J.F.; Formal analysis, P.S. and J.V.; Funding acquisition, V.B., J.M.H., and L.S.; Investigation, P.S., O.S., A.T., J.F.,and L.S.; Methodology, A.T. and L.S.; Writing—original draft, P.S., O.S., J.F., and L.S.; Writing—review & editing,J.V., A.T., J.M., V.B., and J.M.H. All authors have read and agreed to the published version of the manuscript.
Funding: This work was supported by the Long-term Organization Development Plan 1011 FVZ UO and ProgressQ40/12 LF UK HK.
Acknowledgments: We wish to thank Cyrus Rasti for his contribution in editing this article and makingsuggestions concerning the English language content of the manuscript.
Conflicts of Interest: The authors declare no conflict of interest. The funders had no role in the design of thestudy; in the collection, analyses, or interpretation of data; in the writing of the manuscript; or in the decision topublish the results.
Abbreviations
ICU Intensive Care UnitTPN Total Parenteral NutritionFFA Free Fatty AcidsFA Fatty AcidsEFAD Essential Fatty Acid DeficiencyIBW Ideal Body WeightPAI-1 Plasminogen Activator Inhibitor
References
1. Singer, P.; Blaser, A.R.; Berger, M.M.; Alhazzani, W.; Calder, P.C.; Casaer, M.P.; Hiesmayr, M.; Mayer, K.;Montejo, J.C.; Pichard, C.; et al. ESPEN guideline on clinical nutrition in the intensive care unit. Clin. Nutr.2019, 38, 48–79. [CrossRef] [PubMed]
2. Barazzoni, R.; Deutz, N.E.P.; Biolo, G.; Bischoff, S.; Boirie, Y.; Cederholm, T.; Cuerda, C.; Delzenne, N.; LeonSanz, M.; Ljungqvist, O.; et al. Carbohydrates and insulin resistance in clinical nutrition: Recommendationsfrom the ESPEN expert group. Clin. Nutr. 2017, 36, 355–363. [CrossRef] [PubMed]
3. Calder, P.C.; Adolph, M.; Deutz, N.E.; Grau, T.; Innes, J.K.; Klek, S.; Lev, S.; Mayer, K.; Michael-Titus, A.T.;Pradelli, L.; et al. Lipids in the intensive care unit: Recommendations from the ESPEN Expert Group. Clin.Nutr. 2018, 37, 1–18. [CrossRef]
4. McClave, S.A.; Taylor, B.E.; Martindale, R.G.; Warren, M.M.; Johnson, D.R.; Braunschweig, C.; McCarthy, M.S.;Davanos, E.; Rice, T.W.; Cresci, G.A.; et al. Guidelines for the Provision and Assessment of Nutrition SupportTherapy in the Adult Critically Ill Patient. JPEN J. Parenter. Enteral Nutr. 2016, 40, 159–211. [CrossRef][PubMed]
Nutrients 2020, 12, 1373 15 of 17
5. Soeters, P.; Bozzetti, F.; Cynober, L.; Elia, M.; Shenkin, A.; Sobotka, L. Meta-analysis is not enough: Thecritical role of pathophysiology in determining optimal care in clinical nutrition. Clin. Nutr. 2016, 35, 748–757.[CrossRef] [PubMed]
6. Boden, G. Obesity, insulin resistance and free fatty acids. Curr. Opin. Endocrinol. Diabetes Obes. 2011, 18,139–143. [CrossRef]
7. Arabi, Y.M.; Tamimi, W.; Jones, G.; Jawdat, D.; Tamim, H.; Al-Dorzi, H.M.; Sadat, M.; Afesh, L.; Sakhija, M.;Al-Dawood, A. Free Fatty Acids’ Level and Nutrition in Critically Ill Patients and Association with Outcomes:A Prospective Sub-Study of PermiT Trial. Nutrients 2019, 11, 384. [CrossRef]
8. Krogh-Madsen, R.; Plomgaard, P.; Akerstrom, T.; Moller, K.; Schmitz, O.; Pedersen, B.K. Effect of short-termintralipid infusion on the immune response during low-dose endotoxemia in humans. Am. J. Physiol.Endocrinol. Metab. 2008, 294, E371–E379. [CrossRef]
9. Carvalho, G.; Pelletier, P.; Albacker, T.; Lachapelle, K.; Joanisse, D.R.; Hatzakorzian, R.; Lattermann, R.;Sato, H.; Marette, A.; Schricker, T. Cardioprotective effects of glucose and insulin administration whilemaintaining normoglycemia (GIN therapy) in patients undergoing coronary artery bypass grafting. J. Clin.Endocrinol. Metab. 2011, 96, 1469–1477. [CrossRef]
10. Kalupahana, N.S.; Voy, B.H.; Saxton, A.M.; Moustaid-Moussa, N. Energy-restricted high-fat diets onlypartially improve markers of systemic and adipose tissue inflammation. Obesity 2011, 19, 245–254. [CrossRef]
11. Langouche, L.; Perre, S.V.; Thiessen, S.; Gunst, J.; Hermans, G.; D’Hoore, A.; Kola, B.; Korbonits, M.; Van denBerghe, G. Alterations in adipose tissue during critical illness: An adaptive and protective response? Am. J.Respir. Crit. Care Med. 2010, 182, 507–516. [CrossRef]
12. Devine, B.J. Gentamicin therapy. Drug Intell. Clin. Pharm. 1974, 8, 650–655. [CrossRef]13. Saluk, J.; Hoppensteadt, D.; Syed, D.; Liles, J.; Abro, S.; Walborn, A.; Bansal, V.; Fareed, J. Biomarker profiling
of plasma samples utilizing RANDOX biochip array technology. Int. Angiol. 2017, 36, 499–504. [CrossRef][PubMed]
14. Solichova, D.; Blaha, M.; Aufartova, J.; Krcmova, L.K.; Plisek, J.; Honegrova, B.; Kasalova, E.; Lanska, M.;Urbanek, L.; Sobotka, L. The Effect of LDL-Apheresis and Rheohaemapheresis Treatment on Vitamin E. J.Nutr. Sci. Vitaminol. 2015, 61, 105–112. [CrossRef] [PubMed]
15. Noguchi, K.; Gel, Y.R.; Brunner, E.; Konietschke, F. nparLD: An R Software Package for the NonparametricAnalysis of Longitudinal Data in Factorial Experiments. J. St. Softw. 2012, 50, 23. [CrossRef]
16. Holm, S. A Simple Sequentially Rejective Multiple Test Procedure. Scand. J. Stat. 1979, 6, 65–70. [CrossRef]17. Team, R.C. R: A Language and Environment for Statistical Computing; R Foundation for Statistical Computing:
Vienna, Austria, 2019; Available online: https://www.R-project.org/ (accessed on 2 April 2020).18. Levinson, M.; Groeger, J.; Jeevanandam, M.; Brennan, M.F. Free fatty acid turnover and lipolysis in septic
mechanically ventilated cancer-bearing humans. Metabolism 1988, 37, 618–625. [CrossRef]19. Shaw, J.H.; Wolfe, R.R. Response to glucose and lipid infusions in sepsis: A kinetic analysis. Metabolism 1985,
34, 442–449. [CrossRef]20. Wolfe, R.R. Sepsis as a modulator of adaptation to low and high carbohydrate and low and high fat intakes.
Eur. J. Clin. Nutr. 1999, 53, S136–S142. [CrossRef]21. Wolfe, R.R.; Herndon, D.N.; Peters, E.J.; Jahoor, F.; Desai, M.H.; Holland, O.B. Regulation of lipolysis in
severely burned children. Ann. Surg. 1987, 206, 214–221. [CrossRef]22. Langin, D. Adipose tissue lipolysis as a metabolic pathway to define pharmacological strategies against
obesity and the metabolic syndrome. Pharmacol. Res. 2006, 53, 482–491. [CrossRef] [PubMed]23. Marques, M.B.; Langouche, L. Endocrine, metabolic, and morphologic alterations of adipose tissue during
critical illness. Crit. Care Med. 2013, 41, 317–325. [CrossRef] [PubMed]24. Carpentier, A.C.; Frisch, F.; Cyr, D.; Genereux, P.; Patterson, B.W.; Giguere, R.; Baillargeon, J.P. On the
suppression of plasma nonesterified fatty acids by insulin during enhanced intravascular lipolysis in humans.Am. J. Physiol. Endocrinol. Metab. 2005, 289, E849–E856. [CrossRef] [PubMed]
25. Stegmayr, B.; Olivecrona, T.; Olivecrona, G. Lipoprotein lipase disturbances induced by uremia andhemodialysis. Semin. Dial. 2009, 22, 442–444. [CrossRef] [PubMed]
26. Gonzales, A.M.; Orlando, R.A. Role of adipocyte-derived lipoprotein lipase in adipocyte hypertrophy. Nutr.Metab. 2007, 4, 22. [CrossRef]

Nutrients 2020, 12, 1373 16 of 17
27. Goodenough, R.D.; Wolfe, R.R. Effect of total parenteral nutrition on free fatty acid metabolism in burnedpatients. JPEN J. Parenter. Enteral Nutr. 1984, 8, 357–360. [CrossRef]
28. Shaw, J.H.; Wolfe, R.R. An integrated analysis of glucose, fat, and protein metabolism in severely traumatizedpatients. Studies in the basal state and the response to total parenteral nutrition. Ann. Surg. 1989, 209, 63–72.[CrossRef]
29. Langouche, L.; Vander Perre, S.; Wouters, P.J.; D’Hoore, A.; Hansen, T.K.; Van den Berghe, G. Effect ofintensive insulin therapy on insulin sensitivity in the critically ill. J. Clin. Endocrinol. Metab. 2007, 92,3890–3897. [CrossRef]
30. Soeters, M.R.; Soeters, P.B. The evolutionary benefit of insulin resistance. Clin. Nutr. 2012, 31, 1002–1007.[CrossRef]
31. Dai, Y.J.; Sun, L.L.; Li, M.Y.; Ding, C.L.; Su, Y.C.; Sun, L.J.; Xue, S.H.; Yan, F.; Zhao, C.H.; Wang, W. Comparisonof Formulas Based on Lipid Emulsions of Olive Oil, Soybean Oil, or Several Oils for Parenteral Nutrition: ASystematic Review and Meta-Analysis. Adv. Nutr. 2016, 7, 279–286. [CrossRef]
32. Jia, Z.Y.; Yang, J.; Xia, Y.; Tong, D.N.; Zaloga, G.P.; Qin, H.L. Safety and efficacy of an olive oil-basedtriple-chamber bag for parenteral nutrition: A prospective, randomized, multi-center clinical trial in China.Nutr. J. 2015, 14, 119. [CrossRef] [PubMed]
33. Umpierrez, G.E.; Spiegelman, R.; Zhao, V.; Smiley, D.D.; Pinzon, I.; Griffith, D.P.; Peng, L.; Morris, T.;Luo, M.; Garcia, H.; et al. A double-blind, randomized clinical trial comparing soybean oil-based versusolive oil-based lipid emulsions in adult medical-surgical intensive care unit patients requiring parenteralnutrition. Crit. Care Med. 2012, 40, 1792–1798. [CrossRef] [PubMed]
34. Ling, P.-R.; Andersson, C.; Strijbosch, R.; Lee, S.; Silvestri, A.; Gura, K.M.; Puder, M.; Bistrian, B.R. Effectsof glucose or fat calories in total parenteral nutrition on fat metabolism and systemic inflammation in rats.Metabolism 2011, 60, 195–205. [CrossRef] [PubMed]
35. Wilson, M.D.; Blake, W.L.; Salati, L.M.; Clarke, S.D. Potency of polyunsaturated and saturated fats asshort-term inhibitors of hepatic lipogenesis in rats. J. Nutr. 1990, 120, 544–552. [CrossRef] [PubMed]
36. Teran-Garcia, M.; Adamson, A.W.; Yu, G.; Rufo, C.; Suchankova, G.; Dreesen, T.D.; Tekle, M.; Clarke, S.D.;Gettys, T.W. Polyunsaturated fatty acid suppression of fatty acid synthase (FASN): Evidence for dietarymodulation of NF-Y binding to the Fasn promoter by SREBP-1c. Biochem. J. 2007, 402, 591–600. [CrossRef][PubMed]
37. Mayer, K.; Gokorsch, S.; Fegbeutel, C.; Hattar, K.; Rosseau, S.; Walmrath, D.; Seeger, W.; Grimminger, F.Parenteral nutrition with fish oil modulates cytokine response in patients with sepsis. Am. J. Respir. Crit.Care Med. 2003, 167, 1321–1328. [CrossRef]
38. Das, U.N. n-3 fatty acids, γ-linolenic acid, and antioxidants in sepsis. Crit. Care 2013, 17, 312. [CrossRef]39. Hajri, T.; Gharib, M.; Kaul, S.; Karpeh, M.S., Jr. Association between adipokines and critical illness outcomes.
J Trauma Acute Care Surg. 2017, 83, 507–519. [CrossRef]40. Paz-Filho, G.; Mastronardi, C.; Wong, M.-L.; Licinio, J. Leptin therapy, insulin sensitivity, and glucose
homeostasis. Indian J. Endocrinol. Metab. 2012, 16, S549–S555. [CrossRef]41. Koch, A.; Gressner, O.A.; Sanson, E.; Tacke, F.; Trautwein, C. Serum resistin levels in critically ill patients are
associated with inflammation, organ dysfunction and metabolism and may predict survival of non-septicpatients. Crit. Care 2009, 13, R95. [CrossRef]
42. McCowen, K.C.; Ling, P.R.; Friel, C.; Sternberg, J.; Forse, R.A.; Burke, P.A.; Bistrian, B.R. Patterns of plasmaleptin and insulin concentrations in hospitalized patients after the initiation of total parenteral nutrition. Am.J. Clin. Nutr. 2002, 75, 931–935. [CrossRef] [PubMed]
43. Barr, L.H.; Dunn, G.D.; Brennan, M.F. Essential fatty acid deficiency during total parenteral nutrition. Ann.Surg. 1981, 193, 304–311. [CrossRef] [PubMed]
44. Gramlich, L.; Meddings, L.; Alberda, C.; Wichansawakun, S.; Robbins, S.; Driscoll, D.; Bistrian, B. EssentialFatty Acid Deficiency in 2015: The Impact of Novel Intravenous Lipid Emulsions. JPEN J. Parenter. EnteralNutr. 2015, 39, 61s–66s. [CrossRef] [PubMed]
45. Llop, J.; Sabin, P.; Garau, M.; Burgos, R.; Perez, M.; Masso, J.; Cardona, D.; Sanchez Segura, J.M.; Garriga, R.;Redondo, S.; et al. The importance of clinical factors in parenteral nutrition-associated hypertriglyceridemia.Clin. Nutr. 2003, 22, 577–583. [CrossRef]
46. Altomare, D.F.; Semeraro, N.; Colucci, M. Reduction of the plasma levels of tissue plasminogen activatorafter infusion of a lipid emulsion in humans. JPEN J. Parenter. Enteral Nutr. 1993, 17, 274–276. [CrossRef]

Nutrients 2020, 12, 1373 17 of 17
47. Van der Poll, T.; Levi, M.; Braxton, C.C.; Coyle, S.M.; Roth, M.; ten Cate, J.W.; Lowry, S.F. Parenteral NutritionFacilitates Activation of Coagulation but Not of Fibrinolysis during Human Endotoxemia. Int. J. Infect. Dis.1998, 177, 793–795. [CrossRef]
48. Biesalski, H.K. Vitamin E requirements in parenteral nutrition. Gastroenterology 2009, 137, S92–S104.[CrossRef]
49. Steephen, A.C.; Traber, M.G.; Ito, Y.; Lewis, L.H.; Kayden, H.J.; Shike, M. Vitamin E status of patientsreceiving long-term parenteral nutrition: Is vitamin E supplementation adequate? JPEN J. Parenter. EnteralNutr. 1991, 15, 647–652. [CrossRef]
© 2020 by the authors. Licensee MDPI, Basel, Switzerland. This article is an open accessarticle distributed under the terms and conditions of the Creative Commons Attribution(CC BY) license (http://creativecommons.org/licenses/by/4.0/).