the impact of foreign direct investment on co2 …
TRANSCRIPT
International Journal of Scientific & Engineering Research Volume 9, Issue 2, February-2018 2061 ISSN 2229-5518
IJSER © 2018 http://www.ijser.org
THE IMPACT OF FOREIGN DIRECT INVESTMENT ON CO2 EMISSION IN NIGERIA
(1980 - 2014) Olukayode Emmanuel, MAKU1
Department of Economics, Olabisi Onabanjo University, Ago-Iwoye, Ogun State, Nigeria
Soliu Bidemi, ADEGBOYEGA Department of Economics, Olabisi Onabanjo University, Ago-Iwoye, Ogun State, Nigeria
Aduralere Opeyemi, OYELADE University of Ibadan, Nigeria.
The study investigated the impact of foreign direct investment on CO2 emission in Nigeria over the period 1980 to 2014. Econometric techniques which included correlation analysis, unit root test, co-integration, error correction model were employed to determine the direction and the magnitude of impacts. Findings from the analysis revealed gross domestic product positively influence CO2 emission in Nigeria and was insignificant while foreign direct investment and energy consumption have negative impact on CO2 emission in Nigeria but not significant. Also gross domestic product per capita, foreign direct investment and energy consumption in one year lag (-1) have negative impact on CO2 emission in Nigeria but only energy consumption was significant at 10% level of significant. Furthermore, gross domestic product per capita, foreign direct investment and energy consumption in two year lag (-2) have a negative impact on CO2 emission in Nigeria but only foreign direct investment is significant at 10% level of significant. Furthermore, gross domestic product per capita, foreign direct investment and energy consumption in three year lag (-3) have a positive impact on CO2 emission in Nigeria but all the variables are insignificant. The result of ECM indicated that the model seems to be good as it satisfies the diagnostic test and also has an adjusted R-Squared (R2) value of 0.413645, which indicate that only about 45.64% of the total systematic variation in CO2 emission in Nigeria is not accounted for by the explanatory variables all taken together. The Durbin Watson (DW) statistics value of 1.701254 shows that there is no serious problem of serial correlation and heteroskedasticity. The error term is also found to be normally distributed and it will take approximately six years and some months for full adjustments to take place after a shock has occurred. Keywords: Foreign Direct Investment, CO2 Emission and Economic Growth . JEL Classification: Q43.
1.1 Introduction During the last two centuries, human activities have increased
the concentration of greenhouse gases (GHG) in the
atmosphere considerably. The most important increase has
been that of carbon dioxide (CO2), which is emitted when
burning fossil fuels such as coal, oil, and natural gas. For the
10,000 years prior to the 19th century, accumulated CO2
remained between 260 and 290 parts per million (ppm), then
suddenly started to increase rapidly. At present, accumulated
CO2 is above 385 ppm and is increasing annually by an
average amount of 2 ppm [1] Greenhouse gases form a
“blanket” of pollution that traps heat in the atmosphere,
causing climate instability characterized by severe weather
events such as storms, droughts, floods, heat waves, and
rising sea levels. According to the IPCC, an 80 percent
reduction in global greenhouse gas emissions by 2050 is
essential in order to avert the worst effects of climate change
[10]
Earth’s surface temperature is the outcome of energy
flows that are dynamic, sensitively re-adjusting to a fluid
balance of forces. The incoming warmth from the sun and the
IJSER

International Journal of Scientific & Engineering Research Volume 9, Issue 2, February-2018 2062 ISSN 2229-5518
IJSER © 2018 http://www.ijser.org
internal heat from the molten core beneath the mantle are
continuously being radiated out into space, and the difference
between these rates of warming and cooling creates the
surface temperatures we must cope with [29]. The
atmosphere ultimately governs this race between heating and
cooling by acting as a “valve” regulating the rate of heat loss
from infrared radiation into space, and the size of this valve is
mainly due to CO2. CO2 captures heat, acting like a gaseous
blanket over the planet. Although heat still works its way out
through this chemical blanket, the blanket slows its progress
enough to retard cooling and raise the global surface
temperature. If it were not for naturally occurring levels of
atmospheric CO2 in the past, the surface temperature of our
planet would be below freezing (–18c), liquid water would
not exist, and life as we know it impossible [29].
Developing countries are increasingly aware of the
role of foreign direct investment (FDI) as an engine of growth
in their economies. Foreign investors can contribute to growth
by providing much needed capital and skills, by sharing risks
in large projects and by serving as a vehicle for technology
transfer. For many developing countries, FDI is a mechanism
by which to promote industries in which they have a potential
comparative advantage that cannot otherwise be
exploited.FDI contributes to these countries’ economic
development, which in turn affecting their energy demand
and environmental degradation [22]
Furthermore, foreign direct investment (FDI) inflow
has increased during the past twenty years in almost every
nation of the world including Nigeria revitalizing the long
debate in both academic and policy spheres on their
advantages and related costs [21] One aspect of the debate
argues that FDI provide direct capital financing generating
positive externalities and stimulate economic growth via
technology transfer. While part of other aspect of the debate is
that FDI inflow and their activities in the host country leads to
energy consumption and carbon dioxide emissions which
release toxic substances that pollute and degrade the natural
environment. The increase threat of greenhouse gases and
global warming along with climate change has called for
more attention and discussion on the danger of its
consequences on the natural environment [21]. Therefore, this
study is set to investigate the impact of foreign direct
investment on CO2 emission in Nigeria.
Specifically, this study intends to determine the effect of
foreign direct investment, gross domestic product per capita
and energy consumption on CO2 emission in Nigeria, and
how relative importance of foreign direct investment, gross
domestic product per capita and energy consumption on CO2
emission in Nigeria. Lastly to examine the short-run and long-
run relationship among the variables under study.
The study is organized into five sections. The introduction
captures section one, followed by section two that covers the
literature review which includes the theoretical review,
methodology and empirical review. Section three focuses on
theoretical framework and methodology while section four
deals with discussion and interpretation of results. Finally,
section five deals with summary and conclusion.
2. Literature Review 2.1 Theoretical Review 2.1.1 Environmental Kuznets curve (EKC) In 1991, [13] found that the long-term relationship between
economic growth and environment quality was an inverted
U-shaped curve. The phenomenon has been labeled as
Environmental Kuznets Curve (EKC) by [24] later. The EKC
hypothesizes that environment quality deteriorates with the
increase of per capita income at the early stage of economic
growth and gradually improves when the country reaches to
a certain level of affluence. Developed countries have fairly
stable production structures, whereas rapidly industrializing
IJSER

International Journal of Scientific & Engineering Research Volume 9, Issue 2, February-2018 2063 ISSN 2229-5518
IJSER © 2018 http://www.ijser.org
and developing countries have unstable production structure
and the effects of structural change on emissions may be less
obvious. The primary sector (agriculture, fisheries, forestry,
and mining) tends to be more resource-intensive than either
the secondary (industry) or tertiary (services) sectors. The
industry (especially manufacturing), on the other hand, tends
to be more pollution-intensive than either agriculture or
services. Since the structure of the economy (sectoral
composition of output) changes with economic growth, part
of the effect of increases in income per capita on
environmental degradation reflects the effects of changing
composition of output. In the case of pollution, economic
structure is represented by the share of industry in GDP and
expects a positive relationship with environmental
degradation. Since the share of industry in GDP first rises
with economic growth and then declines as the country
moves from the pre-industrial to the post-industrial stage of
development, an inverted-U shaped relationship between
environmental pollution and income level are expected while
controlling for all other influences transmitted through
income.
The importance of trade in combination with
composition of economic activity is investigated in the
decomposition of EKC for CO2 concentrations across
countries [17]. People, at low-income levels, are more
concerned with food and other material needs and less
concerned with environmental quality. People, at higher
income levels, begin to demand higher levels of
environmental quality to go along with their increased
prosperity. The modified EKC analysis can be used to
compare the differences in EKC between countries
(developed and developing specifically, as long as enough
data exists) due for instance to inter-country variations in the
presence of corruption. One of the determinants of
environmental policy is the socio political regime of a
particular country. Corruption and rent-seeking behaviour
can influence the relationship between income and
environment [20]. However, for any level of per capita
income, the pollution levels corresponding to corrupt
behavior are always above the socially optimal level. So, the
turning point of EKC takes place at income and pollution
levels above those corresponding to the social optimum,
which depends on the existing social institutions. Institutional
changes triggered by citizens’ demand for cleaner
environments are more likely to occur in developed countries
than in developing.
2.1.2 Halo Effect Hypothesis The halo effect follows the productivity literature in spirit,
which examines the productivity spillovers by FDI both at the
firm and macroeconomic levels. The rationale behind
potential environmental spillovers is that the possibility that
multinaltional corporations (MNCs) encourage the
dissemination of environmentally clean technologies and
management practices. This occurs if the foreign firm engages
in contracts only with environmentally responsible domestic
counterparts. This may happen under shareholder pressure at
the MNC or because of practices established at the MNCs
based on its home country environmental regulations and
standards. Further environmental knowledge can disseminate
through the movement of trained workers from foreign to
domestic firms or because of a direct competition of domestic
firms with the MNCs. The literature on environmental
spillovers from FDI confines to only case studies of specific
countries’ manufacturing industry firms. The evidence with
respect to the halo hypothesis has been mixed.
2.1.3 Pollution Haven Hypothesis
The original pollution haven hypothesis [8] states that as
trade is liberalized, industries that pollute shift from rich
IJSER
International Journal of Scientific & Engineering Research Volume 9, Issue 2, February-2018 2064 ISSN 2229-5518
IJSER © 2018 http://www.ijser.org
countries with tight regulation to poor countries with weak
regulation and conversely, clean industries migrate towards
rich countries. The pollution haven hypothesis has three
dimensions. The first is the relocation of heavy polluting
industries from developed countries with stringent
environmental policies to developing countries where similar
policies do not exist, are lax or not enforced. Accordingly,
global free trade would encourage polluting industries and
processes to move to countries with weak environmental
policy. The second dimension is the dumping of hazardous
waste generated from developed countries (industrial and
nuclear energy production), in developing countries. This
issue was the subject of the Basle Convention on hazardous
waste. The last dimension is the unrestrained extraction of
non-renewable natural resources in developing countries by
multinational corporations engaged in producing petroleum
and petroleum products, timber and other forest resources,
etc. All the dimensions relate to conscious decisions on
environmental policy and how they impact on the
environment, future production and trade.
This theory addressed pollution haven in three ways.
(i) The relation between exports and regulation. Since
regulation increases cost, the exports of countries with more
stringent regulations become relatively more expensive than
those with lax regulation. Therefore their exports decline and
their imports of relatively dirty goods rise. (ii) The shift in the
pattern of trade in pollution-intensive goods: despite evidence
supporting this hypothesis [11], this may be due to various
factors such as increase in demand for products in the
developing countries, development of endowments that
develop these industries. (iii) Accordingly, high regulatory
costs are likely to deter firms’ investment decisions. At the
international level, the specific question that is addressed is
whether FDI in polluting industries increased towards
developing countries.
2.1.4 Porter Hypothesis According to [25] “Strict environmental regulations do not
inevitably hinder competitive advantage against rivals;
indeed, they often enhance it.” He went on to suggest various
mechanisms by which environmental regulations might
enhance competitiveness, such as reduction in the use of
costly chemicals or lower waste disposal costs. The traditional
view of environmental regulation held by virtually all
economists until that time was that requiring firms to reduce
an externality like pollution necessarily restricted their
options and thus by definition reduced their profits. After all,
if profitable opportunities existed to reduce pollution, profit
maximizing firms would already be taking advantage of those
opportunities.
The traditional view among economists and
managers concerning environmental protection is that it
comes at an additional cost imposed on firms, which may
erode their global competitiveness. Environmental
regulations (ER) such as technological standards,
environmental taxes, or tradable emissions permits force
firms to allocate some inputs (labor, capital) to pollution
reduction, which is unproductive from a business perspective.
Technological standards restrict the choice of technologies or
inputs in the production process. Taxes and tradable permits
charge firms for their emissions pollution, a by-product of the
production process that was free before. These fees
necessarily divert capital away from productive investments.
This traditional paradigm was challenged by a number of
analysts, notably Professor Michael Porter [25] and his
coauthor Claas van der Linde [26]. Based on case studies, the
authors suggest that pollution is often a waste of resources
and that a reduction in pollution may lead to an improvement
in the productivity with which resources are used. More
stringent but properly designed environmental regulations (in
particular, market-based instrument such as taxes or cap-and-
trade emissions allowances) can “trigger innovation [broadly
IJSER

International Journal of Scientific & Engineering Research Volume 9, Issue 2, February-2018 2065 ISSN 2229-5518
IJSER © 2018 http://www.ijser.org
defined] that may partially or more than fully offset the costs
of complying with them” in some instances [26]. Figure 2.1
summarizes the main causal links involved in the PH. As
Porter and van der Linde first described this relationship, if
properly designed, environmental regulations can lead to
“innovation offsets” that will not only improve
environmental performance, but also partially—and
sometimes more than fully—offset the additional cost of
regulation.
Figure 2.1 Schematic Representation of the Porter
Hypothesis
Author Computation from Doytchand Uctum (2011)
Porter and van der Linde go on to explain that there are at
least five reasons that properly crafted regulations may lead
to these outcomes:
• First, regulation signals companies about likely
resource inefficiencies and potential technological
improvements.
• Second, regulation focused on information gathering
can achieve major benefits by raising corporate
awareness.
• Third, regulation reduces the uncertainty that
investments to address the environment will be
valuable.
• Fourth, regulation creates pressure that motivates
innovation and progress.
• Fifth, regulation levels the transitional playing field.
• Finally, they note, “We readily admit that innovation
cannot always completely offset the cost of
compliance, especially in the short term before
learning can reduce the cost of innovation-based
solutions” [26].
The Porter Hypothesis has met with great success in political
debate, especially in the United States, because it contradicts
the idea that environmental protection is always detrimental
to economic growth. The PH has been invoked to persuade
the business community to accept environmental regulations,
as it may benefit from them in addition to other stakeholders.
In a nutshell, well-designed environmental regulations might
lead to a Pareto improvement or “win– win” situation in
some cases, by not only protecting the environment, but also
enhancing profits and competitiveness through the
improvement of the products or their production process or
through enhancement of product quality. The PH has been
criticized for being incompatible with the assumption of
profit maximizing firms [23].
2.1.5 Pollution Leakages Pollution leakage has emerged as a potentially important
factor in the relationship between economic growth and
environmental quality [3] Critics of the Environmental
Kuznets Curve hypothesis have suggested that whilst
economic growth in country A may lead to lower domestic
emissions due to structural changes in the domestic economy,
continued consumption of pollution intensive products
imported from overseas may lead to increases in pollution in
the exporting country [5] Moreover, measures to reduce
emissions in country A – such as a pollution tax – may result
in increased emissions in exporting countries, partly through
changing incentives for the location of dirty industries when
factors of production are mobile across international borders
[28]. Modelling studies of the effects of energy efficiency
improvements on domestic pollution reveal a third channel
Strict but Flexible Environmental Regulations
Innovation
Environmental
Performance
Business Performance (sometimes)
IJSER

International Journal of Scientific & Engineering Research Volume 9, Issue 2, February-2018 2066 ISSN 2229-5518
IJSER © 2018 http://www.ijser.org
for pollution levels in trading countries to be codetermined,
due to competiveness effects on energy-intensive (and thus,
typically, carbon-intensive) export sectors [14]
2.2 Empirical Review [2] examined the impact of environmental policy on location
decision, the outflow of “dirty” Foreign Direct Investment
(FDI) from 1990 to 2000 for fourteen developing countries and
eleven developed/OECD. The study also examined the impact
of “dirty” FDI in host countries, on annual CO2 total emission;
total emission of known particulate matters; rising
temperature; and total energy use. Using disaggregated FDI
data, panel data regression, and the paper found that, “dirty”
FDI outflow is positively correlated with environmental
policy in eleven OECD countries.
[1] examined two most important benefits and costs
of foreign direct investment in the Indian context - GDP
growth and the environment degradation. The paper found a
statistically significant long run positive, but marginal, impact
of FDI inflow on GDP growth in India during 1980-2003. On
the other hand, the long run growth impact of FDI inflow on
CO2 emissions is quite large. The actual impact on the
environment, however, may be larger because CO2 emission
is one of the many pollutants generated by economic
activities. But CO2 being a global air pollutant, the paper
finding has some far reaching implications for the global
environment as well, with India having emerged as the fourth
highest in the global ranking of CO2 emissions by turn of this
century.
[29] examined the impact of foreign investment
dependence on carbon dioxide emissions 1978 to 2008 in
China. In a time series regression analysis, the author finds
that foreign capital penetration has a significant negative
effect on the growth of CO2 emissions, which is due to the
spill-over effect. It does not mean that FDI does no harm to
us. Chinese are aware that foreign capitals of pollution-
intensive industries have poured into China. The paper must
be strict with the inflow of foreign capital. Exports aggravate
the pressure on CO2 emissions. It was the evidence of
“Pollution Haven”. Economic growth, however, has no
systematic effect. The paper finds negative effect of domestic
investment and agriculture shares on total CO2 emissions
over the same period.
[7] investigated the existence of the environmental
Kuznets curve (EKC) for carbon dioxide (CO2) emissions and
its causal relationships with economic growth and openness
by using time series data (1971-2006) from China (an
emerging market), Korea (a newly industrialized country),
and Japan (a developed country). The sample countries span a
whole range of development stages from industrialized to
newly industrialized and emerging market economies. The
environmental consequences according to openness and
economic growth do not show uniform results across the
countries. Depending on the national characteristics, the
estimated EKC show \different temporal patterns. China
shows an N-shaped curve while Japan has a U-shaped curve.
Such dissimilarities are also found in the relationship between
CO2 emissions and openness. In the case of Korea and Japan
it represents an inverted Ushaped curve, while China shows a
U-shaped curve. We also analyze the dynamic relationships
between the variables by adopting a vector auto regression or
a vector error correction model. These models through the
impulse response functions allow for analysis of the causal
variable’s influence on the dynamic response of emission
variables and it adopts a variance decomposition to explain
the magnitude of the forecast error variance determined by
the shocks to each of the causal variables over time. Results
show evidence of large heterogeneity among the countries
and variables impacts.
[12] developed a model of trade with heterogenous
firms, where firms invested in abatement technology and
IJSER

International Journal of Scientific & Engineering Research Volume 9, Issue 2, February-2018 2067 ISSN 2229-5518
IJSER © 2018 http://www.ijser.org
thereby have an impact on their level of emissions. The model
shows how firm productivity and firm exports are both
positively related to investments in abatement technology.
Emission intensity was, however, negatively related to firms'
productivity and exports. The basic reason for these results is
that a larger production scale supports more fixed
investments in abatement technology and, in turn, lowers
emissions per output. In contrast to the standard models of
heterogeneous firms, firms' productivity, and thus export
performance, was not exogenous, but endogeneously
determined by firms' investment in abatement technology.
The paper derived closed form solutions for firm-level
abatement investments and emissions per output, and tests
the empirical implications of the model using detailed
Swedish firm level data. The empirical results strongly
support the model.
[10] examined the determinants of Carbon dioxide
(CO2) emissions for 15 Post-Soviet Union Independent (PSI)
countries given their recent transition to market-based
economies and their relatively high levels of corruption. They
examined the direct and indirect effects of economic growth
on CO2 emissions for the PSI countries using a system
generalized method of moment (GMM) approach to account
for simultaneity among corruption, growth, and CO2
emissions. They find a linear relationship between GDP and
CO2 emissions. Furthermore, GDP influences CO2 emissions
directly, but also indirectly through its impact on corruption.
Similarly, corruption affects CO2 emissions directly, as well
as indirectly through its impact on GDP. They find that
political democracy and economic freedom increase CO2
emissions indirectly through their impact on economic
growth. Improved energy efficiency and the EU climate
policy reduce CO2 emissions, while FDI inflows tend to
increase CO2 emissions.
[18] examined the causal relationship between CO2
emissions, energy consumption, output and FDI (foreign
direct investment) in ANICs (Asian newly industrialized
countries: Hong Kong, Republic of Korea, Singapore, Taiwan)
from 1971 to 2011. The result based on VECM (Vector Error
Correction Model) implied that there is a long run co-
integrated relationship between CO2 emissions, energy
consumption, output and FDI. The result supports the
environmental Kuznets curve hypothesis in this region. Short
run dynamics show the Granger Causality from economic
growth to CO2emissions. There is an also indirect causality
from FDI (inward FDI and outward FDI) to CO2emissions in
the short run. In the long run, there was unidirectional
granger causality from the other variables to CO emissions.
[4] investigated that the role of Foreign Direct
Investment (FDI) in environmental pollution besides other
factors and resources of investment have been greatly
considered by lots investigators. Existence of foreign direct
investment or multi-national enterprises may show positive
marginal spillover effects on technologic characteristics of
national enterprises. The national enterprises may tend to
enjoy from technologic activities of multi-national enterprises
or their technical knowledge for coping environmental
problems as well. As long as products of these technologies
replace with product of traditional resources, it can be
expected that residual loading will also reduce. Therefore,
foreign direct investment will probably leave important
positive effects on decrease of residual loading and
environmental pollution. The main purpose of this research is
to find the relationship between FDI and the quality of
environments. To do so, firstly some countries are selected
from Non-OECD countries, then by using panel data method
for period 1996-2007 the relationship between FDI and
chemical pollution of water was investigated. The results
show that increasing inflow of FDI in Non-OECD countries,
IJSER
International Journal of Scientific & Engineering Research Volume 9, Issue 2, February-2018 2068 ISSN 2229-5518
IJSER © 2018 http://www.ijser.org
increasing FDI causes the amount of water pollution. In other
words, Foreign Direct Investment causes environmental
disturbances in Non-OECD countries. (selected countries).
This study shows that among these countries the ratio of
water chemical.
[21] examined the impact of economic growth,
energy consumption and foreign direct investment inflows on
CO2 emission in Nigeria, using autoregressive distributed lag
(ARDL) approach to co-integration and a time series data
from 1971 to 2010. The result suggested existence of long run
equilibrium relationship among the variables. The empirical
finding reveals that the coefficients of economic growth are
significant and positively related to CO2 emissions both in the
long and short run. Furthermore, the estimates of foreign
direct investment inflows are also significant but inversely
related to CO2 emissions in the long and short run. On the
other hand, the estimates of energy consumption although
positive, are statistically not significantly different from zero
in the long and short run.
[27] examined the impact of carbon dioxide emission
on trade liberalization in Pakistan. The research work used
secondary data from 1980-2010. The variables were taken as
CO2 emission and openness of trade. Granger causality test
was applied to analyze the dynamic relationship between
variables under study. Empirical results show that bi-
directional causality is running between openness of trade
(OT) and carbon dioxide emission
(CO2).
[19] investigated the dynamic causal relationships
among environmental degradation, economic growth, foreign
direct investment (FDI) and energy consumption in the 12
most populous countries in Asia. This panel sample shows
evidence that supports the Environmental Kuznets Curve
(EKC), and that CO2 emissions begin to decline when income
level reaches to 8.9341 (in logarithms). Applying Granger
causality test, we find the existence of both short and long-run
causality relationships among these variables, and economic
growth, FDI, energy consumption and CO2 emissions of 12
Asian most populous countries have relationships with
Japanese income. On the other hand, our estimated results
suggest that these countries have been exchanging the
environmental degradation to implement economic activities.
Furthermore, these results support the pollution haven
hypothesis, which indicate the less stringent environmental
regulations of the host countries have attracted FDI inflows.
3. Theoretical Framework and Methodology
3.1 Theoretical Framework
The theoretical framework for this study is based on the
environmental Kuznets curve (EKC) propounded by [13] to
found that the long-term relationship between economic
growth and environment quality was an inverted U-shaped
curve. The phenomenon The EKC hypothesizes that
environment quality deteriorates with the increase of per
capita income at the early stage of economic growth and
gradually improves when the country reaches to a certain
level of affluence.
CO2 = f(GDPPC)
………..…………….……………………………………….….
(3.1)
(+/-)
Also, the importance of trade in combination with
composition of economic activity is investigated in the
decomposition of EKC for CO2 concentrations across
countries (Kaufmann et al., 1998).
CO2 = f(FDI)
………..………………….…….………………………………….….
(3.2)
(+)
IJSER

International Journal of Scientific & Engineering Research Volume 9, Issue 2, February-2018 2069 ISSN 2229-5518
IJSER © 2018 http://www.ijser.org
People, at low-income levels, are more concerned with food
and other material needs and less concerned with
environmental quality. People, at higher income levels, begin
to demand higher levels of environmental quality to go along
with their increased prosperity.
Equating equation (3.1) with equation (3.2)
CO2 = f(GDPPC, FDI)
………..…………….…………………………………..…. (3.3)
(+/-, +)
This study will incorporate energy consumption as the
control variable.
CO2 = f(GDPPC, FDI & EC)
…………………………………...…..……………... (3.4)
3.2 Research Methodology
3.2.1 Model Specification
The followings three macroeconomic variables are used as
regressors to estimate the impact of foreign direct investment
on CO2 emission in Nigeria.
CO2 = f(GDPPC, FDI & EC)
……………………………….…………………..… (3.5)
Where CO2 = CO2 Emission (measure by metric tons per
capita)
f = Functional notation
GDPPC = Gross Domestic Product Per Capita
(measure by constant 2005 US$)
FDI = Foreign Direct Investment (measure in by BOP,
current US$)
EC = Energy Consumption (measure by kg of oil
equivalent per capita)
CO2 = ß0 + ß1GDPPC + ß2FDI + ß3EC + u-
…………………………………........ (3.6)
In other to normalize the variables, both the explanatory and
explained variable will be log.
LOGCO2 = ß0 + ß1LOGGDPPC + ß2LOGFDI +
ß3LOGEC + u……………….. (3.7)
Where:
• ß0 tells us the expected value of CO2 emission when
all the explanatory variables have zero effect.
• ß1 is the effect of a change in gross domestic product
per capita on CO2 emission while holding all
explanatory variables constant.
• ß2 is the effect of a change in foreign direct
investment on CO2 emission while holding all
explanatory variables constant.
• ß3 is the effect of a change in energy consumption on
CO2 emission while holding all explanatory variables
constant.
• u is the stochastic or error term with all the standard
attributes. It captures the effect of other variables that
could affect the gross domestic product but which
are not included in the model.
3.2.2 Definition of the Variables
CO2 Emissions (Metric tons per Capita)
Carbon dioxide emissions are those stemming from the
burning of fossil fuels and the manufacture of cement. They
include carbon dioxide produced during consumption of
solid, liquid and gas fuels and gas flaring.
Gross Domestic Product per Capita (GDPPC)
Per capita GDP is a measure of the total output of a country
that takes the gross domestic product (GDP) and divides it by
the number of people in the country. The per capita GDP is
especially useful when comparing one country to another
because it shows the relative performance of the countries. A
rise in per capita GDP signals growth in the economy and
tends to translate as an increase in productivity. According to
[21], GDPPC is positively related to CO2 emission. GDP data
IJSER

International Journal of Scientific & Engineering Research Volume 9, Issue 2, February-2018 2070 ISSN 2229-5518
IJSER © 2018 http://www.ijser.org
will be source from World Development Indicator (WDI)
2015.
Foreign Direct Investment (FDI)
A foreign direct investment (FDI) is an investment made by a
company or entity based in one country, into a company or
entity based in another country. Foreign direct
investments differ substantially from indirect investments
such as portfolio flows, wherein overseas institutions invest in
equities listed on a nation's stock exchange. Entities making
direct investments typically have a significant degree of
influence and control over the company into which the
investment is made. Open economies with skilled workforces
and good growth prospects tend to attract larger amounts of
foreign direct investment than closed, highly regulated
economies.
According to [21] FDI is positively related to CO2 emission.
FDI data will be source from World Development Indicator
(WDI) 2015.
Energy Consumption (EC) (kg of oil equivalent per capita)
Energy use refers to use of primary energy before
transformation to other end-use fuels, which is equal to
indigenous production plus imports and stock changes,
minus exports and fuels supplied to ships and aircraft
engaged in international transport. EC is positively related to
CO2 emission. FDI data will be source from World
Development Indicator (WDI) 2015.
Table 3.1: Apriori Expectation
The apriori expectation is that a positive relationship would
be established between CO2 emission and each of the
explanatory variables [4] and [21]
Explanatory
variables
Symbols Hypothesis Expected
sign
Gross Domestic
Product Per
GDPPC Gross domestic
product per
+
Capita capita has a
positive relation
with CO2
emission.
Foreign Direct
Investment
FDI Foreign direct
investment has a
positive relation
with CO2
emission.
+
Energy
Consumption
EC Energy
consumption has
a positive relation
with CO2
emission.
+
Source: Author’s Computation
3.2.3 The Data Requirement and Source
Annual data covering the period from 1980 to 2014 will be
employed and the data would be sourced from World
Development Indicator (WDI) 2015. CO2 emission (measure
by metric tons per capita), gross domestic product per capita
(measure by constant 2005 US$), foreign direct investment
(measure in by BOP, current US$) and energy consumption
(measure by kg of oil equivalent per capita) would be the
variables of interest. Essentially, for the reason of uniformity
in measurement, and clarity in the interpretation of findings,
the variables will be transformed to their natural logarithms
to eliminate any serial correlation.
3.2.4 Estimation Technique
The ordinary least square (OLS) technique will be adopted in
this study. The study will considered the both the short-run
and long-run simultaneously, the econometric methodology
of the error correction mechanism (ECM) will be also
employed. In order to undertake the empirical analysis using
the ECM technique, the variables involved in the model must
be non-stationary and integrated of the same order, or they
IJSER
International Journal of Scientific & Engineering Research Volume 9, Issue 2, February-2018 2071 ISSN 2229-5518
IJSER © 2018 http://www.ijser.org
should be stationary (see Nelson and Polser 1982; Stock and
Watson 1988; and Campbell and Perron 1991). Thus both the
Augmented Dickey-Fuller (ADF) (Dickey and Fuller, 1979,
1981) and Phillips-Perron (PP) (1988) unit root tests will be
utilized to test for the order of integration of the variables. In
the process of testing for co-integration, two separate methods
will be used. First, the presence of unit roots in the residuals
from the regressions of variables in levels will be tested. Then,
the [16] and [15] full information maximum likelihood of an
ECM model will be utilized.
4. Discussion and Interpretation of Result
This section presents the estimated results of equations (3.7)
to analyze the impact of foreign direct investment on CO2
emission in Nigeria.
4.1 Summary Statistics Result
Table 4.1: Summary Statistics Output
Log(CO2)
Log(GDPPC)
Log(FDI)
Log(EC)
Mean -0.526353 6.517568 2.620009 7.48747
9
Median -0.439439 6.406478 1.350009 6.55142
6
Maximum -0.078194 7.001282 8.840009 6.49671
1
Minimum -1.133078 6.203019 -
7.390008 6.49671
1
Std. Dev. 0.297055 0.252284 2.810009 3.81217
9
Skewness -0.452522 0.640871 1.036442 3.81491
2
Kurtosis 2.187510 1.877750 2.601678 15.5562
0
Jarque-Bera 2.157229 4.232532 6.497612 314.814
0
Probability 0.340066 0.120481 0.038821 0.00000
0
Sum -18.42236 288.1149 9.160010 262.061
8 Sum Sq.
Dev. 3.000209 2.164010 2.690020 494.112
0 Observation 35 35 35 35
s Source: Author’s Computation from E-view 7
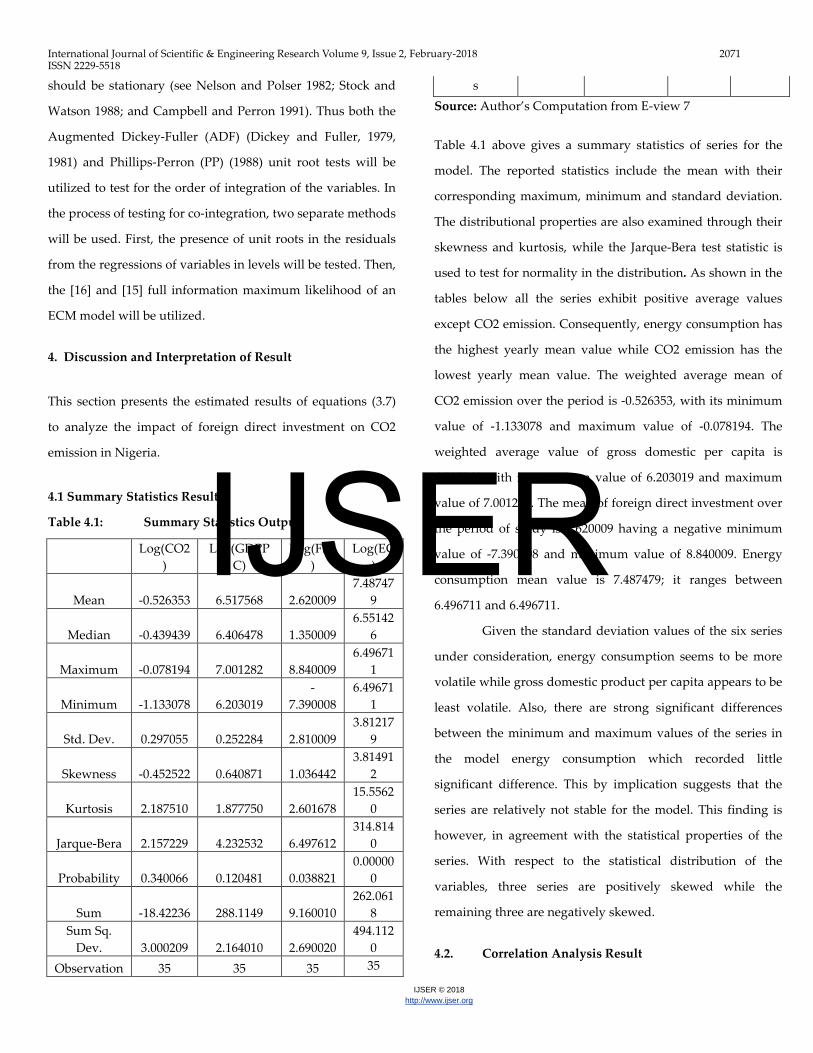
Table 4.1 above gives a summary statistics of series for the
model. The reported statistics include the mean with their
corresponding maximum, minimum and standard deviation.
The distributional properties are also examined through their
skewness and kurtosis, while the Jarque-Bera test statistic is
used to test for normality in the distribution. As shown in the
tables below all the series exhibit positive average values
except CO2 emission. Consequently, energy consumption has
the highest yearly mean value while CO2 emission has the
lowest yearly mean value. The weighted average mean of
CO2 emission over the period is -0.526353, with its minimum
value of -1.133078 and maximum value of -0.078194. The
weighted average value of gross domestic per capita is
6.517568 with its minimum value of 6.203019 and maximum
value of 7.001282. The mean of foreign direct investment over
the period of study is 2.620009 having a negative minimum
value of -7.390008 and maximum value of 8.840009. Energy
consumption mean value is 7.487479; it ranges between
6.496711 and 6.496711.
Given the standard deviation values of the six series
under consideration, energy consumption seems to be more
volatile while gross domestic product per capita appears to be
least volatile. Also, there are strong significant differences
between the minimum and maximum values of the series in
the model energy consumption which recorded little
significant difference. This by implication suggests that the
series are relatively not stable for the model. This finding is
however, in agreement with the statistical properties of the
series. With respect to the statistical distribution of the
variables, three series are positively skewed while the
remaining three are negatively skewed.
4.2. Correlation Analysis Result
IJSER
International Journal of Scientific & Engineering Research Volume 9, Issue 2, February-2018 2072 ISSN 2229-5518
IJSER © 2018 http://www.ijser.org
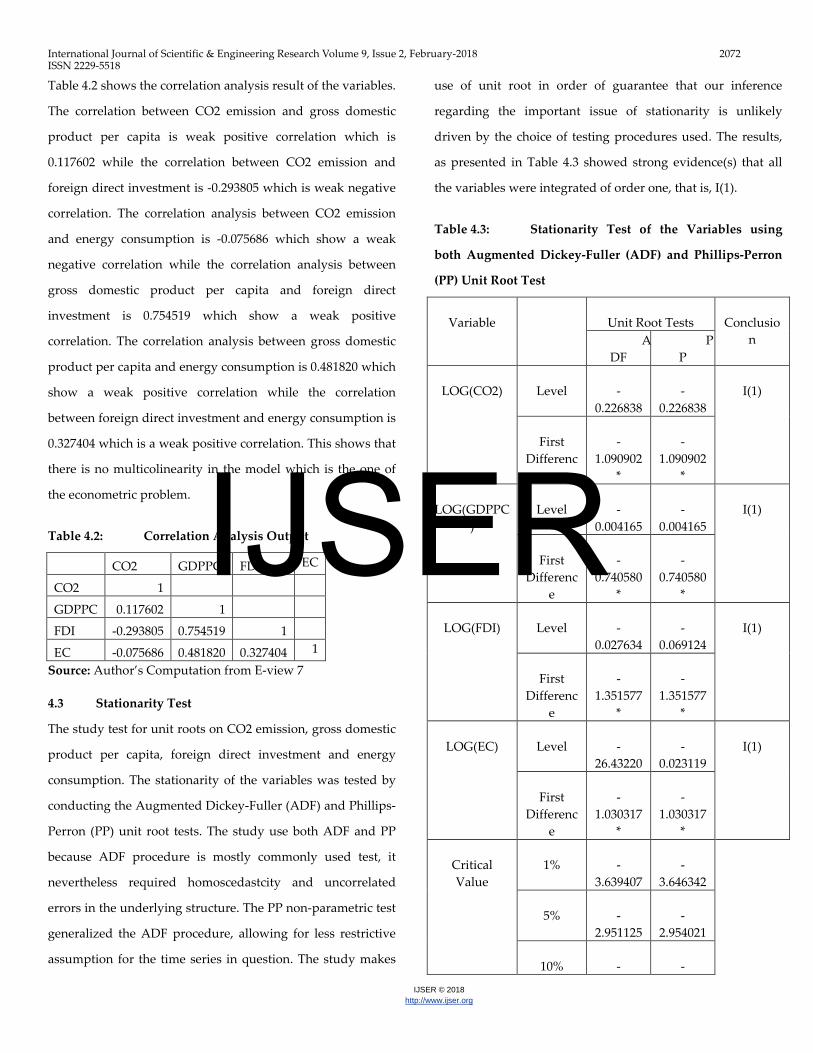
Table 4.2 shows the correlation analysis result of the variables.
The correlation between CO2 emission and gross domestic
product per capita is weak positive correlation which is
0.117602 while the correlation between CO2 emission and
foreign direct investment is -0.293805 which is weak negative
correlation. The correlation analysis between CO2 emission
and energy consumption is -0.075686 which show a weak
negative correlation while the correlation analysis between
gross domestic product per capita and foreign direct
investment is 0.754519 which show a weak positive
correlation. The correlation analysis between gross domestic
product per capita and energy consumption is 0.481820 which
show a weak positive correlation while the correlation
between foreign direct investment and energy consumption is
0.327404 which is a weak positive correlation. This shows that
there is no multicolinearity in the model which is the one of
the econometric problem.
Table 4.2: Correlation Analysis Output
CO2 GDPPC FDI EC
CO2 1
GDPPC 0.117602 1
FDI -0.293805 0.754519 1
EC -0.075686 0.481820 0.327404 1
Source: Author’s Computation from E-view 7
4.3 Stationarity Test
The study test for unit roots on CO2 emission, gross domestic
product per capita, foreign direct investment and energy
consumption. The stationarity of the variables was tested by
conducting the Augmented Dickey-Fuller (ADF) and Phillips-
Perron (PP) unit root tests. The study use both ADF and PP
because ADF procedure is mostly commonly used test, it
nevertheless required homoscedastcity and uncorrelated
errors in the underlying structure. The PP non-parametric test
generalized the ADF procedure, allowing for less restrictive
assumption for the time series in question. The study makes
use of unit root in order of guarantee that our inference
regarding the important issue of stationarity is unlikely
driven by the choice of testing procedures used. The results,
as presented in Table 4.3 showed strong evidence(s) that all
the variables were integrated of order one, that is, I(1).
Table 4.3: Stationarity Test of the Variables using
both Augmented Dickey-Fuller (ADF) and Phillips-Perron
(PP) Unit Root Test
Variable Unit Root Tests Conclusion A
DF P
P
LOG(CO2) Level -0.226838
-0.226838
I(1)
First Differenc
e
-1.090902
*
-1.090902
*
LOG(GDPPC)
Level -0.004165
-0.004165
I(1)
First Differenc
e
-0.740580
*
-0.740580
*
LOG(FDI) Level -0.027634
-0.069124
I(1)
First Differenc
e
-1.351577
*
-1.351577
*
LOG(EC) Level -26.43220
-0.023119
I(1)
First Differenc
e
-1.030317
*
-1.030317
*
Critical Value
1% -3.639407
-3.646342
5% -2.951125
-2.954021
10% - -
IJSER

International Journal of Scientific & Engineering Research Volume 9, Issue 2, February-2018 2073 ISSN 2229-5518
IJSER © 2018 http://www.ijser.org
2.614300 2.615817
Source: Author’s Estimation from E-view 7.
NB: *,** & *** represent significant at 1%, 5% and 10%
respectively
4.4 Co-integration Analysis The next step was to test for the presence of long-run relation
among the variables, that is, co-integrating relationships.
Table 4.4 shows the results of the co-integration tests which
suggested at least one co-integration equation at the 5 percent
level of significance. This means that there is a long run
relationship among the variables.
Table 4.4: Co-integration Output using both Trace
and Maximum Eigen-value
Unrestricted Co-integration Rank Test (Trace) Hypothesized Trace 0.05
No. of CE(s) Eigenvalue Statistic Critical Value Prob.**
None * 0.304393 11.97801 3.841466 0.0005 Trace test indicates 1 co-integrating eqn(s) at the 0.05 level * denotes rejection of the hypothesis at the 0.05 level **MacKinnon-Haug-Michelis (1999) p-values
Unrestricted Co-integration Rank Test (Maximum Eigenvalue) Hypothesized Max-Eigen 0.05
No. of CE(s) Eigenvalue Statistic Critical Value Prob.**
None * 0.304393 11.97801 3.841466 0.0005 Max-eigenvalue test indicates 1 co-integrating eqn(s) at the 0.05 level * denotes rejection of the hypothesis at the 0.05 level **MacKinnon-Haug-Michelis (1999) p-values
Unrestricted Co-integrating Coefficients (normalized by b'*S11*b=I): LOG(CO2)
4.240949
Unrestricted Adjustment Coefficients (alpha): D(LOG(CO2)) -0.100893 Source: Author’s Computation from E-view 7
4.5 Empirical Analysis and Discussion
4.5.1 Effect of Gross Domestic Product per Capita,
Foreign direct investment and energy Consumption on CO2
Emission
Under this sub-section, the powerful econometric techniques
were carried out which is parsimonious regression analysis to
investigate the impact of government expenditure on the
economic growth in Nigeria. This techniques help use to
know the dynamic of short-run to long-run that is the speed
adjustment of short-run to long-run.
Table 4.5: Parsimonious Regression Result Dependent Variable: D(LOGCO2)
Variable Coefficient Std. Error t-Statistic Prob. D(LOGGDPPC) -5.500005 0.000507 -0.108635 0.9149
D(LOGGDPPC(-1)) 0.000494 0.000557 0.885846 0.3897
D(LOGGDPPC(-2)) -6.710005 0.000577 -0.116244 0.9090
D(LOGGDPPC(-3)) 0.000692 0.000467 1.481225 0.1592
D(LOGFDI) -4.070011 2.480011 -1.640237 0.1218 D(LOGFDI(-1)) -4.770011 2.790011 -1.713197 0.1073 D(LOGFDI(-2)) -5.200011 2.870011 -1.811551 0.0901 D(LOGFDI(-3)) 3.050011 2.950011 1.033082 0.3179
D(LOGEC) -5.930012 1.970011 -0.300493 0.7679 D(LOGEC(-1)) -3.620011 2.000011 -1.809797 0.0904 D(LOGEC(-2)) -0.000440 0.001677 -0.262328 0.7966 D(LOGEC(-3)) 0.002693 0.001840 1.463666 0.1639
ECM(-1) -0.154952 0.009825 -2.688408 0.0017
R-squared 0.556822 Mean dependent var
-0.007247
Adjusted R-squared 0.543645 S.D. dependent var 0.109154
S.E. of regression 0.102764 Akaike info criterion
-1.406438
Sum squared resid 0.158407 Schwarz criterion -
0.666316
IJSER

International Journal of Scientific & Engineering Research Volume 9, Issue 2, February-2018 2074 ISSN 2229-5518
IJSER © 2018 http://www.ijser.org
Log likelihood 37.79979 Hannan-Quinn criter.
-1.165177
Durbin-Watson stat 1.701254
Source: Author’s Computation from E-view 7
Note: D(-1), D(-2), D(-3) means differenced at lag one, two and three respectively.
Table 4.5 shows the result of impact of foreign direct
investment on CO2 emission in Nigeria. The long run
coefficients of the determining variables have different signs
and magnitude in term of relationships with CO2 emission.
Gross domestic product positively influence CO2 emission in
Nigeria and is insignificant while foreign direct investment
and energy consumption have negative impact on CO2
emission in Nigeria but not significant. Also gross domestic
product per capita, foreign direct investment and energy
consumption in one year lag (-1) have negative impact on
CO2 emission in Nigeria but only energy consumption is
significant at 10% level of significant. Furthermore, gross
domestic product per capita, foreign direct investment and
energy consumption in two year lag (-2) have a negative
impact on CO2 emission in Nigeria but only foreign direct
investment is significant at 10% level of significant. Lastly,
gross domestic product per capita, foreign direct investment
and energy consumption in three year lag (-3) have a positive
impact on CO2 emission in Nigeria but all the variables are
insignificant.
The result of ECM indicates that the model seems to
be good as it satisfies the diagnostic test and also has an
adjusted R-Squared (R2) value of 0.413645, which indicate that
only about 45.64% of the total systematic variation in CO2
emission in Nigeria is not accounted for by the explanatory
variables all taken together. The Durbin Watson (DW)
statistics value of 1.701254 shows that there is no serious
problem of serial correlation and heteroskedasticity. The error
term is also found to be normally distributed. The coefficient
of the error correction term with one period lag [ECM(-1)] is
negative as expected with a value of -0.154952. This signify
that the long run relationship of the estimated model is stable
and any disequilibrium created in the short run will be
temporary and will get corrected over a period of time.
In order to find out how long it will take to fully
correct any distortion in the long-run relationship, we imply
divide one by the ECM coefficient that is,( 10.154952
= 6.454).
Since the value is greater than six (6), it implies that it will
take approximately six years and some months for full
adjustments to take place after a shock has occurred.
The apriori expectation is that a positive relationship
would be established between CO2 emission and each of the
explanatory variables [4] and [21]) but foreign direct
investment and energy consumption do not follow.
5. Summary and Conclusion
This study investigated the impact of foreign direct
investment on CO2 emission in Nigeria over the period 1980
to 2014. The result investigated by the use of descriptive
statistics, correction analysis, unit root, Johansen co-
integration test and parsimonious regression analysis
reviewed that the impact of foreign direct investment on CO2
emission in Nigeria over the period 1980 to 2014have a
negative relationship (associated) with CO2 emission, the
position of this study is that as both foreign direct investment
and energy consumption increases within the period covered
in this study, CO2 emission also decreases and vice versa.
Thus, increase in foreign direct investment and energy
consumption will not increases CO2 emission in Nigeria.
However, the foregoing findings bear some implications for
policy formulation ion order to reduce the cumulative
emissions of carbon dioxide in Nigeria, scientists and policy
makers should take more care for clean or environment
friendly energy production as well as appropriate technology
IJSER
International Journal of Scientific & Engineering Research Volume 9, Issue 2, February-2018 2075 ISSN 2229-5518
IJSER © 2018 http://www.ijser.org
and adapt some policies regarding the reduction of carbon
dioxide emission rather to increase the GDP only.
Government of Nigeria should implement such policies that
are not harmful for the environment such as the agreement
which allow the receiving of dirty technology which is good
for producers to earn high profit but bad for the
environmental quality. Government should only sign that
trade agreements with countries where the compensation for
rehabilitation of environment is paid. Government needs to
do cause benefit analysis before the inflow of FDI to examine
if it will cause benefit to our country or it will be harmful for
our country if cost is more than the loss then it should sign
the trade agreement with its opponent
Therefore, the Environmental Kuznets curve (EKC) was used
in the study but other theories like Halo effect hypothesis,
pollution haven hypothesis, porter hypothesis and pollution
leakages could also be used to determine the impact of
foreign direct investment on CO2 emission in Nigeria. There
is still need for further research to be conducted along this
line, especially by using another model aside from
Environmental Kuznets curve (EKC). Also, the study had
been mainly aggregative; a disaggregated analysis would be
more informative. The use of a more robust co-integration
approach like the auto-regressive distributed lag (ARDL)
model would also be very insightful.
References
[1] Acharyya J., (2009) “FDI, Growth and the
Environment:Evidence from India on CO2 Emission
duringthe last two Decades”. Journal of Economic
Development. Vol. 34, pp 43 – 58.
[2] Aminu A. M., (2005) “Foreign Direct Investment and
the Environment: Pollution Haven Hypothesis
Revisited”.Paper prepared for the Eight Annual
Conference on Global Economic Analysis, Lübeck,
Germany, June 9 - 11, 2005
[3] Antweiler, W., Copeland, B., Taylor, M. (2001) “Is
free trade good for the environment?” American
Economic Review. Vol. 91, pp 877-908.
[4] Avazalipour M. S., Fatemeh Z., Reza S., Nader H.
and Marjan D. (2013) “The Impact of FDI on
Environmental Resources in Selected Countries
(Non- OECD)”. IJRRAS. Vol. 17 (1), pp 111 – 115.
[5] Bruvoll, A. andFaehn, T., (2006)“Transboundary
effects of environmental policy: Markets and
emission leakages”.Ecological Economics.Vol. 59,pp
499-510.
[6] Campbell and Perron, (1991)
[7] Choi E., Heshmati A. and Cho Y., (2010) “An
Empirical Study of the Relationships betweenCO2
Emissions, Economic Growth and Openness”.
Discussion Paper No. 5304November 2010.
[8] Copeland, B. R. and Taylor M. S., (2004) “Trade,
Growth, and the Environment” Journal of Economic
Literature.Vol.42(1), pp 7-73.
[9] Dickey, D.A., and W.A. Fuller (1979), “Distribution of
the Estimates for AutoregressiveTime Series with a
Unit Root,” Journal of the American Statistical
Association, Vol. 74(4), pp 427-431.
[10] Dmitriy D. L., Jeong H. B. and Meenakshi R. (2012)
“Determinants of CO2 Emissions for Post-Soviet
Independent Countries” Yangsantaekjiro 20, Hyunjin
Evervil 109-301, Bukgu, Gwangju, South Korea.
[11] Doytch N. and Uctum M., (2011) “Globalization and
the Environmental Spillovers of sectoral FDI”.
University of New Haven, Department of Economics
and FinanceBrooklyn College and the Graduate
Center of the City University of New York
November 2011.
IJSER
International Journal of Scientific & Engineering Research Volume 9, Issue 2, February-2018 2076 ISSN 2229-5518
IJSER © 2018 http://www.ijser.org
[12] Forslid R., Okubo T. and Karen-Helene U., (2011)
“International Trade, CO2Emissions and
HeterogeneousFirms” Discussion Paper No. 8583,
September 2011. Centre for Economic Policy Research.
[13] Grossman, G. M. and Krueger A. B., (1991)
“Environmental Impact of a North American Free
Trade Agreement”, NBER Working Paper 3914.
[14] Hanley, N., et al.(2009), “Do increases in energy
efficiency improve environmental quality and
sustainability?”.Ecological Economics. Vol. 68,pp 692-
709.
[15] Jian, W. and Rencheng, T. (2007) Environmental
effect of foreign direct investment in China, 16th
international input-output conference, Turkey.
[16] Johansen S., (1988) “Estimation and hypothesis
testing of cointegration vectors in Gassian vector
autoregressive models”. Econometrica, Vol. 59, pp
1551-1580.
[17] Kaufmann, R. K., Davidsdottir, B., Garnham, S., and
Pauly, P., (1998) “Thedeterminants of atmospheric
SO2 concentrations: reconsidering the environmental
Kuznets curve”, Ecological Economics. Vol. 25, pp 209-
220.
[18] Kim D.D., (2013) “Does FDI inflow crowd out DI in
Korea quest”. ,Journal of Economic Studies. Vol. 30, pp
605-622.
[19] Linh S. H. and Lin S., (2015) “Dynamic Causal
Relationships among CO2 Emissions, Energy
Consumption, Economic Growth and FDI in the most
Populous Asian Countries”. Advances in Management
& Applied Economics. Vol. 5, pp 69-88.
[20] Lopez R., and S. Mitra (2000), ‘Corruption, pollution
and the environmental Kuznets curve’, Journalof
Environmental Economics and Management. Vol.40, pp
137-150.
[21] Maji I. K. and Habibullaha M. S., (2015) “Impact of
Economic Growth, Energy Consumption andForeign
Direct Investment on CO2 Emissions: Evidence from
Nigeria”. World Applied Sciences Journal. Vol. 33 (4),
pp 640-645.
[22] Minh Nguyen, T. B. and Nurul, A. A. T. M. (2002)
“The Role of Foreign Direct Investment in Urban
Environmental Management: Some Evidence from
Hanoi, Vietnam”.Environment, Development and
Sustainability.Vol. 4, pp 279-297.
[23] Palmer, K et al (1995), “Tightening Environmental
Standards: The Benefits-Cost or the No-Cost
Paradigm?” Journal of Economic Perspectives.Vol. 9(4),
pp 119-132.
[24] Panayotou T. (1993), ‘Empirical tests and policy
analysis of environmental degradation at
differentstages of economic development’.WEP 2-22
Working Paper No. 238, International Labour Office,
Technology and Employment Programme, Geneva.
[25] Porter, M. (1991), “America’s Green Strategy”, Scientific American Vol. 264(4), pp 168.
[26] Porter, M., and Van Der Linde C., (1995), Toward a
New Conception of the Environment-
Competitiveness Relationship, Journal of Economic
Perspective. Vol.9(4), pp 97–118.
[27] Salam S., Sattar A. and Gilani S. W., (2015) “An
Empirical Research on Trade Libralization and CO2
Emissionin Pakistan”. Journal of Economics and
Sustainable Development. Vol.6, pp 39 – 46.
[28] Sheldon, I. (2006), “Trade and environmental policy:
a race to the bottom?”Journal ofAgricultural Economics.
Vol. 57(3), pp 365-392.
[29] Yanchun, Y. (2010). FDI and China’s carbon dioxide
emissions 1978–2008. In Proceedings of the 7th
IJSER

International Journal of Scientific & Engineering Research Volume 9, Issue 2, February-2018 2077 ISSN 2229-5518
IJSER © 2018 http://www.ijser.org
international conference on innovation andmanagement
(pp. 289–293). Wuhan University of Technology.
Dr.Olukayode Emmanuel, MAKU is a lecturer at the Department of Economics, Olabisi Onabanjo University, Ago-Iwoye, Ogun State, Nigeria.
Soliu Bidemi, ADEGBOYEGA Is a lecturer at the Department of Economics, Olabisi
Onabanjo University, Ago-Iwoye, Ogun State,
Nigeria.
Mr. Aduralere O., OYELADE is a lecturer at the
University of Ibadan, Nigeria
IJSER