the impact of financial crisis on the efficiency of superannuation funds · · 2018-02-07the...
TRANSCRIPT

16 JLFM / 2011 VOL 10 ISSUE 2
THE IMPACT OF FINANCIAL CRISIS ON THE EFFICIENCY OF SUPERANNUATION FUNDS EVIDENCE FROM AUSTRALIA
MILIND SATHYE
Though superannuation funds play an important role in any economy, little is known about their efficiency as the literature on production efficiency is mainly concerned with banks and insurance companies. This paper analyses the production efficiency of retail superannuation funds in Australia from 2005 to 2009. The estimates of production efficiency were obtained using Data Envelopment Analysis and thereafter regressed on contextual variables using the Tobit model. The study finds that fund characteristics, like size and proportion of funds invested in non-risk avenues, have significant positive association while diversification and financial crisis each have a significant negative association, with the production efficiency of retail superannuation funds in Australia. The findings are relevant to a government appointed major review of the superannuation industry tasked to examine, inter alia, the efficiency of superannuation funds. From the applied or practice perspective, the findings could help firms within the industry determine merger or acquisition targets.

JLFM / 2011 VOL 10 ISSUE 2 17
INTRODUCTIONRetail superannuation funds (RSFs) are superannuation entities with more than four members that offer superannuation products to the public on a commercial basis (APRA, 2009). The RSFs dominate the large funds segment of the superannuation industry and so occupy a predominant position in the Australian economy. The domination of the RSFs, which comprise 44 per cent of the large funds market, is expected to continue (APRA, 2009). They are the fastest growing type of investment vehicle as measured by growth in assets under management (Clements et al., 2006). Assessing the efficiency of the superannuation sector, in general, and the RSFs in particular, is important because the structure of Australia’s superannuation system and the conduct of RSFs within it directly impacts performance. An inefficient system could result in the delivery of costly retail products which provide limited value to investors over the long term (Clements et al., 2006).
Although the RSFs play an important role in many economies, little is known about their production efficiency. The literature on production efficiency is mainly concerned with banks and insurance companies. Furthermore, the impact of the financial crisis on the performance of these institutions is yet to be examined. By providing evidence from an under-researched segment of the finance sector, the present study aims to advance our understanding of the efficiency of financial intermediaries. An immediate motivation for the study is the establishment of a major review of the superannuation industry by the Australian government with a mandate, to examine inter alia, the efficiency of superannuation funds. The examination of the production (managerial) efficiency of a prominent category of superannuation funds — the retail funds — thus has immediate policy relevance. From the applied or practice perspective, the findings could help firms within the industry determine merger or acquisition targets.
Methodologically, we improve upon prior studies relating to the efficiency of the superannuation industry. These studies have typically used multiple regression analysis to examine the link between production efficiency and contextual variables such as the size and risk profile of the superannuation fund. However, multiple regression is not appropriate since the dependent variable is bounded by zero and one. Consequently, following Collie, Rao and Battese (1998), we use the Tobit model in this study. Furthermore, to our knowledge, this is the first study to examine the impact of the financial crisis on the
efficiency of superannuation funds. Australia presents an interesting site for this study. Its superannuation sector witnessed the second worst losses amongst the OECD countries during the global financial crisis, but its economy was relatively unaffected.
The specific aims of the study are: (a) to measure production efficiency of RSFs in Australia; (b) to examine the relationship between the firm characteristics and production efficiency; and (c) to examine the impact of the financial crisis on RSF efficiency. The production efficiency of RSFs is estimated by Data Envelopment Analysis (DEA). The choice of this technique is explained below. The impact of both the financial crisis and organisational characteristics on RSF production efficiency is examined by Tobit regression.
The next section provides an overview of the superannuation industry in Australia. Section 3 reviews the literature and section 4 provides the data and analysis. Section 5 presents results. Section 6 concludes.
OVERVIEW OF THE SUPERANNUATION INDUSTRY IN AUSTRALIASuperannuation funds play a pivotal role in the Australian economy. The funds not only provide a retirement investment vehicle for a majority of Australians but also play an important role in financing the corporate sector. The development of a substantial pool of superannuation savings brought about a large structural change in corporate financing (Henry, 2009). Superannuation funds are also the source of approximately half of the venture capital funding and later stage private equity funding in Australia (IFSA, 2009).
Superannuation as a form of savings has existed for more than a century in Australia, but its coverage was restricted. The superannuation guarantee introduced in 1992 required employers to make tax deductible contributions to superannuation accounts of their employees. The mandatory contribution rate was raised to nine per cent of employee earnings from 2002–03. In May 2010, the Government announced a phased increase in the mandatory contribution to 12 per cent. The superannuation fund can be operated by the employer, industry association, financial services companies or by the employees as individuals.
Superannuation is considered as one of the three pillars of retirement savings in Australia — the other two are the age pension and voluntary savings. The

18 JLFM / 2011 VOL 10 ISSUE 2
Superannuation Industry (Supervision) Act 1993 (SIS) provides the regulatory framework for the superannuation industry in Australia.
The total assets of superannuation funds amounted to A$1.23 trillion in 2009. The six major types of funds, and the value of the assets held by them, are indicated in Table 1.
Table 1: The Australian Superannuation Funds Industry 2009
TYPE OF FUND TOTAL ASSETS NUMBER OF FUNDS NO OF ACCOUNTS IN MILLION
CORPORATE 59.9 3.1 0.7
INDUSTRY 218.9 65 11.6
PUBLIC SECTOR 172.6 39 3.1
RETAIL 345.7 154 16.6
FUNDS WITH LESS THAN 5 MEMBERS
386.1 420,129 0.8
BALANCE OF STATUTORY
FUNDS48.5
TOTAL 1231.8 420,639 32.7
Table 1 shows that RSFs hold a dominant position in the large superannuation funds industry. A fund with less than five members is referred to in Australia as a self-managed superannuation fund. (SMSF). SMSFs are supervised by the Australian Taxation Office, whereas other superannuation funds are supervised by the Australian Prudential Regulation Authority (APRA). APRA identifies four types of superannuation funds: Corporate, Public Sector, Industry and Retail. Of these, the retail funds are run on commercial basis while the rest are ‘not for profit’ funds. Corporate funds are sponsored by a single employer or a group of employers. Public sector funds are sponsored by a government department, agency or government-controlled business enterprise. Industry funds are created as part of industrial award agreements between unions and employer representatives. Retail funds provide superannuation services for profit and are managed by professional financial institutions.
LITERATURE REVIEW AND FRAMEWORKThe performance of retirement savings vehicles, such as pension or superannuation funds, is an emerging area of academic interest. Davis (1995) found that high administrative costs reduce investment returns and, consequently, the pension, in defined contribu-tion funds. Administrative costs for defined benefit funds were found to be higher than those of defined contribution funds (Hannah, 1986, Turner et al., 1989 and Andrews, 1993). Hurd (1990) and Blake (1994, 1997) found that costs of personal pen-sion funds are much higher than those of company plans due to factors such as scale and market power. Thomas and Tonks (2001) found that pension funds follow very similar investment strategies, so that it is difficult to identify performance significantly above the mean.
Some studies have investigated how pension fund characteristics such as defined benefit and defined contribution affect administrative costs. The US studies in this area are by Caswell (1976) and Mitchell

JLFM / 2011 VOL 10 ISSUE 2 19
and Andrews (1981) and in Australia by Bateman and Mitchell (2004). Some researchers have examined the individual account fees and administrative costs in defined contribution pension schemes in countries around the world (e.g. Dobronogov and Murthi, 2005, James, Smalhout and Vittas, 2001). These studies reveal that scale economies could be improved significantly in pension funds. The studies also find large differences in efficiency across countries. Bikker and de Dreu (2006) studied efficiency by type of pension fund in the Netherlands and found that industry-wide pension funds were significantly more efficient than company funds and other funds.
In Australia, Coleman et al., (2006) studied investment performance of Australian superannuation funds and found significant differences across fund types. Retail and industry funds have lower returns and volatility, and higher expenses, while public sector and corporate funds have the highest returns and volatility, and lowest expenses. Sy and Liu (2009) found that, for superannuation funds in Australia, higher operational costs are significantly correlated with lower net investment performance. Ellis et al., (2008) examined the investment performance of large superannuation funds in Australia. They concluded that retail trustees using balanced or growth investment strategies for default investment options on average generated significantly lower net returns than not-for-profit trustees using similar strategies.
Few studies have used Data Envelopment Analysis (DEA) to measure the production efficiency (that is, production of goods and services at minimum cost) of superannuation funds. Braberman et al. (1999) analysed pension funds in Argentina using the Cobb-Douglas cost frontier model. Operating costs were regressed on three independent variables: number of fund members, participants switching from one pension fund to another and profitability of the fund. These researchers found that although regulation increased total costs, it did not significantly affect relative efficiency. Barrientos and Boussofiane (2005) analysed the technical efficiency (that is, using minimum quantity of factor inputs to produce a given quantity of output) of Chilean pension funds. These authors used two outputs, total revenue and the number of contributors, and three inputs, marketing and sales costs, office personnel and executive pay, administration and computing costs. The researchers computed the DEA scores in the first instance and then regressed the efficiency scores on contextual variables. Barros and Garcia (2006) analysed the technical efficiency of superannuation funds in Portugal. The outputs were number of funds, value
of the funds and pensions paid. The inputs were the number of full time staff, book value of fixed assets and contributions received. These authors did not find any continuous trend towards an improvement in technical efficiency. The study found that eight out of 12 pension fund management companies were on the technical efficiency frontier as per the Banker, Charnes and Cooper (1984) model. Barros, Ferro and Romero (2008) used a stochastic frontier model to study the technical efficiency of 10 pension funds in Argentina and found that the mean technical efficiency was 0.86.
The present study contributes to the literature on superannuation funds efficiency in several ways. First, we use a two stage procedure similar to that of Barrientos and Boussofiane (2005). However, these authors used a multiple regression while Collie, Rao and Battese (1998) advise the use of the Tobit model given that the dependant variable is bounded by zero and one. We use Tobit model at the second stage. The other two studies indicated above have not deployed the two-stage procedure. Second, we analyse the efficiency of the hitherto unexplored Australian superannuation industry. The industry is one of the largest in OECD countries. In June 2007, superannuation assets represented more than 114 per cent of GDP (APRA, 2009). As per OECD (2009a) country profile, Australia spends less on public pension, 3.5 per cent of GDP, compared to the OECD average of 7.2 percent of GDP. Consequently, the performance of private sector funds becomes particularly important. Third, to our knowledge, the impact of the financial crisis on superannuation funds is yet to be studied. Australia provides an appropriate case to investigate as Australia’s superannuation funds have been heavily hit by the financial crisis, with real losses of 26.7 per cent in 2008. This was the second worst investment performance for private pension funds in 30 OECD countries (OECD, 2009b).
DATA AND METHOD
DataThe required data for the study was obtained from APRA statistical statements for the years 2005–09. These data are available on the APRA website.
MethodThe selection of retail funds to be included in the sample was guided by the availability of data on the variables used in the Tobit model, and on the inputs and outputs required for estimating production efficiency scores. Of the 154 retail funds, data on all

20 JLFM / 2011 VOL 10 ISSUE 2
the necessary variables was available for 132 (2005), 126 (2006), 127 (2007), 128 (2008) and 114 (2009). Accordingly, only these funds were included in the sample.
The literature on the measurement of efficiency is dominated by two methods, that is, DEA and Stochastic Frontier Analysis (SFA). DEA is a non-parametric technique while SFA is a parametric technique. DEA has an advantage over SFA as it can be used where multiple outputs are produced using multiple inputs. SFA, on the other hand, can only account for one output (Assaf et al., 2011). However, SFA can account for measurement errors, whereas DEA cannot. As RSFs produce multiple outputs using multiple inputs, DEA was the appropriate method of estimating production efficiency scores.
DEA involves construction of an efficiency frontier (best practice) against which the performance of decision-making units (DMUs) in the sample is examined. The inputs and outputs are specified and the linear programming problem is solved which yields efficiency scores that are bounded by zero and one.
Assume N DMUs convert I inputs into J outputs. I can be greater, equal to or less than J. Charnes, Cooper and Rhodes (1978) propose the use of the maximum of a ratio of weighted outputs to weighted inputs for that unit, subject to the condition that similar ratios for all other DMUs be less than or equal to one. That is:
(1) Max e0
=
ujo yj
o
j=1
J
∑
vio xi
o
i=1
I
∑
Subject to
; n = 1,…..N,uj
o yjn
j=1
J
∑
vio xi
n
i=1
I
∑≤1
vio,uj
o ≥ 0; i= 1,….,I; j=1,…..J.
where yjn , x j
n
are positive known outputs and inputs of the nth DMU and vi
o ,ujo
are the variable weights to be determined by solving problem (1). The DMU being measured is indicated by the superscript 0, which is referred to as the base DMU. The maximum of the objective function eo given by problem (1) is the DEA efficiency score assigned to DMU 0.
Since every DMU can be DMU0, this optimisation problem is well-defined for every DMU. If the efficiency score eo =1, DMU0 satisfies the necessary condition to be DEA efficient; otherwise it is DEA-inefficient.
It is difficult to solve problem (1) as stated, because the objective function is non-linear and fractional. Charnes et al (1978), transformed the above non-linear programming problem into a linear one as follows:
Maxho = ujo
j=1
J
∑ yjo
Subject to
vio
i=1
I
∑ xio = 1
, uj
o
j=1
j
∑ yjn − vi
o
i=1
I
∑ xin ≤0
n = 1,……N,
vio ≥ ε , i=1,….I, and uj
o ≥ ε , and ujo ≥ ε , j=1,…..,J.
The variables defined in problem (2) are the same as those defined in problem (1). An arbitrarily small positive number, ε is introduced in problem (2) to ensure that all of the known inputs and outputs have positive weights, and that the optimal objective function of the dual problem to problem (2) is not affected by the values assigned to the dual slack variables in computing the DEA efficiency score for each DMU. The condition ho =1 ensures that the base DMUo is DEA efficient; if not, it is DEA inefficient with respect to all other DMUs in the test. A complete DEA model involves the solution of N such problems, each for a base DMU, yielding N different ( vi
n ,ujn ) weight sets. In each program, the constraints
are held constant while the ratio to be maximised is changed.
Inputs and Outputs for DEA Mode DEA analysis requires inputs and outputs to be specified. Prior studies and the availability of data guided our selection of inputs and outputs. We use two inputs: operating expenses and contributions received. Our chosen outputs are value of the fund and benefits

JLFM / 2011 VOL 10 ISSUE 2 21
paid. Superannuation funds invest contributions received from members and employers, and incur operational expenses to produce value as reflected in their net assets and in benefits paid to members. Operating expenses capture the staffing expenses as well as administrative, marketing and other operating expenses. Several researchers have used operating expenses as an input to measure the efficiency of financial institutions (for example, Avkiran, 1999). Contributions are akin to bank deposits which are commonly used as input in DEA studies of banks. The value of the superannuation fund, as measured by value of net assets at the end of the year, has been used as an output in previous studies of superannuation fund efficiency (for example, Barros and Garcia, 2006). Benefits paid are a proxy for risk-pooling and risk-bearing functions (Cummins et al., 1999).
We measure performance (production efficiency) of superannuation funds and relate it to contextual variables drawn from the theory of structure, conduct and performance. Following prior studies, firm size is measured by the number of members of the retail super fund, diversification by the number of investment products offered and risk by the proportion of funds invested in non-risk avenues such as cash and Australian / overseas fixed interest.
As the dependent variable is not continuous but bounded by zero and one, as already stated above, we estimate the Tobit function. The model can be represented as follows:
yi =β1 + β2X2i + µ2i
if the right hand side is >0, otherwise = 0. The method of maximum likelihood is used to estimate such a model.
The relationship between production efficiency and contextual variables that we examine can be modelled as follows.
yi = β0 + β1sizei + β2diversei + β3nonriski + β4FCi + ei
Dependent variable: The dependent variable represents production efficiency scores. The production efficiency was measured by constant returns to scale (CRS). The CRS captures both variable returns to scale efficiency and scale efficiency. Following previous studies the CRS production efficiency score has been used as the dependent variable.
Independent Variables:
Size: In the literature, size is measured by total assets, number of members, or number of branches in the case of banks. The asset values of superannuation funds are subject to wide fluctuations as is demonstrated by the global financial crisis. Consequently, for the purposes of this study, we measure size by number of members of the fund. Larger size could result in scale efficiency and is expected to have a positive association with performance as measured by production efficiency a priori.
Diverse: Product diversification is measured by the number of the RSFs investment options. It signifies economies of scope. The impact of diversification on firm performance is mixed (Rogers (2001), Pandya and Rao, 1998), Datta et al., (1991) and Hoskisson and Hitt (1990)). Consequently, no sign is assigned a priori for the ‘diverse’ variable.
Risk: The risk variable is measured by the proportion of investment in non-risk avenues. Investment in such avenues is expected to lead to steady growth in the value of the fund. We expect a positive association between efficiency and proportion of funds invested in non-risk avenues.
Financial Crisis: In the model, FC is a binary variable where 1 represents the financial crisis years and zero non-financial crisis years. The ffinancial crisis hit Australia in September 2008 when Lehman Brothers collapsed and the government announced a stimulus package to prevent the economy from going into recession. The year ending June 2009 was the financial crisis year for which FC is set equal to one, for other years, it is zero.
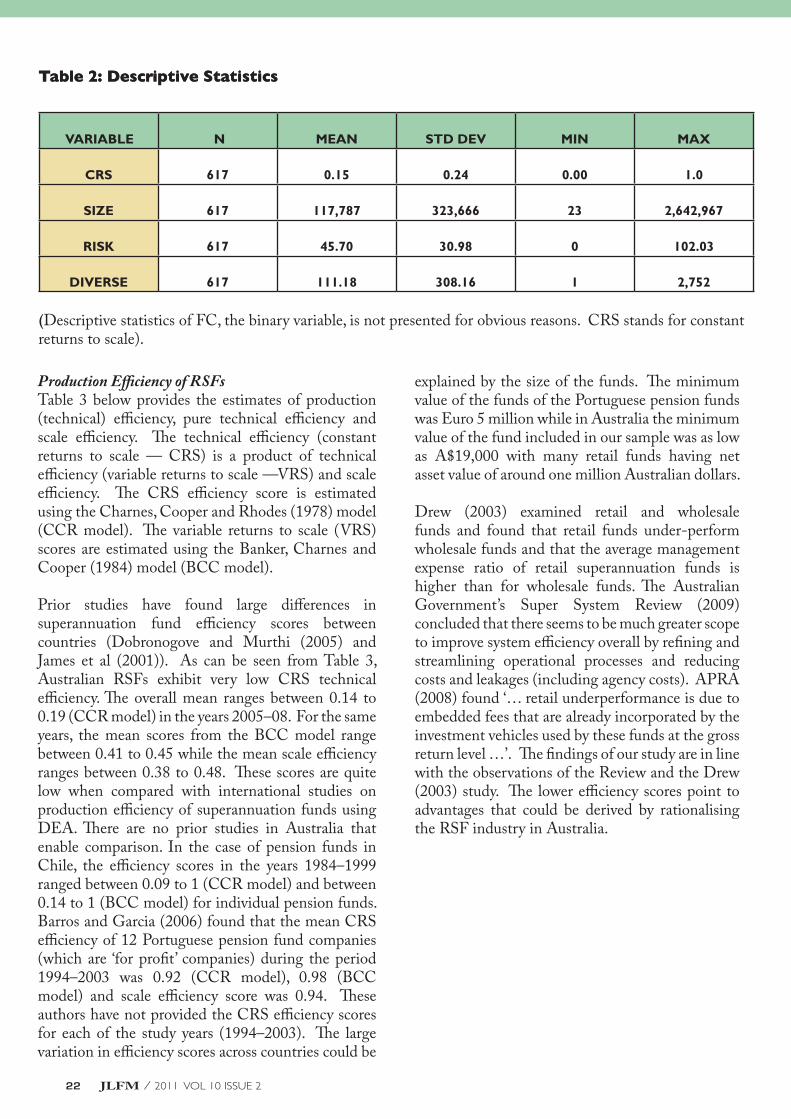
RESULTS AND DISCUSSIONIn the following paragraphs the results from the above analysis are presented and discussed. The descriptive statistics on the variables used in the model are presented below:
22 JLFM / 2011 VOL 10 ISSUE 2
Table 2: Descriptive Statistics
VARIABLE N MEAN STD DEV MIN MAX
CRS 617 0.15 0.24 0.00 1.0
SIZE 617 117,787 323,666 23 2,642,967
RISK 617 45.70 30.98 0 102.03
DIVERSE 617 111.18 308.16 1 2,752
(Descriptive statistics of FC, the binary variable, is not presented for obvious reasons. CRS stands for constant returns to scale).
Production Efficiency of RSFsTable 3 below provides the estimates of production (technical) efficiency, pure technical efficiency and scale efficiency. The technical efficiency (constant returns to scale — CRS) is a product of technical efficiency (variable returns to scale —VRS) and scale efficiency. The CRS efficiency score is estimated using the Charnes, Cooper and Rhodes (1978) model (CCR model). The variable returns to scale (VRS) scores are estimated using the Banker, Charnes and Cooper (1984) model (BCC model).
Prior studies have found large differences in superannuation fund efficiency scores between countries (Dobronogove and Murthi (2005) and James et al (2001)). As can be seen from Table 3, Australian RSFs exhibit very low CRS technical efficiency. The overall mean ranges between 0.14 to 0.19 (CCR model) in the years 2005–08. For the same years, the mean scores from the BCC model range between 0.41 to 0.45 while the mean scale efficiency ranges between 0.38 to 0.48. These scores are quite low when compared with international studies on production efficiency of superannuation funds using DEA. There are no prior studies in Australia that enable comparison. In the case of pension funds in Chile, the efficiency scores in the years 1984–1999 ranged between 0.09 to 1 (CCR model) and between 0.14 to 1 (BCC model) for individual pension funds. Barros and Garcia (2006) found that the mean CRS efficiency of 12 Portuguese pension fund companies (which are ‘for profit’ companies) during the period 1994–2003 was 0.92 (CCR model), 0.98 (BCC model) and scale efficiency score was 0.94. These authors have not provided the CRS efficiency scores for each of the study years (1994–2003). The large variation in efficiency scores across countries could be
Table 2: Descriptive Statistics
explained by the size of the funds. The minimum value of the funds of the Portuguese pension funds was Euro 5 million while in Australia the minimum value of the fund included in our sample was as low as A$19,000 with many retail funds having net asset value of around one million Australian dollars.
Drew (2003) examined retail and wholesale funds and found that retail funds under-perform wholesale funds and that the average management expense ratio of retail superannuation funds is higher than for wholesale funds. The Australian Government’s Super System Review (2009) concluded that there seems to be much greater scope to improve system efficiency overall by refining and streamlining operational processes and reducing costs and leakages (including agency costs). APRA (2008) found ‘… retail underperformance is due to embedded fees that are already incorporated by the investment vehicles used by these funds at the gross return level …’. The findings of our study are in line with the observations of the Review and the Drew (2003) study. The lower efficiency scores point to advantages that could be derived by rationalising the RSF industry in Australia.

JLFM / 2011 VOL 10 ISSUE 2 23
Table 3: Production Efficiency Scores of Retail Superannuation Funds in Australia
n MEAN SD MIN MAX
2005 CRS 132 .14 .24 .00 1
VRS 132 .41 .33 .00 1
SCALE 132 .38 .31 .03 1
2006 CRS 126 .19 .27 .01 1
VRS 126 .44 .33 .02 1
SCALE 126 .48 .90 .05 1
2007 CRS 127 .15 .22 .01 1
VRS 127 .41 .33 .02 1
SCALE 127 .44 .30 .01 1
2008 CRS 118 .17 .26 .00 1
VRS 118 .45 .34 .01 1
SCALE 118 .39 .33 .04 1
2009 CRS 114 .07 .19 .00 1
VRS 114 .47 .35 .01 1
SCALE 114 .15 .25 .01 1
2005 2006 2007 2008 2009
TOTAL FIRMS 132 126 127 118 114
FIRMS ON THE CRS FRONTIER 8 8 4 6 3
FIRMS ON THE VRS FRONTIER 18 19 16 18 21
FIRMS ON THE SCALE FRONTIER 10 8 6 7 4
Table 4: Analysis of DEA Scores

24 JLFM / 2011 VOL 10 ISSUE 2
From Table 4, it is apparent that only a few retail funds were on the efficiency frontier. Many funds operate at low levels of technical efficiency. For example, in the year ending June 2008 (pre-crisis year), only 30 firms had CRS efficiency scores in the fourth quartile, that is, 0.75 to 1. The large number of retail funds operating at unacceptable levels of inefficiency, when compared to their counterparts overseas as indicated by studies mentioned earlier, calls for urgent action to rationalise the sector. It is expected that the Review commissioned by the government will lead to concrete policy actions to ensure that the sector operates efficiently.
In Table 5, we present the results of Tobit regression.
n
617 LR chi2(4) 59.41
LOGLIKELIHOOD 1.667 Prob > chi2 0.00Pseudo R2 0.97
Co-eff t pvalueCRSRISK .0011 3.57 0.00
DIVERSE -.0001 -3.55 0.00FC -.1316 -5.21 0.00
LOGSIZE .0188 4.12 0.00CONSTANT -.0578 -1.20 0.23
Table 5: Tobit Regression Results
(Notes: Normality was checked by skewness and kurtosis and was not found to be an issue. Multicollenearity was not an issue either as variance inflation factor (VIF) values were less than 10 for all variables)
As expected, the contextual variables are significant and have the expected relationships to the dependent variable production efficiency score with expected signs.
Size: The logsize variable has as expected a positive coefficient and is significant. Our results are in line with prior studies that have found a positive and significant impact on efficiency due to economies of scale, for example, Gale (1972), Sheppard, (1972). Prior studies by Dobronogov and Murthi (2005) and James et al (2001) also find that there is room to improve scale economies in superannuation funds. The Super Review (2009) has emphasised the need to improve scale economies in superannuation funds and our study provides empirical support to the contention of the Super Review.
Risk: The variable is measured by proportion of investment in non-risk avenues. A higher proportion of investment in non-risk avenues is found to result in a positive impact on efficiency. This is because investment in such avenues results in steady growth in the value of the fund.
Diverse: The variable as measured by number of investment options is found to have a negative impact on efficiency. Our results are in line with prior work of Rogers (2001) in the context of Australian firms which also found that more focused (less diversified) firms have better performance.
Financial Crisis: As expected the binary financial crisis variable has significant and negative association with the dependent variable. This result means that the financial crisis had a significant negative impact on CRS technical efficiency. This is expected as the outputs used in calculation of DEA efficiency are benefits paid and net asset values at the end of the year. The financial crisis impacted on efficiency through a decline in the market value of investments. As the value of investments made by the superannuation funds fell, the net assets declined rapidly, which in turn affected output values (comprising net assets and benefits paid). However, contributions received and operating expenses did not decline as rapidly as asset values. Consequently, while inputs remained more or less the same, the output values declined rapidly, resulting in a lower efficiency in the crisis

JLFM / 2011 VOL 10 ISSUE 2 25
year. Accordingly, the impact of the financial crisis on efficiency is through lower output values rather than increased input values.
CONCLUSIONThe study estimated the production efficiency of retail superannuation funds in Australia for the years 2005 to 2009. Data envelopment analysis was used to estimate efficiency scores. Overall, the efficiency of Australia’s retail funds was found to be low. Though some countries, Chile, for example, had comparable efficiency scores, other countries, Portugal, for example, have much higher efficiency scores as compared to Australia. The efficiency scores were then related to contextual variables like firm size, diversification, and risk drawn from the structure, conduct and performance hypothesis. The relationship was examined using the censored regression model. It was found that size and proportion of funds invested in non-risk avenues are found to have positively associated with production efficiency. The financial crisis and diversification were found to have significant and negative association with the dependent variable. There are too many small superannuation funds operating in the retail superannuation funds sector in Australia. Our study indicates that economies of scale could be achieved through rationalisation of the sector. It is suggested that mergers and acquisitions be encouraged so as to enhance production efficiency of the retail superannuation funds and the sector as a whole which would ultimately benefit investors in terms of lower fees.
Future research may like to examine the relative performance of retail superannuation funds vis-a-vis other types of superannuation funds in Australia.
REFERENCESE Andrews, Private Pensions in the United States, OECD Series on Private Pensions and Public Policy (Organization for Economic Cooperation and Development, Paris, 1993).
Australian Prudential Regulation Authority, Statistics: Quarterly Superannuation Performance (December 2009, Sydney, issued 11 March 2010) <http://www.apra.gov.au/Statistics/Quarterly-Superannuation-Performance.cfm>(2009a).
Australian Prudential Regulation Authority, Superannuation Industry Overview (APRA Insight, Issue 2, 2009). (2009b).
Australian Prudential Regulation Authority, Investment Performance, Asset Allocation and Expenses of Large Superannuation Funds (APRA Insight, Issue 3, 2008).
A Assaf, C Barros and R Matousek, ‘Productivity and Efficiency Analysis of Shinkin Banks: Evidence from Bootstrap and Bayesian Approaches’ (2011) 35(2) Journal of Banking and Finance 331–42.
Australian Government, Issues Paper, Australian Government Super System Review — Review into the Governance, Efficiency, Structure and Operation of Australia’s Superannuation System (Canberra, 16 October 2009).
N K Avkiran, ‘The Evidence on Efficiency Gains: The Role of Mergers and the Benefits to the Public’ (1999) (23) Journal of Banking and Finance 991–1013. (1999b)
R D Banker, A Charnes and R Cooper, ‘Some Models for Estimating Technical and Scale Inefficiencies in Data Envelopment Analysis’ (1984) 30 Management Science 1078–92.
C Barros and M Garcia, ‘Performance Evaluation of Pension Funds Management Companies with Data Envelopment Analysis’ (2006) 9(2) Risk Management and Insurance Review 165–88.
A Barrientos and A Boussofiane, ‘How Efficient Are the Pension Funds Managers in Chile?’ (2005) 9(2) Revista de Economia Contemporˆanea 289–311.
C Barros, G Ferro and C Romero, 2008. ‘Technical Efficiency and Heterogeneity of Argentina Pension Funds’ (Working Papers 2008/29, Department of Economics at the School of Economics and Management (ISEG), Technical University of Lisbon).
H Bateman and O Mitchell, ‘New Evidence on Pension Plan Design and Administrative Expenses: The Australian Experience’ (Discussion Paper 03/03, Centre for Pensions and Superannuation, University of New South Wales, Sydney, 2004).
J Bikker and J de Dreu, ‘Operating Costs of Pension Funds: The Impact of Scale, Governance and Plan Design (2006) 8 Journal of Pension Economics and Finance 63–89.
D Blake, Pension Schemes as Options on Pension Funds

26 JLFM / 2011 VOL 10 ISSUE 2
Assets: Implications for Pension Funds Asset Management (Birkbeck College, London, 1994).
D Blake, ‘Pension Choices and Pension Policy in the United Kingdom’ in S Vald´es-Prieto (ed), The Economics of Pensions (Cambridge University Press, Cambridge, 1997) 277–317.
D G Braberman, O Chisari, L Quesada and M Rossi, ‘Funci´on de Costos en la Industria de las Administradoras de Fondos de Jubilaciones y Pensiones en la Argentina: Un An´alisis de las Modificaciones Regulatorias’ (1999) 14 Revista de An´alisis Ec´onomico 121–42.
J W Caswell, ‘Economic Efficiency in Pension Plan Administration: A of the Construction Industry’ (1976) 42 Journal of Risk and Insurance 257–73.
A Charnes, W Cooper and E Rhodes, ‘Measuring the Efficiency of Decision-Making Units’ (1978) 2 European Journal of Operations Research 429–44.
A Clements, G Dale and M Drew, ‘Australia’s Retail Superannuation Fund Industry: Structure, Conduct and Performance’ (2006) 12(2) Accounting, Accountability and Performance 1–32.
T Coelli, P Rao and G Battese, ‘An Introduction to Efficiency and Productivity Analysis’ (Kluwer Academic Press, Boston, 1998).
A Coleman, N Esho and M Wong, The Impact of Agency Costs on the InvestmentPerformance of Australian Pension Funds (2006) 5(3) Journal of Pension, Economics and Finance 299–324.
J Cummins, S Tennyson and A Weiss, ‘Consolidation and Efficiency in the US Life Insurance Industry’ (1999) 23 Journal of Banking and Finance 325–57.
D Datta, N Rajagopala and A Rasheed, ‘Diversification and Performance: Critical Review and Future Directions’ (1991) 28(5) Journal of Management Studies 529–58.
E Davis, Pension Funds-Retirement-Income Security and Capital Markets — An International Perspective (Clarendon Press, Oxford, 1995).
A Dobronogov and M Murthi, ‘Administrative Fees and Costs of Mandatory Private Pensions in Transition Economies’ (2005) 4(1) Journal of Pension Economics and Finance 31–55.
M Drew and J Stanford, ‘Retail Superannuation Management in Australia: Risk, Cost and Alpha’ (Discussion Paper No. 126, Queensland University of Technology, Brisbane, 2003).
K Ellis, A Tobin and B Tracey, Investment Performance, Asset Allocation and Expenses of Large Superannuation Funds (APRA Insight, Issue 3, 2008) 2–20.
B T Gale, ‘Market Share and Rate of Return’ (1972) 54 Review of Economics and Statistics 412–23.
L Hannah, Occupational Pension Funds: Getting the Long-Term Answers Right, Discussion Paper No. 99 (Centre for Economic Policy Research, London, 1986).
K Henry, ‘Towards A Better Taxation of Savings’ (Speech delivered to the Australian Conference of Economists Business Symposium by Dr Ken Henry, Chair, Australia’s Future Tax System Review Panel and Secretary to the Treasury, 1 October 2009.
M Hitt, R Hoskisson and R Ireland, ‘Mergers and Acquisitions and Managerial Commitment to Innovation in M-form Firms’ (1990) 11 Strategic Management Journal 29–47.
M D Hurd, ‘Research on the Elderly: Economic Status, Retirement and Consumption and Saving’ (1990) 28 Journal of Economic Literature 565–637.
E James, J Smalhout and D Vittas, Administrative Costs and the Organization of Individual Account Systems: A Comparative Perspective (Organisation for Economic Cooperation and Development, Paris, 2001) 17–83.
Investment and Financial Services Association Ltd, IFSA Submission: Review into the Governance, Efficiency, Structure and Operation of Australia’s Superannuation System (25 August 2009) <http://www.ifsa.com.au/submissions>.
Organisation for Economic Cooperation and Development, Pension at a Glance 2009: Retirement-income Systems in OECD Countries (2009) <www.oecd.org/els/social/pensions> (Retrieved 22 April 2010) (2009a).
Organisation for Economic Cooperation and Development, Australia: Highlights of OECD Pensions at A Glance: Retirement-income Systems in OECD Countries (2009) <www.oecd.org/els/social/pensions> (Retrieved 22 April 2010) (2009b).

JLFM / 2011 VOL 10 ISSUE 2 27
O Mitchell and E Andrews, ‘Scale Economies in Private Multi-employer Payment Systems’ (1981) 54(4) Industrial and Labor Relations Review 522.
A Pandya and N Rao, ‘Diversification and Firm Performance: An Empirical Evaluation’ (1998) 11 (2) Journal of Financial and Strategic Decisions 67–81.
M Rogers, ‘The Effect of Diversification on Firm Performance’ (Melbourne Institute Discussion Paper 2/01, Melbourne, 2001).
W G Shepherd, ‘The Elements of Market Structure’ (1972) 54 Review of Economics and Statistics 25–35.
W Sy and K Liu, ‘Investment Performance Ranking of Superannuation Firms’ (Research Working Papers, Australian Prudential Regulation Authority, Sydney, 2009).
A Thomas and I Tonks, ‘Equity Performance of Segregated Pension Funds in the UK’ (2001) 1(4) Journal of Asset Management 321–43.
J Turner and D Beller, Trends in Pensions (US Department of Labor. Washington DC, 1989).
A U T H O R P R O F I L E
Professor Milind Sathye is Professor of Banking and Finance and Head of Accounting, Banking and Finance at the University of Canberra. Prior to joining academia, Professor Sathye worked for nearly two decades in the Reserve Bank of India (National Bank). His areas of research focus are efficiency and productivity in the financial sector, microfinance and electronic banking. He currently holds two competitive external grants.