the impact of exchange listing on corporate governance...
TRANSCRIPT

The Impact of Exchange Listing on Corporate Governance: Evidence from Non-Listed REITs
Dan W. French
Trulaske College of Business University of Missouri
Andrew Kern Trulaske College of Business
University of Missouri [email protected]
Thibaut G. Morillon
Trulaske College of Business University of Missouri [email protected]
Adam Yore
Trulaske College of Business University of Missouri [email protected]
September 2017
Abstract
We study the value of exchange listing to a previously unlisted public firm. Using the unique laboratory of public non-listed REITs that transition to public listing, we are able to investigate the changes in the firms’ governance around listing to draw conclusions about both the influence of public market participants on governance and managements’ incentives for rent extraction. We find results that are consistent with improved governance after listing while documenting characteristics of transitioning firms that may imply managerial rent extraction among non-listed firms. We discuss these results in the context of the prior literature on non-listed REITs that suggests non-listed REITs are poorly governed and typically not investor-friendly.
Keywords: exchange listing, corporate governance, REITs

1
The Impact of Exchange Listing on Corporate Governance: Evidence
from Non-Listed REITs
1. Introduction
In this paper, we study the impact that a public listing has on the corporate governance of
the listing firm. Doing so allows us to contribute to the literature by documenting the influence
public market participants may have over such issues as board structure, compensation and
managerial incentives.
Much of the literature has focused on public listing as a method by which managers can
increase the firm’s investor base (Merton (1987), Kadlec and McConnell (1994)), signal the
quality of the firm to potential investors (Ying et. al (1977), Sanger and McConnell (1986)), or
merely raise capital for the firm. Yet scant attention has been given to the changes in governance
of the firm around listing. This is understandable. Typically, exchange listing is accompanied by
the firm’s initial public offering, whereby the firm simultaneously lists its stock on the exchange
and, for the first time, offers it for sale to the public. Thus, the governance of the firm is
unobservable prior to listing merely because the firm is not subject to the SEC requirements for
disclosure.
This is not always the case, however. A unique subsample of public firms, public non-
listed real estate investment trusts (REITs), can go public without listing. This means that
information about these firms is available because, although their shares do not trade on any
exchange or public market, they are registered with the SEC and the firm is thus required to
periodically file SEC-mandated forms as would any other public firm. Some of these firms
ultimately transition to a public listing. Studying those that transition provides insight in to the

2
value of listing in general by allowing us to compare characteristics of the firm before the listing
with those after the listing. In any other environment this would not be possible.
Additionally, most of the limited extant literature on public non-listed REITs has given
reason to question whether they are even viable investments. Shares of such firms are typically
sold to retail investors through brokers that charge high broker and sales commissions,
sometimes approaching 15% (Corgel and Gibson (2008), Wiley (2017)) and come with back-end
loads and managerial participation in residual cash flows. Because the shares do not trade and
thus share prices are unobservable, the monitoring of such firms more difficult. Moreover,
because the management of such firms is not subject to the pressures of public market
participants, managerial rent extraction opportunities may be exacerbated (Wiley (2017)).
Our results suggest that listing does indeed cure many of the corporate governance ills
associated with public non-listed REITs. The firms become less opaque, have more independent
boards and design better compensation structures. A public non-listed REIT is typically owned
exclusively by retail investors, a phenomenon documented by Corgel and Gibson (2008). This is
due largely to the manner in which the shares are marketed and sold. However, upon a transition
to listed status institutional ownership becomes substantial. We corroborate the findings of
Corgel and Gibson (2008) in our sample and argue that the increase contributes to the market
influences that trigger changes in corporate governance.
A better understanding of the pressures and influences market participants have on the
design of a firm’s governance is an important contribution to the literature. However, our results
showing improved corporate governance would also suggest that, prior to listing, the firms in our
sample may be vulnerable to rent extraction on the part of management merely because the
CEOs of poorly governed firms can more easily extract rents (Bebchuck, Fried and Walker
3
(2002)). We explore this possibility and find evidence that REITs that elect to list are on average
bigger, younger, more transparent, more profitable and more likely to be professionally managed
than REITs that elect not to list.
The remainder of this paper is organized as follows. Section 2 provides some
background on public non-listed REITs. Section 3 reviews the literature on corporate
governance and develops the hypotheses of our study. Results and a discussion presented in
Section 4.
2. Public Non-listed REITs and Sample Description
Public non-listed REITs have existed for many years in the United States but have
become increasingly common, even outpacing the growth in REITs in general. Figure1 illustrates
that while the total number of listed REITs increased by 10 percent from 2000 to 2015 (from 177
to 196), the number of non-listed REITs more than tripled (from 19 to 67). Details of this trend
are displayed in Table I.
Even though their shares do not trade on any exchange or public market, non-listed
REITs are public companies with shares registered with the U.S. Securities and Exchange
Commission (SEC). They file the same regular required financial disclosures with the SEC as do
listed firms, filings such as the 10-K, 10-Q, 8-K, proxy, and prospectus. Both listed and non-
listed REITs are subject to the same requirements to maintain REIT status including a minimum
of 75% of assets invested in real estate or related) assets, 75% of revenue from real estate, and a
payout of at least 90% of gross income.
Public non-listed REITs offer their shares primarily to retail investors via a public
offering, often a shelf offering effective for an extended period. The REIT determines its offering
price, and investors purchasing shares of the firm do so through brokers or sales agents who

4
receive a substantial commission. The shares are most often sold for $10 (Corgel and Gibson
(2008)) and, because they are not traded, the REIT can maintain a $10 share price throughout its
non-listed life. This fixed price may appeal to retail investors who are averse to the volatility
associated with listed REITs but attracted to relatively high dividend yields. However, although
some non-listed REITs periodically offer to repurchase a limited number of shares from
shareholders at a price determined by the REIT (e.g. $9.50), for the most part investors in non-
listed REITs have little recourse when seeking liquidity.
Prior literature has shown that public non-listed REITs also have aggressive corporate
governance protections for the sponsor such as poison pills, staggered boards and fees triggered
by certain liquidity events (Wiley (2014)). Further, the structure seems to benefit the REIT
sponsors and advisors to the detriment of the investor. Wiley (2017) finds that the modal
combined cost to the investor to purchase shares is 14%, and that ongoing operating fees of more
than 6% annually. In the event of liquidation, investors may face additional disposition fees and
can give up rights to residual cash flows (Wiley (2017)).
In addition to listing status, the main difference between listed and non-listed REITs is
their planned life span. Unlike the going-concern nature of listed REITs, the typical public non-
listed REIT issues shares at its inception with a pre-established termination date usually ranging
from seven to ten years. At the end of their limited life, public non-listed REITs can provide
investors with liquidity by 1) selling the portfolio and distributing the proceeds, 2) merging with
or acquiring a listed REIT or 3) listing the REIT on an organized exchange (most often the New
York Stock Exchange). In this study we focus on 3), those public non-listed REITs that
transition to listed status.

5
The value of the average non-listed REIT tends to deteriorate over time, so non-listed
REITs that choose to list would likely have low listing prices. Hartzell, Kim, Kimbrell, and
Sprow (2012) find that non-listed REITs underperform compared to listed REITs and attribute
this principally to non-listed REITs’ high fees. Seguin (2016) estimates that the equity claims of
non-listed REITs are worth 23% to 80% less than those of comparable listed REITs. Henderson,
Mallett, and McCann (2015, 2016) find evidence of continuing significant underperformance of
non-listed REITs with an average annual return of 4.0% compared to listed REITs’ 11.3%.
While their evidence shows that all non-listed REITs have poor performance regardless
of the type of liquidity event, those firms that list show a much greater increase in wealth for
their shareholders than do those whose liquidity event was acquisition by a listed REIT. The
listing-day price for firms that listed was 66 percent greater than their average estimated net asset
value (potentially flawed, internally computed) compared to the average acquisition value
increase of 29 percent given to firms that merged (computed from Henderson, Mallett, and
McCann (2015), Table 2). Jones, Benefield, and Evans (2016) find that a large number of non-
listed REITs sell assets within bankruptcy. From an operating standpoint, Sahin (2012)
concludes that non-listed REITs generate lower return on capital and funds from operation than
comparable listed REITs. Overall, the evidence on non-listed REITs points to very poor
investment performance attributable to high up-front high fees, poor operating performance, lack
of stock liquidity, and potential management conflict of interests.
Why then do non-listed REITs exist? The main reason is likely a combination of
optimistic claims by non-listed REITs combined with effective sales efforts of brokers. Non-
listed REITs tend to pay relatively high dividends, especially during their early years, making
them appeal to investors seeking a high current income. Unfortunately, these apparent high
6
dividend yields are largely an illusion. Seguin (2015) finds that non-listed REITs keep their
dividend yield high by paying distributions that exceed cash flows (i.e. paid out of capital), and
hence these yields are unsustainable. Resulting liquidation-event share values of non-listed
REITs are typically a fraction of the original offering price.
Our period of study begins in 2002. We identify REITs that listed after previously being
public non-listed by identifying the first entry of all firms with the REIT SIC code (6798) on the
CRSP database, using word searches on Internet search engines for potential news releases of
REIT listing, and consulting prior literature on public non-listed REITs. From possible listings,
we consult the firm’s annual 10-K filings to confirm the listing event and verify the date.
We identify 22 REITs that transitioned from non-listed via a listing event between 2002
and 2015. This group forms our “transition sample.” Our search procedure was comprehensive,
resulting in what we believe to be a complete and correct record of all the non-listed REITs that
listed during that period.
Appendix A presents an inventory of the listing events. They begin in 2002, with listings
becoming more common as time passes. Seventeen of the listings occurred on the NYSE with
the remainder of listings on Nasdaq and AMEX.
We collect financial and corporate governance data for equity REITs from the SNL
Financial real estate database and the National Association of Real Estate Investment Trusts
(NAREIT) from 2000 to 2015, assembling a set of 640 US REITs, 212 of which are non-listed
(including our 20 firms that moved to listed status during the period). About half of the non-
listed firms no longer exist by the last year of the sample because they were acquired, liquidated,
or terminated REIT status. For variables with no data available from SNL and NAREIT, we refer
to 10-K and proxy statement filings.

7
We categorize observations into one of three ways: the pre-listing period, the transition
(or listing) year, and the post-listing period. Pre-listing and post-listing periods vary between one
and eleven years, and the listing occurs within the transition year. While a listing can occur at
any time within the year, data observations are from the year-end financial reports.
3. Corporate Governance and Hypothesis Development
Researchers often classify corporate governance mechanisms into internal and external
categories (see, for example, Gillan (2006)). Internal mechanisms are controlled by the firm and
imposed on its own structure. They principally involve the structure of the corporate board of
directors, but also include managerial incentives, financial structure, and bylaw and charter
provisions. External mechanisms exert control via forces that are not under direct control of the
firm such as regulations, the market for corporate control, or the media industry. Our study
focuses on internal measures but also includes some external mechanisms that we would expect
to change following a firm’s listing, even though the firm has little influence on them.
In the following subsections, we identify the corporate governance characteristics that
have been associated with valuation. The governance measures deemed favorable for companies
in general have been found to apply to REITs equally (see, for example, studies by Hartzell, Sun,
and Titman (2006), Bauer, Eichholz, and Kok (2009), and Anglin, Edelstein, Gao, and Tsang
(2011)).
3.1. Internal Mechanisms
Stock exchanges have standards regarding certain governance characteristics that all
listed firms must meet. Firms might choose to exceed these standards if management feels that
the result would maximize shareholder value, but they must at least comply with the exchange’s
standards in order to remain listed. For example, the board of directors of a New York Stock

8
Exchange (NYSE) listed firm requires a majority of the firm’s directors be independent within
one year of the listing date. It also requires listed firms to have a nominating (or corporate
governance) committee composed entirely of independent directors, as well as maintaining a
compensation committee composed entirely of independent directors. To comply with these
requirements, firms must have at least one independent committee member by the listing date, a
minimum of a majority within 90 days of the listing date, and a fully independent committee
within one year. Most of the firms in our sample (17 of 22) elect to list on the (NYSE).
Evidence supports the notion that a greater number of independent directors on the board
facilitates the monitoring function and helps counter agency issues (Rosenstein and Wyatt (1990)
and Hermalin and Weisbach (1998) Bertoni, Meoli, and Vismara (2014)). Our measure of board
independence is the percentage of directors that are independent, Independent Directors (%).
Because of the listing requirements, we expect this variable to increase following listing.
The monitoring role of a corporate board should be more effective when management has
less influence over new board appointments. This occurs when the nominating committee is
independent. Likewise, an independent compensation committee should reduce agency conflicts
that might arise when compensation committee members are not independent. Sun, Cahan, and
Emanuel (2009) show that better firm performance is associated with firms that have higher
quality compensation committees.
Our variables Nominating Committee and Compensation Committee are indicator
variables equal to one when the committee is 100 percent independent as required by NYSE
listing standards. Each is equal to zero when there is no committee or if the committee is less
than 100 percent independent. Because non-listed REITs are not required to have either

9
committee, many of them do not, and their proxy statement often states that the entire board
assumes the nominating and compensation oversight functions.
Listing firms have no latitude with these two board characteristics; both Nominating
Committee and Compensation Committee must be fully independent within one year of the
listing. We expect these variables to increase for listing firms as they prepare for their transition
and in the year following the listing.
Prior research shows that larger boards provide a more favorable governance
environment. For example, they bring additional human capital and increase the monitoring
ability of directors (Álvarez, Fernández, Gómez and Méndez (1998) and Coles, Daniel, and
Naveen (2008)). There are limits, though, and boards can reach a size where communication
issues reduce their effectiveness (Yermack (1996) and Eisenberg, Sundgren, and Wells (1998)).
Non-listed REITs typically have smaller boards, so we expect board size to increase at some time
during the transition to listed status. Our variable Board Size is equal to the number of members
on the board.
Corporate governance literature considers independent directors as “busy” if they serve
on multiple boards (three or more). The evidence in the literature is mixed. Some suggest board
busyness is detrimental to shareholder value if busyness leads to busy directors being more
“distracted” (Fich and Shivdasani, 2006; Falato et al., 2014). On the other hand, Ferris et al.
(2003) find evidence suggesting that busy directors hold multiple positions because of their
superior skill. It is unclear how we should expect board busyness to change during the listing
effort, but it might increase if the newly listed firm attempts to attract more talent. Our variable
Board Busyness is the percentage of independent directors serving on two or more additional
boards.

10
Board members appointed to the board by the current CEO are more likely to feel more
allegiance to that CEO and might be less effective monitors. A “captured board” is one that has a
majority of independent members chosen during the tenure of the current CEO. Captured Board
is a classification variable equal to one when more than half of the independent board members
joined the board after the appointment of the current CEO. We expect to see listing firms make
board appointments that reduce Captured Board as they approach and move into listed status.
A firm paying board members might be able to attract more talented and experienced
independent board members. Our variable Board Compensation is the dollar value of the total
compensation of the board. We expect an increase following listing.
CEOs who also serve in the position of board chair have the potential to use their extra
influence to hinder the board’s monitoring function (Fama & Jensen (1983)). Baliga, Moyer, and
Rao (1996) report that dual CEOs lead to slightly weaker performance. Our variable Chair/CEO
Duality is an indicator variable equal to one if the CEO is also the chairman of the board. Our
expectation is that some firms will shift from a dual CEO to two separate individuals occupying
the two positions following the listing.
There are numerous studies of the link between managerial compensation and firm
performance are (see, for example, Core, Guay, and Thomas (2005) for a review). While the
question of whether CEO compensation is a symptom of agency or a tool to alleviate agency is
controversial (Bebchuk and Fried (2003); Hall and Murphy (2003)), the consensus seems to be
that incentive compensation provides a favorable environment to encourage management to
maximize shareholder wealth. We use the following variables to control for CEO incentive
compensation: CEO Bonus, CEO Equity-based Compensation, and CEO Non-equity Incentive

11
Compensation. In addition, we report additional CEO compensation variables CEO Salary, CEO
Other Compensation, and CEO Total Compensation, which is the sum of all previous items.
Starting with Jensen and Meckling (1976), several authors have proposed the notion that
financial leverage disciplines management. Debt obliges managers to satisfy debt covenant
agreements and to generate sufficient cash flow to cover debt service, thereby alleviating some
of the agency problems that might arise from the existence of the firm’s free cash flows. While
some counterarguments have merit, most research supports the general concept of the existence
of leverage as an effective component of corporate monitoring.
Debt is an internal mechanism, and its issuance might provide a positive signal to
investors. However, management might not be able to change the firm’s capital structure quickly
or even want to do so. Assumption of additional debt entails a willing lender and the existence of
a need for the debt (e.g. for additional investment or to retire equity), and a listing firm may or
may not have a specific justification for additional financing simply due to the listing event. It is
therefore unclear that a listing firm’s management would alter its leverage as a signal of
corporate governance associated with its listing. If any type of firm were to take such action,
REITs are a good laboratory because they often tend to employ greater leverage than do other
types of firms, and the act of listing on an exchange might make additional debt available to the
firm at a lower cost.
Our measure of leverage, Debt/Assets, is equal to the ratio of the firm’s total debt to its
total gross assets (assets plus accumulated depreciation). Our use of gross assets accounts for the
specific case of real estate, and our expectation of its change during listing is that it might
increase following listing, but there is not strong ex-ante argument to support such a change.
12
3.2. External Mechanisms
We look at firm ownership to capture the effect of external governance mechanisms. The
presence of influential investors such as insiders (management or board members) or
independent blockholders (non-insiders owning five percent or more of the firm’s stock) is a
good indicator of monitoring quality. Indeed, higher levels of insider owenerhsip and
blockholder ownership are associated with better monitoring (Jensen and Meckling, 1976).
Particularly, Institutional investors, have shown to be effective monitors and their presence is
associated with lower agency costs (Weis, et. Al., 1995), increased pay for performance
sensitivity (Hartzell and Starks, 2003), and better firm performance (Ferreira and Matos, 2008).
We use the following variable to capture the quality of external mechanisms:
Insider Ownership is the percentage of the total shares outstanding held by executives and board
members. Independent Blockholders is the number of independent blockholders, while
Blockholder Ownership captures the percentage of total shares outstanding owned by
blockholders. Institutional Investors is the number of institutional investors, and Institutional
Ownership is the percentage of shares outstanding owned by institutional investors.
Insiders typically sell shares during an IPO or shortly thereafter using there newfound
liquidity. In a similar fashion, insiders of non-listed REITs might utilize the post-listing liquidity
to dispose of some of their holdings, so we expect to find Insider Ownership to decrease
following listing. Contrariwise, we anticipate the number of blockholders, especially
institutional holders to increase following listing.
3.3. Dividend Payouts and the Initial Listing Price
There are two additional relevant variables that we might expect management to change
as the firm lists: dividend payouts and the listing price. While these are not specifically corporate
13
governance measures, dividend payouts are related to the corporate governance capital structure
variables, and the initial listing price could be related to the series for pre-listing cash dividend
distributions. It is worth noting the changes that we expect in these variables are a result of the
specific situation in which non-listed REITs find themselves; they may not be relevant for other
firms.
Our first expectation is that transitioning REITs have different dividend policy than that
of other non-listed REITs. A second expectation relates to the low share values that would result
from repeated unsustainable payouts. These values would lead us to expect post-listing prices for
the listing REITs that are lower per share than the average existing REIT. However, share price
is a misleading measure at best, and even showing that non-listed REITs list for a lower price
than the average listed REIT does not tell us much. There is, however, a firm-initiated event that
would relay information about a too-low price and whether the firm is acting to inflate its per-
share listing price. This event is the reverse stock split.
Some reverse splits are nondiscretionary; their purpose is to raise the stock price to
satisfy a minimum share price dictated by the exchange. For example, the minimum price for
newly listed shares on the NYSE or Nasdaq market is $4.00 per share. Others are discretionary,
effected by the company in order to bring the share price up to some level deemed more
acceptable by the market. In either case, reverse splits are a relatively infrequent event (see, for
example Desai and Jain (1997) and Crutchley and Swidler (2013)). The typical original issue
price of non-listed REITs of $10 per share is likely an acceptable price level. It would therefore
be reasonable to conclude that any non-listed REIT effecting a reverse stock split prior to listing
is attempting to return its stock price to a more acceptable level in order to make up for prior
inferior performance and/or payouts out of capital.
14
To identify firms that effect a nondiscretionary reverse stock split, we compute the
implied sans-split price by dividing the listing-day price by the split factor. We define splits with
a sans-split price less than $4 as nondiscretionary; splits associated with a $4 or more sans-split
price are discretionary. We then compute the portion of each type of split as a percent of the total
sample; the variable names are Non-discretionary Reverse Splits and Discretionary Reverse
Splits. Reverse splits are so uncommon that in the absence of listing-price targets, the portion of
discretionary and of nondiscretionary reverse splits would be close to zero. A positive portion of
firms implementing a discretionary reverse split implies proactive discretionary price target
control by the firm. A positive portion of non-discretionary reverse splits is less informative
about proactive price control because of the minimum initial listing price requirement.
4. Results
4.1. Transitioning REITs vs Non-listed REITs
We start by observing the differences between non-listed REITs and transitioning REITs.
To compare the two groups, we retain the observations of the transition REIT sample that occur
before their listing year only. Although transitioning REITs are by definition “non-listed” before
their listing event, we want to see whether there are differences between those REITs that elect
to list versus REITs that elect not to. Table 2 presents the summary statistics for our full sample
(Panel A) our non-listed REITs sample (Panel B) and transitioning REITs sample (Panel C).
Panel A shows that the average firm in the sample has been registered with the SEC for four
years, has $1.2 billion worth of assets under management, and has funds from operation topping
$33 million annually. However, its mean FFO/total assets ratio is negative, indicating that some
firms have a negative profitability (for REITs, FFO/total assets is a better measure of

15
profitability than ROA). Almost three quarters of the firms in the full sample are founder held,
but only 17% are complying with the SEC’s independence and governance requirements.
Comparing the summary statistics of our non-listed REIT sample (Panel B) with that of
our transitioning REITs sample (Panel C), we observe several differences between the two
groups. First, transition REITs are more than twice as big as traditional non-listed REITs (the
average transition REITs’ assets are roughly $2 billion while it is about $1 billion for the average
non-listed REIT. The second major difference concerns governance quality as the average
transitioning REITs is less leveraged, more likely to be professionally managed and is twice as
likely to be already compliant with SEC’s governance requirement than their non-listed REIT
counterpart.
The average transition REIT is also younger, and pays twice the amount of dividends the
average non-listed REIT does. Moreover, the average transitioning REIT also appears to be
profitable with a FFO/total assets ratio of 2.7% while the average non-listed REIT is not (-1.8%
FFO/total assets). This is consistent with our initial hypothesis that REITs electing to list are
better managed and better performing than other non-traded REITs. Transitioning REITs also
appear to have a different, more generous dividend policy than the rest of the non-traded REITs,
which together with the apparent lower profitability of non-traded REITs is consistent with the
literature’s findings that non-traded REITs pay dividends out of capital to keep with the
unrealistically high dividend yields they advertise to attract investors.
We next investigate whether the characteristics of non-traded REITs are predictive of
their ownership status. Our initial hypothesis argues that the non-listed REITs that choose to list
are likely to be those that are better managed and more performant. Consequently, we argue that

16
we should see differences between transitioning REITs before their listing events and other non-
listed REITs that elect not to list. To test this conjecture, we use a logit model of the form:
REIT Ownership Status = β1 (Log Total Assets) + β2 (Firm Age) + β3 (FFO/Total Assets) +
β4 (Leverage) + β5 (Dividends Per Share) + β6 (Governance Compliance) + β7 (Blockholder)
+ β8 (Founder Held) + Year Fixed Effects + ε
Where ownership status is an indicator variable equal to one if the firm observed is a
transitioning REIT before its listing event, and zero if it is a non-traded REIT.
Table 3 reports the result or our logistic regression, with and without year fixed effects.
Several variables are good predictors of the likelihood of a REIT to list on a stock exchange
when preparing a liquidity event. Consistent with our primary analysis, we find that transitioning
REITs are significantly bigger, younger, and more profitable than other non-traded REITs.
Moreover, transitioning REITs pay significantly more dividends, are more likely to be
professionally managed, and more likely to be already compliant with the SEC’s independence
and governance requirements. We conclude that transition REITs have differences with
traditional non-traded REITs. Transitioning REITs seem to be more suited to make the leap to
publicly traded stock markets as they are already more on par with stock exchange listing
requirements than non-listed REITs. These results are consistent with our initial hypothesis and
show that non-listed REITs that elect to list are the “good REITs”, which are better governed
than REITs that opt for other types of liquidation event.
4.2. Governance variables
We find evidence that transitioning REITs are better governed than non-traded REITs.
We now look at select governance variables to determine whether transition REITs’ governance
quality is stable or if it builds-up over time. Moreover, we hypothesize that following listing,

17
change is gradual as significant changes in corporate governance are most likely to happen over
time. However, a competing hypothesis would be that the transition is abrupt and happening
rapidly as the action of listing on a stock exchange acts as a catalyst for change. Table 4 reports
the yearly means of transition REITs’ governance variables for a window period of three years
before the listing to three years after what we call the “transition period”.
First, we observe that firm size appears to increase slightly during the transition period
but remains steady following the listing. Second, we see that board size, board independence, the
presence of both a compensation committee and a nominating committee, as well as the
availability of information on executive compensation all follow the same trend. These variables
are steady in the three years leading to the transition and then increase sharply following the
listing. This is consistent with the hypothesis of a greater transparency post-listing as most stock
exchanges have requirements in terms of reporting and independence that force REITs to make
steps toward more transparent governance in order to maintain their status on the stock
exchange.
Second, we note that the number of founder-held REITs decreases progressively
throughout our window of observation. This decline is noteworthy: if two thirds of the
transitioning firms are founder held three years before listing, only 20% remain so three years
after listing. This is consistent with the “cash-out” hypothesis where founders see listing as an
opportunity to make a profit and relinquish their control of the firm for a payment. We note that
the number of REITs with a captured board follows a similar pattern which is consistent with
founder CEOs relinquishing control of the firm after its listing.
We decompose founder held firms in three separate categories: firms whose founder is
also the CEO, firms whose founder is a board member, and firms whose founder is a

18
blockholder. Firms whose founder is a CEO or a board member follow a similar declining
pattern throughout our window of observation. However, we note that the number of firms
whose founder is also a blockholder follows a u shaped pattern as it decreases until listing but
increases afterwards.
Third, the number of REITs with a busy board increases monotonically until year 1 and
then decreases. Although dissimilar to that of other variable, this pattern could be explained by
REITs acquiring talent around the transition period as seen by the increase in board size, board
independence and more importantly board busyness. This is consistent with a willingness to
improve corporate governance around the listing period. Taking board busyness as proxy for
director skill as suggested by Ferris et al. (2003), we can interpret this trend either as evidence of
a better governance as powerful CEOs try to avoid “busy” directors to be able to extract rent
more efficiently.
Fourth, we see that most components of CEO pay increase monotonically throughout the
window of observation with large increases in the year of the listing. The only exceptions are the
“bonus” and “other compensation” components of the CEO pay package. We document an
increase in CEO total pay and observe that board compensation follows a similar pattern.
Fifth, the number of blockholders and institutional holders appears to increase linearly.
Indeed, after their transition, newly listed firms seem to have one more institutional owner per
year holding some of their equity. The percentage of institutional investor ownership also
increases almost monotonically from zero before the listing to slightly below 25% at the end of
our window. Blockholder ownership mirrors that pattern which is largely driven by institutional
investors.

19
Overall, we observe that no trend is common to all variables. Most tend to follow a
monotonic pattern which could be consistent with a gradual adjustment starting multiple years
before listing. However, some variables are stable from one year to the next showing no sign of
adaptation until after the liquidation event.
Additionally, we note that our results are robust to several changes in the specifications
of our tests. As we use yearly observations, one criticism could stem from the fact that
observations occurring during the listing year might influence our data, as REITs that know they
are transitioning might already be making changes in anticipation of the listing date. In an
unreported table, we address this concern by removing the observations that are too close to the
effective listing date (we remove from the sample the observations occurring within 6 month of
the listing date). Our results remain qualitatively similar without these observations.
Consequently, for the remainder of the paper we elect to continue to use these
observations. As an additional robustness check, we run the same tests with our transition REIT
sample, but with the requirement of pairwise observations for any REIT. For example, some
REITs have four years’ worth of observations before their transition but only three afterwards. In
our pairwise sample, we drop the last (here the oldest) observation to have a symmetric number
of observations before and after listing. In untabulated results, we re-run our test without this
constraint and find similar results. It is worth noting that all our results are robust to the use of
both samples and are qualitatively similar. Therefore, we believe it is more appropriate to use the
larger sample in order for our tests to have more power. As such, we use the unrestricted sample
for the remainder of the paper.
20
4.3. The listing effect
Our findings indicate that transitioning REITs seem to be better governed and better
managed than other non-traded REITs. We now investigate whether governance further
improves once transitioning firms complete their listing on a publicly traded stock exchange, as
well as the magnitude of this “listing effect” controlling for size, profitability and firm specific
factors. Table 5 through 7 reports the results of a series of regressions that investigate the effect
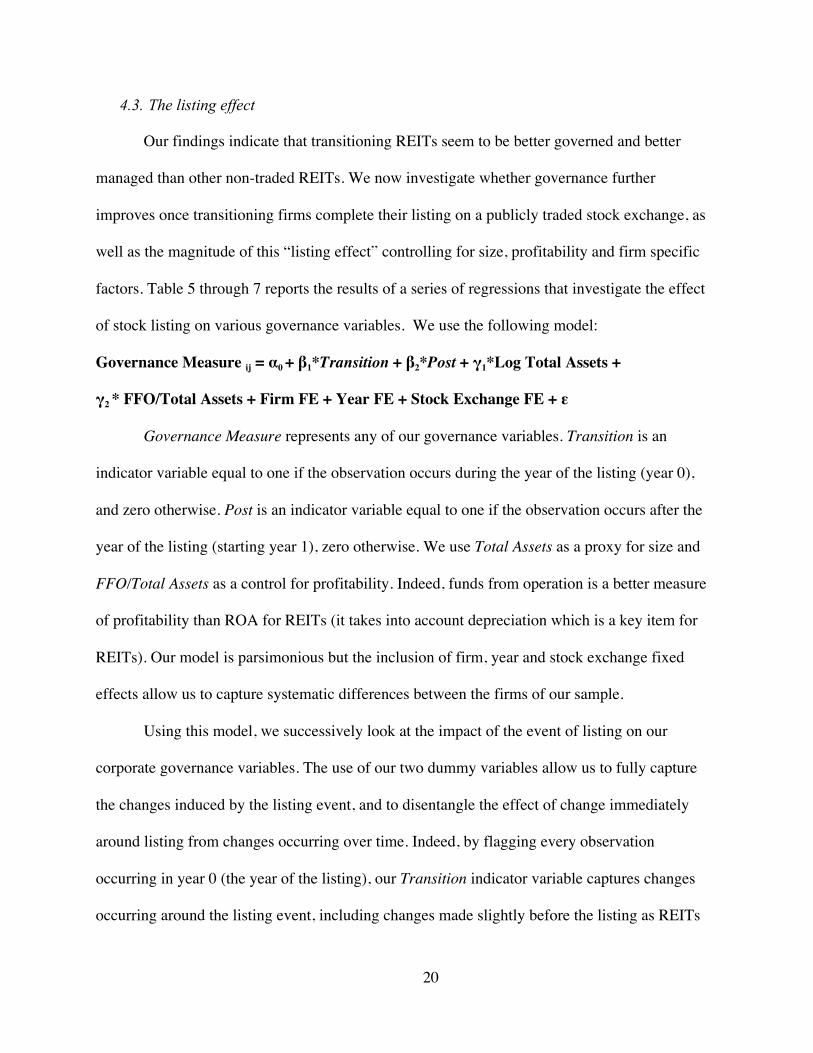
of stock listing on various governance variables. We use the following model:
Governance Measure ij = α0 + β1*Transition + β2*Post + γ1*Log Total Assets +
γ2 * FFO/Total Assets + Firm FE + Year FE + Stock Exchange FE + ε
Governance Measure represents any of our governance variables. Transition is an
indicator variable equal to one if the observation occurs during the year of the listing (year 0),
and zero otherwise. Post is an indicator variable equal to one if the observation occurs after the
year of the listing (starting year 1), zero otherwise. We use Total Assets as a proxy for size and
FFO/Total Assets as a control for profitability. Indeed, funds from operation is a better measure
of profitability than ROA for REITs (it takes into account depreciation which is a key item for
REITs). Our model is parsimonious but the inclusion of firm, year and stock exchange fixed
effects allow us to capture systematic differences between the firms of our sample.
Using this model, we successively look at the impact of the event of listing on our
corporate governance variables. The use of our two dummy variables allow us to fully capture
the changes induced by the listing event, and to disentangle the effect of change immediately
around listing from changes occurring over time. Indeed, by flagging every observation
occurring in year 0 (the year of the listing), our Transition indicator variable captures changes
occurring around the listing event, including changes made slightly before the listing as REITs

21
might start making decisions in the few months preceding the transition. Our second dummy
captures changes occurring strictly after the listing (year 1 and after), thus allowing us to capture
the long-term effect of listing. We also test the hypothesis that the two indicator variables taken
together are different form zero and report the F-statistic. This allows us to shed light on the
effect of listing on transitioning REITs.
4.4. Board and Committee structure
We start our investigation of the listing effect by observing its impact on board and
committee structure (Table 5). Overall, the results are consistent with our initial intuition that the
listing effect appears to be substantial for most variables, even after controlling for size and
profitability. Our coefficients suggest that in the years following the listing, REITs roughly add
one outside directors to their board, while the number of insiders decrease (by 0.46 on average),
explaining the overall increase in board size. This is consistent with the fact that the listing
requirements of most stock exchanges include a provision requiring a minimum ratio of
independent directors. In addition, the definition of an “independent director” used by stock
exchanges is clearly defined and less subject to interpretation, prompting transitioning firms not
meeting the selected criteria for independence to make the necessary moves to ensure
compliance. Our results indicate that board independence increase by 9% on average in the post
listing period.
We note that this trend is not the consequence of transitioning REITs anticipating stock
exchange’s governance and transparency requirement as the coefficients on our transition
dummies for independence related variables are insignificant. We conclude that newly listed
REITs try to attract independent directors following their listing, most likely in order to comply
with the stock exchanges’ requirements. The addition of outsiders to the board and the overall
22
increase in board independence is consistent with firm governance improving following the
listing.
Next, we investigate board busyness. This type of change is most likely to occur through
time rather than in an abrupt manner, as shareholders must wait for the end of the current
directors’ term to replace them. However, neither our transition variable nor our post variable are
significant, indicating that boards of transitioning REITs are simply not getting more busy
following the listing. This implies that new independent directors are not more likely to be busy.
We find that the number of REITs with dual CEOs and captured boards decrease
significantly around listing (by 18% and 29% respectively). This is consistent with the greater
independence requirement implied by the listing restrictions. Indeed, a dual CEO is more likely,
or at least has a greater ability to use his influence to pick “his” board members. The number of
dual CEO decreases by an additional 22% in the years following the listing, consistent with an
improvement in governance quality over the long run.
Finally, we observe that listing firms are significantly more likely to have independent
compensation and nominating committees following their transition. In fact, several non-listed
REITs do not have either committee and the board itself often takes care of the functions
pertaining to these committees. Results suggest that the level of independence of the nomination
committee and compensation committee rise both around the listing as well as in the long term.
Indeed, both committees are roughly 30% more likely to be independent in the year of the listing
and roughly another 40% more likely to be independent in the subsequent years. One year after
listing, the quasi-totality of listing firms have both committees, all fully independent, which
again, is consistent with the idea of tighter requirements imposed to maintain listing.

23
Overall, these results are consistent with our initial hypothesis of an improved
governance following listing. Moreover, profitability does not appear to affect governance much
as its relation to most governance variables (to the exception of compensation committee
independence) is insignificant.
4.5. CEO & Board compensation
We now focus on the evolution of CEO and board compensation following the transition
process. Table 6 reports the results of our regression. First, we observe that firms disclose more
information about executive pay following the listing, as both indicator variables are significant.
Indeed, in the pre-listing period many REITs declare not having any employees, as they claim
their executives are compensated for their work as part of a global package paid by an affiliated
entity (very often by another REIT, member of the same group). Only about 40% of the REITs
disclose information related to executive compensation prior being listed. This figure increases
by 15% in the transition period, and increases by another 27% in the subsequent years.
Nearly all the available metrics concerning CEO pay increase in the post-listing period,
most of them significantly. The average CEO’s salary is about 40% higher, climbing from
$393,534 to $548,546. CEO equity compensation triples, going from $475,809 to $1,675,621,
while total compensation more than doubles following the listing (from $1,505,000 to
$3,148,393 on average). The coefficients of our regression show that the increase occurs both in
the year of the listing as well as in the post listing period.
CEO bonus is the only sub-category that is not impacted by the transition and remains
unchanged. Other forms of compensation perceived by the CEO decrease significantly around
listing. This most likely represents a shift in the incentive component of the CEO compensation

24
package, as the increase in equity compensation more than offsets the decrease in other types of
compensation.
Directors also see their compensation inflate significantly after the listing, as the
collective board pay rises on average from $488,715 to $1,072,394. This figure does not take
into account the fact that boards are larger following the listing. However, we previously
observed that board size increases on average by 1 full member, which means an increase
ranging from $77,697 to $147,105 per capita, a still highly statistically significant figure.
Overall, the results indicate that total CEO pay increases sharply when a REIT goes
public, consistent with our initial hypothesis. It is important to note that this increase in pay is
independent of firm size or profitability as the controls are insignificant in almost every iteration.
In other words, this shows that CEO compensation drastically increases once a REIT transitions
to the publicly traded status, regardless of the size or the performance of the firm. We highlight
this phenomenon, as the perspective of getting a large payday might incentivize managers to list.
The combined F-test all yield further evidence that there is a significant listing effect on CEO
compensation.
4.6. Ownership
Table 7 reports the results of our regressions on a series of ownership related variables.
First, we observe that insider ownership is not affected by the decision to list.
Second, we note that transition firms are significantly less likely to be founder held
following their status change. This changes occurs both in the listing year as well as over the
long run (a decrease of 12% and 15% respectively). We note that more than a third of the pre-
listing sample is founder held and that in some cases, the founder is also the active CEO and
chairman of the board. There might be a willingness to “cash out” from some of these founders,

25
which would explain why we have less founder-held firms and less dual CEO/chairman
following the listing.
Categorizing founder-held firms by their nature, we find evidence of a decrease in the
number firms whose founder is also CEO immediately upon listing. This is consistent with the
greater independence requirement implied by the listing restrictions. This is also consistent with
the previous finding that boards are less likely to be captured post listing. Indeed, founder-CEOs
are all the more likely to be anterior to directors, and powerful enough to influence director
appointment. However, we note that the number of firms whose founder is also director or a
blockholder does not decrease significantly (although the point estimates are negative, they are
not statistically significant).
We now look at the evolution institutional ownership and to a larger extent, blockholder
ownership. We find evidence that one of the main effect of listing is to attract institutional
owners. Indeed, ownership related variables might represent the most obvious post-transition
evolution as they all drastically change following listing events. We observe that independently
of size and profitability, REITs are more likely to have institutional owners hold their shares
after going public.
One insight of our regression analysis is that our dummy transition for the number and
the ownership percentage of institutional owners is not significant. This suggests that
institutional investors progressively acquire newly listed REITs’ stock over time. In fact, many
transitioning REITs see one or multiple additional institutional owners hold their stock in the
years following their listing. The average transitioning REIT has 1.8 additional institutional
owners holding an average of 20% of its stock following the listing while no firm in the
transition sample had any institutional investor among its shareholders prior to their listing.
26
The number of blockholders is largely influenced by institutional owners. The number of
independent blockholders rises from virtually 0 in the pre-listing period to roughly 1.7 on
average following the listing. In other words, very few REITs have independent shareholders
owning at least 5% of their total shares outstanding before being listed. The rare ones that do
have a blockholder have an insider (often the founder) owning a large chunk of their shares.
Blockholder and institutional owner monitoring helps align managers and shareholders’
incentives, which is consistent with the idea that transitioning REITs are being governed more
successfully following their transition.
4.7. The impact of reverse stock splits
Table 8 reports that a significant number of REIT realize reverse stock splits right before
the listing event (from 1 for 2 to 1 for 6 shares). In fact, a total of seven REITs engage in reverse
stock splits in the few days immediately preceding their listing, and another five do so in
subsequent years. This is significant as none of them undertake any comparable action before
listing.
This last finding raises the question of the reason behind REITs’ sudden propensity to
engage in reverse stock splits around their listing events. Reverse splits are sometimes used as a
way to inflate the price per share of a stock as a low price per share is often viewed as
detrimental. Indeed, managers consider a high price per share as attractive, as they fear to see
their stock being deemed as a penny stock should prices fall too low. As such, by completing a
reverse split, managers reduce the number of shares outstanding by a specific multiple, which
automatically multiplies the price per share by that same multiple. For example, a reverse stock
split of 1 for 2 would cut the number of shares outstanding in half while doubling the remaining

27
shares’ price. Table 8 summarizes our findings regarding transitioning REITs engaging in
reverse stock splits.
First, we observe that seven out of twelve REITs complete their reverse stock split within
60 days of going public. In their proxy statements, some of these REITs clearly stipulate making
that move in order to prepare their listing. Another firm conducted its split a mere 15 days after
the listing. For the four remaining REITs, the reverse split occurs between two and six years
following the listing and is unrelated to it. Consistent with our intuition, we observe that
adjusting share price for the reverse split shows that pre-reverse split prices were or would have
been in the low single digits for most REITs. Managers’ desire to have an inflated price per share
is coherent with these REITs’ decision to reduce their number of shares outstanding.
Table 9 reports the result of a regression on the likelihood to complete a reverse stock
split right before listing using a model similar to that of previous tests. Consistent with our
intuition, we find that transitioning REITs are more likely to make such a move during the year
of their transition. We then decompose reverse splits into two categories: discretionary split and
non-discretionary splits. A share price below $4 would constrain firm to delist. As such if a
firm’s pre-split share price is below the $4 per share threshold, we consider the move to be non-
discretionary, as the firm would have to de-list otherwise. Conversely, if a firm’s pre-split share
price is above the $4 per share threshold, we consider the move to be discretionary. We find that
both discretionary and non-discretionary splits are more likely to occur during the transition
period.
5. Conclusion
In this paper, we use the unique laboratory of public non-listed REITs to study the
decision to transition to public listing. We look at the corporate governance features of non-

28
traded REITs and their impact on managers’ decision to list on a stock exchange. We find that
transitioning REITs are on average twice as large, more profitable and better governed, than non-
traded REITs who do not make the leap towards publicly traded stock markets.
Moreover, the quality of the governance of transitioning firms increases following their
listing. Indeed, following their transition, firms tend to reach for more independent, possibly
more experienced directors. Almost every firm discloses executive compensation information
and features fully independent compensation committee and nominating committee following
their transition. The average overall compensation package of both the board and the CEO more
than doubles post-listing while founders appear to quickly cash-out. The most striking change
consists in the surge in institutional investors holdings post listing. No non-traded REIT has any
institutional investor among its equity holder prior to being listed. This changes following listing
as institutional investors own an average of roughly 13% of a newly listed REIT’s shares
outstanding.
Overall, these findings are consistent with the fact that transitioning REITS have a better
governance following their transition. Furthermore, we find that changes in corporate
governance occur gradually through time as opposed to abruptly right after the listing event.
Moreover, transitioning REITs’ size measured by total assets increases slightly when listing but
relatively constant afterwards.
Finally, we find that several REITs engage in reverse stock splits immediately before
listing in order to boost their price per share and avoid having a price per share perceived as “too
low”.

29
Álvarez, Ana Isabel Fernández, Silvia Gómez, and Carlos Fernández Méndez. "The effect of board size and composition on corporate performance." In Corporate Governance, Financial Markets and Global Convergence, pp. 1-16. Springer US, 1998. Anglin, Paul, Robert Edelstein, Yanmin Gao, and Desmond Tsang. "What is the Relationship Between REIT Governance and Earnings Management?" The Journal of Real Estate Finance and Economics 47, no. 3 (2013): 538-563. Baliga, B. Ram, R. Charles Moyer, and Ramesh S. Rao. “CEO Duality and Firm Performance: What’s the Fuss”: Strategic Management Journal 17 (1996): 41-53. Bauer, Rob, Piet Eichholtz, and Nils Kok. "Corporate governance and performance: the REIT effect." Real Estate Economics 38, no. 1 (2010): 1-29. Bebchuk, L., J. Fried and D. Walker, 2002, “Managerial Power and Rent Extraction in the Design of Executive Compensation,” The University of Chicago Law Review 69, 751-846. Bertoni, Fabio, Meoli, Michel, and Vismara, Silvio. Corporate Governance: An International Review 22 (2014): 116-131. Coles, Jeffrey L., Naveen D. Daniel, and Lalitha Naveen. "Boards: Does one size fit all?" Journal of Financial Economics 87, no. 2 (2008): 329-356. Core, John E., Wayne R. Guay, and Randall S. Thomas. “Is U.S. CEO Compensation Inefficient Pay Without Performance? Michigan Law Review 103 (2005): 1142-1185. Corgel, J.B., S. Gibson, 2008, “Real estate private equity: The case of U.S. unlisted REITs,” Journal of Property Investment and Finance 26, 132–150. Crutchley, Claire E., and Steven Swidler. “Multiple Reverse Stock Splits (Investors Beware!).” Journal of Economics and Finance 39 (2013), 357-369. Desai, Hemang, and Prem Jain. “Long-Run Common Stock Returns Following Stock Splits and Reverse Stock Splits.” Journal of Business 70 (1997) 409-433. Edwards, Benjamin P. "Conflicts & Capital Allocation." Ohio State Law Journal, Forthcoming (2017). Eisenberg, Theodore, Stefan Sundgren, and Martin T. Wells. "Larger board size and decreasing firm value in small firms." Journal of Financial Economics 48, no. 1 (1998): 35-54. Falato, Antonio, Dalida Kadyrzhanova, and Ugur Lel. "Distracted directors: Does board busyness hurt shareholder value?" Journal of Financial Economics 113, no. 3 (2014): 404-426. Fama, Eugene F., and Michael C. Jensen. "Separation of ownership and control." Journal of Law & Economics 26, no. 2 (1983): 301-325.

30
Ferreira, Miguel A., and Pedro Matos. "The colors of investors’ money: The role of institutional investors around the world." Journal of Financial Economics 88, no. 3 (2008): 499-533. Fich, Eliezer M., and Anil Shivdasani. "Are busy boards effective monitors?" Journal of Finance 61, no. 2 (2006): 689-724. Gillan, Stuart L. “Recent Developments in Corporate Governance: An Overview.” Journal of Corporate Finance 12 (2006), 381-402. Giovannini, Renato. “Corporate Governance, Family Ownership and Performance.” Journal of Management Governance 14 (2010): 145-166. Goyal, V. K. and C. W. Park. “Board Leadership Structure and CEO Turnover.” Journal of Corporate Finance 8 (2002): 49-66. Hartzell, Jay C., and Laura T. Starks. "Institutional investors and executive compensation." The journal of finance 58, no. 6 (2003): 2351-2374. Hartzell, Jay C., J. Kim, Vee Kimbrell, and James Sprow. "Returns in the nontraded REIT industry: Evidence from full-cycle events." Real Estate Finance 29, no. 4 (2012): 3-19. Henderson, Brian, Joshua Mallett, and Craig McCann. "An Empirical Analysis of Non-Traded REITs." Securities Litigation and Consulting Group (2015). Henderson, Brian, Joshua Mallett, and Craig McCann. "An Empirical Analysis of Non-Traded REITs." The Journal of Wealth Management 19, no. 1 (2016): 83-94. Hermalin, Benjamin E., and Michael S. Weisbach. "Endogenously chosen boards of directors and their monitoring of the CEO." American Economic Review (1998): 96-118. Howard, Margot, Katherine A. Pancak, and Douglas A. Shackelford. "Taxes, Investors, and Managers: Exploring the Taxation of Foreign Investors in US REITs." Journal of the American Taxation Association (2016). Jensen, M. C. and Meckling, W. “Theory of thFirm: Managerial Behavior, Agency Costs, and Capital Structure.” Journal of Financial Economics 3 (1976): 305-360. Jones, Timothy A., Justin D. Benefield, and Jocelyn Evans. "Investment Opportunities for Private REITs and RELPs Bankrupt Properties: An Empirical Examination." Journal of Real Estate Portfolio Management 22, no. 1 (2016): 31-46. Kadlec, G. and J. McConnell, 1994, “The Effect of Market Segmentation and Illiquidity on Asset Prices: Evidence from Exchange Listings,” The Journal of Finance 49, 611-636.

31
Lack, Simon. "Non-traded REITs: A Security that Shouldn't Exist." Wall Street Potholes: Insights from Top Money Managers on Avoiding Dangerous Products (2016): 1-24. Merton, R., 1987, Presidential Address: A simple model of capital market equilibrium with incomplete information, The Journal of Finance 42, 483-510. Radcliffe, Robert C., and William B. Gillespie. "The price impact of reverse splits." Financial Analysts Journal 35, no. 1 (1979): 63-67. Rosenstein, S. and J. G. Wyatt. “Outside Directors, Board Independence, and Shareholder Wealth.” Journal of Financial Economics 26, (1990): 175-191. Sahin, Olgun Fuat. "Non-Traded REITs." Journal of Accounting and Finance 12, no. 1 (2012): 48-59. Sanders, W. G. and Boivie, S. “Sorting Things Out: Valuation of New Firms in Uncertain Markets.” Strategic Management Journal 25 (2004: 167-186. Sanger, G. and J. McConnell., 1986, “Stock Exchange Listings, Firm Value and Security Market Efficiecny: The Impact of NASDAQ.” Journal of Financial and Quantitative Analysis 21, 1-25. Seguin, Paul J. "The Relative Value of Public Non-Listed REITs." Journal of Real Estate Research 38, no. 1 (2016): 59-92. Sun, Jerry, Steven F. Cahan, and David Emanuel. "Compensation committee governance quality, chief executive officer stock option grants, and future firm performance." Journal of Banking & Finance 33, no. 8 (2009): 1507-1519. Villalonga, Belen, and Raphael Amit. "How do family ownership, control and management affect firm value?" Journal of Financial Economics 80, no. 2 (2006): 385-417. Weiss, Elliott J., and John S. Beckerman. "Let the money do the monitoring: How institutional investors can reduce agency costs in securities class actions." The Yale Law Journal 104, no. 8 (1995): 2053-2127. Wiley, J., 2014, “Illiquidity Risk in Non-Listed Funds: Evidence from REIT Fund Exits and Redemption Suspensions,” Journal of Real Estate Finance and Economics 49, 205-236. Wiley, J., 2017, “Dividend Manipulation at Unlisted REITs,” Real Estate Economics 5, 1-49. Woolridge, J. Randall, and Donald R. Chambers. "Reverse splits and shareholder wealth." Financial Management (1983): 5-15. Yermack, David. "Higher market valuation of companies with a small board of directors." Journal of Financial Economics 40, no. 2 (1996): 185-211.

32
Ying, L.K.W., W.G. Lewellen, G.G. Schlarbaum and R. Lease, 1977, “Stock Exchange Listings and Securities Returns,” Journal of Financial and Quantitative Analysis 12, 415-432.

33
Figure 1 – Number of Listed and Non-Listed REITs, 2000 to 2015
19 22 20 19 23 2632 31 35 39
5059
65 6370 67
177 174168 169
176 172
154142 142
151160
166172
182191
196
2000 2001 2002 2003 2004 2005 2006 2007 2008 2009 2010 2011 2012 2013 2014 2015
ListedREITs
Non-listedREITs

34
Table 1 Descriptive Statistics Panel A depicts the distribution of both listed and non-listed REITS in our sample. IPOs represent the number of new REITs entering the market in a given year. Liquidated or Acquired indicates the number of REITs disappearing form the market because of a liquidation event or an acquisition. Moved to Listed indicates the number of non-listed REITs listing on a major stock exchange. From non-Listed indicates the number of Non-Listed REITs that made the transition to the listed status. Panel B indicates the type of REITs contained in our sample. Non-Traded REITs are REITs that are not listed on a major stock exchange during the year of observation. Traded REITs are REITs that are not listed on a major stock exchange during the year of observation. Active REITs are still in business as of the last year of our data collection. Historical REITs are not in business anymore as of the last year of our data collection. Panel C displays detailed information about our transitioning REITs sample.
Changes in Non-Listed and Listed REITs from 2002 to 2015
Non-Listed REITs Listed REITs
Year IPOs Liquidated or Acquired
Moved to Listed
End-of-Year Total IPOs Liquidated or
Acquired From Non-
Listed End-of-Year
Total 2002 5 4 2 20 2 10 2 168
2003 1 2 0 19 10 9 0 169
2004 6 1 1 23 14 8 1 176
2005 3 0 0 26 10 14 0 172
2006 13 6 1 32 3 22 1 154
2007 5 6 0 31 3 15 0 142
2008 5 1 0 35 4 4 0 142
2009 4 0 0 39 10 1 0 151
2010 9 0 2 50 7 0 2 160
2011 10 1 0 59 8 2 0 166
2012 10 2 2 65 7 3 2 172
2013 7 6 3 63 11 4 3 182
2014 17 4 6 70 6 3 6 191
2015 7 6 4 67 10 9 5 196

35
Table 2 Summary statistics In this table, we report the summary statistics for full sample (Panel A), our non-listed REITs sample (Panel B), and our sample of Transitioning REITs before their listing (Panel C).
Panel A: Full Sample Variable N Mean Stdev 25th Median 75th Firm Age 504 3.956 2.539 2 3 6 Total Assets (in $ thousands) 504 1,272,402 1,899,372 138,869 469,986 1,601,431 Net Income (in $ thousands) 504 14,345 130,836 -6,954 -248 13,751 ROA 504 -0.096 1.502 -0.037 -0.004 0.025 FFO (in $ thousands) 504 33,055 71,986 -205 6,382 40,221 FFO/Total Assets 504 -0.010 0.397 -0.003 0.017 0.036 Leverage 504 0.527 1.279 0.303 0.470 0.609 Dividends (per share) 504 0.741 0.751 0.430 0.650 0.800 Governance Compliance 504 0.167 0.373 0 0 0 Blockholder Held 504 0.196 0.398 0 0 0 Founder Held 504 0.738 0.440 0 1 1 Panel B: Non-Listed REITs Variable N Mean Stdev 25th Median 75th Firm Age 409 4.054 2.606 2 4 6 Total Assets (in $ thousands) 409 1,097,791 1,751,665 129,758 447,996 1,225,396 Net Income 409 19,287 135,228 -5,134 -247 13,606 ROA 409 -0.037 0.447 -0.027 -0.002 0.021 FFO 409 25,707 60,148 -299 4,784 32,007 FFO/Total Assets 409 -0.018 0.440 -0.005 0.014 0.034 Leverage 409 0.552 1.415 0.322 0.492 0.621 Dividends Per Share 409 0.618 0.639 0.400 0.637 0.718 Governance Compliance 409 0.134 0.342 0 0 0 Blockholder Held 409 0.205 0.404 0 0 0 Founder Held 409 0.773 0.420 1 1 1 Panel C: Transitioning REITs Variable N Mean Stdev 25th Median 75th Firm Age 95 3.537 2.192 2 3 5 Total Assets (in $ thousands) 95 2,024,147 2,298,460 177,945 1,002,894 3,496,919 Net Income 95 -6930 107999 -14,088 -289 13,896 ROA 95 -0.350 3.335 -1.675 -0.177 1.428 FFO 95 64,689 103,827 1,605 13,739 118,513 FFO/Total Assets 95 0.027 0.026 0.010 0.025 0.047 Leverage 95 0.423 0.214 0.287 0.414 0.586 Dividends Per Share 95 1.268 0.947 0.600 0.940 1.845 Governance Compliance 95 0.305 0.463 0 0 1 Blockholder Held 95 0.158 0.367 0 0 0 Founder Held 95 0.589 0.495 0 1 1

36
Table 3 Likelihood to list. This table reports the results of a logistic regression of the likelihood for a non-listed REIT to list. We use the following model: REIT Ownership Status = β1 (Log Total Assets) + β2 (Firm Age) + β3 (FFO/Total Assets) + β4 (Leverage) + β5 (Dividends Per Share) + β6 (Governance Compliance) + β7 (Blockholder) + β8 (Founder Held) + Year Fixed Effects + ε. All variables are defined in appendix B.
Variable Coefficient p-value Coefficient p-value
Log Total Assets 0.35*** <.01 0.37*** <.01
Firm Age -1.13*** <.01 -1.27*** <.01
FFO/Total Assets 18.50*** <.01 22.06*** <.01
Leverage -0.12 0.84 -0.09 0.89
Dividends Per Share 0.69*** <.01 0.67*** <.01
Governance Compliance 1.57*** <.01 1.62*** <.01
Blockholder 0.43 0.26 0.64 0.10
Founder-Held -1.12*** <.01 -1.29*** <.01
Year Fixed Effects No Yes
N 504 504
R2 19.31% 18.81%

37
Table 4 Summary statistics: transition REITs In panel A we report the mean value of every governance variable of our transition REIT sample over a seven-year window, starting three years before the listing event to three years afterwards [-3; 3]. In panel B we report the mean value of every governance variable as well as the t-stat of the difference in means between groups for transitioning REITs during the listing year. Transitioning REITs pre-listing are referred to as group 1. Transitioning REITs post-listing are referred to as referred to as group 2. All variables are defined in appendix B.
Panel A: Means of governance variables for transitioning REITs
Transition REITs’ yearly means
Variables t-3 t-2 t-1 t0 t+1 t+2 t+3
N 18 21 22 22 20 17 15
Total Assets (in $ thousands) 1,640,953 1,642,043 1,849,707 2,278,480 2,039,136 2,302,476 2,382,409
Board size 5.667 5.714 6.045 6.182 6.700 7.294 7.800
Board independence (%) 0.660 0.654 0.669 0.681 0.755 0.780 0.781
Board Busyness 0.167 0.143 0.227 0.227 0.300 0.118 0.133
Captured board 0.667 0.667 0.591 0.409 0.500 0.412 0.333
Compensation committee 0.468 0.433 0.428 0.758 1 1 1
Nominating committee 0.459 0.394 0.391 0.709 0.900 1 1
Founder-Held 0.611 0.429 0.409 0.364 0.250 0.235 0.200
Founder-CEO 0.333 0.238 0.273 0.182 0.200 0.176 0.200
Founder-Board 0.556 0.381 0.364 0.364 0.250 0.235 0.200
Founder-Blockholder 0.111 0.095 0.091 0.045 0.100 0.118 0.133
Dual CEO 0.611 0.667 0.727 0.409 0.350 0.353 0.400
Executive pay info 0.389 0.429 0.409 0.545 0.750 0.882 0.867
CEO salary ($) 194,100 236,358 338,837 371,006 383,889 461,333 430,419
CEO bonus ($) 21,374 251,679 175,021 285,938 405,366 63,767 43,538
CEO equity-based compensation ($) 50,000 187,785 319,504 664,718 1,445,596 943,282 1,079,628
CEO non-equity incentive plan ($) 0 41,667 152,084 422,251 232,415 373,516 371,804
CEO other compensation ($) 188,607 190,977 193,434 43,574 41,332 38,208 373,849
CEO total compensation ($) 454,081 908,466 1,178,879 1,787,487 2,508,598 1,867,106 2,299,239
Board compensation ($) 216,134 287,381 340,413 468,291 983,674 733,483 848,585
Insider ownership (%) 0.025 0.022 0.019 0.020 0.035 0.040 0.046
Leverage 0.454 0.443 0.421 0.431 0.462 0.483 0.523
Number of Blockholders 0.500 0.238 0.227 0.227 1.350 2.588 3.133
Number of independent Blockholders 0.056 0 0 0 1.000 2.118 2.667
Blockholder ownership (%) 0.039 0.022 0.062 0.065 0.131 0.229 0.300
Number of institutional investors 0 0 0 0.045 1.200 2.118 2.867
Institutional investor ownership (%) 0 0 0 0.008 0.108 0.173 0.247

38
Table 5 Board & committee structure We run a series of regressions to look at the “listing effect” of previously non-listed REITS on their board structure. For continuous variables, we run an OLS specification. For binary variables such as Board Busyness, Captured Board and Dual CEO, we run a logit regression. Model: Variable of interest = α0 + β1 Transition + β2 Post-listing + β3 γ2 + FE + ε. Where Dummy Listing is the coefficient of a dummy variable that is equal to one if the observation occurs during the listing-year, zero otherwise. Dummy Post-listing is the coefficient of a dummy variable that is equal to one if the observation occurs after the listing event (listing-year excluded), zero otherwise. γ2 is a vector of control variables including the log of total assets and the ratio of FFO to total assets. F-test reports the value of the test that the two dummies are zero jointly. We also include firm fixed effects. All variables are defined in Appendix B.
Note: ***, **, and * denote significance of coefficients at the 1%, 5%, and 10% levels, respectively.
Board & Committee Structure
Variable N Dummy Listing
Dummy Post-Listing F-test Log Total
Assets FFO /
Total Assets Fixed Effects R2
Board Size 212 0.11 0.45* 1.49 0.05 0.22 Firm /Year /SE 82.14%
Number of Insiders 212 -0.01 -0.46*** 2.76* 0.08* -2.57 Firm /Year /SE 65.98%
Number of Outsiders 212 0.12 0.91*** 4.97** -0.03 2.79 Firm /Year /SE 84.02%
Board Independence 212 0.02 0.09*** 8.76*** -0.00 0.19 Firm /Year /SE 76.18%
CC independence 212 0.31*** 0.46*** 32.95*** 0.04 2.10* Firm /Year /SE 72.84%
NC independence 212 0.27*** 0.43*** 23.81*** 0.11*** 1.36 Firm /Year /SE 78.35%
Board Busyness 212 0.01 0.10 0.07 0.07*** -0.74 Firm /Year /SE 78.20%
Captured Board 212 -0.18* -0.049 1.49 -0.03 -1.76 Firm /Year /SE 59.37%
Dual CEO 212 -0.29*** -0.22** 18.84*** -0.04 -0.64 Firm /Year /SE 76.55%

39
Table 6 CEO & Board compensation We run a series of regressions to look at the “listing effect” of previously non-listed REITS on CEO and board compensation. For continuous variables, we run an OLS specification. For binary variables such as Executive Pay Disclosure, we run a logit regression. Model: Variable of interest = α0+ β1 Transition + β2 Post-listing + β3 γ2 + FE + ε. Where Dummy Listing is the coefficient of a dummy variable that is equal to one if the observation occurs during the listing-year, zero otherwise. Dummy Post-listing is the coefficient of a dummy variable that is equal to one if the observation occurs after the listing event (listing-year excluded), zero otherwise. γ2 is a vector of control variables including the log of total assets and the ratio of FFO to total assets. F-test reports the value of the test that the two dummies are zero jointly. We also include firm fixed effects. All variables are defined in Appendix B.
Note: ***, **, and * denote significance of coefficients at the 1%, 5%, and 10% levels, respectively.
CEO & Board Compensation
Variable N Dummy Transition Dummy Post F-test Log Total
Assets FFO /
Total Assets Fixed Effects R2
Executive Pay Disclosure 212 0.15* 0.27*** 7.73*** -0.02 -1.4 Firm /Year /SE 74.29
Salary 122 1.49** 1.12* 5.81** 0.12 -12.6 Firm /Year /SE 74.78%
Bonus 122 1.85 1.28 0.79 -1.18 -38.8 Firm /Year /SE 44.12%
Equity Compensation 122 4.40** 6.54*** 10.82*** -0.1 -10.62 Firm /Year /SE 64.74%
Non-Equity Compensation 122 4.37** 5.92*** 8.88*** 0.74 47.62 Firm /Year /SE 59.58%
Other Compensation 122 -3.00* -0.73 1.80 -1.39 -41.32* Firm /Year /SE 60.00%
Total Compensation 122 0.57* 0.69** 5.34** 0.33 -2.29 Firm /Year /SE 81.55%
Board Compensation 208 0.20* 0.47*** 8.07*** 0.23*** 1.04 Firm /Year /SE 91.07%

40
Table 7 Ownership We run a series of regressions to look at the “listing effect” of previously non-listed REITS ownership related variables. For continuous variables, we run an OLS specification. For binary variables such as Founder-Held, Founder-CEO, Founder-Board, Founder-Blockholder, and Presence of BH, we run a logit regression. Model: Variable of interest = α0+ β1 Transition + β2 Post-listing + β3 γ2 + FE + ε. Where Dummy Listing is the coefficient of a dummy variable that is equal to one if the observation occurs during the listing-year, zero otherwise. Dummy Post-listing is the coefficient of a dummy variable that is equal to one if the observation occurs after the listing event (listing-year excluded), zero otherwise. γ2 is a vector of control variables including the log of total assets and the ratio of FFO to total assets. F-test reports the value of the test that the two dummies are zero jointly. We also include firm fixed effects. All variables are defined in Appendix B.
Note: ***, **, and * denote significance of coefficients at the 1%, 5%, and 10% levels, respectively.
Ownership
Variable N Dummy Transition Dummy Post F-test Log Total
Assets FFO /
Total Assets Fixed Effects R2
Insider Ownership 212 0.00 0.00 0.23 -0.01** 0.00 Firm /Year /SE 74.73%
Founder-Held 212 -0.12* -0.15* 3.92** 0.08*** 2.50** Firm /Year /SE 76.65%
Founder-CEO 212 -0.12* 0.02 1.21 -0.04* 2.62*** Firm /Year /SE 78.59%
Founder-Board 212 -0.08 -0.08 1.50 0.05** 3.72*** Firm /Year /SE 79.94%
Founder-Blockholder 212 -0.02 -0.01 1.01 0.03* -2.06** Firm /Year /SE 62.74%
Presence of BH 212 -0.02 0.66*** 7.90*** -0.13*** -0.76 Firm /Year /SE 70.68%
Number of BH 212 -0.57* 1.21*** 0.28 -0.36*** 15.32*** Firm /Year /SE 79.00%
Number of Independent BH 212 -0.44 1.65*** 2.87* -0.17 13.51*** Firm /Year /SE 76.68%
BH Ownership (%) 212 -0.03 0.08** 0.28 -0.06*** 1.23** Firm /Year /SE 60.61%
Institutional Owners 212 -0.34 1.77*** 3.69** -0.16 13.54*** Firm /Year /SE 70.09%
Institutional Ownership (%) 212 -0.04 0.13*** 1.69 -0.02* 1.16*** Firm /Year /SE 66.58%

41
Table 8 The impact of stock splits. We look at REITS operating a stock split in prevision or after their listing on a stock exchange. We look at adjusted stock prices on listing day and compare it to investors’ initial purchase price. Listing Date is the date of the listing event. Reverse Stock Split Date is the date when the reverse stock split occurred. Split/Listing Timing is the number of days between the listing date and the day the reverse stock split occurred. Stock Split Ratio is the ratio of the number of existing shares to the number of shares post reverse-split. Post-split Price is the price of the share after the reverse stock split. Pre-Split Price is the induced price per share before the stock split calculated as the post-split price multiplied by the inverse of the stock-split ratio. Original Purchase Price is the price paid by an initial investor at the inception of the REIT. Adjusted Listing Day Price is the price of the share on listing day had the adjusted split not taken place, that is we multiply the listing day price by the stock by the stock split ratio if the reverse stock split occurred before the listing, and take the raw listing day price otherwise. Capital Gain at Listing is the gain or loss realized on listing day by an initial investor that purchased shares of a transitioning REITs at its inception, taking into account reverse stock splits. It is computed as the Listing day price adjusted for split minus the price at inception over the price at inception
The Impact of Stock Splits for Transitioning REITs
REIT Listing Date Reverse
Stock-Split Date
Split/Listing Timing
Stock Split Ratio
Original Purchase
Price
Adj. Pre-Split Price *(Actual Pre-Split Price)
Listing Price *(Post-Split Price)
Columbia Property Trust 10/10/2013 8/14/2013 -57 1:4 $10 $5.69 $22.75
Tier REIT 7/23/2015 6/2/2015 -51 1:6 $10 $3.25 $19.50
CatchMark Timber Trust 12/12/2013 10/24/2013 -49 1:2.5 $10 $5.40 $13.50
Retail Properties of America, Inc. 4/5/2012 3/20/2012 -16 1:2.5 $10 $3.50 $8.75
Whitestone REIT 8/26/2010 8/24/2010 -2 1:3 $10 $4 $12
Bluerock Residential Growth 3/28/2014 3/26/2014 -2 1:2 $10 $5.23 $10.46
Apple Hospitality REIT 5/18/2015 5/18/2015 0 1:2 $11 $9 $18
Meredith Enterprises Inc. 10/31/2002 11/15/2002 15 1:3 $10 *$4.85 *$14.55
Global Net Lease 6/29/2015 2/8/2017 590 1:3 $9 *$7.96 *$23.88
Gramercy Property Trust 5/21/2013 3/20/2015 668 1:4 $10 *$5.94 *$23.76
Healthcare Trust of America 6/6/2012 12/15/2014 922 1:2 $10 *$13.05 *$26.10
DCT Industrial Trust 12/13/2006 11/18/2014 2897 1:4 $10 *$7.83 *$31.31

41
Table 9 Equity and Stock Splits We run a series of regressions to look at the likelihood of transition REITS to complete reverse stock splits. For binary variables such as Reverse Stock Split, Discretionary Split and Non-Discretionary Split, we run a logit regression. Model: Variable of interest = α0+ β1 Transition + β2 Post-listing + β3 γ2 + FE + ε. Where Dummy Listing is the coefficient of a dummy variable that is equal to one if the observation occurs during the listing-year, zero otherwise. Dummy Post-listing is the coefficient of a dummy variable that is equal to one if the observation occurs after the listing event (listing-year excluded), zero otherwise. γ2 is a vector of control variables including the log of total assets and the ratio of FFO to total assets. F-test reports the value of the test that the two dummies are zero jointly. We also include firm, year and stock exchange fixed effects. All variables are defined in Appendix B.
Note: ***, **, and * denote significance of coefficients at the 1%, 5%, and 10% levels, respectively.
Equity and Stock Splits
Variable N Dummy Transition
Log Total Assets ROA R2
Reverse Stock-Split 212 0.36*** -0.01 1.32 35.30%
Discretionary Split 212 0.20*** 0.00 1.08 27.97%
Non-Discretionary Split 212 0.16*** -0.01 0.13 26.94%

42
Appendix A – Transitioning REITS
Pre-listing name Post-listing name Listing Date
Stock Exchange Ticker
AMREIT Inc. AMREIT 2002/7/23 AMEX AMY
West Coast Realty Investors Inc. Meredith Enterprises Inc. 2002/10/31 AMEX MPQ
Inland Real Estate Corp Inland Real Estate Corp 2004/6/9 NYSE IRC
Dividend Capital Trust DCT Industrial Trust 2006/12/13 NYSE DCT
Piedmont Office Realty Trust, Inc. Piedmont Office Realty Trust, Inc. 2010/2/10 NYSE PDM
Whitestone REIT Whitestone REIT 2010/8/25 NYSE WSR
American Realty Capital Trust Inc. American Realty Capital Trust Inc. 2012/3/1 NASDAQ ARCT
Inland Western Retail Real Estate Trust Inc. Retail Properties of America, Inc. 2012/4/5 NYSE RPAI
Healthcare Trust of America, Inc. Healthcare Trust of America, Inc. 2012/6/6 NYSE HTA
Chambers Street Properties Gramercy Property Trust 2013/5/21 NYSE GPT
Cole Credit Property Trust III Inc. Cole Real Estate Investments, Inc. 2013/6/20 NYSE COLE
Independence Realty Trust Independence Realty Trust 2013/8/13 NYSE IRT
Wells Real Estate Investment Trust II Inc. Columbia Property Trust 2013/10/10 NYSE CXP
Wells Timberland REIT Inc. CatchMark Timber Trust 2013/12/12 NYSE CTT
Bluerock Enhanced Multifamily Trust, Inc Bluerock Residential Growth REIT 2014/3/28 NYSE BRG
American Realty Capital Healthcare Trust American Realty Capital Healthcare 2014/4/7 NASDAQ HCT
American Realty Capital New York. New York REIT 2014/4/15 NYSE NYRT
United Development Funding IV United Development Funding IV 2014/6/4 NASDAQ UDFI
Behringer Harvard Multifamily REIT I, Inc. Monogram Residential Trust 2014/11/21 NYSE MORE
Apple REIT Nine Inc. Apple Hospitality REIT 2015/5/18 NYSE APLE
American Realty Capital Global Trust, Inc. Global Net lease 2015/6/29 NYSE GNL
Behringer Harvard REIT I, Inc. Tier REIT 2015/7/23 NYSE TIER

43
Appendix B – Variable definition (corporate governance measures)
Variable name Variable definition
Accumulated Depreciation Dollar value of the accumulated depreciation.
Blockholder Ownership Percentage of total shares outstanding held by blockholders
Board Busyness Percentage of busy independent directors in the board
Board Compensation Dollar value of the total compensation of the board
Board Size The size of the REIT’s board of directors can affects is governance
Board Independence Percentage of independent directors in the board
Captured Board Indicator variable equal to one if the CEO has been appointed before more than 50% of the independent board members
CEO Bonus Dollar value of the cash performance-based part of the CEO compensation package
CEO Equity Compensation Dollar value of CEO compensation paid in equity through stock options
CEO Non-Equity Compensation Dollar value of CEO compensation earned through non-equity plan, that is awards that are non-stock or equity
CEO Other Compensation Dollar value of perquisite and other benefits provided to the CEO
CEO Salary Dollar value of the base salary of the CEO
CEO Total Compensation Dollar value of the sum of the totality of the CEO compensation package
Compensation Committee Indicator variables equal to one if the firm has an independent compensation committee
Discretionary Reverse Stock Split Indicator variable equal to one if the price per share of the firm’s share is above $4 before the reverse stock split
Dividends Paid Dollar value of the dividends paid
Dividends Per Share Total amount of dividend paid per share
Dual CEO Indicator variable equal to one if the CEO is also the chairman of the board
Executive Pay Info Indicator variable equal to one if we information about CEO compensation is available
FFO payout Regular cash dividends paid on the company's primary issue of common stock as a percent of funds from operations, on a per-share basis
Founder-Blockholder Indicator variable equal to one if the “founder” of the firm owns at least 5% of the shares
Founder-Board Indicator variable equal to one if the “founder” of the firm is a member of the board
Founder-CEO Indicator variable equal to one if the “founder” of the firm is also the CEO
Founder-Held Indicator variable equal to one if the “founder” of the firm is an executive, member of the board, or holds at least 5% of the stock.
Insider Ownership Percentage of the total shares outstanding held by executives and the board
Institutional Investor Ownership Percentage of total shares outstanding held by institutional investors
Leverage The percentage of debt in a REIT capital structure, computed as debt over total assets

44
Variable name Variable definition
Nominating Committee Indicator variables equal to one if the firm has an independent nominating committee
Non-Discretionary Reverse Stock Split Indicator variable equal to one if the price per share of the firm’s share is below $4 before the reverse stock split
Number of Blockholders Number of individuals or entities owning more than 5% of the total shares outstanding
Number of Independent Blockholders Number of independent individuals or entity owning more than 5% of the total shares outstanding
Number of Institutional Investors Number of institutional investors owning more than 5% of the total shares outstanding
Return of capital Percentage of the annual dividend reported by the company as a return of capital payment. Used for income tax purposes, returns of capital are reductions to the cost basis rather than current income.
Reverse Stock Split Indicator variable equal to one if the firm completed a reverse stock-split the year of the observation
Total Assets Dollar value of the total assets of the firm.