the impact of entrepreneurial climate on youth unemployment419882/fulltext01.pdf · title: the...
TRANSCRIPT

The Impact of Entrepreneurial Climate on Youth Unemployment
A Study of This Relationship in Swedish Municipalities
Bachelor’s thesis within Political Science
Author: Tina Alpfält
Tutor: Benny Hjern
Per Viklund
Jönköping March 2011

Bachelor’s Thesis in Political Science
Title: The Impact of Entrepreneurial Climate on Youth Unemployment – A
Study of Swedish Municipalities
Author: Tina Alpfält
Tutor: Benny Hjern & Per Viklund
Date: [2011-03-10]
Subject terms: Entrepreneurial climate, youth unemployment
Abstract
The purpose of this thesis is to create a deeper understanding of the concepts
entrepreneurial climate and youth unemployment as well as estimating the
statistical relationship between them. This was realised through a use of multiple
methods. A qualitative study that examined the causes and solutions to youth
unemployment and one that investigated what factors constitute a good
entrepreneurial climate. Some causes of youth unemployment are technological
progress, globalisation, labour market regulations, the Swedish education system
and the local entrepreneurial climate. Possible solutions to some of these causes
are to reform the labour market regulations, incorporate more vocational training
in the education system and improve the entrepreneurial climate. Factors that
constitute a good entrepreneurial climate are business friendly attitudes, good
service by the municipality and good communication between the firms and the
municipality. The quantitative study was followed by a quantitative study with the
hypothesis that the local entrepreneurial climate and the youth unemployment
have a negative relationship in Swedish municipalities. The regression results for
both years examined, 2006 and 2009, confirmed the hypothesis. When the local
entrepreneurial climate improves, the youth unemployment decreases. An
interesting finding is that the goodness of fit, indicated by the adjusted R2, almost
is twice as large for 2009, when the Swedish economy was in a recession,
compared to 2006 when the economy was booming.

List of Abbreviations
EPA = Employment Protection Act
EU = European Union
LAS = Lag om Anställningsskydd
OECD = Organisation for Economic Co-operation and Development
OLS = Ordinary Least Squares
SBA = Small Business Act
SCB = Statistiska Centralbyrån
SKL = Sveriges Kommuner och Landsting
SME = Small and Medium sized Enterprises
SOU = Statens Offentliga Utredningar
SVT = Sveriges Television
VIF = Variance Inflation Factor

i
Contents
List of Abbreviations ................................................................. ii
1 Introduction .......................................................................... 1
1.1 Purpose & Research Questions .................................................... 2 1.2 Method .......................................................................................... 2
1.2.1 Qualitative Method .............................................................. 3 1.2.2 Quantitative Method ............................................................ 4
1.3 Limitations ..................................................................................... 5
1.4 Disposition ..................................................................................... 5
2 Background Information & Previous Research .................. 7
2.1 Definition of Youth Unemployment ................................................ 7
2.2 The Swedish Case ........................................................................ 8
2.3 Previous Research ........................................................................ 9
3 Supply & Demand on the Labour Market .......................... 10
3.1 According to Supply and Demand Theory ................................... 10
3.2 Actual Situation ........................................................................... 11 3.3 Return to Equilibrium ................................................................... 12
3.3.1 Removing the Wage Floor ................................................ 12
3.3.2 Increasing the Demand for Labour ................................... 13
4 Youth Unemployment......................................................... 15
4.1 Causes of Youth Unemployment ................................................. 15
4.2 Potential Side Effects Caused by Youth Unemployment ............. 16
4.2.1 Poor Health ....................................................................... 16 4.2.2 Increased Public Costs and Tax Losses ........................... 17 4.2.3 Criminality and Drugs ....................................................... 17
4.2.4 Negative Effects on Future Career ................................... 18 4.3 Suggested Cures......................................................................... 18
4.3.1 Internships and On-the-job Training ................................. 18
4.3.2 Collaboration between Relevant Instances ....................... 19 4.3.3 Entrepreneurial Climate .................................................... 19
4.3.4 Labour Market Regulations ............................................... 20
5 Entrepreneurial Climate ..................................................... 22
5.1 Why is an Entrepreneurial Climate Important? ............................ 22
5.2 A Good Entrepreneurial Climate ................................................. 22
5.3 Ranking of Municipalities’ Entrepreneurial Climate ..................... 24
6 The Relationship between Unemployment & Entrepreneurship ..................................................................... 28
6.1 Presentation of Model and Variables........................................... 28
6.2 Descriptive Statistics ................................................................... 30 6.3 Regression Results ..................................................................... 31
7 Discussion .......................................................................... 35
8 Conclusion .......................................................................... 40
References ............................................................................... 41
ii
Figures Figure 1.1: Triangulation of methods. ............................................................. 3 Figure 1.2: Outline of thesis. .......................................................................... 6 Figure 2.1: Unemployment in Sweden from 1976 to 2009. ............................ 8 Figure 3.1: The labour market according to theory ....................................... 10 Figure 3.2: The labour market in Sweden. ................................................... 11
Figure 3.3: Increasing the demand for labour............................................... 13 Figure 5.1: Components of the ranking. ....................................................... 25
Tables Table 5.1: The ranking of 2010. ................................................................... 26
Table 6.1: Hypothesised effects of the variables. ......................................... 29 Table 6.2: Descriptive statistics for 2006. ..................................................... 30
Table 6.3: Descriptive statistics for 2009. ..................................................... 31 Table 6.4: Regression results for 2006. ....................................................... 32 Table 6.5: Regression results for 2009. ....................................................... 33
1
1 Introduction
Unemployment has always been an important topic within both economics and politics.
However, it does not seem to hit the labour force evenly. Many studies have shown that
young citizens are unemployed to a larger extent than the older citizens (O’Higgins,
1997; Nilsson, 2010 & Lundin, 2007).
In the beginning of 2010 the youth unemployment in Sweden was 30%, which can be
compared to 21.1% in the EU27 area, according to data from the European database
Eurostat. That is a high number, indicating that almost one in three young Swedes does
not have a job. Consequently the issue of youth unemployment was discussed
intensively in debates prior to the 2010 general election in Sweden. It was called one of
the most important topics by the magazine Kollega (Unionen, 2010), a magazine
published by the Swedish labour union, “Unionen”. In addition, statistics published by
“Sveriges Television” (SVT), the Swedish national television company, suggests that
employment in general was the second most important topic for the voters when they
decided which party to vote for, according to the exit polls (SVT, 2010).
As stated by Singel (1984) the consequences of being unemployed in the early years can
be severe. People that have trouble to enter the labour market successfully when young,
are more likely to be unemployed later on in life and have lower earnings. There are
also many other reasons why youth unemployment is an important problem, such as the
risk of permanent alienation and the large costs that it has on the society (Nilsson,
2010).
Due to the economical burden on the society one could argue that it should be in
everyone’s interest to work towards a decrease of unemployment rates among youths.
Arbetsförmedlingen (The Swedish Public Employment Services) is the authority that
deals with the unemployed youths practically and they have various programmes
designed to facilitate for them to enter the labour market. Their actions are governed by
the government and decisions are thus made on a national level (Arbetsförmedlingen,
2010a).
According to Carling & Richardson (2004) the two most popular and common solutions
used by Arbetsförmedlingen’s local employment offices are further education and work
placement schemes. Both of these aim at increasing the competence of the unemployed
person and thereby facilitate for them to find a regular job.
Nevertheless, high youth unemployment remains although youths are receiving more
education and practical skills. It suggests that low skills and competence of the youths is
not the only reason for the problem. Another important reason of the problem, as
suggested by Rantakeisu, Starrin and Hagquist (1996), is that there are not enough jobs
for the youths. Based on that the underlying assumption of this thesis is:
Without new job opportunities, and assuming no demographical changes, the youth
unemployment can only decrease at the expense of another age group, ethnic group etc.
Therefore the active support and promotion of local entrepreneurial climates become
increasingly important if new job opportunities are to be created.
Therefore this thesis firstly sets out to investigate the phenomena youth unemployment
and entrepreneurial climate in more general terms. Secondly the relationship between
2
youth unemployment figures and local entrepreneurial climates in Swedish
municipalities is examined.
1.1 Purpose & Research Questions
The purpose of this thesis is twofold. The first aim is to create a deeper knowledge of
the subjects youth unemployment and local entrepreneurial climate through a qualitative
study. This means that definitions are examined as well as causes, effects and possible
solutions of youth unemployment, this is developed further in the firs two research
questions stated below. The second aim is to examine, through a quantitative study,
whether there is a relationship between a good environment for firms and low
unemployment figures for youths, and if so is it negative or positive? Thus the research
questions are stated as follows:
1. What are the causes of youth unemployment and are there any solutions to it?
2. What constitutes a good entrepreneurial climate?
3. How is the youth unemployment rate affected by the local entrepreneurial
climate?
The hypothesis to be tested is the following:
There is a negative relationship between youth unemployment and entrepreneurial
climate in the Swedish municipalities.
One should observe that a negative relationship for the variables in this thesis means
that an improved entrepreneurial climate results in a lower unemployment. The term
negative refers to the decrease seen in one variable as the other increases, which is seen
as a positive effect for the youth unemployment and entrepreneurial climate.
1.2 Method
According to Halvorsen (1992) a method is a way to proceed with an investigation and
there are mainly two such ways to proceed; hypothetical-deductive or inductive. The
first he describes is the hypothetical-deductive way of work, which means that the
researcher attempts to judge theories by testing hypotheses. This is usually done by
quantitative methods.
The second way to work with a study is inductive, which means that no hypotheses
exist a priori. The researcher instead attempts to develop an understanding for a specific
phenomenon; the most common way to do that is by using qualitative methods
(Halvorsen, 1992).
Boije (2010) tries to explain the difference between qualitative and quantitative analysis
by showing how two studies focusing on the same variables can produce different
outcomes as a result of the varying methods used. As she summarises, qualitative
research literature is used to understand a field of research and the analysis builds on
textual content from observations and interviews. Quantitative research, on the other
hand, uses the literature to deduct hypotheses which are later on tested, often with
statistical criteria and the results are based on numbers rather than text.
3
This thesis will make use of different methods, which is considered advantageous by
some researchers (Eliasson, 2010; Halvorsen, 1992 & Denscombe, 2009) since it
provides a broader view of a subject than one method only. In this thesis it is helpful
since it provides a deeper knowledge of the subjects whose relation is to be examined.
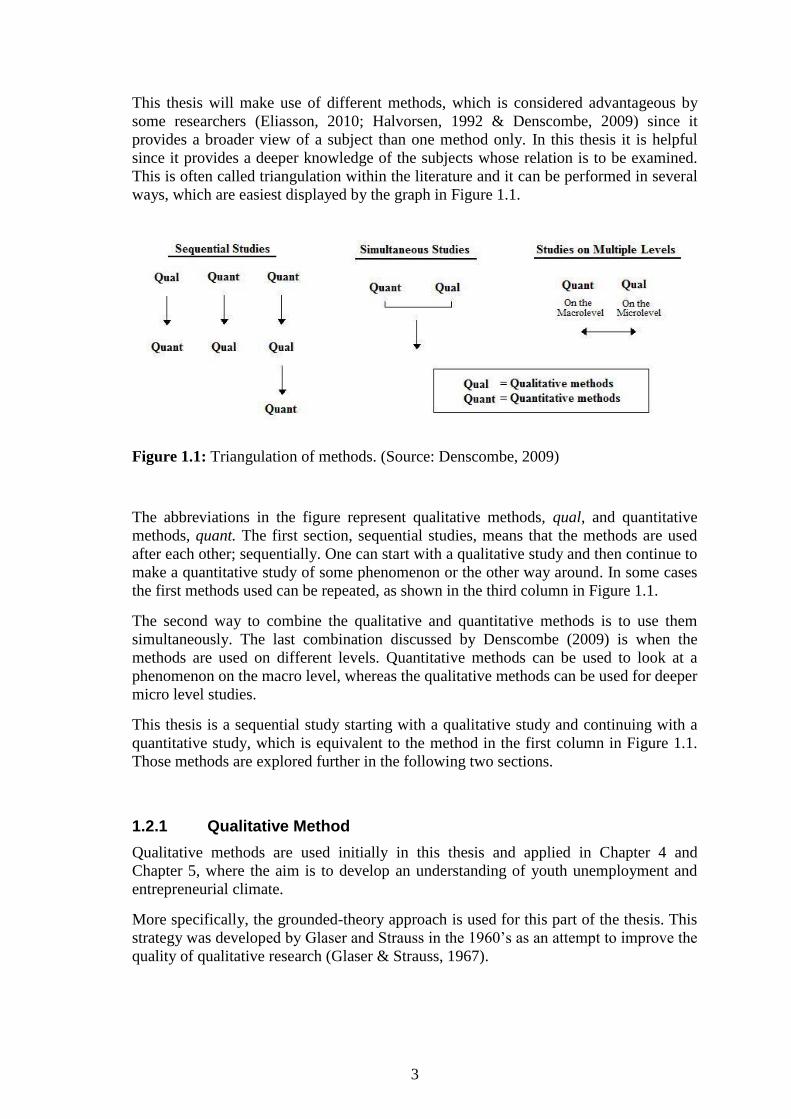
This is often called triangulation within the literature and it can be performed in several
ways, which are easiest displayed by the graph in Figure 1.1.
Figure 1.1: Triangulation of methods. (Source: Denscombe, 2009)
The abbreviations in the figure represent qualitative methods, qual, and quantitative
methods, quant. The first section, sequential studies, means that the methods are used
after each other; sequentially. One can start with a qualitative study and then continue to
make a quantitative study of some phenomenon or the other way around. In some cases
the first methods used can be repeated, as shown in the third column in Figure 1.1.
The second way to combine the qualitative and quantitative methods is to use them
simultaneously. The last combination discussed by Denscombe (2009) is when the
methods are used on different levels. Quantitative methods can be used to look at a
phenomenon on the macro level, whereas the qualitative methods can be used for deeper
micro level studies.
This thesis is a sequential study starting with a qualitative study and continuing with a
quantitative study, which is equivalent to the method in the first column in Figure 1.1.
Those methods are explored further in the following two sections.
1.2.1 Qualitative Method
Qualitative methods are used initially in this thesis and applied in Chapter 4 and
Chapter 5, where the aim is to develop an understanding of youth unemployment and
entrepreneurial climate.
More specifically, the grounded-theory approach is used for this part of the thesis. This
strategy was developed by Glaser and Strauss in the 1960’s as an attempt to improve the
quality of qualitative research (Glaser & Strauss, 1967).
4
Eneroth (1984) describes with examples how the grounded-theory method is applied to
an actual study. What one does is to systematically categorise the collected data. The
central concept in Chapter 4 is youth unemployment, thus the literature examined that is
related to youth unemployment is gathered together. In the second step the concept can
be divided into subcategories. In Chapter 4 the subcategories are causes of youth
unemployment, potential side effects of youth unemployment and possible solutions. In
the third step all of these categories are divided according to their various dimensions.
For example; globalisation, technological progress, the entry of women in the labour
force, content of education, entrepreneurial climate and laws.
As seen the data is grouped in several levels which then become easier to analyse.
Except for this way of coding data Glaser and Strauss (1967) highlight the importance
of which data that is included. The focus should be on collecting data from various
groups so that as many aspects as possible are covered. Diversity is thus believed to
provide more information of the phenomenon studied.
Therefore the data for the Chapters 4 and 5 were collected from many various sources.
There are official documents published by the government, reports written by specialist
organisations such as the Ungdomsstyrelsen (Youth Council), interest organisations,
books, journal articles and articles from other magazines.
Due to the wideness of the subjects chosen for deeper investigations and their macro
importance for society it would have been difficult and time consuming to aim for
primary data. Halvorsen (1992) says that in some situations using primary data is not an
alternative, especially in cases where the phenomenon examined is historical or related
to the macro level.
1.2.2 Quantitative Method
Quantitative methods are used in Chapter 6 in this thesis where the aim is to explain the
relationship between youth unemployment and entrepreneurial climate. The specific
method used is what Halvorsen (1992) calls a bivariate analysis. The concept refers to
an analysis of two variables. Nevertheless, the actual regression model used for the
statistical testing of the relationship between the variables will make use of more than
two variables due to the difficulties of creating an entrepreneurial climate variable.
The regression is of a linear type and is tested by the regular Ordinary Least Squares
(OLS) method in the statistical software E-views. The data used is statistical data of
secondary nature. Even though the focus is on more local relationships, i.e. on the
municipal level, than the previous sections there are too many municipalities in Sweden
to make it possible to collect primary data within a reasonable time frame.
According to Descombe (2009), official statistics are usually credible, based on facts
and objective. Also Halvorsen (1992) defends the usage of secondary data in form of
official statistics and states that Statistiska Centralbyrån (SCB), Statistics Sweden, is the
most important producer of statistics is Sweden. The data used for the unemployment
variable is based on raw data from SCB. Even though one of the problems with official
statistics is number of unreported cases there is no better alternative with available
statistics for all Swedish municipalities.
5
Other sources of statistics, according to Halvorsen (1992), are interest organisations and
public bodies. The data used for the proxy variables of entrepreneurial climate are based
on data from the business promoting organisation Svenskt Näringsliv.
1.3 Limitations
Sweden is divided into 290 municipalities which are to be studied in this thesis over two
different years only. The reason for that is that it is more interesting, for this particular
study, to see if there are any geographical variations at one point in time, equivalent to a
cross sectional model, than examining a few municipalities over several years; which
constitutes a time series model.
Additionally, it is interesting to examine whether the relationship differs between
recessions and booms. Based on that, the years 2006 and 2009 have been chosen as
years studied. The reasons are several, for example it is more interesting to look at more
recent years in order to get results that are as up to date as possible. The most recent
year with a recession was 2009. The financial crisis erupted in the autumn of 2008, so
most of that year was not characterised by a recession.
Another exogenous factor that affected the choice of year was the change in the
definition of an unemployed person, which was altered to better suit a harmonised EU
definition in October 2007; nevertheless SCB has recalculated data from April 2005
using this new definition. Thus 2006 is the first year where the same definition applies
to all months of the year and therefore it was chosen as the boom year.
This thesis exclusively examines the entrepreneurial climate and its potential effects on
youth unemployment and not the employment decisions made by the municipalities
themselves. One of the main reasons for this focus on the private sector and not on the
public is that the rules by which the private firms must adhere are shaped by the public
sector. Therefore the municipalities are seen as governing bodies shaping the
entrepreneurial climate in this thesis and not a source of employment.
1.4 Disposition
The outline of this thesis is presented graphically in Figure 1.1. As is seen the
introductory chapter is followed by a background chapter describing the definitions of
youths and unemployed persons, presenting facts about the Swedish situation and a
summary of previous research within the field of entrepreneurship and unemployment.
6
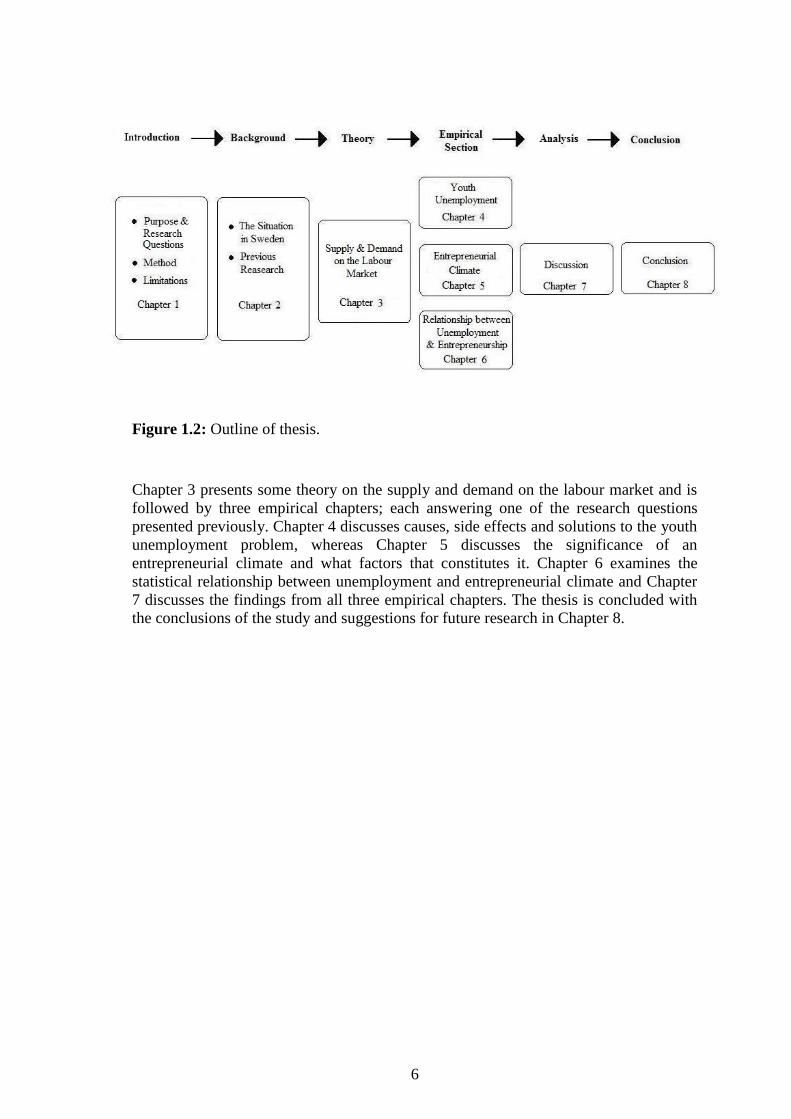
Figure 1.2: Outline of thesis.
Chapter 3 presents some theory on the supply and demand on the labour market and is
followed by three empirical chapters; each answering one of the research questions
presented previously. Chapter 4 discusses causes, side effects and solutions to the youth
unemployment problem, whereas Chapter 5 discusses the significance of an
entrepreneurial climate and what factors that constitutes it. Chapter 6 examines the
statistical relationship between unemployment and entrepreneurial climate and Chapter
7 discusses the findings from all three empirical chapters. The thesis is concluded with
the conclusions of the study and suggestions for future research in Chapter 8.
7
2 Background Information & Previous Research
Before starting the analysis it is helpful to make some definitions of youth
unemployment and get an impression of the Swedish situation. This chapter concludes
with some previous research on the hypothesis to be tested: the negative relationship
between entrepreneurial climate and youth unemployment.
2.1 Definition of Youth Unemployment
The definition of youth unemployment varies from source to source. In the statistics
presented by Arbetsförmedlingen there are only two categories of unemployment
statistics to choose from; either for the whole working age of 16-64 years of age or for
the subgroup aged 18-24. Looking at other reports and articles several variations are
found. In a report by Arena för tillväxt (2010), the unemployment of youths aged 15-24
is mentioned already in the prologue. Later on the interval 18-24 years of age, as used
by Arbetsförmedlingen, is discussed as well as the age group of 20-24. In an official
report by the Swedish government, statens offentliga utredningar (SOU), from 2003
(SOU, 2003) the age group of 16-24 is discussed.
Clearly there is no consensus within this field of literature regarding the age constituting
youths. However, the definition of being unemployed is not easily defined either. In the
statistics provided by Statistics Sweden the labour force consists of two parts;
unemployed and occupied. With occupied one refers to either a person who has worked
a minimum of one hour during a reference week or a person who was absent from work
for various reasons such as vacation or health problems (SCB, 2009). The category
unemployed is also divided into two subgroups; those who are full time students
looking for employment and those who are openly unemployed with no other
occupation. This is part of a new definition from 2007, which was made in order to
increase the level of coherence between intra-EU statistics. Prior to 2007 the full-time
students were not included in the labour force at all (SCB, 2007). Neither were
participants in some labour market programs or people who are not actively applying
for jobs (SCB, 2005).
The statistics provided by Arbetsförmedlingen has two main categories
(Arbetsförmedlingen, 2010b); those who are enrolled at an employment office and those
who are not. As mentioned by Arena för tillväxt (2010), this measurement does not say
anything about those youths that have not enrolled at their local employment office, but
still lack an employment. Among those included in the enrolled category there are three
major subcategories, those who are openly unemployed and could start working
immediately, those who are unemployed and participating in labour market programs
and finally those who are employed where the employer receives economic support for
them. This last category is usually not included when calculating unemployment figures
since they technically have an employment.
To conclude this section one can say that the definitions of youths, employed and
unemployed seems to differ from case to case. Therefore one should be careful when
looking at statistics and reading about youth unemployment before making
comparisons.
8
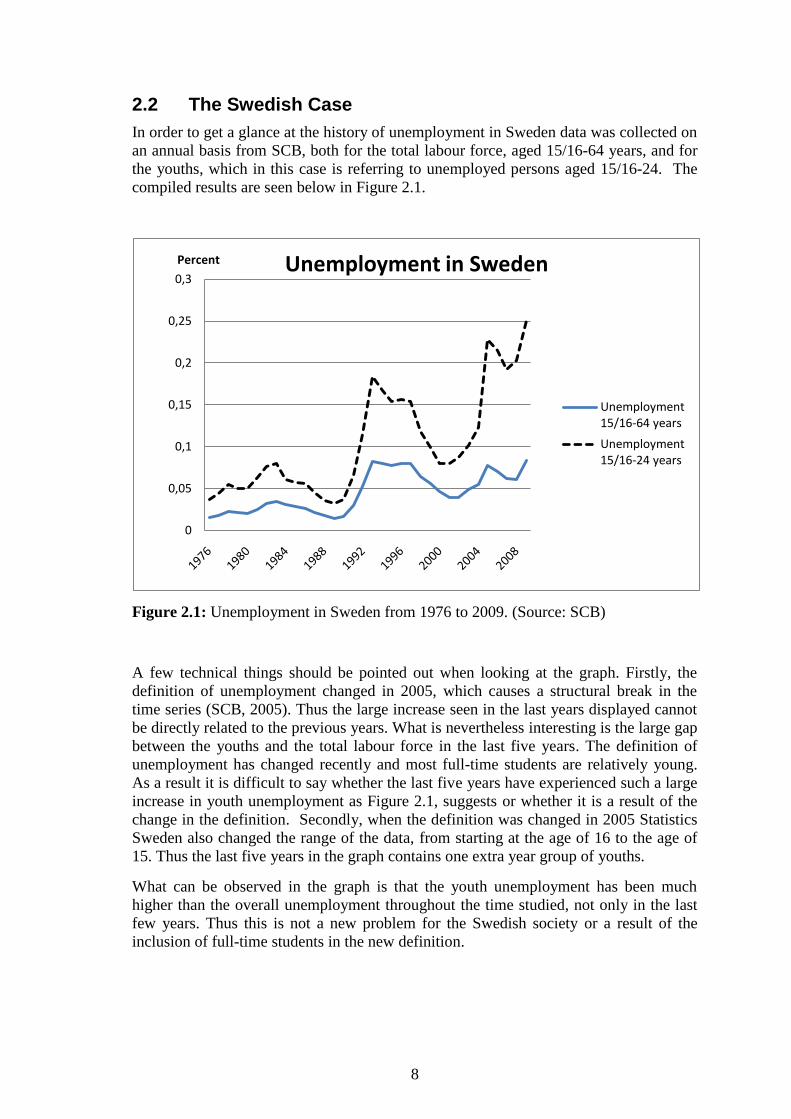
2.2 The Swedish Case
In order to get a glance at the history of unemployment in Sweden data was collected on
an annual basis from SCB, both for the total labour force, aged 15/16-64 years, and for
the youths, which in this case is referring to unemployed persons aged 15/16-24. The
compiled results are seen below in Figure 2.1.
Figure 2.1: Unemployment in Sweden from 1976 to 2009. (Source: SCB)
A few technical things should be pointed out when looking at the graph. Firstly, the
definition of unemployment changed in 2005, which causes a structural break in the
time series (SCB, 2005). Thus the large increase seen in the last years displayed cannot
be directly related to the previous years. What is nevertheless interesting is the large gap
between the youths and the total labour force in the last five years. The definition of
unemployment has changed recently and most full-time students are relatively young.
As a result it is difficult to say whether the last five years have experienced such a large
increase in youth unemployment as Figure 2.1, suggests or whether it is a result of the
change in the definition. Secondly, when the definition was changed in 2005 Statistics
Sweden also changed the range of the data, from starting at the age of 16 to the age of
15. Thus the last five years in the graph contains one extra year group of youths.
What can be observed in the graph is that the youth unemployment has been much
higher than the overall unemployment throughout the time studied, not only in the last
few years. Thus this is not a new problem for the Swedish society or a result of the
inclusion of full-time students in the new definition.
0
0,05
0,1
0,15
0,2
0,25
0,3
Percent Unemployment in Sweden
Unemployment 15/16-64 years
Unemployment 15/16-24 years
9
Another observation one can make is that the youths seem to be the affected more
severely by a recession than employees in general. This is what could be expected
considering the regulations on the Swedish labour market.
2.3 Previous Research
Much research has been conducted on the topic of entrepreneurship and entrepreneurial
climate in general. Some research has been conducted on the same topic as this thesis,
the relationship between the entrepreneurial climate and unemployment, but they have
focused on other regions. Their main findings are presented below.
The Organisation for Economic Co-operation and Development (OECD, 1998a) states
that after the economic crisis, which hit Sweden in 1990, the result was increased
productivity in the Swedish industries rather than increased employment. This has
shifted the focus towards entrepreneurship and small and medium sized enterprises
(SME) which are the source of the future jobs; if some of the existing obstacles are to be
removed.
Another Study by Faria, Cuestas and Mourelle (2010) claims that there is a division in
the literature between researchers that have intended to study the effects
entrepreneurship has on unemployment and those who have intended to study the
opposite relationship; the effects on entrepreneurship caused by an increased
unemployment. In order to establish which one is the most appropriate or whether there
is bidirectional causality between entrepreneurship and unemployment they perform a
granger-causality test on data from several developed countries; such as Australia,
Germany, the United Kingdom and the United States. They find that there is a
bidirectional relationship between the variables for all countries they studied. This
implies that not only does the amount of entrepreneurship affect the unemployment rate
but high unemployment is promoting more entrepreneurship.
Audretsch and Fritsch (1994) performed a study on start-ups of new firms in West-
Germany and found that the rate of newly established firms is negatively related to the
unemployment rate. Thus the more new firms that are established the lower is the
unemployment rate. A similar study was performed on Italian data by Garofoli (1994).
He also found this negative relationship between unemployment and start-ups.

10
3 Supply & Demand on the Labour Market
This chapter outlines the technicalities of the labour market and discusses how the
labour market should work, according to theory, how it actually works and some ways
to retain the equilibrium on the labour market. Only when knowledge of the economic
mechanisms is gained can one discuss the political remedies to the disequilibrium.
3.1 According to Supply and Demand Theory
Within most economic markets a supply and demand schedule, like the one displayed in
Figure 3.1, can be of use. The Y-axis shows the wage level (W) and the X-axis the
quantity of labour (Q), or number of persons on the labour market. The downward
sloping line, DL, shows the demand for labour and is downward sloping since the lower
the wage for each worker the more workers a firm could, or wishes, to employ. The
upward sloping line, SL, shows the supply of labour which builds on the assumption
that the higher the wage level the more persons are willing to work (McDowell, Thom,
Frank & Bernanke, 2006).
Figure 3.1: The labour market according to theory (Source: McDowell et al., 2006)
When combining the supply and demand one gets an intersection, point A; this is the
equilibrium point. In this point the number of persons wanting a job is equal to the
number of persons that the firms are willing to hire. Therefore the W* indicates the
equilibrium wage paid in this market and the Q* the equilibrium number of persons
employed.
Nevertheless if the labour market would be in, for example point B instead of the
equilibrium point A, the firms are willing to hire more workers at a lower price although
fewer persons are willing to take a job at that low wage, see point C. As a result the

11
wage will be driven upwards to the point where the market comes to a rest; the
equilibrium point.
3.2 Actual Situation
Often the reality differs from the theories. The labour market in Sweden is no different.
Sweden has received criticisms for its rigid labour market from OECD (2008).
According to OECD (2008), there are no legislated minimum wages in Sweden, instead
the labour unions and the employers agree upon collective agreements ensuring that the
affected workers get a certain minimum wage; which is very high compared with those
in other countries. As stated by McDowell et al. (2006) about 90% of the Swedish
labour force holds a membership to a union. Thus there is no need for a legislated
minimum wage; the labour unions efforts affect most workers anyway.
The result of this is a different version of the supply and demand scheme than the one
shown previously in Figure 3.1. The new scheme will contain the minimum wage
resulting in a disequilibrium of the market, which is displayed in Figure 3.2.
Figure 3.2: The labour market in Sweden. (Source: McDowell et al. 2006)
Like previously, the Y-axis shows the wage level and the X-axis the number of persons
on the labour market. WMin represents the minimum wage, which works like a price
floor on the market; the wage cannot fall below it. As a consequence the number of
persons seeking employment is indicated by point C and the number of persons the
firms are willing to employ is indicated by point B. These are translating to QD, the
quantity of labour demanded, and QS, the quantity of labour supplied on the X-axis. The
gap between them represents the excess supply. Due to the presence of the minimum
wage the equilibrium cannot be reached resulting in unemployment.
12
Usually high unemployment puts downward pressure on the wage levels but not in this
case. This can be explained partially by the presence of a WMin which in turn can be
partly explained by the insider-outsider model as described by Dornbusch, Fischer and
Startz (2004). It says that the firms and labour unions only negotiate with those who
already have a job, the insiders. Therefore there is no pressure to lower the wages and
allow for more of the unemployed, the outsiders, to acquire a job since lowering the
wages for the outsiders would automatically give the insiders a lower wage too.
3.3 Return to Equilibrium
It was established in the previous section that the labour market in Sweden is in
disequilibrium, the number of people willing to work does not equal the number of
employees the firms are willing to hire. A possible reason for this is the presence of the
wage floor created by the strong labour unions. This section discusses what can be done
in order to return to the equilibrium. That is various policy areas that could be reformed
to encourage employment in Sweden.
There are three ways to do it, although, only two of them are discussed in this thesis;
removing the wage floor and increasing the demand for labour. This is because the
third, to reduce the supply of labour, is difficult to do through policy changes and also a
bit immoral. The municipalities or the state does not have the moral right to exclude
some people from the labour market in order to make the unemployment figures look
more appealing. This approach would not solve the problem with an economic nburden
on the society since those excluded still would need some kind of income to survive,
such as income support from the municipalities.
3.3.1 Removing the Wage Floor
The first potential solution to the disequilibrium is to remove the floor that is
obstructing downward movements; in this case the minimum wages. This would imply
a return from Figure 3.2 to Figure 3.1. Since the minimum wages are not created by
Swedish laws it is not as easy as to simply change the “malfunctioning” law in order to
correct the problem.
Policies, and possible new laws, would instead have to be directed towards the labour
unions. For example there could be a policy saying that no wage increases are to be
negotiated when the unemployment is above a certain level or the economy is in a
recession. Since the tradition of labour unions is so strong in Sweden it would be
difficult to introduce a policy saying that the labour unions must accept reduced wage
levels so a policy of no increases in such situations would have to be sufficient.
This displays another weakness of policy setting. In democratic states the president or
the prime minister is elected in general elections. The sitting president or party of course
wants to be re-elected; therefore it is not in his/her interest to introduce policies that will
be negatively welcomed by the voters. Such a thing could cost him/her the victory in the
next election. Thus the politician always attempts to perform restrictive policies in the
beginning of the administration period and the closer the elections come the more he or
13
she attempts to expand the economy so that the unemployment decreases (Dornbusch et
al. 2004).
Nevertheless a decrease in unemployment as a result of lower wages for everyone is
probably not seen upon mildly. This can be referred back to the insider-outsider model
(Dornbusch et al. 2004); those who are on the inside do not care about those on the
outside.
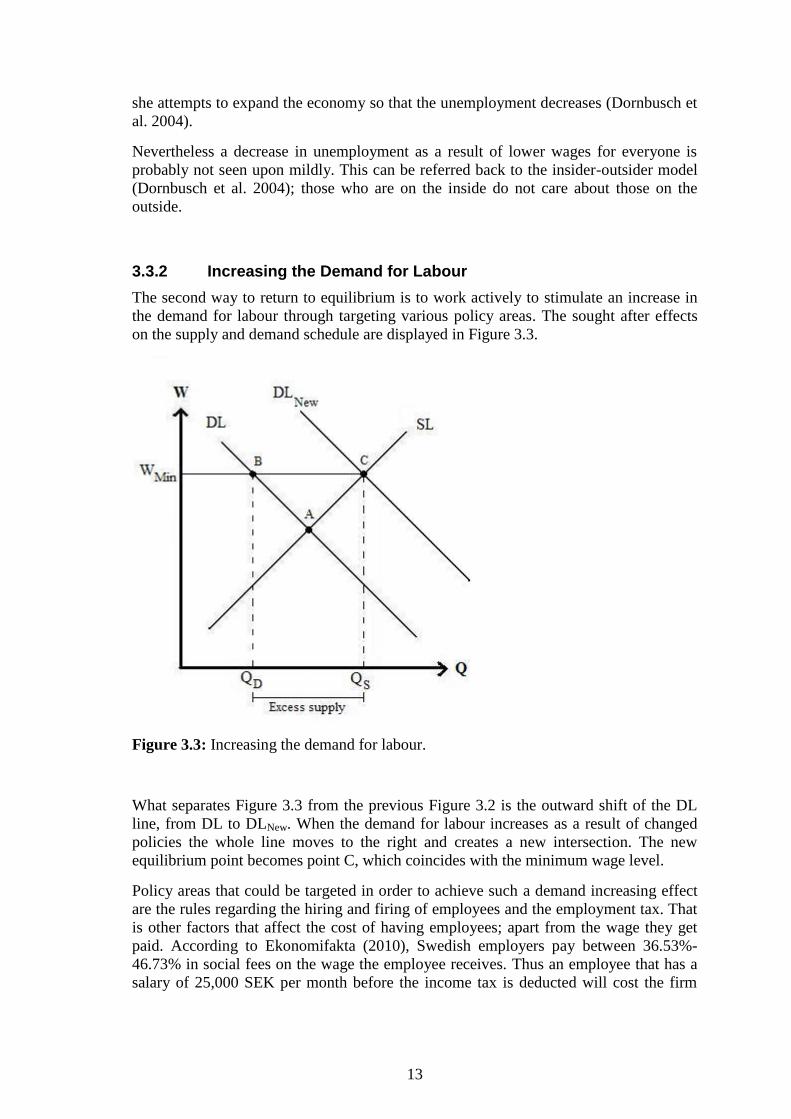
3.3.2 Increasing the Demand for Labour
The second way to return to equilibrium is to work actively to stimulate an increase in
the demand for labour through targeting various policy areas. The sought after effects
on the supply and demand schedule are displayed in Figure 3.3.
Figure 3.3: Increasing the demand for labour.
What separates Figure 3.3 from the previous Figure 3.2 is the outward shift of the DL
line, from DL to DLNew. When the demand for labour increases as a result of changed
policies the whole line moves to the right and creates a new intersection. The new
equilibrium point becomes point C, which coincides with the minimum wage level.
Policy areas that could be targeted in order to achieve such a demand increasing effect
are the rules regarding the hiring and firing of employees and the employment tax. That
is other factors that affect the cost of having employees; apart from the wage they get
paid. According to Ekonomifakta (2010), Swedish employers pay between 36.53%-
46.73% in social fees on the wage the employee receives. Thus an employee that has a
salary of 25,000 SEK per month before the income tax is deducted will cost the firm
14
between 34,132.50 and 36,682.50 SEK per month1. It should be emphasised that this
section only is concerned with economic effects and initiatives and disregards the
benefits for the workers induced by the social fees.
The existence of rigid rules on the labour market is another factor that is potentially
contributing to the high unemployment. When it is difficult and costly to fire an
employee firms may be more careful with hiring employees when needed, especially
youths (OECD, 2008). Therefore the labour protection rules could also be targeted
when making policies to decrease the unemployment. In Sweden lagen om
anställningsskydd (LAS), equivalent to the Employment Protection Act (EPA), is
potentially contributing to high youth unemployment by stating that the last employee
hired is the first to be fired in case of downsizing of the firm. The younger an employee
is the less time he/she has had available to work and the more likely he/she is to be one
of the newest recruits of a firm. Svenskt Näringsliv is one of the actors that advocate a
reformation of the LAS, and especially these rules about the turn-taking (Svenskt
Näringsliv, 2010a). This topic is discussed further in section 4.3.4.
Others claim that improved entrepreneurial climate increases the business creation and
as a result the job creation (OECD,1998b; SOU, 2008:121 and Rönn, 2002). Another
way to decrease the unemployment and contribute to the rightward shift of the demand
for labour could therefore be to improve the entrepreneurial climate in the Swedish
municipalities. How this could be done is discussed to a greater extent in Chapter 5 and
the hypothesis that improving the entrepreneurial climate really leads to a lower
unemployment is tested empirically on Swedish data in Chapter 6.
1 25000*1.3653=34132.50
25000*1.4673=36682.50

15
4 Youth Unemployment
This chapter discusses the first research problem; why the problem with high youth
unemployment exists at all, together with some research made on the side effects as well
as possible solutions, whereof one is to improve the entrepreneurial climate.
4.1 Causes of Youth Unemployment
The problem with high youth unemployment has many reasons, which can be divided
into two categories, or levels; the macro level and the micro level.
The macro level contains issues that are of more international character which
individual countries cannot directly affect through interventions, laws and various
programmes. One such factor is globalisation which has increased the international
competition over the years according to Faria et al. (2010). This is also acknowledged
by Cerny (2010) who says that there are two categories of people within a state; one that
gains from globalisation through the possibility of making their business transnational,
and one that loses from globalisation through higher unemployment and lower wages.
Munch (2010) has examined the Danish labour market and the effects of outsourcing
and found that it increased the unemployment, at least in the short run. The jobs that
tended to disappear were industrial jobs requiring relatively low skills; jobs which
youths have a larger chance of getting.
Arena för tillväxt (2010) also discusses the issue of technological progress and the
resulting effects on the Swedish society. The technological progress together with
globalisation has made it possible for “new countries” to enter the world market; some
examples of such countries are China and India. When many industries have been
established in Asia, or relocated from developed countries, the tendency in developed
countries has been a transition from reliance on industries to a heavier reliance upon
services. The industrial jobs that remain in the developed countries are often more
specialised and more knowledge demanding, which makes it difficult for youths to enter
those firms as well.
A third factor that has been claimed to contribute to the high unemployment figures, at
least in the short run, is the entrance of women in the labour force (Singell, 1984). He
looks upon the case in the USA where only 28% of the women participated in the
labour force in 1940 whilst that proportion had risen to above 50% in 1978. Such a
structural change increases the labour force rapidly and the risk is that the demand for
labour is increasing too slowly to provide jobs for them.
On the micro level there are larger variation between countries since these factors are
more easily altered by governments and local councils. The first factor discussed by
OECD (2008) is the content of the education. Sweden is being criticised for having an
education system with too much focus on theory. Those that do attend programmes
focusing on vocational training still lack important skills when they graduate, which
makes it difficult for those youths to acquire a job. This is also emphasised by Arena för
tillväxt (2010), which says that more focus should be put on internships and
entrepreneurship.
16
Related to that topic is local entrepreneurial climate. When the international competition
intensifies, innovations and entrepreneurship become more important than previously.
Since entrepreneurship is something that is embedded in individuals it is of larger
importance that effort is put on the local entrepreneurial climate in order to encourage
those with good business ideas to develop them. This topic is discussed further in
chapter 5.
Laws and rules also contribute to the high youth unemployment many researchers
claim. According to OECD (2008), the minimum wages in Sweden, in combination
with a heavy regulated labour market that makes it very difficult for firms to fire
employees, aggravate for youths to get an employment. The same argument is put
forward by Singell (1984) for the US labour market and by O’Higgins (1997) in a
European perspective.
4.2 Potential Side Effects Caused by Youth Unemployment
Unemployment among youths is known to have negative effects on both the society and
the unemployed themselves. Some of the aspects are discussed in the following
sections.
4.2.1 Poor Health
One common example of side effects that hit unemployed, according to many
researchers, such as Hammarström (1996) and O’Higgins (1997), is the deterioration of
their health. According to Rantakeisu, Starrin and Hagquist (1996), there are three types
of health problems that are central in this situation. Firstly, it is common for
unemployed persons to get struck by depression and other psychological problems,
which can create a great amount of stress on the body. Secondly, physical problems,
such as an increased blood pressure, appear as a result of the psychological stress.
Lastly, unemployed persons may adopt new habits or types of behaviour that are bad for
the health; such as smoking, the use of narcotics and an increased consumption of
alcohol.
Some psychological problems that affect unemployed youths, according to
Hammarström (1996), are anxiety, insomnia, abeyancy and impeded self confidence.
The longer the spell of unemployment is, the higher is the risk of getting psychological
problems. Among youths the risk of getting psychological problems is about three times
higher, when being unemployed as compared to someone who is not unemployed.
What is quite dangerous about the psychological problems is that they affect the
physical health as well. Hammarstöm (1996) observes several common problems
among the youths she is interviewing and having contact with. Many of the physical
problems the youths have are related to the stomach; such as lowered appetite, stomach
pains and gastric catarrh. A problem that is also affecting the stomach is worsened
eating habits. Many unemployed youths start eating junk food and, as previously
mentioned, consume much alcohol. Apart from problems with the stomach this can also
lead to overweight (Hammarström, 1996).
17
Unemployment has a tendency to increase the risk of starting to smoke cigarettes at
young age Hammarström (1996) finds in her study. If one already is a smoker,
unemployment often seems to increase the consumption. The same is the case for
consumption of alcohol. However, Hammarström (1996) points out that the causality
sometimes is difficult to define since some people may have difficulties finding a job
because of high alcohol intake and not the other way around. The general finding is
nevertheless that there is a correlation between consumption of alcohol or cigarettes and
unemployment.
4.2.2 Increased Public Costs and Tax Losses
Unemployment is the largest economical problem the municipalities face, according to
Svenska Kommunförbundet (1997). The municipalities are regularly assisting with
labour market programs (Lundin, 2008), which is costly. In addition the municipalities
are the ones responsible for providing the economic support to the inhabitants in need.
Nilsson (2010), estimates that about one million of the Swedish citizens are being
provided for by the transfer payment system, either in form of economic support or
various kinds of disability pensions. Nilsson (2010), continues by demonstrating how
costly unemployed youths are, especially if they have other problems as well. A
troubled youth that needs help from several authorities, such as employment offices,
health care, Försäkringskassan (the Swedish Social Insurance Office) and so on will
cost about 15 million SEK until the retirement at the age of 65. Thus it must be
worthwhile to spend, even quite large amounts of money, to break the alienation and
help him/her to become a regular working citizen.
Another aspect of the cost for the municipalities is put forward by Ungdomsstyrelsen
(2006). As they point out there is not only the higher costs that worsen the economy of
the municipality, but also the lower revenues from taxes and consumption. The smaller
is the labour force the less tax money is collected and less money can be spent on health
care, education and other essential functions (Nilsson, 2010). The same conclusion is
drawn by Lundin (2008), who claims that the municipalities, as a consequence, have a
great interest in labour market policies even though the general policies are decided on a
national level and the tasks administrated by the local employment offices.
4.2.3 Criminality and Drugs
Another side effect that is negative, not only for the unemployed youths themselves, but
for the society as a whole is the increased risk for drug usage and the increased risk of
drug abusing youths committing crimes (O’Higgins, 1997). As Singell (1984) explains,
when the number of legal opportunities is beginning to peter, illegal activities are
exploited instead. In Hammarström (1996), it is stated that a higher unemployment of
youths increase the use of cannabis. The same effect is found by Hammer (1992) in a
study of Norwegian youths.
It is not only the risk of drug abuse that increases when the youth unemployment
increases, also the amount of property crimes tend to increase. A study by Britt (1994)
on American time series data indicated that the amount of property crimes, such as
robbery and burglary, did not increase when the youth unemployment did. However, he
18
found a relation between the lagged unemployment variable and the number of property
crimes. This suggests, like Singell (1984), that unemployment does not immediately
turn the youths into criminals, but as the spell of unemployment increases the risk of
them committing crimes increases.
4.2.4 Negative Effects on Future Career
Even if the unemployed youth manages to find a job the negative effects are not over.
According to Nordström Skans (2004) the risk of being unemployed again within the
next few years is larger if one ended up unemployed after the upper secondary school.
The same discussion is held by, for example, O’Higgins (1997) and Singel (1984). As
O’Higgins (1997) states, a period of unemployment early in ones career may damage
one’s future job prospects as well as the wage level. This is also observed by Singel
(1984) who says that early work experience is significantly connected to the wage
received as an adult.
Gartell (2009) has made a study of Swedish youths after their graduation from a
university; as opposed to graduation from the upper secondary school like Nordström
Skans (2004). What she finds is in line with the observations made by Nordström Skans
(2004); early unemployment damages the future career opportunities. She also finds that
youths who become unemployed when they graduate from the university tend to have a
yearly wage that is 30% lower than the yearly wage of those youths who managed to
find a job when graduating. This wage gap does not seem to disappear over time for the
university graduates, as Nordström Skans (2004) states will be the case for the students
with an upper secondary education only.
4.3 Suggested Cures
As seen in previous sections there are many reasons for the high figures of youth
unemployment and the effects from it are many and severe. The suggested cures for this
problem are numerous and some of them are presented in more detail in the following
sections, including the one which this thesis focuses on; entrepreneurial climate.
4.3.1 Internships and On-the-job Training
To increase the amount of internships and the contact with the business world within the
education is one of the most common suggestions made by various actors. According to
OECD (1998c), the reforms made in the Swedish education system in the 1990 have
resulted in 16 national programs on the upper secondary level. Two of them are
preparing the students for university studies and 14 of them are focusing more on
vocational training, although they also give eligibility for university studies. These
vocational programs are supposed to include a minimum of 15 weeks of on-the-job
training during the three years of education. Some studies object and say that this is not
sufficient in order to prepare the students for their future careers and give them contacts
with potential employers (Arena för tillväxt, 2010 & Schröder, 1997).
19
A study made by Hall (2009) indicates that when the new reform of the upper secondary
school in Sweden took place, prolonging the vocational programs from the former two
years to three years of education, this had a negative effect on the completion rates. The
probability of a student dropping out of its education, increased by 3.8 percentage points
when the duration of the program increased.
In a report from the Ungdomsstyrelsen (2009a) the alienation of youths is examined in
Denmark, Netherlands and the United Kingdom. The unemployment figures for the
youths presented are much lower in Denmark and the Netherlands than they were in
Sweden during the same time period. One of the large differences between Denmark,
Netherlands and Sweden is that their education systems incorporate internships and on-
the-job training to a much larger extent than does the Swedish educational system.
Another report from Ungdomsstyrelsen (2009b), suggests that on-the-job training not
only is of importance within the educational system but also as a labour market
program. Larsson (2003) found that labour market programs that focus on workplace
practice are more successful than those focusing on pure educational training. The same
result is found in a study by Carling and Richardson (2004).
4.3.2 Collaboration between Relevant Instances
Another common suggestion is the need of a better collaboration between various
instances; such as the employment offices, the municipalities, the Försäkringskassan
and the social service centres (Ungdomsstyrelsen 2009b, OECD, 2008).
In a report from 2007, Ungdomsstyrelsen describes some attempts of collaboration, in
navigator centres, within some municipalities. Funds were provided by the government
through the Ungdomsstyrelsen and the money was split between 28 municipal projects.
The report tries to make an evaluation of the projects through interviews with those
responsible for the projects as well as coworkers. What can be said is that the
collaboration has increased between the authorities the unemployed youths have contact
with. As a result of these projects the youths only have to go to one place where most
assistance needed can be found (Ungdomsstyrelsen, 2007).
According to Ungdomsstyrelsen (2009b), the navigator centres described above are
examples of projects that have been successful in helping youths solve their possible
problems and then moving on to finding jobs or start studying. As is reported by
Ungdomsstyrelsen (2009b) it is important to identify the troubled youths early and by
collaboration between the municipalities and other agencies that can be done.
Successful methods that have been seen within local projects, such as the navigator
centres, are the flexibility of the institution and their careful mapping of the individuals
and their history. If all aspects of the youth’s problems are known it is easier for the
officers to adapt the solutions to him or her (Ungdomsstyrelsen, 2009b).
4.3.3 Entrepreneurial Climate
Another suggestion is to improve the local entrepreneurial climate in the municipalities.
This is one of the recommendations OECD has for lowering the high level of
20
unemployment Sweden had in the 1990’s (OECD, 1998b). Since not much has changed,
with regards to the unemployment situation, one can assume that it still a valid
recommendation. It states that small and medium sized enterprises (SME) are
“important for raising the employment-generating capacity of the economy” (OECD,
1998b, p.65).
OECD (1998a) says that because of the important role of SME:s one should focus more
on improving their situation. That could mean a lowering of the obstacles to start new
businesses and also to facilitate the rules with which they have to comply. The same
suggestion is made by Ekberg (1997).
In Rantakeisu et al. (1996) one can read how it is common for the government to
attempt to solve the adult unemployment with structural measures, but for the youths
there is a focus in individual measures. The measures used are usually education and
some on-the-job training. According to Rantakeisu et al. (1996) this will only lead to
increased competition among the youths since the amount of jobs not is increasing.
Thus the logic thing to do should be to encourage more job creating measures.
Arena för tillväxt (2010) finishes their report by stating five concluding advices for the
policymakers. One of them is to stimulate the entrepreneurial way of thinking among
the youths and to improve the local entrepreneurial environment in order to increase the
amount of jobs available.
4.3.4 Labour Market Regulations
The last category of solutions to the youth unemployment is to change the labour
market regulations, which was also discussed in Chapter 3. One example of a regulation
that is disadvantaging youths is the LAS (SFS 1982:80). One of its areas of regulation
concerns who will be made redundant first, in a case of downsizing of a company. It
says that the last one in will be the first one out. If two employees would have worked
for the company for the same length of time the one who is youngest is made redundant.
According to Sahlén and Kreicbergs (2009) there are many myths in the debate about
the LAS and youth unemployment. Some claims that the problem is not the act itself,
but the temporary employments which youths tend to get, and others that the youths
would be the first to be made redundant even in the absence of the LAS. Sahlén and
Kreicbergs (2009), examine employment and unemployment statistics carefully and
finds that the LAS does hurt youths. In the category of temporary employments the
percentage of youths that were laid off between 2008 and 2009 were not significantly
higher than the percentage for the older workers. The main difference was seen within
the category of permanent employments where the percentage of youths that lost their
jobs within the same time period was five times higher than the percentage for older
workers.
There are other regulations on the labour market that hurt youths than the Employment
Protection Act. One example is the relatively high minimum wages in Sweden (Arena
för tillväxt, 2010; OECD, 2008). As long as the minimum wage is relatively high it
might be too costly for some firms to employ youths, since they in general are less
productive as a result of their smaller amount of work experience than older workers.
This way of thinking is also present in the work of le Grand (1997). He compares the

21
Swedish labour market with the Japanese, where the wages varies more with age. It is
cheap to hire youths in Japan and, as a result, their youth unemployment is not as severe
as the Swedish.
Apart from lower minimum wages there are other ways of making it cheaper to employ
youths. One example is to subsidise employments for youths (Lundin, 2007). The
employment offices in Sweden have the possibility to subsidise the employment of
youths who have been enrolled with an employment office for at least six months; the
employment may be temporal. The youths are then considered to be workers and are no
longer listed as unemployed. Lundin (2007), finds that youths that have been included
in the program and had a subsidised employment, more often than others, end their
unemployment period and manage to find regular jobs.

22
5 Entrepreneurial Climate
This chapter discusses the second research question, what is meant with an
entrepreneurial climate and discusses what factors that constitutes a good one. In
addition the yearly ranking of all Swedish municipalities constructed by Svenskt
Näringsliv is presented.
5.1 Why is an Entrepreneurial Climate Important?
The attention given to entrepreneurship and entrepreneurial climate is quite new. As
described by Granfeldt and Hjort af Ornäs (2003), it was not until the 1990’s the
discussions started to flourish due to the observations that towns with similar economic
presuppositions and structures seemed to develop in very different directions. It was
realised that there was something else, apart from these structural and economical
factors, that steered the development and it was called “factor X”.
Later on it was realised that the “factor X” consisted of ideas, knowledge, thoughts and
competence that is carried by humans and develops within their networks. According to
Granfeldt and Hjort af Ornäs (2003) this social capital is of great importance for the
local business life.
This view is shared by many. For example Jerkert (1999) says that the private firms are
those that provide the new jobs and therefore it is of great importance that the
municipalities appreciate that and collaborate with the firms. Not only is the job
creation important per se, it is also an important source of income for the municipality;
the more people who are employed the more taxes they can collect. In an SOU from
2008 it is said that Sweden needs new firms to establish themselves and provide jobs
throughout the country. Thus entrepreneurship is of great importance for the future
growth of both municipalities and the country in general (SOU, 2008:121).
The same view is held by Rönn (2002) who says that “the entrepreneurial climate has an
essential importance for the wealth of a municipality or a country. Where the climate is
beneficial the business life flourishes, ideas are realised and employment opportunities
are created.” (p. 6, author’s own translation).
The importance is also highlighted from higher authorities such as the European Union
(EU), where the Small Business Act (SBA) was presented by the European Commission
in 2008. It contained several suggestions for improvements of the situation for the
SME’s since they are of such great importance for the economic growth and creation of
employment opportunities (EU, 2010).
5.2 A Good Entrepreneurial Climate
It has been suggested in the previous section that an entrepreneurial climate is of
importance for economic growth of the municipality and also to lower the
unemployment rate through job creation. This section focuses on the question of what
constitutes a good entrepreneurial climate and what the municipalities can do in order to
improve it for the private firms.
23
Jerkert (1999) is dividing factors into two categories; one relating to the firm itself and
one to its employees and owners. In the first category he puts the importance of good
networks between the firms, the municipality and other authorities. Important are also
the attitudes held in the municipality, both by the municipal staff and among the
inhabitants in general. Creating meeting places for entrepreneurs and business owners is
also a factor appreciated by the businesses. In order to facilitate for the establishment
and development of firms it is also important that the municipalities can assist with
fundraising and that it can provide high quality labour. A nice blend of firms is also
appreciated by business owners, according to Jerkert (1999).
In the second category Jerkert (1999) places fundamental factors appealing to the
business owners and their employees. The first one mentioned is the importance of the
municipality to have well managed finances. It is also important that the municipality
can offer good quality schools and a good environment so that families can live
satisfactorily in the area.
Another factor that Jerkert (1999) discusses is the importance of a well functioning
infrastructure. This is important for both categories since the firms are dependent on the
infrastructure transports to and from their firms and the employees for their commuting
possibilities.
Another study enhancing the importance of attitudes is performed by Rönn (2002).
According to him the existence of positive attitudes and a spirit of cooperation are very
important in the long run for the new business development. He suggests some more
concrete actions that the municipality can make in order to improve the entrepreneurial
climate locally. The first is to establish a single department within the municipality
which is responsible for all communication with the firms; this makes it more clear and
easy for the firms when they need to contact the municipality. The second is to adapt the
laws concerning building and construction so that entrepreneurship is stimulated. The
third is to keep the taxes and other fees on low levels in order to not deter firms from
establishing themselves in the municipality. The last suggestion made is to work
actively to shorten the office turnaround time required for municipal permissions.
The municipalities have always been assumed to provide competent labour, good
infrastructure, residences, premises for firms, schools, child care facilities and a range of
leisure time activities (Granfeldt & Hjort af Ornäs, 2003). Most of these are important
for the employees. Recently the demand for more business promoting services has
increased and business owners demand that the municipality can offer a good social
climate and cooperation with the private firms. This can be summarised as the identity
of the municipality according to Granfeldt and Hjort af Ornäs (2003).
A study by Sveriges Kommuner och Landsting (SKL, 2010) claims that the
entrepreneurial climate in a municipality depends on three categories of factors. The
first regards factors and condition which the municipality are not able to affect, such as
the geography. The second category concerns factors which the municipality can affect
to some extent, such as infrastructural issues. The last category concerns factors of
which the municipality is solely responsible for, such as how service-minded the
municipality is towards the local firms.
The SBA presented by the EU in 2008 presents several suggestions for improving the
entrepreneurial climate in the local regions of Europe (EU, 2010). For example the
24
member states should create an entrepreneurial climate that benefit family run
businesses, SME:s and reward entrepreneurial thinking. The member states are also
encouraged to make the public administrations more adherent to the needs of SME:s,
shorten the office turnaround times, and create so called one-stop-shops. This is a place
in the municipality where the firm can go with all its problems instead of contacting
several instances. More information should also be given to firms of how to compete in
public procurements.
A publication by Svenskt Näringsliv (2008) is discussing more practically how firms
and municipalities can improve the local entrepreneurial climate. In order to create a
good communication between the municipality and the private firms one could organise
meetings and company visits, publish newsletters and improve the municipality’s
webpage. According to Svenskt Näringsliv (2008) it is very appreciated by the business
owners if representatives from the municipality participate in the meetings with local
business associations. When there is no time for personal meetings the webpage of the
municipality is a very useful tool. There should be easy to find information about public
procurement and contact information as well as to download various forms.
Several researchers have enhanced the importance of attitudes within the municipality;
Svenskt Näringsliv (2008) is one of them. Except for making an effort to learn about the
local firms the municipalities could open up for competition within sectors where they
do not need to operate. That allows for new firm establishments and the municipalities
can focus on their core tasks instead of running companies on the side.
A suggestion made by Svenskt Näringsliv (2008) that is not seen much elsewhere in the
literature is service warranties. This implies that the municipality obliges itself to handle
various applications within a certain number of days. One example is to have a planning
permit handled within 7 or 14 working days. This is a way for the municipality to signal
to the firms that they are important and to increase the possibilities to plan ahead for the
firms.
5.3 Ranking of Municipalities’ Entrepreneurial Climate
Several rankings that compare the entrepreneurial climate in the municipalities exist.
The most known is Lokalt företagsklimat, a ranking made by Svenskt Näringsliv
(Granfeldt & Hjort af Ornäs, 2003). It has been presented on a yearly basis since 2000.
Another ranking concerning entrepreneurial climate is Företagarna om kommunen
made by SCB but only for those municipalities that requests their participation. The
results are not publicly presented after that but given to the participating municipalities
(SKL, 2010). A ranking that is focusing more on the performance of the local firms as a
measure of the entrepreneurial climate is Årets företagarkommun made by Företagarna
and UC. Företagarna is an organisation working to enhance the interest of firms and UC
is Sweden’s leading firm handling business and credit records (SKL, 2010).
The ranking, Lokalt företagsklimat, conducted by Svenskt Näringsliv is based on both
official statistics and questionnaires. The questionnaires are sent to local business
owners who are supposed to grade the municipality, where the firm is located, on
several issues. In municipalities with less than 1,200 firms and less than 50,000
inhabitants 200 questionnaires are sent out to randomly selected firms. In medium sized
25
municipalities, with more than 50,000 inhabitants and more than 1200 firms, 400
questionnaires are sent out. In the larger municipalities, Malmö and Göteborg, 600
questionnaires are sent out and finally in Stockholm 1,200. This is supposed to make the
collected statistics more reliable (Svenskt Näringsliv, 2010b).
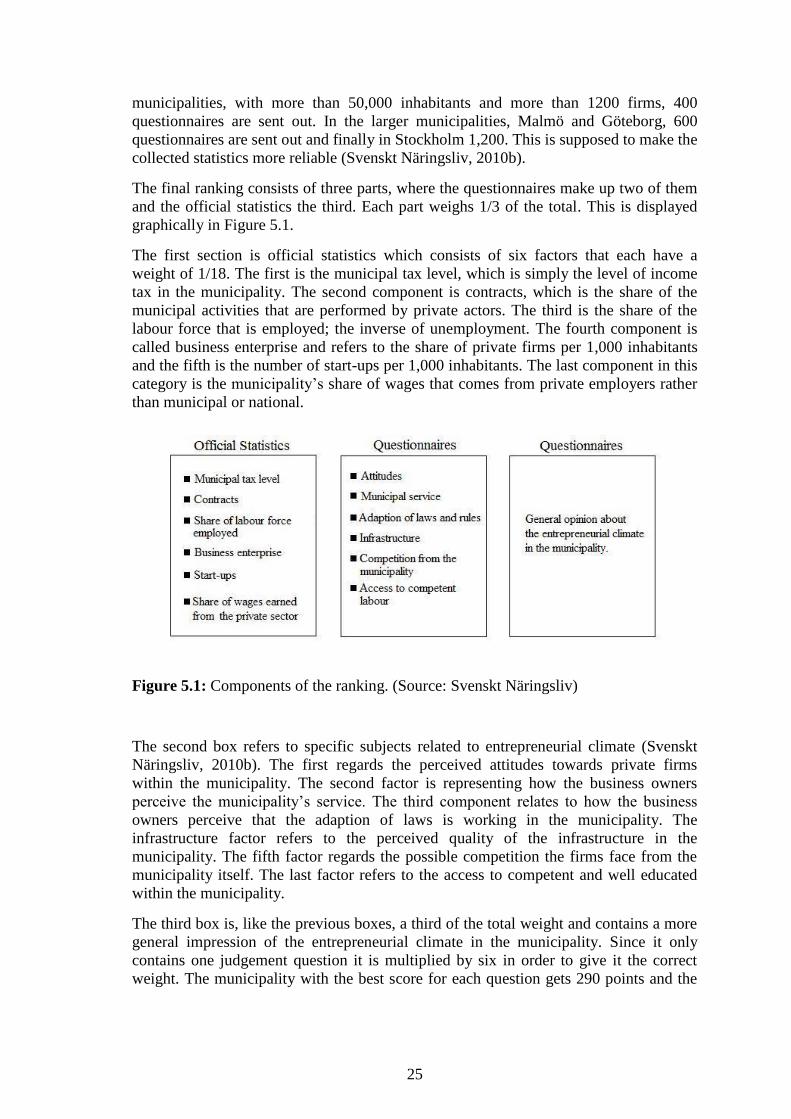
The final ranking consists of three parts, where the questionnaires make up two of them
and the official statistics the third. Each part weighs 1/3 of the total. This is displayed
graphically in Figure 5.1.
The first section is official statistics which consists of six factors that each have a
weight of 1/18. The first is the municipal tax level, which is simply the level of income
tax in the municipality. The second component is contracts, which is the share of the
municipal activities that are performed by private actors. The third is the share of the
labour force that is employed; the inverse of unemployment. The fourth component is
called business enterprise and refers to the share of private firms per 1,000 inhabitants
and the fifth is the number of start-ups per 1,000 inhabitants. The last component in this
category is the municipality’s share of wages that comes from private employers rather
than municipal or national.
Figure 5.1: Components of the ranking. (Source: Svenskt Näringsliv)
The second box refers to specific subjects related to entrepreneurial climate (Svenskt
Näringsliv, 2010b). The first regards the perceived attitudes towards private firms
within the municipality. The second factor is representing how the business owners
perceive the municipality’s service. The third component relates to how the business
owners perceive that the adaption of laws is working in the municipality. The
infrastructure factor refers to the perceived quality of the infrastructure in the
municipality. The fifth factor regards the possible competition the firms face from the
municipality itself. The last factor refers to the access to competent and well educated
within the municipality.
The third box is, like the previous boxes, a third of the total weight and contains a more
general impression of the entrepreneurial climate in the municipality. Since it only
contains one judgement question it is multiplied by six in order to give it the correct
weight. The municipality with the best score for each question gets 290 points and the
26
municipality with the worst score 1 point. The points are then summarised to give an
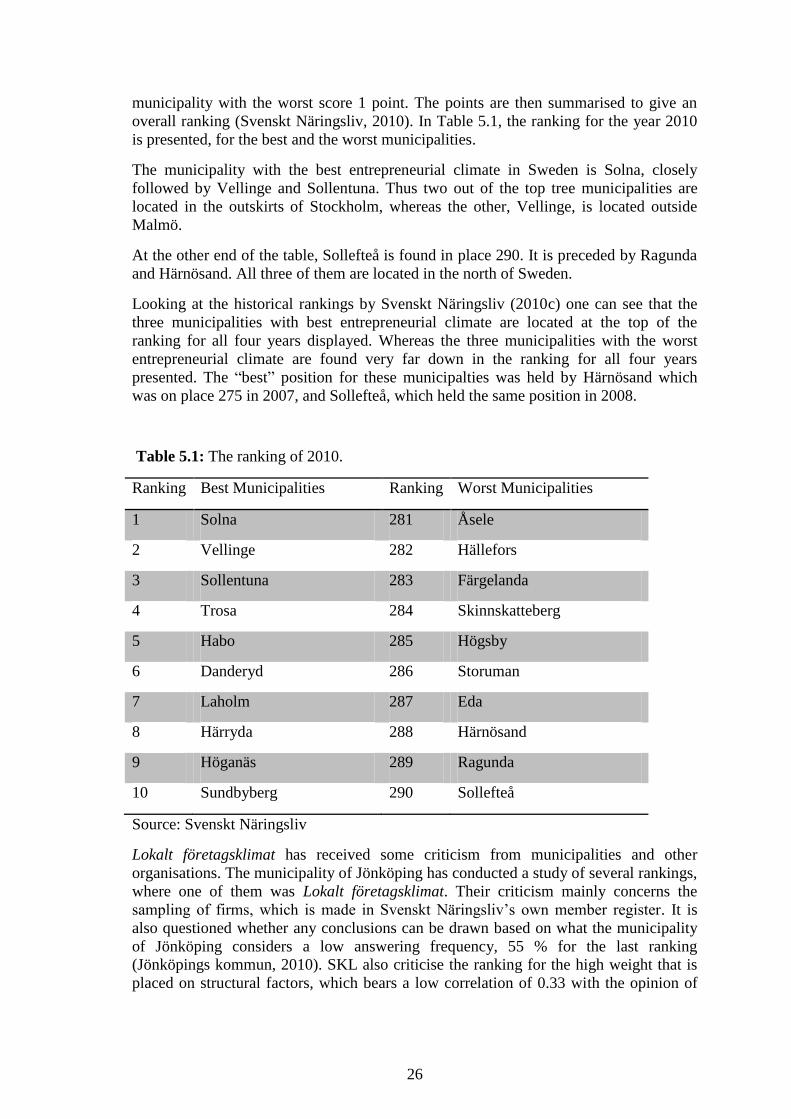
overall ranking (Svenskt Näringsliv, 2010). In Table 5.1, the ranking for the year 2010
is presented, for the best and the worst municipalities.
The municipality with the best entrepreneurial climate in Sweden is Solna, closely
followed by Vellinge and Sollentuna. Thus two out of the top tree municipalities are
located in the outskirts of Stockholm, whereas the other, Vellinge, is located outside
Malmö.
At the other end of the table, Sollefteå is found in place 290. It is preceded by Ragunda
and Härnösand. All three of them are located in the north of Sweden.
Looking at the historical rankings by Svenskt Näringsliv (2010c) one can see that the
three municipalities with best entrepreneurial climate are located at the top of the
ranking for all four years displayed. Whereas the three municipalities with the worst
entrepreneurial climate are found very far down in the ranking for all four years
presented. The “best” position for these municipalties was held by Härnösand which
was on place 275 in 2007, and Sollefteå, which held the same position in 2008.
Table 5.1: The ranking of 2010.
Ranking Best Municipalities Ranking Worst Municipalities
1 Solna 281 Åsele
2 Vellinge 282 Hällefors
3 Sollentuna 283 Färgelanda
4 Trosa 284 Skinnskatteberg
5 Habo 285 Högsby
6 Danderyd 286 Storuman
7 Laholm 287 Eda
8 Härryda 288 Härnösand
9 Höganäs 289 Ragunda
10 Sundbyberg 290 Sollefteå
Source: Svenskt Näringsliv
Lokalt företagsklimat has received some criticism from municipalities and other
organisations. The municipality of Jönköping has conducted a study of several rankings,
where one of them was Lokalt företagsklimat. Their criticism mainly concerns the
sampling of firms, which is made in Svenskt Näringsliv’s own member register. It is
also questioned whether any conclusions can be drawn based on what the municipality
of Jönköping considers a low answering frequency, 55 % for the last ranking
(Jönköpings kommun, 2010). SKL also criticise the ranking for the high weight that is
placed on structural factors, which bears a low correlation of 0.33 with the opinion of

27
the local firms. In addition, the selected firms that fill out the questionnaire have not
necessarily been in contact with the municipality. This can affect the ranking of the
municipalities (SKL, 2010).
28
6 The Relationship between Unemployment & Entrepreneurship
Based on the background, theory and qualitative discussions presented in the previous
chapters this chapter conducts a quantitative empirical study on the Swedish
municipalities and the connection between entrepreneurial climate and youth
unemployment.
6.1 Presentation of Model and Variables
This study sets out to investigate the relationship between youth unemployment and
entrepreneurial climate within the Swedish municipalities. This is already from the
outset a difficult relationship to model considering the multifaceted term entrepreneurial
climate. As was seen previously, in section 5.2 and section 5.3, the concept contains
various factors ranging from good communication between firms and the municipality
to good schools and housing for their employees. These variables are very difficult to
measure, if not impossible. As a consequence this study will make use of two proxy
variables attempting to measure the result of having an entrepreneurial climate instead
of the entrepreneurial climate itself; this being the number of existing and newly
established firms in the municipality.
In order to incorporate deviations from this simple relationship between entrepreneurial
relationship and unemployment two additional dummy variables are included in the
model. The final model used in this study is presented in Equation 6.1.
(6.1)
Closer descriptions of each variable and the sources of the data used are found below.
Unemployment (U)
This variable is the dependent variable and constitutes the unemployment in the age
group 18-24, which has been collected from Arbetsförmedlingen. The data is presented
in percentages for two groups, those that are openly unemployed and those that are
participating in labour market programs. Since those youths that are participating in
labour market programs do so because they are unemployed the two groups were
aggregated into one variable; unemployment.
Newly established firms (StartUps)
This variable is one of the explanatory variables. It measures the number of newly
established firms per 1,000 inhabitants in each municipality. The data is collected from
another database provided by Svenskt Näringsliv named Företagsklimat. It is assumed
that a higher value indicates that it is easier to establish new businesses within the
specific municipality, which should indicate a good entrepreneurial climate.
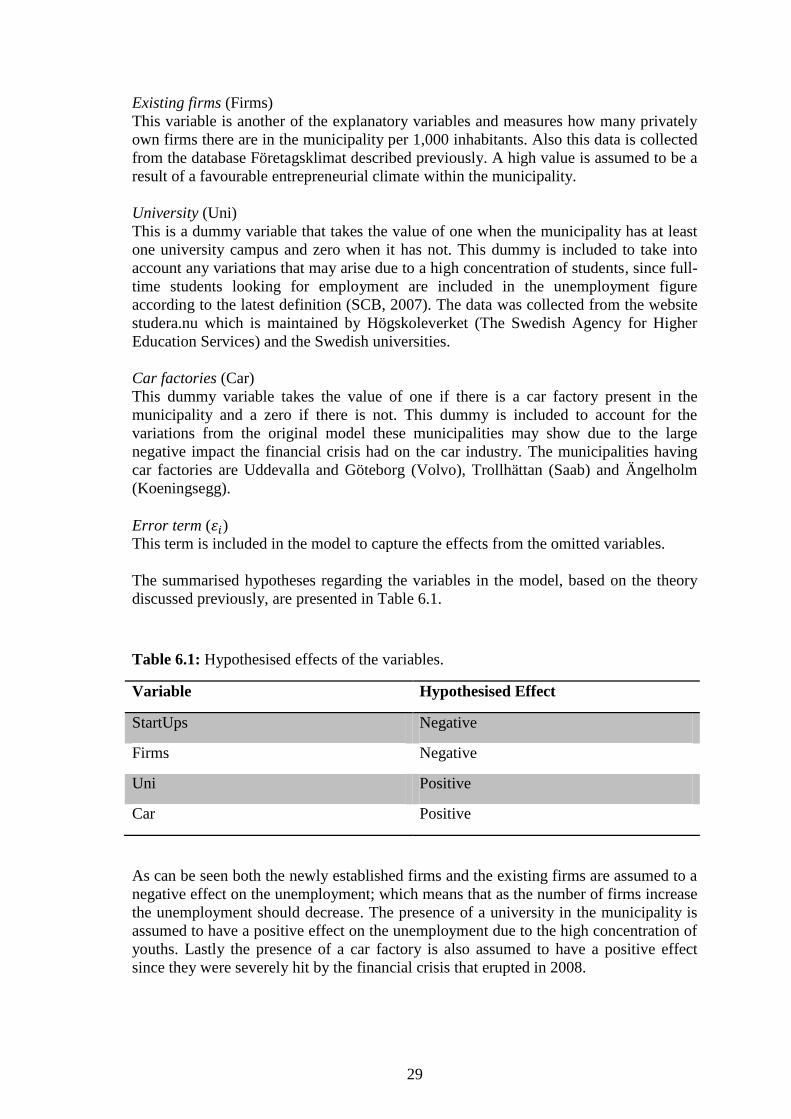
29
Existing firms (Firms)
This variable is another of the explanatory variables and measures how many privately
own firms there are in the municipality per 1,000 inhabitants. Also this data is collected
from the database Företagsklimat described previously. A high value is assumed to be a
result of a favourable entrepreneurial climate within the municipality.
University (Uni)
This is a dummy variable that takes the value of one when the municipality has at least
one university campus and zero when it has not. This dummy is included to take into
account any variations that may arise due to a high concentration of students, since full-
time students looking for employment are included in the unemployment figure
according to the latest definition (SCB, 2007). The data was collected from the website
studera.nu which is maintained by Högskoleverket (The Swedish Agency for Higher
Education Services) and the Swedish universities.
Car factories (Car)
This dummy variable takes the value of one if there is a car factory present in the
municipality and a zero if there is not. This dummy is included to account for the
variations from the original model these municipalities may show due to the large
negative impact the financial crisis had on the car industry. The municipalities having
car factories are Uddevalla and Göteborg (Volvo), Trollhättan (Saab) and Ängelholm
(Koeningsegg).
Error term ( ) This term is included in the model to capture the effects from the omitted variables.
The summarised hypotheses regarding the variables in the model, based on the theory
discussed previously, are presented in Table 6.1.
Table 6.1: Hypothesised effects of the variables.
Variable Hypothesised Effect
StartUps Negative
Firms Negative
Uni Positive
Car Positive
As can be seen both the newly established firms and the existing firms are assumed to a
negative effect on the unemployment; which means that as the number of firms increase
the unemployment should decrease. The presence of a university in the municipality is
assumed to have a positive effect on the unemployment due to the high concentration of
youths. Lastly the presence of a car factory is also assumed to have a positive effect
since they were severely hit by the financial crisis that erupted in 2008.

30
6.2 Descriptive Statistics
The descriptive statistics for both years examined are found below; the statistics for
2006 in Table 6.2 and the statistics for 2009 in Table 6.3.
Table 6.2, shows that the mean value of unemployment in 2006 is 9.06 in the Swedish
municipalities. Nevertheless, there are large differences between the municipalities, as
shown by their maximum and minimum values. The municipality with the highest level
of unemployment has a figure of 23.56% and the municipality with the lowest
unemployment only a figure of 1.21%.
Large differences are found for some of the other variables as well. Regarding the
newly established firms in the municipalities the municipality with the “best
entrepreneurial climate” saw 15.72 firms establish themselves, per every 1,000
inhabitants, in 2006 whilst the municipality with the “worst entrepreneurial climate”
only had 3.23 new firms per 1,000 inhabitants. Looking at the variable for existing firms
the municipality with the “best entrepreneurial climate” had 213.54 firms per 1,000
inhabitants whereas the equivalent figure for the municipality with the “worst
entrepreneurial climate” was 47.42. This suggests that there is a difference of
approximately 350% between the “worst” and the “best” municipality.
The mean values for the dummy variables, Uni and Car, can be interpreted differently
than the other variables. Since the only values the dummy variables can have are zero
and one the mean value is the probability of a one; thus the probability that a
municipality has a university campus or a car factory. As can be seen in Table 6.2, the
probability of having a university campus is 0.14. It also suggests that 14% of all
Swedish municipalities have a university campus. By the same token only 1% of the
Swedish municipalities have a car factory.
Table 6.2: Descriptive statistics for 2006.
U StartUps Firms Uni Car
Mean 9.06 7.23 113.86 0.14 0.01
Median 8.72 6.93 108.82 0 0
Max 23.56 15.72 213.54 1 1
Min 1.21 3.23 47.42 0 0
Standard
deviation
3.72 1.82 32.58 0.35 0.12
Number of
observations
290 290 290 290 290
The dummy variables are the same for 2009 and therefore their descriptive statistics
have not changed, although the other variables’ statistics have. As can be seen in Table
6.3, the mean value of the unemployment was 12.36% in 2009, which is 3.30

31
percentage points higher than in 2006. Clearly the financial crisis has had an effect on
the average Swedish municipality. What is interesting to note is that the variation in
unemployment is larger in 2009, the maximum value is 27.62% and the lowest value
1.54%. This increase is also confirmed by higher standard deviation; 4.65 instead of the
former 3.72.
The number of start-ups and established firms shows interesting trends, the mean value
of start-ups is 7.3 in 2009 as compared to the 6.93 in 2006. The number of established
firms has also seen an increase from an average of 113.86 per 1000 inhabitants in 2006
to 117.66 in 2009. This suggests that more private firms exist and more new ones are
established on average in the Swedish municipalities even though the economy moved
into a recession. This supports the study performed by Fario et al. (2010).
Table 6.3: Descriptive statistics for 2009.
U StartUps Firms Uni Car
Mean 12.36 7.30 117.66 0.14 0.1
Median 12.41 7.04 112.72 0 0
Max 27.62 17.06 219.35 1 1
Min 1.54 3.15 50.76 0 0
Standard
deviation
4.65 1.86 32.77 0.35 0.12
Number of
observations
290 290 290 290 290
The median values in Table 6.2., and Table 6.3., are often lower than the mean values
for the same variables, except for the dummy variables. This suggests that there are
some municipalities that have very high values of start-ups, established firms and
unemployment which pushes the mean values upwards past the median values. There
should thus be more municipalities with very high values than very low values.
6.3 Regression Results
In order to establish the relationship between the variables and to test the hypothesis
made in section 1.1, an OLS regression was performed on the data. The results can be
seen in Table 6.4 and Table 6.5.
White’s heteroscedasticity test was performed, as recommended by Gujarati (2003)
when dealing with cross-sectional data. Heteroscedasticity2 was found to be present for
2 The variance of the error term, , is not constant, instead it depends on the x-value. If the problem is not
remedied the estimated coefficients are bisaed and the whole result could be misleading (Gujarati,
2003).
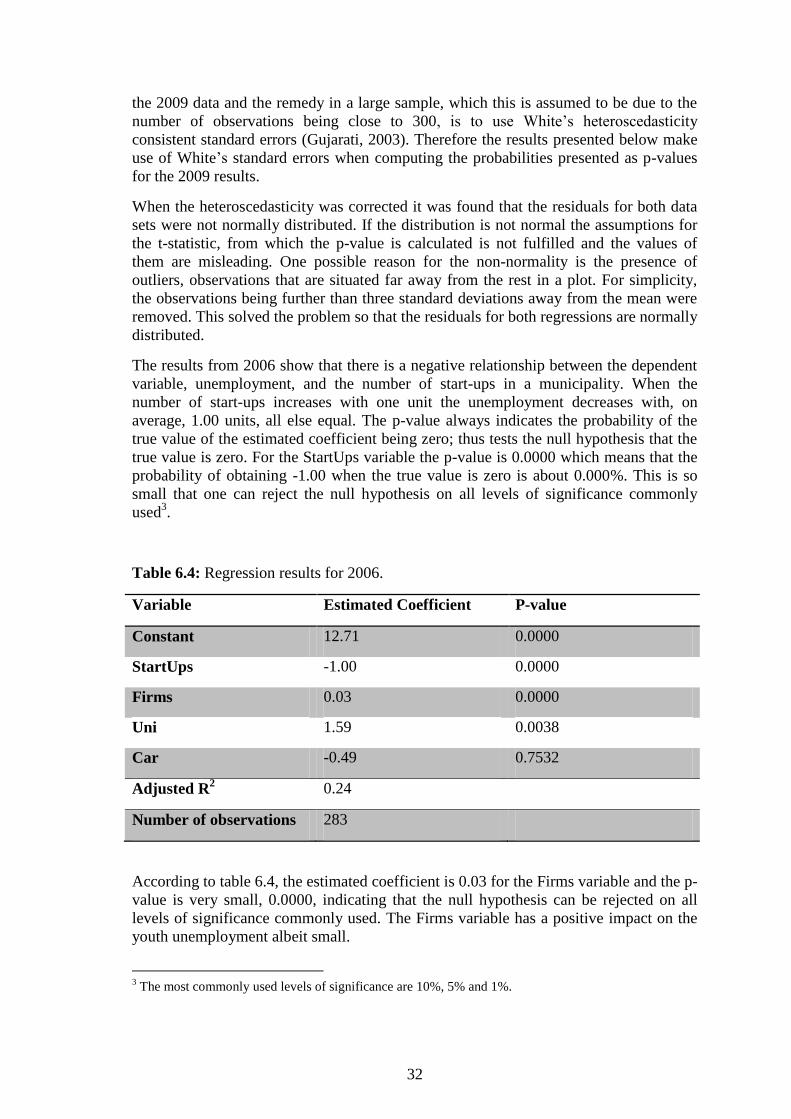
32
the 2009 data and the remedy in a large sample, which this is assumed to be due to the
number of observations being close to 300, is to use White’s heteroscedasticity
consistent standard errors (Gujarati, 2003). Therefore the results presented below make
use of White’s standard errors when computing the probabilities presented as p-values
for the 2009 results.
When the heteroscedasticity was corrected it was found that the residuals for both data
sets were not normally distributed. If the distribution is not normal the assumptions for
the t-statistic, from which the p-value is calculated is not fulfilled and the values of
them are misleading. One possible reason for the non-normality is the presence of
outliers, observations that are situated far away from the rest in a plot. For simplicity,
the observations being further than three standard deviations away from the mean were
removed. This solved the problem so that the residuals for both regressions are normally
distributed.
The results from 2006 show that there is a negative relationship between the dependent
variable, unemployment, and the number of start-ups in a municipality. When the
number of start-ups increases with one unit the unemployment decreases with, on
average, 1.00 units, all else equal. The p-value always indicates the probability of the
true value of the estimated coefficient being zero; thus tests the null hypothesis that the
true value is zero. For the StartUps variable the p-value is 0.0000 which means that the
probability of obtaining -1.00 when the true value is zero is about 0.000%. This is so
small that one can reject the null hypothesis on all levels of significance commonly
used3.
Table 6.4: Regression results for 2006.
Variable Estimated Coefficient P-value
Constant 12.71 0.0000
StartUps -1.00 0.0000
Firms 0.03 0.0000
Uni 1.59 0.0038
Car -0.49 0.7532
Adjusted R2 0.24
Number of observations 283
According to table 6.4, the estimated coefficient is 0.03 for the Firms variable and the p-
value is very small, 0.0000, indicating that the null hypothesis can be rejected on all
levels of significance commonly used. The Firms variable has a positive impact on the
youth unemployment albeit small.
3 The most commonly used levels of significance are 10%, 5% and 1%.
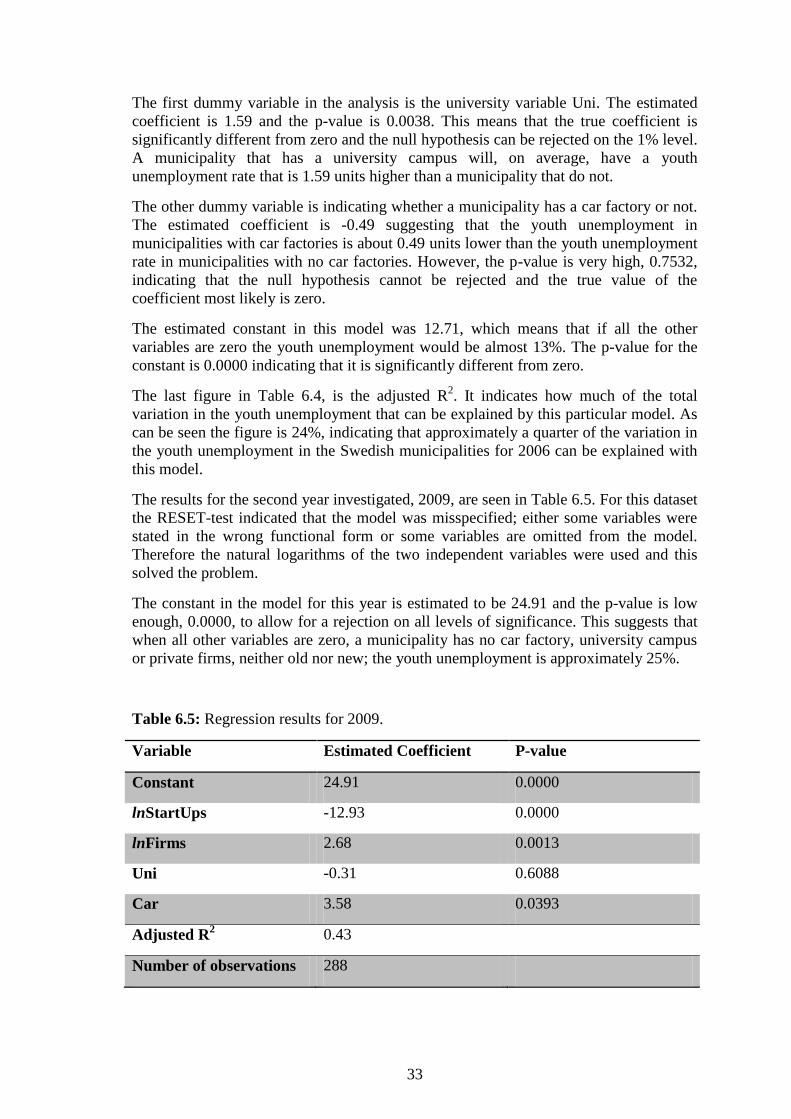
33
The first dummy variable in the analysis is the university variable Uni. The estimated
coefficient is 1.59 and the p-value is 0.0038. This means that the true coefficient is
significantly different from zero and the null hypothesis can be rejected on the 1% level.
A municipality that has a university campus will, on average, have a youth
unemployment rate that is 1.59 units higher than a municipality that do not.
The other dummy variable is indicating whether a municipality has a car factory or not.
The estimated coefficient is -0.49 suggesting that the youth unemployment in
municipalities with car factories is about 0.49 units lower than the youth unemployment
rate in municipalities with no car factories. However, the p-value is very high, 0.7532,
indicating that the null hypothesis cannot be rejected and the true value of the
coefficient most likely is zero.
The estimated constant in this model was 12.71, which means that if all the other
variables are zero the youth unemployment would be almost 13%. The p-value for the
constant is 0.0000 indicating that it is significantly different from zero.
The last figure in Table 6.4, is the adjusted R2. It indicates how much of the total
variation in the youth unemployment that can be explained by this particular model. As
can be seen the figure is 24%, indicating that approximately a quarter of the variation in
the youth unemployment in the Swedish municipalities for 2006 can be explained with
this model.
The results for the second year investigated, 2009, are seen in Table 6.5. For this dataset
the RESET-test indicated that the model was misspecified; either some variables were
stated in the wrong functional form or some variables are omitted from the model.
Therefore the natural logarithms of the two independent variables were used and this
solved the problem.
The constant in the model for this year is estimated to be 24.91 and the p-value is low
enough, 0.0000, to allow for a rejection on all levels of significance. This suggests that
when all other variables are zero, a municipality has no car factory, university campus
or private firms, neither old nor new; the youth unemployment is approximately 25%.
Table 6.5: Regression results for 2009.
Variable Estimated Coefficient P-value
Constant 24.91 0.0000
lnStartUps -12.93 0.0000
lnFirms 2.68 0.0013
Uni -0.31 0.6088
Car 3.58 0.0393
Adjusted R2 0.43
Number of observations 288

34
The estimated coefficient for the variable lnStartUps is -12.93, suggesting that a one
unit increase in the number of start-ups causes the youth unemployment to decrease
with [12.93*(1/StartUps)] units. Since the p-value is 0.0000 the null hypothesis that the
true value of the coefficient is zero can be rejected on all levels of significance.
The variable lnFirms has a coefficient of 2.68, indicating that for every unit increase in
the number of private firms per 1000 inhabitants the youth unemployment would
increase by [2.68*(1/Firms)] units. The p-value is 0.0013 and the null hypothesis that
the true value is zero can be rejected on the 1% level of significance.
The first dummy variable Uni has an estimated coefficient of -0.31 suggesting that a
municipality with a university campus on average has an unemployment rate that is
about 0.31 percentage points lower than a municipality without a university campus.
The p-value is 0.6088 and the null hypothesis of a true value of zero cannot be rejected.
The dummy variable Car shows an estimated coefficient of 3.58. This suggests that a
municipality with a car factory on average had an unemployment that was 3.64 units or
percentage points higher than a municipality that do not. Looking at the p-value, 0.0393
one can reject the null hypothesis of the true value being zero on the 5% level of
significance.
The adjusted R2 for the model on data from 2009 is 0.43. This indicates that 43% of the
variations in the unemployment variable are explained by this particular model.
35
7 Discussion
The first research question posed in this thesis concerned youth unemployment,
including questions like why is there such a thing as a youth unemployment problem,
what can be done to improve the situation and what the side effects are that makes this
problem so severe.
As seen in Chapter 4, the side effects are many and what is the most serious about them
is that they all tend to affect the society at large in a negative way; not only the youths
themselves. It was described, with an example from Nilsson (2010), how a youth who
becomes alienated at young age will cost the society about 15 million SEK until its
retirement, if nothing is done to help the youth enter the labour market. Even if the
youth does not become alienated for a longer time period it still damages their future
prospects on the labour market, in terms of wage levels and future employment
prospects, according to O’Higgins (1997), Gartell (2009), Nordström Skans (2004) and
Singell (1984).
As if those factors were not costly enough for the society Hammarström (1996) found in
her study that unemployed youths often had psychological or physical problems induced
by the unemployment spell. Additionally, the consumption habits also changed for the
worse with a higher intake of alcohol and junk food. According to O’Higgins (1997),
Britt (1994) and Singell (1984) the risk increased for drug abuse and property crimes
when the youth unemployment increased.
Summarised it is obvious that these side effects have the potential of becoming very
costly for the society if no actions are taken. A youth that turns to the criminal world is
difficult to successfully help entering the labour market. The same is the case for those
youths that develop serious health problems; they are more likely to be conceived as
permanently ill rather than entering the labour force. With higher costs and lower
revenues for the municipalities the quality of their services becomes lowered for all
citizens.
Where does the problem originate then? As outlined previously there are two levels of
reasons; one macro level and one micro level. On the macro level causes such as
globalisation, technological progress and the supply shock induced when women
entered the labour market were put forward by researchers. The supply shock
explanation does not seem well founded anymore, women have been part of the labour
force for a long time in Sweden and the market should have had time to adjust for that.
Nevertheless the other two causes seem more plausible in the 21st century. The
globalisation, in conjunction with the rapid technological progress seen, results in a shift
of industrial production from the developed countries to some of the developing
countries. Instead the production of knowledge intensive goods and the importance of
innovations increase in the developed countries, which puts higher demands on the
labour in, for example, Sweden.
This leads the discussion towards the micro level causes. The foundation of the human
capital of the labour is laid partly in school and partly on the workplace itself. The
Swedish education system has received much criticism from OECD due to its high
theoretical content and lack of vocational training (OECD, 2008). In addition, large
differences are shown in the report “Focus 09” presented by Ungdomsstyrelsen (2009a)
when the education systems in Denmark, the UK and the Netherlands are examined and
36
compared to the Swedish. Out of these four countries it was found that Sweden had the
highest youth unemployment figures and the lowest amount of vocational training.
In order to enable for a higher degree of vocational training within the Swedish
education system the relations with the business-life must be strengthened. This is also
pointed out as a problem; the lack of encouragement to improve the entrepreneurial
climate and inspire for innovations. This particular issue has received much attention
and the EU has suggested that more emphasis must be put on facilitating for the SME’s
throughout Europe (EU, 2010).
The last cause that is given attention is the existence of rigid laws and regulations in
Sweden. An employee is very costly for a firm since the minimum wages negotiated by
the labour unions are relatively high, together with the high social fees the firm must
pay. The regulations also make it difficult to fire an employee that does not live up to
the expectations. As a result firms, especially SME’s, are scared of hiring new
employees in the first place, and when they have to they prefer someone they know will
make a good job; someone with relevant work experience and good references.
Typically this person is not a youth.
When turning towards the solutions to the problem instead the macro level does not
exist at all; a nation or a municipality can effect neither globalisation nor technological
progress. All solutions therefore have a bottom-up approach; the intervention is made
on a low level and hopefully that has positive effects upward towards the higher levels.
One of the most common suggestions is to reform the educational system in Sweden to
incorporate more vocational training and internships. Another one is to reform LAS so
that it becomes easier to hire and fire employees as well as reform the turn-taking rules
that constantly disadvantage youths.
Another angle is taken by those who claim that the collaboration between instances such
as the employment offices, the municipality and social service centres should be
improved. This is believed to facilitate for youths that are unemployed to get assistance
so that they can enter the labour market or start studying without too much
complications.
What is quite interesting is that all these remedies discussed so far aims at increasing the
competence of the youth or removing some regulations that aggravated their entrance on
the labour market. Some youths do need that since they may have incomplete grades
from the upper secondary school, which makes them more difficult to hire when the
jobs become more advanced.
Still, changing LAS and educating youths will not automatically create more jobs; it
will simply make more candidates qualified per job that is advertised. Therefore the
suggestion to improve the entrepreneurial climate in Swedish municipalities is regarded
very important in this study. Encouraging people with entrepreneurial minds and new
ideas to start their own businesses will help to create new jobs.
This position is held by several other researchers who claim that the entrepreneurial
climate is highly important for the job creation and economic development, not only in
Sweden but in developed countries in general (EU, 2010; SOU 2008:121; Rönn, 2002
and Jerkert, 1999).
37
Regarding the practical meaning of entrepreneurial climate the researchers’
interpretations seem to be varying rather little. The most common factor pointed out as
important is the attitudes in the municipality towards the private firms. Other common
factors indicating a good entrepreneurial climate are company visits and meetings, the
creation of a one-stop-shop for the firms in the municipal office, good infrastructure and
to adapt laws and regulations so that they benefit the entrepreneurial climate.
Some researchers (Jerkert, 1999 and Granfelt & Hjort af Ornäs, 2003) divided the
factors into two categories, one which is directly related to the firm and one that is more
of importance for the employees. The latter category also included factors such as good
schools, childcare facilities and housing. It is important that these factors are not
forgotten since the well-being of the citizens may well be one of the key factors
determining where entrepreneurs decide to establish their new firms.
The ranking produced by Svenskt Näringsliv is much in the same line of thought as
those factors that are suggested to be of importance. Thus the ranking seems to be well-
constructed and its results may be, at least, of guideline character. In the ranking
presented for 2010 the most obvious trend was the concentration around major cities for
those municipalities that made it to the top of the ranking, whilst those in the bottom
were located in the north of Sweden.
One contributing factor to this trend that is not directly encompassed in the construction
of the ranking is the wish of firms to locate near the large markets where most of the
potential customers and the subcontractors live. Consequently, the scarce population in
the North of Sweden and the long distance to the larger cities would disadvantage the
northern municipalities regardless of their encouraging efforts. This would be in line
with the agglomerating forces discussed within regional science.
The effect the entrepreneurial climate has on youth unemployment was examined in
Chapter 6. Unfortunately unemployment figures were not published for both age and
geography, so the proxy variable used cannot be expected to behave identically to the
true youth unemployment. Nevertheless the regular unemployment figure and those for
the youth unemployment were shown to correlate with approximately 93% on the
national level so its use can still be defended.
The empirical results from the regression output for 2006 confirmed that the level of
newly established firms in a municipality is negatively related to the youth
unemployment of that municipality. Since the level of newly established firms is a
proxy for entrepreneurial climate the hypothesis of the thesis is confirmed; the
entrepreneurial climate does affect the youth unemployment negatively. When the level
of newly established firms increase with one unit the unemployment will, on average,
decrease with approximately 1.00 units, or percentage points. Thus it seems that the
theory presented is working, when increasing the demand for labour, as shown in Figure
3.3, the excess supply diminishes.
This study thereby seems to confirm what other researchers have found (Fario et al.
2010; Garofoli, 1994 and Audretsch & Fritsch, 1994), namely a negative relationship
between entrepreneurial climate and unemployment. However, some care should be
taken since the database Företagsklimat is based on the members of Svenskt Näringsliv
only. It cannot be assumed to be fully valid for those firms that are not included in the
database.
38
The second proxy variable for entrepreneurial was found to be 0.03; the hypothesis
regarding Firms is consequently rejected. The reasons for this could be several. Firstly
there may be a relationship between Startups and Firms where Startups is the stronger
one making Firms look insignificant in the regression output. However, if that would be
the case the problem is not severe enough to create multicollinearity4 since the variance
inflation factors (VIF) shows no sign of it, they are all well below 10. Secondly, the
Startups variable reflects a flow whilst the Firms variable reflects a level. Therefore the
changes in unemployment may be better corresponding to the changes in private firms,
the Startups variable, since the value of the Firms variable is relatively small.
The first, out of the two, dummy variables Uni was significantly different from zero and
had a positive relationship to the unemployment variable. The hypothesis presented for
this variable was thereby confirmed. According to the regression output a municipality
with a university campus has, on average, an unemployment figure that is
approximately 1.6 units, or percentage points, higher than a municipality that does not
have a university campus. With the new definition of unemployment, incorporating full-
time students seeking employment, this is what could be expected.
The last dummy variable regarded municipalities with car factories and in the regression
output based on the data from 2006 it was proved to be insignificantly different from
zero. Thus the hypothesis made previously for this variable is rejected. The
unemployment figures for municipalities with and without car factories are not
statistically different from each other. Nevertheless, one should bear in mind that the
data from 2006 reflects a year when the economy was strong in Sweden.
The overall goodness of fit of the model to the data is estimated with the adjusted R2.
The figure presented in Table 6.4, indicates that 24% of the variations in unemployment
can be explained by the model. This a fairly good value although it suggests that some
influential factors have been left out by the model. This could be economic factors or
possibly geographical factors which neither were incorporated in this model.
Additionally, it could also be a result of lack of knowledge of the objects in the data.
For example, the data states how large share of a municipalities population that is
unemployed, however, it does not state the reason. In many cases persons that are
unemployed may have a criminal background, problems with alcohol or drugs, which
makes them difficult to hire even if new firms are being established in a municipality, It
may also be the case that unemployed persons lack relevant competence making them
unsuitable for newly established firms.
These findings help to show that as much as one can argue that educating youths is not a
complete solution to the youth unemployment problem, neither is improving the
entrepreneurial climate. In order to improve the situation for youths several measures
must be taken and used together.
The regression output based on the data from 2009 provides more valuable insights. The
most drastic change is that the dummy Car has become significantly different from zero
on all levels of significance, indicating that a municipality with a car factory has an
4 Multicollinearity is the statistical term for a situation where the independent variables, those on the
right-hand side in the regression equation, are correlated with each other. This can create inflated
variances which in turn makes the t-values smaller. It thus seems that the variables are not significantly
different from zero, even though they should be.

39
unemployment figure that is, on average, 3.58 units, or percentage point, higher than a
municipality without a car factory. Thus, for this dataset the hypothesis regarding the
Car variable is confirmed. Considering the change in economic situation in Sweden
from 2006 to 2009 it seems reasonable.
Linked to the financial crisis that erupted in 2008 is the shift in the constant between the
datasets; in 2006 it was approximately 13 and in 2009 almost 25. This suggests that the
average municipality had a youth unemployment figure that was 12 percentage points
higher in 2009 as compared to 2006, all else equal.
The StartUps variable is significantly different from zero and its hypotheses confirmed
for this set of data as well. The Uni variable, however, is not significantly different from
zero for this dataset. Looking a bit more carefully one can see that they have moved in
the opposite directions; the impact of StartUps has increased whereas the impact of Uni
has decreased. This suggests that the importance of a good entrepreneurial climate is of
higher importance in recessions than in booms. Could this be interpreted to mean that
the SME:s matters more in recessions as a result of large companies’ or public sector’s
downsizings? If more firms are established in recessions, as the descriptive statistics
indicate, but the youth unemployment still is higher the additional unemployment must
originate somewhere. This would be an interesting topic for further studies.
The insignificance of the Uni variable first seemed surprising but when including
psychology and expectations in the analysis it makes sense. In a recession full-time
students may have lower expectations on the labour market and they might stop seeking
employment, since they do not believe that they can acquire a job when the economic
situation is that bad.
The adjusted R2 for the regression output of the data from 2009 has almost doubled,
when compared to the value from the 2006 year’s data; from 24% to 43%. This
reinforces the discussion held previously that the entrepreneurial climate seem to be of
higher importance in recessions.
40
8 Conclusion
The purpose of this thesis was to create a deeper understanding of the concepts youth
unemployment and entrepreneurial climate as well as estimating the relationship
between them. The hypothesis posed was that the entrepreneurial climate would affect
the youth unemployment negatively in the Swedish municipalities, meaning that an
improved entrepreneurial climate would lower the youth unemployment.
The answer to the first research question posed is that the causes of youth
unemployment are several and exists on a macro level, globalism and technological
progress, and a micro level, education system, entrepreneurial climate and regulations of
the labour market. Nevertheless the suggested solutions are all originating at the micro
level. For example the reform of labour market regulations, improvements of local
entrepreneurial climates and more vocational training in the education system. The
youth unemployment problem is severe to the society both due to the large costs it
inflicts and the loss of revenues.
The answer to the second research question posed is that a good entrepreneurial climate
is important for the economic development and job creation in a region. The most
commonly suggested factors that constitute a good entrepreneurial climate are for
example the attitudes in the municipality towards private firms, the service of the
municipality and good communications in shape of company visits, newsletters, a one-
stop-shop and a useful website. In addition it is important that the municipality can be
appealing towards potential business owners and employees’ private needs.
The third research question regarded a quantitative analysis of youth unemployment and
entrepreneurial climate in the Swedish municipalities and the result confirmed the
hypothesis stated; the entrepreneurial climate is negatively related to the youth
unemployment. This is in line with the studies made by Garofoli (1994), Audretsch and
Fritsch (1994) and Fario et al. (2010).
Since the adjusted R2 was fairly mediocre for both years examined it brings up the
discussion of which other variables could be informative to include in this type of study.
One suggestion made for future studies is to focus more on the impact of distances
through transport costs from the larger cities in Sweden. Another suggestion is to look
at the population of the municipalities to see whether firms’ strive to be located close to
the potential customers is statistically important. A different angle of the topic would be
to make case studies of unemployed to see in which extent they are difficult to hire even
in the presence of job opportunities.
41
References
Arbetsförmedlingen (2010a). Så här styrs vår verksamhet. Retrieved on October 8,
2010, from: http://www.arbetsformedlingen.se/Om-oss/Var-verksamhet/Styrning.html
Arbetsförmedlingen. (2010b). Definitioner och förklaringar för Arbetsförmedlingens
statistik. Retrieved on December 22, 2010 from:
http://www.arbetsformedlingen.se/4.5673ff2e11fd0ca559b8000347738.html
Arena för tillväxt. (2010). Ungdomarna, jobben och framtiden!. [Report]. Stockholm:
Arena för tillväxt.
Audretsch, D.B., & Fritsch, M. (1994). The geography of firm births in Germany.
Regional studies, 28, 359-365.
Boeije, H. (2010). Analysis in Qualitative Research. London: Sage Publications.
Britt, C.L. (1994). Crime and unemployment among youths in the United States, 1958-
1990: A time series analysis. American Journal of Economics and Sociology, 53(1), 99-
109.
Carling, K. & Richardson, K. (2004). The relative efficiency of labor market programs:
Swedish experience from the 1990s. Labour Economics, 11, 335-354.
Cerny, P.G. (2010). The competition state today: from raison d’Etat raison du Monde.
Policy Studies, 31(1), 5-21.
Denscombe, M. (2009). Forskningshandboken – för småskaliga forskningsprojekt inom
samhällsvetenskaperna. Lund: Studentlitteratur.
Dornbusch, R., Fischer, S., & Startz, R. (2004). Macroeconomics (9th ed.). Boston:
McGraw-Hill.
Ekberg, J. (1997). Integrera invandrarna… In J. Johannesson & E. Wadensjö (Eds.), 28
recept mot arbetslösheten (p. 144-150). Stockholm: SNS Förlag.
Ekonomifakta. (2010). Sociala avgifter. Retrieved on January 10, 2011 from:
http://www.ekonomifakta.se/sv/Fakta/Arbetsmarknad/Arbetsgivaravgift/Sociala-
avgifter/
Eliasson, A. (2010). Kvantitativ metod från början. Lund: Studentlitteratur.
Eneroth, B. (1984). Hur mäter man ”vackert”? Grundbok i kvalitativ metod.
Stockholm: Natur och Kultur.
EU. (2010). En ”Small Business Act” för de små och medelstora europeiska företagen.
Retrieved on January 10, 2011 from:
http://europa.eu/legislation_summaries/enterprise/business_environment/et0001_sv.htm
Fario, J.R., Cuestas, J.C. & Mourelle, E. (2010). Entrepreneurship and unemployment:
A nonlinear bidirectional causality?. Economic Modelling, 27, 1282-1291.
42
Freeman, R.B., & Wise, D.A. (1982). The youth labour market problem: Its nature,
causes, and consequences. In R.B. Freeman & D.A. Wise (Eds.), The youth labour
market problem: Its nature, causes, and consequences (p.1-16). Chicago: University of
Chicago Press.
Garofoli, G. (1994). New firm formation and regional development: the Italian case.
Regional Studies, 28, 381-394.
Gartell, M. (2009). Har arbetslöshet i samband med examen från högskolan långsiktiga
effekter?. (2009:8) [Report]. Uppsala: IFAU.
Glaser, B.G., & Strauss, A.L. (1967). The discovery of grounded theory: Strategies for
qualitative reearch. New York: Aldine Publishing Company.
Granfelt, T., & Hjort af Ornäs, A. (2003). Näringslivsklimat i kommunerna: en fråga om
kultur och samspel. [Report]. Linköping: Centrum för kommunstrategiska studier –
Linköpings Universitet.
Gujarati, D.N. (2003). Basic econometrics (4th ed.). Boston: McGraw-Hill.
Hall, C. (2009). Förlängningen av yrkesutbildningarna på gymnasiet: effekter på
utbildningsavhopp, utbildningsnivå och inkomster. (2009:7) [Report]. Uppsala: IFAU.
Halvorsen, K. (1992). Samhällsvetenskaplig metod. Lund: Studentlitteratur.
Hammarström, A. (1996). Arbetslöshet och ohälsa – om ungdomars livsvillkor. Lund:
Studentlitteratur.
Hammer, T. (1992). Unemployment and use of drug and alcohol among young people:
a longitudinal study in the general population. British Journal of Addiction, 87, 1571-
1581.
Jerkert, B. (1999). Kommuner och företagare – i samverkan för tillväxt. Stockholm:
Företagarnas Riksorganisation.
Jönköpings kommun. (2010). Om kommunrankningar – en granskning av metod och
tillförlitlighet. [Report]. Jönköping: Jönköpings kommun.
Lag om anställningsskydd. SFS 1982:80.
Larsson, L. (2003). Evaluation of Swedish Youth Labour Market Programs. The
Journal of Human Resources, 38(4), 891-927.
Le Grand, C. (1997). Löner, arbetslivsutveckling och ungdomsarbetslöshet. In J.
Johannesson & E. Wadensjö (Eds.), 28 recept mot arbetslösheten (p. 133-136).
Stockholm: SNS Förlag.
Lundin, D. (2007). Subventionerade anställningar för unga – en uppföljning av allmänt
anställningsstöd för 20-24-åringar. (2007:1) [Report]. Uppsala: IFAU.
Lundin, M. (2008). Kommunerna och arbetsmarknadspolitiken. (2008:13) [Report].
Uppsala: IFAU.
McDowell, M., Thom, R., Frank, R., & Bernanke, B. (2006). Principles of Economics.
London: McGraw-Hill.
43
Munch, J.R. (2010). Whose job goes abroad? International outsourcing and individual
job separations. The Scandinavian Journal of Economics, 112(2), 339-360.
Nilsson, I. (2010). Unga som är utanför arbetsmarknaden. (Temagruppen Unga i
Arbetslivets skrifter 2010:3) [Report]. Stockholm: Ungdomsstyrelsen.
Nordström Skans, O. (2004). Har ungdomsarbetslöshet långsiktiga effekter. (2004:13)
[Report]. Uppsala: IFAU.
OECD. (1998a). Entrepreneurship and job creation. OECD Economic Surveys: Sweden,
6, 126-153.
OECD. (1998b). Implementing structural reform: a review of progress. OECD
Economic Surveys: Sweden, 6, 65-82.
OECD. (1998c). Education and training. OECD Economic Surveys: Sweden, 6, 83-125.
OECD. (2008). Education and youth unemployment. OECD Economic Surveys:
Sweden, 20, 89-124.
O’Higgins, N. (1997). The challenge of youth unemployment. International Social
Security Review, 50(4), 63-93.
Rantakeisu, U., Starrin, B. & Hagquist, C. (1996). Ungdomsarbetslöshet – Vardagsliv
och samhälle. Lund: Studentlitteratur.
Rönn, J. (2002). ”Tillsammans kan vi förändra” – en skrift om bra och dåligt
företagsklimat. [Report]. Stockholm: Svenskt Näringsliv.
Sahlén, M., & Kreicbergs, J. (2009). Fakta om turordningsreglerna och
ungdomsarbetslösheten. [Report]. Stockholm: Svenskt Näringsliv.
SCB. (2005). AKU-definitioner och förklaringar från och med april 2005. Retrieved on
January 10, 2011 from: http://www.scb.se/Pages/Standard____131801.aspx
SCB. (2007). Ny redovisning av arbetskraftsundersökningen (AKU) från oktober 2007.
Retrieved on January 10, 2011 from:
http://www.scb.se/statistik/AM/AM0401/_dokument/AKU1.pdf
SCB. (2009). Begrepp och definitioner av AKU. Retrieved on January 10, 2011 from:
http://www.scb.se/Pages/Standard____218190.aspx
Schröder, L. (1997). Wi= mpi – tcf . In J. Johannesson & E. Wadensjö (Eds.), 28 recept
mot arbetslösheten (p. 137-143). Stockholm: SNS Förlag.
Singell, L.D. (1984). Youth unemployment: What does the 1980 census say about its
causes and cures?. Journal of Urban Affairs, 6(1), 5-15.
SKL. (2010). Räkna räkna ranka- En rapport om att mäta företagsklimatet i
kommunerna. [Report]. Stockholm: SKL.
SOU. (2003:92). Unga utanför. Slutbetänkande av utredningen om unga utanför.
Stockholm: Fritzes.
44
SOU. (2008:121). Innovationer och företagande – Sveriges framtid. Betänkande av
företagsfinansieringsutredningen. Stockholm: Fritzes.
Svenska Kommunförbundet. (1997). Arbetslöshet och arbetsmarknadsåtgärder i
Sveriges kommuner – en sammanställning med nyckeltal. Stockholm: Svenska
kommunförbundet.
Svenskt Näringsliv. (2008). Lokalt företagsklimat – så ökar du trivsel, investeringar och
tillväxt i din egen kommun!. [Report]. Stockholm: Svenskt Näringsliv.
Svenskt Näringsliv. (2010a). Reformera lagen om anställningsskydd. Retrieved on
December 18, 2010 from: http://www.svensktnaringsliv.se/fragor/las/reformera-lagen-
om-anstallningsskydd_16553.html
Svenskt Näringsliv. (2010b). Metod för rankingen. Retrieved on January 10, 2011 from:
http://www.svensktnaringsliv.se/fragor/foretagsklimat/metod-for-rankingen_12679.html
Svenskt Näringsliv. (2010c). Ranking 2010. Retrieved on January 10, 2011 from:
http://foretagsklimat.svensktnaringsliv.se/rankingall.do
SVT (2010). Valu. Retrieved on October 8, 2010, from:
http://svt.se/2.139744/1.2153298/viktigaste_fragor_i_val_av_parti
Ungdomsstyrelsen. (2006). Arbetsmarknadssatsningen – att bryta ungdomars
utanförskap på arbetsmarknaden. (Ungdomsstyrelsens skrifter 2006:6) [Report].
Stockholm: Ungdomsstyrelsen.
Ungdomsstyrelsen. (2007). Navigatorcentrum visar vägen till arbete – Resultat och
erfarenheter från satsningen på kommunal navigatorverksamhet. (Ungdomsstyrelsens
skrifter 2007:15) [Report]. Stockholm: Ungdomsstyrelsen.
Ungdomsstyrelsen. (2009a). Fokus 09: Metoder för att bryta ungas utanförskap –
exempel från Europa. (Ungdomsstyrelsens skrifter 2009:7) [Report]. Stockholm:
Ungdomsstyrelsen.
Ungdomsstyrelsen. (2009). Vägarna in: arbetet med unga i kommuner med lokala
utvecklingsavtal. (Ungdomsstyrelsens skrifter 2009:11) [Report]. Stockholm:
Ungdomsstyrelsen.
Unionen (2010). Valet 2010: Ungdomsarbetslösheten. Retrieved on October 8, 2010
from; http://www.kollega.se/index.cfm?c=12094