the impact of e-commerce on transport in europe and ......e-commerce has a minor influence on...
TRANSCRIPT
EUROPEAN PARLIAMENT
WORKING PAPER
The impact of e-commerce on transport in Europeand possible actions to be taken
to meet increased demand
TRAN 111 EN
Directorate-General for Research
Transport Series


This document is published in English only.
At the end of this document please find a full list of the other publications in the TransportSeries.
Publisher: European Parliament L-2929 Luxembourg
Author:Professors TNO Inro, Delft/Netherlands
Editor:Mr. Reinhart PABST Directorate-General for Research Division for Agriculture, Regional Policy, Transport and Development Robert Schuman Building Office 06B046 Tel:(00352) 4300 22021 Fax:(00352) 4300 27719 E-mail: [email protected]
The opinions expressed in this document are the sole responsibility of the author and do notnecessarily represent the official position of the European Parliament.
Reproduction and translation for non-commercial purposes are authorised, provided thesource is acknowledged and the publisher is given prior notice and sent a copy.
Manuscript completed in January 2002.

EUROPEAN PARLIAMENT
WORKING PAPER
The impact of e-commerce on transport in Europeand possible actions to be taken
to meet increased demand
TRAN 111 EN03-2002
Directorate-General for Research
Transport Series


e-commerce
3 PE 315.043
CONTENTS
Page
INTRODUCTION................................ ................................ ................................ ................................ .......... 9
1 EXISTING FACTS AND FIGURES ON E-COMMERCE ................................ ............................... 11
1.1 DEFINITION OF E-COMMERCE............................................................................................................. 111.2 AN E-COMMERCE FRAMEWORK.......................................................................................................... 12
1.2.1 The relation between trends, e-commerce and transport...........................................................121.2.2 Trends and developments ........................................................................................................131.2.3 Policy making .........................................................................................................................16
1.3 FACTS AND FIGURES FOR THE ACTUAL ENVIRONMENT......................................................................... 161.3.1 Internet use .............................................................................................................................161.3.2 Total e-commerce sales ...........................................................................................................171.3.3 E-commerce related to trade....................................................................................................201.3.4 Dematerialisation....................................................................................................................23
2 THE IMPACT OF E-COMMERCE ON TRANSPORT ................................ ................................ ... 25
2.1 THE RELATIONS BETWEEN E -COMMERCE AND TRANSPORT ..................................................................252.2 EFFECTS ON LOGISTICS STRUCTURES AND SPATIAL BEHAVIOUR ........................................................... 25
2.2.1 Spatial behaviour and delivery networks in B2C- relations: the last mile..................................252.2.2 Delivery networks in Business-to-Business relations ................................................................30
2.3 POSSIBLE IMPACTS: TRAFFIC AND TRANSPORT EFFECTS ......................................................................322.3.1 Goods flows in tons .................................................................................................................322.3.2 Goods flows in distance...........................................................................................................342.3.3 Modal-split..............................................................................................................................372.3.4 Traffic flows ............................................................................................................................40
3 RESULTS AND RECOMMENDATIONS................................ ................................ ......................... 43
3.1 SUMMARY OF RESULTS ...................................................................................................................... 433.2 EXPECTATIONS FOR 2010 .................................................................................................................. 473.3 POSSIBLE ACTIONS ............................................................................................................................ 48
REFERENCES................................ ................................ ................................ ................................ ............. 51
ANNEX A: EXPECTED ONLINE BUSINESS TRADE ................................ ................................ .......... 55
ANNEX B: EVALUATION OF COLLECTION POINTS – DESCRIPTION OF CRITERIA ............... 56


e-commerce
5 PE 315.043
EXECUTIVE SUMMARY
For Europe it is important to understand the developments in e-commerce and the impactthey have on Europe as a whole and its economic sectors. On the one hand, it is important tosupport the development and adoption of advanced e-commerce solutions that may contributeto the competitiveness of European enterprises. On the other hand, it is important to mitigatepossible negative consequences for the citizens, the companies and the environment.
The purpose of this study is to formulate a basis for transport policy for the EuropeanParliament’s Committee on Regional Policy, Transport and Tourism. The input is formulatedon the basis of the most reliable forecasts possible on the growth of e-commerce inducedfreight traffic in the medium term. In addition, the study should generate suggestions to copewith the anticipated increase in the volume of traffic.
The four main questions to be answered in this study are the following:
Question 1: To clarify the annual e-commerce-related growth in absolute figures in relationto EU-trade in the medium term.E-commerce has a negligible share in total trade. In 1999, the B2B and B2C related e-commerce revenues of EU-15 have no more than 0.3% share in the total European trade(intra EU trade and trade with the rest of the world). Although this number may vary inaccordance with the scope of the definition of e-commerce, such a small volume does notsignificantly amount to total trade in quantitative terms. Several sources expect that B2C e-commerce sales will contribute to total retail spending with 5% by the year 2005, for B2B noclear forecasts are available.
Question 2: To quantify the impact of e-commerce on freight transport as regards of themode of transport and transport routes.Actual scenario studies do not identify e-commerce as a significant factor that influencestransport routes, transport modes, goods flows in tonnes, nor in distances (TRT & TNO Inro,2001). Currently, any quantified data on this relation is not available. In general, the modalshare of international freight transport in the EU is expected to be as follows in 2020 (ECMT,2020):- road is growing from 43% to 45%,- maritime shipping keeps a stable share of 24%,- inland waterways a stable share of 15%,- and rail stagnates at 7%.
ICT tools can optimise transport flows. This optimisation can take place in the planningprocess, thus before the transport takes place, and during the transport by using sophisticatedcommunication tools. And through a more efficient use of truck capacity for example, tripscan be minimised, which may affect the total distance travelled. Although statistics for theEU are unavailable, NERA (2000) estimates that bringing in more IT into the freight sector(route planning and scheduling, freight exchanges etc) will lead to a 17% and 19% reductionin vehicle mileage for the UK by 2005 and 2010.

e-commerce
6 PE
Question 3: To assess the impact of e-commerce on the use of conventional delivery servicesand the mode of delivery.E-commerce has a minor influence on conventional delivery systems and the mode ofdelivery.As far as B2B e-commerce is concerned, transport operators and logistics service providersbring the usual modes of transport (especially trucks) into action.As regards B2C e-commerce, dedicated delivery networks and courier services are oftenused. These dedicated delivery networks are usually fitted to the conventional systems,because of the high investments involved and to avoid business risks. As long as the productsbought electronically fit in the letterbox, the logistical structure and the modes used will notlikely change. When the products ordered become larger in future (more three-dimensional),changes in the distribution structure will be necessary.
Home delivery of digital purchased products and the use of collection points in thedistribution network may have some influence on the modal split, although current statisticsdo not reveal such a trend.E-commerce usually demands highly flexible supply chains, whereas rail and sea transportare the least flexible modes with high infrastructure costs and a reliance on regular volumeshipments. However, when one breaks down road transport to the different kinds (i.e.capacities) of trucks and vans, e-commerce may lead to a change in this ‘road split’. When e-commerce affects the distribution by demanding that deliveries take place more frequent, ashift is to be expected from the large trucks to smaller vans.
Question 4: To put a figure on the avoidance of physical freight transport resulting fromdematerialisation.Dematerialisation hardly avoids physical freight transport. Dematerialised volumes are toosmall to obtain a significant effect. Although the Internet has made possible that letters,reports, memos and other business correspondence can be formatted and sent in a digital way,the mail is collected anyway and the product replaced has a relative low weight. And eventhough software, music, movies, books can be downloaded in stead of sent and received in aphysical way, the moment that a customer puts the digital data on a physical record, blankCD-ROMs, paper etc. must be bought. These activities result in other good flows. Thus,dematerialisation therefore initiates several substitution effects.
Possible actionsOn the basis of the results found in this study, the question is “what transport policy measuresshould be taken at Community level with regard to existing environmental standards in orderto cope with any anticipated increase in demand for transport services?”
Given the current situation, in which quantitative data is lacking, the answer would be“none”. Effects, if at all present and measurable, are very small. More results may be possiblein stimulating/mitigating other factors influencing transport. As the ECMT puts it: Theglobalisation of trade, the reorganisation of distribution and the concentration of warehousing points, thespecialisation of production units, the efficiency of transport, the performance of road, rail, air, sea, andwaterways are probably the causes that should be factored into trends.

e-commerce
7 PE 315.043
This may be an unsatisfactory result, and the situation for 2010 may be such, that currentintervention by policy makers is worthwhile. A first step is to recognise and acknowledge thee-commerce and Internet-related developments. In this respect it is striking to see that in thenew European white paper on transport (European transport po licy for 2010: time to decideCOM (2001) 370), ‘e-commerce’ is not mentioned and ‘Internet’ only twice!
While it is difficult to measure and predict the isolated impact of e-commerce on transport, itshould not be treated separately. Integration of policy, from different directorates within theEuropean Union and from different policy levels (National, European, supranational) isnecessary.
Leaving all developments to the private market without guidance may lead to undesirednegative effects. ‘Doing nothing’ is therefore not the most useful approach.
Suggested actions that the Parliament may undertake or support are:- Stimulate and support the development of an e-commerce or ICT-monitor that measures
in an unambiguous fashion the effects of e-commerce on traffic and transport in Europe.- The European SME’s generate the bulk of production in Europe. They are however
lagging behind in the use of e-commerce. The Parliament can support initiatives toeducate and help SME’s getting on the Internet. A stimulus in this respect can be thedevelopment of the ‘e-government’ concepts, in which the European Union can be in thelead.
- The use of ICT within the supply chains has great potential in improving transportefficiency (route optimisation, reduction of empty returns, etc.). This potential is clearlynot used to its full extent, in particular by smaller transport companies. The Parliamentcan support initiatives to educate and help transport companies using ICT-tools to theirbenefit.
- E-commerce is passing its hype-stage. It is therefore important to take the ‘e’ out e-commerce. By this we mean that e-commerce effects should be seen in the context ofother developments and treated in an equal fashion with the other developments. Asstated above, e-commerce will reinforce ongoing trends. Accommodating those trendsmay sort more effect than a focus on e-commerce as a single entity.
- For many people and companies, the view on e-commerce developments is blurred by themany different possibilities and approaches that exist in the use of e-commerce. The useof e-commerce may be stimulated through supporting the standardisation of concepts,technologies, the body of knowledge, etc.
- In addition to the previous item, the Parliament can focus on preventing the ‘digitaldivision’ between those who use the technology, and those who cannot or do not want touse it.
- The parliament can accommodate the use of e-commerce by changing or developing newlegislation.- With respect to e-commerce transactions the following issues are relevant
(UNCTAD, 2001):- Finding global solutions for global transactions- Settling global laws for digital disputes- Setting a clear framework to protect the e-commerce consumer- Taking care of data protection and privacy- Finding solutions for digital signatures

e-commerce
8 PE
- “Cybertaxation”: a clear position and directive on the way taxes on international e-commerce goods- and services flows are levied, will support the development of e-commerce.
The Parliament can join the developments by supra-national organisations like the UNCTADand the OECD, but should also develop its own vision and policy in this respect.With respect to e-commerce deliveries, two categories of legislation are important1:
- Product related legislation.- Vehicle operation legislation.
1 ACEA, E-commerce, freight distribution and the truck industry, 2000.

e-commerce
9 PE 315.043
INTRODUCTION
Problem Sketch
ContextMany developments determine the way we organise our society. Large and frequentlymentioned trends are globalisation of commerce and trade, a constant increase in mobility ofpeople, shifts towards a ‘knowledgeable Europe to compete in the Digital Economy ’ (IPTS-JRC, 2000), mass-individualisation and ageing of people in Western societies.
Next to these ‘autonomous’ trends are the developments in Information and Commun icationTechnology (ICT), and in particular e-commerce and m-commerce, also large determinantsfor the organisation of our society. On the one hand it concerns changes which directly (at themicro-level) steer our activities, like the replacement of manual labour by automated systems.On the other hand it concerns more fundamental changes of the structure of economic sectorsat the meso and macro level.ICT influences transport in Europe at the micro and macro level, which is, highly simplified,represented in the figure below.
Figure 1: The impact of e-commerce and ICT on transport networks
ProblemIn 1999 and 2000 the attention for e-commerce was mainly triggered by the success of manyInternet-initiatives. From 2000 until today, the attention springs from the dow nfall of manyinitiatives. This has blurred the view on more fundamental questions like:− What is the true size of e-commerce-related trade?− Does e-commerce fundamentally change sectors and the way people do business?
Many companies and governmental bodies struggle with these questions, given the amount ofe-commerce-related events and conferences. Also at the policy level attention is given to therelation between e-commerce and transport2. There is a general feeling that policy attentionto the consequences of e-commerce is necessary, but clear data on the direction and impact ofe-commerce are lacking.
2 For example, the OECD and ECMT jointly organised at 5 and 6 June 2001 a seminar on ‘the impact of e-commerce on
transport’ with the purpose ‘to analyse the interaction between e-commerce and transport, and assess the implications fortransport of the growth in e-commerce’.
E-commerce and ICT :influencingandchanging
ICT: support
Supply Chain/ Transport Network

e-commerce
10 PE
Objective
For Europe it is important to understand the developments of e-commerce and the i mpact ithas on Europe as a whole and its economic sectors. On the one hand, it is important tosupport the development and adoption of advanced e-commerce solutions that may contributeto the competitiveness of European enterprises. On the other hand, it is important to mitigatepossible negative consequences for the citizens, the companies and the environment.
The purpose of this study is to formulate a basis for transport policy for the EuropeanParliament’s Committee on Regional Policy, Transport and Tourism on the basis of the mostreliable forecasts possible on the growth of e-commerce induced freight traffic in the mediumterm. In addition, the study should generate suggestions to cope with the anticipated increasein the volume of traffic.
The main questions to be answered in this study are the following:1. To clarify the annual e-commerce-related growth in absolute figures in relation to EU-
trade in the medium term.2. To quantify the impact of e-commerce on freight transport as regards of the mode of
transport and transport routes.3. To assess the impact of e-commerce on the use of conventional delivery services and the
mode of delivery.4. To put a figure on the avoidance of physical freight transport resulting from
dematerialisation.
The answers to these questions will form the input for the recommendations, which stemfrom this study.
Approach
Given the scope of the project, the focus is on gathering all recent information and datapossible. The approach is on fact finding from public sources, libraries, conferences, andcensus offices (such as Eurostat) and through searches on the Internet.Data available from different sources is compared and analysed to find solid trends. Inaddition, the information is filtered to make a difference between existing predictions andassumptions on the one hand and statistics on the other hand. This study focuses on thestatistics.E-commerce is not the only trend with an impact on transport. To clarify the relation betweennon e-commerce trends, e-commerce and their impact on transport, a framework is madewhich is presented in the next chapter.
Reading Guide
In this chapter the objective and approach is sketched. In the next chapter, the analysisframework, as well as fact and figures on the actual use of e-commerce are presented. Inchapter three, the relation between e-commerce and traffic and transport is elaborated andsupported with quantitative evidence where possible. Chapter 4 describes our observationsand presents recommendations.

e-commerce
11 PE 315.043
1 EXISTING FACTS AND FIGURES ON E-COMMERCE
1.1 Definition of e-commerce
According to the OECD, e-commerce refers generally to all forms of transaction relating tocommercial activities, involving both organisations and individuals, which are based upon theprocessing and transmission of digitised data, including text, sound and visual images. It alsorefers to the consequences that the electronic exchange of commercial information may haveon the institutions and processes that support and govern commercial activities.
The OECD definition covers different kinds of applications of electronic transactions. E-commerce can also be defined in a more limited way. The most limited definition is: ‘sellingproducts or services via the Internet’. This is what is also called e-tailing. If the exchange ofproduct information and payments and different electronic media are also included, thefollowing definition can be used:
The exchange of information, services, products and payments by an electronic medium(Internet, digital telephone network or cable television network).
E-commerce is part of a larger concept, named e-business. E-business goes beyond e-commerce being much more than the current technological focus of online trade(PriceWaterhouseCoopers, 2000). It encompasses all aspects of an organisation fromstrategy, process, organisation and systems to its trading partners and the final customer (seethe figure below).
E-business is using electronic information to improve performance, create value and enable new relationships between businesses and customers
E-commerce is the marketing,selling and buying of productsand services on the Internet
Figure 2: E-business is more than e-commerce
The following forms of e-commerce are usually discerned:− E-shop: ‘web marketing’ of a company or a shop. In first instance this is done to promote
the company and its goods or services. Increasingly added is the possibility to order and topay. Benefits sought for the company are increased demand, a low-cost route to globalpresence, and cost-reduction of promotion and sales. Benefits for the customers can belower prices compared to the traditional offer, wider choice, better information, andconvenience of selecting, buying and delivery.
− E-procurement: electronic tendering and procurement of goods and services. Benefitssought are to have a wider choice of suppliers which is expected to lead to lower costs,better quality, improved delivery, reduced cost of procurement. For suppliers the benefitsare a higher service levels (by means of sharing more information) and possibly a moredurable interaction (i.e. integration) with customers as for already established relations.

e-commerce
12 PE
− E-marketplace: an electronic implementation of the offering and bidding mechanismknown from traditional marketplaces. As for goods, the bidding process may also beintegrated with contracting, payments and delivery. As for services, carriers and logisticsservice providers can for example offer capacity which could be specified in origin,destination, and product / transport characteristics. Benefits for suppliers and buyers areincreased efficiency, and timesavings (e.g. ‘last-minute options’. Buyers also benefit fromthe competition between suppliers of the same kind of product.
The electronic medium used is relevant, but hardly makes a difference to the definitions.Currently, the Internet is the most relevant electronic medium for e-commerce. The Internetis therefore the first cited medium for e-commerce. Other media are also starting to play arole. These new electronic media for e-commerce include digital television (iDTV) andmobile telephones, such as the Wireless Application Protocol (WAP) phones in Europe andthe Japanese internet mobile phones (IMPs). E-commerce with mobile phones is often calledm-commerce. M-commerce is defined as: The delivery of transaction services by mobileterminals for the purpose of exchanging goods and services between consumers, businessesand financial institutions, regardless of place and time by making wireless networks (Nijhuis,2001).
We focus on business to business (B2B) and business to consumer (B2C) e-commerce:− Business-to-business (B2B): financial transactions and exchange of information between
companies. Important forms include: Electronic Data Interchange (EDI) and virtualmarketplaces.
− Business-to-consumer (B2C): presentation and delivery of goods and services bycompanies to consumers. This is also referred to as tele-shopping.
The figure below depicts the possible B2B relations and the B2C relations in a productionchain.
Sourcing Production Distribution Consumption
B2B B2C
B2C
Figure 3: possible B2B and B2C relations in a production chain
1.2 An e-commerce framework
1.2.1 The relation between trends, e-commerce and transportNot only e-commerce influences transport. To put its role into perspective, a framework ismade which the basis of the analysis of the research questions. The framework is given inFigure 4 and consists of three parts.
In the first part, several trends can be identified that have an influence on the actualenvironment, i.e. economic development, spatial development, technical development, andother developments, such as demographic and cultural trends.

e-commerce
13 PE 315.043
The second part consists of the actual environment, which is the existing set of businessstructures, infrastructures, ICT-networks, goods and passenger flows, et cetera, at a given, i.e.the present, time. This actual environment can change as a result of the above mentioneddevelopments. In the actual environment, ICT-networks and e-commerce is already in use.This study will focus on the present situations of these aspects.
The behaviour of companies and individuals in the actual environment determines spatialplanning, influences traffic and transport and the way logistical structures are developed.These are components of the third part of the framework.
Spatialbehaviour
Logisticalstructures
Traffic &Transport effects
Economicdevelopment
Spatialdevelopment
Technicaldevelopment
Otherdevelopments
E-commerce
Actual environment
ICT
Influence of policy makers
Figure 4: Impact of general developments and e-commerce on traffic and transport
1.2.2 Trends and developmentsThe following trends are identified, which have influence on goods flows and transport ingeneral:
Trends in economic development:A - The growth of GDP. The GDP growth gives indication on the willingness of business toinvest in, exploit and use e-commerce. Prognoses of the GDP growth rate for the years 2000-2010 lie between 2.3% and 2.6% (ECMT 2001; TRT & TNO Inro, 2001). Figure 5 gives anEU-9 comparison (EC, 1999). In the aftermath of the attack on the WTC in New York of 11September 2001, it has become clear that EU-economies have slowed down their growthpace.
B - The growth of disposable income. The growth of disposable income says somethingabout the willingness of consumers to purchase computer, about the internet avai lability, andthe growth of online shopping. Growth of disposable income is related to growth of GDP.
C - Explication of costs. The transport costs that are taken into account in cost calcul ationsare mainly direct costs: the costs of the vehicle, fuel and labour. In the context ofinternalising external effects of transport, three kinds of cost will also affect e-commerceinduced transport:
− Delivery costs of digital purchased (physical) products can either be specified or not. Ifspecified, vendors may invoice a percentage, a fixed sum of money, or may higher theproduct price. Sometimes different means of transport can be used to deliver the order.

e-commerce
14 PE
In that case, the transport time and related costs are specified. On the basis of theseattributes, a customer can choose its transport mode.
− Environmental costs can make transport become more expensive, so that shifts may takeplace.
− Congestion costs can also make transport become more expensive, so that shifts maytake place.
0
0,5
1
1,5
2
2,5
3
3,5
4
Finlan
d
Franc
e
German
y
Greece
Irelan
dIta
ly
Netherl
ands
Spain UK
aver
age
annu
al c
ompu
nd g
row
th r
ate
2000-2005 2005-2010
Figure 5: EU-9 Comparison: Real Gross Domestic product (GDP) per country
D - Pressure on the cost per transport mode. The severe competition and excess capacity inthe European transport market keep the transport prices under a constant pressure Changes inthe proportions of the costs per modality can initiate shifts in the modal split.
E - Changing over to the Euro. While ten countries start using the Euro, price differences ofproducts offered via the Internet become more clearer as a result of transparency. This couldimpact the goods flows in distances (i.e.: it is cheaper to buy a product from abroad).
Trends in spatial development:A - Geographic (de)concentration of companies. Geographical concentration can take placein three ways. First, parties that trade in one supply chain can concentrate next to each otherat the same physical location. One finds this clustering for example in the automotive sector,where Original Equipment Manufacturers (OEMs) and service providers settle next to thefactory of the producer. Second, parties with the same kind of product or equal activities can(geographically) concentrate. Third, complementary parties can concentrate to each other.Examples hereof are industrial ecosystems, where the industrial residues of one productionprocess can be used as material in another process (e.g. cooling water).
B - (De)urbanisation of companies. (De)urbanisation is the concentration of companies in thevicinity, but not within an urban area. This influences networks and because of this goodsflows in distances.
C - Responsiveness. Responsiveness reflects the extent to which firms are capable ofaccommodating unique and/or unplanned customer requirements (CLM, 1999). Relevantaspects of responsiveness in relation to freight transport are delivery time, deliveryfrequency, reliability, route planning, distance, et cetera. E-commerce could increaseresponsiveness, because it makes it easier to find products, vendors, producers (also partners,such as in co-makership relations).

e-commerce
15 PE 315.043
D - Congestion. Congestion may come down to stagnation of traffic and infrastructuralcapacity. Congestion stands goods flows in the way.
E - EU enlargement. The EU enlargement could reduce trade barriers. Because of this, tradecan increase and goods flows (in tonnes and distance) can increase.
Trends in technical development:A lot of trends take place in the field of technology.A - ICT–related examples are:
− Evolving global computer and communication networks. The Internet, in particular theworldwide web, is most prominent in its development, but also high performancecommunication (data and speech) networks develop fast. This allows for (centralized)control of global supply chains. A basic problem in the development is the establishmentof harmonised or standardised network operating systems.
− The fixed networks are joined by semi-mobile and mobile networks and applications. Inthe (near) future ubiquitous and roaming computing and communication will be commonpractice. This already leads to better control of goods and vehicle flows in the transportsector while it allows for tracking and tracing. It is particularly useful in rural areas andareas where technological advances are behind, like Eastern Europe. A Dutchdepartment already introduced the term ‘M-commerce’ (mobile commerce) as a stepfurther than e-commerce (MinV&W, 2001).
− In the area of hardware, miniaturisation will continue, not only for chips, but also fordevices, like mobile phones, laptop computers and palmtop computers. Integration offunctionalities also evolves. The consequence of shrinking sizes is not only an increasein ease of use, but also continuing declining costs. This will lead to new areas ofapplication, for example the use of plastic chips as tag and price label on products.
− Communication tools (e.g. virtual shopping, e-procurement, communication) Cellphones, palmtops and organisers shall change dramatically in near future. Internet shallbe integrated in all kinds of equipment and machines: on the street, in shops, in the car ortruck, et cetera.
− Planning tools. Planning tools can be used for optimising transport flows.
B - Dematerialisation. As a result of dematerialisation, digital products and services do notrequire physical distribution (e.g. books, music)
C - Home delivery of digitally purchased goods, both on the field of planning (distributionnetworks) and on the field e-commercialised internet sites. Important issues are:
− Considering whether the physical distribution channel will need to change− Considering whether the product requires that the customer is present at moment of
delivery
D - Infrastructure. The actual infrastructure provides the maximum transport capacity foreach modality. Developments in infrastructure influence capacity and the modal split
Other developments:The use of e-commerce and the impact on traffic and transport is also influenced by thefollowing developments:A - Globalisation: for long, production and consumption were country-specific. Nowadays,parts are still of a local nature, but other parts are more common. Globalisation and enlargingof the European Community will determine the use of e-commerce.

e-commerce
16 PE
B - Demographic development:− The size of the population. As a result of population growth, the number of Internet users
will increase.− Ageing of society. The society in Western Europe is ageing: less children are born and
the average age rises. As a consequence, the consumer needs change, both in terms ofproducts and services required, as well as in the way e-commerce will be used.
1.2.3 Policy making
Not only ‘autonomous’ developments determine the use of e-commerce and its impact ontraffic and transport. Also policy will influence it. Policy can be seen as mechanism to set thecontext for the actual environment (for instance by means of legislation) and can also directlyinfluence parts of the actual environment (for instance bye means of directives andguidelines). As such policy can impact on all components of the framework. Policymakingtakes place at many different levels: from local, national, European to world wide (forinstance in the context of the WTO and the OECD). The policy levels influence and interactwith each other. Hence, policy at the level of the European Parliament will influence and beinfluenced by national policies and supra-European policy.
1.3 Facts and figures for the actual environment
In this section we present facts and figures on the current use of e-commerce at a genericlevel, and bring them in relation to sales and trade at the European level.
1.3.1 Internet useThe availability of PC’s and connection to Internet (that is the availability of telephone linesand Internet hosts) is a prerequisite for e-commerce.Although the USA set the trend in this sector, the attention for Information andCommunication Technology in Europe is likely to produce productivity gains in the comingdecade. However this will not be the case for all Europe. While Northern Europe is alreadyhighly wired, the Internet penetration in the south and the especially in the east of Europe isstill close to zero. This section gives an indication of the use of Internet by individuals and bybusinesses in the European Union. This is an indicator for the e-commerce market.However, the relation between Internet users and e-commerce is not direct. After all e-commerce is about Internet users that buy (and sell in the case of businesses) on the Internet,and not about users that use the Internet only for e-mail or surfing. This is one of the reasonsthat statistics about Internet use differ so much. Some researchers count Internet users assomeone who may have been online in the past month or sometimes past year. Someresearchers include people who use e-mail or age groups are different (only 18+, 10+ or even2+)
IndividualsNua publishes month-by-month use of the Internet (www.nua.com). The latest estimate onInternet use is for August 2001. Worldwide use is estimated at 513.41 million users, forEurope the estimate is 154.63 million. In the table below, the estimates for the countries ofthe European Union are given in number and percentage.
Table 1: Internet users in the European Union, August 2001Member State of the E.U. Number % population date

e-commerce
17 PE 315.043
Sweden 5.64 million 63.55 July 2001United Kingdom 33 million 55.32 June 2001Denmark 2.93 million 54.74 July 2001Netherlands 8.7 million 54.44 Aug 2000Finland 2.27 million 43.93 Aug 2000Austria 3 million 36.9 October 2000Germany 28.64 million 34.49 Aug 2001Italy 19.25 million 33.7 Aug 2001Ireland 1.25 million 32.54 July 2001Belgium 2.7 million 26.36 Sept 2000Luxembourg 100.000 22.86 Dec 2000Portugal 2 million 19.9 Dec 2000France 11.7 million 19.65 Aug 2001Spain 7.38 million 18.43 July 2001Greece 1.33 million 12.42 October 1999Source: http://www.nua.com
From the table we learn that the use varies, where Sweden is in the lead and Spain, Portugaland Greece are lagging. On average, the Internet use of other countries in Europe is at thelower end, ranging between 1% and 25% of the population.
Business access to InternetSurveys of European business show that 16% (Dataquest, 1999) to 37% (NOP ResearchGroup, 1999) had some form of Internet access in 1999. Penetration rates are especially highfor large companies. NOP Research shows that companies with more than 200 employeeshave an average Internet user incidence of 75%. For small companies (<10 employees) this is32%.
45%
44%
42%
35%
34%
34%
30%
27%
23%
15%
13%
Finland
Sweden
Denmark
Germany
UK
Switzerland
Netherlands
Average
Belgium
Italy
Spain
Source: eMarketer 2000
Figure 6: European business online, by country, for 1999 (as a % of all businesses)
From the above figure we learn that, as for individuals being online, the Internet use bybusinesses also tends to be higher in the northern part of Europe.
1.3.2 Total e-commerce salesLike the variation in estimates about Internet users, the estimates for e-commerce revenuesshow a considerable variation (see the figure below). As already indicated in the first section,the main explanation for this is the difference in interpretation of the definition of e-commerce.

e-commerce
18 PE
16.8
18.9
19
24.4
36
33.6
49.3
69.5
87.4
420.3
430
511.1
853.3
e-Marketer
Wallburg DillonRead
AndersenConsulting
IDC
Forrester
1999
2000
2003
Source: eMarketer 2000
Figure 7: Comparative estimates: Western European total e-commerce revenue in 1999, 2000and 2003 (in billion $)
In the e-commerce revenues especially Germany and the UK have a relative high share(around 30 and 25% respectively) in total European e-commerce revenues (IDC, 2000).Forrester Research projects western European e-commerce will account for 6% of total salesby 2004. Expectations for the Netherlands are very high, namely 10% of total sales.
6.0%
9.2%
7.1%
6.5%
5.0%
4.3%
6.0%
All
Netherlands
UK
Germany
France
Italy
All other
Source: Forester research, 2000
Figure 8: Projected Western-European e -commerce as a % of total sales, 2004
The above figures give an indication of total e-commerce revenues. As the amount andstructure of the e-market differs considerably between the B2B and the B2C segment, we willfocus in the following subsections on these segments separately. In the figure below can beseen that estimates are that most of the e-commerce revenues are generated in the B2Bsegment.

e-commerce
19 PE 315.043
0
50
100
150
200
250
300
350
400
450
1998 1999 2000 2001 2002 2003
B2B
B2C
Total
Source: eMarketer, 2000
Figure 9: B2B and B2C e-commerce revenues in Western Europe, 1998-2003 (in Billions $)
B2B revenuesAs in the US and the rest of the world, the majority of e-commerce in Europe is in the B2Bsector. Over time, similar what is happening in the US, it is expected that the B2B share willincrease further from 77% in 1998 to 85% of total e-commerce in 2003 (Emarketer, 2000).
According to Gartner Group, B2B e-commerce in Europe is 12 to 18 months behind the US.Although several impediments to growth, Gartner Group points out that the stron gest regionalgrowth in B2B e-commerce market is in Europe and forecast a growth of 7200%. Underlyingassumption for the prospective estimates is a major shift from EDI to Internet, as well aspressure on small and medium enterprises to buy and sell through the web.
Figure 10: Estimates of European B2B e-commerce revenues (in billion $)
Of the B2B revenues 13% is currently realised on e-marketplaces (Kluwer, 2001). Accordingto a survey of Forrester among 500 employees in European business, 71% has the intention todo business in 2001 via e-marketplaces
B2C revenuesAccording to eMarketer, consumer e-commerce revenues in Europe nearly tripled in 1999 tot$3.5 billion from $1.2 billion in 1998. They climbed to nearly $6.4 billion in by the end of2000 and will climb to $63 billion by 2003. Forrester even shows a higher estimate: $74.8billion in 2003. Like B2B, B2C e-commerce lags behind the US, by 1,5 to 2 years. Accordingto the Boston Consulting group, online retailing accounts for only 0,2% of total Europeanretail market, while 1,2% of retailing in the US takes place on Internet.
1400
54,9
357,2
13,3
2340
31,833
766 778,5
1350
0
500
1000
1500
2000
2500
1999 2000 2003 2004 2005
eMarketer Gartner group Durlacher research Forrester IDC

e-commerce
20 PE
6.4
7.6
8.5
8.9
63
74.8
0 20 40 60 80
eMarketer
Jupiter
Forrester
BostonConsulting
2000
2003
Figure 11: Comparative estimates: B2C e-commerce in Western Europe in 2000 and 2003 (inbillions)
In the online retail revenues especially Germany and the UK have a relative high share(32.2% and 27.9% respectively). The table below gives an indication of the absolute B2Csales per country and per capita. In total sales the UK, followed by Germany and Franceshow the highest sales. Per capita Finland and Denmark spent the most. As can be seen fromthe table, total spending in 1999 already amounted to $15 billion. This is rather high incomparison with the estimates for 2000 as given in the figure above.
Table 2: Online B2C sales per country, 1999Country Euros (in millions) Euro (per capita)Denmark 700 (665$) 160 ($152)Finland 800 (760$) 200 ($190)France 3,400 ($3,230) 80 ($76)Germany 3,600 ($3,420) 50 ($48)Ireland 100 ($95) 40 ($38)Italy 1,100 ($1,045) 20 ($19)Spain 400 ($380) 10 ($10)Sweden 700 ($665) 100 ($95)UK 5,300 ($5,035) 110 ($105)Total 16,100 ($15,295) 60 ($57)
Source: Empirica, 1999
1.3.3 E-commerce related to tradeWhen the e-commerce revenues (B2C and B2B) are related to European trade (intra EU tradeand trade with the rest of the world) it becomes clear that the percentage of e-commerce intrade was in 1999 a negligible share of total sale (see Table 3). Colin (2001) concludes thesame for world e-commerce as a percentage of world trade. Although numbers vary by afactor 1 to 4 (accordance the scope of the definition of e-commerce), a small volume thatvaries by this factor does not amount to total trade very much in quantitative terms, as can beseen from the table below.
Le journal du Net (in Collins, 2001) gives estimates for the share of electronic commerce inworld sales in 2004. Behind the Rest of the World and South America with shares of 2.4%each, Europe comes in sight with an expectation of 6% of world sales in 2004. NorthAmerica and Asian Pacific show the highest shares with of 12,8% respectively 8 %.

e-commerce
21 PE 315.043
Although the above numbers give estimates about the share of e-commerce in trade a moredetailed analysis is needed to make forecasts. Because the market sectors B2B and B2C differso much we will make a separate analysis in the next paragraphs.
Table 3: E-commerce and external trade per country, 1999Country E-commerce revenues
(billion Euro)Total trade(billion Euro)
Percentage ofe-commerce in trade
Belgium 0.19 382.0 0.0%
Denmark 0.35 103.7 0.3%Germany 3.94 1139.3 0.3%Greece 0.05 41.9 0.1%Spain 0.53 275.2 0.2%France 1.50 712.6 0.2%Ireland 0.09 137.7 0.1%Italy 0.61 513.2 0.1%Luxembourg 0.01 21.2 0.0%The Netherlands 1.13 478.5 0.2%Austria 0.16 150.0 0.1%Portugal 0.06 66.6 0.1%Finland 0.82 86.9 0.9%Sweden 0.94 173.3 0.5%United Kingdom 3.34 671.9 0.5%EU 15 13.71 4954.0 0.3%Source: Eurostat, eMarketer
B2BThe B2B e-commerce market contains all the electronic transaction between and withinsourcing, production and distribution. Two exemplary cases are (1) that the wholesaler makestransactions with retailers and (2) that companies producing semi-finished goods maketransactions with companies that produce the consumer products. These electronictransactions can be between countries or inside countries. To make an estimate about B2B e-commerce as a percentage of total trade one needs first an indication of the total B2B market(electronic plus non-electronic). The main indicators are:− Total B2B trade in value and growth rates
− Domestic trade between companies− Foreign trade between companies
− E-commerce trade in value and growth rates− Domestic e-commerce trade between companies− Foreign e-commerce trade between companies
As the e-commerce data is formulated as e-commerce revenues per region (i.e. country,Western Europe, Europe), only export has to be taken into account, since revenues of importare counted by the e-commerce regions of the destination region. Table 4 depicts theestimated growth of B2B e-commerce trade. One can notice that the growth roughly doubleseach year.

e-commerce
22 PE
Table 4: Estimated growth of B2B e-commerce trade 2001 - 2005Western Europe B2B projections (billions euro)
2001 2002 2003 2004 2005Private trading networks 50 130 334 752 1476Storefronts 109 235 402 583 738Net Markets 46 135 289 471 702total 205 500 1025 1806 2916Source: Jupiter MMXI: Online trade, quantifying the benefitsAssumptions for this estimate:1 euro = 0.96 dollarWestern Europe includes Austria, Belgium, Finland, France, Germany, Ireland, Italy, Switzerland, UK, Sweden, Norway,Denmark, Luxemburg, the NL, Spain, Portugal and Greece
In Appendix A, an overview of estimates of online business trade for a typical, Europeancompany with sales of € 30 Billion is given (as projected by Jupiter MMXI).
B2CThe B2C e-commerce market contains all the electronic transaction between consumers andcompanies. Currently, the main supplier in the B2C segment is the retail sector. However inthe near future it is possible that also more producing companies will offer B2C services.This will not be the case in product groups where consumers buy a range of products (e.g.)groceries but can be the case in the more speciality product groups like electronic devices.
The consumer can buy products locally (i.e. in their own country) or from other cou ntries. Inthe last case it is still possible that the products are already in inventory in the country of theconsumer. In other cases the products will be shipped after order to the country of theconsumer.
To make an estimate about B2C e-commerce as a percentage of total trade first we need anindication of the total B2C market (electronic plus non-electronic). The main indicators are:− Total B2C trade in value and growth rates
− Domestic trade between companies and consumers− Foreign trade between companies and consumers
− E-commerce trade in value and growth rates− Domestic e-commerce trade between companies and consumers− Foreign e-commerce trade between companies and consumers
According to the Boston Consulting Group, on line retailing (B2C) is currently focused onnational markets. European-based online retailers generate 93% of their sales from localmarkets. Only 5% of sales are currently derived from other European countries and 2% fromcountries outside Europe. European consumers are increasingly buying from local vendors.According to a study by Europay International and Jupiter Communications 5% of Europeanshoppers polled brought from European retail sites in 1997 compared to 15% who boughtlocally in 1999. This is partly explained by the fact that US retailers introduce local Europeansites as www.amazon.nl. Of those transactions made in European retail outlets, 80% weremade in the customers’ own country. Loca lised approaches are therefore an importantsuccess factor for European online retailers. For B2C commerce as a percentage of trade it istherefore important to relate this for a considerable part to domestic retail trade. In the tablebelow, B2C as a percentage of retail sales is given for 1999. An important remark is that thesales represent both products and services, which will have different impact on transport andtraffic. This issue will also be addressed in the next chapter.

e-commerce
23 PE 315.043
Table 5: B2C e-commerce sales as a percentage of retail salesB2C millioneuro
Total retailsales
1999B2C e-commerce
As % of sales growth(1998-> 1999)
2000(estimate)
WesternEurope
(Calculated)
Germany 375,000 1125 0.30% 200%UK 263,784 976 0.37% 280%France 231,429 324 0.14% 215%Sweden 32,059 218 0.68% 170%Italy 202,222 182 0.09% 145%NL 50,294 171 0.34% 210%Switzerland 41,034 119 0.29% 110%Austria 39,130 90 0.23% 210%Belgium 48,125 77 0.16% 420%
Spain/Portugal 110,000 66 0.06% 185%Norway 21,923 57 0.26% 200%Finland 21,818 48 0.22% 160%Denmark 21,500 43 0.20% 220%Totaal B2C 1,456,667 3496 0.24% 200% 9439Averagegrowth
200% 170%
Note: excluding automotive and collectibles/auction categories)Source: Adapted from Boston Consulting group
One can conclude that e-commerce grows very fast. Electronic transactions double each year.If the expansion in e-commerce continues at this rapid pace, as is expected, then e-commercetransactions between B2B and between B2C will account for about 5% of inter-companytransactions and retail sales respectively (Coppel, 2000).
1.3.4 DematerialisationE-commerce makes dematerialisation of products possible, on both B2C and B2B level. B2Ce-commerce can also lead to a decrease in trade and transport volume because products canbe downloaded from the Internet (sometimes free of charge). Music can be listened via theInternet and books can be read on the Internet. However, many people still prefer to make it a‘physical’ product by copying it onto empty compact discs or paper.Dematerialisation leads to changes in distribution. The direct delivery of cds, tapes, videosand software is transformed into distribution via the Internet. It is predicted that‘entertainment’ products will increasingly be downloaded through the Internet rather thanphysically transported. It has been forecast that by 2004, 8% of all recorded music sales willbe downloaded via the Internet and that by 2010 this proportion will have risen to 20% (MTI,1999, quoted in the Financial Times 16/5/99). Paper-based media will be subject to a similartrend, though its net effect on freight traffic volumes is likely to less pronounced and it willbe partly offset by a growth in paper sales for home printing.
However, the sales in music still show an increase. The statistics shown in Figure 12 are forthe United States. Although sales in units increase just a little in 2000 (0,4%) the net valuestill increases with 3,1%. One cannot speak of a declining music industry due to the Internet.
The International Federation of the Phonographic Industry (IFPI) 3 states that the value grewwith 4% in the UK, the third largest market in the world. Austria, Denmark, Ireland, Portugal
3 http://www.ifpi.org/site-content/publications/rin_order.html

e-commerce
24 PE
and Spain also showed a growth in sales. IFPI claim that Germany, France, Italy and Belgiumfelt the effects of CD burning, but numbers are not available.
2000 Yearend Statistics
0100200300400500600700800900
1000
1991 1992 1993 1994 1995 1996 1997 1998 1999 2000
Year
Uni
ts s
hipp
ed (i
n m
illio
ns) CD
CD singleCassetteCassette SingleLPVinyl SingleMusic videoDVD
Figure 12: Music sales in units in the United States (http://www.riaa.com/)
As such, the effect of dematerialisation on music is minimal so far.The popularity of Napster and the fact that several new music sites, like Kazaa and Gnutella,have emerged after the lawsuit against Napster indicate that new developments are to beexpected in the music industry. The debate on copyrights will take a long time and until then,the effect of dematerialisation is difficult to predict.
E-commerce can also affect transport on B2B level. Nowadays, for example, businesses useelectronic mail (e-mail) and videoconference to communicate with each other. Especially theusage of attachments on e-mails can avert physical mail deliveries.
At a macro-level we see an ongoing shift in demand from goods towards services. At amicro-level we see a replacement of the form of the product. This traditionally started withcomputer software, but new forms find their way very quickly, such as business reports,books and brochures. Electronic document delivery is impacting the growth of express andcourier markets (Key Note 2000). However, the low weight and volume of the productsreplaced may mean that the logistics impact is relatively insignificant.
In conclusion, the little dematerialisation so far and the low volume of products and servicesindicate that the effects on transport are expected to be insignificant.

e-commerce
25 PE 315.043
2 THE IMPACT OF E-COMMERCE ON TRANSPORT
2.1 The relations between e-commerce and transport
This chapter discusses the impact of e-commerce on transport. As depicted in Figure 4, e-commerce influences the logistical structures, the spatial behaviour and the transport andtraffic effects. The next section describes the influences of e-commerce on the logisticalstructures and spatial behaviour. This is described for both business to consumer and businessto business-relations.The third section of this chapter discusses the effects of e-commerce on traffic and transport.
2.2 Effects on logistics structures and spatial behaviour
The logistical configuration is a model that shows the structure of the physical goods flow.The main elements are the primary processes from producers to consumers, the location ofinventory and the flows of goods between processes and inventory points (Van Goor et al,1999). This means that the logistical structure is also influenced by spatial behaviour.The primary processes from producers to consumers are in this case the location of producersand consumers, determined by spatial behaviour. Furthermore, spatial behaviour is alsoimportant in locations of inventory. Together, locations of producers, points of inventory andthe location of consumers make up the logistical structure. The flows of goods are discussedin the next section.
The logistical structure is the network used for delivering goods. The question is: ‘Does e-commerce influence spatial behaviour and delivery networks and if so, how?’
2.2.1 Spatial behaviour and delivery networks in B2C- relations: the last mileThe delivery strategy that e-commerce companies choose for B2C goods determine the(change in) delivery networks. Different companies can choose different solutions, but theyall have a common problem: the last mile of delivering goods to consumers (Smidts andMaltha, 2001), this is illustrated in Figure 13.
Spatialbehaviour
Logisticalstructures
Last mile solutions
Criteria
Difficulties:-many last miles-high cost of delivery-trade off speed vs. variety-entrenched competitors
Factors:-Type of store-Type of product-Type of consumer
Figure 13: Spatial behaviour and logistical structures in Business-to-Consumer e-commerce

e-commerce
26 PE
Many see passing the ‘last-mile barrier’ as a strategic opportunity for e-commerce companiesto enhance the added value. However, companies need to cope with at least the followingissues (Laseter et al, 2000):− limited online sales potential,− high cost of delivery,− a selection-variety trade off and existing,− entrenched competitionFirst, the sales are spread across lots of ‘last miles’. Even in the case of the most positiveprediction of future online sales, that much home delivery volume will not provide enoughsales density to alter fundamental delivery economics. This is called limited online salespotential. It is illustrated by the results on the currently small share of e-commerce in trade(see Table 5).
A second challenge is the high cost of delivery (Laseter et al., 2000). The consumer todaypays the cost of the home delivery, consisting of time and delivery costs (Yrjölä, 2001). Inelectronic grocery shopping (EGS), the grocery chain will pay for the costs of the ‘last mile’and then charge it to the consumer as a service charge or as a part of the price of the products.So these delivery costs are made more explicit. It will, however be very difficult to get theconsumer to realise that driving to the supermarket actually costs something and to make atrue comparison between the two value offerings (Yrjölä, 2001). Various solutions inovercoming the last mile work only on a small scale and large-scale initiatives have not beensuccessful so far. The impact of the delivery cost depends on the value of the package beingdelivered. The two product categories covered by e-commerce cause individual orders tohave low values. This means that more orders cause more delivery costs.
Third, e-commerce involves a new trade-off between speed and variety. Instant gratificationgoes at the expense of limitless offerings. To achieve fast response, products must be heldlocally rather than in large national distribution centres, as category killers and largecatalogue retailers do. Thus, variety is lost. Only high volume products are worth the troubleof stock keeping, but they provide the least profit per unit because of heavy pricecompetition.
The fourth issue mentioned by Laseter et al is entrenched competition. This indicates thepresence of postal services, logistics service providers like UPS or DHL, or bricks & mortarretailers (see below). Note that this argument is only true for e-tailers that deliver themselves,there are various examples of e-commerce initiatives collaborating with postal services orbricks & mortar companies that become clicks & mortar.
The above mentioned issues mean that large scale B2C e-commerce is not yet here and willnot be here for a while, thus little change in spatial behaviour or delivery networks isexpected. Initial research shows that EGS can reduce city traffic with private cars and havefavourable environmental impact (Yrjölä, 2001). However, other evidence does not supportthis yet.

e-commerce
27 PE 315.043
If an organisation does decide to use e-commerce, there are a couple of factors that determinethe strategy for delivery and spatial behaviour: the store type, the product type and thecustomer type (Smidts and Maltha, 2001).
Three types of stores can be distinguished,− ‘clicks-only’: only sell through the internet,− ‘bricks & mortar’: only sell in physical outlets.− ‘clicks & mortar’: sell on the internet as well as in regular stores
The type of product, determined by its characteristics (for example expiration of products,large volume or valuable goods) is very important in choosing a delivery-strategy. Most ofthe e-tailers tend to focus on a mix of two product categories, immediategratification/impulse items, such as videos, music, books and magazines, and routinenecessities, like grocery and household items (Laseter et al, 2000). The main characteristic isthat the products have a known and steady perceived value. Currently, the consequence islow volumes and low value of the products bought. The type of product also dete rmines if itis necessary to be (physically) close to the consumer.
The type of clients determines the delivery demands: the elderly woman who cannot walkvery well may values home delivery, while the busy business man who is not often at homevalues reliability of delivery.
Despite the difficulties in solving the last mile-problem, there are many initiatives. Most ofthem on a small scale, some larger. Figure 13 shows the connection between the last milesolutions, criteria for the success of solutions, spatial behaviour and the logistical structures.The last mile can be accomplished in several ways (Smidts and Maltha, 2001):− Using existing stores− New points of delivery− Newly build facilities− Home delivery
The first two options are two groups of collection points (DTZ Research, 2001). DTZResearch has set a number of criteria to evaluate each choice for a collection point. Thecriteria are summarised in Table 6.
Table 6: Criteria for evaluating collection points.Access/trip generation Market structureConvenience Value addedGeographic coverage Planning/trafficOpening hours ReturnsManagement expertise MindsetCapacity Branding
These criteria can be used in evaluating the likelihood of a certain solution to be widely used.The more likely a solution is, the more the influence on spatial behaviour and deliverynetworks should be taken into account. A description of the criteria is given in Annex B.

e-commerce
28 PE
Example of solving the last mile-problem through existing facilitiesThere are a number of possibilities for using existing facilities, as shown in Table 7. Eachoption is evaluated, resulting in a score which is 12 at most.
Table 7: Existing facilities and their score on the evaluation criteria (DTZ Research, 2001)
Facility Score Facility ScoreExisting retail outlets 0 Convenience/Co-ops 10Food superstores 10 Shopping centres 7CTNs4 9 Retail parks 4Petrol Filling Stations 6 Public transport nodes 9Post/sorting offices 5 Schools/ Higher Education 2
BrunaBruna is a bookstore with 500 stores in the Netherlands (Smidts, Maltha, 2001). In the table,this is an example of using a shopping centre as a collection point, which scores 7 out of 12.Customers can order books on the internet and choose to come and get it at one of the storesor have it delivered. No costs are charged when picking up the books in the store and theconsumer can choose which store to go to. As soon as a consumer orders on the internet, thechosen store receives a fax with the necessary data. The products are set aside or ordered atthe supplier. The order is ready at the store in 5 days on average. With foreign titles, it canbecome several weeks.The order can also be delivered by PTT Post, the national postal service, at work or at home.In case the consumer is not at home, the package is delivered at the closest post office. Booksare delivered two days after payment. Per order fl 3,50 (1.59 Euro) is charged for deliverycosts.When using an extra distribution channel, the store, the benefits are not very clear.Consumers even have to wait longer for their order. An advantage is that no delivery costsare charged and cash payment is also possible. But what is the benefit in comparison to goingto the store and getting your books right away instead of waiting for 5 days? The advantagefor Bruna is the return-channel of wrong or broken products. A consumer can go back to thestore and receive cash. For Bruna, little organisational adjustment is needed because thestores are already used to handle return flows and the distribution system is designed for it.
This solution presented in this example is not expected to be widely used (evaluation score is7). But it does illustrate that using existing stores do not influence spatial behaviour.Furthermore, delivery networks are not changed. The consumer is still driving to the store orthe postal service takes a package to the consumer, this means the existing network is used.Traffic is the same or a little more, because of the postal service driving where they otherwisewould not.
Example of solving the last mile-problem through new points of delivery
Texaco, UPS, e-tailersPetrol filling stations are high traffic point (Smidts and Maltha, 2001). A petrol filling stationis an existing facility, but at the same time a new point of delivery. Petrol filling stationsscore 6 out of 12.Every day 500 to 1000 people stop at an average filling station to get petrol, wash the car andbuy some cigarettes. For the future a growth in such services is expected, even up to 70% ofprofits, because the margins on petrol are decreasing. Texaco came up with the idea to usethese high traffic points as pick up/drop off points. They think this is especially useful for
4 CTN= Confectioners, Tobacconists and Newsagents
e-commerce
29 PE 315.043
products that are too large for the mailbox. The consumers ta rgeted are higher educatedpeople between 18 and 45. They are online most and often drive a car.A consumer places an order on a website of an e-tailer. For delivery, home delivery or pickupat a filling station is chosen. UPS picks up the package at the e-tailer and takes it to the fillingstation. As soon as the package arrives there the consumer receives an email or SMS. Theconsumer then picks it up at the Texaco’s. Texaco keeps the products stored for 14 days andif they are not collected, UPS takes them back to the e-tailer. The e-tailer pays UPS forlogistical services and UPS pays Texaco for delivery.The advantage for Texaco is that more people come to them and while they are there mightbuy ice cream and fill the tank. UPS saves on costs, instead of delivering 10 packages to 10different addresses, they can all be dropped at the same address. Furthermore, major savingsare achieved in return-flows. By organising a network of drop-off points, consumers canleave their return-goods at filling stations, UPS was driving by anyway. The main benefit forconsumers is that they do not have to stay home for receiving their order.
The structure of delivery networks is changed by this initiative. Instead of going to the store,consumers have the products delivered at home or they drive to Texaco. This means a newnode is created in the delivery network. The spatial behaviour is not changed, because theTexaco stations are existing.Traffic might be less, because consumers have to get petrol anyway and UPS can delivermore packages to one address instead of all consumers driving to the store.
Example of solving the last mile-problem through newly build facilitiesThere are a number of possibilities for using new build facilities, as shown in Table 8. Eachoption is evaluated, resulting in a score which is 12 at most. The details of the evaluation canbe viewed in Appendix 1.
Table 8: Newly build collection points and their score (DTZ Research, 2001)
Facility ScoreDedicated collection points 11Shared warehouses 8Park & Ride 8Major employment sites 9
AlbertAlbert5 is a co-operation in the Netherlands of five companies of Royal Ahold: Albert Heijn(supermarket), Etos (drug stores), Gall&Gall, (liquor store), De Tuinen (natural care andwellbeing) and Deli XLShop (wholesale business for consumers and small and mediumenterprises). This service is started instead of the existing AH Thuisservice, supermarkethome delivery and Gall-webwinkel, home delivery of liquor. The reason is the multi-channel-thinking and offering the consumer a unique selection of products. Especially for this service,three new distribution centres have been built. They are divided over the area covered by theservice, which is approximately 50% of the Netherlands.Consumers can order products from all five companies in one system. The products aredelivered through the common system of home delivery 6 days a week within 24 hours andthe consumer only has to pay once.Spatial behaviour is very important in case of new built collection points. In this case threelocations near the consumers were chosen. The motivation is not clearly stated, but the speedof delivery and the perishable products are obvious reasons.
5 www.albert.nl; www.ahold.nl

e-commerce
30 PE
The delivery network was changed due to adding inventory points. By this, traffic willprobably increase.
Example of solving the last mile-problem through home deliveryHome delivery is a third way in filling in the last mile. There are many solutions, like pizzacouriers, mini-vans and parcel delivery companies. One of the few that is successful is Tesco.
TescoTesco6, a chain of groceries home-based in the UK, is the only successful e-tailer in homedelivery. Tesco.com is an Internet version of the local Tesco supermarket, only much bigger.Because they are on the Internet, more choice and more products can be offered than could fitin a supermarket. Also Clubcard points can still be earned with every purchase. There are 7major stores within Tesco.com, grocery, books, entertainment, baby & toddler, home &living, electricals and clothing. At the moment groceries can only be delivered to the addressregistered, but they can send goods bought from all of the other online stores to almost anyhome within the UK (e.g. to send a book or CD as a gift). Consumers can cancel or changeany of their current orders online up until 4pm on the day before delivery, Monday toSaturday. Products are delivered from local supermarkets or Tesco warehouses. Deliverycosts are set different for every store, groceries are £5 (8.05 Euro), books £2.25 plus 50p peritem (3.60 Euro and 0.80 Euro). For returning goods, a service number has to be called.The advantages for consumers are easy ordering, still earning Clubcard points and of coursehome delivery. Disadvantage is that the delivery address can only be specified once andsomeone has to be home for reception of the package. It is not clear if Tesco consolidatespackages from different stores nor what happens if the consumer is not at home. Tescodelivers an extra service and meanwhile does not have to change the organisation. Policiesfor stock keeping and delivery of supermarkets and warehouses can remain the same. Whenreturning an article, the closest store can be looked up. The downside is that Tesco has toovercome the last mile and thus attract personal and buy mini-vans or contract logisticalservice providers for example. It is not clear if the service charges cover the costs of delivery.
Delivery networks are not changed by home delivery. If the consumers substitute the onlinegrocery store for their usual shopping, vehicle movements hardly change either. If consumersgo shopping anyhow, online shopping generates more traffic.
ConclusionsThe cases show that several options for filling in the last mile have different strengths andweaknesses. The technology for implementing e-commerce is readily available, but theproblems with delivery are such that B2C e-commerce nevertheless does not have a gloriousfuture yet. In the near future, different tailor-made and small-scale solutions will emerge. Thesuccessful ones will try to grow into large-scale operations. Delivery networks therefore willbarely be influenced. Traffic movements will most likely increase, because more traffic willbe generated in delivering the online ordered goods, especially mini-vans for delivering smallvolumes quickly in urban areas.
2.2.2 Delivery networks in Business-to-Business relationsBusiness-to-business e-commerce exists in different varieties. The most common initiative isan e-marketplace, where two parties get together to arrange their transactions. By bringingbuyers and sellers together electronically, these new e-commerce marketplaces hope todramatically reduce supply chain costs. An e-marketplace is built for back-haulage, listing
6 www.tesco.com

e-commerce
31 PE 315.043
available truckloads into, out of and across. The marketplace intends to reduce the emptyruns and low capacity runs for vehicles7.There are three kinds of e-marketplaces, neutral vertical marketplaces, buyer or sellerconsortia and transportation hubs (Business Week, 2001). An important distinction is open orclosed marketplaces. Open marketplaces are public and accessible for all. Closedmarketplaces are for example open for a producer and a determined set of carriers.
Business-to-business fulfilment can be more difficult than business-to-consumer e-commerce. The reason is that B2B has more dimensions of complexity, such as shipmentsize, variety of shipment frequencies, multiple distribution channels, uneven breadth ofcarrier services, less mature carrier e-commerce offerings and more e-commerce transactionplaces.
Wiley, of Agribuys.com, suggests that electronic transportation exchanges can help some ofthe empty back hauls while they simultaneously provide faster service for the needs ofexpedited shipments (Business Week, 2001). Cranfield University’s Mike Clarke says onlinefreight exchanges can bring economies of scale, cut down administration and improveefficiency by using up spare capacity of distribution firms, whether this is in vehicles orwarehouses (Nash, 2001). However, clear evidence is lacking.The most fundamental change is that logistics operators are used to working with pa rticularcompanies in long-term contracts. But now those relationships are becoming distanced andcontract are dealt with through trading platforms. This change probably will not happencompletely for another 5 or 10 years, as distribution firms are currently locked into contracts.
Watkins from Frigoscandia on the other hand thinks that freight exchanges have a role toplay, but time will tell to what degree they can actually help the logistics industry (Nash,2001). Many distribution companies of all shapes and sizes believe they would use a returnloads or a tender service over the web as long as the process was secure and rates were notdriven down.
Toshiba Information Systems8
Toshiba, a world leader in high technology, is an integrated manufacturer of electrical andelectronic products. TUI-Consumer Product Division is a wholly owned subsidiary operatingin the UK which specialises in the manufacture and supply of such products to multiple, mailorder and independent resellers. The infrastructure consists of an NDC in the North ofEngland and a satellite operation attached to the Head Office in Camberley, Surrey.The requirement was to establish a cost effective transport procurement solution thatdelivered the capability of handling the seasonal peak between October–January. The thenused concept was making several telephone calls to local hauliers using their predefined rateschedules.The solution, provided by eLogistics, was a sophisticated system that was easy to operate,utilising Internet Explorer as the gateway to the platform. The carrier lists, customer deliverypoints and specific requirements are set up as templates. Jobs are then posted on the platform.The initial bid is held pending further quotes from alternative carriers until the deadline is dueto expire, allowing the opportunity of a more competitive price for the job to be made. As apilot, this system was installed at 6 carriers.By allowing all the jobs posted on the platform to be visible to the defined carrier-basesimultaneously, work was consistently awarded to carriers operating out of their trad itional
7 www.eurohaul.net8 www.elogistics.com (Case study Toshiba Information Systems, white paper)

e-commerce
32 PE
areas by taking the advantage of back load situations at a lower rate. Trading on the platformhas allowed Toshiba to select the most competitive price for a job without losing the qualityof carrier fulfilment. On average, they have seen a drop in their transport costs of 5% and insome cases as much as 25%. The carriers that adopted the solution have benefited by gettingmore work.There are many platforms for B2B carriers. This case shows that such a platform can havevery positive results. Companies can achieve lower transport costs, which contributes tobecoming more competitive. Furthermore, carriers can obtain more back loads and in thatway also serve more clients. But they do have to accept lower rates, so the end-result forcarriers is still insecure.
Spatial behaviour is not relevant in this case and the delivery network was not changed. Theonly effect might be that there is less traffic because of vehicle efficiency.
ConclusionsCurrently, the business to business e-commerce market is bigger than the business toconsumer market, and it is expected to be even more so in the future. The benefits of e-commerce, better communication, improved tracking, shared information to improve freightefficiency, are already starting to emerge.But it seems from the scarce evidence that B2B e-commerce is a substitute and improvementfor phone and fax, and/or it is complementary to phone and fax, rather than that it isgenerating more business and thus more transport or changing the infrastru cture. This isillustrated in Figure 14.
Old
New
Business BusinessPhone, fax
Internet, Marketplace, e-mail, EDI, ...
Figure 14: Business to business relations in the old and new economy
2.3 Possible impacts: Traffic and transport effects
In this section we discuss the impact of e-commerce on goods flows in tons, goods flows indistance, modal split and traffic flows. Again, where possible, the impact is illustrated withquantitative material
2.3.1 Goods flows in tons
The figure below depicts the e-commerce related influencing factors on the subject of goodsflows (in tons) and their relations.

e-commerce
33 PE 315.043
Figure 15: E-commerce related influences on goods flows in tons
E-commerce related influencesE-commerce affects the goods flows in tons in the following way. For B2B, the Internet hasmade possible that letters, reports, memos and other business correspondence can beformatted and sent in a digital way. Although the mail is collected anyway and the productreplaced may have a low weight, the dematerialisation of correspondence can diminish thegoods flows in tons.
The B2C digital purchase of digital products can diminish the goods flow. Software, music,movies, books can be downloaded in stead of sent and received in a physical way. However,the moment that a customers puts the digital data on a physical record, blank CD-ROMs,paper etc. must be bought, which results in other good flows in the whole supply chain. Thus,dematerialisation can therefore initiate several substitution effects.
Increased information about goods availability, and, potentially, lower transport costs froman electronically optimised logistics chain, could also stimulate higher consumption, with aconsequent increase in the total volume transported. A recent McKinsey study (Calkins,2000) present the case of a UK retailer selling both on-line and from shops that found out thatcustomers using both media increased their total purchases by 10% compared to those notusing the Internet.It also noted that the best e-tailers are achieving average purchases up to 20% greater thancomparable ‘bricks and mortar’ competitors. However, it is uncertain whether this representsa shifting, or net increase, in consumption. McKinsey attributes the findings to a greaterpercentage of premium products, the bundling of products and services and easier cross-selling in e-retailing.
The explication and invoicing of the delivery costs can cut down digital purchases in the B2Cmarket. When customers buy goods in normal shopping centres, they pay their own transportin an indirect manner. But when goods are digitally purchased and delivered to the home, thecustomer is faced with the delivery costs. The customer may decide to either not buy it (withno resulting goods flow) or to buy it in a normal shop after all (resulting in that the goods aretransported by the customer 9).
No real quantitative evidence is found for the support of the impact of e-commerce on goodsflows in tons. Most reasoning is based on case-material and circumstantial evidence.
Other influencing factorsAlthough e-commerce will have an impact on the goods flows, there are many other factorsthat can have an influence on the goods flows in tons. Regarding the trends identified inchapter 2, the following factors have an influence:
9 Which is not accounted for in freight transport, but ‘ordinary’ traffic.
±
Goods flows(in tons)
E-commerce Digital purchase
Dematerialisedproducts
Physical products
Delivery costs
Collection points
Home delivery
−±
e-commerce
34 PE
− Economic factors:− Growth of GDP, freight in tons increase− Growth of disposable income, freight in tons could increase− Explication of environmental costs, freight in tons could decrease (or a modal shift takes
place)− Explication of congestion costs, freight tons could decrease (or a modal shift takes place)− Changing over to the Euro, freight tons could increase
− Spatial factors:− Congestion, freight tons could decrease− EU enlargement, freight tons could increase
− Demographic factors:− Population growth, freight tons could increase
Future goods flowsAccording to the ECMT (2001), the tonnage carried increases by 76 per cent over the period1995-2020, i.e. by less than the increase in economic activity in Europe, which is 85 per centon average, giving an elasticity of less than one. Broken down to a more detailed level, thetonnage numbers for intra-regional traffic account for a substantial proportion of totaltonnage:of a total of 11 billion tonnes of European trade,− intra-regional trade accounts for 5 billion tonnes,− inter-regional trade within the EU for 3 billion tonnes,− trade between EU Member States for 1 billion tonnes,− and extra-Community trade – much of it in commodities, including oil – for 2 billion
tonnes.
The overall trend is therefore composed of intra-regional, inter-regional and internationaltraffic flows. This shows large variation in growth from 1995-2020:− intra-regional traffic increases by less than 50 per cent in tonnes over the period (elasticity
close to 0.5),− while inter-regional traffic doubles (elasticity around 1.3)− as does international traffic, though at an even faster rate with countries of Central Europe
(elasticity between 2 and 3).
2.3.2 Goods flows in distanceA possible driver of an increase of goods flows are more geographically extended supplypatterns, and a correspondingly higher average length of haul. The Trilateral LogisticsEurope project, performed for the European Commission and the OECD, concluded that thiswould be the likely effect of e-commerce and related developments in B2B relations (Trilog,1999). E-commerce has also been identified as an important factor in the high rate of growthof airfreight, which is being partially driven by e-commerce (Lobo and Zairi 1999). On theother hand, by providing more information about potential sources of supply the e-economycould make it easier to source requirements locally, so that total tonnes-kilometres arereduced.

e-commerce
35 PE 315.043
The figure below depicts the e-commerce related influencing factors on the subject of goodsflows (in distance) and their relations.
Figure 16: E-commerce related influences on goods flows in distance
E-commerce related influencing factorsDigital purchase of both physical and dematerialised products and the impact of deliverycosts can influence the goods flows. These factors are already discussed in the previoussection. Other factors, which relate to e-commerce, influence goods flows (in kms) in thefollowing way.E-commerce related responsiveness can influence goods flows in distance in three manners.First, companies can choose to bring a dedicated distribution centre in to action in the supplychain, as mentioned before in this chapter. Being an extra link in the chain, the total transportdistance shall probably increase. Second, e-commerce influences shifts in urbanisation andde-urbanisation. An urbanisation shift could take place, as a result of the settlement of servicepoints near the consumers. De-urbanisation takes place simultaneously, as a consequence ofthe settlement of back-offices and outlets in sub-urban areas. The influence on transportdistances consists therefore of substitution, increasing and decreasing effects. Third, e-commerce influences concentration and de-concentration shifts. Concentration takes alsoplace in non-congested areas, where companies want to profit from economies of scale.Because of the fact that e-commerce has stimulated global sourcing and e-procurement, asourcing network of companies can get de-concentrated. De-concentration shifts can also befound in congested areas, where service points must be located near the customer.ICT-tools can make a network to operate in a more efficient way. Routes can be opt imisedthrough planning on before hand and, during a transport process, through A ssisted GPS (A-GPS) and communication facilities, with less transport distances as a result.E-commerce has also made possible the utilisation of market places. Especially the B2Bmarket places enable companies to optimise their transport. For example, shipments can beconsolidated and back-haulage can be found via the Internet.
FiguresAfter all these expected patterns in relationships, the major question is whether e-commercetrade leads to changing transport and traffic patterns. The Internet offers the potential to buyand sell products all over the world, which leads to the expectation that average transport
±−
−
−
Goods flows(in kms)E-commerce
Digital purchase
ICT tools
Dematerialisedproducts
Physical products
Delivery costs
Responsiveness Urbanisation
Concentration −
Home delivery
Collection points
Distributioncentres
B2B Marketplaces ±
+±
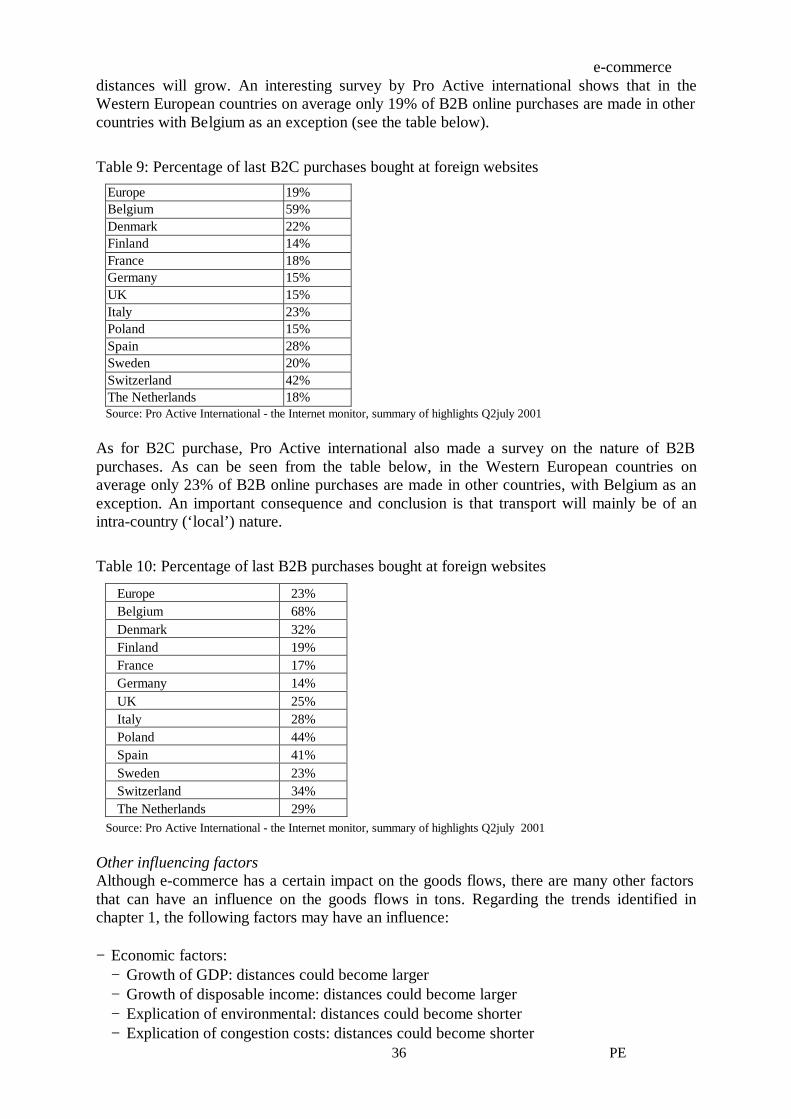
e-commerce
36 PE
distances will grow. An interesting survey by Pro Active international shows that in theWestern European countries on average only 19% of B2B online purchases are made in othercountries with Belgium as an exception (see the table below).
Table 9: Percentage of last B2C purchases bought at foreign websitesEurope 19%Belgium 59%Denmark 22%Finland 14%France 18%Germany 15%UK 15%Italy 23%Poland 15%Spain 28%Sweden 20%Switzerland 42%The Netherlands 18%Source: Pro Active International - the Internet monitor, summary of highlights Q2july 2001
As for B2C purchase, Pro Active international also made a survey on the nature of B2Bpurchases. As can be seen from the table below, in the Western European countries onaverage only 23% of B2B online purchases are made in other countries, with Belgium as anexception. An important consequence and conclusion is that transport will mainly be of anintra-country (‘local’) nature.
Table 10: Percentage of last B2B purchases bought at foreign websites
Europe 23%Belgium 68%Denmark 32%Finland 19%France 17%Germany 14%UK 25%Italy 28%Poland 44%Spain 41%Sweden 23%Switzerland 34%The Netherlands 29%
Source: Pro Active International - the Internet monitor, summary of highlights Q2july 2001
Other influencing factorsAlthough e-commerce has a certain impact on the goods flows, there are many other factorsthat can have an influence on the goods flows in tons. Regarding the trends identified inchapter 1, the following factors may have an influence:
− Economic factors:− Growth of GDP: distances could become larger− Growth of disposable income: distances could become larger− Explication of environmental: distances could become shorter− Explication of congestion costs: distances could become shorter

e-commerce
37 PE 315.043
− Changing over to the Euro: distances could become larger− Spatial factors:
− Congestion: distances could become shorter− EU enlargement: distances could become larger
− Technical factors:− More adequate infrastructure: distances could become larger
Future goods flowsIt is difficult to find quantitative data on goods flows on distance, since most statistics areusing tonnes-kilometres as measurement unit. The ECMT (2001) states that the a veragedistance travelled is increasing substantially for freight, due to firms’ longer supply anddistribution distances. For freight transport, often more than half the rise in to nnes-kilometrescan be put down to shipping distances.Regarding figures in tonnes-kilometres, freight traffic (including road, rail, and waterways)grows almost at the same pace as GDP (EC, 1999). This means that long term incomeelasticities of freight transport demand are close to one (in line with values for example insome OECD studies). According to Figure 5 and Figure 17, freight transport demand isgrowing significantly slower than GDP in only two countries: Germany and Ireland.
Figure 17: EU9 Comparison of trends in total freight transport demand (in tonkm) per country (EC,1999)
2.3.3 Modal-splitE-commerce usually demands highly flexible supply chains, whereas rail and sea transportare the least flexible modes with high infrastructure costs and a reliance on regular volumeshipments. This inherent disadvantage is compounded by the limited application of e-commerce within the rail and maritime sectors. The latter is particularly slow in moving tothe electronic documentation, which could reduce costs and wastage and, more importantly,increase speed, reliability and customer confidence in delivery times.Figure 18 shows the influences that relate to e-commerce, on modal split and their relations.
0
0,5
1
1,5
2
2,5
3
3,5
4
Finlan
d
Franc
e
German
y
Greece
Irelan
dIta
ly
Netherl
ands
Spain UK
aver
age
annu
al c
ompo
und
grow
th r
ate
2000-2005 2005-2010
Physical products Modal splitE-commerce Digital purchase
Delivery costs
Costs pertransport mode
Home delivery
Dematerialised

e-commerce
38 PE
Figure 18: E-commerce related influences on modal split
E-commerce related influencesE-commerce affects the modal split in the following way. E-commerce could reduce demandfor goods through dematerialisation. Technology is creating the option of delivering someproducts such as music, film, software and documents in electronic rather than physical form.When physical goods are purchased via the internet, the goods must be delivered at home ormade available at collection points as soon as possible. To do so, service providers usededicated delivery networks, as discussed section 2.2. The delivery of digital purchasedgoods can result in delivery costs. As already described, the explication of these costs candecrease the digital purchase. Additionally, delivery costs can relate to the costs per transportmode, if the customer can choose its transport mode associated delivery time.Besides the delivery costs that are invoiced to the customer, the actual transport costs must bepaid. For a company that exploits e-commerce, these costs can be the basis of a selection oftransport modes. As result of this selection, a change in the modal split (road, air, sea, rail,and waterways) can result.
For policy-makers, the costs per transport mode are an ideal instrument to influence themodal split. Relative shifts in price of one mode against another, and particularly about theprice of rail as opposed to road, can promote favourable transport modes above ot hers.However, such price policies do not relate with e-commerce.
When one breaks down road transport to the different kinds (i.e. capacities) of trucks andvans, e-commerce may also lead to a change in this ‘road split’. When e-commerce affectsthe distribution by demanding that deliveries take place more frequent, a shift is to beexpected from the large trucks to smaller vans. The reason hereof is that a more frequentdelivery scheme can decrease the goods flows in tons per delivery, and that these deliveriesmay fit into a van. And companies shall choose this strategy, since transport costs of vans arelower than the costs of trucks. Besides, vans have various advantages in congested areas,when the economies of scale are just in a minor place.
Another issue is the distinction between transport and traffic. Home delivery is imputed togoods flows and thus to transport. When a customer must collect its order(s) at ded icatedcollection points however, the customer transports its goods probably by car, bicycle, or onfoot. So transportation of goods from collection point to the home is i mputed to traffic.Although this could be seen as more a methodological issue, it does has it effects onquantitative analysis and figures.
Other influencing factorsAlthough e-commerce has a certain impact on goods flows, there are many other factors thatcan have an influence on the modal split. Regarding the trends identified in chapter 1, thefollowing factors may have an influence:− Economic factors:
− Explication of environmental costs− Explication of congestion costs
− Spatial factors:− (De-)urbanisation− (De-)concentration
− Technical factors:− ICT tools, e.g. in the field of Intelligent Logistics Concepts− Infrastructure improvements (per modality)

e-commerce
39 PE 315.043
Future modal splitTrends in transport prices and costs have a major bearing on mobility levels and especially onmodal split. Here, the ECMT (2001) stresses a prime concern of most policy-makers involvedin long-term development.
74,7
13,4
6,85,1
Road
Rail
Inland waterways
Pipelines
Figure 19: Total modal split of 1999 for EU-15 (tkm in %) (Eurostat, 2001)
According to the ECMT (2001), the modal split (measured in tonnes) is significant for intra-regional road transport for the period 1995-2020, given the short haulage di stances: of theorder of 95%. The share of intra-regional rail transport is circa 3%. For internal inter-regionaltrade, the share of road transport increases from 81% to 83%, leaving rail in tonnes fallingfrom 10% to 9%.
In the international transport sector, the modal split is between road and maritime transport,with inland waterway and rail also account for a share. Inland waterway carries a verysubstantial share of bulk traffic along the main waterways. Road still has a large share,increasing from 43% to 45%, inland waterway’s share would remain constant at 15% aswould maritime transport with 24% and rail transport with 7%.
Figure 20 depicts a 2000-2010 forecast for the total modal share of trucks. The particularlylow modal share in Finland and the Netherlands can be explained by the importance ofrespectively coastal shipping and waterway transport.
00,10,20,30,40,50,60,70,80,9
1
Finlan
d
Franc
e
German
y
Greece
Irelan
dIta
ly
Netherl
ands
Spain UKTr
ucks
- M
odal
sha
re in
tran
spor
t
2000 2010
Figure 20: EU9 Comparison: Modal share of trucks in freight transport (EC, 1999)
The opportunities which e-commerce creates for improved management and optimisation oflogistics may require equivalent integrated organisations. The development of inter-modaltransport, for example, may only grow substantially with the development of centralised

e-commerce
40 PE
trans-modal ‘infomediaries’ who can, inter alia, provide an integrated tracking service overall transport modes.
2.3.4 Traffic flowsTraffic consists of actual means of transport that make use of existing infrastructure.Therefore, a distinction between goods flows and passenger flows can be made, but a trafficanalysis must take both flows into account. Figure 21 depicts the factors that influence traffic.
Modal split
Traffic
Passenger flows(# cars)
Passenger flows(in kms)
Modal splitInfrastructural
capacity
Goods flows(in tons)
Goods flows(in kms)
Figure 21: Factors that influence traffic
In ‘Time to decide’ the European Commission (2001) stresses that economic growth willalmost automatically generate greater needs for mobility, with estimated increases in demandof 38% for goods services and 24% for passengers. If nothing is done, heavy goods trafficwill increase by 50%.Most passenger and goods traffic uses road. In 1998, road transport accounted for nearly halfof all goods traffic (44%) and more than two-thirds of passenger traffic (79%). Road's shareof the goods market has been growing constantly, from 41% in 1990 to 44% in 1998, and, ifno action is taken, is expected to reach 47% by 2010 (EC, 2001).
Goods flowsIncreased information from electronically integrated supply chains, vehicle tracking and othersources might allow better matching of capacity with loads, and enable a higher degree ofreverse logistics. In this case, the traffic becomes more optimised, which could results in amoderation of traffic growth. On the other hand, electronically-enabled production moves to‘just in time’ production, which could increase the number of partially loaded vehicles on theroads.
Another important variable is load consolidation through sharing of distribution facilities anddelivery vehicles. For example, a Swedish study examined all deliveries to 15 shops,restaurants, schools and day nurseries and compared this to an ‘ideal’ pattern involving tripoptimisation and shared use of delivery vehicles. They found that the latter could produce a39% reduction in distance travelled, a 42 % reduction in the number of vehicles used and a58% reduction in the number of journeys (IST 2000).
Passenger flowsIn the US home shopping was driven by a number of ‘dot com’ companies who attempted toestablish alternative channels to established retailers. However, all of these have either goneout of business or been taken over by existing retailers and the European model of ‘bolt on’home shopping by existing retailers is now being adopted in the US. This is much cheaper inthe short and medium term because it can take advantage of the existing store infrastructure,although as volumes rise there may be a need for more dedicated ‘picking centres’. Some ofthe centres may be co-located with supermarkets but most are likely to be developed in low-

e-commerce
41 PE 315.043
cost warehousing locations. In some cases, dispersed picking centres may deliver in relativelylarge vehicles to local ‘van centres’, from where smaller vans will deliver to homes(Foresight 2000). As the number of returns is another key factor in the economics of homeshopping, its development is also likely to create pressure for more evening and weekenddeliveries. Finally, there is likely to be development of local distribution centres where goodscan be dropped if people are not at home, or by request (which might be stimulated by lowerdelivery charges for home delivery).
Complete replacement of car-based shopping trips by Internet ordering and van-baseddelivery could certainly reduce distance travelled – by 70 to 80% according to one simulation(Cairns 1999). However, complete replacement is unlikely as consumers could use the sparetime and vehicle availability to make other journeys whilst providers can offer very differentkinds of distribution service. The retail sector also has a strong interest, and new techniques,to divert time and cost savings into further shopping. People shop not only to buy specificgoods, but for a variety of other reasons such as social interaction, excitement and creatingand maintaining a personal identity. It is also possible that the Internet might produce an‘unbundling’ of multiple orders which, for convenience, were previously made from a singlelocation. This could mean that a single car trip is replaced by a number of van deliveries,leading to a major increase in delivery units (Marker and Goulias 1999).
Two aggregate forecasts of the transport impact of electronic home shopping have r ecentlybeen reported:
In the UK, NERA (2000) have estimated that home shopping will reduce car based shoppingtravel by 5% by 2005 and 10% by 2010. This outweighs a forecast increase in delivery trafficof 0.25% by 2005 and 0.5% by 2010.The study also estimates that bringing in more IT into the freight sector (route planning andscheduling, freight exchanges etc) will lead to a 17% and 19% reduction in goods vehiclemileage by 2005 and 2010.
A Netherlands study by the Dutch Road Haulage Association TLN (TLN 2000), hasestimated that 11.5% of total retail sales - approximately 3.5 million tonnes of goods - will bepurchased on-line and home delivered by 2005. In the urban Netherlands this will oftensubstitute for cycle or foot trips, which are currently the two most frequent modes oftransport for shopping. The net effect is forecast to be a 17% increase in road vehiclemovements over the next 5 years.
Infrastructural capacityBoth existing infrastructure and actual traffic determine the infrastructual capacity
Another effect of both B2B and B2C e-commerce has been increased demand for warehousespace. In the USA the market for rented warehousing has been growing by 10-15% perannum, much of it driven by e-commerce vendors10. In the UK, e-commerce warehousing ismainly concentrated in the Southeast, where the surveyors FPP Savills have estimated that e-retailing accounted for 2 million square feet in 1999, or 10% of the available space. A studyby Lambert Smith Hampton11 has also found that there is now a shortage of suitable sites inseveral areas of the country.
10 www.werc.org11 www.lsh-ni.co.uk/

e-commerce
42 PE

e-commerce
43 PE 315.043
3 RESULTS AND RECOMMENDATIONS
3.1 Summary of results
This report focuses on the relation of e-commerce with trade and the impact of e-commerceon traffic and transport. As stated in chapter 1, the focus was on fact finding and analysis ofexisting data. Going through the results presented in chapters 2 and 3, the first conclusionshould be that actual data currently gives little support to answer the questions set in theobjective and the study cannot obtain the results asked for at the current time. This is due totwo reasons: first, despite the interest for e-commerce, data is not gathered on a structuralbasis. Second, the material that is available is many times grounded on case studies, givesindirect evidence and often conflicts with comparable material from other sources.
The four questions set out in the objective have been broken down to several concise researchquestions12. This section discusses these research questions and the results we found insuccessive order.
How many people and European business are online?The latest estimate on Internet use is for August 2001. NUA estimates the world-wide use ofInternet at 513.41 million users, for Europe the estimate is 154.63 million.
Surveys on Internet access of European business vary from 16% (Dataquest, 1999) to 37%(NOP Research Group, 1999). Especially large companies have a high penetration rate. NOPResearch shows that companies with more than 200 employees have an average Internet userincidence of 75%. For small companies (<10 employees) this is 32%.
What is the size of total e-commerce sales?E-commerce is not easy to measure and difficult to predict. The estimates for e-commercerevenues show a considerable variation as a result. The major reason is the difference ininterpretation of the definition of e-commerce. All forecasts project however that the e-commerce sales shall double or more than double each year.
Forrester Research forecasts Western European e-commerce will account for 6% of totalsales by 2004 (Forrester Research). Expectations for the Netherlands are very high, namely10% of total sales. With respect to total European e-commerce revenues, especially Germanyand the UK have a relative high share: around 30 and 25% respectively (IDC, 2000)
What is the E-commerce part within trade?E-commerce has a negligible share in total trade. This applies to Europe, but also for thewhole world. In 1999, the B2B and B2C related e-commerce revenues of EU-15 have nomore than a 0.3% share in the total European trade (intra EU trade and trade with the rest ofthe world).
The B2B e-commerce trade still grows considerably. On top, the (Western Europe) privatetrading networks increase their trade from € 50 billion in 2001 to € 1476 billion in 2005. Ingeneral, the Western Europe B2B e-commerce trade is projected to increase from € 205billion to € 2916 billion.
12 As listed in “Annex I: technical specifications for the study” of the contract.

e-commerce
44 PE
For Europe, the B2C e-commerce sales are estimated as 0.24% of total retail sales in 1999.The average growth is projected on 170% for Europe in 2000. With respect to this growth,Belgium, Switzerland and Italy set the range of variations per country. Whereas the B2C e-commerce sales are estimated as 0.16% of total retail sales in Belgium, the growth isprojected on 420% in 2000. In Italy however, the B2C e-commerce sales are calculated asjust 0.09% of total retail sales, and the growth is projected on just 145%. Finally, albeit theB2C e-commerce sales in Switzerland are estimated as 0.29% of total retail sales, the growthis projected on just 110%.Several sources expect that B2C e-commerce will amount to 5% of retail spending by theyear 2005 (see a.o. Coppel, 2000).
What is the quantified impact of e-commerce on freight transport as regards the mode oftransport and transport routes?Actual scenario studies do not identify e-commerce as a significant factor that influencestransport routes, transport modes, goods flows in tonnes, nor in distances (TRT & TNO Inro,2001). Therefore, there is not any quantified data on this relation available.In general, the modal share of international freight transport in the EU is expected to be asfollows in 2020 (ECMT, 2020): road is growing from 43% to 45%, maritime shipping keepsa stable share of 24%, inland waterways a stable share of 15%, and rail stagnates at 7%.
How will the behaviour of those ordering goods affect the frequency of transport movements?Statistical data for Europe is unavailable and on the basis of the material available, no clearanswer can be given. In the UK, NERA (2000) have estimated that home shopping willreduce car based shopping travel by 5% by 2005 and 10% by 2010. This outweighs a forecastincrease in delivery traffic of 0.25% by 2005 and 0.5% by 2010. In contrast, the Dutch RoadHaulage Association TLN (TLN 2000), has estimated that 11.5% of total retail sales -approximately 3.5 million tonnes of goods - will be purchased on-line and home delivered by2005. The net effect is forecast to be a 17% increase in road vehicle movements over the next5 years.
Will a measurable substitution effect lead to an overall reduction in shopping trips?In addition to the previous section, trip optimisation can lead to a reduction of the number oftrips, regarding both B2B and B2C delivery. However, it is very difficult to make aprediction of the influence of e-commerce on the number of shopping trips by consumers,because of the fact that many other factors must be taken into account for such a prediction.On the one hand, people do not shop only to buy specific goods, but consumers often goshopping just for fun and social interaction. On the other hand, the retail sector has a stronginterest in consumers that shop in the traditional way, because of the fact that those peoplecan be persuaded to buy more goods than they intended.
Another issue is the distinction between transport and traffic. Home delivery is imputed togoods flows and thus to transport. When a customer must collect its order(s) at ded icatedcollection points however, the customer carries its goods probably by car, bicycle, or on foot.So transportation of goods from collection point to the home is i mputed to traffic. Althoughthis could be seen as more a methodological issue, it does has it effects on quantitativeanalysis and numbers.
Will a measurable substitution effect lead to an overall reduction in distances travelled?The substitution of goods flows by dematerialisation will not significantly lead to an overallreduction in distances travelled. Dematerialised products may substitute some physicalproducts. However, the moment that customers put the digital product on physical blankrecords, other goods flows emerge. Further, digital purchase of physical products creates

e-commerce
45 PE 315.043
different kind of goods flows (in comparison with traditional supply chain structures). Theaverage goods flows in tonnes may decrease, but the total distance travelled could increase asa result of a very fine distribution structure and dispersed daily deliveries.
Nevertheless, ICT tools can optimise transport flows. This optimisation can take place in theplanning process, thus before the transport takes place, and during the transport by usingsophisticated communication tools. And through a more efficient use of truck capacity forexample, trips can be minimised, which may affect the total distance travelled. For the UK,NERA (2000) estimates that bringing in more IT into the freight sector (route planning andscheduling, freight exchanges etc) will lead to a 17% and 19% reduction in vehicle mileageby 2005 and 2010.
Does e-commerce-induced extra ordering lead to extra transport?As shown in Figure 15, e-commerce has some influences on goods flows in tons.Dematerialisation, a major influencing factor, may initially lead to a reduction of transport.However various substitution effects occur, which results that the goods flows in tons hardlychange. Further, one can argue that the infl uences identified have just a minor effect on thetotal goods flows with respect to other non e-commerce related aspects.As depicted in Figure 16, e-commerce has several influences on goods flows in distances.Next to dematerialisation, the use of ICT tools and the strive for r esponsiveness trough(de-)urbanisation, (de-)concentration, and the usage of e-commerce dedicated distributioncentres are important influencing factors. Taken the substitution effect into account, onecould argue that the influences identified have just a small effect on the total goods flows.
What impact does the customer structure of e-commerce have on the demand for transportservices from private households and companies (works transport)?This question cannot be answered in isolation. Along with e-commerce, a vast bundle of newtechnologies is becoming available, making it possible for people to start tele-working andtele-learning, and for companies to work over greater distances and to reduce the number ofbusiness trips (e.g. by videoconference).If the history of telecommunication is taken into account with for example the developmentof the telephone, the PC and IT-networks, the impression however is that new forms ofcommunication do not hamper growth in the demand of transport. Rather, it appears to leadto an increase in mobility, hence an increase in demand for transport services.
Does the use of e-commerce mean that transport movements do not take place since onlygoods actually ordered are moved (fewer return goods)?No, one could think that less transport movements might be necessary, since only actuallyordered goods are moved. But the need for responsiveness makes it necessary to still haveproducts in stock, preferably at a decentralised warehouse. And the ease of e-commercemakes that people order goods return more easily. The return percentage for most products isbetween 1 and 10%, and for apparel between 25 and 30%. This is not so much caused by theselling through the Internet, but is more a co nsequence of the principle of “selling atdistance” (TNO Inro, 2001b).Furthermore, the necessary home delivery causes one van to drive for 10 consumers insteadof ten consumers driving, but it is not clear whether consumers go shopping anyway. Alsovans need to drive more often because consumers are not always home at the time ofdelivery. If customers are to pick up their goods at collection points, they must drive in anycase.

e-commerce
46 PE
Is there any likelihood of an alteration in the volume of traffic, where possible with greaterconcentration at certain time of day/night or certain days of the week?This will largely depend on the logistics structures companies develop in answer to the e-commerce developments. Current evidence is scarce and based on cases. The “Albert”example in chapter 3 shows that a group of companies decided to restructure their logisticsleading to another form of the fundamental lay-out of the chains, which could alter volumesof traffic. However, this alternative has only started recently, with no hard data available yet.
Influence of e-commerce on traffic concentration: increased congestion of industrial estates,approach roads and distribution centres? What effects are to be expected on the existingmajor distribution points, motorway/intersections, residential areas?This study does not find any significant relations between e-commerce and trafficconcentration. So far, e-commerce induced trade is too small and e-commerce related supplychain structures are integrated in traditional structures to a large extent. Nevertheless, e-commerce is growing very fast. This could mean that e-commerce induced traffic would leadto undesired situations. Exemplary actions to avoid such situations are:1. Product related legislation. Not all products are suitable for electronic sale and home
delivery. Especially when health and safety are at issue, restrictions are desirable.Exemplary restrictions are temperature regimes, required certifications for transportoperators, and prohibition of sale (e.g. of guns).
2. Regulation of the time slots in which deliveries can be made. Shops already have timeslots for their urban distribution of supplies. It can be argued that very frequent homedelivery also should be regulated.
3. Regulation of the time slots in which customers can visit the collection points anddelivery points to collect their goods. If a collection point is open for 24 hours, it maycontribute to increased (local) congestion at peak times (e.g. 4:30-6:30 PM) and maycome to local noise pollution in the night. But on the other hand, the collection pointsneed to be accessible when consumers are able to drive along and that is especially atrush hours.
4. Regulation of the size and/or weight of the vehicles that can be used to make thesedeliveries. Home delivery by using heavy truck could have consolidation effects, butcould also damage local roads in city centres or residential areas. When home delivery isused more often, it can be argued that vehicles are restricted to certain limits.
During 1999 and 2000, the growth of e-commerce led to an increased demand for warehousespace. In the USA, the market for rented warehousing has been growing by 10-15% perannum, much of it driven by e-commerce vendors (WERC, 2000). In the UK, e-commercewarehousing is mainly concentrated in the Southeast, where the surveyors FPP Savills haveestimated that e-retailing accounted for 2 million square feet in 1999, or 10% of the availablespace. A study by Lambert Smith Hampton (2000) has also found that there is now a shortageof suitable sites in several areas of the country.Such demand and concentration effects will lead to new traffic patterns, potentially to a shiftof congestion to new areas.
What happens to the use of conventional delivery services and the mode of delivery?E-commerce has a minor influence on conventional delivery services and the mode ofdelivery. As far as B2B e-commerce is concerned, transport operators and logistics serviceproviders bring the usual modes of transport (especially trucks) into action. With respect toB2C e-commerce, dedicated delivery networks and courier services are often used. Thesededicated delivery networks are usually fitted to conventional systems, because of the highinvestments involved and to avoid business risks. As long as the products boughtelectronically are of a two-dimensional nature (i.e. they fit in the letterbox), the logistical

e-commerce
47 PE 315.043
structure and the modes used will not likely change. When the products ordered becomelarger in future (more three-dimensional), changes in the distribution structure will benecessary.In addition, because of the fact that many other factors influence the modal split (in an evenstronger manner), the impact of e-commerce on conventional delivery services is minimal.
What scope is provided for shortening the transport routes specifically by the intelligent useof IT (GPS?) in transport management? Is there a resulting likelihood of a reduction in thenumber of empty runs or low capacity runs for vehicles?It is highly unlikely that the use of IT will lead to shortening of transport routes, except for anoptimisation in networks used by transport operators (which is a repeating planning activity).On the other hand, the application of intelligent IT makes it possible to reduce the number ofempty runs by means of better communication between the different parties in a transportchain. Many companies are investing in communication equipment for their vehicles (like inon-board computers, mobile phones, tracking and tracing facilities, etc.), but also forinformation exchange in the chain.
What figure can be put on the avoidance of physical freight transport resulting from e-dematerialisation?The little dematerialisation so far and the low volume of products and services suggest thatthe effects on transport are expected to be insignificant. Dematerialised volumes are too smallto obtain a significant effect. Although the Internet has made possible that letters, reports,memos and other business correspondence can be formatted and sent in a digital way, themail is collected anyway and the product replaced has a relative light weight. And eventhough software, music, movies, books can be downloaded in stead of sent and received in aphysical way, the moment that a customers puts the digital data on a physical record, blankCD-ROMs, paper etc. must be bought. These activities result in other good flows. Thus,dematerialisation therefore initiates several substitution effects.
3.2 Expectations for 2010
Assuming a guaranteed growth of the exploitation of e-commerce as a result of a pe rsistenttechnical innovation, two trend scenarios may represent the development of e-commerce:− a flourishing trajectory, in which e-commerce makes a large, and expanding contribution to
the overall business. This scenario can be translated into ‘e-combustion’: transport iscompletely subordinate to customer service; one stop shopping changes into daily ‘just-for-you’ shipments of small packages by mail order and teleshops; producers require perfectresponsiveness of their suppliers, who must deliver more than once a day instead of once aweek. An underlying trend is mass-customisation; logistics will shift from production-to-stock to unique production of single items. Transport will significantly increase.
− a moderate trajectory, in which e-commerce makes a narrow contribution to the overallbusiness that just grows in a very limited manner. This scenario can be translated into ‘e-limination’: all opportunities to reduce transport demand are exploited; consumers andcustomers require sustainable solutions; service requirements are modest, leaving room totransport optimisation. An underlying trend is sustainability; logistics will focus on newforms of consolidation. There will be a modest grow in transport13.
13 The relation between economic growth and the increase in mobility is positive. Hence, in the ‘e-limination’ scenario
there will also be an increase in transport.

e-commerce
48 PE
In practice, the development of e-commerce and its consequences will be in between the e-combustion and e-limination scenarios. After the hype of 1999 and 2000 on e-commerce andin the aftermath of September 11, the current expectations on economic growth and e-commerce are moderate. We expect that the current sentiment will turn positive in thecoming years, leading to an upswing again. In effect, we expect that e-commercedevelopments will take on a growth rate which is around the growth rate of GDP, but withlarger fluctuations.
Several sources expect that by the year 2005 B2C e-commerce as a % of retail spending willamount to 5%. We expect this figure to come true later than by 2005, given the currentslower pace of economic growth in Europe. In addition, given the nature of the (physical!)products that can be sold, we expect the B2C e-commerce sales numbers to settle around thispercentage. This will cause new distribution concepts to be developed, especially in urbanareas. Traffic and transport patterns will alter and a pressure on the urban infrastructure andenvironment may occur. We do not expect that e-commerce will lead to significant globalbuying by consumers. Currently, consumers mainly buy from national websites, which maygenerate more local transport.
For B2B the picture is more difficult. In effect, the percentage of trade via B2Be-commercemay easily outnumber the B2C sales, in terms of value, volume and percentage of overalltrade. However, these B2B e-commerce sales will for a very large part be a substitution oftrade facilitated via other forms of communication. We expect that e-commerce will reinforceexisting trends like global sourcing. On the other hand, we should bear in mind that the bulkof production in Europe is established by SME’s. These companies tend to source locally, orat a national level. The effects of e-commerce on traffic and transport will therefore probablystill have a national scope.
3.3 Possible actions
On the basis of the results found in this study, the question is “what transport policy measuresshould be taken at Community level having regard to existing environmental standards inorder to cope with any anticipated increase in demand for transport services?”
Given the current situation, the answer would be “nothing”. Effects, if at all present andmeasurable, are very small. More results may be possible in stimulating/mitigating otherfactors influencing transport. As the ECMT puts it: ‘The globalisation of trade, thereorganisation of distribution and the concentration of warehousing points, the special isationof production units, the efficiency of transport, the performance of road, rail, air, sea, andwaterways are probably the causes that should be factored into trends’.
This may be an unsatisfactory result, and the situation for 2010 may be such, that currentintervention by policy makers is worthwhile. A first step is to recognise and acknowledge thee-commerce and Internet-related developments. In this respect it is striking to see that thenew European white paper on transport (European transport po licy for 2010: time to decideCOM (2001) 370), e-commerce is not mentioned and Internet only twice!
While it is difficult to measure and predict the impact of e-commerce on transport, a first stepshould be to treat the topics not separately. Integration of policy, from diffe rent directorateswithin the European Union and from different policy levels (National, European, supra-national) is therefore necessary.

e-commerce
49 PE 315.043
Leaving all developments to the private market, without guiding the developments may leadto undesired negative effects. ‘Doing nothing’ is therefore not the most useful approach.
Suggested actions that the Parliament can undertake or support are:− Stimulate the development of an e-commerce or ICT-monitor that measures in an
unambiguous fashion the effects of e-commerce on traffic and transport in Europe. Choicesshould be made on the proper methodological approach and criteria which have to be used.The current set of criteria used for European statistics, such as ton-kilometres does notoffer the right information on the e-commerce effects. Alternatively to the stimulation of amonitor is to join existing initiatives by other supra-national bodies like the OECD or theUNCTAD, who ‘struggle’ with the same measuring problems.
− The European SME’s generate the bulk of production in Europe. They are however laggingbehind in the use of e-commerce. For them it can improve both efficiency andeffectiveness. The Parliament can support initiatives to educate and help SME’s getting onthe Internet. A stimulus in this respect can be the development of the ‘e-government’concepts, in which the European Union can be in the lead.
− The use of ICT within the supply chains has large potential in improving transportefficiency (route optimisation, reduction of empty returns, etc.). This potential is clearlynot use to its full extent, in particular not by smaller transport companies. The Parliamentcan support initiatives to educate and help transport companies using ICT-tools to theirbenefit.
− E-commerce is passing its hype-stage. It is therefore important to take the ‘e’ out e-commerce14. By this we mean that e-commerce effects should be seen in the context ofother developments and treated in an equal fashion as the other developments. As statedabove, e-commerce will reinforce ongoing trends and accommodating those trends maysort more effect than a focus on e-commerce as a single entity.
− For many people and companies, the view on e-commerce developments is blurred by themany different possibilities and approaches that exist in the use of e-commerce. The use ofe-commerce may be stimulated through supporting the standardisation of concepts,technologies, the body of knowledge, etc.
− In addition to the previous item, the Parliament can focus on preventing the ‘digital divide’between those who use the technology, and those who cannot or do not want to use it. Thisdivide may occur along the lines of generations, income groups and/or geographical areas.
− The parliament can accommodate the use of e-commerce by changing or developing newlegislation.
- With respect to e-commerce transactions the following issues are relevant(UNCTAD, 2001):- Finding global solutions for global transactions- Settling global laws for digital disputes- Setting a clear framework to protect the e-commerce consumer- Taking care of data protection and privacy- Finding solutions for digital signatures
- “Cybertaxation”: a clear position and directive on the way taxes on international e-commerce goods- and services flows are levied, will support the development of e-commerce.
The Parliament can join the developments by supra-national organisations like theUNCTAD and the OECD, but should also develop its own vision and policy in this respect.
14 Or, alternatively, the ‘m’ out of m-commerce.

e-commerce
50 PE
With respect to e-commerce deliveries, two categories of legislation are important15:− Product related legislation. Examples include health and safety regulations that set
temperature regimes required for many food products and the monitoring regimesrequired to ensure that these temperatures are maintained.
− Vehicle operation legislation. Regulation that includes any controls that affect:− the time at which deliveries can be made (both in terms of vehicle access to the street
concerned and unloading regulations in force on the street);− the times at which customers are permitted to visit the collection and delivery points
to collect their goods;− the size and/or weight of vehicles that can be used to make these deliveries.
15 ACEA, E-commerce, freight distribution and the truck industry, 2000.

e-commerce
51 PE 315.043
REFERENCES
Boston Consulting Group , The race for the online riches, E-retailing in Europe, February2000.
Broens, D.F, K. Vanroye, R. Demkes , E-commerce, supply chain management andintermodality, Background paper for the 3rd EU-USA Forum on Freight Intermodalism,Boston, 1999.
Brown, M, E- commerce, freight distribution and the Truck Industry, ACEA SAG meeting,Brussels, 1999.
Business Week, Business-to-business fulfillment grapples with complexity, 2001.
Cairns, S, Home Delivery of Electronic Shopping: The Environmental Consequences, ESRCTransport Studies Unit, University College, London, 1999.
Calkins, J, Farello, M, and Shi, C, From Retailing to E-tailing, The McKinsey Quarterly,No.1, p140-147, 2000.
Cap Gemini Ernst &Young, Electronic Marketplaces, Your ticket for the new economy,Kluwer, Deventer, 2001.
Colin, J. The impact of e-commerce on logistics, Joint OECD/ECMT seminar: the impact ofe-commerce on transport, session 2: E-commerce and Logistics, Paris, 5/6 June 2001.
Coppel, J. E-commerce: impacts and policy challenges, OECD paper, June 2000.
Council of Logistics Management, authors: D.J. Bowersox, D.J. Closs, Th. P. Stank, 21st
Century Logistics: making supply chain integration a reality, Michigan State University,1999.
DTZ Research, DTZ Pieda Consulting, E-commerce and the Physical Transportation ofGoods, 2001.
E-Marketer, The E-Europe report, October 2000.
European Commission, Information Society DG, IST, , Case Studies of the InformationSociety and Sustainable Development, Brussels.
European Commission, Standard & Poor’s DRI and KULeuven, 1999, The AOPII Cost-effectiveness Study, Part III: the Transport Base Case, Draft Final Report, Brussel, 1999.
European Commission, White paper: European transport policy for 2010: time to d ecide,COM(2001) 370, Brussels, 2001.
European Conference of Ministers of Transport (ECMT), Pan-European integration oftransport, a Baseline Scenario for Transport in Europe, CEMT/CM(2001)3/FINAL, Lisbon,2001.

e-commerce
52 PE
Foresight Retail E-commerce Task Force, @Your Service, London: DTI, 2000.
Garreau, A., Overview of the impact of e-commerce on the management of firms, JointOECD/ECMT The impact of e-commerce on transport, session 1: E-commerce – a stock-take, Paris, 5/6 June 2001.
Goor, A.R. van, Ploos van Amstel, M.J., Ploos van Amstel, W., Fysieke distributie: denken intoegevoegde waarde, Houten, 1999.
Holland International Distribution Council, Electronic Commerce and Logistics, The Hague,1998.
Hultkrantz, H., Lumsden, K., E-commerce and consequences for the logistics industry, 2001.
IPTS-JRC, Emerging Thematic Priorities for Research In Europe, Working paper, IPTS,Seville, December 2000.
Iveco, Impacts of e-commerce on physical distribution, Proceedings of the E-distributionforum, Baveno, Italy, September 11-12, 2000.
Jupiter MMXI, "Managing the web’s best customers, profiting from segmentation",European Consumer Commerce, volume 1, April 2001.
Jupiter MMXI, "Online trade, quantifying the benefits", B-to-B Marketing & Commerce,volume 2, July 2001.
Key Note, Express and Courier Market, London, May 2000.
Laseter, T., Houston, P., Chung, A. e.a., "The Last Mile to Nowhere: Flaws & Fallacies inInternet Home Delivery", Strategy + Business, issue 20, 2000.
Lobo I. and Zairi M, "Competitive benchmarking in the air cargo industry", Part 1,Benchmarking, vol 6 no 2, pp 164-190, 1999.
Marker, J T and Goulias K, A Review And Framework For The Analysis Of HouseholdReplenishment And Its Impact On Travel Behaviour And Goods Movement, PennsylvaniaTransportation Institute, University Park, Pennsylvania, 1999.
Ministerie van Verkeer & Waterstaat (MinV&W: Ministry of Traffic & Transport),Joanknecht & Vieveen B.V., Location Based Services, The Hague, 2001.
Nash, S., Logistics & the Internet: How will the Internet affect the logistics industry, 2001.
Nemoto,T., Visser, J., Yoshimoto, R., Impacts of Information and communication technologyon urban logistic systems, Joint OECD/ECMT seminar on The impact of e-commerce ontransport, Paris, 5/6 June 2001.
NERA, Motors and Modems Revisited, National Economic Research Associates, London,2000.
OECD, Understanding the Digital Divide, Paris, 2001 .

e-commerce
53 PE 315.043
OECD, paper published by the OECD Secretariat, Session 1, E-commerce – a stock take,Joint OECD/ECMT seminar on The impact of e-commerce on transport, Paris, 5/6 June2001.
PriceWaterhouseCoopers, The changing shape of European logistics: the e-logistics serviceprovider as the enabler for e-business, 2000.
Ruijgrok, Prof. C. J., Advanced Logistics and ICT, Paper submitted for WCTR, Seoul, July2001.
Smidts, M., Maltha, S., De laatste loodjes wegen het zwaartst. E-commerce en logistiek:probleem van de laatste kilometer, Electronic Commerce Platform Nederland, 2001.
Stephens Inc., Fulfillment: The industry behind the button, version 2.0, Logistics andfulfillment, Industry report, august 2000.
TNO Inro et al, TRILOG-Europe End Report, Delft, October 1999.
TNO Inro, Co-operation in the e-world, Delft, November 2000.
TNO Inro, Locations factors of e-DC’s, Delft, September 2001a.
TNO Inro, Physical distribution in online retailing, an exploration of fundamental layouts fore-logistics, Delft, August, 2001b.
TNO Inro, Space for the digital economy, Exploration of the relations between ICT andspatial-economic development, Delft, April 2001 .
TNO Inro, World Watch, impacts of the New Economy on logistics, transport and space,Delft, June 2001.
Transport en Logistiek Nederland (TLN), Nieuwe wijn in oude zakken (New wine in oldbottles), TLN Research department, June 2000.
TRT, TNO Inro, Transport infrastructure and policy: a macroeconomic analysis for the EU,deliverable D1: common assumptions and scenarios, draft report, Project funded by the ECunder the Competitive and sustainable growth thematic programme of the 5 th RTDFramework program, Milan, 2001.
Visser, J.G.S.N and Temoto, T., E-commerce and the consequences for freight transport,Joint OECD/ECMT seminar on The impact of e-commerce on transport, Paris, 5/6 June2001.
Yrjölä, H., Physical distribution considerations for electronic grocery shopping, ECOMLOGresearch program, Helsinki University of Technology, 2001.

e-commerce
54 PE
Internet sites
http://cyberatlas.internet.com/http://europa.eu.int/comm/eurostat/http://www.ahold.nlhttp://www.albert.nlhttp://www.automatiseringsgids.nl/http://www.bostonconsulting.nl/http://www.census.gov/http://www.dedigitalerevolutie.nl/http://www.ecommercetimes.com/http://www.ecp.nl/http://www.elogistics.com , Case study Toshiba Information Systems, white paperhttp://www.emerce.nl/http://www.europeprofile.com/http://www.forrester.com/http://www.gartner.com/http://www.ifpi.org/site-content/publications/rin_order.htmlhttp://www.idc.com/http://www.jupitermmxi.com/http://www.lsh-ni.co.uk/http://www.multiscope.nl/http://www.nua.comhttp://www.oecd.org/http://www.retailing.net/http://www.riaa.com/http://www.tesco.comhttp://www.tln.nlhttp://www.werc.org
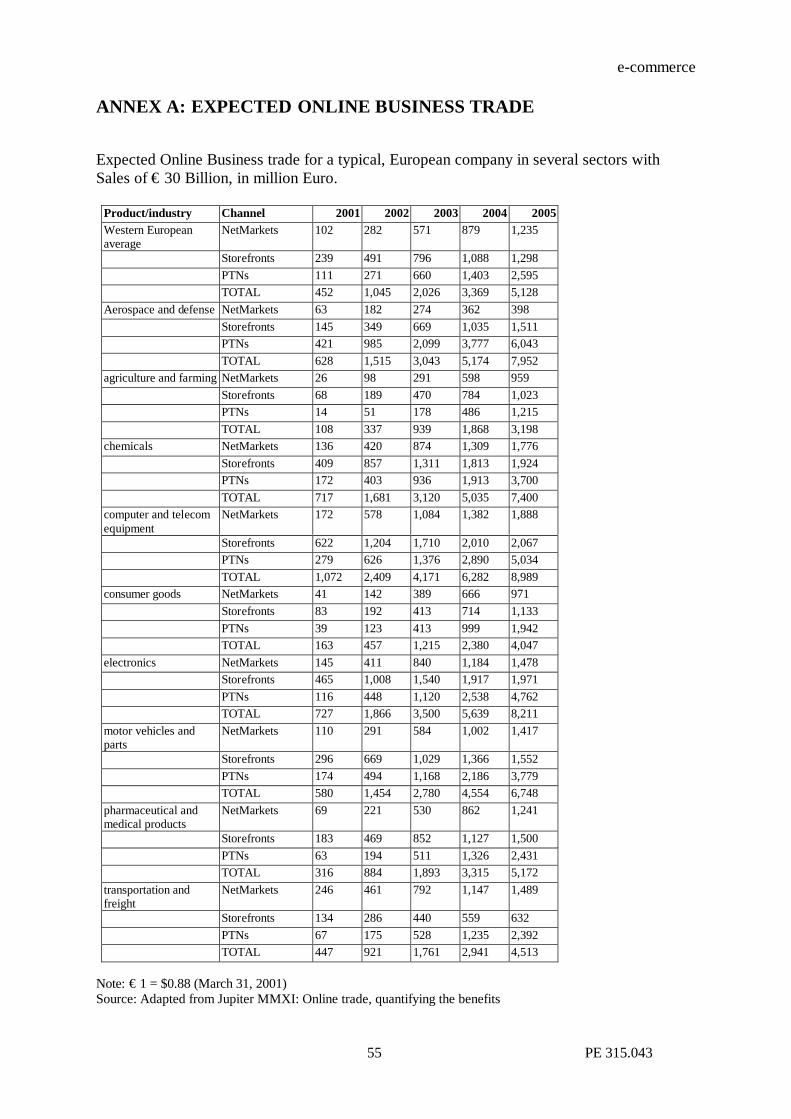
e-commerce
55 PE 315.043
ANNEX A: EXPECTED ONLINE BUSINESS TRADE
Expected Online Business trade for a typical, European company in several sectors withSales of € 30 Billion, in million Euro.
Product/industry Channel 2001 2002 2003 2004 2005Western Europeanaverage
NetMarkets 102 282 571 879 1,235
Storefronts 239 491 796 1,088 1,298PTNs 111 271 660 1,403 2,595TOTAL 452 1,045 2,026 3,369 5,128
Aerospace and defense NetMarkets 63 182 274 362 398Storefronts 145 349 669 1,035 1,511PTNs 421 985 2,099 3,777 6,043TOTAL 628 1,515 3,043 5,174 7,952
agriculture and farming NetMarkets 26 98 291 598 959Storefronts 68 189 470 784 1,023PTNs 14 51 178 486 1,215TOTAL 108 337 939 1,868 3,198
chemicals NetMarkets 136 420 874 1,309 1,776Storefronts 409 857 1,311 1,813 1,924PTNs 172 403 936 1,913 3,700TOTAL 717 1,681 3,120 5,035 7,400
computer and telecomequipment
NetMarkets 172 578 1,084 1,382 1,888
Storefronts 622 1,204 1,710 2,010 2,067PTNs 279 626 1,376 2,890 5,034TOTAL 1,072 2,409 4,171 6,282 8,989
consumer goods NetMarkets 41 142 389 666 971Storefronts 83 192 413 714 1,133PTNs 39 123 413 999 1,942TOTAL 163 457 1,215 2,380 4,047
electronics NetMarkets 145 411 840 1,184 1,478Storefronts 465 1,008 1,540 1,917 1,971PTNs 116 448 1,120 2,538 4,762TOTAL 727 1,866 3,500 5,639 8,211
motor vehicles andparts
NetMarkets 110 291 584 1,002 1,417
Storefronts 296 669 1,029 1,366 1,552PTNs 174 494 1,168 2,186 3,779TOTAL 580 1,454 2,780 4,554 6,748
pharmaceutical andmedical products
NetMarkets 69 221 530 862 1,241
Storefronts 183 469 852 1,127 1,500PTNs 63 194 511 1,326 2,431TOTAL 316 884 1,893 3,315 5,172
transportation andfreight
NetMarkets 246 461 792 1,147 1,489
Storefronts 134 286 440 559 632PTNs 67 175 528 1,235 2,392TOTAL 447 921 1,761 2,941 4,513
Note: € 1 = $0.88 (March 31, 2001)Source: Adapted from Jupiter MMXI: Online trade, quantifying the benefits

e-commerce
56 PE
ANNEX B: EVALUATION OF COLLECTION POINTS –DESCRIPTION OF CRITERIA
− Access refers to the accessibility of the prospective facility, is it within walking distance orwithin a short car-journey?
− Geographic coverage is the concentration of facilities throughout the UK.− Management expertise reflects the extent to which operators have the necessary experience
to manage this element in the supply chain.− Capacity indicates if existing uses have the necessary capacity to provide additional
services.− The market structure reflects the pattern and concentration of ownership in the se ctor.
Nation-wide facilities owned and operated by a small number of companies (grocerymarket) is likely to be more attractive than a nation-wide market dominated by smallindependents.
− The criteria of Value Added show the likelihood of the use of the facility as a collectionpoint to add value to the original activity.
− Planning/Traffic refers to a particular constraint on either traffic or planning grounds, suchas a lack of parking spaces.
− Returns indicate the easiness to make a return using the delivery system.− Mindset refers to the fact that frequently visited destinations are more likely to be attractive
as a collection point.− Finally, branding indicates the opportunity to brand the collection point as an entity in its
own right. Source: Adapted from : DTZ Research, 2001