the impact of dynamic capabilities on resource access and
TRANSCRIPT

This article was downloaded by: [129.170.194.153] On: 13 September 2016, At: 13:19Publisher: Institute for Operations Research and the Management Sciences (INFORMS)INFORMS is located in Maryland, USA
Organization Science
Publication details, including instructions for authors and subscription information:http://pubsonline.informs.org
The Impact of Dynamic Capabilities on Resource Accessand DevelopmentChristian Stadler, Constance E. Helfat, Gianmario Verona
To cite this article:Christian Stadler, Constance E. Helfat, Gianmario Verona (2013) The Impact of Dynamic Capabilities on Resource Access andDevelopment. Organization Science 24(6):1782-1804. http://dx.doi.org/10.1287/orsc.1120.0810
Full terms and conditions of use: http://pubsonline.informs.org/page/terms-and-conditions
This article may be used only for the purposes of research, teaching, and/or private study. Commercial useor systematic downloading (by robots or other automatic processes) is prohibited without explicit Publisherapproval, unless otherwise noted. For more information, contact [email protected].
The Publisher does not warrant or guarantee the article’s accuracy, completeness, merchantability, fitnessfor a particular purpose, or non-infringement. Descriptions of, or references to, products or publications, orinclusion of an advertisement in this article, neither constitutes nor implies a guarantee, endorsement, orsupport of claims made of that product, publication, or service.
Copyright © 2013, INFORMS
Please scroll down for article—it is on subsequent pages
INFORMS is the largest professional society in the world for professionals in the fields of operations research, managementscience, and analytics.For more information on INFORMS, its publications, membership, or meetings visit http://www.informs.org

OrganizationScienceVol. 24, No. 6, November–December 2013, pp. 1782–1804ISSN 1047-7039 (print) � ISSN 1526-5455 (online) http://dx.doi.org/10.1287/orsc.1120.0810
© 2013 INFORMS
The Impact of Dynamic Capabilities onResource Access and Development
Christian StadlerWarwick Business School, Coventry, CV4 7AL, United Kingdom, [email protected]
Constance E. HelfatTuck School of Business at Dartmouth, Hanover, New Hampshire 03755, [email protected]
Gianmario VeronaBocconi University, Milan, Italy 20136, [email protected]
This study analyzes dynamic capabilities that support activities directed toward accessing resources and further develop-ing resources to make them commercially usable. We develop theory and empirically investigate the impact of dynamic
capabilities on the amount and success of these activities and whether the impact of dynamic capabilities differs betweenthe two types of activities. Using unique data from the upstream oil industry, we develop an objective measure of dynamiccapability that is distinct from the outcomes of utilizing these capabilities. We find that firms with more sophisticateddynamic capabilities undertake greater amounts of activity to access resources and further develop them prior to commercialuse; they also have greater success in these activities. Finally, these effects of dynamic capabilities are larger for activitiesdirected toward initially accessing resources than those directed toward further developing them, which is consistent withthe potential for firms to rely on knowledge gained through resource access activity when conducting subsequent activityto further develop resources.
Key words : dynamic capabilities; resources; exploration; capability measurement; activitiesHistory : Published online in Articles in Advance February 28, 2013.
IntroductionResources that firms own, control, or have access to on asemipermanent basis affect competitive outcomes (Amitand Schoemaker 1993, Barney 1991, Helfat and Peteraf2003, Peteraf 1993, Wernerfelt 1984). Although firmssometimes stumble on valuable resources, firms oftenpurposefully undertake activities to obtain resources andfurther develop these resources prior to commercial use.In carrying out these activities, firms may use dynamiccapabilities, which can serve a variety of purposes,including the creation, extension, and modification ofresources (Helfat et al. 2007). In this study, we analyzedynamic capabilities directed toward obtaining resourcesand further developing them to the point where they arecommercially usable. Although new resources frequentlyrequire additional development, research on dynamiccapabilities generally has not investigated stages inbringing resources to the point of commercial use. Here,we develop a theory and empirically investigate whetherdynamic capabilities affect the amount of activity thatfirms conduct to obtain and further develop resources, aswell as the success of these two types of activities. Wealso investigate whether the impact of dynamic capabil-ities differs between these two activities.
Research on both firm resources and dynamic capabil-ities tends to focus on performance outcomes; however,it is important to unpack how these outcomes come
about, lest we draw spurious conclusions (see, e.g.,Ketchen et al. 2007). For example, dynamic capabili-ties may affect not only the success of activities directedtoward change but also how much of these activitiesfirms undertake in the first place—a distinction gener-ally not addressed in prior research. Moreover, accurateassessment of the direct effect of dynamic capabilitieson the success of activities requires that we control forany indirect effect through the amount and type of activ-ity. In addition, research has yet to examine whether theeffects of dynamic capabilities differ between the initialobtaining of resources and their further development. Inparticular, because firms may be able to rely on knowl-edge gained through the activity of obtaining resourceswhen they are further developing those resources forcommercial use, firms may have less need for dynamiccapabilities during later stages of resource development.
Following similar usage by Wernerfelt (1984), Amitand Schoemaker (1993), and Helfat and Peteraf (2003),in this study the term “resource” denotes a tangible,intangible, or human asset that a firm owns, controls,or has access to through other means on a semiper-manent basis.1 Firms can obtain resources in manyways, including creating new resources from scratch orrecombining existing resources, such as through busi-ness unit reorganization (Karim 2009); finding resourcesthat may exist in the external environment but that the
1782
Dow
nloa
ded
from
info
rms.
org
by [
129.
170.
194.
153]
on
13 S
epte
mbe
r 20
16, a
t 13:
19 .
For
pers
onal
use
onl
y, a
ll ri
ghts
res
erve
d.
Stadler, Helfat, and Verona: The Impact of Dynamic Capabilities on Resource Access and DevelopmentOrganization Science 24(6), pp. 1782–1804, © 2013 INFORMS 1783
firm does not possess, such as not-yet-discovered phys-ical assets; investing in plants and equipment; and buy-ing resources from others, including through mergersand acquisitions (Capron and Mitchell 1998). In thisstudy, we use the term “resource access” (as a noun) todenote the obtainment of resources and “resource accessactivity” to denote an activity directed toward obtain-ing resources.2 In addition, firms sometimes may fur-ther develop newly obtained resources, such as through aprocess of postmerger integration of acquired resources(Capron and Mitchell 1998). Here, the term “resourcedevelopment” (used as a noun) denotes further devel-opment of resources subsequent to resource access,and “resource development activity” denotes an activitydirected toward further resource development.
This study deals with access and development ofresources prior to commercial use, as opposed to theday-to-day procurement of inputs for ongoing commer-cial activity. Commercial use of a resource begins whenthe resource is first used to support the production, deliv-ery, or sales of a product or service that can be soldin the external market. This applies to intermediate aswell as final products and services. For example, semi-conductors are intermediate products used in comput-ers and other devices downstream in the vertical chain;because semiconductors are products distinct from com-puters and other downstream products, it is possible toanalyze access and development of resources for semi-conductors separately.
As noted above, dynamic capabilities may under-pin activities directed toward both resource access andresource development. Following Teece et al. (1997),researchers have often viewed dynamic capabilities asespecially important in rapidly changing environments.But as Eisenhardt and Martin (2000) observe, dynamiccapabilities also matter in “moderately dynamic” envi-ronments. In addition, Helfat and Winter (2011) note thatfirms can and do utilize dynamic capabilities on a regu-lar basis, even in relatively placid environments. In thisstudy, we examine dynamic capabilities in an industry inwhich the external environment shifted from relativelystable to much more variable—the upstream oil indus-try. Using unique hand-collected data, we analyze theextent to which dynamic capabilities affect the amountof activity that firms direct toward access and develop-ment of resources in the form of oil and gas reserves, aswell as the success of these activities.
This study makes several contributions. First,we develop new theory regarding dynamic capabilitiesthrough an analysis of (1) stages of resource access anddevelopment prior to commercial use; (2) the impact ofdynamic capabilities on not only the success but alsothe amount of these activities; and (3) how knowledgegained during resource access activity may affect theneed for, and impact of, dynamic capabilities duringresource development activity. In addition, we advance
empirical analysis of dynamic capabilities. Such empir-ical research is relatively sparse and consists largelyof case studies (Di Stefano et al. 2010). Quantitativemeasurement of capabilities has posed a number ofchallenges, including the difficulty of obtaining objec-tive measures rather than those derived from surveys,as well as the difficulty of measuring capabilities sep-arately from outcomes of capability utilization (Grantand Verona 2013). Here, we empirically test hypothesesderived from our theoretical analysis using an objective,quantitative, relatively fine-grained measure of dynamiccapabilities that reflects the potential to conduct activi-ties rather than subsequent outcomes.
In what follows, we first analyze theoretical issuesrelevant to our study and derive new hypotheses regard-ing the impact of dynamic capabilities on the amountand success of activities directed toward resource accessand development, as well as differences in this impactbetween the two activities. We then describe the industrysetting and our data, followed by an explanation of thevariables, including our empirical measure of dynamiccapabilities. We also explain our statistical methodol-ogy. We then present the empirical results and discussthe findings. The paper concludes with implications forfuture research.
Theoretical DevelopmentAttributes of Dynamic CapabilitiesTeece et al. (1997, p. 516) originally defined dynamiccapabilities as “the firm’s ability to integrate, build,and reconfigure internal and external competences.”They explained that this included “adapting, integrat-ing, and reconfiguring internal and external organiza-tional skills, resources, and functional competences’’(Teece et al. 1997, p. 515). Eisenhardt and Martin (2000,p. 1107) subsequently defined dynamic capabilities as“[t]he firm’s processes that use resources—specificallythe processes to integrate, reconfigure, gain and releaseresources” and “the organizational and strategic rou-tines by which firms achieve new resource configura-tions.” Helfat et al. (2007, p. 4) synthesized and refinedthese definitions in defining dynamic capabilities as“the capacity of an organization to purposefully create,extend, or modify its resource base.”
In the definition of Helfat et al. (2007), the term“resource base” includes both the resources and capabil-ities (also frequently termed “competences” or “skills”)of an organization.3 Additionally, “the word ‘capacity’refers to the ability to perform a task in at least a mini-mally acceptable manner” (Helfat et al. 2007, p. 5), and“implies that the function that a dynamic capability per-forms is repeatable and can be reliably executed to atleast some extent” (Helfat et al. 2007, p. 5). A dynamiccapability therefore tends to improve the execution ofan activity, relative to one-time ad hoc problem solving
Dow
nloa
ded
from
info
rms.
org
by [
129.
170.
194.
153]
on
13 S
epte
mbe
r 20
16, a
t 13:
19 .
For
pers
onal
use
onl
y, a
ll ri
ghts
res
erve
d.

Stadler, Helfat, and Verona: The Impact of Dynamic Capabilities on Resource Access and Development1784 Organization Science 24(6), pp. 1782–1804, © 2013 INFORMS
(Winter 2003). Helfat and Winter (2011, p. 1244) elabo-rate that “minimally satisfactory” means that the outputof a task or activity is “recognizable as such, and func-tions at least minimally as intended,” 4 but it “impliesnothing about economic viability, much less superiorperformance.” 5 Moreover, “because organizations varyin how well they perform an activity,” the definitionof dynamic capability does not constitute a tautologywith respect to superior performance (Helfat and Winter2011, p. 1244; see also Helfat et al. 2007). That is,although the definition of a dynamic capability impliesthe capacity to perform a particular activity at a mini-mally satisfactory threshold of performance, firms varyin how well their dynamic capabilities enable them toaccomplish an activity; to say that a firm has a dynamiccapability says little about how well that capability per-forms its intended function above some minimal stan-dard of functionality or about the resulting economicperformance.
An organizational capability has been described invarious ways, including as a “high-level routine (or col-lection of routines)” (Winter 2003, p. 991). Organiza-tional routines are executed by teams of people whounderstand the routines and utilize them when needed.The characteristics of routines—including the communi-cation and coordination procedures involved—are criti-cal attributes of a capability. A capability and its associ-ated routines confer the potential to carry out an activity.If and when a capability is called into use, that capa-bility enables a firm to carry out an activity, which inturn produces an outcome; through this route, capabil-ities affect the outcomes of activities. Like all capa-bilities, dynamic capabilities typically are maintainedthrough exercise (Winter 2003). And like all capabili-ties, dynamic capabilities may not always be exercised attheir full potential. For example, a product developmentteam that executes the routines that comprise a dynamiccapability may need to devote more effort when seekingto add many new features to a product than when seek-ing to add a single, easy-to-configure feature to the prod-uct. Thus, the extent to which an organization utilizes aparticular capability (dynamic or otherwise) depends oncircumstances, including the difficulty of the task.
What differentiates dynamic from nondynamic capa-bilities is the nature of the activities in question. Nondy-namic capabilities, often termed “operational” or “ordi-nary” (Winter 2003), are directed toward maintainingthe status quo. An operational capability “enables a firmto perform an activity on an on-going basis using moreor less the same techniques on the same scale to sup-port existing products and services for the same cus-tomer population” (Helfat and Winter 2011, p. 1244).In contrast, a dynamic capability is directed toward alter-ing how a firm earns a living (Winter 2003, Helfat andWinter 2011). These capabilities have specific purposesand support specific activities within a particular context;
they are not “a generic capacity to undertake change”(Helfat and Winter 2011, p. 1245; see also Winter 2003).
A firm may seek to alter how it makes a living in avariety of ways, such as by changing its products, scaleof operations, production processes, or markets served,which often entails alterations in the scale and scope ofresources (Winter 2003, Helfat and Winter 2011). Manyactivities directed toward altering the scale and scopeof resources may rely on dynamic capabilities, includ-ing activities associated with research and development(R&D), new product development, investments, merg-ers and acquisitions, and alliances (Helfat 1997, Eisen-hardt and Martin 2000, Helfat et al. 2007). Firms alsomay use dynamic capabilities in an effort to shape orreshape their external ecosystems (Teece 2007), includ-ing by altering the scale or scope of resources. Forexample, a firm may use its (dynamic) strategic plan-ning capabilities to craft and implement an investment ina new plant (a resource) with the intention of affectingthe behavior of competitors (Helfat and Winter 2011). Inthis study, we focus on alterations in the scale and scopeof resources, and we examine the impact of dynamiccapabilities on the amount and outcome of activities thatfirms undertake to obtain resources and, if needed, tofurther develop them prior to commercial use.
Helfat and Winter (2011, p. 1245) note that “althoughdynamic and operational capabilities differ in their pur-poses and intended outcomes 0 0 0 it is impossible to draw abright line” between the two types of capabilities. Whichcapabilities then might reasonably be termed “dynamic,”in the sense that they have important dynamic aspects?Helfat and Winter (2011, p. 1249) argue that capa-bilities that aim to “promote economically significantchange are dynamic, even if the pace of change appearsslow or undramatic.” They provided several examplesof dynamic capabilities that support arguably nonradicalyet economically significant resource change, includingIntel’s capability to repeatedly create new semiconductordesigns and thereby support new product introductions,Walmart’s capability to repeatedly open new retail outletsand thereby extend the scale of operations and the geo-graphic scope of markets, and oil company capabilitiesto repeatedly discover new reserves and thereby extendthe scale and characteristics of company resources. Asthese examples suggest, “dynamic capabilities often sup-port existing businesses” but over time can irrevoca-bly alter “the scale and scope of company resources,”despite the seemingly gradual pace of change (Helfat andWinter 2011, p. 1249).
In some cases, resources develop over time throughslow processes of resource accumulation (Dierickxand Cool 1989). Dynamic capabilities, however, mayenable companies to speed up the process of devel-oping resources, as in Intel’s capability to create newsemiconductor designs that resulted in the commercial
Dow
nloa
ded
from
info
rms.
org
by [
129.
170.
194.
153]
on
13 S
epte
mbe
r 20
16, a
t 13:
19 .
For
pers
onal
use
onl
y, a
ll ri
ghts
res
erve
d.
Stadler, Helfat, and Verona: The Impact of Dynamic Capabilities on Resource Access and DevelopmentOrganization Science 24(6), pp. 1782–1804, © 2013 INFORMS 1785
introduction of a new chip every 18–24 months (Helfatand Winter 2011). In many industries, the processthrough which resources move from inception to com-mercial use occurs in distinct stages. Although firmsobtain some resources that need no additional develop-ment prior to commercial use, such as equipment thatcan be used without modification, many resources dorequire further development.
Examples of Dynamic Capabilities UnderpinningResource Access and Development ActivitiesIndustries in which firms utilize a staged process ofresource access and development activities include phar-maceuticals (Henderson 1994, Severi Bruni and Verona2009), semiconductors (Leiblein and Madsen 2009), andplatform product industries (Shane 2009). For exam-ple, when pharmaceutical companies seek new drugsfor commercial production and sale, the process beginswith research activity directed toward discovery of newmolecular compounds, termed “drug discovery.” Com-panies in this industry regularly seek to obtain resourcesin the form of new molecular compounds for at leasttwo reasons. First, drugs based on new molecular com-pounds can provide sources of revenue and growth.Second, because drugs are significantly more profitablewhen they are patented than when they are not, andbecause patents have a limited lifetime, pharmaceuti-cal companies regularly seek new molecular compounds.This involves screening large numbers of compounds todiscover ones that may address a particular disease orhealth problem. In addition, firms can attempt to createnew compounds through molecular manipulation. If drugdiscovery R&D results in a promising compound, a com-pany may undertake additional preclinical R&D to fur-ther analyze the properties of the molecules and assesspotential side effects and toxicity, conduct clinical trialsin humans, and file for regulatory approval of the drug.The term “drug development” often is used to refer toactivities in the preclinical and clinical stages of devel-opment, and usage of the term sometimes includes filingfor regulatory approval as well.6
When firms regularly conduct activities directedtoward drug discovery and development, they are likelyto invest in developing the requisite capabilities. Suchcapabilities are dynamic, in that they support activi-ties to obtain new resources (molecular compounds andknowledge) through drug discovery and modify theseresources through drug development, enabling firmsto extend and modify their resource bases. Althoughdynamic capabilities that support drug discovery anddevelopment activity can result in fundamentally newdrugs, these capabilities also can enable firms to obtainand further develop molecular compounds that reflectincremental changes from the past—consistent with theobservation that dynamic capabilities need not result inradical change or in qualitatively new types of resources.
The semiconductor industry provides another exam-ple of resource access followed by resource develop-ment. According to Leiblein and Madsen (2009, p. 721),“Throughout the industry’s history, and particularly sincethe early 1980s, successive innovations in process tech-nology have improved product performance by reduc-ing the physical dimensions of semiconductor devices.”Much of the success of this industry has come fromobtaining new process technologies (resources) that firmsfurther develop and incorporate into designs for newsemiconductor devices. As an example, Leiblein andMadsen (2009) describe the company Silicon StorageTechnology, Inc. (SST), which designed a flash memorychip based on its “SuperFlash” process technology.
Other industries in which resource access and devel-opment occur in stages include many product platformbusinesses. A product platform is “a common tech-nological base to which different features are added,to create a family of products each targeted at dif-ferent customers” (Shane 2009, p. 151). Although adetailed description of product platforms is beyond thescope of this analysis, in Shane’s summary descrip-tion, the common technological base can be considereda resource, which is then further developed by addingdifferent features. Platforms are used in many indus-tries, including automobiles, computers, cameras, videogames, and websites.
The foregoing examples revolve around process tech-nology innovation and new product development activ-ities, which often involve stages of resource access anddevelopment. These activities are common in many sec-tors of the economy, including electronics, consumerproducts, and complex manufacturing. The empiricalsetting in this study provides yet another example ofaccess and development of resources in the form ofoil and gas reserves. We develop hypotheses regard-ing dynamic capabilities that underpin activities directedtoward resource access and development prior to com-mercial use, and we then test these hypotheses in theupstream U.S. oil and gas industry. Ongoing commer-cial use of a resource involves operational rather thandynamic capabilities and is not the subject of this study.
The Amount and Success of Resource Access andDevelopment ActivitiesFrom an economic perspective, firms conduct activitiesto obtain and further develop resources in order to gener-ate profits in the future. When deciding whether to con-duct specific activities directed toward resource accessand development, firms make a forecast of anticipatedprofits to these activities (even if a rough forecast ofwhether or not these activities eventually may pay off),and then they decide how much effort and expenditureto devote to them.7 As we explain next, dynamic capa-bilities may affect the anticipated financial payoff from
Dow
nloa
ded
from
info
rms.
org
by [
129.
170.
194.
153]
on
13 S
epte
mbe
r 20
16, a
t 13:
19 .
For
pers
onal
use
onl
y, a
ll ri
ghts
res
erve
d.

Stadler, Helfat, and Verona: The Impact of Dynamic Capabilities on Resource Access and Development1786 Organization Science 24(6), pp. 1782–1804, © 2013 INFORMS
undertaking activities directed toward resource accessand development.
Within an industry, capabilities tend to vary across firmsin their attributes (Nelson 1991; Helfat 1994a, 1994b;Helfat and Peteraf 2003; Hoopes et al. 2003). Theattributes of a dynamic capability, i.e., the characteristicsof its routines, confer the potential to achieve a particularoutcome from conducting an activity. Even when firmshave the same type of dynamic capability, the cost ofthe capability is likely to differ across firms, because theattributes of the capability differ between firms.8 In addi-tion, differences between firms in the attributes of adynamic capability are likely to lead to differences in thepotential value of output (from the amount or quality ofoutput) or the cost of conducting an activity (other thanthe cost of the capability itself). In the case of resourceaccess or development, the output of an activity consistsof a resource or set of resources that is obtained or devel-oped, and costs include those of the dynamic capabilityas well as of conducting resource access or develop-ment activity. All else being equal, when the attributesof a dynamic capability have the potential to yield lowercosts and/or higher value of output from an activity, afirm has an economic incentive to undertake more ofthe activity that the capability supports. Hypothesis 1reflects this logic when applied to resource access anddevelopment.
Hypothesis 1. All else being equal, when the attri-butes of dynamic capabilities confer greater potentialfor lower costs and/or higher value of output, firms willundertake greater amounts of activity directed towardresource access and greater amounts of activity directedtoward resource development.
Dynamic capabilities and their attributes may alsoaffect the success of activities directed toward resourceaccess and development, independent of an effect on theamount of activity. Certainly, if all else is equal, con-ducting more of these activities is likely to enable firmsto obtain and further develop more resources. However,the impact of dynamic capabilities on the success of anactivity does not necessarily come only from an impacton the amount of activity. In particular, because firmsface variation in the opportunities available to them, dif-ferent firms have different opportunities to undertakeresource access and development activities. As a result,the attributes of dynamic capabilities do not perfectlypredict the amount of activity that firms will undertake toobtain or further develop resources. Instead, firms withsimilar amounts of activity may differ in the attributes oftheir dynamic capabilities. Firms whose dynamic capa-bilities have attributes that confer the potential for lowercosts and/or a higher value of output are likely to havemore successful outcomes from conducting an activity.This logic implies the following.
Hypothesis 2. All else being equal, when the attri-butes of dynamic capabilities confer greater potential forlower costs and/or a higher value of output, firms willhave greater success in resource access and in resourcedevelopment, controlling for the amount of the respectiveactivity.
Resource Access vs. Resource DevelopmentBoth resource access and development can pose sig-nificant challenges for firms. The more difficult it isto accomplish these activities, the more useful dynamiccapabilities may be, because these capabilities providethe capacity to carry out activities somewhat reliably.Although dynamic capabilities entail costs, firms maybe willing to bear them if the returns to the associatedactivities would otherwise be lower. For less difficultactivities, firms may be able to rely more heavily onad hoc approaches that do not entail costs associatedwith dynamic capabilities (Winter 2003). That is, eventhough ad hoc approaches may be less reliable, for lessdifficult tasks, the benefits conferred by dynamic capa-bilities may not be high enough to warrant the extra cost.
The relative difficulty of activities directed towardresource access versus resource development depends onmany factors. In some cases, it may be easier to obtaina resource (such as purchasing an asset) than to developit into a commercially usable form. In other instances,it may be at least as or even more difficult to obtain aresource (such as creating a new-to-the-world technol-ogy) than to develop it further. In at least one respect,however, the difficulty of obtaining resources and thedifficulty of developing them further differs systemat-ically. When seeking to obtain new resources, a firmgenerally lacks prior direct knowledge of the resourcesin question because it has yet to obtain them.
For example, in the pharmaceutical industry, firmsengaged in drug discovery lack prior direct knowledgeof new molecular compounds that they seek but haveyet to discover. In contrast, when firms undertake activi-ties to further develop or modify resources, they alreadyhave some prior direct knowledge of the resources inquestion (even for a purchased asset, as a result of priordue diligence). Thus, in the pharmaceutical industry, pre-clinical R&D activity to further develop a drug reliesin part on the knowledge about a molecular compoundgained during drug discovery (Severi Bruni and Verona2009). Holding constant all other factors, the lack ofthis prior direct knowledge is likely to increase the diffi-culty of resource access (e.g., drug discovery) relative tothe difficulty of resource development (e.g., drug devel-opment). Consistent with this logic, drug developmentactivity on average has much higher rates of successthan does drug discovery; this is due in part to priordirect knowledge of the compound in question duringdrug development (McGahan 1995).
Dow
nloa
ded
from
info
rms.
org
by [
129.
170.
194.
153]
on
13 S
epte
mbe
r 20
16, a
t 13:
19 .
For
pers
onal
use
onl
y, a
ll ri
ghts
res
erve
d.

Stadler, Helfat, and Verona: The Impact of Dynamic Capabilities on Resource Access and DevelopmentOrganization Science 24(6), pp. 1782–1804, © 2013 INFORMS 1787
In some instances, firms may have prior knowledgeof resources that are similar but not identical to thosethat they seek to obtain. This sort of indirect priorknowledge, however, does not entirely eliminate theimportance of direct knowledge of the resources inquestion. In the pharmaceutical industry, for example,prior knowledge of a category of drugs may make iteasier to formulate new drugs in this category, but itdoes not appear to greatly improve knowledge aboutwhether the newly formulated drug will actually work(Severi Bruni and Verona 2009).
These arguments imply that, if all else is equal,firms may have less need to utilize dynamic capabili-ties for activities directed toward resource developmentthan resource access, because prior direct knowledge ofthe resources in question reduces the difficulty of devel-oping resources relative to obtaining them. Therefore,dynamic capabilities and their attributes may have lessimpact on the anticipated returns to resource develop-ment activities than on the returns to resource accessactivities, holding constant factors other than a lack ofprior direct knowledge of the resources in question.Thus, when firms decide how much activity to undertakein light of anticipated returns, the attributes of dynamiccapabilities are likely to have less impact on the amountof resource development activity than on the amount ofresource access activity. The following hypothesis sum-marizes this logic.
Hypothesis 3. All else being equal, the attributes ofdynamic capabilities will have less impact on the amountof activity directed toward resource development thanresource access.
Finally, the impact of dynamic capabilities and theirattributes on the success of an activity may differfor resource access and resource development. As justargued, dynamic capabilities may be less important forresource development than for resource access becauseof differences in prior direct knowledge of the resourcesin question. Consequently, holding constant factors otherthan prior direct knowledge of resources and controllingfor the amount of activity, the incremental impact of theattributes of dynamic capabilities on the success of activ-ities directed toward resource development is likely to beless than for resource access. The following hypothesisreflects this logic.
Hypothesis 4. All else being equal, the attributes ofdynamic capabilities will have less impact on the successof activity directed toward resource development thanon resource access, controlling for the amount of eachactivity.
Empirical Setting: Upstream Oil IndustryThe upstream oil industry provides an excellent set-ting in which to test our hypotheses. Activities in this
industry fall into three categories: oil exploration, oildevelopment, and production. Through oil exploration,an industry term for activities directed toward obtainingoil and gas reserves, firms seek to obtain new physi-cal resources. Through what is termed oil development,firms undertake activities aimed at developing oil andgas reserves to the point where they are commerciallyusable. If oil development activity is successful, firmscan then bring the reserves into commercial use throughproduction. Because of our interest in resource accessand development, this study analyzes only oil explo-ration and development and does not analyze extractionof reserves through production.9
Oil exploration and development activities have manyfeatures in common with resource access and devel-opment activities in the pharmaceutical industry. Drugsproduced by the pharmaceutical industry rest on the dis-covery of new resources (molecular compounds); crudeoil and natural gas produced by the upstream oil indus-try rest on the discovery of new resources (under-ground reserves). Like molecular compounds, no twogeologic reservoirs are the same, and they often differsubstantially.10 Moreover, firms in both industries havelong since exhausted the easy-to-discover resources; as aresult, success in obtaining new resources in both indus-tries is far from assured. In addition, newly discoveredresources in these industries require additional resourcedevelopment activity prior to commercial use, and suc-cess in further resource development is not a foregoneconclusion. As in the pharmaceutical industry, resourceaccess and development in the upstream oil industryinvolve activities that can benefit from dynamic capa-bilities, as explained in more detail below. Additionally,like firms in the pharmaceutical industry, firms in theupstream oil industry regularly conduct resource accessand development activities in an effort not only to aug-ment their revenue streams but also to replace previouslyhighly productive resources that have fallen in value(as a result of patent expirations in the pharmaceuticalindustry and oil reservoir depletion in the upstream oilindustry).
As often occurs in the pharmaceutical industry, activi-ties directed toward resource access and development inthe upstream oil industry do not necessarily result in rad-ical changes to company resources, but they neverthelessmay have a substantial impact on the resource base of afirm. Finch et al. (2002, p. 969) observe that “[a] criti-cal activity for companies involved in the upstream oiland gas industry is deciding whether or not to invest indeveloping hydrocarbon prospects.” As explained below,activities directed toward obtaining and further devel-oping reserves in this industry rely on capabilities todeploy sophisticated and complex seismic imaging andwell drilling technologies, which are key to identifyinghydrocarbon reservoirs and managing their development
Dow
nloa
ded
from
info
rms.
org
by [
129.
170.
194.
153]
on
13 S
epte
mbe
r 20
16, a
t 13:
19 .
For
pers
onal
use
onl
y, a
ll ri
ghts
res
erve
d.

Stadler, Helfat, and Verona: The Impact of Dynamic Capabilities on Resource Access and Development1788 Organization Science 24(6), pp. 1782–1804, © 2013 INFORMS
(Acha 2002). These core activities have important strate-gic implications. As Weston et al. (1999) note, oil com-panies tend to face declining stock prices when they failto replace depleted oil reserves.
Resource Access and Development in Upstream OilThe process that firms undergo in an effort to find anddevelop crude oil and natural gas reserves prior to pro-duction is as follows.11 Companies first purchase or leaseland in anticipation of searching for oil in a specific loca-tion. Then they collect and interpret seismic data regard-ing geologic formations underground, from which theyform a preliminary estimate of the number of hydrocar-bons that a tract may hold. (In some instances, firmsmay also be able to conduct preliminary seismic imag-ing studies prior to purchasing or leasing land.) Seismictechnology has advanced from two-dimensional (2D)to three-dimensional (3D), and more recently to four-dimensional (4D), imaging.12 All upstream oil firms inoperation today can utilize 2D technology. 3D technol-ogy was less common in the 1990s and is becomingmore standard today; 4D imaging represents cutting-edge technology, and only a small number of firms cancarry out this sort of imaging.
This process of seismic imaging entails the utilizationof highly sophisticated equipment in the field, along withadvanced computing technology and interpretation ofinformation gained from its use, involving the coordina-tion of teams of geologists, geophysicists, engineers, andproject management personnel. As Helfat and Winter(2011) note, the complexity and coordination of thetasks involved in seismic imaging activity, as well as itsrepeated nature, point to an underlying capability andassociated routines.
If the results of the seismic imaging studies appearpromising, firms undertake exploratory drilling to obtainadditional information about how much oil a tract ofland may contain. The simplest and least technologi-cally sophisticated approach is to drill a vertical wellusing a rotary drill. Although this technology has beenin use since the early 20th century, it is still com-monly employed today because of its relatively low cost.In some cases, however, the topography of an oil reser-voir makes it impossible to drill effectively using onlyvertical wells. In the 1940s, the first experiments tookplace using directional wells, which are drilled at anangle from the surface. A further advancement involvedhorizontal well drilling, in which wells start as ver-tical shafts below the surface and then deviate at anangle. Finally, the most sophisticated drilling technologyis multilateral drilling, in which a drilled well starts witha single entry point and then splits into several deviatedboreholes, increasing drilling reach.
The drilling of wells requires the deployment of tech-nologically sophisticated equipment, often in physically
challenging terrain. Obtaining and interpreting informa-tion from deployment of this equipment requires teamsof geologists, geophysicists, and engineers. As the pre-ceding description of some of the more sophisticatedtechnologies indicates, these are complex and difficulttasks requiring extensive organizational coordination,suggestive of an underlying capability and set of rou-tines for well drilling. The coordination required mayinclude that with specialized drilling firms. Nevertheless,particularly for the more sophisticated technologies, it isdifficult to interpret the results accurately without hav-ing an in-depth understanding of the technologies gainedfrom experience using them (Stadler 2011). As a result,upstream oil companies rarely outsource all exploratorydrilling activities, and upstream oil companies ratherthan specialist drilling firms often pioneer new drillingtechnologies.
If exploratory drilling indicates a high probabilitythat a tract contains oil, firms estimate and report thenumber of “proved” reserves, which are defined in theUnited States as reserves that are predicted to be eco-nomically viable under current price and cost condi-tions and to have a 90% probability of successful recov-ery using existing technologies (U.S. Securities andExchange Commission 1978).
Firms cannot immediately use proved reserves to pro-duce oil and gas. Instead, they must ascertain whethertracts for which exploration activity was successful infact contain economically viable amounts of oil and gasand then develop tracts to the point where productioncan occur. Firms again use the above-mentioned pro-cesses described to conduct additional seismic imag-ing studies to map reservoirs in detail. They then con-duct additional drilling of what are termed developmentwells to ascertain whether the tract contains commer-cially viable amounts of oil or gas.
The capabilities that underpin activities directedtoward resource access and development in the upstreamoil industry are dynamic in that they are directed towardeconomically significant change. In particular, over timethese capabilities can irrevocably alter the scale andscope of company resources. Seismic imaging and welldrilling activities can enable firms to locate and developreserves in what are often qualitatively new and dif-ferent types of geologic formations. The capabilitiesthat underpin these activities support augmentation andreplenishment of resources, or what Helfat et al. (2007)refer to as extending and modifying resources. Overa period of years, application of these capabilities cansubstantially extend and reconfigure the composition ofcompany resources that are essential for survival inthe upstream oil industry. As Helfat and Winter (2011)observe, capabilities that support economically signifi-cant yet gradual change for an organization in its exist-ing business nevertheless qualify as dynamic.
Dow
nloa
ded
from
info
rms.
org
by [
129.
170.
194.
153]
on
13 S
epte
mbe
r 20
16, a
t 13:
19 .
For
pers
onal
use
onl
y, a
ll ri
ghts
res
erve
d.

Stadler, Helfat, and Verona: The Impact of Dynamic Capabilities on Resource Access and DevelopmentOrganization Science 24(6), pp. 1782–1804, © 2013 INFORMS 1789
As the preceding description indicates, resourceaccess and development in the upstream oil industryconsist of similar activities and use similar capabili-ties. Although this similarity of dynamic capabilities forresource access and development does not apply in everyindustry, it is especially helpful for empirical testing: wecan conduct particularly clean tests of the hypothesesbecause we can examine the impact of the same dynamiccapabilities on both resource access and development.
In this industry, obtaining new resources in the formof reserves is particularly challenging. Although firmsoften have had prior experience undertaking such activi-ties, they always lack prior direct knowledge of geologicformations on new tracts. Even on new tracts in closeproximity to existing proved reserves, many tracts turnout not to contain hydrocarbons in economically viablequantities. In addition, as noted earlier, no two reservoirsare the same, and their features often differ substantially.As a result, even when seismic imaging studies suggestthat reservoirs are promising enough to merit exploratorydrilling, success at finding proved reserves is far fromassured; for example, only 52% of exploratory wells inour data resulted in proved reserves. In contrast, oil fielddevelopment is much less challenging, in part becausefirms gain a great deal of information about the geologicformations in question through the process of obtainingreserves (Stadler 2011, Stoneley 1995). In our data, forexample, 91% of development wells successfully locatedeconomically viable amounts of oil and gas.
In summary, in the upstream oil industry, technolog-ically sophisticated and organizationally complex activ-ities directed toward obtaining and further developingreserves are likely to be underpinned by dynamic capa-bilities. As explained below, these capabilities vary sub-stantially across firms, making this industry an appropri-ate setting in which to test Hypotheses 1 and 2. Resourcedevelopment also relies heavily on prior direct knowl-edge of the resources in question—namely, provedreserves on specific tracts. This provides an appropriatesetting in which to test Hypotheses 3 and 4 regardingthe impact of the attributes of dynamic capabilities onresource access versus resource development.
MethodsSample and DataOur sample consists of publicly owned companies thatappeared at least once in the annual list in the Oil andGas Journal (the primary industry trade journal) of thelargest companies (in terms of assets) operating in theupstream oil industry in the United States between 1993and 2006.13 We included only publicly held companiesin our sample, because we could not reliably obtainfinancial and oil and gas-related data for privately heldand state-owned companies. We also included only firmsthat had 30% or more of their total assets in upstream
oil and gas for at least one year in which they appearedin the listing, because firms for which upstream oil andgas was not an important business might make decisionsregarding upstream oil activities based on factors in theirother businesses.14 For example, an oil refining companymight seek to obtain and further develop oil and gasreserves in order to ensure crude oil supply for its down-stream business (Weston et al. 1999). (A lower cutoffof 25% does not substantially alter the results reportedhere.) Most of the excluded firms were electric utility,chemical, or oil refining companies.
Table 1 reports descriptive statistics. Our sample con-sists of 244 firms, including large publicly owned for-eign companies such as Shell and British Petroleum thatfile annual reports with the U.S. Securities and ExchangeCommission (SEC). The sample also includes relativelysmall firms: the four smallest firms in the sample, asmeasured by asset size in the first year for which wehave data, had asset values ranging from $1,580 to$67,140. The inclusion of these firms suggests that thesample includes most publicly owned upstream oil com-panies with U.S. operations. The firms also vary widelyin their expenditures on oil exploration and develop-ment, their proved reserves, and their operating income(EBITDA). In addition, Table 1 shows that during thesample time period, 19% of the observations are of firmsthat were vertically integrated into downstream opera-tions, and 45% are of firms that had offshore oil reservesin addition to onshore reserves. Finally, most of thefirms had primarily domestic reserves, with only 15% ofproved reserves outside the United States.
Of the 244 firms, 44 reported data in all years in thesample. Firms exited the sample partway through thetime period either because they were acquired by/mergedwith another firm (92 companies) or because theydeclared bankruptcy and ceased to operate (37 firms).The firms that entered our sample after 1993 did sofor one of four reasons: (1) they resulted from merg-ers between firms not previously in the sample (suchas privately held firms that merged and became pub-licly held) (28 firms), (2) they were spin-offs of otherfirms (6 firms), (3) they were newly established firms(24 firms), or (4) they were firms that existed previouslyas stand-alone entities that were not publicly held butbecame so partway through the sample period (63 firms).
To compile the data, we first consulted the 10-Kreports (20-F reports for foreign firms) that compa-nies file annually with the SEC, which contain finan-cial information as well as data specific to oil and gasoperations.15 The reports also contain descriptive infor-mation regarding offshore and foreign oil operations,whether or not the firms were vertically integrated, theseismic imaging and well drilling capabilities of firms,and the backgrounds of firms that had not previouslyreported to the SEC. We supplemented these data withinformation on mergers and acquisitions (M&A) from
Dow
nloa
ded
from
info
rms.
org
by [
129.
170.
194.
153]
on
13 S
epte
mbe
r 20
16, a
t 13:
19 .
For
pers
onal
use
onl
y, a
ll ri
ghts
res
erve
d.

Stadler, Helfat, and Verona: The Impact of Dynamic Capabilities on Resource Access and Development1790 Organization Science 24(6), pp. 1782–1804, © 2013 INFORMS
Table 1 Descriptive Statistics, 1993–2006 4n = 118975
Variable Mean Std. dev. Min Max
EBITDA, lagged (billion US$) 0098 4057 −0014 82020Total reserves, lagged (thousand barrel oil equivalent) 6381973000 214761297000 0 2214001000000Log(Total reserves, lagged ) 9098 2090 0 16092Foreign reserves/Total reserves, lagged 0015 0029 0 1Exploration expenditures (US$ × 0.001) 1391000000 4671000000 0 1210001000000Log(Exploration expenditures) 14061 5064 0 23020Presample exploration expenditures (US$ × 0.001) 661900000 2231000000 0 118001000000Log(Presample exploration expenditures) 14018 5030 0 30014Development expenditures (US$ × 0.001) 3061000000 110601000000 0 1316001000000Log(Development expenditures) 15088 4046 0 23033Presample development expenditures (US$ × 0.001) 1631000000 6391000000 0 419201000000Log(Presample development expenditures) 15006 3068 0 27039Successful exploratory wells drilled 9000 23000 0 344000Log(Successful exploratory wells drilled × 100) 4004 3011 0 10045Presample successful exploratory wells drilled 3050 9000 0 60000Log(Presample successful exploratory wells drilled × 100) 2080 2092 0 8070Successful development wells drilled 94000 222000 0 11972000Log(Successful development wells drilled × 100) 6022 3040 0 12019Presample successful development wells drilled 34000 84000 0 472000Log(Presample successful development wells drilled × 100) 4080 3039 0 10076CEO with upstream expertise only, lagged 0028 0045 0 1CEO with both upstream and nonupstream expertise, lagged 0037 0048 0 1Dynamic capability, lagged 3083 1038 2 7Nonintegrated, lagged 0081 0039 0 1M&A, lagged 0010 0030 0 1Offshore operations, lagged 0045 0050 0 1New entrant without prior experience, lagged 0001 0010 0 1New entrant with prior experience, lagged 0004 0020 0 1Exit due to M&A 0005 0021 0 1Exit due to bankruptcy 0002 0014 0 1Crude oil price, lagged (US$ per barrel oil equivalent) 23063 6095 17027 44045
SDC Platinum. In addition, we conducted a search ofmedia coverage using LexisNexis to obtain informa-tion on mergers and acquisitions not covered by SDCPlatinum (primarily small firms or firms acquired by for-eign companies), as well as reasons why firms exitedthe sample. We also collected data on CEO educa-tion and work experience from biographical descrip-tions in annual proxy statements filed with the SEC,the Marquis Who’s Who database, ZoomInfo, and arti-cles in LexisNexis. To obtain information missing fromthese sources, we conducted 117 brief interviews ask-ing for factual information on CEO backgrounds, suchas a CEO’s university degree, with the CEOs, theirspouses, administrators from the CEOs’ former schools,the human resources departments of their former firms,or fellow board members.
To gather additional information on firms’ seismicimaging and well drilling capabilities, we supplementeddescriptive information in the 10-K and 20-F reportswith articles from the Journal of Petroleum Technology,the Oil and Gas Journal, and Geology (the main journalof the Geological Society of America). For 188 firmsfor which publicly available information on capabilitieswas incomplete, we contacted these companies’ seniortechnical staff to obtain factual information. For some
of the larger firms, we conducted multiple interviews,because this information could not be obtained from asingle informant (e.g., the head geologist provided uswith information on seismic imaging, and a senior reser-voir engineer did the same for drilling technology).
EstimationAll the variables were constructed using annual data.The data for the dependent variables span the years1993–2006. We omitted 1999, because the Asian cri-sis caused oil prices to fall precipitously for a singleyear; this anomalous situation could have caused com-panies to lower their expenditures on activities directedtoward resource access and development regardless oftheir dynamic capabilities. (Inclusion of this year in thesample does not change the substance of the resultsreported here.) To mitigate the possibility of reverse cau-sation, most right-hand-side variables are lagged oneyear. This is an appropriate lag structure for the expen-diture equations, in light of the decision-making pro-cesses in the upstream oil industry, in which firms final-ize their budgets for each year in the last month ofthe preceding fiscal year (see Quick and Buck 1984,Kukalis and Jungemann 1995, Grant 2003). This lagstructure also is appropriate for the regressions that ana-lyze the success of resource access and development
Dow
nloa
ded
from
info
rms.
org
by [
129.
170.
194.
153]
on
13 S
epte
mbe
r 20
16, a
t 13:
19 .
For
pers
onal
use
onl
y, a
ll ri
ghts
res
erve
d.

Stadler, Helfat, and Verona: The Impact of Dynamic Capabilities on Resource Access and DevelopmentOrganization Science 24(6), pp. 1782–1804, © 2013 INFORMS 1791
activity, because drilling outcomes are generally reportedwith a lag of approximately a year from when drillingcommences. Data for all dollar-denominated variablesare converted to real values expressed in 2000 dol-lars, using the U.S. gross domestic product chain-typeimplicit price deflator (http://www.eia.doe.gov/aer/txt/ptb1601.html, accessed June 23, 2010).
Dependent Variables. We use two dependent variablesto test Hypothesis 1: annual expenditures on oil explo-ration (resource access) and annual expenditures on oildevelopment (resource development). We use expendi-tures to measure the amount of resource access anddevelopment activity that companies undertake, becausethis measure enables comparisons between companies.For example, even when companies drill wells usingsimilar technologies, some wells may entail greatereffort and cost more to drill than others as a result of dif-ferences in geologic formations and tract locations. Oilexploration expenditures include up-front payments tolease a property (e.g., from the government) or purchaseland, as well as expenditures incurred during explorationactivity.16 The latter include the costs of topographi-cal, geographical, and geophysical studies; drilling andequipment costs; and personnel costs. Oil developmentexpenditures are incurred in fields where explorationhas been successful and companies have booked provedreserves. Development expenditures include costs ofseismic and land surveys, drilling of additional wells,and personnel and equipment. Expenditures on explo-ration and development include all expenditures in agiven year, regardless of whether they are capitalized orexpensed for accounting purposes.
Expenditures on oil exploration and development arehighly skewed because of a few large values and manysmaller values. To achieve a normal distribution, weconverted the dollar values of expenditures to naturallogarithms. Because some firms had zero explorationor development expenditures in some years (equivalentto a negative value in logarithmic terms), we followeda procedure similar to that suggested by Cameron andTrivedi (2009, p. 532) by first converting the zero valuesto a value of one dollar and then applying the natu-ral log transformation (resulting in a natural log valueof zero).17
In a second set of regressions that tests Hypothe-sis 2 regarding the success of upstream oil resourceaccess and development activity, we use measures ofsuccess that are directly traceable to these activities. Theindustry metric for the success of oil exploration anddevelopment activity is the number of wells drilled forwhich oil was found, termed “successful wells drilled.”To measure the success of resource access activity,we use the number of successful exploratory wellsdrilled; these are wells for which proved reserves arebooked, because they are anticipated to contain econom-ically viable amounts of oil. To measure the success
of resource development activity, we use the numberof successful development wells drilled; these are wellsfor which the presence of commercially viable amountsof oil is confirmed.18 Like expenditures, the distribu-tion of the number of successful wells of both typesis highly skewed, and some firms have zero success-ful wells in some years. We therefore used the sameprocedure as for expenditures to convert the number ofsuccessful exploratory and development wells to naturallogarithmic values (for a similar approach, see Acs et al.2002, Leiblein and Madsen 2009). Because of data lim-itations, we are unable to assess the impact of dynamiccapabilities on financial performance. Available mea-sures of financial performance, such as return on assetsor Tobin’s q, depend on factors other than upstream oilexploration and development that are difficult to controlfor (notably, oil production) and include nonupstreambusinesses for some firms.
Explanatory Variable: Attributes of Dynamic Capa-bility. Our explanatory variable captures the attributesof dynamic capabilities that have the potential to affectthe value of output (namely, oil and gas reserves) fromresource access and development activities. As explainedearlier, these activities rely heavily on seismic imagingand well drilling technologies. To develop a proxy mea-sure of the attributes of dynamic capabilities, we usedthe technological sophistication of a firm’s seismic imag-ing and well drilling technologies. Key attributes of acapability are the characteristics of its routines, and asnoted earlier, the use of both imaging and well drillingtechnologies is likely to entail a set of routines. In addi-tion, for a set of routines to qualify as a capability,the routines must be sufficiently reliable to serve as abasis for regular use. In the upstream oil industry, to saythat a technology can be used on a reliable basis meansthat, at a minimum, the technology can be used in full-scale applications, which are large-scale projects aimedat obtaining and further developing oil and gas reservesthat have commercial potential. Because mistakes inusing a new imaging or drilling technology in projects atfull scale can be extremely costly, firms generally con-duct pilot (test) projects on a small scale first. Only whenthe firm’s use of the technology has reached a level ofreliability sufficient for full-scale applications does thecompany deploy the technology in such projects. (Thiswas confirmed during interviews with company person-nel.) Thus, we focus on technologies used in full-scaleprojects.
Seismic imaging technologies have a hierarchy ofsophistication, as do well drilling technologies. Withineach hierarchy, use of a more sophisticated technologyrequires a thorough understanding of the less sophis-ticated ones.19 Nevertheless, more sophisticated tech-nologies require somewhat different routines than lesssophisticated ones, because the technologies differ. For
Dow
nloa
ded
from
info
rms.
org
by [
129.
170.
194.
153]
on
13 S
epte
mbe
r 20
16, a
t 13:
19 .
For
pers
onal
use
onl
y, a
ll ri
ghts
res
erve
d.
Stadler, Helfat, and Verona: The Impact of Dynamic Capabilities on Resource Access and Development1792 Organization Science 24(6), pp. 1782–1804, © 2013 INFORMS
example, use of 3D imaging technology requires walk-ing through a room of images, whereas 2D technologydoes not. Greater technological sophistication providesgreater potential to locate and develop new reserves,because firms can conduct oil exploration and develop-ment in a wider range of geologic formations. As a re-sult, the extent of technological sophistication, as aproxy for attributes of dynamic capabilities, provides anindicator of the potential value of output of using thesecapabilities (i.e., reserves). Although we are unable todirectly measure the costs of deploying dynamic capabil-ities, in the empirical analysis we control for firm-leveleffects and other factors that are likely to capture someof these costs.
In constructing a measure of the attributes of dynamiccapabilities for each firm in each year, we began byidentifying the year in which a firm first utilized eachlevel of technological advancement for seismic imaging(2D, 3D, and 4D imaging) and for well drilling (verti-cal, directional, horizontal, and multilateral drilling) ina full-scale application. Given that oil exploration anddevelopment is ongoing in upstream oil companies, oncea firm starts to deploy one of these technologies in afull-scale application, it generally retains its knowledgeof the technology in subsequent years.20 (This was con-firmed in the interviews.) Therefore, for each level oftechnological sophistication in imaging or well drilling,a firm was coded as having this attribute in the first yearof full-scale use and all subsequent years.
To create a summary variable for the attributes ofeach firm’s dynamic capabilities in each year, we firstassessed the level of technological sophistication perfirm for imaging and drilling separately. Firms that hadnever conducted seismic imaging or well drilling wouldhave received a value of 0 for the level of sophisticationof each technology, but no firms fell into this category.For drilling, firms that possessed only the least sophis-ticated technology of vertical drilling received a valueof 1, firms that also had directional drilling technologyreceived a value of 2, firms with horizontal drilling tech-nology received a value of 3, and firms with multilateraldrilling technology received a value of 4. For seismicimaging, firms that possessed only the least sophisticatedtechnology (2D imaging) received a value of 1, firmswith 3D technology received a value of 2, and firms with4D technology received a value of 3.
Although imaging and drilling are distinct from oneanother and entail different technologies and knowledgebases, the two activities are interdependent. In particu-lar, well drilling utilizes the results from prior seismicimaging, but imaging alone does not determine drillingoutcomes. Because these two technologies work in con-cert, we combined imaging and drilling into a singlemeasure of the attributes of dynamic capabilities.
As noted at the start of this paper, empirical researchon capabilities has often lacked data with which to con-struct objective rather than subjective measures of capa-bilities. Our measure clearly is objective, rather thanderived from survey data. Even when researchers havebeen able to utilize objective measures, these have some-times taken the form of a single binary 40115 variablethat indicates whether a firm possesses a capability of aparticular type (Grant and Verona 2013). The measurethat we use is finer-grained, in that it incorporates a scaleassociated with level of technological sophistication. Ourmeasure of the attributes of dynamic capabilities also hasthe advantage that it does not reflect how successfullyfirms have used these technologies beyond a minimalthreshold of initial deployment. Instead, by using a mea-sure that reflects key underlying attributes of dynamiccapabilities, we capture the potential for a firm to obtainand develop new resources. In particular, as noted above,firms with more technologically sophisticated capabili-ties for seismic imaging and well drilling have the poten-tial to undertake a broader range of projects than firmswith less sophisticated capabilities. This greater techno-logical sophistication in turn provides the potential tolocate and develop new resources with a greater quan-tity and/or quality of output. Note, however, that techno-logical sophistication is measured independently of theamount and success of resource access and developmentactivity.
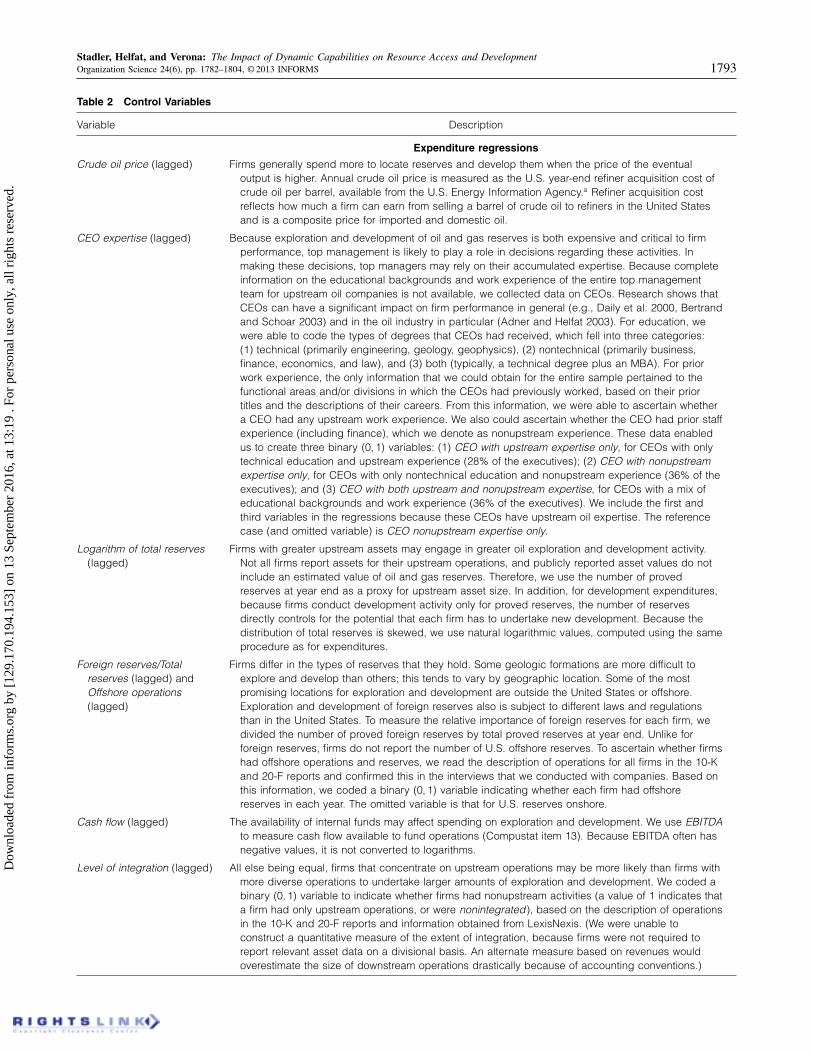
Control Variables. The regressions include severalvariables that control for influences other than dynamiccapabilities on the amount and success of resourceaccess and development activity. Table 2 explains thereasons for including each control variable in the regres-sions and the construction of each variable. The regres-sions for oil exploration and development expenditurescontain controls for crude oil price, CEO expertise,total number of reserves, type of reserves (foreign, U.S.offshore, U.S. onshore), availability of internal funds(cash flow), integration into downstream operations, newentrant status, firm exit, merger and acquisition activity,and fixed firm effects through a presample dependentvariable. The last item is explained in more detail below.The regressions for the success of oil exploration anddevelopment control for expenditures on each activityand include all the control variables in the expenditureregressions except oil price, cash flow, and integration,because these do not directly affect whether drilled wellsyield oil. We do not include dummy variables for indi-vidual years as controls, because they are highly corre-lated with oil prices in the expenditure regressions andwith expenditures in the success regressions. The timeperiod of our analysis, 1993–2006, covers a period ofrelatively stable oil prices and a more variable periodwith sharply increasing output prices.21
Dow
nloa
ded
from
info
rms.
org
by [
129.
170.
194.
153]
on
13 S
epte
mbe
r 20
16, a
t 13:
19 .
For
pers
onal
use
onl
y, a
ll ri
ghts
res
erve
d.
Stadler, Helfat, and Verona: The Impact of Dynamic Capabilities on Resource Access and DevelopmentOrganization Science 24(6), pp. 1782–1804, © 2013 INFORMS 1793
Table 2 Control Variables
Variable Description
Expenditure regressions
Crude oil price (lagged) Firms generally spend more to locate reserves and develop them when the price of the eventualoutput is higher. Annual crude oil price is measured as the U.S. year-end refiner acquisition cost ofcrude oil per barrel, available from the U.S. Energy Information Agency.a Refiner acquisition costreflects how much a firm can earn from selling a barrel of crude oil to refiners in the United Statesand is a composite price for imported and domestic oil.
CEO expertise (lagged) Because exploration and development of oil and gas reserves is both expensive and critical to firmperformance, top management is likely to play a role in decisions regarding these activities. Inmaking these decisions, top managers may rely on their accumulated expertise. Because completeinformation on the educational backgrounds and work experience of the entire top managementteam for upstream oil companies is not available, we collected data on CEOs. Research shows thatCEOs can have a significant impact on firm performance in general (e.g., Daily et al. 2000, Bertrandand Schoar 2003) and in the oil industry in particular (Adner and Helfat 2003). For education, wewere able to code the types of degrees that CEOs had received, which fell into three categories:(1) technical (primarily engineering, geology, geophysics), (2) nontechnical (primarily business,finance, economics, and law), and (3) both (typically, a technical degree plus an MBA). For priorwork experience, the only information that we could obtain for the entire sample pertained to thefunctional areas and/or divisions in which the CEOs had previously worked, based on their priortitles and the descriptions of their careers. From this information, we were able to ascertain whethera CEO had any upstream work experience. We also could ascertain whether the CEO had prior staffexperience (including finance), which we denote as nonupstream experience. These data enabledus to create three binary 40115 variables: (1) CEO with upstream expertise only, for CEOs with onlytechnical education and upstream experience (28% of the executives); (2) CEO with nonupstreamexpertise only, for CEOs with only nontechnical education and nonupstream experience (36% of theexecutives); and (3) CEO with both upstream and nonupstream expertise, for CEOs with a mix ofeducational backgrounds and work experience (36% of the executives). We include the first andthird variables in the regressions because these CEOs have upstream oil expertise. The referencecase (and omitted variable) is CEO nonupstream expertise only.
Logarithm of total reserves(lagged)
Firms with greater upstream assets may engage in greater oil exploration and development activity.Not all firms report assets for their upstream operations, and publicly reported asset values do notinclude an estimated value of oil and gas reserves. Therefore, we use the number of provedreserves at year end as a proxy for upstream asset size. In addition, for development expenditures,because firms conduct development activity only for proved reserves, the number of reservesdirectly controls for the potential that each firm has to undertake new development. Because thedistribution of total reserves is skewed, we use natural logarithmic values, computed using the sameprocedure as for expenditures.
Foreign reserves/Totalreserves (lagged) andOffshore operations(lagged)
Firms differ in the types of reserves that they hold. Some geologic formations are more difficult toexplore and develop than others; this tends to vary by geographic location. Some of the mostpromising locations for exploration and development are outside the United States or offshore.Exploration and development of foreign reserves also is subject to different laws and regulationsthan in the United States. To measure the relative importance of foreign reserves for each firm, wedivided the number of proved foreign reserves by total proved reserves at year end. Unlike forforeign reserves, firms do not report the number of U.S. offshore reserves. To ascertain whether firmshad offshore operations and reserves, we read the description of operations for all firms in the 10-Kand 20-F reports and confirmed this in the interviews that we conducted with companies. Based onthis information, we coded a binary 40115 variable indicating whether each firm had offshorereserves in each year. The omitted variable is that for U.S. reserves onshore.
Cash flow (lagged) The availability of internal funds may affect spending on exploration and development. We use EBITDAto measure cash flow available to fund operations (Compustat item 13). Because EBITDA often hasnegative values, it is not converted to logarithms.
Level of integration (lagged) All else being equal, firms that concentrate on upstream operations may be more likely than firms withmore diverse operations to undertake larger amounts of exploration and development. We coded abinary 40115 variable to indicate whether firms had nonupstream activities (a value of 1 indicates thata firm had only upstream operations, or were nonintegrated ), based on the description of operationsin the 10-K and 20-F reports and information obtained from LexisNexis. (We were unable toconstruct a quantitative measure of the extent of integration, because firms were not required toreport relevant asset data on a divisional basis. An alternate measure based on revenues wouldoverestimate the size of downstream operations drastically because of accounting conventions.)
Dow
nloa
ded
from
info
rms.
org
by [
129.
170.
194.
153]
on
13 S
epte
mbe
r 20
16, a
t 13:
19 .
For
pers
onal
use
onl
y, a
ll ri
ghts
res
erve
d.
Stadler, Helfat, and Verona: The Impact of Dynamic Capabilities on Resource Access and Development1794 Organization Science 24(6), pp. 1782–1804, © 2013 INFORMS
Table 2 (cont’d)
Variable Description
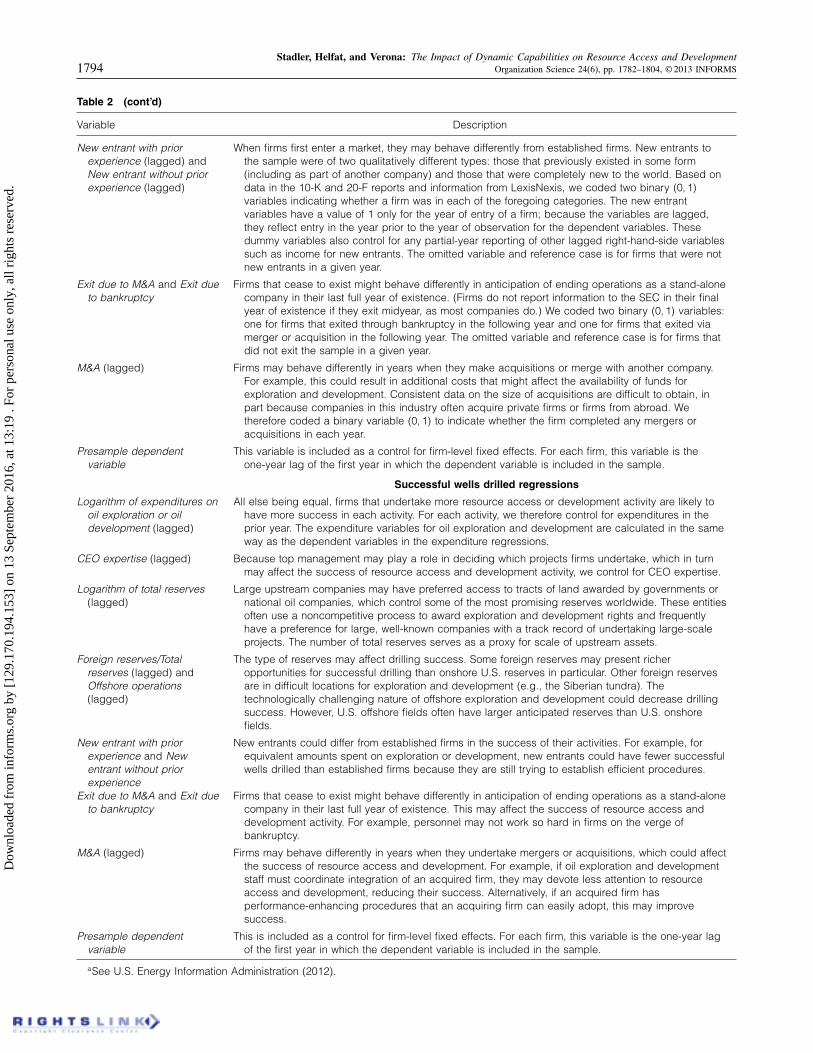
New entrant with priorexperience (lagged) andNew entrant without priorexperience (lagged)
When firms first enter a market, they may behave differently from established firms. New entrants tothe sample were of two qualitatively different types: those that previously existed in some form(including as part of another company) and those that were completely new to the world. Based ondata in the 10-K and 20-F reports and information from LexisNexis, we coded two binary 40115variables indicating whether a firm was in each of the foregoing categories. The new entrantvariables have a value of 1 only for the year of entry of a firm; because the variables are lagged,they reflect entry in the year prior to the year of observation for the dependent variables. Thesedummy variables also control for any partial-year reporting of other lagged right-hand-side variablessuch as income for new entrants. The omitted variable and reference case is for firms that were notnew entrants in a given year.
Exit due to M&A and Exit dueto bankruptcy
Firms that cease to exist might behave differently in anticipation of ending operations as a stand-alonecompany in their last full year of existence. (Firms do not report information to the SEC in their finalyear of existence if they exit midyear, as most companies do.) We coded two binary 40115 variables:one for firms that exited through bankruptcy in the following year and one for firms that exited viamerger or acquisition in the following year. The omitted variable and reference case is for firms thatdid not exit the sample in a given year.
M&A (lagged) Firms may behave differently in years when they make acquisitions or merge with another company.For example, this could result in additional costs that might affect the availability of funds forexploration and development. Consistent data on the size of acquisitions are difficult to obtain, inpart because companies in this industry often acquire private firms or firms from abroad. Wetherefore coded a binary variable 40115 to indicate whether the firm completed any mergers oracquisitions in each year.
Presample dependentvariable
This variable is included as a control for firm-level fixed effects. For each firm, this variable is theone-year lag of the first year in which the dependent variable is included in the sample.
Successful wells drilled regressions
Logarithm of expenditures onoil exploration or oildevelopment (lagged)
All else being equal, firms that undertake more resource access or development activity are likely tohave more success in each activity. For each activity, we therefore control for expenditures in theprior year. The expenditure variables for oil exploration and development are calculated in the sameway as the dependent variables in the expenditure regressions.
CEO expertise (lagged) Because top management may play a role in deciding which projects firms undertake, which in turnmay affect the success of resource access and development activity, we control for CEO expertise.
Logarithm of total reserves(lagged)
Large upstream companies may have preferred access to tracts of land awarded by governments ornational oil companies, which control some of the most promising reserves worldwide. These entitiesoften use a noncompetitive process to award exploration and development rights and frequentlyhave a preference for large, well-known companies with a track record of undertaking large-scaleprojects. The number of total reserves serves as a proxy for scale of upstream assets.
Foreign reserves/Totalreserves (lagged) andOffshore operations(lagged)
The type of reserves may affect drilling success. Some foreign reserves may present richeropportunities for successful drilling than onshore U.S. reserves in particular. Other foreign reservesare in difficult locations for exploration and development (e.g., the Siberian tundra). Thetechnologically challenging nature of offshore exploration and development could decrease drillingsuccess. However, U.S. offshore fields often have larger anticipated reserves than U.S. onshorefields.
New entrant with priorexperience and Newentrant without priorexperience
New entrants could differ from established firms in the success of their activities. For example, forequivalent amounts spent on exploration or development, new entrants could have fewer successfulwells drilled than established firms because they are still trying to establish efficient procedures.
Exit due to M&A and Exit dueto bankruptcy
Firms that cease to exist might behave differently in anticipation of ending operations as a stand-alonecompany in their last full year of existence. This may affect the success of resource access anddevelopment activity. For example, personnel may not work so hard in firms on the verge ofbankruptcy.
M&A (lagged) Firms may behave differently in years when they undertake mergers or acquisitions, which could affectthe success of resource access and development. For example, if oil exploration and developmentstaff must coordinate integration of an acquired firm, they may devote less attention to resourceaccess and development, reducing their success. Alternatively, if an acquired firm hasperformance-enhancing procedures that an acquiring firm can easily adopt, this may improvesuccess.
Presample dependentvariable
This is included as a control for firm-level fixed effects. For each firm, this variable is the one-year lagof the first year in which the dependent variable is included in the sample.
aSee U.S. Energy Information Administration (2012).
Dow
nloa
ded
from
info
rms.
org
by [
129.
170.
194.
153]
on
13 S
epte
mbe
r 20
16, a
t 13:
19 .
For
pers
onal
use
onl
y, a
ll ri
ghts
res
erve
d.

Stadler, Helfat, and Verona: The Impact of Dynamic Capabilities on Resource Access and DevelopmentOrganization Science 24(6), pp. 1782–1804, © 2013 INFORMS 1795
Statistical MethodsBecause the dependent variables in the regressions can-not take on negative values and are censored at 0, weuse Tobit maximum likelihood estimation. We use ran-dom effects Tobit estimation to control for firm-leveleffects that the included right-hand-side variables maynot capture. Because the value of the capability vari-able changes slowly within firms over time, we can-not estimate standard fixed effects regressions, becausethis would make it impossible to estimate the capabilityeffects. In addition, standard fixed effects estimation can-not be used for Tobit analysis.22 Instead, to control forfirm-level fixed effects, we include a presample depen-dent variable on the right-hand side of the regressions.Blundell et al. (1995) suggest this approach for situa-tions in which traditional fixed effects estimation can-not be used. Blundell et al. (1995) apply this approachto dynamic panel regressions for count data. Follow-ing Blundell et al. (1995), a number of studies in man-agement have used a presample dependent variable tocontrol for fixed effects (e.g., Ahuja and Katila 2001,Ziedonis 2004). The presample variable is the same (thatis, fixed) for all observations of an individual firm. AsAhuja and Katila (2001, p. 204) note, the presampledependent variable provides an instrument that “servesas a ‘fixed-effect’ for the firms in the panel and helpsto partial out unobservable differences across firms.”Blundell et al. (1995) use three years of data prior tothe start of the sample to construct a presample depen-dent variable. Because of data limitations, in our studythe presample dependent variable is the value of thisvariable in the year immediately preceding the first yearin which the dependent variable for each firm appearsin the sample. We also conduct a robustness test thatcontrols for firm-level fixed effects using ordinary leastsquares, as explained later.
Because there is a lag between the time when firmsconduct activities for resource access and developmentand the time when the success of each of these activi-ties is known (about a year on average), this implies arecursive system of equations, such that firms first makeexpenditures directed toward resource access and devel-opment and subsequently learn how successful each ofthese activities were. When equations are recursive, theerror terms are uncorrelated, and therefore the regres-sion for the amount of each activity can be estimatedindependently of the regression for the success of eachactivity (Pindyck and Rubinfeld 1998). All regressionsare estimated using Stata 11.
ResultsTable 3 reports correlation coefficients for the vari-ables in the regressions. Our explanatory variable for theattributes of dynamic capabilities is positively correlatedwith several control variables. We calculated the vari-ance inflation factor (VIF) for this variable when used Table
3CorrelationMatrix4n
=11
8975
12
34
56
78
910
1112
1314
1516
1718
1EB
ITD
A,l
agge
d(b
illio
nU
S$)
1000
2Lo
g(To
talr
eser
ves,
lagg
ed)
0042
1000
3Fo
reig
nre
serv
es/T
otal
rese
rves
,lag
ged
0038
0044
1000
4Lo
g(Ex
plor
atio
nex
pend
iture
s)00
2300
5600
2510
005
Log(
Dev
elop
men
texp
endi
ture
s)00
2800
7600
2700
5710
006
Log(
Succ
essf
ulex
plor
ator
yw
ells
drill
ed)
0026
0061
0027
0069
0058
1000
7Lo
g(Su
cces
sful
deve
lopm
entw
ells
drill
ed)
0027
0079
0023
0055
0077
0059
1000
8C
EOw
ithup
stre
amex
pert
ise
only
,lag
ged
0005
0000
0002
−00
0100
0100
01−
0002
1000
9C
EOw
ithbo
thup
stre
aman
dno
nups
tream
expe
rtis
e,la
gged
0003
0011
−00
0100
0700
0800
0700
13−
0048
1000
10D
ynam
icca
pabi
lity,
lagg
ed00
3600
5300
3100
4600
5000
4900
4500
0300
0910
0011
Non
inte
grat
ed,l
agge
d−
0038
−00
43−
0033
−00
21−
0031
−00
22−
0035
−00
06−
0007
−00
2610
0012
M&
A,l
agge
d00
0700
2200
0600
1500
1700
2100
2000
0000
0500
12−
0004
1000
13O
ffsho
reop
erat
ions
,lag
ged
0023
0053
0035
0041
0042
0044
0034
−00
0200
0100
47−
0015
0012
1000
14N
ewen
trant
with
outp
rior
expe
rienc
e,la
gged
−00
02−
0011
−00
04−
0006
−00
06−
0006
−00
0900
0000
03−
0005
0005
−00
01−
0007
1000
15N
ewen
trant
with
prio
rex
perie
nce,
lagg
ed−
0004
−00
18−
0007
−00
17−
0020
−00
16−
0016
−00
0200
01−
0015
0007
−00
04−
0011
−00
0210
0016
Exit
due
toM
&A
−00
0300
0600
0000
0000
0700
0300
0700
02−
0001
0003
0003
0003
0004
−00
02−
0005
1000
17Ex
itdu
eto
bank
rupt
cy−
0003
−00
0800
02−
0011
−00
12−
0009
−00
1100
01−
0001
−00
0500
00−
0005
−00
06−
0001
−00
03−
0003
1000
18C
rude
oilp
rice,
lagg
ed(U
S$pe
rba
rrel
)00
1100
0000
0100
0800
0900
1100
0700
0200
0000
2300
0400
0400
02−
0001
−00
10−
0003
0002
1000
Dow
nloa
ded
from
info
rms.
org
by [
129.
170.
194.
153]
on
13 S
epte
mbe
r 20
16, a
t 13:
19 .
For
pers
onal
use
onl
y, a
ll ri
ghts
res
erve
d.
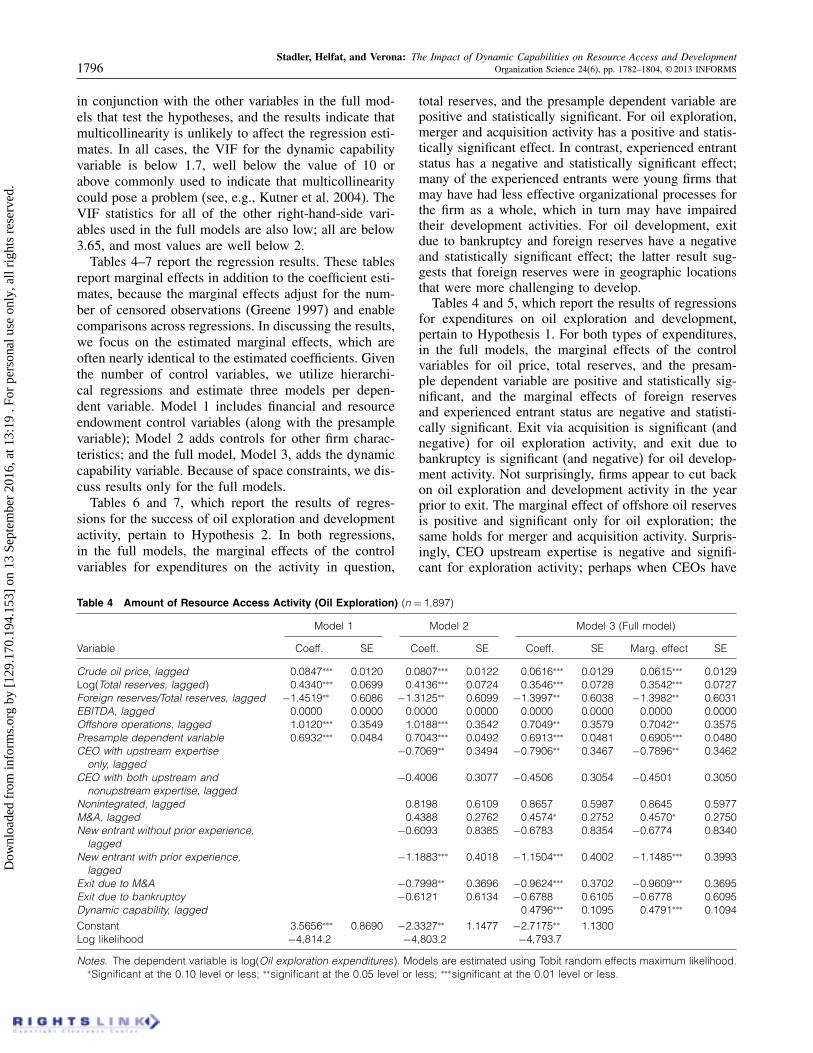
Stadler, Helfat, and Verona: The Impact of Dynamic Capabilities on Resource Access and Development1796 Organization Science 24(6), pp. 1782–1804, © 2013 INFORMS
in conjunction with the other variables in the full mod-els that test the hypotheses, and the results indicate thatmulticollinearity is unlikely to affect the regression esti-mates. In all cases, the VIF for the dynamic capabilityvariable is below 1.7, well below the value of 10 orabove commonly used to indicate that multicollinearitycould pose a problem (see, e.g., Kutner et al. 2004). TheVIF statistics for all of the other right-hand-side vari-ables used in the full models are also low; all are below3.65, and most values are well below 2.
Tables 4–7 report the regression results. These tablesreport marginal effects in addition to the coefficient esti-mates, because the marginal effects adjust for the num-ber of censored observations (Greene 1997) and enablecomparisons across regressions. In discussing the results,we focus on the estimated marginal effects, which areoften nearly identical to the estimated coefficients. Giventhe number of control variables, we utilize hierarchi-cal regressions and estimate three models per depen-dent variable. Model 1 includes financial and resourceendowment control variables (along with the presamplevariable); Model 2 adds controls for other firm charac-teristics; and the full model, Model 3, adds the dynamiccapability variable. Because of space constraints, we dis-cuss results only for the full models.
Tables 6 and 7, which report the results of regres-sions for the success of oil exploration and developmentactivity, pertain to Hypothesis 2. In both regressions,in the full models, the marginal effects of the controlvariables for expenditures on the activity in question,
Table 4 Amount of Resource Access Activity (Oil Exploration) 4n = 118975
Model 1 Model 2 Model 3 (Full model)
Variable Coeff. SE Coeff. SE Coeff. SE Marg. effect SE
Crude oil price, lagged 000847∗∗∗ 000120 000807∗∗∗ 000122 000616∗∗∗ 000129 000615∗∗∗ 000129Log(Total reserves, lagged 5 004340∗∗∗ 000699 004136∗∗∗ 000724 003546∗∗∗ 000728 003542∗∗∗ 000727Foreign reserves/Total reserves, lagged −104519∗∗ 006086 −103125∗∗ 006099 −103997∗∗ 006038 −103982∗∗ 006031EBITDA, lagged 000000 000000 000000 000000 000000 000000 000000 000000Offshore operations, lagged 100120∗∗∗ 003549 100188∗∗∗ 003542 007049∗∗ 003579 007042∗∗ 003575Presample dependent variable 006932∗∗∗ 000484 007043∗∗∗ 000492 006913∗∗∗ 000481 006905∗∗∗ 000480CEO with upstream expertise
only, lagged−007069∗∗ 003494 −007906∗∗ 003467 −007896∗∗ 003462
CEO with both upstream andnonupstream expertise, lagged
−004006 003077 −004506 003054 −004501 003050
Nonintegrated, lagged 008198 006109 008657 005987 008645 005977M&A, lagged 004388 002762 004574∗ 002752 004570∗ 002750New entrant without prior experience,
lagged−006093 008385 −006783 008354 −006774 008340
New entrant with prior experience,lagged
−101883∗∗∗ 004018 −101504∗∗∗ 004002 −101485∗∗∗ 003993
Exit due to M&A −007998∗∗ 003696 −009624∗∗∗ 003702 −009609∗∗∗ 003695Exit due to bankruptcy −006121 006134 −006788 006105 −006778 006095Dynamic capability, lagged 004796∗∗∗ 001095 004791∗∗∗ 001094Constant 305656∗∗∗ 008690 −203327∗∗ 101477 −207175∗∗ 101300Log likelihood −4181402 −4180302 −4179307
Notes. The dependent variable is log(Oil exploration expenditures). Models are estimated using Tobit random effects maximum likelihood.∗Significant at the 0.10 level or less; ∗∗significant at the 0.05 level or less; ∗∗∗significant at the 0.01 level or less.
total reserves, and the presample dependent variable arepositive and statistically significant. For oil exploration,merger and acquisition activity has a positive and statis-tically significant effect. In contrast, experienced entrantstatus has a negative and statistically significant effect;many of the experienced entrants were young firms thatmay have had less effective organizational processes forthe firm as a whole, which in turn may have impairedtheir development activities. For oil development, exitdue to bankruptcy and foreign reserves have a negativeand statistically significant effect; the latter result sug-gests that foreign reserves were in geographic locationsthat were more challenging to develop.
Tables 4 and 5, which report the results of regressionsfor expenditures on oil exploration and development,pertain to Hypothesis 1. For both types of expenditures,in the full models, the marginal effects of the controlvariables for oil price, total reserves, and the presam-ple dependent variable are positive and statistically sig-nificant, and the marginal effects of foreign reservesand experienced entrant status are negative and statisti-cally significant. Exit via acquisition is significant (andnegative) for oil exploration activity, and exit due tobankruptcy is significant (and negative) for oil develop-ment activity. Not surprisingly, firms appear to cut backon oil exploration and development activity in the yearprior to exit. The marginal effect of offshore oil reservesis positive and significant only for oil exploration; thesame holds for merger and acquisition activity. Surpris-ingly, CEO upstream expertise is negative and signifi-cant for exploration activity; perhaps when CEOs have
Dow
nloa
ded
from
info
rms.
org
by [
129.
170.
194.
153]
on
13 S
epte
mbe
r 20
16, a
t 13:
19 .
For
pers
onal
use
onl
y, a
ll ri
ghts
res
erve
d.

Stadler, Helfat, and Verona: The Impact of Dynamic Capabilities on Resource Access and DevelopmentOrganization Science 24(6), pp. 1782–1804, © 2013 INFORMS 1797
Table 5 Amount of Resource Development Activity (Oil Development) 4n = 118975
Model 1 Model 2 Model 3 (Full model)
Dependent variable Coeff. SE Coeff. SE Coeff. SE Marg. effect SE
Crude oil price, lagged 000708∗∗∗ 000080 000679∗∗∗ 000081 000572∗∗∗ 000085 000572∗∗∗ 000085Log(Total reserves, lagged 5 008846∗∗∗ 000458 008887∗∗∗ 000471 008547∗∗∗ 000477 008547∗∗∗ 000477Foreign reserves/Total reserves,
lagged−104211∗∗∗ 003861 −102735∗∗∗ 003882 −103328∗∗∗ 003864 −103328∗∗∗ 003864
EBITDA, lagged 000000 000000 000000 000000 000000 000000 000000 000000Offshore operations, lagged 000803 002265 000298 002263 −001476 002298 −001476 002298Presample dependent variable 004694∗∗∗ 000418 004774∗∗∗ 000426 004657∗∗∗ 000424 004657∗∗∗ 000424CEO with upstream expertise
only, lagged−000084 002234 −000604 002227 −000604 002227
CEO with both upstream andnonupstream expertise,lagged
000147 001985 −000147 001977 −000147 001977
Nonintegrated, lagged 007812∗∗ 003734 008148∗∗ 003709 008148∗∗ 003709M&A, lagged −000216 001845 −000101 001838 −000101 001838New entrant without prior
experience, lagged006489 005500 006170 005478 006170 005478
New entrant with priorexperience, lagged
−006279∗∗ 002615 −006059∗∗ 002605 −006059∗∗ 002605
Exit due to M&A 002750 002444 001912 002444 001912 002444Exit due to bankruptcy −007644∗∗ 003902 −007990∗∗ 003888 −007990∗∗ 003888Dynamic capability, lagged 002736∗∗∗ 000714 002736∗∗∗ 000714Constant −105893∗∗ 006372 −203069∗∗∗ 008129 −204668∗∗∗ 008083Log likelihood −4129002 −4128105 −41274022
Notes. The dependent variable is log(Oil development expenditures). Models are estimated using Tobit random effects maximum likelihood.∗Significant at the 0.10 level or less; ∗∗significant at the 0.05 level or less; ∗∗∗significant at the 0.01 level or less.
Table 6 Success of Resource Access Activity (Oil Exploration) 4n = 118975
Model 1 Model 2 Model 3 (Full model)
Dependent variable Coeff. SE Coeff. SE Coeff. SE Marg. effect SE
Log(Oil exploration expenditures,lagged 5
003402∗∗∗ 000227 003314∗∗∗ 000228 003142∗∗∗ 000229 002722∗∗∗ 000201
Log(Total reserves, lagged 5 003339∗∗∗ 000499 003103∗∗∗ 000509 002644∗∗∗ 000519 002290∗∗∗ 000451Foreign reserves/Total reserves,
lagged−005538 004025 −005800 004021 −006430 004002 −005569 003469
Offshore operations andreserves, lagged
004979∗∗ 002379 004824∗∗ 002375 003231 002398 002802 002081
Presample dependent variable 003269∗∗∗ 000572 003483∗∗∗ 000577 003476∗∗∗ 000574 003010∗∗∗ 000497CEO with upstream expertise
only, lagged003422 002403 002845 002391 002477 002091
CEO with both upstream andnonupstream expertise,lagged
−001230 002118 −001695 002109 −001465 001820
M&A, lagged 003847∗∗ 001891 004056∗∗ 001880 003561∗∗ 001673New entrant without prior
experience, lagged−005651 006518 −006277 006506 −005279 005298
New entrant with priorexperience, lagged
−007318∗∗ 003359 −006747∗∗ 003334 −005674∗∗ 002715
Exit due to M&A 000759 002586 −000135 002581 −000117 002233Exit due to bankruptcy 002920 004796 002223 004769 001942 004203Dynamic capability, lagged 002704∗∗∗ 000727 002341∗∗∗ 000632Constant −600727∗∗∗ 004816 −508178∗∗∗ 005088 −509991∗∗∗ 005065Log likelihood −3132708 −3132006 −3131307
Notes. The dependent variable is log(Successful exploratory wells drilled ). Models are estimated using Tobit random effects maximumlikelihood.
∗Significant at the 0.10 level or less; ∗∗significant at the 0.05 level or less; ∗∗∗significant at the 0.01 level or less.
Dow
nloa
ded
from
info
rms.
org
by [
129.
170.
194.
153]
on
13 S
epte
mbe
r 20
16, a
t 13:
19 .
For
pers
onal
use
onl
y, a
ll ri
ghts
res
erve
d.
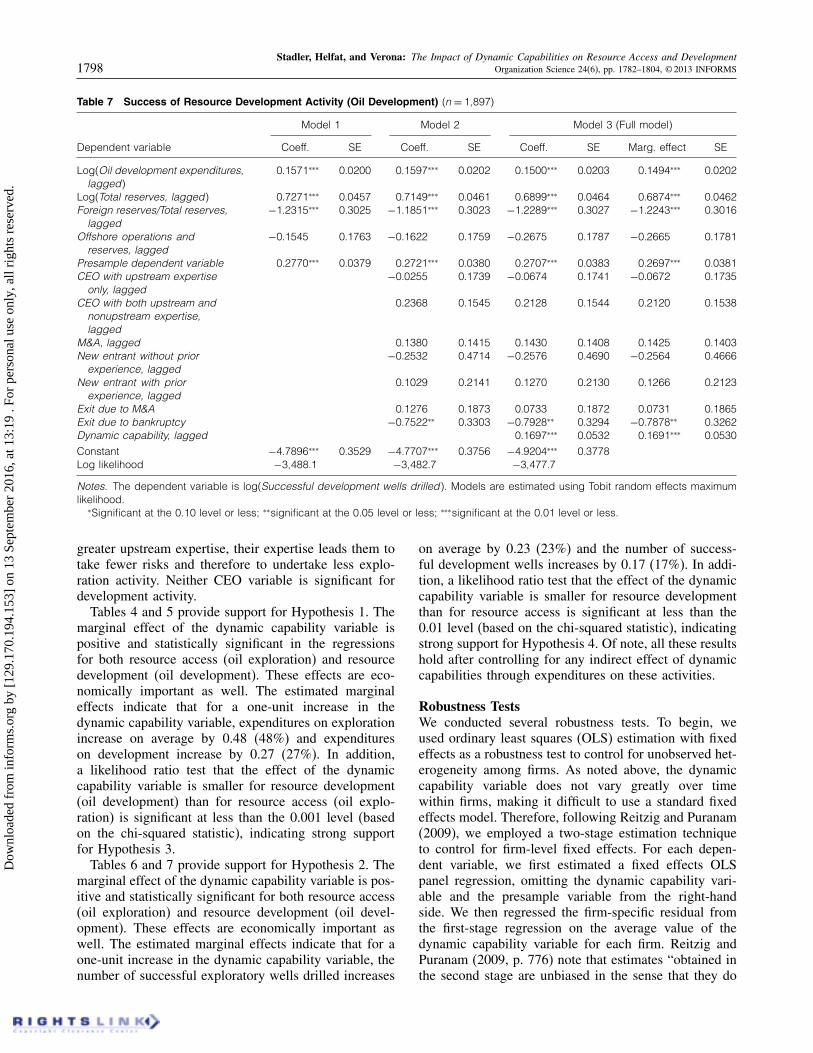
Stadler, Helfat, and Verona: The Impact of Dynamic Capabilities on Resource Access and Development1798 Organization Science 24(6), pp. 1782–1804, © 2013 INFORMS
Table 7 Success of Resource Development Activity (Oil Development) 4n = 118975
Model 1 Model 2 Model 3 (Full model)
Dependent variable Coeff. SE Coeff. SE Coeff. SE Marg. effect SE
Log(Oil development expenditures,lagged 5
001571∗∗∗ 000200 001597∗∗∗ 000202 001500∗∗∗ 000203 001494∗∗∗ 000202
Log(Total reserves, lagged 5 007271∗∗∗ 000457 007149∗∗∗ 000461 006899∗∗∗ 000464 006874∗∗∗ 000462Foreign reserves/Total reserves,
lagged−102315∗∗∗ 003025 −101851∗∗∗ 003023 −102289∗∗∗ 003027 −102243∗∗∗ 003016
Offshore operations andreserves, lagged
−001545 001763 −001622 001759 −002675 001787 −002665 001781
Presample dependent variable 002770∗∗∗ 000379 002721∗∗∗ 000380 002707∗∗∗ 000383 002697∗∗∗ 000381CEO with upstream expertise
only, lagged−000255 001739 −000674 001741 −000672 001735
CEO with both upstream andnonupstream expertise,lagged
002368 001545 002128 001544 002120 001538
M&A, lagged 001380 001415 001430 001408 001425 001403New entrant without prior
experience, lagged−002532 004714 −002576 004690 −002564 004666
New entrant with priorexperience, lagged
001029 002141 001270 002130 001266 002123
Exit due to M&A 001276 001873 000733 001872 000731 001865Exit due to bankruptcy −007522∗∗ 003303 −007928∗∗ 003294 −007878∗∗ 003262Dynamic capability, lagged 001697∗∗∗ 000532 001691∗∗∗ 000530Constant −407896∗∗∗ 003529 −407707∗∗∗ 003756 −409204∗∗∗ 003778Log likelihood −3148801 −3148207 −3147707
Notes. The dependent variable is log(Successful development wells drilled ). Models are estimated using Tobit random effects maximumlikelihood.
∗Significant at the 0.10 level or less; ∗∗significant at the 0.05 level or less; ∗∗∗significant at the 0.01 level or less.
greater upstream expertise, their expertise leads them totake fewer risks and therefore to undertake less explo-ration activity. Neither CEO variable is significant fordevelopment activity.
Tables 4 and 5 provide support for Hypothesis 1. Themarginal effect of the dynamic capability variable ispositive and statistically significant in the regressionsfor both resource access (oil exploration) and resourcedevelopment (oil development). These effects are eco-nomically important as well. The estimated marginaleffects indicate that for a one-unit increase in thedynamic capability variable, expenditures on explorationincrease on average by 0.48 (48%) and expenditureson development increase by 0.27 (27%). In addition,a likelihood ratio test that the effect of the dynamiccapability variable is smaller for resource development(oil development) than for resource access (oil explo-ration) is significant at less than the 0.001 level (basedon the chi-squared statistic), indicating strong supportfor Hypothesis 3.
Tables 6 and 7 provide support for Hypothesis 2. Themarginal effect of the dynamic capability variable is pos-itive and statistically significant for both resource access(oil exploration) and resource development (oil devel-opment). These effects are economically important aswell. The estimated marginal effects indicate that for aone-unit increase in the dynamic capability variable, thenumber of successful exploratory wells drilled increases
on average by 0.23 (23%) and the number of success-ful development wells increases by 0.17 (17%). In addi-tion, a likelihood ratio test that the effect of the dynamiccapability variable is smaller for resource developmentthan for resource access is significant at less than the0.01 level (based on the chi-squared statistic), indicatingstrong support for Hypothesis 4. Of note, all these resultshold after controlling for any indirect effect of dynamiccapabilities through expenditures on these activities.
Robustness TestsWe conducted several robustness tests. To begin, weused ordinary least squares (OLS) estimation with fixedeffects as a robustness test to control for unobserved het-erogeneity among firms. As noted above, the dynamiccapability variable does not vary greatly over timewithin firms, making it difficult to use a standard fixedeffects model. Therefore, following Reitzig and Puranam(2009), we employed a two-stage estimation techniqueto control for firm-level fixed effects. For each depen-dent variable, we first estimated a fixed effects OLSpanel regression, omitting the dynamic capability vari-able and the presample variable from the right-handside. We then regressed the firm-specific residual fromthe first-stage regression on the average value of thedynamic capability variable for each firm. Reitzig andPuranam (2009, p. 776) note that estimates “obtained inthe second stage are unbiased in the sense that they do
Dow
nloa
ded
from
info
rms.
org
by [
129.
170.
194.
153]
on
13 S
epte
mbe
r 20
16, a
t 13:
19 .
For
pers
onal
use
onl
y, a
ll ri
ghts
res
erve
d.
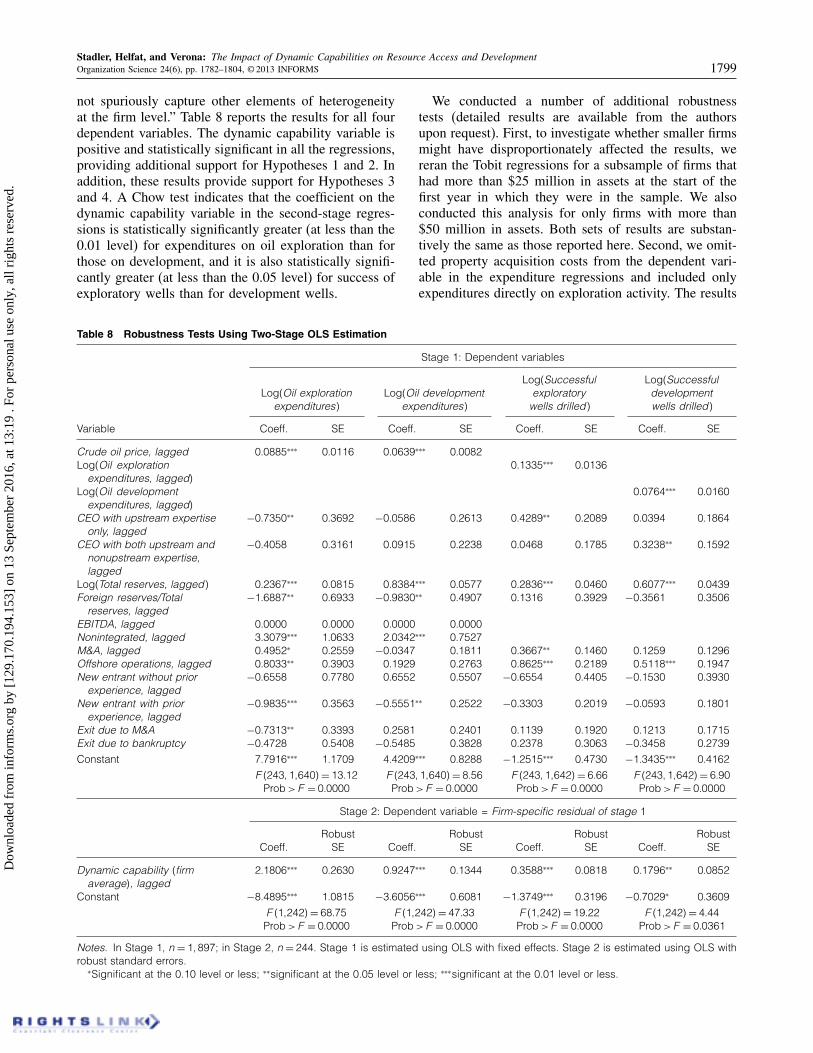
Stadler, Helfat, and Verona: The Impact of Dynamic Capabilities on Resource Access and DevelopmentOrganization Science 24(6), pp. 1782–1804, © 2013 INFORMS 1799
not spuriously capture other elements of heterogeneityat the firm level.” Table 8 reports the results for all fourdependent variables. The dynamic capability variable ispositive and statistically significant in all the regressions,providing additional support for Hypotheses 1 and 2. Inaddition, these results provide support for Hypotheses 3and 4. A Chow test indicates that the coefficient on thedynamic capability variable in the second-stage regres-sions is statistically significantly greater (at less than the0.01 level) for expenditures on oil exploration than forthose on development, and it is also statistically signifi-cantly greater (at less than the 0.05 level) for success ofexploratory wells than for development wells.
Table 8 Robustness Tests Using Two-Stage OLS Estimation
Stage 1: Dependent variables
Log(Successful Log(SuccessfulLog(Oil exploration Log(Oil development exploratory development
expenditures) expenditures) wells drilled ) wells drilled )
Variable Coeff. SE Coeff. SE Coeff. SE Coeff. SE
Crude oil price, lagged 000885∗∗∗ 000116 000639∗∗∗ 000082Log(Oil exploration
expenditures, lagged)001335∗∗∗ 000136
Log(Oil developmentexpenditures, lagged)
000764∗∗∗ 000160
CEO with upstream expertiseonly, lagged
−007350∗∗ 003692 −000586 002613 004289∗∗ 002089 000394 001864
CEO with both upstream andnonupstream expertise,lagged
−004058 003161 000915 002238 000468 001785 003238∗∗ 001592
Log(Total reserves, lagged ) 002367∗∗∗ 000815 008384∗∗∗ 000577 002836∗∗∗ 000460 006077∗∗∗ 000439Foreign reserves/Total
reserves, lagged−106887∗∗ 006933 −009830∗∗ 004907 001316 003929 −003561 003506
EBITDA, lagged 000000 000000 000000 000000Nonintegrated, lagged 303079∗∗∗ 100633 200342∗∗∗ 007527M&A, lagged 004952∗ 002559 −000347 001811 003667∗∗ 001460 001259 001296Offshore operations, lagged 008033∗∗ 003903 001929 002763 008625∗∗∗ 002189 005118∗∗∗ 001947New entrant without prior
experience, lagged−006558 007780 006552 005507 −006554 004405 −001530 003930
New entrant with priorexperience, lagged
−009835∗∗∗ 003563 −005551∗∗ 002522 −003303 002019 −000593 001801
Exit due to M&A −007313∗∗ 003393 002581 002401 001139 001920 001213 001715Exit due to bankruptcy −004728 005408 −005485 003828 002378 003063 −003458 002739Constant 707916∗∗∗ 101709 404209∗∗∗ 008288 −102515∗∗∗ 004730 −103435∗∗∗ 004162
F 42431116405= 13012 F 42431116405= 8056 F 42431116425= 6066 F 42431116425= 6090Prob>F = 000000 Prob >F = 000000 Prob>F = 000000 Prob >F = 000000
Stage 2: Dependent variable = Firm-specific residual of stage 1
Robust Robust Robust RobustCoeff. SE Coeff. SE Coeff. SE Coeff. SE
Dynamic capability 4firmaverage5, lagged
201806∗∗∗ 002630 009247∗∗∗ 001344 003588∗∗∗ 000818 001796∗∗ 000852
Constant −804895∗∗∗ 100815 −306056∗∗∗ 006081 −103749∗∗∗ 003196 −007029∗ 003609F 4112425= 68075 F 4112425= 47033 F 4112425= 19022 F 4112425= 4044
Prob >F = 000000 Prob>F = 000000 Prob >F = 000000 Prob >F = 000361
Notes. In Stage 1, n = 11897; in Stage 2, n = 244. Stage 1 is estimated using OLS with fixed effects. Stage 2 is estimated using OLS withrobust standard errors.
∗Significant at the 0.10 level or less; ∗∗significant at the 0.05 level or less; ∗∗∗significant at the 0.01 level or less.
We conducted a number of additional robustnesstests (detailed results are available from the authorsupon request). First, to investigate whether smaller firmsmight have disproportionately affected the results, wereran the Tobit regressions for a subsample of firms thathad more than $25 million in assets at the start of thefirst year in which they were in the sample. We alsoconducted this analysis for only firms with more than$50 million in assets. Both sets of results are substan-tively the same as those reported here. Second, we omit-ted property acquisition costs from the dependent vari-able in the expenditure regressions and included onlyexpenditures directly on exploration activity. The results
Dow
nloa
ded
from
info
rms.
org
by [
129.
170.
194.
153]
on
13 S
epte
mbe
r 20
16, a
t 13:
19 .
For
pers
onal
use
onl
y, a
ll ri
ghts
res
erve
d.
Stadler, Helfat, and Verona: The Impact of Dynamic Capabilities on Resource Access and Development1800 Organization Science 24(6), pp. 1782–1804, © 2013 INFORMS
are substantively the same as those reported here. Third,in the model for exploration expenditures, we added avariable for net purchases of reserves (lagged) to controlfor the possibility that firms might substitute purchasesof reserves for oil exploration activity. Firms can pur-chase reserves through purchases of land or by acquiringfirms that have proved reserves; firms also frequently sellproved reserves through sales of land (Finch and Acha2009).23 This variable was not statistically significant.Fourth, we combined the two CEO dummy variablesinto one, indicating whether the CEO had any upstreamexpertise at all. This variable was not significant. Fifth,to investigate the possibility that CEOs might have alarger impact in smaller firms, we reran the regressionsfor the subsample of firms with assets values of $25 orless. The CEO variables remained insignificant for thesefirms.
As a sixth robustness test, in the model for success-ful development wells drilled, we added a variable forsuccessful exploratory wells drilled in the prior year tocontrol for the possibility that firms with greater priorsuccess in exploration might have greater developmentsuccess. This variable was not significant. Seventh, in themodel for development expenditures, we added a vari-able for prior exploration expenditures and a variable forprior exploration success, both separately and togetherin the same model. In these regressions, the marginaleffects of these variables were positive and statisticallysignificant, but the dynamic capability variable remainedpositive and statistically significant at the 0.01 level,with similar marginal effects to that reported in Table 5.Finally, we constructed an alternate dynamic capabil-ity variable for the extent of technological sophisticationfor seismic imaging alone. Because imaging precedesdrilling, imaging might have a disproportionate impacton the amount and success of resource access and devel-opment activity. The substantive results reported earliercontinue to hold. The alternate dynamic capability vari-able is positive and statistically significant in all theregressions, providing additional support for Hypothe-ses 1 and 2. The marginal effect also is substantiallylarger for exploration than for development, providingadditional support for Hypotheses 3 and 4.
DiscussionThese results demonstrate the effect of dynamic capa-bilities on both the amount and the success of activitiesdirected toward resource access and development in theupstream oil industry. When firms have more sophisti-cated dynamic capabilities, they undertake more activitydirected toward both resource access (oil exploration)and resource development (oil development), consistentwith Hypothesis 1. The estimated marginal effects arestatistically and economically significant. In addition,
the results show that dynamic capabilities have a directeffect on the success of activities directed toward bothresource access and resource development, even aftercontrolling for the amount of each activity; this is con-sistent with Hypothesis 2. Again, the estimated marginaleffects are statistically and economically significant.
The results also show that, not surprisingly, upstreamoil companies that undertake more resource access anddevelopment activity have greater success in these activi-ties. The expenditure variables, which reflect the amountof activity undertaken, have economically importantmarginal effects on the success of these activities.The marginal effect of expenditures on the success ofresource access (oil exploration) is 0.27 (27%), andthe marginal effect of expenditures on the success ofresource development (oil development) is 0.15 (15%).The economic and statistical significance of these expen-diture variables points to the importance of controllingfor the amount of activity when analyzing the impact ofdynamic capabilities on the success of activities directedtoward change.
We can compare the direct effect of dynamic capabil-ities on the success of resource access and developmentactivities with the indirect effect through the amountof activity undertaken. To estimate the indirect effectof the dynamic capability variable on the success ofeach activity, we can multiply the estimated marginaleffect of the dynamic capability variable in each expen-diture regression by the estimated marginal effect ofexpenditures in the associated regression for success-ful wells drilled.24 For resource access (oil exploration),this indirect marginal effect is 0.13 (0048 × 0027);for resource development (oil development), the indi-rect marginal effect is 0.04 (0027 × 0015). This bringsthe combined direct and indirect marginal effects ofdynamic capabilities to 0.36 for resource access and to0.21 for resource development. The indirect effects con-stitute approximately 35% of the combined effects ofdynamic capabilities for resource access and approxi-mately 20% of the combined effects for resource devel-opment. Thus, the indirect effects are economicallyimportant, but the direct effects of dynamic capabilitieson the success of each activity are much larger.
The results also support Hypotheses 3 and 4, thatdynamic capabilities have a smaller effect on the amountand success of activity for resource development thanfor resource access. Our analysis provides a particularlyappropriate test of these hypotheses, in that resourcedevelopment in the upstream oil industry relies heavilyon prior direct knowledge of oil and gas reserves gainedthrough resource access activity. Moreover, because thesame dynamic capabilities underlie activity directedtoward both resource access and development, thismakes it more likely that differences in the estimatedeffects of dynamic capabilities for the two activities stemfrom differences in prior direct knowledge of resources,
Dow
nloa
ded
from
info
rms.
org
by [
129.
170.
194.
153]
on
13 S
epte
mbe
r 20
16, a
t 13:
19 .
For
pers
onal
use
onl
y, a
ll ri
ghts
res
erve
d.

Stadler, Helfat, and Verona: The Impact of Dynamic Capabilities on Resource Access and DevelopmentOrganization Science 24(6), pp. 1782–1804, © 2013 INFORMS 1801
as opposed to differences in the capabilities them-selves. Notably, the difference in the estimated marginaleffects for resource access and resource development issizeable. For expenditures, the marginal effect of thedynamic capability variable is 1.78 times greater forresource access than for resource development. For suc-cessful wells drilled, the marginal effect of the dynamiccapability variable is 1.35 times greater for resourceaccess than for resource development.
Of the control variables, not surprisingly, firms withmore upstream assets in terms of proved reserves tendedto conduct more activity directed toward resource accessand development, and they had greater success. Oilprices also have a large impact on the amount of expen-ditures for resource access and development activity.When prices are high, firms undertake more of theseactivities, and vice versa when prices are low. The sig-nificance of this variable points to the importance of con-trolling for key factors in the external environment whenanalyzing the impact of dynamic capabilities. Otherwise,there is a risk of misattributing the influence of factorsin the external environment to dynamic capabilities. Toinvestigate the potential for this sort of misattribution inour setting, we omitted the oil price variable from theexpenditure regressions. The estimated marginal effectsof the dynamic capability variable rose substantially, par-ticularly during the second half of the time period whenprices were rising; this illustrates the danger of omittingkey environmental variables.
In most of the regressions, the CEO variables wereinsignificant. Unfortunately, we could not obtain as pre-cise information regarding CEO expertise as desirable.In addition, most firms had relatively few CEOs—anaverage of 1.7 CEOs per firm; this low variation withinfirms makes it more difficult to detect CEO effects in afixed effects type of model that primarily captures vari-ation within firms over time. Nevertheless, the resultssuggest that CEO expertise may be less important forresource access and development than dynamic capabil-ities within the organization.
This analysis used a measure of the attributes ofdynamic capabilities based on uniquely detailed dataspecific to the industry in question. The results showthat not only do dynamic capabilities have statisticallysignificant effects but the magnitudes of the effects areeconomically important as well. Firms in the upstreamoil industry that had more technologically sophisticateddynamic capabilities relied on them to conduct greateramounts of activity directed toward resource access anddevelopment. Dynamic capabilities also had a directeffect on the success of these activities—suggestingthat dynamic capabilities may contribute to competitiveadvantage in resource access and development.
ConclusionThis study enhances our understanding of dynamic capa-bilities in several ways. First, the analysis advances
our theoretical understanding of dynamic capabilities.We examine how dynamic capabilities affect stages ofresource access and development in order to betterunderstand the potential impact of dynamic capabilitieson resource extension and modification. The analysisshows that dynamic capabilities are likely to affect notonly the success of activities directed toward changebut also the requisite investments in terms of expendi-tures to fund these activities. Additionally, the analysissuggests that a lack of prior direct knowledge of theresources in question may cause dynamic capabilitiesto have greater importance for resource access than forresource development.
Second, we empirically analyze dynamic capabilitiesin new ways. We separate the amount of each activitythat firms undertake from the success of the activity, andwe estimate the effect of dynamic capabilities on each.We also estimate the indirect effect of dynamic capabil-ities on the success of activities through the amount ofsuch activities firms undertake. In addition, we analyzehow the impact of dynamic capabilities may differ forresource access and development. Finally, we measurethe attributes of dynamic capabilities separately from theextent of success in utilizing these capabilities.
This study has several limitations. Notably, it is lim-ited to one industry, and future research is needed toascertain whether the findings hold in other industries.In addition, because of data limitations, we were unableto examine the impact of dynamic capabilities on finan-cial performance. Available measures of financial per-formance, such as return on assets or Tobin’s q, dependon factors other than resource access and developmentthat are difficult to control for in this industry (notably,oil production) and include nonupstream businesses forsome firms.
This study contains new theoretical analysis and find-ings that provide a foundation for future research onthe impact of dynamic capabilities on stages of resourceaccess and development. More generally, the questionof how prior direct knowledge of resources, and thedifficulty of an activity in general, affects the useful-ness and impact of dynamic capabilities is an issue thatwould benefit from future research. Our results sug-gest an important contingency in the study of dynamiccapabilities—namely, that the impact of these capabili-ties may depend on the type of activity in question.
AcknowledgmentsThe authors gratefully acknowledge the assistance of HeroldInc. in providing them with data on the oil industry. The firstauthor also benefited from a fellowship from the AustrianAcademy of Sciences while in residence as a Visiting Scholarat the Tuck School. In addition, the authors received researchfunding from the Tuck School of Business and from KiTeS atBocconi University. The usual caveat applies.
Dow
nloa
ded
from
info
rms.
org
by [
129.
170.
194.
153]
on
13 S
epte
mbe
r 20
16, a
t 13:
19 .
For
pers
onal
use
onl
y, a
ll ri
ghts
res
erve
d.
Stadler, Helfat, and Verona: The Impact of Dynamic Capabilities on Resource Access and Development1802 Organization Science 24(6), pp. 1782–1804, © 2013 INFORMS
Endnotes1As Helfat and Peteraf (2003) and Amit and Schoemaker(2013) note, “resources” can be defined to include inputs toproduction as well as assets. In most cases, inputs derive fromassets of some type. In this study, we focus on assets.2This usage is consistent with dictionary definitions such asthat in the Merriam-Webster online dictionary (http://www.merriam-webster.com/dictionary/access, accessed February 10,2012), where access (as a verb) means “to gain access to” or“to obtain.” Firms can have access to a resource through avariety of means, including owning or controlling the use ofthe resource.3Firm resources include tangible assets such as plants andequipment; intangible assets such as reputation, relationships,and knowledge; and human assets such as human capital (Amitand Schoemaker 1993, Grant 2005). Helfat et al. (2007) fol-low Amit and Schoemaker (1993) in distinguishing an asset,termed a “resource,” from the ability to utilize it, termed a“capability.” Teece et al. (1997) do not provide a precise def-inition of “competence” or “skill,” and the literature containsa variety of definitions and usages of the terms “capabilities,”“competences,” and “skills.” These terms are often used syn-onymously, as we do here.4Helfat and Winter (2011, p. 1244) note that “important con-cepts rarely have edges that are entirely sharp, and this case[of dynamic capabilities] is no exception 0 0 0 an important ‘mat-ter of degree’ issue lurks in the words ‘minimally satisfac-tory’ and also in ‘reliable.’ Historical contexts and prevailingcompetitive standards are generally relevant to the practicalinterpretation here.”5Economic viability depends on demand for the output of anactivity and on competition in the market for the product thatthe resource supports, in addition to at least minimally satis-factory performance of an activity (see Helfat et al. 2007).6Wikipedia contributors, “Drug development.” Wikipedia, TheFree Encyclopedia. Accessed February 10, 2012, http://en.wikipedia.org/wiki/Drug_development.7Although future profits from resource access depend on fur-ther development of the resources, resource access activitiesmay have different characteristics than resource developmentactivities, as explained below. It therefore is appropriate toanalyze resource access and development separately.8These costs include both fixed and marginal costs. In general,fixed costs include ongoing overhead costs as well as costsexpended prior to deployment. For dynamic capabilities, thelatter are often sunk (nonrecoverable) (Winter 2003).9In this industry, oil and gas reserves are considered assets (orresources, in the terminology used here) and are treated thisway for accounting purposes.10A reservoir essentially is a “rock sponge.” Hydrocarbonsare trapped in the pores of the rock. Differences in reservoirsare due to the type of rock (e.g., sandstone, limestone), thestructure of the reservoir (e.g., flat layers, curved, fracturedrock), the depth and physical location in which the reservoir islocated, the pressure in the reservoir, and the composition ofthe reservoir (e.g., how much water it contains). These factorsresult in an endless variety of reservoirs.11This process is well known in the industry (see, e.g., Stoneley1995, Finch et al. 2002, Society of Petroleum Engineers 2004).
122D technology provides two-dimensional images of the sub-surface. In 3D technology, three-dimensional images are pre-sented in special rooms that enable geologists and geophysi-cists to literally walk in the image while they interpret thedata. 4D seismic imaging adds an additional parameter of time,enabling specialists to simulate the development of a reservoirover time and calculate how production would affect a reser-voir, enabling firms to better estimate the amount of oil theymay be able to extract (Dubinsky and Baecker 1999).13When we began data collection in early 2008, the most recentpublicly available data were for 2006. Given the lagged valuesof the right-hand-side variables, the earliest year of data forthe sample is 1992. We did not collect data for earlier yearsfor two reasons. First, oil prices were extremely volatile in theyears immediately preceding 1992, which could confound theanalysis. Second, it is difficult to obtain data for the full sampleof firms prior to 1992. Financial and oil and gas operating dataare not available from online sources for years prior to 1992,and other sources of information this far back in time can bedifficult to obtain. In addition, some of these data are not avail-able at all farther back in time, because firms were not requiredto report them.14Total assets that companies report do not include the esti-mated value of proved reserves.15We obtained some data contained in these reports from Com-pustat (income and asset data) and from Herold Inc., a lead-ing upstream oil research firm (data on proved oil reserves,wells drilled, and exploration and development expenditures).We obtained the remainder of the information in these reportsfrom the SEC website via the EDGAR database.16For further explanation, see U.S. Securities and ExchangeCommission (1975, 1978).17No nonzero expenditure values were as low as one dollar,so this transformation preserves the censoring threshold in ouroriginal data.18Data are not available on the estimated amount of recoverableoil from newly drilled successful wells.19Studies of the evolution of oil and gas technology that doc-ument aspects of this hierarchy include those by Graebneret al. (1981), Dubinsky and Baecker (1999), Lubinski (1950),Longbottom and Herrera (1997), and the Journal of PetroleumTechnology (1999a, 1999b). Although firms that have the abil-ity to deploy a more sophisticated technique also possess theability to deploy less sophisticated techniques, a firm does nothave to have experience using the less sophisticated techniquesin order to deploy the more sophisticated ones. Informationobtained during the factual interviews with company technicalpersonnel described earlier also confirmed the existence andnature of such a hierarchy of technological sophistication.20Most firms in the sample undertake a positive amount ofeither exploration or development (and often both) activity ina given year, through which they maintain their capabilities.Although some firms may not use each technology every year,use of more advanced technologies enables firms to maintaintheir capabilities for less advanced technologies (as explainedin endnote 19). In addition, if firms fail to maintain their capa-bilities through use of the technologies, we will not find empir-ical support for our hypotheses.21Crude oil prices remained largely within a relatively stable$20–$30 per barrel range from 1992 to 1998, before temporar-ily dipping below $10 per barrel during the Asian financial
Dow
nloa
ded
from
info
rms.
org
by [
129.
170.
194.
153]
on
13 S
epte
mbe
r 20
16, a
t 13:
19 .
For
pers
onal
use
onl
y, a
ll ri
ghts
res
erve
d.

Stadler, Helfat, and Verona: The Impact of Dynamic Capabilities on Resource Access and DevelopmentOrganization Science 24(6), pp. 1782–1804, © 2013 INFORMS 1803
crisis of 1999. Annual average oil prices then rose in fits andstarts from $20 per barrel in mid-2000 to more than $50 perbarrel at the end of 2006.22Wooldridge (2002, p. 541) provides an alternate technique forobtaining consistent coefficient estimates that control for fixedeffects in Tobit regressions. Because this technique relies on theuse of per-firm mean values of the right-hand-side variables,which are highly correlated with the slowly changing capabilityvariable, we cannot use Wooldridge’s technique for the samereasons as noted in the text.23The net purchases variable is calculated as additions of newproved reserves through land purchases or company acquisi-tions minus proved reserves sold through land sales. Becausenet purchases of reserves can be negative as a result of sales ofreserves, the values are not converted to natural logarithms.24By definition, the first derivative of well drilling success withrespect to dynamic capabilities via expenditures (the indirectmarginal effect) equals the first derivative of well drilling suc-cess with respect to expenditures (the marginal effect of expen-ditures on well drilling success) multiplied by the first deriva-tive of expenditures with respect to dynamic capabilities (themarginal effect of dynamic capabilities on expenditures).
ReferencesAcha VL (2002) Framing the past and future: The development and
deployment of technological capabilities by the oil majors in theupstream petroleum industry. Ph.D. thesis, University of Sussex,Brighton, UK.
Acs ZJ, Anselin L, Varga A (2002) Patents and innovation counts asmeasures of regional production of new knowledge. Res. Policy31(7):1069–1085.
Adner R, Helfat CE (2003) Corporate effects and dynamic managerialcapabilities. Strategic Management J. 24(10):1011–1025.
Ahuja G, Katila R (2001) Technological acquisitions and the inno-vation performance of acquiring firms: A longitudinal analysis.Strategic Management J. 22(3):197–220.
Amit R, Schoemaker P (1993) Strategic assets and organizational rent.Strategic Management J. 14(1):33–46.
Amit R, Schoemaker P (2013) Resources and capabilities. Teece DJ,Augier M, eds. The Palgrave Encyclopedia of Strategic Manage-ment (Palgrave Macmillan, Basingstoke, Hamphire, UK). Forth-coming.
Barney J (1991) Firm resources and sustained competitive advantage.J. Management 17(1):99–120.
Bertrand M, Schoar A (2003) Managing with style: The effect of man-agers on firm policies. Quart. J. Econom. 118(4):1169–1208.
Blundell R, Griffith R, Van Reenen J (1995) Dynamic count data mod-els of technological innovation. Econom. J. 105(429):333–344.
Cameron AC, Trivedi PK (2009) Microeconometrics Using Stata(Stata Press, College Station, TX).
Capron L, Mitchell W (1998) Bilateral resource redeploymentand capabilities improvement following horizontal acquisitions.Indust. Corporate Change 7(3):453–483.
Daily CM, Certo ST, Dalton DR (2000) International experience in theexecutive suite: The path to prosperity? Strategic ManagementJ. 21(4):515–523.
Dierickx I, Cool K (1989) Asset stock accumulation and sustainabilityof competitive advantage. Management Sci. 35(12):1504–1511.
Di Stefano G, Peteraf MA, Verona G (2010) Dynamic capabili-ties deconstructed: A bibliographic investigation into the ori-gins, development, and future directions of the research domain.Indust. Corporate Change 19(4):1187–1204.
Dubinsky VS, Baecker DR (1999) An interactive drilling-dynamicssimulator for drilling optimization and training. J. PetroleumTech. 51(2):46–47.
Eisenhardt KM, Martin JA (2000) Dynamic capabilities: What arethey? Strategic Management J. 21(10–11):1105–1121.
Finch J, Acha V (2009) Making and exchange of a second-hand oilfield, considered in an industrial marketing setting. MarketingTheory 8(1):45–66.
Finch JH, Macmilan FE, Simpson GS (2002) On the diffusion ofprobabilistic investment appraisal and decision-making proce-dures in the UK’s upstream oil and gas industry. Res. Policy31(6):969–988.
Graebner R, Wason C, Meinardus H (1981) Three-dimensional meth-ods in seismic exploration. Science 211(4482):535–540.
Grant RM (2003) Strategic planning in a turbulent environment:Evidence from the oil majors. Strategic Management J. 24(6):491–517.
Grant RM (2005) Contemporary Strategy Analysis, 5th ed. (Black-well, Malden, MA).
Grant RM, Verona G (2013) Measuring organizational competence.Teece DJ, Augier M, eds. The Palgrave Encyclopedia of Strate-gic Management (Palgrave Macmillan, Basingstoke, Hampshire,UK). Forthcoming.
Greene WH (1997) Econometric Analysis, 3rd ed. (Prentice-Hall,Upper Saddle River, NJ).
Helfat CE (1994a) Firm-specificity in corporate applied R&D. Organ.Sci. 5(2):173–184.
Helfat CE (1994b) Evolutionary trajectories in petroleum firm R&D.Management Sci. 40(12):1720–1747.
Helfat CE (1997) Know-how and asset complementarity and dynamiccapability accumulation: The case of R&D. Strategic Manage-ment J. 18(5):339–361.
Helfat CE, Peteraf MA (2003) The dynamic resource-basedview: Capability lifecycles. Strategic Management J. 24(10):997–1010.
Helfat CE, Winter SG (2011) Untangling dynamic and operationalcapabilities: Strategy for the (n)ever-changing world. StrategicManagement J. 32(11):1243–1250.
Helfat CE, Finkelstein S, Mitchell W, Peteraf MA, Singh H, Teece DJ,Winter SG (2007) Dynamic Capabilities: Understanding Strate-gic Change in Organizations (Blackwell, Malden, MA).
Henderson R (1994) The evolution of integrative capability: Innova-tion in cardiovascular drug discovery. Indust. Corporate Change3(3):607–630.
Hoopes DG, Madsen TL, Walker G (2003) Why is there a resource-based view? Toward a theory of competitive heterogeneity.Strategic Management J. 24(10):889–902.
Journal of Petroleum Technology (1999a) Horizontal and multilateralwells: Increasing production and reducing overall drilling andcompletion costs. J. Petroleum Tech. 51(7):20–24.
Journal of Petroleum Technology (1999b) Seismic technology: Evo-lution of a vital tool for reservoir engineers. J. Petroleum Tech.51(2):22–28.
Karim S (2009) Business unit reorganization and innovation in newproduct markets. Management Sci. 55(7):1237–1254.
Dow
nloa
ded
from
info
rms.
org
by [
129.
170.
194.
153]
on
13 S
epte
mbe
r 20
16, a
t 13:
19 .
For
pers
onal
use
onl
y, a
ll ri
ghts
res
erve
d.

Stadler, Helfat, and Verona: The Impact of Dynamic Capabilities on Resource Access and Development1804 Organization Science 24(6), pp. 1782–1804, © 2013 INFORMS
Ketchen DJ Jr, Hult TM, Slater SF (2007) Toward greater understand-ing of market orientation and the resource-based view. StrategicManagement J. 28(9):961–964.
Kukalis S, Jungemann M (1995) Strategic planning for a joint venture.Long Range Planning 28(3):46–56.
Kutner MH, Nachtsheim CJ, Neter J (2004) Applied Linear Regres-sion Models, 4th ed. (McGraw-Hill Irwin, Chicago).
Leiblein MJ, Madsen TL (2009) Unbundling competitive heterogene-ity: Incentive structure and capability influences on technologi-cal innovation. Strategic Management J. 30(7):711–735.
Longbottom J, Herrera I (1997) Multilateral wells can multiplyreserve potential. Amer. Oil Gas Reporter 40(9):53–58.
Lubinski A (1950) A study of the buckling of rotary drilling strings.API Drilling and Production Practices (American PetroleumInstitute, Washington, DC), 178–215.
McGahan A (1995) The pharmaceutical industry in the 1990s. HBSCase 9-796-058, Harvard Business School, Boston.
Nelson RR (1991) Why do firms differ, and how does it matter?Strategic Management J. 12(S2):61–74.
Peteraf MA (1993) The cornerstones of competitive advantage:A resource-based view. Strategic Management J. 14(3):179–191.
Pindyck RS, Rubinfeld DL (1998) Econometric Models and Eco-nomic Forecasts, 4th ed. (Irwin/McGraw-Hill, Boston).
Quick A, Buck N (1984) Strategic Planning for Exploration Manage-ment (Prentice-Hall, Boston).
Reitzig M, Puranam P (2009) Value appropriation as an organizationalcapability: The case of IP protection through patents. StrategicManagement J. 30(7):765–789.
Severi Bruni D, Verona G (2009) Dynamic marketing capabilities inscience-based firms: An exploratory investigation of the phar-maceutical industry. British J. Management 20(S1):S101–S117.
Shane S (2009) Technology Strategy for Managers and Entrepreneurs(Pearson Prentice Hall, London).
Society of Petroleum Engineers (2004) Petroleum reserves andresources definitions. Accessed June 23, 2010, http://www.spe.org/industry/reserves.php.
Stadler C (2011) Process innovation and integration in process ori-ented settings: The case of the oil industry. J. Product InnovationManagement 28(7):44–62.
Stoneley R (1995) Introduction to Petroleum Exploration for Non-Geologists (Oxford University Press, Oxford, UK).
Teece DJ (2007) Explicating dynamic capabilities: The natureand microfoundations of (sustainable) enterprise performance.Strategic Management J. 28(13):1319–1350.
Teece DJ, Pisano G, Shuen A (1997) Dynamic capabilities and strate-gic management. Strategic Management J. 18(7):509–533.
U.S. Energy Information Admistration (2012) Crude oil prices (collarsper barrel). Petroleum Marketing Monthly (February) http://www.eia.gov/pub/oil_gas/petroleum/data_publications/petroleum_marketing_monthly/current/pdf/pmmtab1.pdf.
U.S Securities and Exchange Commission (1975) Financial account-ing and reporting for oil and gas producing activities pursuantto the Federal securities laws and the Energy Policy and Con-servation Act of 1975. Rule 17 CFR §210.4-10, Securities andExchange Commission, Washington, DC.
U.S. Securities and Exchange Commission (1978) Financial account-ing and reporting by oil and gas producing companies. Statementof Financial Accounting Standards 19, Department of Energy,Washington, DC.
Wernerfelt B (1984) A resource-based view of the firm. StrategicManagement J. 5(2):171–180.
Weston JF, Johnson BA, Siu JA (1999) Mergers and restructur-ing in the world oil industry. J. Energy Finance Development4(2):149–183.
Winter SG (2003) Understanding dynamic capabilities. StrategicManagement J. 24(10):991–996.
Wooldridge JM (2002) Econometric Analysis of Cross Section andPanel Data (MIT Press, Cambridge, MA).
Ziedonis RH (2004) Don’t fence me in: Fragmented markets for tech-nology and the patent acquisition strategies of firms. Manage-ment Sci. 50(6):804–820.
Christian Stadler is an associate professor of strate-gic management at Warwick Business School. He receivedhis Ph.D. from the University of Innsbruck in Austria. Hisresearch interests include dynamic capabilities, ambidexterity,and corporate diversification.
Constance E. Helfat is the J. Brian Quinn Professor inTechnology and Strategy at the Tuck School of Businessat Dartmouth. Her research focuses on firm capabilities andknowledge, with an emphasis on technological innovation andfirm adaptation and change. She also has conducted researchon corporate executives, including women executives.
Gianmario Verona is the Telecom Italia Mobile Professorof Market Innovation at Bocconi University, where he is alsoa member of the faculty of the SDA Bocconi School of Man-agement. His research interests include dynamic capabilities,knowledge integration, and open and user innovation.
Dow
nloa
ded
from
info
rms.
org
by [
129.
170.
194.
153]
on
13 S
epte
mbe
r 20
16, a
t 13:
19 .
For
pers
onal
use
onl
y, a
ll ri
ghts
res
erve
d.