the impact of dollar devaluation on world oil industry: do...
TRANSCRIPT

A. F. Alhajji. July 2004 1
The Impact of Dollar Devaluation on World Oil Industry: Do Exchange Rates Matter?
A. F. Alhajji, Ph.D.Associate ProfessorCollege of Business AdministrationOhio Northern universityAda, Oh, 45810
A. F. Alhajji. July 2004 2
OutlineIntroductionThe Impact of Exchange Rates on Supply
Exchange Rates and Drilling ActivitiesExchange Rates and ProductionExchange Rates and ExportsExchange Rates and Purchasing PowerExchange Rates and Inflation
The Impact of Exchange Rates on DemandThe direct impactThe indirect impact
Empirical EvidenceConclusions

A. F. Alhajji. July 2004 3
FactsCrude Oil is priced in US dollars while products are priced in local currencies.Oil revenues for countries and most oil companies are in US dollars.International oil companies operate around the world and use different currencies.Producing countries trade is denominated in US dollars and other world currencies.Producing countries have different trade partners.

A. F. Alhajji. July 2004 4
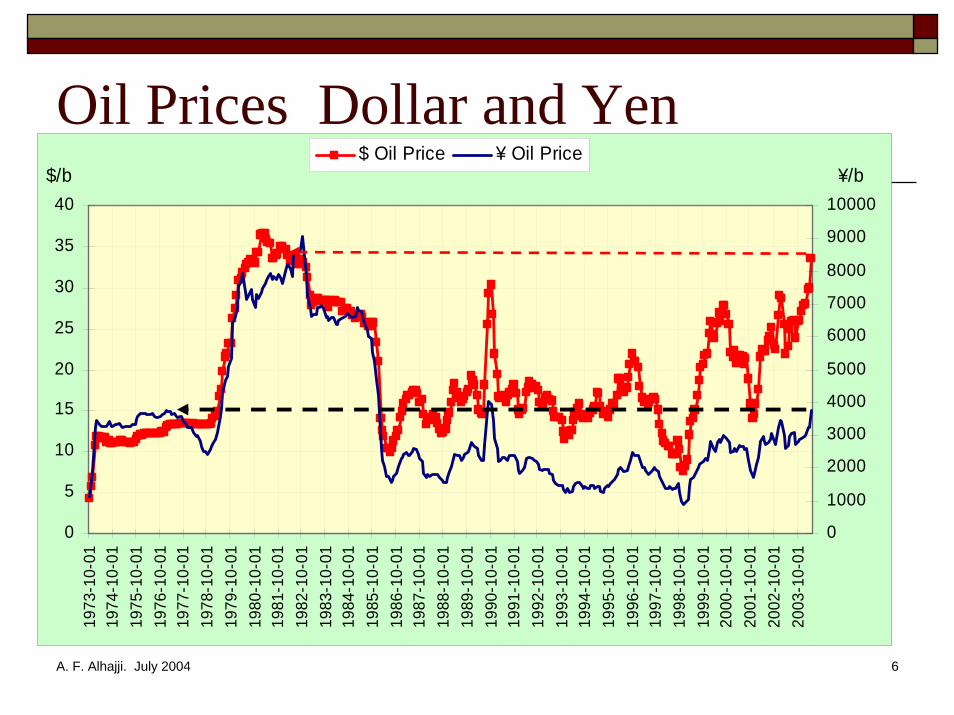
ObservationsOil Prices are high only in dollars but they are relatively low in other currencies, especially the Euro and the yen.See the four figures below

A. F. Alhajji. July 2004 5
Oil Prices in Dollar and Euro
8
13
18
23
28
33
38
43
1/4/
1999
4/4/
1999
7/4/
1999
10/4
/199
9
1/4/
2000
4/4/
2000
7/4/
2000
10/4
/200
0
1/4/
2001
4/4/
2001
7/4/
2001
10/4
/200
1
1/4/
2002
4/4/
2002
7/4/
2002
10/4
/200
2
1/4/
2003
4/4/
2003
7/4/
2003
10/4
/200
3
1/4/
2004
4/4/
2004
WTI ($) Brent (€)$&€/b
A. F. Alhajji. July 2004 6
Oil Prices Dollar and Yen
0
5
10
15
20
25
30
35
40
1973
-10-
0119
74-1
0-01
1975
-10-
0119
76-1
0-01
1977
-10-
0119
78-1
0-01
1979
-10-
0119
80-1
0-01
1981
-10-
0119
82-1
0-01
1983
-10-
0119
84-1
0-01
1985
-10-
0119
86-1
0-01
1987
-10-
0119
88-1
0-01
1989
-10-
0119
90-1
0-01
1991
-10-
0119
92-1
0-01
1993
-10-
0119
94-1
0-01
1995
-10-
0119
96-1
0-01
1997
-10-
0119
98-1
0-01
1999
-10-
0120
00-1
0-01
2001
-10-
0120
02-1
0-01
2003
-10-
01
0
1000
2000
3000
4000
5000
6000
7000
8000
9000
10000
$ Oil Price ¥ Oil Price$/b ¥/b

A. F. Alhajji. July 2004 7
Oil Prices in Dollar and DM
0
10
20
30
40
50
60
70
80
90
100
Oct
-73
Oct
-74
Oct
-75
Oct
-76
Oct
-77
Oct
-78
Oct
-79
Oct
-80
Oct
-81
Oct
-82
Oct
-83
Oct
-84
Oct
-85
Oct
-86
Oct
-87
Oct
-88
Oct
-89
Oct
-90
Oct
-91
Oct
-92
Oct
-93
Oct
-94
Oct
-95
Oct
-96
Oct
-97
Oct
-98
Oct
-99
Oct
-00
Oct
-01
Oct
-02
Oct
-03
$ Oil Price DM Oil Price

A. F. Alhajji. July 2004 8
Oil Prices in Dollar and Sterling
0
5
10
15
20
25
30
35
40
Oct
-73
Oct
-74
Oct
-75
Oct
-76
Oct
-77
Oct
-78
Oct
-79
Oct
-80
Oct
-81
Oct
-82
Oct
-83
Oct
-84
Oct
-85
Oct
-86
Oct
-87
Oct
-88
Oct
-89
Oct
-90
Oct
-91
Oct
-92
Oct
-93
Oct
-94
Oct
-95
Oct
-96
Oct
-97
Oct
-98
Oct
-99
Oct
-00
Oct
-01
Oct
-02
Oct
-03
$ Oil Price £ Oil Price$/£/b
A. F. Alhajji. July 2004 9
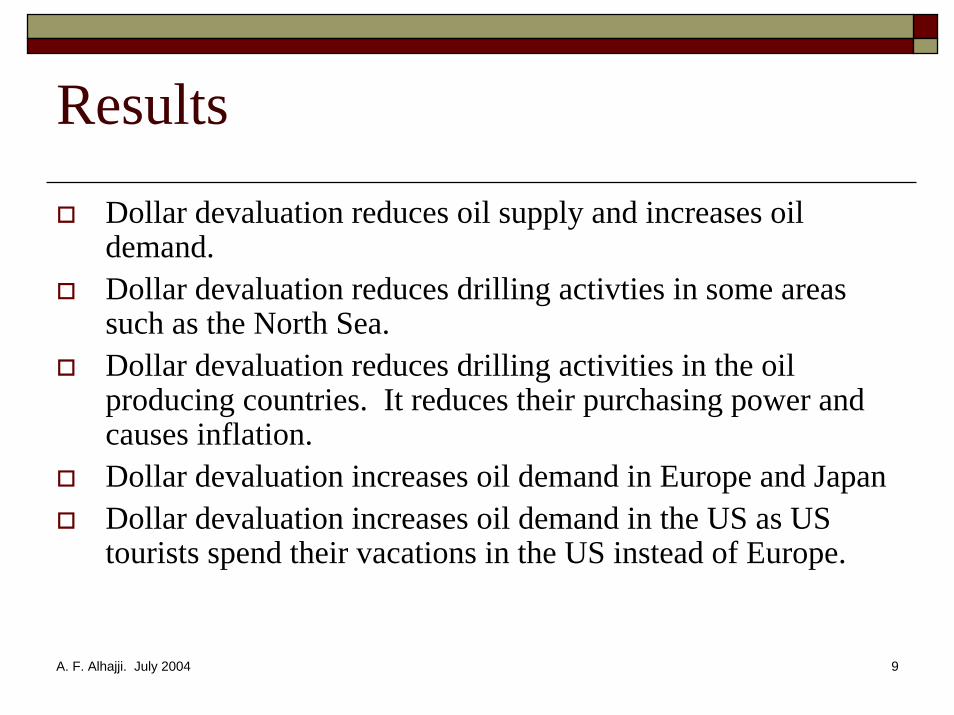
Results
Dollar devaluation reduces oil supply and increases oil demand.Dollar devaluation reduces drilling activties in some areas such as the North Sea.Dollar devaluation reduces drilling activities in the oil producing countries. It reduces their purchasing power and causes inflation.Dollar devaluation increases oil demand in Europe and JapanDollar devaluation increases oil demand in the US as US tourists spend their vacations in the US instead of Europe.

A. F. Alhajji. July 2004 10
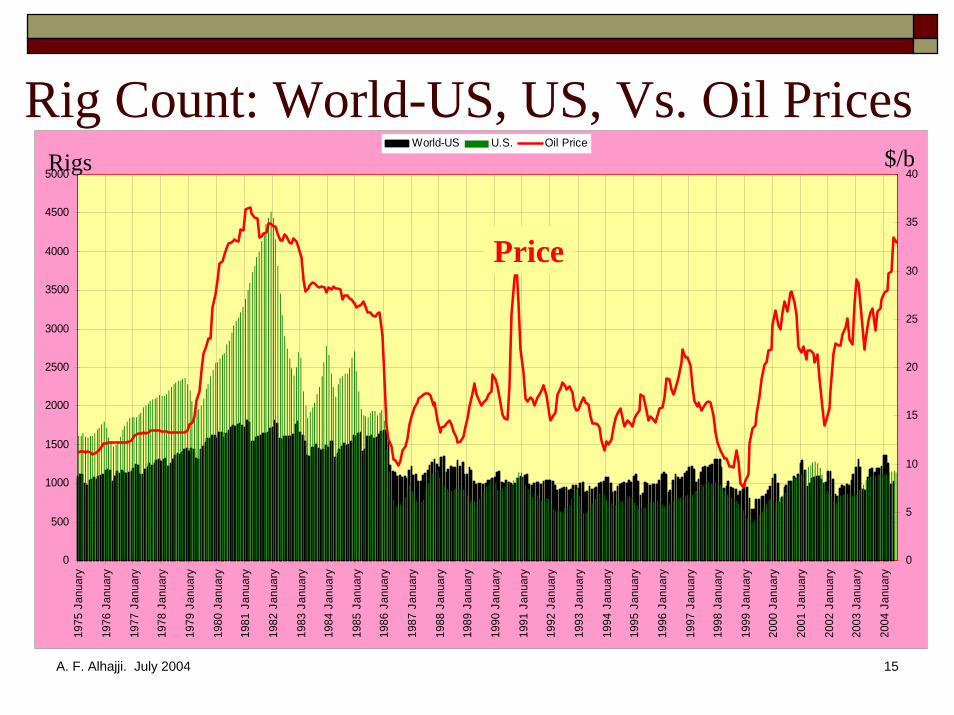
Observations on Drilling ActivitiesDrilling activities are highly correlated with oil pricesThere is a lag when prices increase. No lag when prices decrease.Changes in the world rig count are misleading. They follow changes in US.This pattern does not hold in recent months. Is it because of dollar devaluation?
A. F. Alhajji. July 2004 11
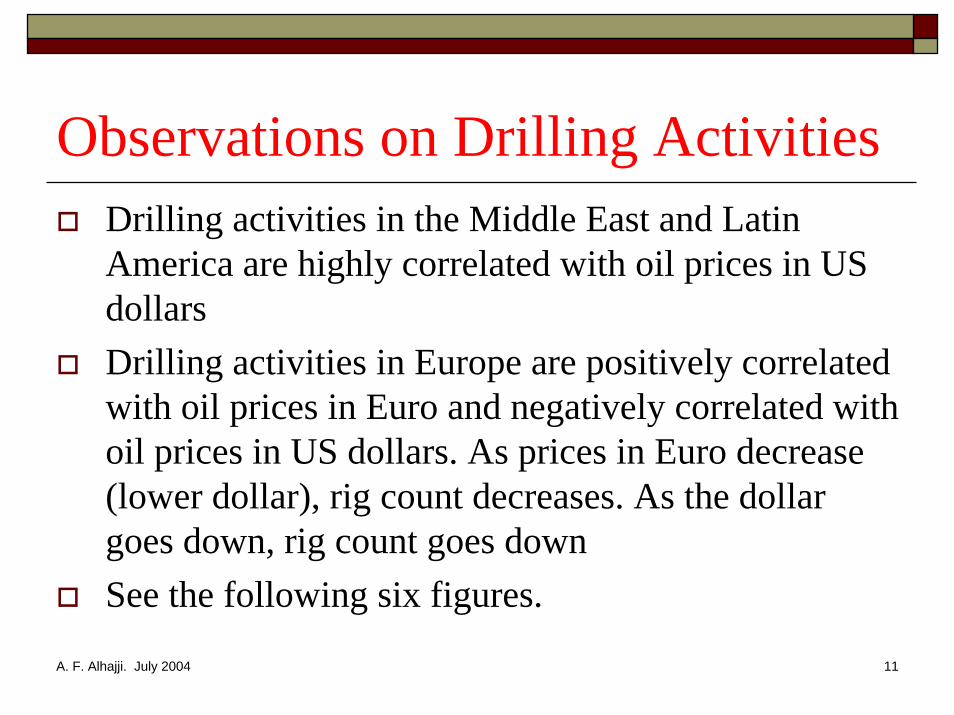
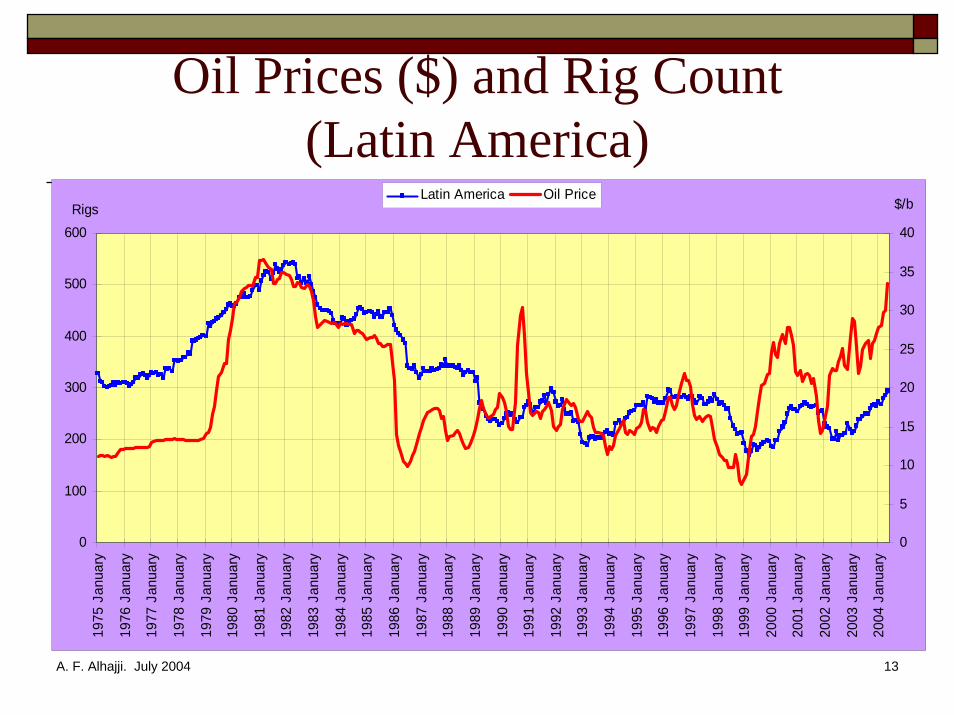
Observations on Drilling ActivitiesDrilling activities in the Middle East and Latin America are highly correlated with oil prices in US dollarsDrilling activities in Europe are positively correlated with oil prices in Euro and negatively correlated with oil prices in US dollars. As prices in Euro decrease (lower dollar), rig count decreases. As the dollar goes down, rig count goes downSee the following six figures.

A. F. Alhajji. July 2004 12
Oil Prices and Rig Count
500
1500
2500
3500
4500
5500
6500
1975
Jan
uary
1976
Jan
uary
1977
Jan
uary
1978
Jan
uary
1979
Jan
uary
1980
Jan
uary
1981
Jan
uary
1982
Jan
uary
1983
Jan
uary
1984
Jan
uary
1985
Jan
uary
1986
Jan
uary
1987
Jan
uary
1988
Jan
uary
1989
Jan
uary
1990
Jan
uary
1991
Jan
uary
1992
Jan
uary
1993
Jan
uary
1994
Jan
uary
1995
Jan
uary
1996
Jan
uary
1997
Jan
uary
1998
Jan
uary
1999
Jan
uary
2000
Jan
uary
2001
Jan
uary
2002
Jan
uary
2003
Jan
uary
2004
Jan
uary
0
5
10
15
20
25
30
35
40
U.S. World Oil Price
Rigs $/B
Price
A. F. Alhajji. July 2004 13
Oil Prices ($) and Rig Count (Latin America)
0
100
200
300
400
500
600
1975
Jan
uary
1976
Jan
uary
1977
Jan
uary
1978
Jan
uary
1979
Jan
uary
1980
Jan
uary
1981
Jan
uary
1982
Jan
uary
1983
Jan
uary
1984
Jan
uary
1985
Jan
uary
1986
Jan
uary
1987
Jan
uary
1988
Jan
uary
1989
Jan
uary
1990
Jan
uary
1991
Jan
uary
1992
Jan
uary
1993
Jan
uary
1994
Jan
uary
1995
Jan
uary
1996
Jan
uary
1997
Jan
uary
1998
Jan
uary
1999
Jan
uary
2000
Jan
uary
2001
Jan
uary
2002
Jan
uary
2003
Jan
uary
2004
Jan
uary
0
5
10
15
20
25
30
35
40
Latin America Oil Price$/bRigs

A. F. Alhajji. July 2004 14
Oil Prices and Rig Count(Middle East)
0
50
100
150
200
250
300
1975
Jan
uary
1976
Jan
uary
1977
Jan
uary
1978
Jan
uary
1979
Jan
uary
1980
Jan
uary
1981
Jan
uary
1982
Jan
uary
1983
Jan
uary
1984
Jan
uary
1985
Jan
uary
1986
Jan
uary
1987
Jan
uary
1988
Jan
uary
1989
Jan
uary
1990
Jan
uary
1991
Jan
uary
1992
Jan
uary
1993
Jan
uary
1994
Jan
uary
1995
Jan
uary
1996
Jan
uary
1997
Jan
uary
1998
Jan
uary
1999
Jan
uary
2000
Jan
uary
2001
Jan
uary
2002
Jan
uary
2003
Jan
uary
2004
Jan
uary
0
5
10
15
20
25
30
35
40
M East Oil PriceRigs $
A. F. Alhajji. July 2004 15
Rig Count: World-US, US, Vs. Oil Prices
0
500
1000
1500
2000
2500
3000
3500
4000
4500
5000
1975
Jan
uary
1976
Jan
uary
1977
Jan
uary
1978
Jan
uary
1979
Jan
uary
1980
Jan
uary
1981
Jan
uary
1982
Jan
uary
1983
Jan
uary
1984
Jan
uary
1985
Jan
uary
1986
Jan
uary
1987
Jan
uary
1988
Jan
uary
1989
Jan
uary
1990
Jan
uary
1991
Jan
uary
1992
Jan
uary
1993
Jan
uary
1994
Jan
uary
1995
Jan
uary
1996
Jan
uary
1997
Jan
uary
1998
Jan
uary
1999
Jan
uary
2000
Jan
uary
2001
Jan
uary
2002
Jan
uary
2003
Jan
uary
2004
Jan
uary
0
5
10
15
20
25
30
35
40
World-US U.S. Oil Price
Rigs $/b
Price

A. F. Alhajji. July 2004 16
Oil Prices ($) Vs Rig Count in Europe
0
50
100
150
200
250
300
1975
Jan
uary
1976
Jan
uary
1977
Jan
uary
1978
Jan
uary
1979
Jan
uary
1980
Jan
uary
1981
Jan
uary
1982
Jan
uary
1983
Jan
uary
1984
Jan
uary
1985
Jan
uary
1986
Jan
uary
1987
Jan
uary
1988
Jan
uary
1989
Jan
uary
1990
Jan
uary
1991
Jan
uary
1992
Jan
uary
1993
Jan
uary
1994
Jan
uary
1995
Jan
uary
1996
Jan
uary
1997
Jan
uary
1998
Jan
uary
1999
Jan
uary
2000
Jan
uary
2001
Jan
uary
2002
Jan
uary
2003
Jan
uary
2004
Jan
uary
0
5
10
15
20
25
30
35
40
Europe Rig Count Oil PriceRigs $/B

A. F. Alhajji. July 2004 17
Oil Prices (£) Vs. # of Rigs in Europe
0
50
100
150
200
250
300
1975
Jan
uary
1976
Jan
uary
1977
Jan
uary
1978
Jan
uary
1979
Jan
uary
1980
Jan
uary
1981
Jan
uary
1982
Jan
uary
1983
Jan
uary
1984
Jan
uary
1985
Jan
uary
1986
Jan
uary
1987
Jan
uary
1988
Jan
uary
1989
Jan
uary
1990
Jan
uary
1991
Jan
uary
1992
Jan
uary
1993
Jan
uary
1994
Jan
uary
1995
Jan
uary
1996
Jan
uary
1997
Jan
uary
1998
Jan
uary
1999
Jan
uary
2000
Jan
uary
2001
Jan
uary
2002
Jan
uary
2003
Jan
uary
2004
Jan
uary
0
5
10
15
20
25
30
Europe Rig Count Oil Price (£)Rigs £/b
A. F. Alhajji. July 2004 18
Oil Consumption in the UKDepreciation of the dollar increased consumption in recent months. Consumption declined sharply in the fourth quarter of 2000 when the dollar appreciated relative to the Sterling and the Euro.Dollar devaluation has little impact on other European countries because of high taxes on petroleum products. See the following Figure.

A. F. Alhajji. July 2004 19
Oil Prices and Petroleum Consumption in the UK
0.00
5.00
10.00
15.00
20.00
25.00
30.00
35.00
40.00
1999 January 2000 January 2001 January 2002 January 2003 January 2004 January1400.00
1450.00
1500.00
1550.00
1600.00
1650.00
1700.00
1750.00
1800.00
1850.00
1900.00
1950.00
WTI ($) Brent (€) UKPrice

A. F. Alhajji. July 2004 20
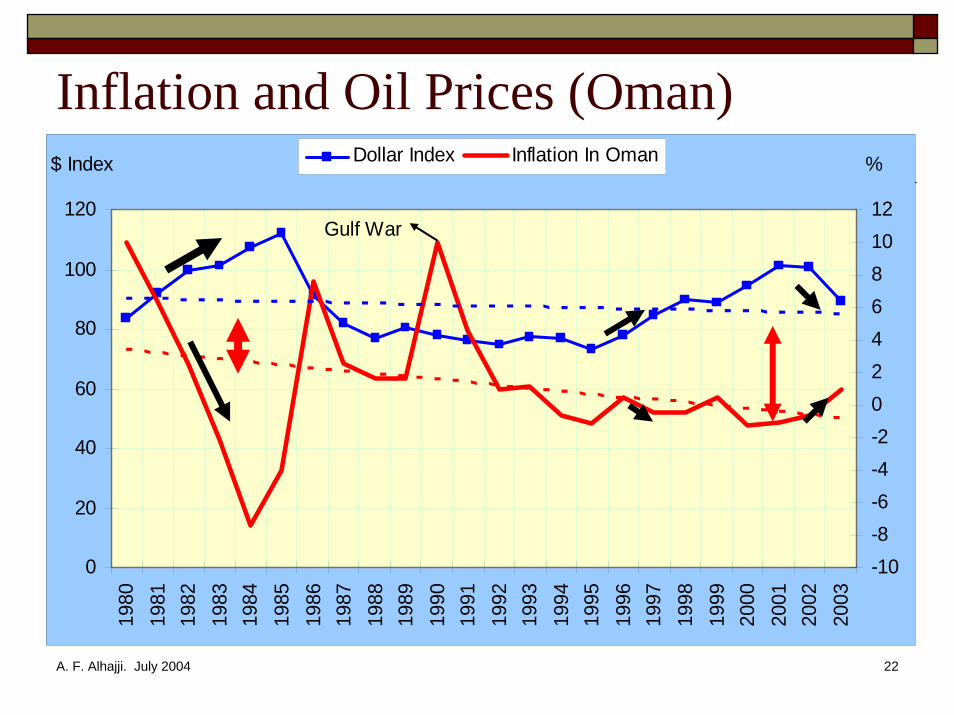
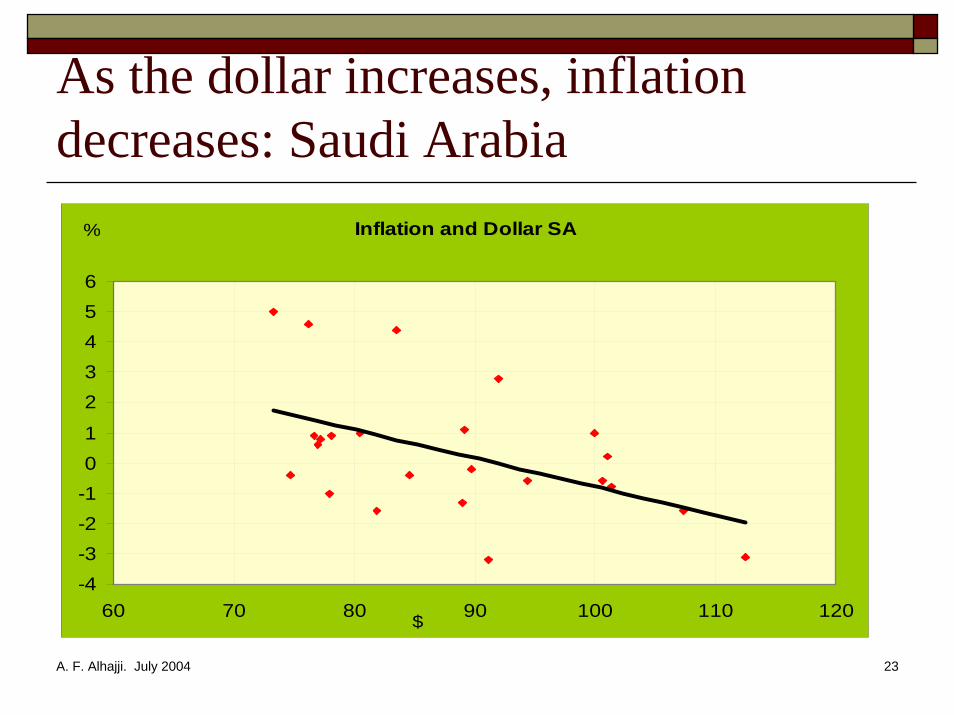
The Impact on Oil Producing Countries
Dollar Devaluation:Causes inflationReduces purchasing powerIncreases cost of operations if spare parts are imported from Europe and Japan
This would reduce upstream investment.It will apply to US oil companies operating in OPEC.
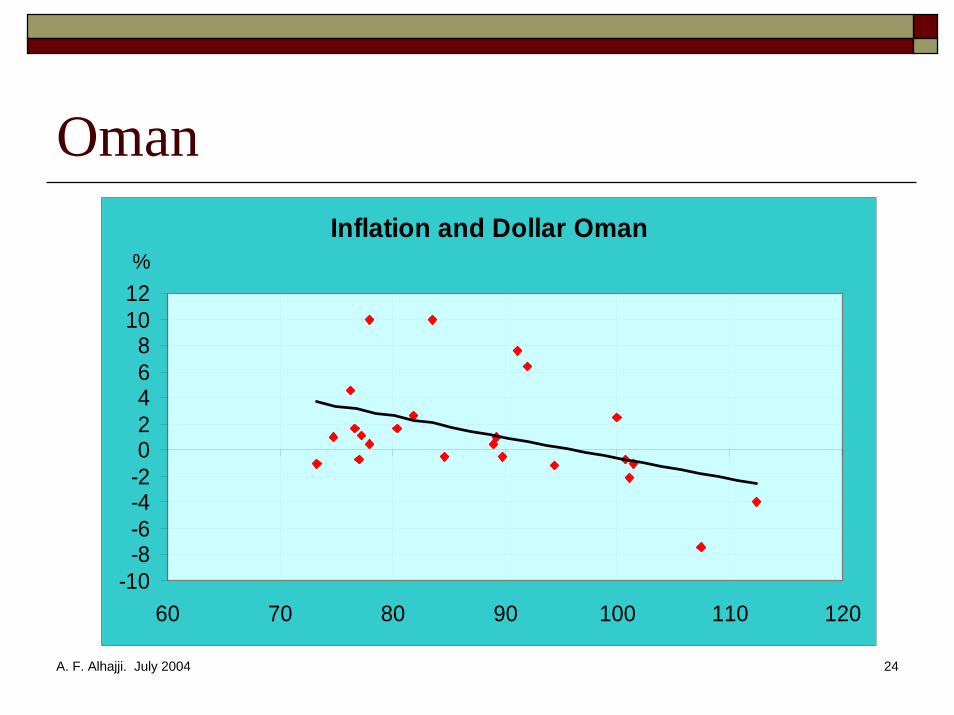
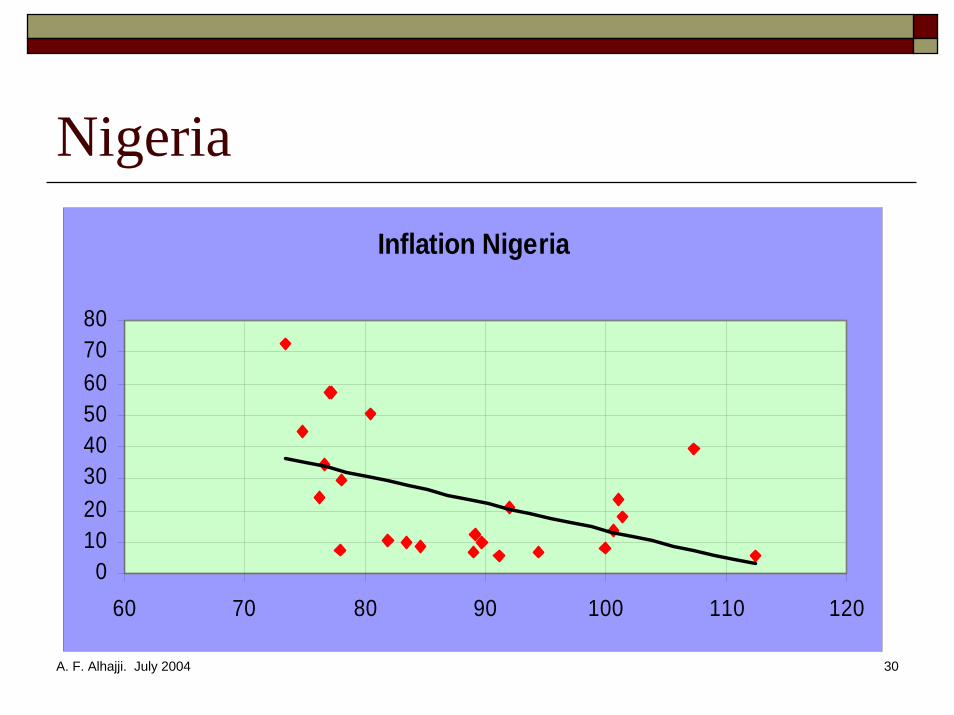
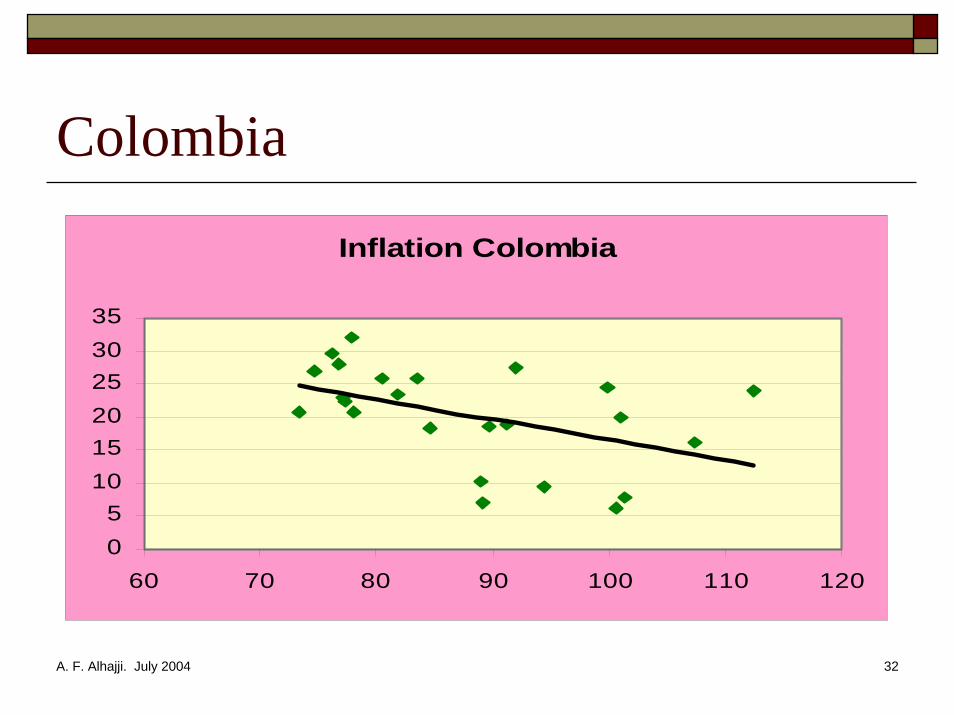
See next 14 figures on the relationship between dollar devaluation and inflation in the oil producing countries

A. F. Alhajji. July 2004 21
Inflation and Oil Prices (Saudi Arabia)
0
20
40
60
80
100
120
1980
1981
1982
1983
1984
1985
1986
1987
1988
1989
1990
1991
1992
1993
1994
1995
1996
1997
1998
1999
2000
2001
2002
2003
-4
-3
-2
-1
0
1
2
3
4
5
6
Dollar Index Inflation in SA
Gulf War
%$ Index
A. F. Alhajji. July 2004 22
Inflation and Oil Prices (Oman)
0
20
40
60
80
100
120
1980
1981
1982
1983
1984
1985
1986
1987
1988
1989
1990
1991
1992
1993
1994
1995
1996
1997
1998
1999
2000
2001
2002
2003
-10-8-6-4-2024681012
Dollar Index Inflation In Oman
Gulf War
%$ Index
A. F. Alhajji. July 2004 23
As the dollar increases, inflation decreases: Saudi Arabia
Inflation and Dollar SA
-4-3-2-101
23456
60 70 80 90 100 110 120
%
$
A. F. Alhajji. July 2004 24
OmanInflation and Dollar Oman
-10-8-6-4-202468
1012
60 70 80 90 100 110 120
%

A. F. Alhajji. July 2004 25
QatarInflation and Dollar Qatar
-2-10123456789
10
60 70 80 90 100 110 120
%

A. F. Alhajji. July 2004 26
UAEInflation Dollar UAE
0123456789
1011
60 70 80 90 100 110 120
%

A. F. Alhajji. July 2004 27
BahrainInflation Dollar Bahrain
-3-2-1012345
60 70 80 90 100 110 120

A. F. Alhajji. July 2004 28
AlgeriaInflation Alg
-505
101520253035
60 70 80 90 100 110 120

A. F. Alhajji. July 2004 29
IranInflation and Dollar Iran
0
10
20
30
40
50
60
60 70 80 90 100 110 120
A. F. Alhajji. July 2004 30
Nigeria
Inflation Nigeria
01020304050607080
60 70 80 90 100 110 120

A. F. Alhajji. July 2004 31
RussiaInflation Russia
-500
0
500
1000
1500
2000
60 70 80 90 100 110
A. F. Alhajji. July 2004 32
Colombia
Inflation Colombia
05
101520253035
60 70 80 90 100 110 120

A. F. Alhajji. July 2004 33
AngolaInflation Angola
-1000
0
1000
2000
3000
4000
5000
60 70 80 90 100 110 120

A. F. Alhajji. July 2004 34
Observations1. The exchange rate-inflation effect declines as the
percentage of oil exports in total exports declines.
2. The relationship between dollar devaluation and inflation in the oil producing countries does not hold if:
The local currency is not pegged to the dollarThe economy is diversifiedThe dependence on oil is small
Norway, Indonesia, Gabon, and MexicoOut of 18 oil producing countries, only four countries found not have an inverse relationship between the value of the dollar and inflation.
A. F. Alhajji. July 2004 35
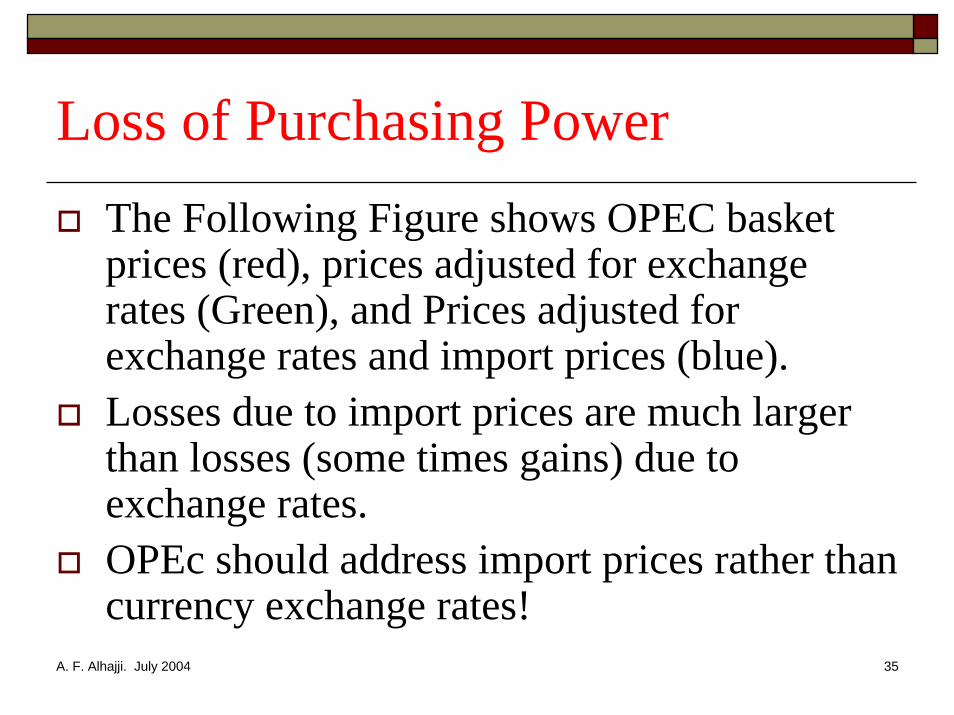
Loss of Purchasing PowerThe Following Figure shows OPEC basket prices (red), prices adjusted for exchange rates (Green), and Prices adjusted for exchange rates and import prices (blue).Losses due to import prices are much larger than losses (some times gains) due to exchange rates.OPEc should address import prices rather than currency exchange rates!

A. F. Alhajji. July 2004 36
Loss of Purchasing Power
10
15
20
25
30
35
40
Jul-9
0
Jan-
91
Jul-9
1
Jan-
92
Jul-9
2
Jan-
93
Jul-9
3
Jan-
94
Jul-9
4
Jan-
95
Jul-9
5
Jan-
96
Jul-9
6
Jan-
97
Jul-9
7
Jan-
98
Jul-9
8
Jan-
99
Jul-9
9
Jan-
00
Jul-0
0
Jan-
01
Jul-0
1
Jan-
02
Jul-0
2
Jan-
03
Jul-0
3
OPEC Basket Price Adjusted for Exchange Rates Adjusted for Infaltion$/b

A. F. Alhajji. July 2004 37
Loss of Purchasing PowerThe following two Figures show oil prices after adjusting them for purchasing power (adjusted for import prices and exchange rates) for three OPEC members. The US real price of oil (adjusted for US inflation) is added for comparison.
OPEC members have different trading partners. Therefore, the effect of dollar devaluation differ from one country to another.

A. F. Alhajji. July 2004 38
Purchasing Power Oil Prices
0
2
4
6
8
10
12
14
16
18
1977
1978
1979
1980
1981
1982
1983
1984
1985
1986
1987
1988
1989
Indonesia Venezuela UAE US

A. F. Alhajji. July 2004 39
Real Oil Prices (constatnt 1970)
4
5
6
7
8
9
10
11
12
13
14
15
16
17
18
1975 1980 1985
Saudi ArabiaUAEKuwaitLibyaIndonesiaVenezuelaUSA

A. F. Alhajji. July 2004 40
ResultsDollar depreciation reduces activities in upstream through different channels including lower return on investment, increasing cost, inflation, and purchasing powerDollar devaluation increases demand in countries with appreciated currencies because of increase in purchasing power.Dollar devaluation increases demand in the US as tourists prefer to spend their vacations in the US.

A. F. Alhajji. July 2004 41
ResultsStudies that focus on demand elasticities must use oil prices denominated in national currencies, not in US dollars.Studies that focus on the relationship between energy prices and economic growth must use oil prices denominated in national currencies, not in US dollars.Exchange rates may explain several issues in international energy markets that researchers are not able to sort out or agree on.