the impact of diversity - iupui
TRANSCRIPT

THE IMPACT OF DIVERSITYUnderstanding How Nonprofit Board Diversity Affects Philanthropy, Leadership, and Board EngagementFebruary 2018
The desirability and appropriateness of nonprofit board diversity has long been recognized. What is less understood is the impact diversity has on a board’s engagement and outcomes. This report considers that impact and the factors that contribute to it.
CONTENTS EXECUTIVE SUMMARY 4
KEY FINDINGS 7
SEEKING THE DIVERSITY-IMPACT CONNECTION 8
DIVERSITY AND THE AMERICAN NONPROFIT ORGANIZATION 10
COMPARING NONPROFIT BOARD DIVERSITY TO THE U.S POPULATION 11
CORRELATING ORGANIZATIONAL ATTRIBUTES TO DIVERSITY 12
CORRELATING DIVERSITY TO IMPACT 13
BOARD MEMBER ENGAGEMENT 14
FUNDRAISING ENGAGEMENT 15
ADVOCACY ENGAGEMENT 16
CASE STUDIES 17
COMO FRIENDS 18
COVECARE CENTER 20
CROCKER ART MUSEUM 22
LUTHERAN SOCIAL SERVICES OF THE SOUTHWEST 24
PAWS NEW YORK 26
TENNESSEE STATE UNIVERSITY FOUNDATION 28
UNITED WAY OF ABILENE 29
CASE STUDY THEMES 31
IMPLICATIONS 32
CONCLUSION 33
APPENDIX I: PREVIOUS LITERATURE 34
APPENDIX II: METHODOLOGY 38
APPENDIX III: REFERENCES 40
APPENDIX IV: STATISTICAL TABLES 42
ACKNOWLEDGEMENTS 57
INDIANA UNIVERSITY LILLY FAMILY SCHOOL OF PHILANTHROPY (LFSOP) 57
JOHNSON, GROSSNICKLE AND ASSOCIATES (JGA) 58
BOARDSOURCE 58

WHICH ORGANIZATIONAL ATTRIBUTES CORRELATE WITH BOARD DIVERSITY?The goal of this question is to provide a better understanding of the landscape of nonprofit board diversity.
EXECUTIVE SUMMARY Diversity on nonprofit boards in the United States has been widely studied. A great deal of research has focused on this area, exploring topics such as the level of diversity, the motivations for increased diversity, and the benefits diversity seems to deliver.
Despite such research, little is known about how increasing the diversity on nonprofit boards affects board engagement and impact. This study addresses this gap by answering two questions:
HOW IS BOARD DIVERSITY RELATED TO ORGANIZATIONAL ACTION?The goal of this question is to examine the relationship between board diversity and board outcomes, which we assessed by looking at board member engagement, fundraising engagement, and advocacy engagement.
To examine this topic, the research team worked in two phases. For the first phase, we conducted an empirical analysis of the dataset from BoardSource’s Leading with Intent: 2017 National Index of Nonprofit Board Practice (LWI) and also included information from Forms 990 and the Indiana University Lilly Family School of Philanthropy’s Million Dollar List. For the second phase of the research, we used case studies to delve more deeply into the findings from Phase One.
A key to the research was measuring board engagement, which we accomplished by focusing on three outcomes: board member engagement, fundraising engagement, and advocacy engagement. These were measured by the responses nonprofit organization CEOs gave to relevant quantitative and qualitative questions.
This study does not provide any simple guidelines for how organizations can quickly increase their boards’ diversity or engagement, but it does offer interesting insights into the relationships between diversity and the work of nonprofit boards. In addition, case studies provide examples of organizations that are actively wrestling with issues of diversity and how these issues contribute to engagement.
4

WHICH ATTRIBUTES ARE LINKED TO DIVERSITY? We asked our first question in an effort to better understand the landscape of nonprofit board diversity by gaining insight into how organizational characteristics (i.e., its age, revenue level, or area of focus) might be linked to the diversity (i.e., the race, ethnicity, gender, and age) of its board members. This line of inquiry did deliver some insights—most notably that older organizations and organizations with higher revenues tend to have less-diverse boards holding other factors constant when compared to newer nonprofits and nonprofits with lower revenues, respectively.
At the same time, the study found that an organization’s area of focus—its subsector within the nonprofit universe—is also related to board diversity. For example, nonprofits that focus on education tend to have higher percentages of African-American board members.
HOW DOES DIVERSITY RELATE TO ORGANIZATIONAL ACTION?At the highest level, the question “How is board diversity related to organizational action?” can be answered quite simply: “In a lot of ways.” However, if we focus on specific measures of action— board member engagement, fundraising engagement, and advocacy engagement—we see that the answer is more complex.
BOARD MEMBER ENGAGEMENT
Only one organizational characteristic was associated with higher board member engagement: the age of the organization. Specifically, older organizations tend to have more involved boards. In particular, boards of organizations founded prior to 1900 were significantly more likely to be rated as highly involved by their CEOs.
Meanwhile, gender and age diversity do seem to play a role in board member engagement. For example, boards with higher percentages of women tend to be more engaged in overseeing and governance and have higher commitment and involvement, as do boards with higher percentages of members age 39 or younger.
FUNDRAISING ENGAGEMENT
We find that as older organizations tend to have higher board member engagement in governance, their boards are also more likely to have board members who are more involved in fundraising. In fact, the oldest organizations—especially those founded before 1900—had significantly higher percentages of board members who met with potential donors, asked others for money, and contributed themselves.
According to their CEOs’ estimations, boards of arts and culture organizations were consistently more involved with fundraising.
FOLLOWING ARE SOME HIGHLIGHTS FROM THE RESEARCH AND CASE STUDIES.
AN IMBALANCEDemographic diversity in the United States continues to increase—it’s anticipated that Hispanic and Asian-American populations will double by the year 2060 and the African-American population will rise from 13.1 percent of the population in 2012 to 14.7 percent in 2060. Meanwhile, women’s economic power and educational achievements continue to rise. While gender diversity on nonprofit boards is improving, many seem to remain primarily white, older, and have more male than female board members.
5

Three demographic factors were significantly associated with fundraising efforts.
Gender: Boards with higher percentages of women more actively participated in fundraising and were graded higher by their CEOs for their fundraising performance.
Age: Boards with a higher percentage of members age 39 or younger were more likely to have board members who ask others for donations.
Ethnic and Racial: While there were no significant findings among boards with higher percentages of People of Color overall, boards that have a higher percentage of Asians were rated higher by their CEOs for their fundraising performance.
ADVOCACY ENGAGEMENT
In contrast to board member engagement and fundraising engagement, the study found only one organizational characteristic associated with advocacy engagement: the revenue of the organization. Boards of organizations with revenues of $5 million and greater were significantly more likely to engage with policymakers, monitor the impact of government policy, and provide information on advocacy activities to policymakers.
Similarly, only one demographic factor was significantly associated with advocacy engagement: gender. Boards with higher percentages of women tended to be more engaged in advocacy activities.
In general, some of the factors that correlate with diversity or engagement, such as the age of an organization or its subsector, cannot be changed. However, as some of the case studies revealed, through focused effort it is possible to drive progress in terms of diversity and board engagement. As we also saw, the simple pursuit of diversity and board impact could result in other areas of growth and progress that deliver rewards in the short- and long-term.
6
To measure board engagement, we focused on three outcomes: board member engagement, fundraising engagement, and advocacy engagement. We categorized questions from the CEO survey into these three categories (see the full text of all questions in Appendix II), and our analysis explored a number of dependent variables:
• Board member engagement was measured by nonprofit organization CEOs’ responses to questions such as whether board members participate in community building and outreach, whether they are engaged in oversight and governing of the organization, and whether they stay on the board for the maximum time allowed.
• Fundraising engagement was measured by CEOs’ responses to questions such as whether board members meet with potential donors, whether they ask others for money, whether they personally contribute to the organization, and whether they attend the organization’s fundraising events.
• Advocacy engagement was measured by CEOs’ responses to questions such as whether board members engage with policymakers, whether they monitor the impact of government policy, and whether they educate policymakers.

KEY FINDINGS
1. Diversity on nonprofit boards falls short of reflecting the overall diversity of the United States.
2. Older organizations and organizations with higher revenues tend to have less diverse boards.
3. Older organizations tend to have board members who are more involved in overseeing and governance and have higher board member commitment and involvement.
4. Organizations with higher revenues tend to have boards that are more engaged with policymakers and advocacy.
5. Boards with higher percentages of women tend to have more board member engagement, higher fundraising engagement, and higher advocacy engagement.
6. The pursuit of board diversity delivers its own rewards.
7

SEEKING THE DIVERSITY-IMPACT CONNECTIONThis study combines quantitative and qualitative methods to explore diversity among nonprofit boards as well as the role diversity plays in the engagement of these boards. We conducted the study in two phases.
For the first phase, we conducted an empirical analysis of the dataset from BoardSource’s Leading with Intent: 2017 National Index of Nonprofit Board Practice (LWI). To enrich the dataset, we included information from Forms 990 and the Million Dollar List. This allowed us to
compare key institutional characteristics and charitable giving information with survey responses from nonprofit organization CEOs. The surveys for the 2017 LWI were collected in 2016 and included responses from 1,597 CEOs and 409 board chairs. The main results presented in this study use the CEO survey results because the dataset included a greater number of responses and could be more easily matched to organization-level data.
In the course of the study, demographic diversity and organizational characteristics were used as independent variables, with demographic diversity consisting of gender diversity, racial/ethnic diversity, and diversity in the age of the board members. For organizational characteristics, we included the year of founding, the subsector, revenue, and the number of full-time paid employees.
1The Million Dollar List is a collection of nearly 70,000 publicly announced gifts from U.S. donors to nonprofit recipient organizations around the world. The Indiana University Lilly Family School of Philanthropy has compiled and maintained the Million Dollar List dataset since 2000.
A THEORETICAL FRAMEWORKBoth organization characteristics and board diversity affect board outcomes; however, organization characteristics also affect board diversity. As such, we worked with the theoretical framework below:
8
While we could take a number of organization characteristics into account for our research, we chose to focus on the age of the organization, the organization’s revenue, and the subsector of the organization.
To measure board outcomes, we focused on three factors: board member engagement, fundraising engagement, and advocacy engagement.
BOARD MEMBER ENGAGEMENT
FUNDRAISING ENGAGEMENT
ADVOCACY ENGAGEMENT
BOARD DIVERSITY
INFLUENCING FACTORSBOARD OUTCOMES
ORGANIZATIONAL CHARACTERISTICS

To measure board engagement, we focused on three outcomes: board member engagement, fundraising engagement, and advocacy engagement. We categorized questions from the CEO survey into these three categories (see the full text of all questions in Appendix II), and our analysis explored a number of dependent variables:
• Board member engagement was measured by nonprofit organization CEOs’ responses to questions such as whether board members participate in community building and outreach, whether they are engaged in oversight and governing of the organization, and whether they stay on the board for the maximum time allowed.
• Fundraising engagement was measured by CEOs’ responses to questions such as whether board members meet with potential donors, whether they ask others for money, whether they personally contribute to the organization, and whether they attend the organization’s fundraising events.
• Advocacy engagement was measured by CEOs’ responses to questions such as whether board members engage with policymakers, whether they monitor the impact of government policy, and whether they educate policymakers.
(Please see the tables in Appendix IV for specific coefficients and levels of significance.)
For the second phase of the research, we used case studies to dive deeper into the findings from the first phase. These case studies provide a more in-depth understanding of the relationship between board diversity and engagement.
The particular data and methodology used in this study place limitations on how the findings should be interpreted.
• The study uses self-reported survey responses.
• The study uses single time-point cross-sectional data.
• We attempted to put together a panel dataset using a dataset of past LWI responses, but the organizations included were not consistent enough from year-to-year to allow us to effectively do so.
As such, causal conclusions should not be made based on these results.
As we reviewed our data, we found that the subsector distribution of our sample was similar to the distribution in the nonprofit sector as a whole but did differ in two key subsectors: education and religious organizations. This can be accounted for by the large percentage of organizations where the subsector of the organization was either unknown, unclassified, or missing. For religious organizations, we note that it is likely that small congregations making up a large part of the religious subsector might not be reached by the survey. Table 1 shows the subsector distribution of our sample compared to all public charities.
TABLE 1. SUBSECTOR DISTRIBUTION: NATIONAL TAXONOMY OF EXEMPT ENTITIES (NTEE) CATEGORY
CATEGORY PERCENT OF SAMPLE ALL PUBLIC CHARITIESa
Arts 8.3% 9.9%
Education 6.6% 17.1%
Environment/Animal 4.0% 4.5%
Health 10.4% 12.9%
Human Services 31.1% 35.5%
International 1.8% 2.2%
Public Service Benefit 12.8% 11.6%
Religious 1.0% 6.2%
Unknown/Unclassified/Missing 24.0%b
aSource: Urban Institute, National Center for Charitable Statistics, Core Files (Public Charities, 2013) as cited in McKeever, 2015bSome respondents either did not respond to this question or their response did not fit into one of the appropriate categories.
9
2 Colby & Ortman, 20153 Ibid.4 Bureau of Labor Statistics, 20115 Branch, Moody, Marx Smock, & Bransford, 20106 Mesch, 2010; Wiepking & Bekkers, 20127 Guo & Musso, 20078 Miller, 19999 Walt & Ingley, 200310 Daley, 2002
DIVERSITY AND THE AMERICAN NONPROFIT ORGANIZATION
The increasing diversity of the U.S. population gives the nonprofit sector an unparalleled opportunity to engage new audiences, bring new voices to the table, and involve new talent and leadership. Making this shift—in particular, embracing the potential roles and contributions of women and ethnic and racial groups—is essential if the nonprofit sector is to reflect the values of our 21st century pluralistic society.
To put this opportunity into context, we point to census data projecting that demographic diversity in the United States will continue to increase. Most notably, Hispanic and Asian-American populations will double by 2060,2 while African-Americans also will increase as a share of the total population, from 13.1 percent in 2012 to 14.7 percent in 2060.3 Meanwhile, women’s economic power and educational achievements continue to rise.4
Existing research suggests that these and other changes in the nation’s demographics will have a transformative effect on the concerns and goals driving the nonprofit sector. For example, recent studies point out that leadership potential from diverse groups is growing in philanthropy,5 and scholars have noted that women’s philanthropic interests and motivations differ from those of men.6
Other research has explored nonprofit organizations’ reasons for pursuing greater board diversity. These include a need to increase representation,7 to be recognized by peers and community members as egalitarian and effective,8 to balance skills and attributes among board members,9 and to add expertise and increase reputation.10
Despite these and other findings about board diversity, we find that little is known about how increasing diversity in the nonprofit community affects board engagement.
This study seeks to add to this conversation by increasing the understanding of nonprofit board diversity and assessing how diversity can affect an organization’s actions and outcomes. In this effort, we focused on two questions:
What organizational attributes are linked to board diversity?
The goal of this question is to provide a better understanding of the landscape of nonprofit board diversity.
How is board diversity related to organizational action?
The goal of this question is to examine the relationship between board diversity and board outcomes, which we assessed by looking at engagement, fundraising, and board member engagement, fundraising engagement, and advocacy engagement.
It is our hope that, by asking these questions and gathering information related to them, we can help the nonprofit sector better understand how diversity can affect a board’s ability to help an organization achieve its goals.
10
COMPARING NONPROFIT BOARD DIVERSITY TO THE U.S. POPULATION
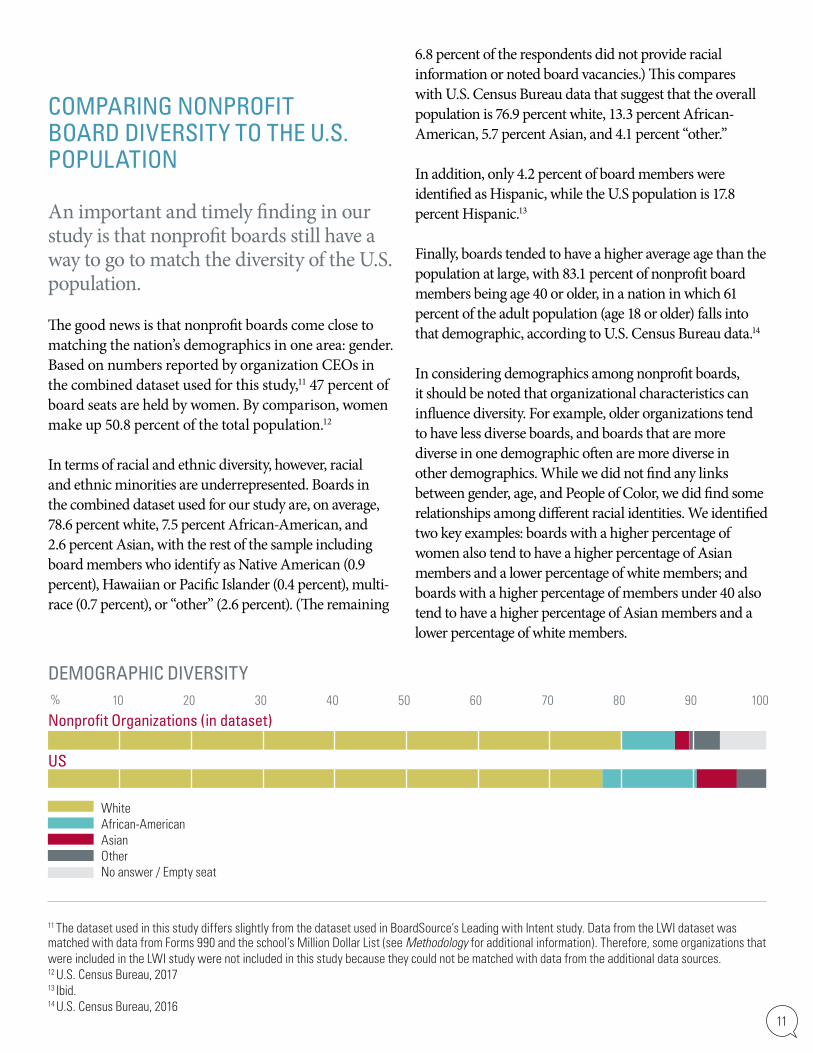
An important and timely finding in our study is that nonprofit boards still have a way to go to match the diversity of the U.S. population. The good news is that nonprofit boards come close to matching the nation’s demographics in one area: gender. Based on numbers reported by organization CEOs in the combined dataset used for this study,11 47 percent of board seats are held by women. By comparison, women make up 50.8 percent of the total population.12
In terms of racial and ethnic diversity, however, racial and ethnic minorities are underrepresented. Boards in the combined dataset used for our study are, on average, 78.6 percent white, 7.5 percent African-American, and 2.6 percent Asian, with the rest of the sample including board members who identify as Native American (0.9 percent), Hawaiian or Pacific Islander (0.4 percent), multi-race (0.7 percent), or “other” (2.6 percent). (The remaining
6.8 percent of the respondents did not provide racial information or noted board vacancies.) This compares with U.S. Census Bureau data that suggest that the overall population is 76.9 percent white, 13.3 percent African-American, 5.7 percent Asian, and 4.1 percent “other.”
In addition, only 4.2 percent of board members were identified as Hispanic, while the U.S population is 17.8 percent Hispanic.13
Finally, boards tended to have a higher average age than the population at large, with 83.1 percent of nonprofit board members being age 40 or older, in a nation in which 61 percent of the adult population (age 18 or older) falls into that demographic, according to U.S. Census Bureau data.14
In considering demographics among nonprofit boards, it should be noted that organizational characteristics can influence diversity. For example, older organizations tend to have less diverse boards, and boards that are more diverse in one demographic often are more diverse in other demographics. While we did not find any links between gender, age, and People of Color, we did find some relationships among different racial identities. We identified two key examples: boards with a higher percentage of women also tend to have a higher percentage of Asian members and a lower percentage of white members; and boards with a higher percentage of members under 40 also tend to have a higher percentage of Asian members and a lower percentage of white members.
US
Nonprofit Organizations (in dataset)10 20 30 40 50 60 70 80 90 100%
DEMOGRAPHIC DIVERSITY
11 The dataset used in this study differs slightly from the dataset used in BoardSource’s Leading with Intent study. Data from the LWI dataset was matched with data from Forms 990 and the school’s Million Dollar List (see Methodology for additional information). Therefore, some organizations that were included in the LWI study were not included in this study because they could not be matched with data from the additional data sources.12 U.S. Census Bureau, 201713 Ibid.14 U.S. Census Bureau, 2016
WhiteAfrican-AmericanAsianOtherNo answer / Empty seat
11

CORRELATING ORGANIZATIONAL ATTRIBUTES TO DIVERSITY
THE BIG QUESTION: WHICH ORGANIZATIONAL ATTRIBUTES ARE LINKED TO BOARD DIVERSITY?
The goal of this question is to better understand the landscape of nonprofit board diversity and gain insights into how organizational characteristics (i.e., age, revenue level, or area of focus) might correlate with the diversity of its board. In other words, it seeks to identify the types of organizations that are more or less likely to have diverse boards.
Having noted that nonprofit boards do not match the diversity of the general population, the study did find some relationships between diversity and organizational characteristics. Most notably, older organizations and organizations with higher revenues tend to have less diverse boards.
The study also found that an organization’s area of focus—or its subsector within the nonprofit universe—correlates with board diversity. For example, nonprofits that focus on education appear to have higher percentages of African-American board members, while nonprofits that focus on environmental/animal causes or international causes tend to have lower percentages of African-American board members. Nonprofits focused on international issues tend to have a higher percentage of younger board members. Finally, religious organizations have significantly fewer women on their boards compared to any other subsector, but they tend to have higher percentages of Hispanic board members (see Table 2).
12
TABLE 2. DIVERSITY BY NTEE CATEGORY: AVERAGE PERCENT OF BOARD MEMBERS
CATEGORY WOMEN UNDER 40 AFRICAN-AMERICAN ASIAN HISPANIC
Arts 46.7% 16.8% 5.6% 2.7% 2.7%
Education 50.2% 17.5% 14.2% 2.3% 5.4%
Environment/Animal 49.2% 14.8% 1.4% 2.0% 3.4%
Health 49.7% 13.6% 8.5% 2.8% 4.5%
Human Services 47.5% 17.1% 8.4% 2.2% 4.6%
International 42.7% 23.2% 1.0% 3.2% 3.0%
Public Service Benefit 46.7% 18.2% 7.1% 3.8% 3.9%
Religious 27.9% 16.5% 7.4% 0.9% 9.5%
Unknown/Unclassified/Missing 45.5% 17.3% 6.6% 2.4% 3.9%

CORRELATING DIVERSITY TO IMPACT
THE BIG QUESTION: HOW IS BOARD DIVERSITY RELATED TO ORGANIZATIONAL ACTION?
With this question, the study sought to examine how board diversity affects board activity.
While board activity can be measured in a number of ways, for this study we asked organization CEOs to help us assess this by answering questions about their boards’ involvement in three key areas: board member engagement, fundraising engagement, and advocacy engagement.
To assess board member engagement, we asked the CEOs to respond to questions and statements addressing board members’ willingness to participate in community building and outreach, engagement in oversight and governing of the organization, willingness to remain on the board for the maximum time allowed, and related matters.
We measured fundraising engagement by considering CEOs’ responses to questions and statements about matters such as whether board members meet with potential donors, whether they are willing to ask others for money, and whether they personally contribute to the organization.
Finally, we measured advocacy engagement through the CEOs’ responses to statements and questions about matters such as board members’ willingness to engage with policymakers, monitoring of government policy, and willingness to educate policymakers.
At the highest level, the question “How is board diversity related to organizational action?” can be answered quite simply: “In a lot of ways.” Looking closer, however, we see that the answer is much more complex. On the following pages, we dig into that complexity.
13

BOARD MEMBER ENGAGEMENT
Obviously, most nonprofits seek to have their boards deeply engaged in substantively important work and issues in order to create opportunities to add value and leadership. Our study suggests that some nonprofits have distinct factors that encourage this and others that may be seen as barriers, based on their organizational characteristics, culture, board practices, and demographics.
Assessing this overall engagement involved reviewing data and CEOs’ responses to questions about matters such as board members’ commitment to the organization, participation in community building, and involvement in oversight and governing.
ORGANIZATIONAL CHARACTERISTICS
An important organizational characteristic that is significantly associated with higher overall engagement of board members is the age of the organization. Generally, older organizations tend to have higher board member engagement. In particular, boards of organizations founded prior to 1900 were significantly more likely to be rated as highly committed and involved by their CEOs. This result is primarily driven by chapters of national, highly recognizable organizations such as the United Way, Big Brothers Big Sisters, and the YMCA, which make up a large majority of the older organizations in the sample.
DEMOGRAPHICS
Diversity does appear to play a role in board engagement, but in complex ways.
Having more female and younger members work in boards’ favor, it seems, as boards with higher percentages of women tend to be more engaged, committed, and involved; as do boards with higher percentages of members age 39 or younger.
However, boards with higher percentages of African-Americans tend to have lower board member engagement in governance and were less likely to be rated as highly involved by their CEOs. We explored this relationship more deeply and found that it appears to be driven by results from older organizations and organizations with higher revenues as this decreased board member engagement was not found to be true in smaller, newer organizations. There is no relationship between the percentage of African-Americans on the board and board member engagement among smaller, newer organizations. The data does not provide insight into why this may be, but
it is possible that the culture of older organizations and organizations with higher revenues may make it a challenge for new board members to participate. This is something that should be further studied. Measures of race, ethnicity, gender, or board member age were not significantly associated with any other measures of board member engagement.
CASE STUDY INSIGHTS:The Tennessee State University Foundation, an organization supporting a historically black university in Nashville, struggled to engage board members in fundraising activities. It countered this challenge through a campaign of overt and dramatic change that gave board members clear expectations.
SAMPLE QUESTION
How would you “grade” your BOARD’s performance in the
following areas?:
Commitment and involvement
SAMPLE QUESTION
How strongly do you agree or disagree with the following
statements related your BOARD’s culture?:
The majority of board members are actively engaged in overseeing and governing the organization.
14

FUNDRAISING ENGAGEMENT
A majority of nonprofit organizations expect board members to participate in fundraising, but some organizations are more successful at engaging board members in fundraising activities, according to our study.
To measure fundraising involvement, we asked CEOs to respond to questions and statements about such matters as how much board members rely on staff for fundraising activities, whether board members donate to their organizations, and whether board members are willing to ask for donations.
ORGANIZATIONAL CHARACTERISTICS
Two organizational characteristics seem to have a considerable effect on fundraising engagement.
First, similar to the way that older organizations tend to have higher board member engagement, our study suggests that these older organizations are also more likely to have board members who are involved in fundraising. In fact, the oldest organizations—especially
those founded before 1900—had significantly higher percentages of board members who met with potential donors, asked others for money, and contributed themselves. In addition,
organizations founded before 1900 were slightly more likely to have fundraising expectations more clearly explained to them.
Second, the boards of arts and culture organizations were more engaged in fundraising, by their CEOs’ estimations. These boards were described as more likely to actively participate in fundraising and attend fundraising events, and CEOs graded the boards’
fundraising efforts more highly. In particular, these boards were significantly more involved than the boards of health, environmental/animal, and
internationally focused organizations. Measures of race, ethnicity, gender, or board member age were not significantly associated with any other measures of fundraising.
DEMOGRAPHICS
Three demographic factors seemed to be most associated with fundraising engagement.
• Gender: Boards with higher percentages of women more actively participated in fundraising and were graded higher by their CEOs for their fundraising performance.
• Age: Boards with a higher percentage of members age 39 or younger were more likely to have members who ask others for donations. They also were more likely to have fundraising expectations more clearly explained to them and provided more contacts.
• Race: Boards that have a higher percentage of People of Color did not have any significant differences in fundraising engagement overall. However, boards that have a higher percentage of Asians were rated higher by their CEOs for their fundraising performance.
CASE STUDY INSIGHTS:Until recently, board members for Arizona’s Lutheran Social Services of the Southwest were not really expected to engage in fundraising. Today, thanks to an effort that redefined giving, set concrete-but-reasonable expectations and nurtured a team mentality, every board member gives and 80 percent of the board participates in development activities.
SAMPLE QUESTION
Please indicate your agreement with following
statements:
The board actively participates in fundraising versus relying mostly
on the CEO and staff.
SAMPLE QUESTION
How would you “grade” your BOARD’s performance in the
following areas?:
Fundraising
15

ADVOCACY ENGAGEMENT
Often, a board member’s involvement in a nonprofit organization is a result of his or her passion for an issue or cause—a passion organizations typically hope will translate into advocacy. Our study discovered that organizations with certain characteristics and board demographics are more likely to see this translation occur.
For the purpose of this study, we assessed advocacy engagement by asking CEOs about matters such as board members’ involvement with policymakers, their openness to receiving information about causes, and their monitoring of government policy.
ORGANIZATIONAL CHARACTERISTICS
In contrast to board member engagement and fundraising, the study found only one organizational characteristic to be associated with advocacy engagement: the revenue of the organization.
Boards of organizations with revenues of $5 million and greater were significantly more likely to engage with policymakers, monitor the impact of government policy, and provide information on advocacy activities to policymakers.
DEMOGRAPHICS
Only one demographic factor was significantly associated with advocacy engagement: gender. Boards with higher percentages of woman tended to be more engaged in advocacy activities. The only other factor that appeared to matter was the average age of board members, which correlated weakly with advocacy engagement activities. Racial and ethnic diversity did not appear to be associated with advocacy engagement.
CASE STUDY INSIGHTS:New York’s CoveCare Center receives most of its funding from government sources; so, in addition to pursuing philanthropic gifts, its board members must be prepared to participate in advocacy efforts. The organization assists them in this effort by including them in advocacy at every opportunity and including advocacy in every three-year strategic plan.
16
SAMPLE QUESTION
To what extent did the board monitor the impact of local,
state, and federal policy on the organization’s mission delivery
and resources?
SAMPLE QUESTION
To what extent did the board receive information and
resources on effective and appropriate advocacy activities on behalf of the organization?

CASE STUDIES
To shed additional light on the study’s questions and findings, JGA team members conducted interviews with a variety of nonprofit organizations. The Indiana University Lilly Family School of Philanthropy research team assisted by identifying organizations to study. Together, JGA and the school completed seven case studies, which can be read on the following pages. We would like to express our gratitude to the leaders and board members of the organizations profiled in the case studies for their generosity with their time and for sharing their stories to inform this report.
17

Since 1999, Como Friends has provided more than $38 million toward capital projects and community programs, including the Como Park Zoo and Conservatory’s Visitor Center, Tropical Encounters, Polar Bear Odyssey, and Ordway Gardens. This success can be attributed to a couple of key factors. Certainly, consistent leadership plays a role: the current president has been in place since the organization was formed.
But board strength is also an important part of the formula, and the strength of Como Friends’ board is the product of a mindful board development and engagement process.
This process starts with recruitment. Como Friends is working hard to ensure that its board mirrors the diversity of the community, convening a governance committee that considers a wide range of factors when recruiting members. Term limits allow frequent opportunities to refresh the board and keep new energy and viewpoints rotating into the group.
When a new member joins the 29-member board, the Como Friends staff engages him or her quickly in the life of the Zoo and Conservatory. Orientation is thorough, informing new board members about past accomplishments, goals for the future, and clearly defined board expectations.
EMERGING FROM A MERGER WITH HIGH BOARD MEMBER ENGAGEMENT
COMO FRIENDS
More and more nonprofits are undergoing mergers as a way to keep their organizations viable and increase mission impact.
Como Friends was created by uniting four Minnesota nonprofits in the 1990s and, thanks in part to a strategic approach to diversity, individualized board opportunities, and clear expectations of board members, it has emerged as an organization that is stronger than ever.
Como Friends exists to support the Como Park Zoo and Conservatory, a beloved St. Paul/Minneapolis institution with roots dating back to 1897. The most-visited cultural institution in the state of Minnesota, Como Park Zoo and Conservatory welcomes more than two million annual visitors, appealing to a broad audience with a strong brand, free admission, and an accessible location.
Originally two separate entities, Como Park Zoo and Conservatory has had the support of several docent and support groups dating back to the 1960s. In the 1990s, as interest in creating a Visitor’s Center promoted the merger of the Zoo and Conservatory, the four primarily volunteer nonprofits supporting these two entities also merged, forming Como Friends.
Despite its eventual success, the merger did at first create concern because those who served had great passion for the organizations and not everyone could be as involved as they wanted to be with the new structure. The group made the best decisions possible given the situation and worked hard to build strong board relationships. Como Friends has not looked back.
POINTS OF EMPHASIS:
Mindful board development and engagement
Individualized board opportunities
Thorough communication
18
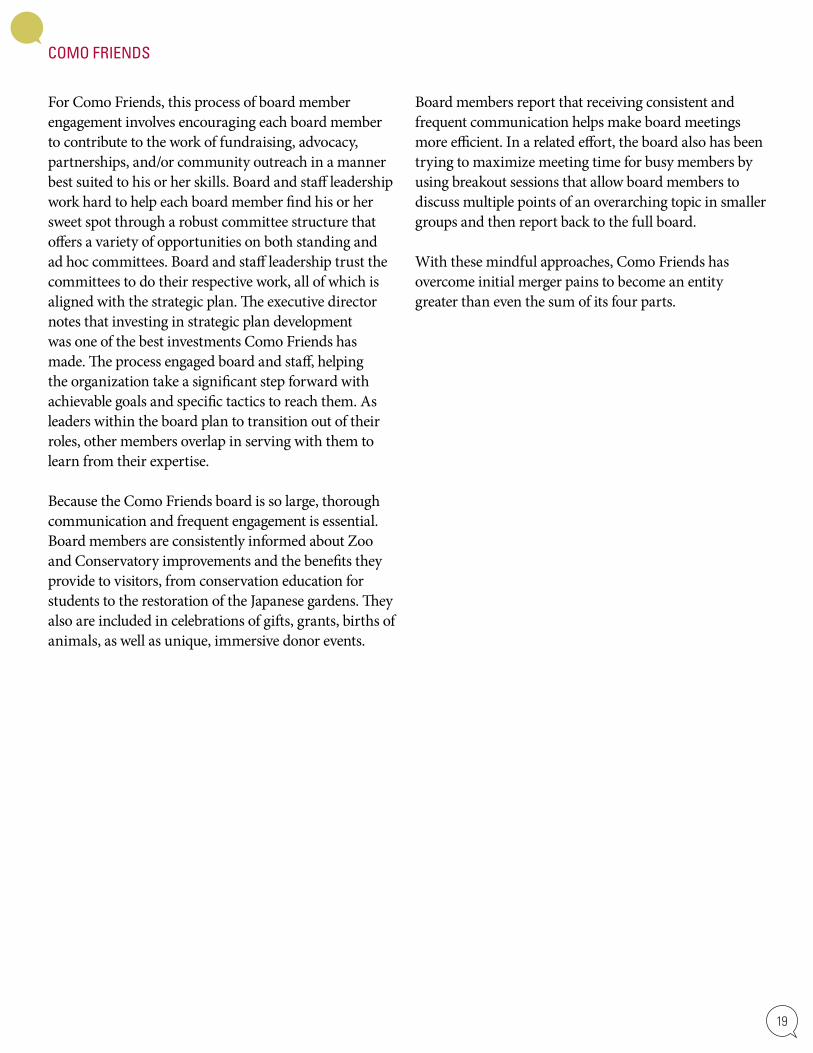
For Como Friends, this process of board member engagement involves encouraging each board member to contribute to the work of fundraising, advocacy, partnerships, and/or community outreach in a manner best suited to his or her skills. Board and staff leadership work hard to help each board member find his or her sweet spot through a robust committee structure that offers a variety of opportunities on both standing and ad hoc committees. Board and staff leadership trust the committees to do their respective work, all of which is aligned with the strategic plan. The executive director notes that investing in strategic plan development was one of the best investments Como Friends has made. The process engaged board and staff, helping the organization take a significant step forward with achievable goals and specific tactics to reach them. As leaders within the board plan to transition out of their roles, other members overlap in serving with them to learn from their expertise.
Because the Como Friends board is so large, thorough communication and frequent engagement is essential. Board members are consistently informed about Zoo and Conservatory improvements and the benefits they provide to visitors, from conservation education for students to the restoration of the Japanese gardens. They also are included in celebrations of gifts, grants, births of animals, as well as unique, immersive donor events.
Board members report that receiving consistent and frequent communication helps make board meetings more efficient. In a related effort, the board also has been trying to maximize meeting time for busy members by using breakout sessions that allow board members to discuss multiple points of an overarching topic in smaller groups and then report back to the full board.
With these mindful approaches, Como Friends has overcome initial merger pains to become an entity greater than even the sum of its four parts.
COMO FRIENDS
19
DEVELOPING A BOARD FOR FUNDRAISING
COVECARE CENTER
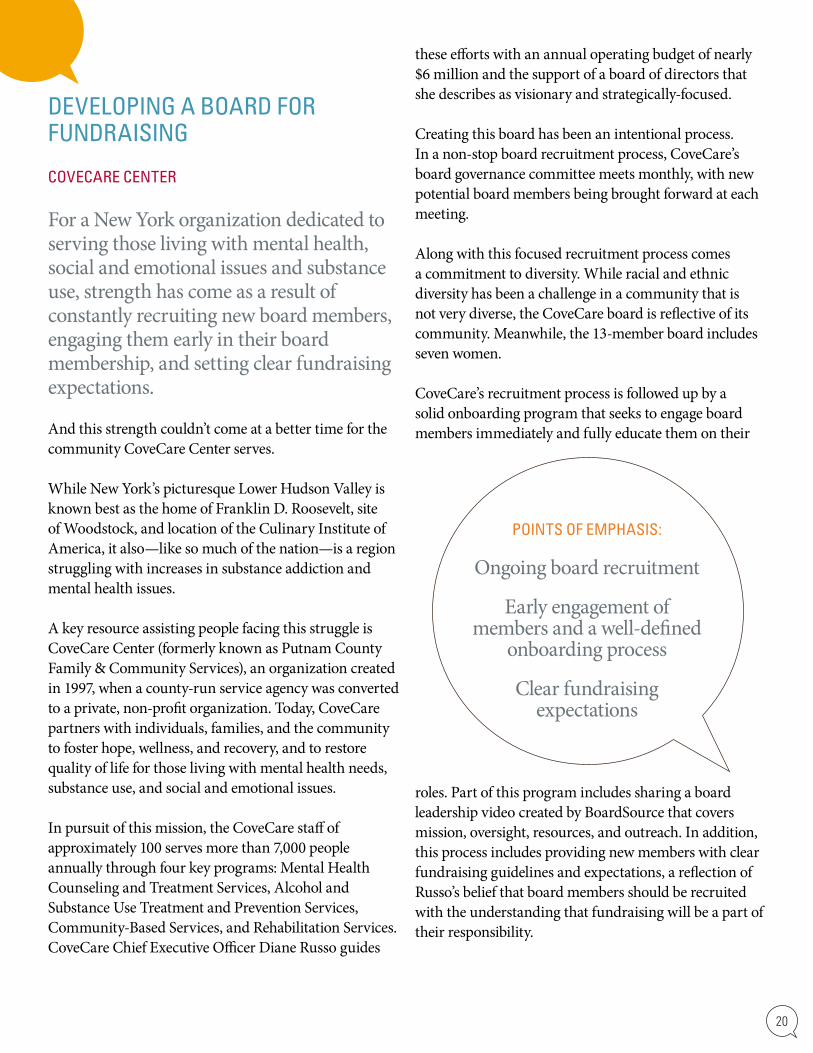
For a New York organization dedicated to serving those living with mental health, social and emotional issues and substance use, strength has come as a result of constantly recruiting new board members, engaging them early in their board membership, and setting clear fundraising expectations.
And this strength couldn’t come at a better time for the community CoveCare Center serves.
While New York’s picturesque Lower Hudson Valley is known best as the home of Franklin D. Roosevelt, site of Woodstock, and location of the Culinary Institute of America, it also—like so much of the nation—is a region struggling with increases in substance addiction and mental health issues.
A key resource assisting people facing this struggle is CoveCare Center (formerly known as Putnam County Family & Community Services), an organization created in 1997, when a county-run service agency was converted to a private, non-profit organization. Today, CoveCare partners with individuals, families, and the community to foster hope, wellness, and recovery, and to restore quality of life for those living with mental health needs, substance use, and social and emotional issues.
In pursuit of this mission, the CoveCare staff of approximately 100 serves more than 7,000 people annually through four key programs: Mental Health Counseling and Treatment Services, Alcohol and Substance Use Treatment and Prevention Services, Community-Based Services, and Rehabilitation Services. CoveCare Chief Executive Officer Diane Russo guides
these efforts with an annual operating budget of nearly $6 million and the support of a board of directors that she describes as visionary and strategically-focused.
Creating this board has been an intentional process. In a non-stop board recruitment process, CoveCare’s board governance committee meets monthly, with new potential board members being brought forward at each meeting.
Along with this focused recruitment process comes a commitment to diversity. While racial and ethnic diversity has been a challenge in a community that is not very diverse, the CoveCare board is reflective of its community. Meanwhile, the 13-member board includes seven women.
CoveCare’s recruitment process is followed up by a solid onboarding program that seeks to engage board members immediately and fully educate them on their
roles. Part of this program includes sharing a board leadership video created by BoardSource that covers mission, oversight, resources, and outreach. In addition, this process includes providing new members with clear fundraising guidelines and expectations, a reflection of Russo’s belief that board members should be recruited with the understanding that fundraising will be a part of their responsibility.
POINTS OF EMPHASIS:
Ongoing board recruitment
Early engagement of members and a well-defined
onboarding process
Clear fundraising expectations
20

That’s not to suggest that board members have to pursue their expectations on their own. While each board member is responsible for “giving or getting” a minimum of $500 per year, the agency’s director of development provides ongoing support to the board on the development function and works with the board to set annual goals, and CoveCare trains board members on how to ask for gifts and provides them with the tools to be successful.
Fundraising is important, but it is also important to CoveCare that it be accompanied by advocacy. The chair of the board governance committee, Chris Dillon, explained that the majority of CoveCare’s funding comes from government sources, so advocacy on behalf of the agency and the people served is vitally important. As such, the board participates whenever appropriate, and advocacy is addressed in every-three-year strategic plan.
Throughout this process of board recruitment, development, and engagement, CoveCare supports board members with training. Whether through the story of a person impacted by their services or presentations about CoveCare programs or departments, time is reserved in each board meeting for education.
CoveCare Center imagines a strong, united community where all people are valued, accepted, and empowered to live healthy lives. It pursues this vision though the hard work of a strong, professional staff and the leadership of an engaged board.
COVECARE CENTER
21

NURTURING A CULTURE OF FUNDRAISING IN THE ARTS
CROCKER ART MUSEUM
The Crocker Art Museum is meeting an ever-changing nonprofit landscape with a deeply ingrained culture of expectation and a desire to be more than just a repository for fine art.
Like other sectors in the nonprofit world, the museum world is undergoing massive and rapid change. Perceptions of visitors, costs for acquisition, changes in the way people value and schedule their personal time, and challenging expectations of new audiences, demographics, neighborhoods, and cities put a continual strain on museums. More and more is expected of them in a high-stakes marketplace that often offers fewer resources and a higher level of competition.
As a result, it’s anticipated that some museums will close in the years ahead. Sacramento’s Crocker Art Museum is an exception. It is expected to survive and, in fact, thrive as it meets challenges, expands its impact, makes good use of its staff and volunteer capital, and builds a strong future.
Founded in 1885, the Crocker Art Museum is a public-private partnership between the city and the Crocker Art Museum Association. While both entities contribute to the museum’s funding, Lial Jones, who serves as the museum’s CEO as well as its Mort and Marcy Friedman Director, sees the board’s engagement in fundraising as essential to the museum’s future. As a result, in recent years, she has worked closely with board members to nurture a shared understanding of the importance of fundraising and a recognition that everyone has a role in it. She makes it clear to board members that they are to be engaged in fundraising, and ensures that staff know that they are to support the board in that work.
This sort of clear expectation is deeply ingrained in the museum’s board culture. For example: • The full-day orientation program that is part of the
onboarding experience is followed up by subsequent checkpoints for new board members.
• That orientation introduces and then builds on the expectation that board members will give personally, commensurate with their financial capacity, and engage in or support the solicitation of others.
• Comparative data on gifting by other organizations is shared with board members as a helpful “benchmark” for giving, according to one director.
The forms of involvement by museum board members can vary. While all members generally are active in ongoing fundraising and campaigns, some members are more active in cultivation and solicitation, and others help with donor identification and engagement. Some members thank donors, and many host visitors at the museum or museum events. The objective is to create an environment that CEO Jones and Director of Advancement Kerry Wood say can engage members of the board in ways that “are appropriate and interesting to them,” recognizing that “one size does not fit all.”
POINTS OF EMPHASIS:
A culture of expectation
Individualized opportunities for engagement
A shared vision for impact
22

Termed a “pretty sophisticated” effort by Marcy Friedman, who serves as co-chair of the current campaign, the initiative creates a mentality in which every board member knows that he or she can do something to help in fundraising.
Staff members believe that while the board has good conversations collectively about fundraising, it is also true that general messages or requests for help from board members are less effective. One-on-one action and requests for help on specific events, appeals, donor meetings, etc., produce more focused and strategic results, they said, adding, “We customize a lot here.”
Of course, these efforts are buttressed by memories of recent successful campaigns. Having experienced the thrill of success and large gifts, the board has a “we can do this” attitude.
Even as successful as this fundraising focus is, however, revenue is not the only objective in these efforts. The Crocker sees itself as a big part of the city’s livability and its plans for future. Its positioning statement is clear about this: “Crocker brings people together and connects them in unexpected ways with art, ideas, and each other and the world around them.”
“This is really about connection,” Jones says. “We have and are creating forums for conversations that matter. We are intentionally engaging in deeper ways with other neighborhoods in the city. The Crocker has wonderful art, but it is really about city building.”
This combination of clear expectations and expansive focus have worked to create a culture that interviewees said board members have embraced, expanded, and made “their own”—which sounds like a recipe for ongoing growth in a time of peril for the museum world.
CROCKER ART MUSEUM
23

INFUSING ENERGY INTO THE BOARD’S ROLE IN FUNDRAISING LUTHERAN SOCIAL SERVICES OF THE SOUTHWEST
At Lutheran Social Services of the Southwest, fundraising used to be a transactional and not a terribly successful process.
Today? New energy in the fundraising process has made board members and staff a lot happier and also produced impressive results.
An organization that has served poor and needy Arizona residents since 1970, Lutheran Social Services of the Southwest (LSS) now has nearly 500 staff members working in 8 counties and assisting one out of every 90 Arizona residents. Affiliated with the Evangelical Lutheran Church in America and recognized by the Lutheran Church–Missouri Synod, LSS deploys an annual budget of $15 million to provide programs and services including emergency food assistance, aging and disability services, foster home care, temporary shelter, employment counseling, and refugee resettlement.
Four years ago, LSS was supplementing the funds it received from government agencies by raising just over $300,000. Its board was hardly involved in fundraising, and board members were not asked to make annual gifts. “It was painful serving on the board at that time,” one board member said. “Meetings were tedious. We were not solicited for gifts. There wasn’t much engagement of the board in fundraising.”
Those days are long gone. This year LSS will approach $1 million in philanthropic support, with 100 percent of board members giving and 80 percent of the board involved in development activities.
WHAT BROUGHT ABOUT THIS CHANGE?
It began with the 2015 arrival of CEO Connie Phillips, who worked with board chair Jayne Baker and board vice chair (and fund development committee chair) Don Smith to reinvigorate the board and launch a strategic fundraising program.
Part of the change at LSS is cultural. The board has been empowered and motivated to play a more active role in advancing LSS’s mission of “showing kindness, doing justice, and serving those in need.” The board’s service to LSS also has been enhanced by the adoption of several board “best practices,” including creating a board manual, conducting a more extensive board-orientation program, annually completing board member activity-commitment forms and self-evaluations, and regularly evaluating board meetings. In addition, LSS is using a board matrix as an aid in determining the composition of the board and in building the diversity of the board in terms of ethnicity, age, gender, faith/religion, and profession.
POINTS OF EMPHASIS:
Shared responsibility for fundraising
A fundraising mandate … with flexibility
Celebrated success
24
Along with these cultural changes and adoption of effective practices have come more tangible, concrete actions shaped by three philosophies
• Take a team approach• Provide board members with various opportunities
to participate• Celebrate success.Getting everyone onboard with the notion that fundraising is a team undertaking has been critical. In Connie Phillips’ words, “Fundraising … only works if all of us—board and staff—are participants in the process.”
This message is conveyed through action: every board meeting includes a board education session, often focused on some aspect of donor relationship-building—identification, cultivation, solicitation, or stewardship. Board members receive regular fundraising progress reports and are asked to share their experiences in helping to initiate or strengthen relationships with donors or potential donors.
This mindset is complemented by an approach that offers board members options for the way they participate in fundraising. Accepting that participation starts with giving (that’s non-negotiable) the board also recognizes that participation will not take the same form for every board member. So, LSS board members are asked to complete annual board-commitment forms that provide various options for how they will offer their “time, skills, connections, and resources.” Included are such specific actions as inviting friends and associates to a “Come and See” event, hosting a table at a fundraising luncheon, making thank-you calls to donors, and promoting LSS in social media on Giving Tuesday.
In addition, in recent years LSS has worked with a consultant to focus specifically on encouraging board involvement in fundraising and increasing its donor base. Much of this work has come about through the implementation of the consultant’s specific fundraising model that has provided a structure for LSS’s fundraising and allowed board members to choose their fundraising roles.
Lastly, in revitalizing its fundraising program, LSS set reasonable goals, worked to stimulate excitement and friendly competition among board members, achieved early success, and then built on that success. Key to this program has been sharing stories of success to foster enthusiasm for and confidence in LSS’s fundraising. Celebrating the “stories” of gifts, especially the relationship progression that led to the gifts, has enabled LSS board members and staff to fully appreciate the fundraising process and see how a team of individuals, focusing on mission and impact, can bring about generous philanthropic investment.
As Don Smith describes it, “Previously, we were just going out and asking for dollars, but now we are telling our story, focusing on the impact we have, and, in doing so, inspiring people to want to help advance our mission, our work, and be part of a great organization.”
And that has made all the difference.
LUTHERAN SOCIAL SERVICES OF THE SOUTHWEST
25

EVOLVING THE BOARD FOR FUNDRAISING IMPACT
PETS ARE WONDERFUL SUPPORT (PAWS) NEW YORK
In 10 short years, Pets Are Wonderful Support (PAWS) New York has built itself from a start-up, no-staff organization into a four-person staff team with more than 1,500 volunteers and an annual budget of $390,000. The key to this transformation? An innovative committee structure, concrete board expectations, and a commitment to board diversity and mission engagement.
PAWS is a New York City-based nonprofit organization that helps elderly and low-income people with a physical impairment to stay in their homes without fear of losing their pets. In addition to its signature Housecall Program, which provides in-home assistance through the help of volunteers, PAWS provides services such as a pet pantry, pet foster care, and veterinary care programs through a community of partners and volunteers. Since it was founded in 2008, PAWS has helped more than 500 elderly people and 1,100 pets, donated more than 70,000 pet-care visits, and provided 45,000 hours of pet care.
Since its founding, PAWS has undergone a gradual evolution. In the early years, the founding executive director, Rachel Herman, drove the organization’s activities as a part-time volunteer, and board members were recruited to do specific work needed for the young organization to get its footing, such as marketing or legal services.
As PAWS’ reach and reputation grew over time, its operations and leadership shifted. The founding executive director became a paid full-time employee in 2012, about the same time the organization adopted a working committee structure to guide board activities. After a few years, the structure was dissolved, and the executive committee was given the flexibility to create ad-hoc committees as needed.
This structure has worked, enabling the organization to be more nimble and effective and allowing the board to be more strategic and less programmatic. A key
element of this approach is the “open door” that exists between the executive director and board chair, allowing for regular organizational updates to be provided to members and giving board members opportunities to share feedback and ideas.
Other shifts have coincided with this change in committee structure. PAWS recruited its first board members based on the organization’s specific needs; now it focuses on ensuring board members have a commitment to helping the organization raise awareness and funds. In addition, recruitment is not centered around a matrix or term limits but is instead based on perceived gaps in perspective. New board members are heavily vetted, with a focus on inviting only those who are committed to the mission and to being active board members.
POINTS OF EMPHASIS:
A flexible committee structure
Clear board fundraising expectations
Recruitment of board members who are passionate about the
mission
26

individual philanthropy revenue. Leaders emphasize that PAW’s mission is too important for its funding to be vulnerable—as needs would be unmet if the organization were not operating. Consequentially, board members clearly understand the significance of their role in fundraising and have received occasional training from fundraising experts. The PAWS board is developing a strategic plan that will detail fundraising goals and tactics to guide its efforts in 2018 and beyond.
In addition to setting aggressive and clear fundraising expectations, PAWS also challenges board members to contribute in ways that are outside of their individual comfort zones. Specifically, they are encouraged to participate in committees and activities that challenge them to develop new skills.
Through these and other efforts, PAWS has successfully evolved from a grassroots program into an emerging organization with active board, staff, volunteers, and partners. This has equipped the organization to tackle a new strategic plan and continue to formalize fundraising expectations and results—initiatives that, no doubt, will lay the groundwork for ongoing evolution that will drive PAWS to new levels of impact.
Through its efforts to reflect its community, PAWS has developed a diverse board. This diversity—expressed in a variety of ways, including experiences, gender, race, and age—helps PAWS make a stronger case to potential funders. “Diversity helps good organizations evolve to the right place and move in the right direction,” said board chair Garry Buff. “It brings different points of view and helps decision-making.”
Once on the board, PAW’s board members receive clear expectations. Each has a give-get fundraising goal that has increased in recent years (through 2014, the average give-get was $250 per board member; in 2015 and 2016, the goal increased to a minimum of $1,000; in 2017, the minimum was raised to $1,500). These clear expectations are conveyed to prospective board members in the recruitment process and affirmed in the onboarding process. In addition, board members receive direct contact about their individual progress and are informed about overall results in financial reports by the board treasurer.
As individual board member fundraising expectations have intensified, members have been able to contribute in ways that work best for them, with the definition of what is counted toward the goal being expanded. The organization’s largest annual fundraising event—which has increased in size and results in recent years—provides the primary platform for board members to reach their give-get goals. While only cash gifts were previously counted, in 2017, cash and in-kind support were counted toward individual goals—including the value of items they secured that were “sold” during the event’s silent auction. Board members also have engaged in direct solicitation and in hosting smaller friend-raising events.
Despite notable successes, PAW’s leaders are motivated to continue to hold high expectations of board members in fundraising. Approximately 50 percent of the organization’s $390,000 annual budget is sourced from foundation grants, which tend to be restricted to direct programming. Opportunity and need remain for the organization to reduce its reliance on grants—which vary from year-to-year—and increase
PETS ARE WONDERFUL SUPPORT (PAWS) NEW YORK
27

ANSWERING CHANGE WITH CHANGE: BOARD ENGAGEMENT
TENNESSEE STATE UNIVERSITY FOUNDATION
A few years ago, the Tennessee State University Foundation’s world was changing. It chose to respond by changing its world even more.
The charitable organization authorized to accept private contributions for Tennessee State University (TSU), the Tennessee State University Foundation was established in 1970 to promote and support literary, scientific, educational, scholarship, research, charitable, and development efforts at TSU. A comprehensive, urban land-grant institution and historically black university founded in Nashville in 1912, TSU serves approximately 10,000 students.
Recent years have brought major change to Tennessee State University and the foundation through the Focus on College and University Success Act. Implemented in July 2016, that act altered the state of Tennessee’s higher education organizational structure and shifted governance of each state university to a separate board of trustees. As a result, TSU now has a board of trustees and a foundation board of directors.
While this change gives volunteers more opportunities to engage with the university and foundation, it also requires increased coordination in setting philanthropic priorities. As such, the boards are working together to create a strategic plan that allows the foundation to best support the university and to ensure that both the foundation and university are on the same page. This additional direction and clarity will provide a roadmap for the foundation as it engages current and potential donors.
Historically, the foundation focused on raising scholarship support through signature events and regional activities. While the foundation board supported those activities, most members were not personally involved in engaging prospective donors to support the foundation. Many board members said
they were not comfortable going on personal visits and preferred to attend events and have one overarching ask made to attendees.
With new leadership, this dynamic has changed. The foundation altered the board culture and shifted the focus to allow for more strategic donor engagement and board member participation.
In this effort, the foundation has focused in large part on board composition. Member identification and recruitment is now being driven by a matrix that identifies key characteristics to ensure a well-rounded and diverse board. Diversity has been a key focus in order to ensure that key industries are represented as well as community and business leaders. While Nashville has a thriving business community, and many businesses support TSU, business leaders traditionally have not connected with the foundation. The foundation is working to remedy this by attracting to the foundation board leaders who can provide guidance and assistance in opening doors to prospective donors.
Supporting this program of board development and engagement was the implementation of term limits and minimum contribution levels. While this was challenging to implement because many longtime board members were neither in a position to make personal gifts at the minimum threshold nor comfortable engaging others, over the past few years the process has helped to bring new members to the board—members who have been greeted from day one with clearly outlined the roles and responsibilities.
The result? A more active board that is focused more than ever on working with the university to identify funding priorities.
POINTS OF EMPHASIS:
A dedication to change
A focus on board development
Clear guidelines and expectations
28

ATTRACTING AND DEVELOPING YOUNG BOARD LEADERS
UNITED WAY OF ABILENE
A conscious pursuit of younger board members has combined with clear expectations to help the United Way of Abilene evolve into a stronger organization that meets the needs of the West Central Texas residents it serves as well as the people who serve on its board.
This evolution has come in part as a result of its leader’s recognition that change was needed. Several years ago, CEO Cathy Ashby noted that her organization lacked young donors. Knowing that demographic would be integral to growing the organization and increasing its revenue, she sought to remedy this shortcoming.
The organization she was working to change had a long record of success. Founded in 1956, the United Way of Abilene serves 19 counties in West Central Texas and works with 27 partner agencies. Focusing on the building blocks of life—education, income, and health—it seeks to collaborate with the community to create lasting change.
The residents of the community it serves love their city and want to serve. In fact, the city of approximately 100,000 supports more than 600 nonprofits, meaning residents have plenty of opportunities to engage and serve. Young people, in particular, have responded, and Ashby wants them to see the United Way as a leading opportunity for service.
To achieve this, she and her board took a number of steps.
First, Ashby recognized that younger people like to be engaged in different ways, so she recruited more board members capable of connecting with the 20-to-40 age group. She also acknowledged that younger generations want to connect to mission, actively serve the community, and still accommodate a full personal and work life. As such, her organization seeks to respect board members’ individuality, taking the time to get to know each board member and align organizational opportunities with his or her individual interests. In addition, Ashby and her board work to continuously engage new and younger board members.
Also, the United Way of Abilene has intentionally linked its board to the Young Leaders Society, a committee for community leaders 40 and younger, by placing the chair of the Society on the board’s executive committee. This gives the young members of the Society a voice, and creates a connection to young up-and-coming leaders.
The result? Today, 21 of the board’s 30 members are in their 30s or 40s.
But this process goes beyond board recruitment. The United Way of Abilene also ensures that younger board members have meaningful board experiences.
New board members are matched with mentor members for their first year. With expectations as simple as sitting together at meetings (to ensure attendance and answer questions), these pairings help newer, younger members understand the board culture.
POINTS OF EMPHASIS:
Conscious pursuit of younger board members
Prioritization of board members’ individuality
A focus on connection to mission
29

In addition, every board member is required to serve on the Community Impact Review Team, an allocation committee known as CIRT. This entails evaluating organizations seeking funding, reviewing partner organizations, and conducting site visits that culminate in final recommendations on grant funding, all of which puts board members on the front lines of the work being done in partner organizations and gives them first-hand exposure to the mission of the United Way of Abilene.
CIRT is also used as an effective recruitment tool for younger board members because, as a committee open to non-board members, it allows the United Way of Abilene to meet and work with individuals who might be a good fit for the board in the future.
The focus on the individual extends beyond recruitment. Board members spend time learning about each other, and each board member is empowered to do what he or she is most interested in to make a difference. These passions are identified in interviews between individual board members and Ashby, who talks with each board member about what he or she is good at and would like to do.
In addition, individual achievements are recognized: if someone is honored in the community, he or she will be celebrated in a board meeting, where “member spotlights” highlight board members’ accomplishments.
To ensure all board members remain connected to partners’ missions, each year, United Way of Abilene has an annual full-day board retreat during which partner organizations are reviewed and site visits are conducted.
The result of this intentional pursuit of younger members and ongoing support of members is a board that is strong and well-equipped to serve the needs of the community its members so cherish.
UNITED WAY OF ABILENE
30

CASE STUDY THEMES
While the organizations included in our case studies were, by design, quite different, some of them did share common themes in their efforts to strengthen their organizations. The following are some themes that appeared repeatedly.
Embrace difficult change. A few of the organizations in our case studies found themselves forced to deal with significant change. Rather than resist and fight change, they instead leaned into it and used it as a springboard for growth.
Focus on board development. This doesn’t mean simply having a training program. This means having ongoing board development that involves a range of experiences and training opportunities.
Set clear guidelines and expectations. Even the most unengaged boards can be transformed with clear expectations—even if the initial introduction of those expectations is painful.
Always be recruiting. By taking board member recruitment out of a once-a-year routine and making it an ongoing process that involves a variety of recruitment approaches, you open the door to a more diverse board.
Let board members do it their way. Yes, every board expects members to fundraise, but successful boards give members a lot of flexibility in how they go about raising funds—and the exceptional boards make a point of getting to know what makes members tick so they can really leverage their passions.
Consciously pursue diversity. Even if creating a more diverse board proves to be a long, slow process, it will be a process that delivers its own rewards.
Focus on inclusion. Diversity for diversity’s sake is never enough. Instead, the organizations in our case studies focused on inclusion through strong governance practices, which ultimately strengthened the organizations.
Bring them on board right. Onboarding can’t be a one-hour, here’s-your-binder event. It must be an ongoing process that involves mentoring, immersion in mission, and more. It will be time-consuming and demanding, but it will pay considerable dividends.
31

IMPLICATIONS
While our study results do not offer a straightforward action plan for increasing board diversity or engagement, they do suggest a number of actions that nonprofit organizations can pursue to move toward greater board diversity and impact.
Have the tough conversation – Ask yourself: Are we realizing our full potential as a board? In what ways are we diverse? How might becoming more diverse increase opportunities for greater mission impact? Discussing diversity can be tough but building the discussion around mission will help to relieve tension and help your board consider how greater diversity can contribute to impact.
Define your board priorities – This study points out three key roles of the board: board member engagement, fundraising engagement, and advocacy engagement. Within these three roles, how do you rate your board’s performance? Where do you need the most emphasis? Where do you need to grow or change? Understanding your board’s performance in these three areas will help you understand how to diversify your board membership.
Align board composition with your priorities – Once you have defined priorities (e.g., board member engagement, fundraising engagement, advocacy engagement), use the research data to inform how you can enhance your board composition to meet your priorities. How could diversity improve performance in these areas? How does your board’s culture support or potentially derail diversity efforts and the ability to fully benefit from diverse perspectives?
32
Recognize that characteristics and diversity intersect – Your organizational characteristics and diversity influence each other, creating a complex environment for leveraging change. Some things are impossible to change (the organization’s age, for example), but you can consider how they influence the work of the board and the context for increased diversity.
Start somewhere and be intentional – Adding diversity in one demographic category tends to lead to diversity in other demographics. Don’t feel overwhelmed by opportunities to diversify your board. Focus on creating a culture of inclusion (see sidebar). Ultimately, this will lead to a more diversified board.
AVOIDING TOKENISM
Pursuing diversity for diversity’s sake can lead to tokenism. Therefore, it is important that board members from diverse backgrounds are not simply added to boards; they must be included in board activities and decision-making. Ensure this by focusing on inclusion.
Previous research (Fredette, Bradshaw, & Inglis, 2007) identifies two pathways to inclusion:
• Functional inclusion, in which board members from diverse backgrounds are identified for goal-driven purposes (e.g. to maintain a balance, to represent a marginalized community, to be accountable to consumers of the organization’s services).
• Social inclusion, which describes when efforts are made to form or strengthen relational bonds among board members (e.g. mentoring programs, retreats).
Working toward functional and social inclusion leads to transformational inclusivity, which benefits the individual, board, and organization (Fredette, Bradshaw, & Inglis, 2007).

CONCLUSION
Diversity on boards—both corporate and nonprofit—is receiving considerable attention from scholars and practitioners alike. This study sought to add to the discussion by examining the current landscape of diversity on nonprofit boards and by understanding the relationship between board diversity, organizational characteristics, and board engagement.
33
Leverage engagement and fundraising – Consider how training and board orientation can help to move your board from internal engagement to external relationship building and fundraising. Engaged board members are the best external fundraisers—how do you get them to turn their internal engagement into external connectivity?
Foster a culture of continuous learning – Capitalize on a diverse skillset to highlight each board member’s role in establishing connections and expanding his or her role in fundraising. Bring in board members and leaders from other organizations to speak to your board about how diversity has affected their board priorities and impact. Review your training and orientation program to prepare all board members for success. And watch for the impact of implicit or unconscious bias on your orientation, training, and board culture.
Nonprofit boards still have a long way to go in the recruitment and engagement of diverse board members. However, by continuing to intentionally pursue diversity and by building an inclusive environment, nonprofit organizations can reap the benefits of a more engaged
board. The message, then, seems to be that there is no simple route to increased diversity or impact, but there is an opportunity to strengthen your organization now by embarking on a course that leads toward those objectives.

APPENDIX I: PREVIOUS RESEARCH
INTRODUCTION
Nonprofits are tax-exempt entities dedicated to a specific mission and acknowledge the importance of volunteerism and philanthropic actions; these characteristics distinguish nonprofits from businesses and the government. In order to discourage fraud and corruption, most nonprofits are governed by a board of directors or trustees, who are volunteers that are “legally responsible for making sure the organization remains true to its mission, safeguards its assets, and operates in the public interests” (National Center for Nonprofit Boards, p.15). A recent report on nonprofit boards identifies a nonprofit board’s areas of responsibilities: legal and fiduciary, oversight, fundraising, and representation of constituencies and viewpoints (Independent Sector, National Center for Nonprofit Boards, p.17). In other words, a nonprofit board of directors plays important roles in governing, maintaining and representing the organization.
Literature on nonprofit board and organizational effectiveness investigates how nonprofit board demographics, board composition and board size, board performance, board competencies, and board-executive director relationship affects organizational effectiveness (Cornforth, 2001; Holland and Jackson, 1998). Although no consensus has been reached on whether a diverse board composition can lead to better organizational effectiveness, board diversity receives the most attention within research. Furthermore, nonprofit boards being conscientious of diversity are perceived to promote a better understanding of external environment and diverse information sources, as well as lead to more effective problem solving and stronger leadership (Jaskyte, 2012).
One key question asked regarding nonprofit board composition is how diverse nonprofit boards should be. When it comes to nonprofit board diversity, most studies focus on demographic diversity, especially on gender diversity and racial diversity (Bear et al, 2010; Buse et al,
2016; Brown 2002a; Daley, 2002). Studies also investigate other demographic characteristics of nonprofit boards, such as age, personal attributes, professional experiences, education and occupation (Miller, 1999; Brown, 2002b; Siciliano, 1996).
One theoretical reason for board diversity is the need for representation. Guo and Musso (2007) suggest that an organization has five dimensions of representation, including substantive, symbolic, formal, descriptive, and participatory representation. Based on their argument, the first two representations are an indication to an organization’s legitimacy, and the last three indicate the organization’s capacity. Thus, a nonprofit’s board of directors are expected to represent the organization and therefore indirectly influence how the organization is perceived. Research findings indicate that organizations with more diverse boards of directors are perceived by peers and community members to be more egalitarian and more effective (Miller, 1999). Diverse board members typically extend the networks of the organizations (Kasper, Ramos, & Walker, 2004).An additional reason for board diversity is due to the need for balancing the skills and attributes that are needed for quality-decision making. As Walt & Ingley (2003) point out, a good balance of board room diversity is:The mix of human capital where human capital is defined as the skills, general or specific, acquired by an individual in the course of training and experiences that a board of directors comprises collectively and draws upon in undertaking its governance function (p.219-220).
According to Walt and Ingley (2003), board diversity should be perceived beyond demographic diversity, such as age, gender, ethnicity, industry background, and religion. Board diversity should also include discipline, independence, and culture. A diverse board group with different skills provides the organization with needed expertise and increases the organization’s reputation (Daley, 2002). However, demographic diversity among the board does not necessarily lead to functional diversity (Daley & Angulo, 1994). This study will further investigate the association between demographic diversity and organizational functioning.
34

DEMOGRAPHIC DIVERSITY
Gender Not long ago, nonprofits were governed dominantly male leadership. For instance, as early as the 1980s, foundations were very homogenous. Less than one third of foundation CEOs were women and 77 percent of foundation board trustees were men in 1982 (Mills, 2017).
More recently, women on boards make a difference by adding the value-contribution to the board through different skills and attributes than the male board members. Research also finds that the number of women on the board affects a company’s corporate social responsibility (CSR) ratings, thus influencing the company’s reputation (Bear et al. 2010). Additionally, Buse, et. al. (2016) surveyed 1,456 nonprofit board chief executive officers and also found that both gender and racial diversity of the board influences the board governance practices, which is mediated by the board inclusion behaviors and diversity policies. In addition, a study of 240 YMCA organizations found that gender diversity leads to better organizational social performance; however, it does not contribute to higher donation levels. Instead, the age diversity of the board is attributed to higher donation levels (Siciliano, 1996).
Race As recently as in the 1980s, there was very little racial diversity in both nonprofit board leadership. In 1982, more than 98 percent of foundation CEOs and 96 percent of foundation board trustees were Caucasian (Mills, 2017).
Nonprofit leadership has become more diverse in recent years. The demography of nonprofit leadership has increased in diversity within the past few years. According to an empirical study of 440 candidates selected to be the top executive in a grant making institution from 2004 and 2008, around 19 percent of the new CEO candidates were members of diverse racial and ethnic groups and 48.9 percent were women (Branch et al. 2010). In addition, the 2008 Grantmakers Salary and Benefits report on 850 foundations and giving programs indicated that about 25 percent of full-time paid staff were minorities. However, based on the responses from 36.2 percent of program officers, only 6.8 percent of
minority individuals were named as full-time paid chief executives (Council on Foundations, 2009). In other words, the racial and ethnic composition in nonprofit leadership is much less diverse compared to the gender composition in the leadership level or the racial composition in the staff level.
The Urban Institute’s survey on 5,115 nonprofits indicates that 86 percent of board members are Caucasian and only 7 percent are African-American or black. Among nonprofits with over 50 percent of their clientele identifying as African-American or black, 18 percent include no African-American or black trustees. Among nonprofits with 25 to 49 percent of their clientele identifying as African-American or black, 36 percent have no African-American board members (Ostrower, 2007). In other words, the racial diversity of nonprofit board members does not fulfill its presentation function. However, research has found that a higher percentage of minority members on the board is positively associated with higher scores of political board performance (Brown, 2002a).
Other
In terms of board occupational composition, Siciliano (1996)’s study on 240 YMCA organizations found that occupational diversity of board members leads to higher levels of social performance and better fundraising.
The size of the board also varies across different nonprofit organization. A study on Spanish foundations indicated that the organizational income and organizational age are significant factors in predicting the board size (de Andres-Alonso, Azofra-Palenzuela, & Romero-Merino, 2009). Having private donor may also be related to a smaller board size (de Andrew-Alonso, et. al., 2009). Pfeffer’s (1973) study of hospital boards found that board size was predicted by hospital budget, the proportion of private donations, and the importance of influence in the community and fundraising.
35

ORGANIZATIONAL DIVERSITY AND BOARD CHARACTERISTICS
Subsector
Previous research has shown that the subsectors of nonprofits is related to the demographic diversity of the boards. Specifically, Abzug and Simonoff (2004) found that nonprofits were less likely to have an African American/black board member if the nonprofit was “a health, Junior League, and/or culture organization” (p.88). In addition, the study also found that the probability of a board member being female has been increasing over the years from 1931 to 1991 across different subsectors. In the year of 1931, human service organizations had the highest probability of having a board member being female, followed by United Way, culture, health, community foundations, and educational organizations. This pattern remains unchanged except within the culture organizations, which increased faster and surpassed the United Way. Yet in 1991, the probability of having a female board member for family services organizations increased rapidly to keep its first rank, then was followed by community foundations, United Way, culture, health and educational (Abzug & Simonoff, 2004).
In summary, boards of directors represent a diverse composition in the nonprofit sector that relate to the effectiveness of board performance and organizational performance. And board composition and diversity vary across the years and subsector.
FUNCTIONAL DIVERSITY
Nonprofit boards are comprised of volunteers, they are expected to be involved in different duties including “fundraising, financial oversight, evaluating the CEO/executive director; planning for the future, setting organizational policy, monitoring programs and policies, community relations, educating the public about the organization and its mission, monitoring the board’s own performance and acting as a counting board for management” (Ostrower, 2007, p.12). However, based upon the Urban Institute report on board performance (2007), boards are most actively engaged in financial oversight and setting organizational policy; less than one third among the samples of 5,115 nonprofits indicated board members were actively engaged in fundraising (Ostrower, 2007).
Board diversity also refers to the diversity of board activities. For instance, Ugboro and Obeng (2009)’s study on 184 board members indicated that the board is involved in a diverse area of activities, including contextual, interpersonal, strategic, educational, and political activities. Among which, the more diverse activities that the board members get involved, the less cost-based measures of organizational performance. In addition, Brown (2005)’s study used the judgment on board performance and organizational performance by 121 board members and 183 executives to find that from the board members’ perspective, the overall board competency, including contextual, analytical, interpersonal, and strategic competencies, significantly affects organizational performance, especially regarding
TABLE 1. THE PROBABILITIES OF HAVING A FEMALE BOARD MEMBER THROUGH THE YEARS
1931 1961 1991
Health 0.10 0.07 0.20
Culture 0.12 0.22 0.27
United Way 0.17 0.11 0.29
Community foundation 0.09 0.04 0.34
Educational 0.00 0.04 0.16
Family services 0.26 0.31 0.40Source: Abzug and Simonoff (2004), p. 89
36

raising the net revenue. Yet, from the executive’s perspective, the contextual and analytical competencies are important factors on organizational performance. Other studies also found that board diversity and expertise is positively associated with organizational performance (Harris, 2014).
On the other hand, some studies did not find a systematic relationship between board diversity and board performance. For example, O’Regan and Oster (2005)’s study on 4,000 board members found that board tenure and multiple boards seem to be positively related to the amount of giving from the board. However, other board member traits, such as age and gender were not significantly related to other types of board performance, such as whether to give or not, service hours, meeting attendance rates, and reports. Minichilli et al. (2009) studied 301 responses from CEOs of the 2,000 largest
CONCLUSIONWhile there has been some research on board diversity, researchers have not yet come to agreement on the connection between board diversity and organizational impact. How and in what ways a board should be demographically diverse will vary by the needs and goals of the organization. More research on the relationship between board diversity and organizational impact is needed.
37
Italian industrial companies ranked by turnover. They found that board members’ commitment is more important than the board demographic diversity in predicting board task performance. A board member’s expressed commitment does affect people’s perception towards board engagement. For instance, Preston and Brown (2004)’s study on 533 board members found that board members are perceived to be more engaged due to their board performance and their expressed affective commitment.
Organizational effectiveness is a multidimensional measure. According to Baruch and Ramalho (2006), studies published between 1992 and 2003 used multiple criteria, financial and nonfinancial. The most commonly used criterion for NPO studies is efficiency, which is regarded as an input-output ratio.
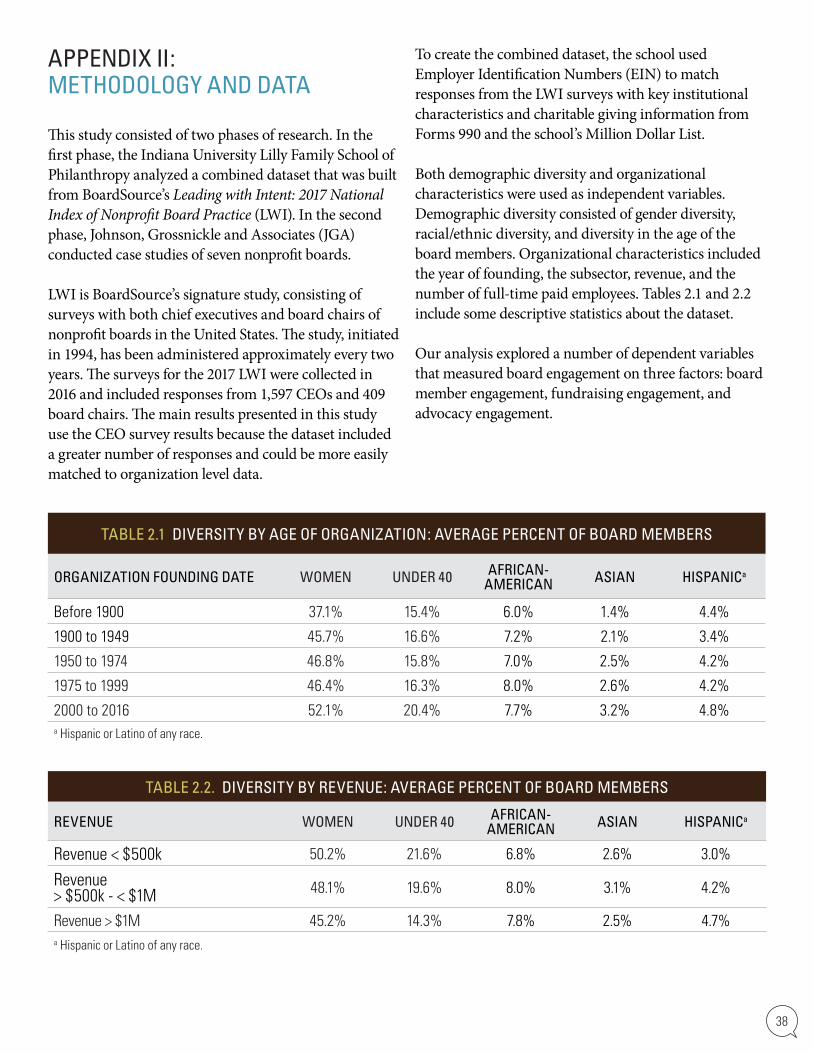
APPENDIX II:METHODOLOGY AND DATA
This study consisted of two phases of research. In the first phase, the Indiana University Lilly Family School of Philanthropy analyzed a combined dataset that was built from BoardSource’s Leading with Intent: 2017 National Index of Nonprofit Board Practice (LWI). In the second phase, Johnson, Grossnickle and Associates (JGA) conducted case studies of seven nonprofit boards.
LWI is BoardSource’s signature study, consisting of surveys with both chief executives and board chairs of nonprofit boards in the United States. The study, initiated in 1994, has been administered approximately every two years. The surveys for the 2017 LWI were collected in 2016 and included responses from 1,597 CEOs and 409 board chairs. The main results presented in this study use the CEO survey results because the dataset included a greater number of responses and could be more easily matched to organization level data.
To create the combined dataset, the school used Employer Identification Numbers (EIN) to match responses from the LWI surveys with key institutional characteristics and charitable giving information from Forms 990 and the school’s Million Dollar List.
Both demographic diversity and organizational characteristics were used as independent variables. Demographic diversity consisted of gender diversity, racial/ethnic diversity, and diversity in the age of the board members. Organizational characteristics included the year of founding, the subsector, revenue, and the number of full-time paid employees. Tables 2.1 and 2.2 include some descriptive statistics about the dataset.
Our analysis explored a number of dependent variables that measured board engagement on three factors: board member engagement, fundraising engagement, and advocacy engagement.
38
TABLE 2.1 DIVERSITY BY AGE OF ORGANIZATION: AVERAGE PERCENT OF BOARD MEMBERS
ORGANIZATION FOUNDING DATE WOMEN UNDER 40 AFRICAN-AMERICAN ASIAN HISPANICa
Before 1900 37.1% 15.4% 6.0% 1.4% 4.4%
1900 to 1949 45.7% 16.6% 7.2% 2.1% 3.4%
1950 to 1974 46.8% 15.8% 7.0% 2.5% 4.2%
1975 to 1999 46.4% 16.3% 8.0% 2.6% 4.2%
2000 to 2016 52.1% 20.4% 7.7% 3.2% 4.8%a Hispanic or Latino of any race.
TABLE 2.2. DIVERSITY BY REVENUE: AVERAGE PERCENT OF BOARD MEMBERS
REVENUE WOMEN UNDER 40 AFRICAN-AMERICAN ASIAN HISPANICa
Revenue < $500k 50.2% 21.6% 6.8% 2.6% 3.0%
Revenue > $500k - < $1M 48.1% 19.6% 8.0% 3.1% 4.2%
Revenue > $1M 45.2% 14.3% 7.8% 2.5% 4.7%a Hispanic or Latino of any race.
The following questions were considered measures of board member engagement:• How would you “grade” your BOARD’s
performance in the following areas: Commitment and involvement
• How strongly do you agree or disagree with the following statements related your BOARD’s culture?: The majority of board members is actively engaged in overseeing and governing the organization.
• In your opinion, what are the three most important areas the board should address to improve its own performance? Strengthen commitment and engagement of individual board members
The following questions were considered measures of fundraising engagement:
• How would you “grade” your BOARD’s performance in the following areas: Fundraising
• Please indicate your agreement with following statements: The board actively participates in fundraising versus relying mostly on the CEO and staff
• Please indicate your agreement with following statements: Expectations related to fundraising are clearly explained during recruitment
• In your opinion, what are the three most important areas the board should address to improve its own performance? Strengthen fundraising efforts
• Approximately what percent of board members participated in each of the following fundraising activities during the past year? Please estimate a percentage for each activity: Attended fundraising events
• Approximately what percent of board members participated in each of the following fundraising activities during the past year? Please estimate a percentage for each activity: Made a personal financial contribution
39
• Approximately what percent of board members participated in each of the following fundraising activities during the past year? Please estimate a percentage for each activity: Provided names of contacts and referrals for fundraising letters/calls
• Approximately what percent of board members participated in each of the following fundraising activities during the past year? Please estimate a percentage for each activity: Met with potential donors face-to-face
• Approximately what percent of board members participated in each of the following fundraising activities during the past year? Please estimate a percentage for each activity: Asked, or joined others in directly asking, for money
The following questions were considered measures of advocacy engagement:
• To what extent did the board engage in the following public policy or advocacy activities: Monitored the impact of local, state, and federal policy on the organization’s mission delivery and resources
• To what extent did the board engage in the following public policy or advocacy activities: Received information and resources on effective and appropriate advocacy activities on behalf of the organization
• To what extent did the board engage in the following public policy or advocacy activities: Worked in concert with the chief executive and leadership team to educate policymakers on behalf of the organization, its mission, and/or the nonprofit sector
We used ordinary least squares, tobit, logit, and ordered logit regressions, where appropriate, to analyze the data. Controls included the age of the organization (year founded), the region the organization is located, revenue size, number of employees, gender of board members, race/ethnicity of board members, and age of board members. Robustness tests were conducted with and without demographic measurements.

Cornforth, C. (2001). What makes boards effective? An examination of the relationships between board inputs, structures, processes and effectiveness in non‐profit organisations. Corporate Governance: An International Review, 9(3), 217-227.
Council on Foundations. (2009). 2008 Grantmakers Salary and Benefits Report.
Daley, J. M. (2002). An action guide for nonprofit board diversity. Journal of Community Practice, 10(1), 33-54.
Daley, J. M., & Angulo, J. (1994). Understanding the dynamics of diversity within nonprofit boards. Community Development, 25(2), 172-188.
de Andrés-Alonso, P., Azofra-Palenzuela, V., & Romero-Merino, M. E. (2009). Determinants of nonprofit board size and composition: The case of Spanish foundations. Nonprofit and Voluntary Sector Quarterly, 38(5), 784-809.
Fredette, C., Bradshaw, P., & Inglis, S. (2007). Moving to transformational inclusivity and board diversity. ASAC, 28(11).
Guo, C, & Musso, J.A. (2007). Representation in nonprofit and voluntary organizations: A conceptual framework. Nonprofit and Voluntary Sector Quarterly, 36(2), 308-326.
Hall, P. D. (1997). A history of nonprofit boards in the United States. National Center for Nonprofit Boards.
Harris, E. E. (2014). The impact of board diversity and expertise on nonprofit performance. Nonprofit Management and Leadership, 25(2), 113-130.
Herman, R. D., & Renz, D. O. (2008). Advancing nonprofit organizational effectiveness research and theory: Nine theses. Nonprofit Management and Leadership, 18(4), 399-415.
Holland, T. P. & Jackson, D. K. (1998). Strengthening board performance: Findings and lessons from demonstration projects. Nonprofit Management & Leadership, 9(2), 121-134.
Jackson, D. K., & Holland, T. P. (1998). Measuring the effectiveness of nonprofit boards. Nonprofit and voluntary sector quarterly, 27(2), 159-182.
40
APPENDIX III: REFERENCES
Abzug, R., & Simonoff, J. S. (2004). Nonprofit trusteeship in different contexts (p. 92). Aldershot: Ashgate.
Baruch, Y. & Ramalho, N. (2006). Communalities and distinctions in the measurement of organizational performance and effectiveness across for-profit and nonprofit sectors. Nonprofit and Voluntary Sector Quarterly, 35(1), 39-65.
Bear, S., Rahman, N., & Post, C. (2010). The impact of board diversity and gender composition on corporate social responsibility and firm reputation. Journal of Business Ethics, 97(2), 207-221.
Buse, K., Bernstein, R. S., & Bilimoria, D. (2016). The influence of board diversity, board diversity policies and practices, and board inclusion behaviors on nonprofit governance practices. Journal of Business Ethics, 133(1), 179.
Branch, R. B., Moody, M. P., Marx Smock, S., & Bransford, D. N. (2010). Who becomes a foundation CEO? An analysis of hiring patterns, 2004-2008. The Foundation Review, 2(2), 7.
Brown, W. A. (2002a). Racial diversity and performance of nonprofit boards of directors. Journal of Applied Management and Entrepreneurship, 7(4), 43-57.
Brown, W. A. (2002b). Inclusive governance practices in nonprofit organizations and implications for practice. Nonprofit Management and Leadership, 12(4), 369-385.
Brown, W. A. (2005). Exploring the association between board and organizational performance in nonprofit organizations. Nonprofit Management and Leadership, 15(3), 317-339.
Bureau of Labor Statistics. (2011). Spotlight: Women at Work. Retrieved from http://www.bls.gov/spotlight/2011/women/.
Colby, S. L. & Ortman, J. M. (2015). Projections of the size and composition of the U.S. population: 2014 to 2060. Current Population Reports, P25-1143, U.S. Census Bureau, Washington, DC.
Jaskyte, K. (2012). Boards of directors and innovation in nonprofit organizations. Nonprofit Management and Leadership, 22(4), 439-459.
Kasper, G., Ramos, H. A., & Walker, C. J. (2004). Making the case for diversity in philanthropy. Foundation News & Commentary, 45(6), 26-35.
McKeever, B. S. (2015). The nonprofit sector in brief 2015: Public charities, giving, and volunteering. Urban Institute: Center on Nonprofits and Philanthropy.
Mesch, D. (2010). Women Give 2010 Part 2: Causes Women Support.
Miller, J. L. (1999). Managing board diversity: The importance of differentiating between diversity and representativeness. Perspectives on Nonprofit Board Diversity: National Center for Nonprofit Boards, 2-10.
Mills, F. (2017). The state of change: An analysis of women and people of color in the philanthropic sector. Council on Foundations. Retrieved from https://www.cof.org/sites/default/files/documents/files/2017-Gender-Diversity-Report.pdf
Minichilli, A., Zattoni, A., & Zona, F. (2009). Making boards effective: An empirical examination of board task performance. British Journal of Management, 20(1), 55-74.
O’Regan, K., & Oster, S. M. (2005). Does the structure and composition of the board matter? The case of nonprofit organizations. Journal of Law, Economics, and Organization, 21(1), 205-227.
Ostrower, F. (2007). Nonprofit governance in the United States. Washington, DC: Urban Institute.
Pfeffer, J. (1973). Size, composition, and function of hospital boards of directors: A study of organization-environment linkage. Administrative science quarterly, 349-364.
Preston, J. B., & Brown, W. A. (2004). Commitment and performance of nonprofit board members. Nonprofit Management and Leadership, 15(2), 221-238.
Salamon, L. M., & Siegfried, J. J. (1977). Economic power and political influence: The impact of industry structure on public policy. American Political Science Review, 71(3), 1026-1043.
Siciliano, J. I. (1996). The relationship of board member diversity to organizational performance. Journal of Business Ethics, 15(12), 1313-1320.
Ugboro, I. O., & Obeng, K. (2009). Board activities, involvement, and public transit performance. Administration & Society, 41(2), 235-257.
U.S. Census Bureau. (2016). American Community Survey 1-year estimates. Retrieved from Census Reporter Profile page for United States https://censusreporter.org/profiles/01000US-united-states/
U.S. Census Bureau. (2017). QuickFacts: United States. Retrieved from https://www.census.gov/quickfacts/fact/table/US/PST045217
Walt, N. & Ingley, C. (2003). Board dynamics and the influence of professional background, gender and ethnic diversity of directors. Corporate Governance, 11(3), 218-234.
Wiepking, P. & Bekkers, R. (2012). Who gives? A literature review of predictors of charitable giving. Part two: gender, family composition and income. Voluntary Sector Review, 3(2), 217-245.
41
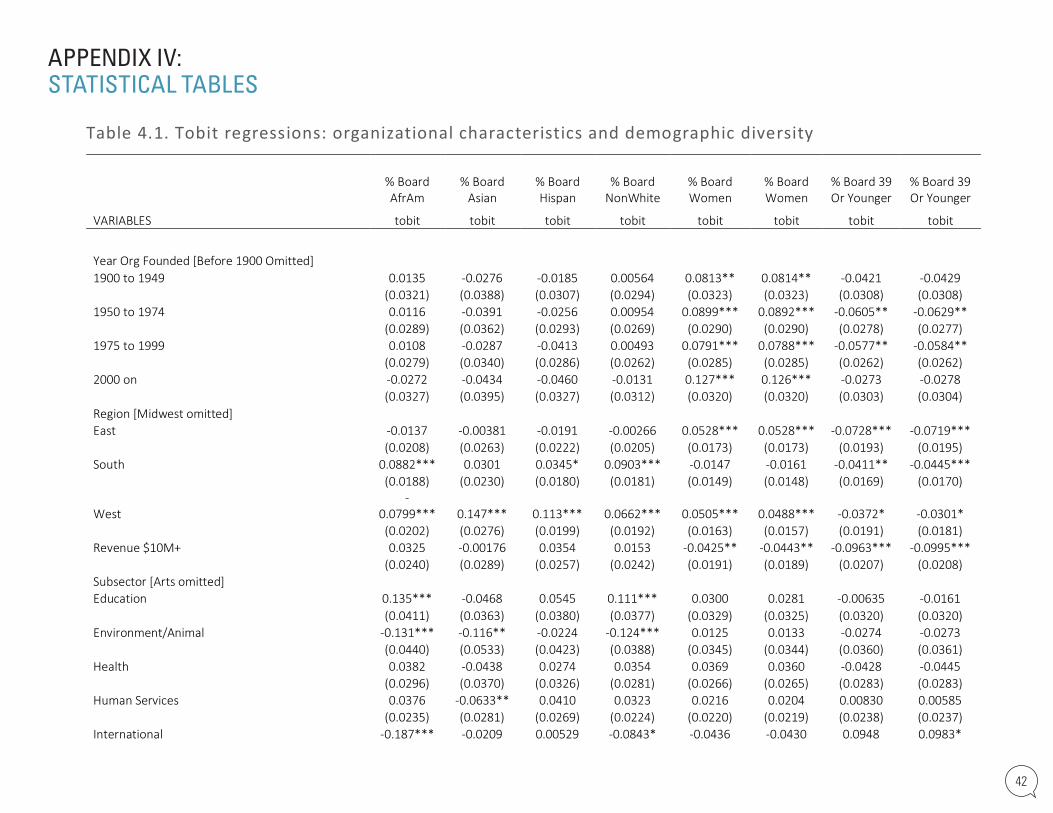
2
Table 4.1. Tobit regressions: organizational characteristics and demographic diversity
% Board
AfrAm
% Board
Asian
% Board
Hispan
% Board
NonWhite
% Board
Women
% Board
Women
% Board 39
Or Younger
% Board 39
Or Younger
VARIABLES tobit tobit tobit tobit tobit tobit tobit tobit
Year Org Founded [Before 1900 Omitted]
1900 to 1949 0.0135 -0.0276 -0.0185 0.00564 0.0813** 0.0814** -0.0421 -0.0429
(0.0321) (0.0388) (0.0307) (0.0294) (0.0323) (0.0323) (0.0308) (0.0308)
1950 to 1974 0.0116 -0.0391 -0.0256 0.00954 0.0899*** 0.0892*** -0.0605** -0.0629**
(0.0289) (0.0362) (0.0293) (0.0269) (0.0290) (0.0290) (0.0278) (0.0277)
1975 to 1999 0.0108 -0.0287 -0.0413 0.00493 0.0791*** 0.0788*** -0.0577** -0.0584**
(0.0279) (0.0340) (0.0286) (0.0262) (0.0285) (0.0285) (0.0262) (0.0262)
2000 on -0.0272 -0.0434 -0.0460 -0.0131 0.127*** 0.126*** -0.0273 -0.0278
(0.0327) (0.0395) (0.0327) (0.0312) (0.0320) (0.0320) (0.0303) (0.0304)
Region [Midwest omitted]
East -0.0137 -0.00381 -0.0191 -0.00266 0.0528*** 0.0528*** -0.0728*** -0.0719***
(0.0208) (0.0263) (0.0222) (0.0205) (0.0173) (0.0173) (0.0193) (0.0195)
South 0.0882*** 0.0301 0.0345* 0.0903*** -0.0147 -0.0161 -0.0411** -0.0445***
(0.0188) (0.0230) (0.0180) (0.0181) (0.0149) (0.0148) (0.0169) (0.0170)
West
-
0.0799*** 0.147*** 0.113*** 0.0662*** 0.0505*** 0.0488*** -0.0372* -0.0301*
(0.0202) (0.0276) (0.0199) (0.0192) (0.0163) (0.0157) (0.0191) (0.0181)
Revenue $10M+ 0.0325 -0.00176 0.0354 0.0153 -0.0425** -0.0443** -0.0963*** -0.0995***
(0.0240) (0.0289) (0.0257) (0.0242) (0.0191) (0.0189) (0.0207) (0.0208)
Subsector [Arts omitted]
Education 0.135*** -0.0468 0.0545 0.111*** 0.0300 0.0281 -0.00635 -0.0161
(0.0411) (0.0363) (0.0380) (0.0377) (0.0329) (0.0325) (0.0320) (0.0320)
Environment/Animal -0.131*** -0.116** -0.0224 -0.124*** 0.0125 0.0133 -0.0274 -0.0273
(0.0440) (0.0533) (0.0423) (0.0388) (0.0345) (0.0344) (0.0360) (0.0361)
Health 0.0382 -0.0438 0.0274 0.0354 0.0369 0.0360 -0.0428 -0.0445
(0.0296) (0.0370) (0.0326) (0.0281) (0.0266) (0.0265) (0.0283) (0.0283)
Human Services 0.0376 -0.0633** 0.0410 0.0323 0.0216 0.0204 0.00830 0.00585
(0.0235) (0.0281) (0.0269) (0.0224) (0.0220) (0.0219) (0.0238) (0.0237)
International -0.187*** -0.0209 0.00529 -0.0843* -0.0436 -0.0430 0.0948 0.0983*
APPENDIX IV: STATISTICAL TABLES
42

3
(0.0633) (0.0621) (0.0502) (0.0499) (0.0393) (0.0393) (0.0598) (0.0596)
Public Service Benefit 0.0100 0.0195 0.0276 0.0190 0.00415 0.00381 0.0253 0.0267
(0.0273) (0.0338) (0.0305) (0.0278) (0.0254) (0.0253) (0.0284) (0.0283)
Religious 0.00603 -0.145 0.121* 0.0100 -0.182*** -0.184*** 0.0163 0.0157
(0.0661) (0.115) (0.0668) (0.0661) (0.0523) (0.0517) (0.0801) (0.0798)
Unknown/Unclassified -0.00865 -0.0433 0.0250 -0.00681 0.00560 0.00475 0.0183 0.0174
(0.0246) (0.0278) (0.0265) (0.0230) (0.0227) (0.0226) (0.0243) (0.0242)
Number of Full-Time Employees 6.00e-06 3.27e-05 -7.00e-05 -5.41e-06 -1.11e-05 -9.01e-06 -5.22e-05 -4.91e-05
(5.65e-05) (4.80e-05) (5.04e-05) (5.38e-05) (3.22e-05) (3.14e-05) (4.35e-05) (4.37e-05)
% of the Board Women 0.0496 0.0873** 0.00773 0.0728* 0.188*** 0.187***
(0.0414) (0.0428) (0.0359) (0.0386) (0.0384) (0.0386)
% of the Board 39 or Younger 0.0541 0.152*** 0.0539 0.145*** 0.180*** 0.178***
(0.0519) (0.0502) (0.0396) (0.0472) (0.0389) (0.0388)
% of the Board African-American 0.0700 0.0882
(0.0604) (0.0732)
% of the Board Asian 0.0963 0.292***
(0.0628) (0.0846)
% of the Board Hispanic 0.00940 0.0949
(0.0570) (0.0642)
% of the Board Non-White (imputed) 0.0869** 0.157***
(0.0413) (0.0490)
Constant -0.0776** -0.211*** -0.133*** -0.0405 0.319*** 0.318*** 0.122*** 0.121***
(0.0377) (0.0534) (0.0419) (0.0348) (0.0351) (0.0351) (0.0353) (0.0353)
Observations 1,181 1,183 1,183 1,183 1,181 1,183 1,181 1,183
Robust standard errors in parentheses
*** p<0.01, ** p<0.05, * p<0.1
43

4
Table 4.2. Ordered logit regressions: advocacy & demographics
1-4 Scale Board
Engagement With
Policymakers
1-4 Scale
Board
Engagement
With
Policymakers
1-4 Scale Board
Engagement
With
Monitoring
Impact Of
Government
Policy
1-4 Scale Board
Engagement
With Monitoring
Impact Of
Government
Policy
1-4 Scale
Board
Engagement
With
Information
On Advocacy
Activities
1-4 Scale Board
Engagement
With Information
On Advocacy
Activities
VARIABLES Ordered Logit Ordered Logit Ordered Logit Ordered Logit Ordered Logit Ordered Logit
Age of organization (before 1900 omitted)
1900 to 1949 0.0308 0.0275 0.135 0.147 -0.0624 -0.0667
(0.282) (0.281) (0.315) (0.313) (0.268) (0.267)
1950 to 1974 -0.102 -0.105 0.0647 0.0734 0.00463 -0.00458
(0.263) (0.261) (0.298) (0.296) (0.238) (0.238)
1975 to 1999 -0.485* -0.497** -0.466 -0.467 -0.457** -0.476**
(0.252) (0.251) (0.290) (0.287) (0.232) (0.232)
2000 to 2016 -0.169 -0.178 -0.555* -0.551* -0.652** -0.664**
(0.280) (0.280) (0.315) (0.313) (0.269) (0.269)
Region (North omitted)
East -0.0701 -0.0646 -0.270 -0.265 -0.337** -0.334**
(0.174) (0.175) (0.171) (0.171) (0.166) (0.166)
South 0.283* 0.281* 0.152 0.173 0.209 0.204
(0.161) (0.158) (0.152) (0.150) (0.149) (0.148)
West 0.0281 0.0349 -0.0882 -0.106 0.00980 -0.00764
(0.170) (0.166) (0.169) (0.165) (0.167) (0.163)
Revenue over $10 million? 0.678*** 0.668*** 0.805*** 0.805*** 0.705*** 0.692***
(0.198) (0.198) (0.222) (0.221) (0.220) (0.218)
NTEE Category (Arts Omitted)
Education 0.0326 0.00469 -0.248 -0.244 -0.0281 -0.0533
44

5
(0.287) (0.284) (0.294) (0.288) (0.281) (0.276)
Environment/Animal 0.146 0.134 -0.319 -0.332 -0.0660 -0.0584
(0.338) (0.337) (0.346) (0.345) (0.328) (0.327)
Health 0.139 0.148 0.370 0.393 0.374 0.391
(0.261) (0.260) (0.258) (0.258) (0.257) (0.256)
Human Services 0.0303 0.00358 0.134 0.124 0.385* 0.372*
(0.220) (0.220) (0.203) (0.203) (0.213) (0.212)
International -1.345** -1.376** -1.994*** -2.040*** -0.864* -0.874*
(0.560) (0.573) (0.597) (0.603) (0.463) (0.469)
Public Society Benefit -0.175 -0.179 -0.0818 -0.0824 -0.0204 -0.0284
(0.248) (0.248) (0.236) (0.236) (0.245) (0.245)
Religious -0.467 -0.459 -0.986* -0.990* 0.177 0.190
(0.684) (0.683) (0.548) (0.542) (0.567) (0.567)
Mutual/Membership Benefit -0.177 -0.104 -15.49*** -15.48*** -13.99*** -13.94***
(0.362) (0.361) (1.071) (1.070) (1.063) (1.062)
Unknown / Unclassified / Missing 0.0477 0.0241 -0.0477 -0.0774 0.269 0.249
(0.226) (0.226) (0.215) (0.215) (0.221) (0.221)
Number of full-time paid employees -7.54e-05 -3.95e-05 0.000373 0.000400 0.000240 0.000262
(0.000559) (0.000572) (0.000490) (0.000510) (0.000383) (0.000389)
% of Board That Are Women -0.285 -0.264 0.172 0.200 0.398 0.405
(0.316) (0.316) (0.317) (0.315) (0.315) (0.313)
% of Board That Are Under 40 0.240 0.258 0.0206 0.0520 0.577* 0.572
(0.347) (0.348) (0.343) (0.344) (0.349) (0.351)
% of Board That Are African-American 0.368 0.630 0.0907
(0.480) (0.415) (0.389)
% of Board That Are Asian 1.347* 1.040 0.367
(0.789) (0.680) (0.766)
% of Board That Are Hispanic 0.133 0.135 0.0337
(0.605) (0.701) (0.635)
% of Board That Are Non-white 0.633** 0.514** 0.354
(0.256) (0.226) (0.229)
45
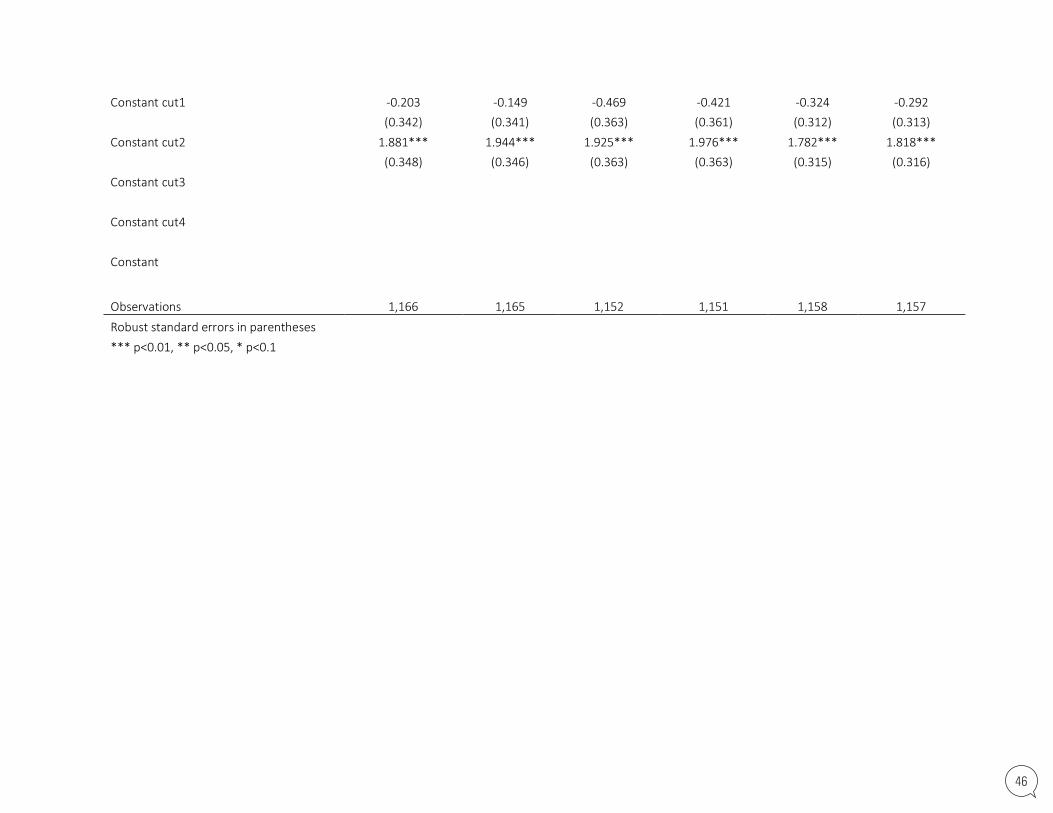
6
Constant cut1 -0.203 -0.149 -0.469 -0.421 -0.324 -0.292
(0.342) (0.341) (0.363) (0.361) (0.312) (0.313)
Constant cut2 1.881*** 1.944*** 1.925*** 1.976*** 1.782*** 1.818***
(0.348) (0.346) (0.363) (0.363) (0.315) (0.316)
Constant cut3
Constant cut4
Constant
Observations 1,166 1,165 1,152 1,151 1,158 1,157
Robust standard errors in parentheses
*** p<0.01, ** p<0.05, * p<0.1
46

7
Table 4.3. Ordered logit regressions: board member engagement & demographics
Agree-Scale on if
Board Engaged in
Overseeing/Governing
the Org
Agree-Scale on if
Board Engaged in
Overseeing/
Governing
the Org
F-A Scale
Grading Board's
Commitment &
Involvement
F-A Scale
Grading
Board's
Commitment
&
Involvement
Board Should
Strengthen
Commitment &
Engagement of
Individual Members
Board Should
Strengthen
Commitment &
Engagement of
Individual
Members
VARIABLES Ordered Logit Ordered Logit Ordered Logit Ordered Logit Logit Odds-Ratios Logit Odds-Ratios
Age of organization (before 1900
omitted)
1900 to 1949 0.0937 0.0935 0.105 0.107 1.106 1.098
(0.268) (0.267) (0.269) (0.269) (0.429) (0.426)
1950 to 1974 -0.119 -0.127 0.226 0.215 1.602 1.590
(0.249) (0.248) (0.247) (0.248) (0.568) (0.564)
1975 to 1999 -0.0780 -0.0777 0.0174 0.0194 1.573 1.563
(0.242) (0.241) (0.238) (0.239) (0.545) (0.541)
2000 to 2016 -0.342 -0.344 0.0197 0.0335 1.517 1.480
(0.270) (0.270) (0.265) (0.266) (0.561) (0.548)
Region (North omitted)
East -0.225 -0.221 -0.134 -0.135 1.014 1.023
(0.161) (0.160) (0.163) (0.163) (0.200) (0.202)
South -0.117 -0.112 -0.133 -0.122 1.109 1.098
(0.155) (0.153) (0.146) (0.145) (0.200) (0.195)
West -0.190 -0.174 -0.00550 -0.0132 0.937 0.976
(0.161) (0.158) (0.160) (0.156) (0.180) (0.181)
Revenue over $10 million? 0.604*** 0.575*** 0.596*** 0.560*** 0.671 0.662
(0.187) (0.188) (0.180) (0.182) (0.190) (0.187)
NTEE Category (Arts Omitted)
Education -0.0571 -0.0526 0.104 0.131 0.997 0.992
(0.284) (0.276) (0.302) (0.298) (0.342) (0.340)
47

8
Environment/Animal -0.404 -0.417 -0.243 -0.248 1.186 1.180
(0.350) (0.351) (0.380) (0.381) (0.459) (0.456)
Health 0.175 0.177 0.201 0.236 0.840 0.815
(0.227) (0.227) (0.254) (0.253) (0.260) (0.254)
Human Services -0.148 -0.149 0.00895 0.0277 0.989 0.984
(0.197) (0.196) (0.222) (0.223) (0.254) (0.252)
International -1.023** -1.024** -0.671* -0.661 1.145 1.148
(0.480) (0.483) (0.402) (0.403) (0.594) (0.593)
Public Society Benefit 0.315 0.324 0.378 0.385 1.139 1.146
(0.232) (0.231) (0.243) (0.244) (0.329) (0.331)
Religious 0.278 0.269 0.472 0.471 0.221 0.230
(0.438) (0.437) (0.320) (0.320) (0.235) (0.244)
Mutual/Membership Benefit 14.58*** 14.58*** 13.53*** 13.52***
(1.052) (1.052) (1.056) (1.057)
Unknown / Unclassified / Missing -0.278 -0.289 0.00803 0.0132 0.995 0.986
(0.208) (0.207) (0.226) (0.227) (0.264) (0.261)
Number of full-time paid employees -0.000237 -0.000210 -9.52e-05 -7.72e-05 1.001* 1.001*
(0.000273) (0.000296) (0.000146) (0.000147) (0.000725) (0.000740)
% of Board That Are Women 0.609** 0.628** 1.132*** 1.113*** 0.958 1.000
(0.301) (0.300) (0.290) (0.289) (0.334) (0.345)
% of Board That Are Under 40 0.339 0.374 -0.346 -0.329 1.131 1.139
(0.342) (0.338) (0.317) (0.318) (0.418) (0.420)
% of Board That Are African-American 0.120 -0.0354 1.059
(0.440) (0.429) (0.542)
% of Board That Are Asian 0.561 -0.542 1.959
(0.851) (0.601) (1.574)
% of Board That Are Hispanic -0.116 -0.113 1.795
(0.644) (0.577) (1.240)
% of Board That Are Non-white -0.0265 -0.305 1.331
(0.253) (0.240) (0.358)
Constant cut1 -3.720*** -3.725*** -3.833*** -3.870***
48
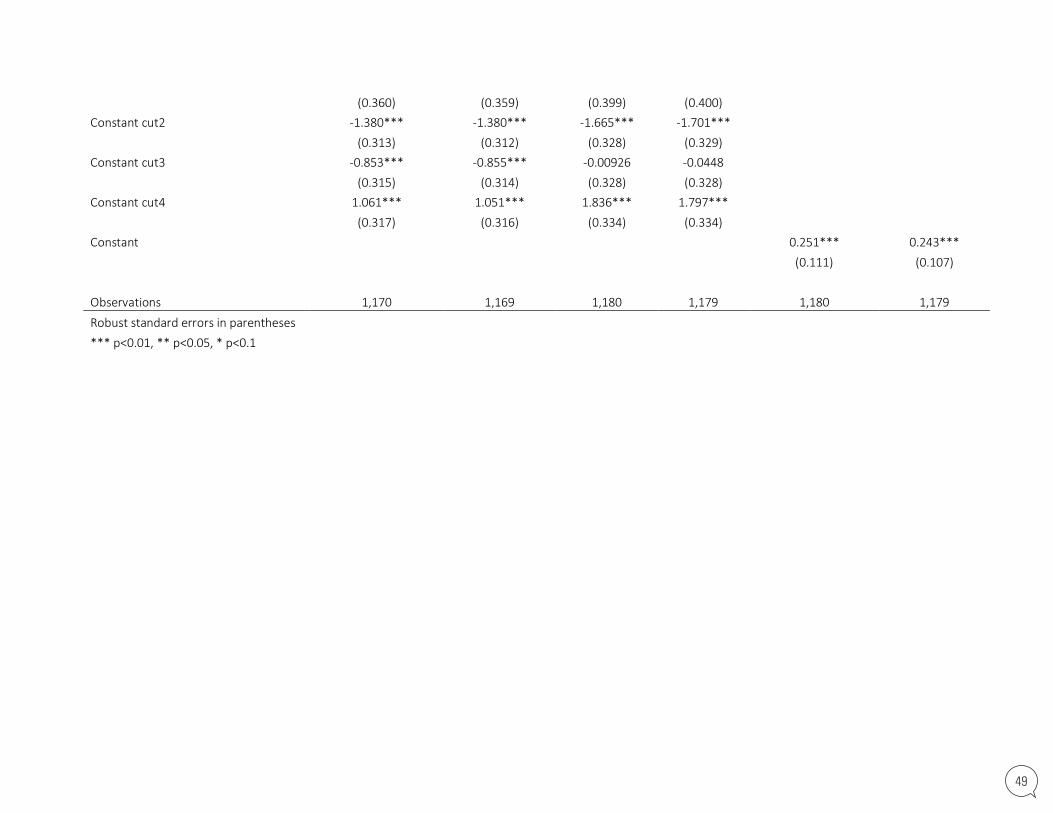
9
(0.360) (0.359) (0.399) (0.400)
Constant cut2 -1.380*** -1.380*** -1.665*** -1.701***
(0.313) (0.312) (0.328) (0.329)
Constant cut3 -0.853*** -0.855*** -0.00926 -0.0448
(0.315) (0.314) (0.328) (0.328)
Constant cut4 1.061*** 1.051*** 1.836*** 1.797***
(0.317) (0.316) (0.334) (0.334)
Constant 0.251*** 0.243***
(0.111) (0.107)
Observations 1,170 1,169 1,180 1,179 1,180 1,179
Robust standard errors in parentheses
*** p<0.01, ** p<0.05, * p<0.1
49
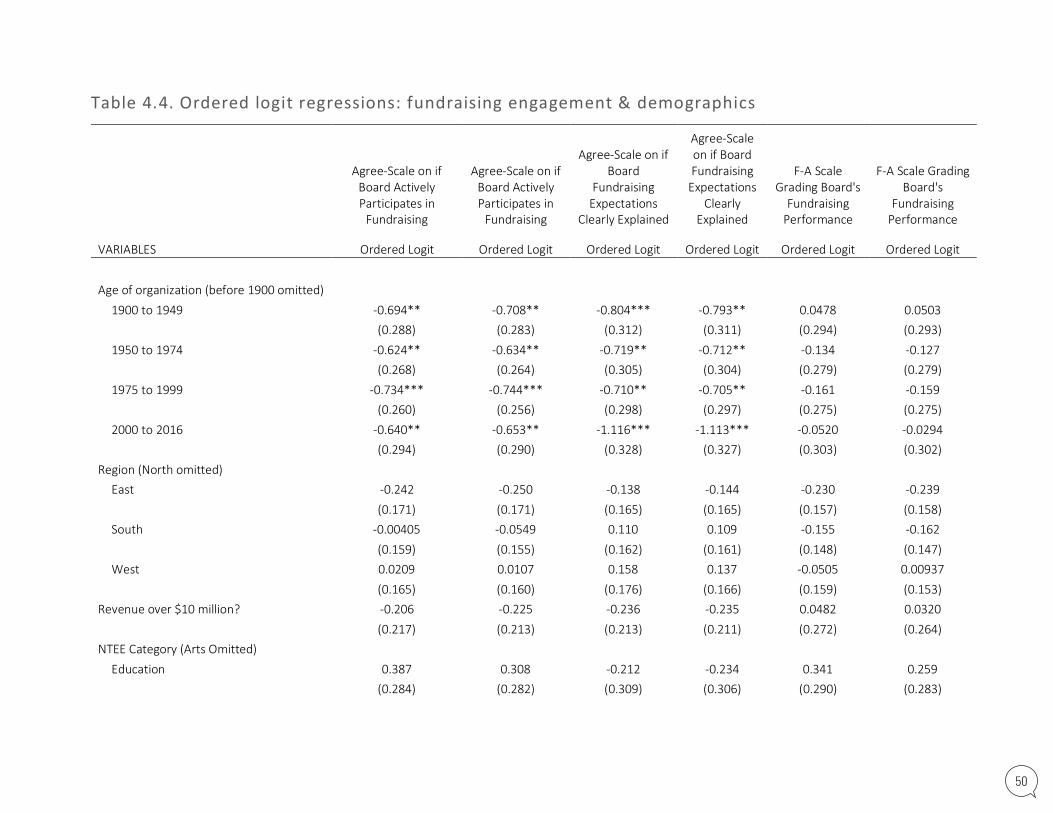
10
Table 4.4. Ordered logit regressions: fundraising engagement & demographics
Agree-Scale on if
Board Actively
Participates in
Fundraising
Agree-Scale on if
Board Actively
Participates in
Fundraising
Agree-Scale on if
Board
Fundraising
Expectations
Clearly Explained
Agree-Scale
on if Board
Fundraising
Expectations
Clearly
Explained
F-A Scale
Grading Board's
Fundraising
Performance
F-A Scale Grading
Board's
Fundraising
Performance
VARIABLES Ordered Logit Ordered Logit Ordered Logit Ordered Logit Ordered Logit Ordered Logit
Age of organization (before 1900 omitted)
1900 to 1949 -0.694** -0.708** -0.804*** -0.793** 0.0478 0.0503
(0.288) (0.283) (0.312) (0.311) (0.294) (0.293)
1950 to 1974 -0.624** -0.634** -0.719** -0.712** -0.134 -0.127
(0.268) (0.264) (0.305) (0.304) (0.279) (0.279)
1975 to 1999 -0.734*** -0.744*** -0.710** -0.705** -0.161 -0.159
(0.260) (0.256) (0.298) (0.297) (0.275) (0.275)
2000 to 2016 -0.640** -0.653** -1.116*** -1.113*** -0.0520 -0.0294
(0.294) (0.290) (0.328) (0.327) (0.303) (0.302)
Region (North omitted)
East -0.242 -0.250 -0.138 -0.144 -0.230 -0.239
(0.171) (0.171) (0.165) (0.165) (0.157) (0.158)
South -0.00405 -0.0549 0.110 0.109 -0.155 -0.162
(0.159) (0.155) (0.162) (0.161) (0.148) (0.147)
West 0.0209 0.0107 0.158 0.137 -0.0505 0.00937
(0.165) (0.160) (0.176) (0.166) (0.159) (0.153)
Revenue over $10 million? -0.206 -0.225 -0.236 -0.235 0.0482 0.0320
(0.217) (0.213) (0.213) (0.211) (0.272) (0.264)
NTEE Category (Arts Omitted)
Education 0.387 0.308 -0.212 -0.234 0.341 0.259
(0.284) (0.282) (0.309) (0.306) (0.290) (0.283)
50

11
Environment/Animal -0.530 -0.516 -0.858*** -0.867*** -0.614* -0.642**
(0.323) (0.320) (0.312) (0.310) (0.317) (0.319)
Health -0.234 -0.282 -0.481* -0.494* -0.309 -0.313
(0.230) (0.231) (0.255) (0.256) (0.246) (0.248)
Human Services 0.148 0.121 -0.199 -0.211 0.0270 -0.000879
(0.185) (0.186) (0.215) (0.216) (0.210) (0.209)
International -0.443 -0.420 -0.711 -0.733* -0.605** -0.588*
(0.467) (0.467) (0.441) (0.445) (0.300) (0.302)
Public Society Benefit 0.297 0.286 -0.0456 -0.0443 0.349 0.352
(0.232) (0.233) (0.258) (0.259) (0.246) (0.244)
Religious -0.0814 -0.155 -0.451 -0.514* 0.261 0.142
(0.607) (0.604) (0.295) (0.297) (0.653) (0.675)
Mutual/Membership Benefit
Unknown / Unclassified / Missing 0.0208 -0.00553 -0.524** -0.547** -0.00650 -0.0208
(0.202) (0.202) (0.225) (0.225) (0.216) (0.215)
Number of full-time paid employees -0.000446 -0.000441 0.000288 0.000288 0.000715 0.000711
(0.000434) (0.000428) (0.000228) (0.000228) (0.00102) (0.000986)
% of Board That Are Women 0.778** 0.739** 0.270 0.286 0.574* 0.555*
(0.315) (0.316) (0.314) (0.314) (0.293) (0.291)
% of Board That Are Under 40 0.215 0.195 0.832** 0.868*** 0.0483 0.101
(0.359) (0.360) (0.337) (0.336) (0.348) (0.349)
% of Board That Are African-American -0.812** 0.105 -0.645
(0.393) (0.443) (0.397)
% of Board That Are Asian -0.130 0.794 1.404**
(0.540) (0.724) (0.555)
% of Board That Are Hispanic -0.783 -0.734 -0.876*
(0.590) (0.771) (0.503)
% of Board That Are Non-white -0.261 -0.00958 -0.307
(0.273) (0.271) (0.241)
Constant cut1 -2.236*** -2.264*** -3.658*** -3.653*** -2.004*** -2.021***
51

12
(0.325) (0.327) (0.381) (0.383) (0.353) (0.354)
Constant cut2 -0.714** -0.741** -2.389*** -2.385*** -0.380 -0.398
(0.323) (0.325) (0.377) (0.380) (0.346) (0.347)
Constant cut3 0.0201 -0.00820 -1.532*** -1.528*** 1.208*** 1.182***
(0.323) (0.326) (0.373) (0.375) (0.347) (0.349)
Constant cut4 1.838*** 1.796*** 0.401 0.402 2.969*** 2.939***
(0.328) (0.330) (0.369) (0.371) (0.363) (0.364)
Constant
Observations 1,032 1,030 1,032 1,030 1,148 1,147
Robust standard errors in parentheses
*** p<0.01, ** p<0.05, * p<0.1
52

13
Table 4.5. OLS regressions: fundraising (questions 1-5)
(1) (2) (3) (4) (5)
% Of Board that Attend a
Fundraising Event
% Of Board that
Attend a
Fundraising Event
% Of Board that
Provide Contacts
% Of Board that
Provide Contacts
% Of Board that
Meet With
Potential Donors
VARIABLES OLS OLS OLS OLS OLS
Age of organization (before 1900 omitted)
1900 to 1949 -2.874 -3.082 -8.764* -8.851* -10.74***
(5.186) (5.174) (5.250) (5.228) (4.040)
1950 to 1974 -3.779 -3.982 -11.91** -12.04** -12.50***
(4.808) (4.789) (5.061) (5.051) (3.809)
1975 to 1999 2.142 1.972 -7.313 -7.564 -11.33***
(4.615) (4.591) (4.883) (4.877) (3.802)
2000 to 2016 -10.92** -10.89** -9.848* -10.00* -8.833**
(5.300) (5.275) (5.312) (5.314) (4.092)
Region (North omitted)
East -2.181 -2.183 -2.036 -1.890 -3.319*
(3.309) (3.308) (2.876) (2.861) (1.820)
South -1.559 -2.444 -0.885 -1.461 0.935
(2.989) (2.979) (2.590) (2.581) (1.779)
West 5.219* 5.483* 1.668 1.832 0.148
(3.137) (3.038) (2.922) (2.815) (1.987)
Revenue over $10 million? -3.650 -4.037 6.806* 6.553* -0.264
(4.164) (4.118) (3.640) (3.624) (2.214)
NTEE Category (Arts Omitted)
Education -2.743 -4.784 -2.416 -3.924 3.669
(5.493) (5.401) (5.094) (5.036) (3.261)
Environment/Animal -0.172 -0.0700 -7.843 -7.764 3.336
(5.772) (5.771) (5.137) (5.132) (3.763)
53

14
Health -10.46** -11.28** -9.223** -9.861** -1.032
(5.213) (5.247) (4.320) (4.291) (2.516)
Human Services -1.749 -2.601 3.375 2.627 4.038*
(3.747) (3.741) (3.556) (3.561) (2.149)
International -0.727 -0.0995 -3.258 -2.801 2.126
(9.019) (8.985) (5.403) (5.256) (3.393)
Public Society Benefit -12.39** -12.79*** -0.979 -1.371 5.083*
(4.844) (4.852) (4.270) (4.266) (2.649)
Religious -4.820 -6.431 -8.170 -8.947 6.775
(11.70) (11.68) (7.026) (6.783) (7.134)
Unknown / Unclassified / Missing -4.945 -5.594 -5.312 -5.862 1.793
(3.900) (3.907) (3.680) (3.695) (2.147)
Number of full-time paid employees 0.00332 0.00361 -0.000838 -0.000431 -0.00179
(0.00545) (0.00536) (0.00492) (0.00489) (0.00196)
% of Board That Are Women 7.763 7.033 8.728 8.840 1.695
(6.059) (6.043) (5.352) (5.379) (3.958)
% of Board That Are Under 40 6.386 6.383 10.75* 10.58* -1.777
(6.725) (6.784) (5.925) (5.940) (4.131)
% of Board That Are African-American -17.70** -7.431 -10.25**
(8.394) (6.899) (4.666)
% of Board That Are Asian 10.76 15.25 12.12
(14.99) (11.74) (7.723)
% of Board That Are Hispanic -15.90 -6.322 -7.906
(13.02) (10.68) (5.805)
% of Board That Are Non-white -2.137 5.478
(4.851) (4.529)
Constant 62.23*** 62.32*** 37.94*** 37.17*** 24.91***
(5.987) (6.008) (6.077) (6.071) (4.172)
Observations 1,032 1,030 1,033 1,031 1,033
R-squared 0.049 0.043 0.045 0.044 0.037
15
Robust standard errors in parentheses *** p<0.01, ** p<0.05, * p<0.1
Table 4.6. OLS regressions: fundraising (questions 6-10)
54

15
Robust standard errors in parentheses *** p<0.01, ** p<0.05, * p<0.1
Table 4.6. OLS regressions: fundraising (questions 6-10)
16
(6) (7) (8) (9) (10)
% Of Board that Meet
With Potential Donors
% Of Board that Ask
Others For Money
% Of Board that Ask
Others For Money
% Of Board that
Personally
Contribute
% Of Board
that Personally
Contribute
VARIABLES OLS OLS OLS OLS OLS
Age of organization (before 1900 omitted)
1900 to 1949 -10.89*** -15.82*** -15.88*** -8.634** -8.905**
(4.022) (5.014) (4.999) (4.397) (4.420)
1950 to 1974 -12.67*** -18.25*** -18.38*** -10.95*** -11.11***
(3.806) (4.807) (4.801) (4.079) (4.092)
1975 to 1999 -11.49*** -14.41*** -14.57*** -8.321** -8.274**
(3.803) (4.761) (4.761) (3.772) (3.787)
2000 to 2016 -8.880** -16.60*** -16.66*** -19.02*** -18.70***
(4.098) (5.067) (5.069) (4.439) (4.461)
Region (North omitted)
East -3.228* -2.866 -2.789 -1.819 -1.881
(1.820) (2.455) (2.435) (3.021) (3.032)
South 0.326 0.220 -0.143 1.344 0.684
(1.771) (2.327) (2.307) (2.762) (2.755)
West 0.472 -0.113 -0.255 0.445 1.580
(1.881) (2.510) (2.427) (2.989) (2.814)
Revenue over $10 million? -0.591 1.754 1.606 2.949 2.426
(2.207) (3.169) (3.156) (3.763) (3.681)
NTEE Category (Arts Omitted)
Education 2.095 -1.730 -2.599 -8.055 -10.15*
(3.205) (3.841) (3.714) (5.203) (5.224)
Environment/Animal 3.401 0.868 1.012 -0.728 -0.920
(3.742) (4.365) (4.332) (5.161) (5.150)
Health -1.619 -2.510 -2.784 -3.654 -4.140
(2.516) (3.683) (3.636) (4.421) (4.467)
55

17
Human Services 3.331 1.530 1.121 -4.298 -5.120
(2.141) (2.835) (2.817) (3.478) (3.490)
International 2.625 2.599 2.847 1.690 2.315
(3.377) (6.875) (6.777) (6.762) (6.847)
Public Society Benefit 4.734* 1.847 1.552 -6.080 -6.225
(2.641) (3.435) (3.415) (4.260) (4.307)
Religious 5.868 -1.978 -2.253 1.869 -0.411
(6.823) (5.291) (5.096) (9.476) (9.574)
Unknown / Unclassified / Missing 1.397 -1.578 -1.760 -9.859*** -10.41***
(2.126) (2.879) (2.856) (3.736) (3.756)
Number of full-time paid employees -0.00138 -0.00594** -0.00565** 0.00564* 0.00589*
(0.00197) (0.00273) (0.00272) (0.00326) (0.00321)
% of Board That Are Women 1.547 12.62*** 12.65*** 1.201 0.141
(3.973) (4.692) (4.711) (5.893) (5.863)
% of Board That Are Under 40 -1.975 14.99*** 14.45*** 4.239 5.320
(4.102) (5.431) (5.428) (6.393) (6.501)
% of Board That Are African-American -3.929 -20.48**
(7.091) (9.461)
% of Board That Are Asian 1.410 25.54**
(10.71) (10.26)
% of Board That Are Hispanic -3.005 -19.71
(7.862) (13.62)
% of Board That Are Non-white 2.639 4.021 -7.531
(3.421) (4.084) (4.816)
Constant 24.43*** 29.59*** 29.01*** 95.31*** 96.05***
(4.114) (5.487) (5.448) (5.279) (5.362)
Observations 1,031 1,033 1,031 1,032 1,030
R-squared 0.031 0.045 0.046 0.044 0.034
Robust standard errors in parentheses
*** p<0.01, ** p<0.05, * p<0.1
56

ACKNOWLEDGMENTS
This report was researched and written by
The Indiana University Lilly Family School of Philanthropy Project Team
Una Osili, Ph.D., Associate Dean for Research and International Programs
Sasha Zarins, Project Coordinator
Jon Bergdoll, Statistician
Coco Xionan Kou, Assistant Director of Research
Adriene Davis Kalugyer, Manager of Public Affairs
Jennifer Staashelm, Administrative Assistant
Yuan Tian, Graduate Research Assistant
Alexis Davenport, Graduate Research Assistant
ABOUT THE INDIANA UNIVERSITY LILLY FAMILY SCHOOL OF PHILANTHROPYThe school resides at IUPUI as the largest, most comprehensive, leading academic research institution dedicated to understanding why and how people give. Recognized internationally as a leader in philanthropic education, training and research, the school is dedicated to improving philanthropy to improve the world by educating students and practitioners to be innovative leaders capable of creating positive, lasting change. The school offers a comprehensive approach to philanthropy through its academic and research programs and through The Fund Raising School, The Lake Institute on Faith & Giving, and Women’s Philanthropy Institute.
The school’s in-house research staff generates new knowledge that increases the understanding of philanthropy and
the nonprofit sector among researchers and scholars, practitioners, donors, and others interested in philanthropic trends. Through the creation and dissemination of scholarly and nationally renowned research, along with conducting privately contracted research, the school’s credibility and methodological rigor set the standard for the field.
The school offers instruction on nonprofit best practices around the world and our research has been emulated in Europe and Asia. Organizations come to us for research because the school provides top-quality, rigorous research. Our work includes the Philanthropy Panel study, the largest and longest-running survey of household giving behavior conducted in partnership with the University of Michigan’s Panel Study of Income Dynamics. Some of our featured research projects also include Giving USA: The Annual Report on Philanthropy, the Study of High Net Worth Philanthropy, and the Million Dollar List, among others. Recently, the school also has taken on two projects on global philanthropy: the Index of Philanthropic Freedom and the Index of Global Philanthropy and Remittances. The Index of Philanthropic Freedom seeks to measure the enabling environment for philanthropy within a country and across countries around the world. The Index of Global Philanthropy and Remittances aims to provide a comprehensive picture of the financial flows from U.S. and other developed countries, as well as emerging economies, to the developing world, including government aid, private philanthropy, remittances, and private capital flows.
The school has conducted highly specialized studies for leading global companies and organizations including American Express, Bank of America, U.S. Chamber of Commerce, National Collegiate Athletic Association, Eli Lilly and Company, Target, the National Football League, United Way Worldwide, and many others. Regional studies of state and citywide giving, such as Giving in Chicago and Georgia Gives, examine localized philanthropic environments. Our expertise includes knowledge of charitable giving, volunteering, corporate philanthropy, foundation grant making and impact investing, disaster philanthropy, nonprofit management, compensation in the nonprofit sector, and best practices in a variety of philanthropic fields. The school’s research has received extensive media coverage with articles appearing, most notably, in the USA Today, Washington Post, Wall Street Journal, Bloomberg, and the Chronicle of Philanthropy.
Please visit our website for more information: http://philanthropy.iupui.edu/.
57

This analysis and report were made possible by funder and research partner
The Johnson, Grossnickle and Associates Project Team
Angela E. White, Senior Consultant and CEO
Deanna Lepsky, Marketing Director
With special thanks for writing the case study interviews:
Ted Grossnickle, Senior Consultant and Founder
Dan Schipp, Senior Consultant
Andy Canada, Senior Consultant
Tim Ardillo, Consultant
Lee Ernst, Consultant
Juli Knutson, Senior Writer
Abigail Coleman, Writer
ABOUT JOHNSON, GROSSNICKLE AND ASSOCIATESSince 1994, Johnson, Grossnickle and Associates has taken an authentic, strategic approach to provide premier philanthropic consulting services to private colleges, seminaries, independent schools, and large cultural, community and health organizations. Our firm specializes in assisting larger nonprofit groups with capital campaigns, development audits, feasibility studies and general fundraising counsel.
JGA believes in strengthening the field of philanthropy through research and empowering nonprofits to make the world a better place. We know the field of philanthropy continues to evolve and we are part of that evolution. Our consultants are teachers, students, authors, and frequent speakers on the latest techniques and philosophies in the field. We invite you to learn more about our services on our website at www.jgacounsel.com, and we look forward to partnering with you on your philanthropic journey.
This analysis and report were made possible through a data and research partnership with
The BoardSource Project Representative
Vernetta Walker, J.D., Chief Governance Officer & Vice President of Programs
ABOUT BOARDSOURCEWith nearly 30 years of hands-on experience working with nonprofit boards, BoardSource has become the go-to resource for nonprofit organizations. We engage and support a global network of nonprofit leaders and organizations, and offer a wide range of resources to strengthen and support board performance.
58