the impact of diet on intestinal microbiota of paediatric
TRANSCRIPT

The impact of diet on intestinal microbiota ofpaediatric patients with inflammatory bowel disease
Sila, Sara
Doctoral thesis / Disertacija
2020
Degree Grantor / Ustanova koja je dodijelila akademski / stručni stupanj: University of Zagreb, Faculty of Food Technology and Biotechnology / Sveučilište u Zagrebu, Prehrambeno-biotehnološki fakultet
Permanent link / Trajna poveznica: https://urn.nsk.hr/urn:nbn:hr:159:873553
Rights / Prava: Attribution-NoDerivatives 4.0 International
Download date / Datum preuzimanja: 2021-11-26
Repository / Repozitorij:
Repository of the Faculty of Food Technology and Biotechnology

UNIVERSITY OF ZAGREB
FACULTY OF FOOD TECHNOLOGY AND
BIOTECHNOLOGY
Sara Sila
THE IMPACT OF DIET ON
INTESTINAL MICROBIOTA OF
PAEDIATRIC PATIENTS WITH
INFLAMMATORY BOWEL
DISEASE
DOCTORAL THESIS
ZAGREB, October, 2020

DOCTORAL THESIS
ZAGREB, October, 2020
UNIVERSITY OF ZAGREB
FACULTY OF FOOD TECHNOLOGY AND
BIOTECHNOLOGY
Sara Sila
THE IMPACT OF DIET ON
INTESTINAL MICROBIOTA OF
PAEDIATRIC PATIENTS WITH
INFLAMMATORY BOWEL
DISEASE

DISERTACIJA
ZAGREB, listopad, 2020
SVEUČILIŠTE U ZAGREBU
PREHRAMBENO-BIOTEHNOLOŠKI FAKULTET
Sara Sila
UTJECAJ PREHRANE NA
CRIJEVNU MIKROBIOTU U
PEDIJATRIJSKIH BOLESNIKA S
UPALNIM BOLESTIMA CRIJEVA

BASIC DOCUMENTATION CARD
University of Zagreb Ph.D. Thesis
Faculty of Food Technology and Biotechnology
Postgraduate study in (Biotechnology and Bioprocess Engineering, Food Technology and Nutrition)
UDK: 331.344.4:2‑455: 616.34: 639.3.043.2(043.3)
Scientific Area: Biotechnical Sciences
Scientific Field: Nutrition
THE IMPACT OF DIET ON INTESTINAL MICROBIOTA OF PAEDIATRIC PATIENTS
WITH INFLAMMATORY BOWEL DISEASE
Sara Sila, MSc Nutrition
Thesis performed at the Children's Hospital Zagreb
Supervisor: Assistant Professor Iva Hojsak, MD, PhD
Short abstract
The diet has a profound effect on the gut microbiota and development of inflammatory bowel disease
(IBD). Characteristics of the gut microbiota were determined in children with IBD at the time of
diagnosis and on the 2nd and the last day of exclusive enteral nutrition (EEN). Children with IBD
demonstrate significant differences in dietary intake (lower intake of energy, calcium and fruits) and
lower lean mass-for-age z-scores at diagnosis. Moreover, lower abundance of the phylum Firmicutes
and higher abundance of the phylum Proteobacteria was observed in patients compared to healthy
siblings and healthy controls at the time of diagnosis. EEN leads to similar changes in the microbiota
composition in children with CD and their healthy siblings.
Number of pages: 167
Number of figures: 12
Number of tables: 18
Number of references: 185
Original in: English
Key words: children; diet; exclusive enteral nutrition; gut microbiota; inflammatory bowel disease
Date of the thesis defense: 22nd October 2020
Reviewers:
1. Prof. Irena Colić Barić, PhD
2. Prof. Blaženka Kos, PhD
3. Tena Niseteo, Res. Assoc.
Thesis deposited in: Library of Faculty of Food Technology and Biotechnology, Kačićeva 23.,
National and University Library, Hrvatske bratske zajednice bb, University of Zagreb, Trg
maršala Tita 14; University of Rijeka, Riječke rezolucije 7; University of Split, Livanjska 5 i
University of Osijek, Trg sv. Trojstva 3.

TEMELJNA DOKUMENTACIJSKA KARTICA
Sveučilište u Zagrebu Disertacija
Prehrambeno-biotehnološki fakultet
Sveučilišni poslijediplomski studij (Biotehnologija i bioprocesno inženjerstvo, prehrambena
tehnologija i nutricionizam)
UDK: 331.344.4:2‑455: 616.34: 639.3.043.2(043.3)
Znanstveno područje: Biotehničke znanosti
Znanstveno polje: Nutricionizam
UTJECAJ PREHRANE NA CRIJEVNU MIKROBIOTU U PEDIJATRIJSKIH BOLESNIKA S
UPALNIM BOLESTIMA CRIJEVA
Sara Sila, mag. nutr.
Rad je izrađen u Klinici za dječje bolesti Zagreb
Mentor: Doc.dr.sc. Iva Hojsak, dr.med.
Kratki sažetak disertacije
Prehrana ima značajan utjecaj na crijevnu mikrobiotu i razvoj kroničnih upalnih bolesti crijeva (IBD).
Karakteristike crijevne mikrobiote u djece s IBD-om određene su u vrijeme dijagnoze, te na drugi i
posljednji dan isključive enteralne prehrane (EEN). Djeca s IBD-om pokazuju značajnu razliku u
prehrambenom unosu (niži unos energije, kalcija i voća), te niži z-score za nemasnu tjelesnu masu u
vrijeme dijagnoze u usporedbi sa zdravim kontrolama. Nadalje, utvrdili smo manju zastupljenost
bakterija iz reda Firmicutes, te veću zastupljeno iz reda Proteobacteria kod djece s IBD-om u vrijeme
dijagnoze. EEN dovodi do sličnih promjena u sastavu mikrobiote u djece sa CD-om i njihovih zdravih
braće i sestara.
Broj stranica: 167
Broj slika: 12
Broj tablica: 18
Broj literaturih navoda: 185
Broj priloga: 4
Jezik izvornika: Engleski
Ključne riječi: crijevna mikrobiota; djeca; isključiva enteralna prehrana; prehrana; upalne bolesti
crijeva
Datum obrane: 22. listopad 2020.
Stručno povjerenstvo za obranu:
1. Prof. dr.sc. Irena Colić Barić
2. Prof. dr.sc. Blaženka Kos
3. Dr.sc. Tena Niseteo, znan. sur.
Rad je pohranjen u knjižnici Prehrambeno-biotehnološkog fakulteta u Zagrebu, Kačićeva 23. ;
Nacionalnoj i sveučilišnoj knjižnici u Zagrebu, Hrvatske bratske zajednice bb., Sveučilištu u
Zagrebu, Trg maršala Tita 14; Sveučilištu u Rijeci, Riječke rezolucije 7; Sveučilištu u Splitu,
Livanjska 5 i Sveučilištu u Osijeku, Trg sv. Trojstva 3.

The dissertation topic was accepted at the 2nd regular session of the Faculty Council of the
Faculty of Food Technology and Biotechnology, University of Zagreb in the academic year
2018/2019 held on November 20th, 2018.

THE IMPACT OF DIET ON INTESTINAL MICROBIOTA OF PAEDIATRIC PATIENTS
WITH INFLAMMATORY BOWEL DISEASE
It has been confirmed in previous studies that the diet has a profound effect on the gut
microbiota, and consequently development of inflammatory bowel disease (IBD). This has
become especially evident with the use of exclusive enteral nutrition (EEN) as a first line
therapy for induction of remission in children with Crohn’s disease (CD). Mechanism of action
of EEN includes modification of the gut microbiota, which in turn leads to reduction of
inflammation and consequently remission of the disease. The aim of this dissertation was to
compare characteristics of the gut microbiota in children with IBD at the time of diagnosis with
that of healthy unrelated controls, but also to that of their healthy siblings (who share a common
genetic origin and live in the same environment). Moreover, impact of EEN on the microbiota
of both CD patients and their healthy siblings has been investigated. We have demonstrated that
children with IBD have significantly lower intake of energy, some micronutrients and fruits
compared to healthy controls, along with lower lean mass-for-age z-scores at diagnosis.
Moreover, children with IBD demonstrate significant differences in microbiota composition at
the time of diagnosis, with reduced presence of genus Eubacterium, Lactobacillus,
Enterobacter and Clostridium, and increased presence of genus Streptococcus, Prevotella and
Escherichia, compared to healthy siblings and healthy controls. Nevertheless, EEN leads to
similar changes in the gut microbiota composition of both children with CD and their healthy
siblings, which is, interestingly, occurring more rapidly in healthy siblings. In conclusion,
microbiome change could have a crucial role in the remission induction of the disease.
Keywords: children; diet; exclusive enteral nutrition; gut microbiota; inflammatory bowel
disease
UTJECAJ PREHRANE NA CRIJEVNU MIKROBIOTU U PEDIJATRIJSKIH BOLESNIKA
S UPALNIM BOLESTIMA CRIJEVA
Prethodna istraživanja su potvrdila da prehrana igra važnu ulogu u etiopatogenezi mnogih
bolesti, uključujući i kronične upalne bolesti crijeva (eng. inflammatory bowel disease – IBD).
Navedeno je potvrđeno korištenjem isključive enteralne prehrane (eng. exclusive enteral
nutrition – EEN) kao prve linije indukcije remisije u djece s Crohnovom bolesti (eng. Crohn’s
disease – CD). Mehanizam djelovanje EEN uključuje, između ostalog, i modifikaciju crijevne
mikrobiote, što dovodi do smanjenja upale i posljedično remisije bolesti. Cilj ove disertacije
bio je usporediti karakteristike crijevne mikrobiote u djece s IBD-om u vrijeme dijagnoze sa
zdravim kontrolama, ali i zdravom braćom i sestrama koji dijele genetsko podrijetlo i žive u
istom okruženju. Nadalje, ispitan je utjecaj EEN-a na mikrobiotu kod bolesnika s CD-om, ali i
njihovih zdravih braće i sestara. Pokazali smo da djeca s IBD-om imaju značajno manji unos
energije, nekih mikronutrijenata i voća u odnosu na zdrave kontrole, te da imaju manji z-score
za nemasnu tjelesnu masu u vrijeme dijagnoze. Nadalje, potvrdili smo da djeca s IBD-om
pokazuju značajne razlike u sastavu mikrobiote u vrijeme postavljanja dijagnoze u usporedbi
sa zdravim kontrolama, sa smanjenim udjelom bakterija iz rodova Eubacterium, Lactobacillus,
Enterobacter i Clostridium, te povećanim udjelom bakterija iz rodova Streptococcus,
Prevotella i Escherichia. Osim toga, EEN dovodi do sličnih promjena u sastavu mikrobiote kod
djece s CD-om i njihovih zdravih braće i sestara, no taj je učinak brže uočljiv kod zdravih braće
i sestara. Zaključno, promjene u mikrobioti mogle bi imati ključnu ulogu u uvođenju bolesti u
remisiju.
Ključne riječi: crijevna mikrobiota; djeca; isključiva enteralna prehrana; prehrana; upalne
bolesti crijeva

It is my pleasure to thank everyone who have contributed to this dissertation and made it
possible.
First of all, I would like to thank Croatian Scientific Foundation for financing my PhD studies
and making it possible to perform this research and write this dissertation.
I would like to express my sincere gratitude to my supervisor Iva Hojsak for her immense help
and guidance and, most importantly, for always believing in me and motivating me to do my
best.
I would like to give special acknowledgement to prof. Sanja Kolaček for recognizing the value
of science of nutrition and its place in the treatment of patients. It is a pleasure to work in
your team.
Special thank you to Tena Niseteo for being my mentor and selflessly sharing her knowledge
with me.
Thank you to all my dear colleagues, especially Ivana Trivić, Ana Močić Pavić, Mario Mašić,
Zrinjka Mišak and Oleg Jadrešin for their great support through my research and clinical
work.
In the end, biggest thank you to all my family and friends for their immense support.

General introduction………………………………………………………………….…..……1
Chapter I Theoretical background……………………………………………………...…....…4
1.1. Epidemiological features…………………………………………………..…..…..4
1.2. Pathogenesis………………………………………………………………..…..….4
1.2.1. Genetic factors…………………………………………………..…….....6
1.2.2. Environmental factors…………………………………………..…….…6
1.2.2.1. Early life factors………………………………………..….…..8
1.2.2.2. Dietary factors………………………………………….….…10
1.2.3. Microbiota…………………………………………………….…….….12
1.2.3.1. Gut microbiota in IBD………………………………….…….13
1.3. Clinical presentation…………………………………………………….….….…14
1.3.1. Most frequent symptoms…………………………………….………....14
1.3.2. Nutritional status………………………………………….……………15
1.3.2.1. Growth and development……………………………..………15
1.3.2.2. Micronutrient deficiencies ……………………………...……16
1.4. Treatment…………………………………………………………………...……17
1.4.1. Nutritional team…………………………………….…..………………19
1.5. Objectives and hypothesis……………………………………..…………………20
Chapter II Methods………………………………………………………….…………….….22
2.1. Participants……………………………………………………….………………22
2.2. Anthropometric measurements and body composition……………..……………23
2.3. Dietary intake………………………………………………………….…………24
2.4. Characterization of intestinal microbiota………………………..…….…………25
2.4.1. PCR amplification and TRFL-P analysis…………………....…………25
2.5. Ethical approval…………………………………………………………..………26
2.6. Statistical analysis………………………………………………………..………27
2.6.1. Paper 1………………………………………………………….………27
2.6.2. Paper 2…………………………………………………………….……27
2.6.3. Paper 3………………………………………………………….………27
2.6.4. Paper 4………………………………….………………………………28
Chapter III Results……………………………………………………………………………30
3.1. Nutritional status and dietary intake (Paper 1) ….……………….………………30
3.2. Microbiota composition of newly diagnosed IBD patients – comparison with
healthy siblings and healthy controls (Paper 2)………………….…..……………….32
3.3. The route of EEN delivery and type of polymeric formula (Paper 3)………...….34

3.4. Microbiota composition of CD patients and healthy siblings during EEN (Paper
4)……………………………………………………………………………..….…….35
Chapter IV Discussion…………………………………………………………………..……39
4.1. Dietary intake of IBD patients (Paper 1)…………………………..………..……39
4.2. Microbiota composition of children with IBD (Paper 2)………………….……..42
4.3. Impact of route of delivery and type of EEN on nutritional status and course of the
disease in children with CD (Paper 3)………………………………………..……….43
4.4. Impact of EEN on the microbiota composition of CD patients and their healthy
siblings (Paper 4)………………………………………………………………..…….44
Chapter V Conclusions………………………………………………………………...……..50
References………………………………………………………………………....……...…..52
Papers ……………………………………………………………………………………..….70

1
GENERAL INTRODUCTION
Inflammatory bowel disease (IBD), comprising of Crohn's disease (CD), ulcerative colitis (UC)
and IBD-unclassified (IBD-U), is an immune mediated chronic inflammatory disorder of
gastrointestinal (GI) tract. CD and UC are two very distinct diseases with regard to their clinical
manifestations and the part of the GI tract they are affecting. CD can involve any part of the GI
tract from the mouth to the anus and can present with inflammatory, penetrating, stricturing or
combination phenotype. Ulcerative colitis is characterized by diffuse, continuous inflammation of
the colon.
About ¼ of patients with IBD present before the age 20 years old (Baldassano and Piccoli, 1999)
in whom the disease can have significant effect on growth and development, but also their quality
of life. In the last 20 to 30 years, a striking increase in the incidence of IBD has been observed
especially in this group of patients (Ruel et al., 2014). Many different factors are involved in the
development of this disease. Among them, significant attention has been given to the environment.
Different environmental factors have been shown to be associated with development of IBD,
including exposure to sunlight/vitamin D, smoking, exposure to pets, exposure to antibiotics,
consumption of dietary fibers, processed foods, breastfeeding, just to name a few (Shouval and
Rufo, 2017). It is clear today that all the factors could influence immune system development and
affect human gut microbiome. These environmental factors, especially affecting in early life, might
be associated with profound and long-lasting changes and possibly could contribute to the rising
incidence of IBD.
Since paediatric patients with IBD are prone to impaired growth and inadequate nutritional status,
importance of the adequate diet and nutritional support has been recognized long ago. Effect of
the diet on the disease is even more emphasized by the effect of the use of exclusive enteral
nutrition (EEN) for remission induction in children with CD. Not only does it lead to reduction in
inflammation, but it also supports growth and improves nutritional status, along with mucosal
healing.

2
How diet effects and modifies immune reaction is still not clear, but increasing evidence is showing
that the diet causes significant changes in the microbiota composition of patients with CD (Assa
and Shamir, 2017a; MacLellan et al., 2017). Therefore, the importance of microbiota in the
pathogenesis of IBD has been well recognized. However, to this date, it is not clear whether
dysbiosis is a consequence or cause of the intestinal inflammation.
Throughout this thesis the following questions were examined:
Does nutritional status differ between newly diagnosed children with IBD and healthy
controls?
How does dietary intake differ between newly diagnosed children with IBD and healthy
controls?
Is there a difference in intestinal microbiota in children with newly diagnosed IBD and
their siblings and healthy unrelated controls?
Does the route of EEN delivery (orally vs NG tube) and type of polymeric formula (with
taste vs tasteless and isocaloric vs hypercaloric) impact the disease outcome and nutritional
status in children with CD?
What is the effect of EEN therapy on the intestinal microbiota in children with CD and
how do they compare to the changes caused by EEN in healthy individuals?

3
CHAPTER I Theoretical background
Epidemiologic features
Pathogenesis
Clinical presentation
Treatment

4
1. THEORETICAL BACKGROUND
1.1. Epidemiologic features
Approximately 25% of patients with IBD present before age of 20 years (Baldassano and Piccoli,
1999). Compared to IBD in adult age, IBD in children presents with more extensive disease
phenotype and more severe clinical course (de Bie et al., 2013; Duricova et al., 2014). Furthermore,
the disease in children shows tendency to spread over time, and recurrent exacerbations in CD
change the disease behavior from inflammatory to stricturing and penetrating form (Duricova et
al., 2014; Malmborg and Hildebrand, 2016). Additionally, in children the disease has significant
consequences on their growth and development, as well as their quality of life.
The latest data shows broad variation in the incidence rates in paediatric population, ranging from
0.5 to 23/100000 for IBD, 0.1 to 13.9/100000 for CD, 0.3 to 15.0/100000 for UC and 0.0 to
3.6/100000 for IBD-U (Sýkora et al., 2018). The incidence of IBD greatly varies based on the
geographical region. The regions with the highest IBD burden are Europe (0.2-23.0/100000) and
North America (1.1-15.2/100000), whereas Oceania, Asia, Latin America and Africa have the
lowest reported IBD incidence (Sýkora et al., 2018).
In the past 20 to 30 years, a striking increase in the incidence of IBD has been observed in patients
<20 years of age (Ruel et al., 2014). Moreover, increase in IBD mostly concerns paediatric-onset
CD, while UC incidence has been reported to be stable (Ruel et al., 2014). The data published
during the previous two decades demonstrated the plateauing incidence of IBD in the Western
countries (Sýkora et al., 2018) after a previously documented increase. However, the incidence
still remains high. In newly industrialized countries in Asia, the Middle East and Africa, the
incidence is approaching the rates reported in westernized countries. Based on the data from the
newly established national pediatric IBD registry, annual incidence of PIBD in Croatia was
7.05/100000 children under 18 years of age/year, with the predominance of UC over other two
forms of IBD (Ivković et al., 2020).
1.2. Pathogenesis
It has been observed that in IBD, host genetic, environmental and microbial factors combine and
lead to a dysregulated mucosal immune response against the gut content/intestinal microbiota

5
(Khor et al., 2011). Dramatic lifestyle changes in the last century have, along with improved
quality of life, led to increased risk of various diseases. Since only a small proportion of IBD can
be explained by genetics, these lifestyle changes have been increasingly explored in connection to
IBD development. Microbiota, influenced by many lifestyle factors, has also been emphasized as
having an important role in the etiology of IBD. Today it is considered that IBD is in fact a group
of related complex diseases which results from a confluence of genetic, microbial and
environmental factors, all leading to dysregulation in the mucosal immune system (Shouval and
Rufo, 2017) (Figure 1). In genetically predisposed individuals, there is an aberrant immune
response to the microbiome that leads to the development of intestinal inflammation (Glassner et
al., 2019). Indeed, data from a number of animal studies have shown that colonization of mice
with intestinal microbiota from donors with IBD exacerbates colitis by altering immune responses
(Britton et al., 2019). Moreover, transfer of naïve CD4+ lymphocytes from healthy mice into mice
that lack T and B lymphocytes can induce colitis (Powrie, 1995; Powrie et al., 1994). Nevertheless,
many of the genetic mutations associated with IBD are related to immune function and interactions
between the immune system and the microbiome (Glassner et al., 2019).
Figure 1. The pathogenesis of inflammatory Bowel Disease (IBD)
IBD
Geneticpredisposition
Environmentalfactors
Microbiota
Dysregulatedimmunesystem

6
1.2.1. Genetic factors
The most important risk factor in etiopathogenesis of IBD is the presence of the disease in the
family. Positive family history of IBD is present in 19-41% of children compared to only 5-10%
of patients in whom disease started after the age of 18 (Gower-Rousseau et al., 2013). Children
whose parent has been diagnosed with IBD have 2-13 times higher risk of being diagnosed with
IBD compared to the general population (Peloquin et al., 2016). However, the risk of being
diagnosed with IBD inside the family refers to other factors additional to hereditary predisposition,
such as being exposed to the same environmental factors. More than 163 genes have been
discovered to be correlated with higher risk of IBD. Genetic mutations of genes, of which the most
important ones are nucleotide oligomerization domain 2 (NOD2), autophagy-related 16-like 1
(ATG16L1), caspase recruitment domain-containing protein 9 (CARD9), and C-type lectin domain
family 7 member A (CLEC7A) lead to changes in the immune function and are associated with
development of IBD (Cohen et al., 2019; Jostins et al., 2012; Lavoie et al, 2019; Liu et al., 2015).
However, only about 7.5% of incidence of CD and 13.6% of incidence of UC can be explained by
genetics (Jostins et al., 2012) (with the exception of monogenic diseases). Therefore, current
emphasis is on different environmental (such as the diet) and microbial factors, which could play
a crucial role in the etiopathogenesis of IBD. Importance of the environment on the development
of IBD is becoming more apparent with the raising research in the field of pathogenesis of IBD.
1.2.2. Environmental factors
Rapidly changing epidemiology of IBD suggests that environmental factors are playing a critical
role in the development of IBD as well as in the modulation of disease phenotypes over time.
Today, a new term – exposome – encompasses the composite of accumulated environmental
exposures that start in utero and continue through childhood into adulthood (Wild, 2012). These
factors provide understanding into the pathogenesis of the IBD, but also provide new insights into
potential dietary, lifestyle and pharmacologic interventions which could help change the course of
the disease, or lower the risk of acquiring the disease. Many different factors have been shown to
be correlated with IBD, as shown in Figure 2. However, it is not yet clear to which extent and at
what time of the exposure they could affect individuals’ risk for IBD.

7
Figure 2. Environmental factors that possibly modulate the risk of developing inflammatory bowel
disease (Shouval and Rufo, 2017).
Three important observations have been made, which confirm the significant role that environment
plays on the disease development: 1) the concordance rate for CD in monozygotic twins is only
50% and even less for UC (Tysk et al., 1988); 2) the rising incidence of IBD in the last 60 years
could not be explained by changes in our genetic makeup, which did not change for thousands of
years; 3) the incidence of IBD rises as the country becomes more developed (Loftus, 2004).
Additionally, children whose parents immigrated from developing countries to developed country
exhibit the same incidence of IBD as native population (Carr and Mayberry, 1999). Moreover,
many environmental factors have been implicated in the development of IBD, such as mode of

8
delivery, type of feeding during first years of life and early exposure to antibiotics
(Ananthakrishnan et al., 2018).
1.2.2.1.Early life factors
It has been established in recent years that different early-life events might explain the
development and clinical severity of IBD. Studies have shown that the functional maturation of
gut microbiome occurs at the first 3-5 years of life, after which it remains stable despite different
environmental factors (Yatsunenko et al., 2012). This observation emphasized potential
importance of influences in that period on subsequent risk of IBD. Early-life risk factors that have
shown the most significant association with the disease development are mode of delivery
(cesarean vs vaginal delivery), early exposure to antibiotics and breastfeeding (Ananthakrishnan
et al., 2018; Kolaček and Hojsak, 2017; Shouval and Rufo, 2017).
Babies born by caesarian section are deprived of contact with the maternal gut or vaginal
microbiota, therefore, show different microbiota composition compared to children born vaginally
(Azad et al., 2016, 2013). Further studies indicate that abnormal microbiota reported after
caesarian section delivery could continue even beyond infancy (Salminen et al., 2004). Even
though data have clearly demonstrated that mode of delivery can have a major effect on the
composition of the intestinal microbiota, data as to whether mode of delivery affects the
subsequent risk of developing IBD later in life are conflicting. A population-based study which
determined whether mode of delivery affects risk of IBD showed no difference in the percentage
of individuals with IBD born by caesarian section (11.6%) versus controls (11.7%, P=0.93).
Furthermore, individuals with IBD were no more likely to have been born by caesarian section
than were their siblings without IBD (11.6% vs 11.3%; P=0.79) (Bernstein et al., 2016). In a large
Danish cohort individuals delivered via caesarean birth had a modest but significant risk in the
subsequent development of IBD (Bager et al., 2012). Study in Norway showed that patients with
IBD were less likely to be delivered by caesarean (Bengtson et al., 2010).
Another early-life event that was shown to be protective of later development of IBD in some
studies, is breastfeeding. Breast milk contains a large number of anti-microbial, anti-inflammatory
and immunomodulatory compounds that could potentially modify the risk of the development of
chronic disease (Rodriguez-Palmero et al., 1999). Furthermore, breastmilk-fed infants develop
9
markedly different patterns of gut colonization in comparison with formula-fed infants (Orrhage
and Nord, 1999). Two meta-analysis were performed to assess the role of breastfeeding in the
development of early onset IBD. One meta-analysis showed a strong inverse association between
breastfeeding and IBD in both CD and UC (Klement et al., 2004). Another study similarly
demonstrated a strong inverse association with early-onset diseases (Barclay et al., 2009).
Moreover, a duration response effect for both UC and CD was observed, whereby protective effect
was only significant when duration of breast feeding was greater than 12 months (Ng et al., 2015).
However, some studies have shown opposite results. A new case-control study found that
breastfeeding for more than 3 months was associated with an increased risk for CD (Strisciuglio
et al., 2017). Furthermore, it was shown that mother’s degree, duration of breast feeding more
than 3 months, fathers’ employment, early gluten introduction at the time of weaning, number of
siblings less than 2 were significant risk factors for CD, while owning of pets and bed sharing were
protective factors for CD. For UC, early gluten introduction and number of siblings less than 2
were significant risk factors, whereas owning of pets and family parasitosis were protective factors
for UC.
Additionally, several studies have examined whether antibiotic use early in life predisposed to IBD
and have consistently shown this association in Western population (Ungaro et al., 2014). Studies
have shown that individuals who were receiving one or more dispensations of antibiotics in their
first year of life were nearly three times as likely to be diagnosed with IBD (Shaw et al., 2010).
Similarly, another study showed that individuals with otitis media by the age of 5, who were given
antibiotics as a treatment, were nearly three times as likely to have IBD (Shaw et al., 2013).
Furthermore, a dose-dependent relationship between the number of antibiotics dispensations and
risk of IBD was observed (Shaw et al., 2011).
Causality studies are difficult to be performed and could have many cofounding factors which
could at least partially explain why results are not uniform. However, they, if taken together could
point to same direction - hygiene hypothesis - which states that areas with better sanitation and
higher hygiene standards, where the exposure to different microbes is often reduced, are in higher
risk of acquiring IBD later in life. Hygiene hypothesis can also explain why some areas have shown
that breastfeeding was associated with an increased risk of developing IBD – in developed
countries, with higher sanitation and hygiene standards, highly educated women are more likely
10
to breastfeed (Strisciuglio et al., 2017). It is now being confirmed by other studies that lower
exposure to microbes leads to changes in microbiota which could potentially increase the risk of
acquiring IBD later in life in genetically predisposed individuals (Fofanova et al., 2016).
1.2.2.2.Dietary factors
It was already emphasized that diet is considered as the most important risk factor. It is known
today that the complex interaction of dietary components and the diet itself with the host’s immune
system, most probably indirectly via intestinal microbiota, is a key part in the development of
chronic inflammation and consequently IBD, but also other diseases. Researchers have been
focusing on the diet in two different aspects when linking it to IBD: 1) to identify dietary habits
and components of the diet that are associated with higher risk of acquiring IBD in susceptible
individuals (pre-illness diet) and 2) to identify dietary habits and components of the diet that can
affect the course of the disease and potential dietary treatment of IBD.
It has been discussed earlier in the text that western life style, characterized by high intake of fat,
read meat and sugar along with low intake of fruits and vegetables, has been positively correlated
with the risk of developing IBD in epidemiologic studies (Hou et al., 2011; Persson et al., 1992).
The most convincing results exist for high intake of fruits and dietary fiber, which were shown to
be associated with lower risk of CD (Hou et al., 2011). Results were conflicting for vegetables. As
for UC, data have shown decreased risk of UC with high fiber intake, however, results were not
statistically significant (Hou et al., 2011). In a prospective study of 170,000 women enrolled in the
Nurses’ Health Study, higher omega-3/omega-6 long chain polyunsaturated fatty acids (LC PUFA)
ratio was associated with lower risk of UC (Ananthakrishnan et al., 2014). One case-control study
has also demonstrated protective effect of higher intake of docosahexaenoic acid on risk of CD
(Chan et al., 2014).
Contrary, studies reported increased risk of developing UC with high intake of total fat, LC PUFA,
omega-6 fatty acids, and meats, and increased risk of CD with high intake of PUFAs, omega-6
fatty acids, saturated fats, and meat (Hou et al., 2011). In the EPIC study, large European
prospective study which investigated the relationship between diet as a whole and IBD risk, it was
demonstrated that the diet characterized by high sugar and soft drinks intake and low intake of
vegetables and non-processed seafood was associated with higher UC risk. Interestingly, when

11
high intake of sugar and soft drinks was coupled with high intake of vegetables, association was
lost. Authors speculate that vegetable intake could modulate a deleterious effect of high soft drink
consumption in UC, thus neutralizing the harmful effects of soft drinks in UC. Authors haven’t
found association between a priori or a posteriori dietary patterns and CD risk (Racine et al., 2016).
There has been growing interest in the last 10 years in links between CD and vitamin D deficiency.
Although it was originally thought that the vitamin D deficiency is merely a consequence of the
disease due to both malabsorption and low sun exposure in active disease, recent studies have
pointed that vitamin D deficiency might also contribute to the pathogenesis of IBD. Interestingly,
CD has been linked to low sun exposure and studies have confirmed that incidence of CD rises
with increasing latitude within North America and Europe (Khalili et al., 2012; Lim et al., 2005;
Loftus, 2004). In the Nurses’ Health study cohort of 72 719 individuals, women with a predicted
highest vitamin D levels had a significantly lower risk of incident CD (Ananthakrishnan et al.,
2012). Moreover, studies have shown that vitamin D metabolism and signaling play key role in
immune system function, especially in relation to innate immunity (White, 2018). The discovery
that vitamin D might additionally have distinct immunological functions has initiated a huge
interest in its possible pathogenic influence on the clinical course of IBD (Nielsen et al., 2018).
Recent studies have shown that vitamin D is involved in cell proliferation and differentiation,
immunomodulation and that it can influence gut microbiome (Gominak, 2016; Holick, 2007;
Rosen, 2011; Theodoratou et al., 2014). Moreover, a number of studies have linked vitamin D
levels with meaningful clinical outcomes in patients with IBD (Kabbani et al., 2016).
Lately, much attention has been given to food additives, especially emulsifiers and food thickeners,
in the etiopathogenesis of IBD. In vitro and in vivo analysis have demonstrated that emulsifiers
alter the mucosal epithelial barrier directly or via change in microbial diversity. Indeed, Roberts et
al. recently demonstrated clear correlation between annual emulsifier consumption in food and
beverages and the incidence in IBD (Roberts et al., 2013). Similarly, high intake of margarine
(which is rich in emulsifying agents and hydrogenated fats) was positively correlated with
development of CD and UC (Cashman and Shanahan, 2003; Maconi et al., 2010). Experimental
data also shows that very small concentrations of the emulsifier polysorbate 80 enhance bacterial
translocation across intestinal epithelia (Roberts et al., 2013).

12
In conclusion, the external environment offers particular promise as a modifiable risk factor for
both incident disease and for outcomes in those with established disease (Ananthakrishnan, 2015).
Taken together, it seems that no specific dietary component, but rather inadequate dietary patterns,
mostly characterized by high intake of fat, sugar, meat and low intake of fiber from vegetables and
fruits and omega-3 fatty acids, are associated with higher risk of IBD. Additionally, high intake of
processed foods rich in food additives is given significant attention recently since it seems to be
correlated with IBD development in some individuals. Indeed, a diet rich in fruits and vegetables,
high in n-3 fatty acids and low in n-6 fatty acids is associated with decreased risk of CD and UC
and has therefore been recommended by the European Society for Clinical Nutrition and
Metabolism (ESPEN) in patients with IBD (Forbes et al., 2017).
1.2.3. Microbiota
Most humans live in a close harmony with the 100 trillion different microbial organisms, including
bacteria, viruses, fungi, and protozoa. Moreover, more than 1000 different species reside in the
gastrointestinal tract and the collective genome of intestinal microbes is estimated to contain
approximately 100 times more genes than the human genome (Qin et al., 2010). At the same time,
only a single layer of intestinal epithelial cells separates these organisms from patrolling immune
cells. The most abundant bacteria phyla found in the large intestine of healthy adults are gram-
negative Bacteroidetes and gram-positive Firmicutes (Human Microbiome Project Consortium,
2012).
The gut microbiota in healthy individuals is known to promote a range of health benefits to the
host, such as pathogen protection, nutrition, metabolism, and the immune system. A variety of
symbiotic interactions between the host and the microbiota is necessary to maintain human health.
An unfavorable alteration of the composition and function of the microbiota is known as dysbiosis,
which alters host-microbiota interaction and the host immune system. There is growing evidence
that dysbiosis of the gut microbiota is associated with human diseases such as IBD, irritable bowel
syndrome, allergy, asthma, metabolic syndrome and cardiovascular disease (Nishida et al., 2018).
As discussed in the previous chapter (3.2. Environmental factors), it is clear today that the effects
of rapid urbanization are likely to be reflected in the human gut microbiome. Environmental factors
are, both directly and indirectly, affecting the gut microbiome. Exposure to a multitude of

13
environmental factors, such as the diet, antibiotics and pollution in early life might be associated
with the loss of specific bacterial species of our ancestral microbiota and hence might contribute
to the rising incidence of IBD.
1.2.3.1. Gut microbiota in IBD
Multiple studies have reported that the composition of microbiota in IBD patients is altered
compared with that in healthy subjects (Kostic et al., 2014). Reduction in microbiota diversity is
the single most reproducible finding of studies on microbes in IBD (Sigall-Boneh et al., 2017).
Reduced diversity results in less flexibility and adaptation leading to impaired microbial functional
capacity. Reduced diversity can be the result of certain bacterial taxa elimination and/or increase
in certain taxa that displace others (Wine, 2014). However, it is not clear whether dysbiosis is a
consequence or cause of the intestinal inflammation. Both expansion of potential pathogens and
global changes in composition have been described. For example, what is usually considered as
“beneficial” phylum Firmicutes is often reduced in proportional abundance in the stool of patients
with IBD, while member of Proteobacteria phylum, who are considered “detrimental”, are
commonly increased in patients with IBD relative to healthy individuals (Ni et al., 2017).
However, the division of certain bacterial species into either beneficial or detrimental has recently
been challenged. Paradoxically, in patients treated with exclusive enteral nutrition (EEN)
(Gerasimidis et al., 2014a, 2014b; Pigneur et al., 2019; Sokol and Langella, 2014) or Crohn’s
disease (CD) treatment-with-eating diet (CD-TREAT) (Svolos et al., 2019), a decrease in
proportion of potentially beneficial bacteria has been described. Contrary, Levine et al. (Levine et
al., 2019) have recently demonstrated that exclusion of dietary components by EEN or Crohn’s
Disease Exclusion Diet (CDED) reduced potentially harmful Proteobacteria while increasing
potentially beneficial Firmicutes.
As mentioned before, the best evidence on the efficacy of a dietary intervention in treatment of
CD is available for EEN (Assa and Shamir, 2017a). Even though the mechanism of action of EEN
has not been fully elucidated, studies have shown that EEN causes significant changes in the
microbiota composition of patients with CD, leading to modification of microbial-based gut
inflammation and consequently – remission of the disease (Assa and Shamir, 2017b; MacLellan
et al., 2017). Current evidence supports the notion that CD is associated by community-level

14
imbalances in gut microbiota, rather than presence of certain bacterial species (Alhagamhmad et
al., 2016), therefore its modification could have an influence on disease course. However, even
though one would expect that EEN causes gut microbiota to change in a way that would more
closely resemble the microbiota composition of heathy controls, studies have shown mixed results
(Assa and Shamir, 2017b; Dziechciarz et al., 2007; Heuschkel et al., 2000; MacLellan et al., 2017;
Zachos et al., 2007). More specifically, studies have shown that EEN, at least initially, may
increase microbial dysbiosis in patients with CD (Gerasimidis et al., 2014a; Kaakoush et al., 2015;
Lewis et al., 2015; Quince et al., 2015). It was proposed by MacLellan et al. (MacLellan et al.,
2017), that EEN perhaps disrupts established dysbiotic microbial communities, and allows for
recolonization and formation of a „heathier“ microbiota.
EEN-induced remission in CD is transient in nature, since approximately 42-67% of patients
relapse within 12 months of EEN cessation (Faiman et al., 2014; Frivolt et al., 2014; Hojsak et al.,
2014; Lambert et al., 2012; Rodrigues et al., 2007). Moreover, there is limited data into changes
in microbiota after the return of patients to the regular diets following EEN. To our knowledge,
only two studies performed a follow-up microbiota composition identification in children treated
with EEN - Leach et al. found that while microbiome profiles were only 15–38% similar to pre-
treatment profiles after eight weeks of EEN, profiles four months after EEN showed 31–41%
similarity to pre-treatment profiles, indicating a partial reversion (Leach et al., 2008). Likewise,
Gerasimidis et al. observed a regression of major EEN-induced microbiome changes upon return
to habitual free diet. Specifically, microbiome diversity and F. prausnitzii levels, which had been
depleted during EEN, increased significantly along with concentrations of fecal SCFAs and sulfide
(Gerasimidis et al., 2014a).
1.3. CLINICAL PRESENTATION
1.3.1. Most frequent symptoms
Clinical presentation of IBD in children does not differ notably from adults. In CD most common
symptoms are anorexia, fever, abdominal pain, chronic/reoccurring diarrhea. In UC, the most
prominent symptoms are bloody diarrhea and tenesmus. Because CD can present with atypical
symptoms, up to 20% of children are diagnosed one year after the development of CD, which is
one of the important reasons of delayed growth in those patients (Sawczenko and Sandhu, 2003).

15
There are many factors that lead to inadequate nutritional status and impaired growth in these
children, which will be discussed in more detail in the next chapters.
1.3.2. Nutritional status
Malnutrition is the extra-intestinal manifestation of IBD, comprising both undernutrition and
overnutrition. Factors leading to malnutrition in paediatric IBD patients are multifactorial, and
include suboptimal nutritional intake, malabsorption, alteration in nutrient requirements and
metabolism, excessive gastrointestinal losses and medication (Gerasimidis et al., 2011). Higher
metabolic rate:fat free mass (FFM) ratio has been reported in IBD patients compared to healthy
controls (Azcue et al., 1997; Capristo et al., 1998; Gasparetto and Guariso, 2014). Impaired gastric
acid and pancreatic enzymes have also been reported in adult undernourished CD patients (Winter
et al., 2004). Moreover, the effect of proinflammatory cytokines on energy and nutrient
requirements, bone and development can also lead to further undernutrition (Wong et al., 2006).
1.3.2.1. Growth and development
The most important presentation of the disease in children is impaired growth, inadequate
nutritional status and delayed sexual maturation. Approximately 60% of patients with CD and 35%
of patients with UC present underweight at the time of diagnosis (Gerasimidis et al., 2011). Even
so, children with IBD are affected by current population trends towards overweight and obesity
(Kugathasan et al., 2007). It was reported that up to 1/5 of children with CD and 1/3 of children
with UC included in a multi-center registry in the United States are overweight or obese during
the follow up (Long et al., 2011).
In every other child delayed linear growth precedes other disease symptoms and persists even after
the therapy introduction (Cezard et al., 2002). The faltering is temporary in 40-50% of cases but
can be prolonged in up to 10-20% in CD, in whom final height is more than 8.0 cm below target
height (Sawczenko et al., 2006). However, being underweight decreased dramatically from 35%
to 2% (Cameron et al., 2013).
Moreover, alterations in body composition in children with IBD have been consistently reported,
with increased fat mass and depleted lean mass (Bryant et al., 2013). More importantly, even after

16
normalization of BMI in IBD patients, an increment in FFM was not proportional to increase in
BMI (Sylvester et al., 2009), which could have clinical implication in paediatric patients, but
which, to this date, have not been fully evaluated.
1.3.2.2. Micronutrient deficiencies
IBD patients are prone to micronutrient deficiencies because of their gut loss through diarrhea and
inadequate dietary intake due to anorexia, as well as because multiple medications used for IBD
can interfere with normal micronutrient absorption (Hwang et al., 2012). Moreover, IBD patients
are prone to avoidance of specific foods, with as much as 53% of paediatric IBD patients avoiding
foods in relation to abdominal symptoms (Diederen et al., 2018). Anemia, impaired linear growth
and poor bone health are just some of the consequences of inadequate micronutrient status.
Micronutrient deficiencies also have important implications for outcomes – patients with anemia
have a poorer quality of life and cognitive function (Wells et al., 2006); vitamin D deficiency is
associated with an increased risk of relapse (Gubatan et al., 2017) and increase disease activity
(Torki et al., 2015) while normalization of vitamin D status is associated with a reduction in the
risk of CD-related surgery (Ananthakrishnan et al., 2013). The most common micronutrient
deficiencies in IBD include iron, vitamin D, folic acid, zinc, magnesium, calcium, vitamin A, B12,
D, E and K deficiency (Peter Irving et al., 2011).
Interpreting blood results of micronutrients and trace elements is challenging since many markers
of status are positive or negative acute phase reactants, meaning that they rise or fall as a part of
inflammatory response. Indeed, during acute phase of the disease ferritin and copper increase but
folate, selenium and zinc decrease (Gerasimidis et al., 2013). However, micronutrient status in
patients in clinical remission seems to be impaired nevertheless (Filippi et al., 2006; Geerling et
al., 1998), even in apparently well-nourished individuals (Vagianos et al., 2007).
Iron deficiency is common in IBD with up to 95% of patients having been reported to be iron
deficient at diagnosis, while up to 70% of patients may have iron deficiency even 2 years after
diagnosis (Fritz et al., 2019). There are multiple factors that could lead to iron deficiency in
paediatric IBD patients, such as poor disease control or insufficient oral intake and/or inadequate
supplementation. Indeed, studies have shown iron deficiency even in patients who were receiving
oral supplementation (Dohil et al., 1998). As recommended by the Porto IBD Group of ESPGHAN

17
(European Society for Paediatric Gastroenterology, Hepatology and Nutrition), patients with CD
and UC should be screened for iron status at diagnosis as well as regularly throughout the course
of the disease, regardless of disease activity, location and supplement use (Miele et al., 2018).
Vitamin D insufficiency and deficiency is common in IBD patients, with as many as 98% of
patients with IBD found to be vitamin D deficient or insufficient (Fritz et al., 2019). It is known
that distance from the equator is important factor in vitamin D status, with patients living more
than 35 degrees from the equator being at a higher risk of poor vitamin D status. Moreover, even
patients living less than 35 degrees from the equator may have poor vitamin D status (Hartman et
al., 2009; Levin et al., 2011; Middleton et al., 2013). Notably, even with high observed deficiency
of vitamin D in children with IBD, it is unclear whether patients with IBD are more likely than
healthy children to have vitamin D deficiency (Laakso et al., 2012; Middleton et al., 2013;
Sentongo et al., 2002). Therefore, there is no overall consensus on the vitamin D status and
necessary actions in children and adolescents with IBD. Nevertheless, according to ESPEN
guidelines (Forbes et al., 2017) vitamin D deficiency should be treated and regular evaluation for
vitamin D deficiency should be performed.
Iron and vitamin D deficiency are particularly common in paediatric IBD, while other deficiencies
include folic acid, zinc, magnesium, calcium, vitamins A, B12, D, E, and K (Peter Irving et al.,
2011). According to ESPEN guidelines, a careful account of nutrition intake, anthropometric
measurements, including history of growth with plotting of previous measurements of weight and
height and assessment of growth rate are essential, along with laboratory work up to identify and
treat nutrient deficiencies. A daily multivitamin supplement is recommended even though it is no
guarantee of adequacy, with iron, zinc and vitamin D likely to require specific replacement
regimens. Poor compliance, particularly in adolescents, is common with multivitamin supplements
and patient education about the rationale behind their use is important (Forbes et al., 2017).
1.4. TREATMENT
The current goals of treatment of IBD in children and adolescents include elimination of symptoms
and improved quality of life, restoration of normal growth and elimination of complications. Based
on the guidelines of the ESPGHAN and the European Crohns and Colitis Organization (ECCO),
treatment of CD and UC differs (Ruemmele et al., 2014; Turner et al., 2012).
18
The main specificity of treatment of CD in children is the use of EEN as a first line therapy to
induce remission in paediatric luminal CD (Turner et al., 2012). The benefits of EEN in IBD were
first described in the surgical literature when CD patients unexpectedly improved after being
administered EEN to optimize their nutritional status (Voitk et al., 1973). Its efficacy has been
confirmed in many studies (Miele et al., 2018; Zachos et al., 2007). It shows the same efficacy as
corticosteroids, but without corticosteroid-associated adverse effects. Additionally, EEN leads to
mucosal healing, supports growth and improves nutritional status of a child and promotes growth
and mineralization of bones (Borrelli et al., 2006). EEN is defined as the provision of essentially
100% of caloric needs by liquid enteral formula (elemental or polymeric) for 6 to 12 weeks orally
or via nasogastric (NG) tube. Studies have demonstrated that the protein source (polymeric vs
elemental formula) does not affect the efficacy of EEN (Ludvigsson et al., 2004; Verma et al.,
2000) and therefore, polymeric formula is preferred due to better palatability and lower cost (Miele
et al., 2018; Rodrigues et al., 2007). Moreover, guidelines recommend that EEN should be taken
orally, unless there is a failure to achieve adequate oral intake in which case NG tube should be
used (Miele et al., 2018), but evidence for this recommendation is lacking. Recently, very
promising alternative to strict EEN has been offered. This new diet, called the CD exclusion diet
(CDED) is a whole-food diet coupled with partial enteral nutrition (PEN), designed to reduce
exposure to dietary components that have adverse effects on the microbiome and intestinal barrier
(Pigneur and Ruemmele, 2019). The study showed that CDED plus PEN was effective in inducing
remission by week 6 and was better tolerated than EEN in children with mild to moderate CD.
In children with CD in whom EEN is not effective or in whom it cannot be used, corticosteroid
therapy is given. However, due to its’ numerous side effects, primarily regarding its effect on
growth and maturing, its usage should be limited. In cases of severe presentation of the disease,
biologic agents can be used to treat CD (de Bie et al., 2012). Its usage is usually limited in
corticosteroid-resistant form of the disease and active disease that doesn’t respond to the immuno-
modulatory therapy (de Bie et al., 2012). Immunomodulators and biologic therapy are also used
for maintenance of remission (Rosen et al., 2015).
In UC, as a first line therapy aminosalicylates are used, which exert a topical anti-inflammatory
effect on the intestinal mucosa. They can be administered orally or topically via enema or
suppository (Rosen et al., 2015). Alternatively, in patients with more severe form of the disease,
19
corticosteroids are used. Immunomodulators are used as a maintenance therapy in patients who
don’t respond to aminosalicylates. In case of active disease despite appropriate
immunomodulatory therapy, biologic therapy can be used (Rosen et al., 2015). Currently, there
are no dietary therapies available for the induction or maintenance of remission in UC patients
(Miele et al., 2018).
1.4.1. Nutritional team
In clinical practice, nutritional status assessment is of utmost importance since it helps to decide
on the treatment course. The discovery of the importance of nutritional status for the clinical
outcome of the disease, as well as for the growth and development of the child has contributed to
the recognition of the importance of adequate nutritional support for patients. Since nutrient
requirements in children are increased due to growth and development (Koletzko, 2004),
malnutrition in children can lead to impaired growth, delayed cognitive development, decreased
educational and social achievement, long-term health problems, and, finally, poor quality of life
in adulthood (Emond et al., 2007; Galler et al., 1983; Galler and Ramsey, 1989; Rudolf and Logan,
2005).
The main goal of nutritional support in paediatric patients is to sustain or restore adequate
nutritional status by providing adequate energy and nutrients to the patients. Nutritional support
will help to preserve body composition, avoid nutrition-related complications, and promote
developmentally adequate feeding habits and skills (Kolaček, 2009). To be able to achieve these
goals, nutrition support team, consisting of a dietitian/nutritionist, paediatrician with an expertise
in clinical nutrition, a nurse, and a pharmacist, needs to be established.
The main modalities of treating malnutrition include: 1) nutritional counseling; 2) oral nutritional
supplements; 3) different enteral feeding protocols; 4) parenteral nutrition (PN) with or without
enteral intake. The choice of nutrition support depends on the age, clinical situation,
gastrointestinal status (digestive and absorptive), possibilities of oral intake, as well as on dietary
habits and costs (Kolaček, 2009).

20
Today, the goal of nutritional support in IBD patients is not only to maintain or establish normal
nutrition status and enable adequate growth and development, but also to support prolonged
remission of the disease.
1.5. OBJECTIVES AND HYPOTHESIS
The goals of this research are:
To identify differences in anthropometric measurements and body composition of children
with IBD at the time of diagnosis and healthy unrelated controls – Paper 1
To identify differences in dietary intake of children with IBD at the time of diagnosis and
healthy unrelated controls – Paper 1
To identify differences in intestinal microbiota in children with IBD compared to their
healthy siblings and healthy unrelated controls at the time of diagnosis – Paper 2
To identify if the route of EEN delivery (orally vs NG tube) and type of polymeric formula
(with taste vs tasteless and isocaloric vs hypercaloric) have an effect on the disease course
and nutritional status of children with CD – Paper 3
To identify differences in intestinal microbiota after 2 days of EEN in children with IBD
and their healthy siblings – Paper 4
To identify the impact of EEN on the microbiota of children with CD – Paper 4
The hypotheses of this research are:
Anthropometric measurements and body composition significantly differs between newly
diagnosed children with IBD and healthy controls.
Dietary intake significantly differs between newly diagnosed children with IBD and
healthy controls.
Intestinal microbiota in children with IBD significantly differs from the intestinal
microbiota of their siblings and healthy unrelated controls.
Route of delivery and/or type of enteral formula have an effect on the disease outcome
and/or nutritional status in children with CD.
EEN therapy has a significant effect on the intestinal microbiota in children with CD and
changes are similar to the changes after EEN in healthy individuals.

21
CHAPTER II Methods
Participants
Anthropometric measurements and body composition
Dietary intake
Characterization of intestinal microbiota
Ethical approval
Statistical analysis

22
2. METHODS
2.1.Participants
Three groups of participants were included in this study:
Newly diagnosed patients with IBD who were diagnosed and treated in tertiary medical
center (Children’s Hospital Zagreb)
Patients who were diagnosed with CD and followed up for at least one year (Children’s
Hospital Zagreb)
Control group I: healthy siblings of newly diagnosed IBD patients, who were included in
the study since they live in the same household, eat the same food and share a common
genetic origin as IBD patients
Control group II: healthy unrelated controls
All participants were 18 years of age or younger. Newly diagnosed patients with IBD were
recruited at the Children’s Hospital Zagreb. Healthy siblings of newly diagnosed IBD patients
were recruited after the acceptance of participation of newly diagnosed IBD patients. Healthy
unrelated controls were recruited from randomly selected elementary and high schools in urban
and rural area in Croatia that responded positively to the invitation to participate in the study – in
those children anthropometric measurements and dietary intake were estimated. Additionally, in
children of hospital staff who have accepted the invitation to participate in the study, stool samples
were collected. Moreover, retrospective data of children who were diagnosed with CD for a year
or longer were collected in order to assess effect of different formula of EEN and route of delivery
on nutritional status and disease outcome. Written consent was obtained from the patients and
healthy controls who were 9 years of age or older and one of their parents. In patients and healthy
controls who were younger than 9 years of age, written consent was obtained only from their
parents or caregivers.
The diagnosis of IBD was established according to the revised Porto criteria (Levine et al., 2013),
while disease location was defined using the Paris classification (Fell, 2012). Severity of the
disease was estimated by Pediatric Crohn’s disease activity index (PCDAI) (Hyams et al., 1991)
and Pediatric ulcerative colitis activity index (PUCAI) (Turner et al., 2007). Exclusion criteria in
healthy siblings and healthy unrelated controls included unintentional weight loss in the last 6

23
months, changes in stool frequency or consistency or other symptoms suggestive of undiagnosed
IBD.
In all three groups the following parameters were evaluated:
Anthropometric measurements and body composition
Dietary intake
Characterization of intestinal microbiota
2.2.Anthropometric measurements and body composition
Anthropometric measurements and body composition were assessed in newly diagnosed children
with IBD, healthy siblings and healthy unrelated controls. In newly diagnosed children with IBD
the measurements were made within the 24 hours from the diagnosis. Anthropometric assessment
included measurements of body weight (BW), body height (BH), middle upper arm circumference
(MUAC), triceps skinfold thickness (TST), subscapular skinfold thickness (SST) and handgrip
strength (HS) and were measured by the same trained person. BW was measured on an electronic
scale with subjects being dressed in a light-weight gym clothes. BH was measured with a portable
stadiometer. TST and SST were estimated using a Holtain skinfold caliper. Jamar hydraulic
handgrip dynamometer was used to estimate both right and left handgrip strength in children older
than 6 years old.
Bioelectrical impedance was used to estimate subjects’ body composition (Maltron BF906,
Maltron International Ltd, Rayleigh, Essex, United Kingdom). Z-scores for BW, BH, body mass
index (BMI) and MUAC were estimated by the Growth Analyzer software. TSF and SSF were
estimated using CDC (Center for disease control and prevention) reference curve (Addo and
Himes, 2010). Z-scores for lean mass (LM) were estimated using UK reference data for pediatric
body composition (Wells et al., 2012).
Nutritional status of participants was determined using World Health Organization (WHO) Growth
reference data for children and adolescents (5-19 years) (WHO, 2006).

24
Estimated energy requirements for each child were calculated using Schofield equation. Since data
about physical activity hasn’t been collected, it was presumed that most of participants had “light”
physical activity level (PAL) (Firouzbakhsh et al., 1993).
Retrospective data on nutritional status was assessed in all children who were diagnosed with CD
and followed up for at least one year at the Children's Hospital Zagreb (tertiary medical center)
from October 2007 to November 2017 in order to assess effect of composition and route of EEN
delivery on disease outcome and nutritional status in patients with CD
2.3. Dietary intake
Dietary intake was estimated in newly diagnosed patients with IBD and healthy unrelated controls.
Information about food consumption was obtained with a validated Food Frequency Questionnaire
(FFQ). FFQ is a tool that estimates frequency of consumption of different foods as well as their
quantity. FFQ that was used contained 87 different items divided into 8 different food groups:
„Milk and milk products“, „Cereals and grains“, „Juices and sodas“, „Fruits“, „Vegetables“,
„Snacks“, „Meat, poultry, eggs and fat“ and „Fast food“. FFQ included frequently consumed
national foods and estimated frequency and quantity of consumption of food items in the last
month. Available frequencies of food consumption were: „never“, „1-3 times a month“, „once a
week“, „2-4 times per week“, „5-6 times per week“, „once a day“, „2-3 times per day“, „4-5 times
per day“ or „ 6+ times per day“. Available portion sizes were small, medium and large and
participants were able to distinguish their usual portion size using three portion size photos.
Frequency of consumption was obtained in a form of personal interview with trained interviewers.
The individual food records data obtained by the FFQ were analyzed by Microsoft Office Excel
2007 worksheet that was generated by using a combination of the Bundeslebensmittelschlüssel
3.01 (BLS 3.01), Fachmann-Kraut-Nährwerttabellen (FKN, Stuttgart, 2005), USDA (FoodData
Central) and Kaić-Rak et al. (Kaić-Rak and Antonić, 1990) food composition databases, in order
to achieve the most accurate estimation of nutritional values of most frequently consumed foods.
The frequency of consumption of food items was multiplied by the portion size to calculate the
amount of nutrients consumed in a 30-day period, from which an average daily energy and nutrient
intake per each participant were calculated. Intake of 24 nutrients were analyzed: total protein,
plant protein, total fat, saturated fatty acids (SFA), monounsaturated fatty acids (MUFA),

25
polyunsaturated fatty acids (PUFA), cholesterol, total carbohydrates, mono- and disaccharides,
polysaccharides, dietary fiber, sodium, potassium, calcium, magnesium, phosphorus, iron, zinc,
retinol equivalent, vitamin B1 and B2, niacin, vitamin B6 and vitamin C.
2.4.Characterization of intestinal microbiota
Stool samples were collected in newly diagnosed patients, healthy siblings of IBD patients and 20
healthy unrelated controls. Stool samples of IBD patients were collected at 3 time points:
Prior to therapy introduction (at the time of diagnosis)
The second day of EEN therapy
The last day of EEN therapy (6-8 weeks from the time of diagnosis)
In healthy siblings of children with CD who accepted the invitation to participate in the study and
who consented to taking EEN for two days, stool samples were collected at two time points
Before the introduction of EEN (close to the time of diagnosis of CD in their siblings)
The second day of EEN
In healthy unrelated controls stool samples were collected only at one-time point.
EEN was given as a polymeric formula. The choice of formula depended on the taste preference
of the child/adolescent. Healthy siblings used the same EEN formula as the one provided to patient
with CD.
All stool samples were stored in the hospital or at home at -20°C for a maximum of 24 hours, after
which they were transferred in the cold packs to the Department of Clinical Microbiology at the
University Hospital for Infectious Diseases and stored at -80°C.
2.4.1. PCR amplification and T-RFLP analysis
PCR amplification and terminal restriction fragment length polymorphism (T-RFLP) analysis
were performed according to Andoh et al with slight modifications (Andoh et al., 2012). 6'-
carboxyfluorescein (6-FAM) labeled 27-F (6-FAM-5'-AGAGTTTGATCCTGGCTCAG-3') and
1492R (5'-GGTTACCTTGTTACGACTT-3') primers (Thermo Fisher Scientific, USA) were used

26
for the amplification of the 16S rRNA gene from the human fecal DNA (Andoh et al., 2012). The
PCR amplification (20 ng of DNA) was performed in 50 µL reactions, in triplicates, according to
previously described protocol (Matsumoto et al., 2005). Amplified DNA was purified using
QIAquick PCR Purification Kit (Qiagen, Germany) and diluted in 50 µL of elution buffer.
HhaI and MspI enzymes were used for the restriction of amplified 16S rRNA genes (Andoh et al.,
2012). 120 ng of purified PCR product was digested separately in 30 µL reaction volumes, using
1 µL of FastDigest HhaI and FastDigest MspI (Thermo Fisher Scientific, USA) at 37°C for one
hour. Restriction products were purified by ethanol/ sodium acetate/EDTA precipitation and
resuspended in 12 µL deionized formamide (Thermo Fisher Scientific, USA) to a final
concentration of 10 ng/ µL (Li et al., 2007). 3 µL of restriction digest product (~36 ng) was mixed
with 11 µL of deionized formamide and 0.5 µL of fourfold diluted GS2500ROX (Thermo Fisher
Scientific, USA). The length of the terminal restriction fragments (T-RFs) was determined with an
ABI PRISM 310 genetic analyzer in GeneScan mode (20s injection time; 15 kV, and 60°C for 48
min for each sample) (Thermo Fisher Scientific, USA) (Matsumoto et al., 2005).
Fragment sizes were estimated by using the Local Southern Method GeneMapper 3.7 software
(Thermo Fisher Scientific, USA). T-RFs in the range of 50–810 bp with a peak height greater than
25 fluorescence units were included in the analysis. Alignment of T-RFs was performed by T-
REX software (http://trex.biohpc.org/) (Li et al., 2007). Binning treshold of 2 bp was used for
assignment of T-RFs to operational taxonomic units (OTUs) (Andoh et al., 2012). The OTUs were
quantified as the percentage values of an individual OTU per total OTU area, and this was
expressed as the % area of the underpeak curve (% AUC) (Sakamoto et al., 2003).
Assignment of OTUs to bacterial taxa was performed in silico using the web-based analysis tool
(PAT+) provided by MiCA3 (http://mica.ibest.uidaho.edu/pat.php), based on the RDP (Ribosomal
Database Project) release 10 16s rRNA gene database (Culman et al., 2009).
2.5.Ethical approval
All procedures performed in studies involving human participants were in accordance with the
ethical standards of the institutional ethics committee and with the 1964 Helsinki declaration and
its later amendments or comparable ethical standards.

27
Study was approved by Ethics Committee Children’s Hospital Zagreb (IRB number: 21102014).
Informed consent was obtained from all individual participants and at least one of their parents
included in the study.
2.6.Statistical analysis
2.6.1. Paper 1 (Sila et al., 2019)
The differences between categorical variables were assessed by chi-square test. The differences
for non-categorical variables were assessed by one-way ANOVA followed by Bonferroni test for
post hoc analysis. Pearson correlation was performed in order to assess correlation between
nutritional status and body composition and food intake. P values less than 0.05 were considered
significant. Statistical analysis was performed using SPSS 19.0 (IBM Corporation, Chicago,
Illinois, United States of America) statistical software.
2.6.2. Paper 2 (Sila et al., 2020a)
The differences between categorical variables were assessed by chi-square test. The differences
for non-categorical variables were assessed based on distribution and number of groups by
ANOVA or t test and Kruskal-Wallis or Mann-Whitney U test. The relative abundance of OTUs
was used to calculate Shannon-Wiener diversity index in order to compare diversity between
different sample groups. Cluster analyses were performed using BioNumerics software (Applied
Maths, Belgium) based on the HhaI or MspI T-RFLP patterns. A dendrogram representing
calculated similarity distances was generated using Pearson’s similarity coefficient analysis and
the unweighted pair-group methods with arithmetic means (UPGMA). P values less than 0.05 were
considered significant. Statistical analysis was performed using SPSS 19.0 (Chicago, IL) statistical
software.
2.1.1. Paper 3 (Hojsak et al., 2019)
The differences between categorical variables were assessed by chi-square test. The differences
for non-categorical variables were assessed by two tailed Student t test for independent samples.
Binary logistic regression model was used to assess characteristics of polymeric formula
(isocaloric vs hypercaloric and with taste vs tasteless), mode of EEN delivery (orally vs NG tube),

28
volume of EEN, and disease location have an influence on EEN failure. P values less than 0.05
were considered significant. Statistical analysis was performed using SPSS 19.0 (Chicago, IL)
statistical software.
2.1.2. Paper 4 (Sila et al., 2020b)
The differences between categorical variables were assessed by chi-square test. The Kolmogorov–
Smirnov test was applied to test whether the data have a normal distribution. As quantitative
variables were not normally distributed difference between healthy controls and patients with CD
were determined by Mann-Whitney U test. Repeated measures for CD patients were analyzed by
Friedman test; post hoc analysis was performed by Wilcoxon test (with Bonferroni adjustment
where p-values from the Wilcoxon tests were multiplied by the number of tests being carried out).
Repeated measures for heathy siblings were analyzed by Wilcoxon test. Due to high number of
variables in OTU comparisons, p values were adjusted for multiple comparison and values less
then 0.01 were considered significant.
The relative abundance of OTUs was used to calculate Shannon-Wiener diversity index in order
to compare diversity between different sample groups. Cluster analyses were performed using
BioNumerics software (Applied Maths, Belgium) based on the HhaI or MspI T-RFLP patterns.
Statistical analysis was performed using SPSS 2319.0 (Chicago, IL) statistical software.

29
CHAPTER III Results
Nutritional status and dietary intake
Microbiota composition of newly diagnosed IBD patients – comparison with
healthy siblings and healthy controls
The route of EEN delivery and type of polymeric formula
Microbiota composition in CD patients and healthy siblings during EEN

30
3. RESULTS
3.1.Nutritional status and dietary intake (Paper 1)
Overall, there were 89 patients with newly diagnosed IBD and 159 healthy controls included in
this study. Of those, 49 (55%) patients were affected by CD (mean age: 14.6 ± 2.6 years) and 40
(45%) by UC (mean age: 14.0 ± 3.7 years for UC). Based on PCDAI/PUCAI scoring, 54 patients
(63.5%) had mild disease and 31 patients (36.5%) had moderate to severe disease at the time of
diagnosis.
BMI z-score was used to estimate nutritional status of all participants. Nutritional status of newly
diagnosed IBD patients and healthy controls is presented in Figure 3.
Figure 3. Comparison of nutritional status according to WHO criteria between IBD patients and
healthy controls (Sila et al., 2019).

31
There was a significant difference in BW-for-age, BMI-for-age and basal metabolic rate (BMR)
but not for triceps- and subscapular skinfold thickness between both CD patients and UC patients
vs. healthy controls. Significant difference in BH-for-age z-score and MUAC-for-age z-score was
found only between CD patients vs. healthy controls. There was no significant difference in any
of anthropometric measures between CD and UC patients. Both CD and UC patients had
significantly lower lean mass-for-age z-scores compared to healthy controls.
Mean energy intake differed significantly between UC patients and healthy controls (7780.9 ±
2774.5 kj; 10198.3 ± 4409.5 kj; p=0.003), but not CD patients (8915.4 ± 3377.6 kj; 10198.3 ±
4409.5 kj; p=0.202).
Difference in intake of macronutrients, micronutrients and different food groups between CD
patients, UC patients and healthy controls is shown in Table 1.
Table 1. Difference in dietary intake between CD patients, UC patients and healthy controls (Sila
et al., 2019).
CD (n=49) UC (n=40) Healthy
controls
(n=159)
p-value
Energy intake (kj), mean (SD) 8915.4
(3377.6)
7780.9
(2774.5)
10198.3
(4409.5)
0.002***
% EER (%), mean (SD) 90.0 (52.8) 86.6 (39.6) 109.3 (45.9) 0.004*
Total proteins (g), mean (SD) 92.4 (33.3) 83.5 (31.6) 107.1 (43.8) 0.002***
Vegetable proteins (g), mean
(SD)
25.7 (11.1) 23.6 (8.7) 29.0 (14.3) 0.043
Animal proteins (g), mean (SD) 46.0 (21.5) 43.7 (20.7) 57.2 (27.4) 0.002*
Total fat (g), mean (SD) 102.1 (45.9) 81.1 (31.1) 108.1 (52.9) 0.010***
Saturated fat (g), mean (SD) 35.9 (17.3) 30.3 (13.8) 43.6 (22.0) 0.001***
Unsaturated fat (g), mean (SD) 31.9 (14.5) 25.6 (10.7) 54.0 (27.2) 0.006***

32
Total carbohydrates (g), mean
(SD)
252.7 (100.8) 228.7 (85.1) 292.9 (133.9) 0.007***
Mono- and disaccharides (g),
mean (SD)
107.8 (62.3) 98.5 (51.8) 131.3 (59.3) 0.002***
Fibers (g), mean (SD) 21.8 (9.2) 20.8 (8.0) 25.8 (12.3) 0.014***
Calcium (mg), mean (SD) 765.1 (399.7) 766.6 (385.1) 987.4 (446.2) 0.001*
Magnesium (mg), mean (SD) 247.3 (193.3) 219.1 (123.5) 279.5 (160.4) 0.091
Phosphorus (mg), mean (SD) 1455.7
(521.1)
1364.9
(508.3)
1742.2
(674.1)
0.001*
Iron (mg), mean (SD) 13.2 (5.5) 11.3 (4.5) 14.7 (6.4) 0.005***
Zinc (mg), mean (SD) 8.6 (3.9) 7.3 (3.5) 8.9 (3.6) 0.047***
Proteins (% EI), mean (SD) 17.3 (2.8) 17.9 (2.8) 17.7 (2.5) 0.622
Carbohydrates (% EI), mean
(SD)
46.5 (7.1) 48.8 (5.6) 47.6 (7.5) 0.355
Fat (% EI), mean (SD) 41.8 (7.0) 38.7 (5.7) 39.0 (6.8) 0.044
Fruits (%EI), mean (SD) 3.3 (3.9) 5.2 (5.3) 6.2 (4.7) 0.002**
Vegetables (%EI), mean (SD) 3.7 (1.7) 4.2 (2.0) 3.8 (2.3) 0.535
Juices and sodas (%EI), mean
(SD)
5.2 (4.0) 5.2 (3.9) 4.9 (4.0) 0.814
Snacks (%EI), mean (SD) 10.8 (9.9) 8.7 (6.2) 9.9 (6.6) 0.444
Fast food (%EI), mean (SD) 13.5 (6.9) 11.3 (4.2) 13.0 (6.3) 0.246
EI – energy intake
Post hoc analysis: *p<0.05 for CD and UC vs. healthy controls; **p<0.05 for CD vs. healthy
controls; ***p<0.05 for UC vs. healthy controls.
3.2.Microbiota composition of newly diagnosed IBD patients – comparison with healthy
siblings and healthy controls (Paper 2)

33
In this part of study, 19 IBD patients (n=13 CD patients; 63.2% male; mean age 14.77±0.65 years),
20 healthy siblings (30% male; mean age 12.84±0.85 years) and 19 healthy controls (47.4% male;
mean age 10.72±0.84 years) were included.
The fecal microbiota profiles of all 3 groups are illustrated by a dendrogram (Figure 4).
A setting of similarity generated 2 major clusters. Most of healthy controls (17/19 with HhaI and
18/19 with MspI) and healthy siblings (20/20 by HhaI and 20/20 by MspI) were classified in cluster
I. In IBD patients, 57.9% (HhaI digestion) and 52.6% (MspI digestion) were classified into cluster
II.
Figure 4. Dendrogram of the fecal microbiota profiles of IBD patients, healthy unrelated controls
and healthy siblings (a. HhaI-digestion, b. MspI-digestion) (Sila et al., 2020a).
Based on the result of HhaI/MspI-digested T-RF patterns, microbial diversity of IBD patients was
reduced compared to that of healthy siblings and healthy unrelated controls (Table 2).
a b

34
Table 2. Comparison of fecal bacterial diversity between IBD patients, healthy siblings and healthy
controls. The Shannon diversity index was calculated from the HhaI- and MspI-digested T-RF
patterns (Sila et al., 2020a).
Shannon index IBD (n=19) Healthy siblings
(n=20)
Healthy controls
(n=19)
p-value
MspI digestion,
mean (SD)
2.11 (0.12) 2.45 (0.85) 2.44 (0.74) 0.018**
HhaI digestion,
mean (SD)
1.75 (0.12) 2.14 (0.81) 1.99 (0.66) 0.013*
Post-hoc analysis: *p<0.05 for IBD vs. healthy siblings, **p<0.05 for IBD vs. healthy siblings and
IBD vs. healthy controls. IBD – inflammatory bowel disease
All HhaI- and MspI-associated OTUs predicting the genus Clostridium, among others, were
significantly decreased in IBD patients at the time of diagnosis compared to healthy siblings and
healthy controls. Some other HhaI- and MspI-associated OTU-s representing phylum Firmicutes,
which include bacteria from the genera Paenibacillus, Bacillus, Lactobacillus, Blautia,
Eubacterium, Roseburia and Ruminoccocus were significantly reduced in IBD patients compared
to healthy siblings and healthy controls. On the contrary, the genera Streptococcus, Lactococcus
and Enterococcus predicted by the MspI-associated 555-bp and 563-bp were significantly
increased in IBD patients. The same has been noticed for the phylum Proteobacteria, represented
by genera Enterobacter, Citrobacter, Escherichia and Klebsiella (495-bp MspI OTUs).
3.3.The route of EEN delivery and type of polymeric formula (Paper 3)
A total of 92 CD patients were included in the study (54.3% male, mean age 13.6 ± 3.0 years).
A total of 71 (77.2%) children treated with EEN achieved remission. Overall 42 (45.7%) patients
that received EEN via NG tube until the end of the EEN period. Moreover, 42 (45.7%) patients
received formula with taste, from which 12 patients received a hypercaloric formula (1.5 kcal/ml),
30 patients received an isocaloric formula (1 kcal/ml), and 50 received a standard isocaloric,
tasteless, polymeric formula.

35
None of the assessed factors, including age, disease location, characteristics of the formula (with
taste vs tasteless and isocaloric vs hypercaloric), and mode of delivery (orally vs trough NG tube
for the whole duration of EEN) were associated with EEN failure (Table 3).
Table 3. Risk factors at diagnosis evaluated with respect to exclusive enteral nutrition (EEN)
failure. Binary logistic regression multivariable model (Hojsak et al., 2019).
HR
95% CI
Age 1.011 0.742-1.378
Disease location
L1
L1
0.254 0.045-1.429
1.518 0.423-5.449
Enteral formula with taste 0.412 0.086-1.960
Hypercaloric (1.5 kcal/ml) enteral formula 2.5 0.377-16.588
NG tube for the duration of EEN 1.001 0.286-3.504
Energy intake via EEN (kcal/kg body weight) 0.964 0.907-1.025
NG - nasogastric
3.4.Microbiota composition of CD patients and healthy siblings during EEN (Paper 4)
Seventeen newly-diagnosed children with CD (52.9% male; mean age 15.98±1.46 years) and 10
of their healthy siblings (30% male; mean age 14.2±3.02 years) participated in this part of the
study.
Difference in microbial diversity estimated by HhaI/MspI-digested T-RF patterns between all
children with CD and healthy siblings at the start of EEN and on the second day of EEN is
presented in Figure 5. There was no significant difference in microbial diversity between children
with CD and healthy siblings before EEN treatment (p=0.127 for HhaI-digestion; p=0.604 for
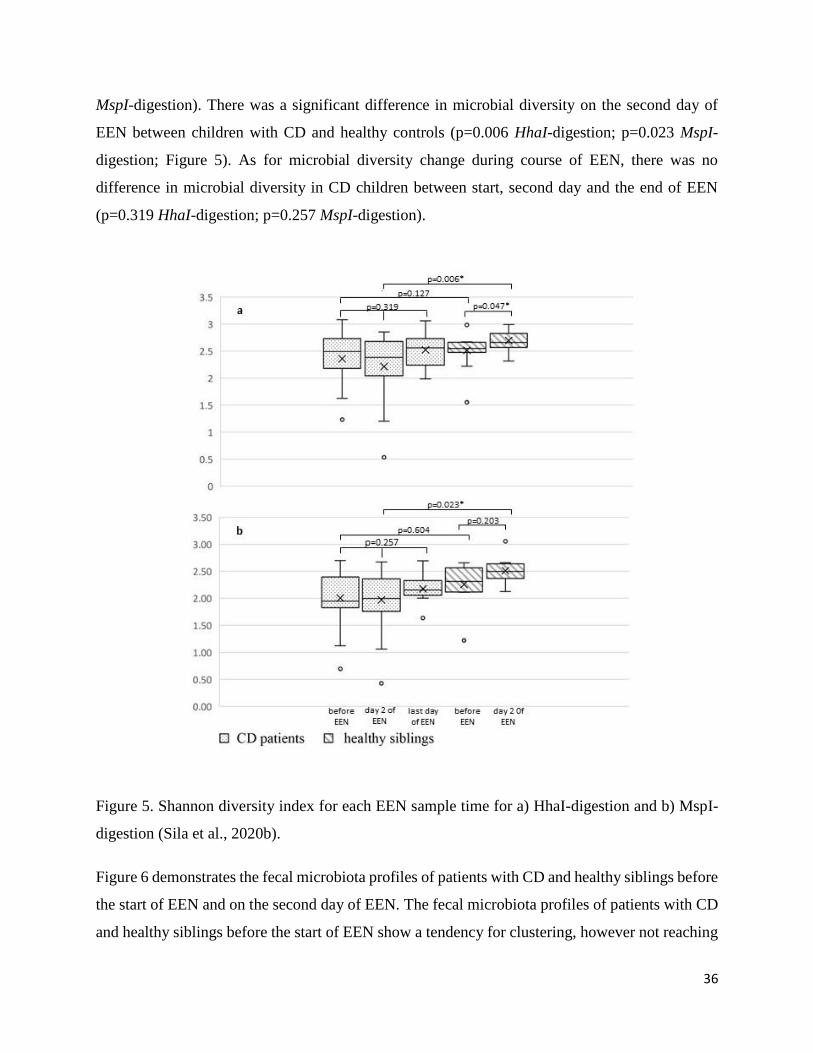
36
MspI-digestion). There was a significant difference in microbial diversity on the second day of
EEN between children with CD and healthy controls (p=0.006 HhaI-digestion; p=0.023 MspI-
digestion; Figure 5). As for microbial diversity change during course of EEN, there was no
difference in microbial diversity in CD children between start, second day and the end of EEN
(p=0.319 HhaI-digestion; p=0.257 MspI-digestion).
Figure 5. Shannon diversity index for each EEN sample time for a) HhaI-digestion and b) MspI-
digestion (Sila et al., 2020b).
Figure 6 demonstrates the fecal microbiota profiles of patients with CD and healthy siblings before
the start of EEN and on the second day of EEN. The fecal microbiota profiles of patients with CD
and healthy siblings before the start of EEN show a tendency for clustering, however not reaching

37
significance (Figure 6a). Figure 6b demonstrates the fecal microbiota profiles of patients with CD
and healthy siblings on the second day of EEN, showing that two major clusters were formed (one
for healthy siblings and other for patients with CD).
Figure 6. Dendrograms of the fecal microbiota profiles of CD patients and healthy siblings (a.
before the introduction of EEN; b. the second day of EEN) (Sila et al., 2020b).

38
CHAPTER IV Discussion
Dietary intake of IBD patients
Microbiota composition of children with IBD
Impact of route of delivery and type of EEN formula on nutritional status and
course of the disease in children with CD
Impact of EEN on the microbiota composition of CD patients and their healthy
siblings

39
4. DISCUSSION
These studies together have demonstrated that children with IBD display significant differences in
nutritional status and dietary intake at the time of diagnosis compared to healthy children.
Moreover, we have shown significant differences in microbiota diversity and composition at the
time of diagnosis in children with IBD, compared to both healthy unrelated children and healthy
siblings. In healthy siblings, some microbiota composition patterns similar to those in children
with IBD had been observed. Furthermore, we have shown that the diet, with regard to EEN used
as a primary therapy for induction of remission in children with CD, leads to significant changes
in microbiota composition in both children with CD and their healthy siblings. However, these
changes are delayed in children with CD compared to their healthy siblings.
4.1. Dietary intake of IBD patients (Paper 1)
Significant differences in intake of macronutrients and some micronutrients were present in IBD
patients at the time of diagnosis compared to healthy population. Estimating dietary intake of IBD
patients is not only important for its impact on the nutritional status of the child, but it has been
shown that the diet is an important factor in the pathogenesis of IBD since it impact the microbial
composition, function, the gut barrier and host immunity (Levine et al., 2018). Moreover, poor
nutrition in childhood IBD contributes to disrupted pubertal development and impaired growth
velocity which may lead to short stature in adulthood (Forbes et al., 2017). Most studies looking
into dietary intake of children with IBD have assessed intake in children with established disease
(Diederen et al., 2018; Hartman et al., 2009; Pons et al., 2009; Thomas et al., 1993; Tsiountsioura
et al., 2014). Therefore, looking into the diet of children before the disease has occurred is
important to estimate potential nutrient deficiencies as well as to set up appropriate nutritional
intervention.
Surprisingly, we have found that energy intake of CD patients was appropriate and did not
significantly differ from that of healthy individuals. However, intake of certain nutrients and food
groups was altered compared to healthy controls, with regard to intake of calcium, phosphorus and
fruit which was lower in these patients. In UC patients, low intake of energy, all macronutrients
and dietary fiber was observed, as well as lower intake of phosphorus, calcium, iron and zinc. Low

40
intake of energy and, consequently all macronutrients in UC patients is of no surprise, since these
children present with acute symptoms (bloody diarrhea and abdominal cramps) at the time
diagnosis. The acute symptoms which are especially prone in UC (severe bloody diarrhea) could
cause the restriction in food intake and increase the likelihood of restrictive diet introduction.
Interestingly, we haven't found that children with CD had lower intake of energy compared to
healthy children, while they did present with deteriorated nutritional status and body composition.
However, in IBD, the pathogenesis of malnutrition is multifactorial. The mechanisms involved
include not only limited food intake, but also malabsorption of nutrients and increased nutrient
losses, among others (Forbes et al., 2017). Interestingly, resting energy expenditure is not
associated with disease activity in children with IBD (Hart et al., 2005; Wiskin et al., 2012, 2009).
Therefore, even though children with CD did not have lower energy intake compared to healthy
controls, lower BMI z-score was probably caused by other factors like malabsorption and
increased nutrient losses.
Low intake of calcium in IBD patients (756.1 ± 399.7 mg for CD patients; 766.6 ± 385.1 mg for
UC patients) is an important observation since it can lead to poor health outcomes like malnutrition
and abnormal bone mineralization. Although we did not investigate it, low intake of calcium in
our cohort is most probably related to low intake of milk and dairy products, as was previously
demonstrated in IBD patients (Pituch-Zdanowska et al., 2019). Low intake of milk products at the
time of diagnosis is most probably associated with secondary lactose intolerance. Indeed,
secondary lactose malabsorption and intolerance are caused by damage of the small intestinal
mucosa in CD leading to reduced lactase expression with the risk of lactase deficiency (Wiecek et
al., 2014). In one meta-analysis, the overall odds ratio for lactose malabsorption in patients with
IBD was 1.6 (95% CI: 1.0 to 2.6, p=0.048), being highest in CD affecting the small bowel (Szilagyi
et al., 2016). Therefore, it is not surprising that one of the most commonly avoided foods in
children with IBD are dairy products, especially in active disease, with as many as 30-41% of
paediatric IBD patients excluding dairy products from their diets (Pituch-Zdanowska et al., 2019).
Moreover, around 1/3 of parents of paediatric patients with IBD believe that the diet could be the
cause of the disease, and 67.1% believe that diet/different type of food can trigger an IBD flare
(Pituch-Zdanowska et al., 2019). Even though we do not know if this was the case in our cohort,
early recognition of different dietary beliefs, especially in newly diagnosed patients with IBD, is

41
important in order to prevent unnecessary self-prescribed dietary restrictions. Moreover, IBD is
already a condition associated with bone mineral loss, development of osteoporosis, and increased
risk of fracture, with the underlying inflammatory process, as well as the low body mass,
corticosteroid use and malabsorption, all commonly recognized factors in contributing to bone
disease (Even Dar et al., 2019). Therefore, unnecessary dietary restrictions such as elimination of
dairy products containing calcium and vitamin D should be avoided in these patients. Early
recognition and intervention are of outmost importance.
Lower intake of fruits and dietary fiber in our cohort could be the result of active symptoms of the
disease. However, no difference was observed in the intake of other food groups such as intake of
vegetables, fast food, soda and juices or snacks, so that is unlikely. Indeed, few studies have found
similar results to ours, where both patients with active and inactive IBD had lower intake of dietary
fiber in comparison with healthy children (Hartman et al., 2016), which means that even children
in remission with no underlying symptoms reduce the intake of these important foods. Indeed, up
to 41.3% and 32.3% of parents of children with IBD report that their children avoid consumption
of fruits and vegetables, respectively (Pituch-Zdanowska et al., 2019). Moreover, we have
observed high intake of snacks, fast food, juices and sodas in both IBD patients and healthy
children, together contributing to even 29.5% and 25.2% of total energy intake in CD and UC
patients, respectively. These observations taken together - low intake of fruit and dietary fiber
along with high intake of industrial processed food - are important for two reasons. First is that in
IBD patients in whom body composition is already impaired due to inflammation, low levels of
physical activity and use of different medicine (Beattie et al., 2006), special attention should be
given to appropriate nutrition in order to improve body composition. Secondly, this type of diet
itself may irreversibly reduce bacterial diversity and lead to the disappearance of specific bacterial
species in the digestive system (Sonnenburg et al., 2016). Moreover, fibers and starches found in
fruits and vegetables are a vital substrate for the production of butyrate and other short chain fatty
acids, which play an important role in downregulating inflammation, as well as enhancing innate
immunity (Furusawa et al., 2013; Roberts et al., 2013). Furthermore, depriving colonic microbes
from fiber can lead to depletion of the mucus layer, disruption of the barrier, immune activation
and tissue damage (Desai et al., 2016). All these factors have been recognized as risk factors for

42
IBD development, and therefore, early nutritional interventions and educations in newly-
diagnosed children with IBD should be employed.
4.2.Microbiota composition of children with IBD (Paper 2)
We have shown in our studies that microbiota diversity and composition of IBD patients
significantly differs from healthy controls and their siblings at the time of diagnosis. Furthermore,
lower abundance of the phylum Firmicutes and higher abundance of the phylum Proteobacteria
was observed in IBD patients compared to healthy siblings and healthy controls. This is of no
surprise, since studies in both adults and children have shown that paediatric IBD patients have
significantly less diverse microbial composition compared to both healthy controls and healthy
siblings (Sheehan and Shanahan, 2017). However, to this day, it is not clear if that is the cause or
a consequence of the disease. Therefore, comparing the microbiota of healthy siblings with that of
IBD patients, who share both the genetic background and environmental exposures that predispose
to IBD, but in whom cumulative effect of different environmental triggers is insufficient to produce
the full-blown disease phenotype, could provide explanation into potential mechanism of IBD
development.
In our cohort, we have found microbiota composition of IBD patients to be significantly different
from that of healthy siblings – which would lead us to conclude that dysbiosis is purely the
consequence of the inflammation in the bowel. Interestingly, even though we didn’t find
statistically significant differences, we did show that some differences observed between healthy
siblings and healthy controls were similar to the differences observed when comparing IBD
patients to healthy controls. More specifically, most OTUs representing bacteria from phylum
Firmicutes (“beneficial” bacteria), but not from phylum Proteobacteria (“detrimental” bacteria)
that were observed in healthy siblings, differed from that of healthy controls and were approaching
values observed in IBD patients. Indeed, reduced abundances of “beneficial” bacteria in siblings
of IBD patients have been observed in other studies as well (Hedin et al., 2017; Joossens et al.,
2011). As shown in the study by Joosens et al. (Joossens et al., 2011), the dysbiosis in relatives of
patients was not characterized by a lack of butyrate-producing capacity, which was the case in IBD
patients, but bacterial species that are known to degrade gastrointestinal mucin. Degradation of the
mucosal barrier might enhance bacterial translocation and lead to increased permeability of the

43
gut. Authors have concluded that enhanced mucin degradation capacity found in relatives of CD
patients might precede or predispose further to development of CD. Furthermore, they speculate
that dysbiosis observed in relatives of the patients with CD might be an intermediate step towards
CD and disease-associated dysbiosis. Moreover, in study by Hedin et al. (Hedin et al., 2017),
increased E. coli contributed to the dissimilarity between patients and healthy controls but not to
the siblings and healthy controls. Thus, authors speculate, it may be that the CD dysbiosis
comprises microbial factors that contribute to pathogenesis (such as lower abundances of
“beneficial” bacteria), overlaid with microbial alterations that are consequent of inflammation
(such as higher abundance of E. coli – “detrimental” bacteria). These observations taken together
could pinpoint to the hypothesis that some “predisposition”, in a sense that there is certain
dysbiosis already present before the presentation of the full-blown disease, potentially does pave
the road to the development of the disease later in life, probably triggered by some environmental
factor(s). Just one example of such trigger could be low consumption of dietary fiber along with
high consumption of industrially processed foods, which could further accentuate the dysbiosis,
and in genetically predisposed individuals eventually lead to the development of IBD. However,
we cannot confirm if this was the case in our cohort.
Even more so, rather than focusing on the microbial composition at the time of diagnosis when the
disease is already established, it may be that the influence of the gut microbiota develops long
before the occurrence of the disease. Even though we haven’t found differences in duration of
breastfeeding, time of weaning, number of siblings, mode of delivery and owning of pets in our
cohort, shared exposures to different risk factors in early perinatal and postnatal life when the
microbiota is developing and becoming stabilized could lead to permanent changes in microbiota,
which could in turn influence the risk of developing IBD later in life (Bianco-Miotto et al., 2017).
4.3.Impact of route of delivery and type of EEN on nutritional status and course of the
disease in children with CD (Paper 3)
Guidelines for the treatment of CD in children suggest an oral route of administration of enteral
formula should be employed (Miele et al., 2018). However, this recommendation almost solely
relies on the expert opinion, and no study to date has demonstrated if oral route should be preferred
(Gailhoustet et al., 2002). Therefore, this retrospective study aimed to assess if the route of delivery

44
of EEN (orally vs NG tube) and characteristics of enteral formula (isocaloric vs hypercaloric and
with taste vs tasteless) impact the effectiveness of EEN in remission induction, disease course, and
nutritional status. We have demonstrated that the route of EEN delivery and the characteristics of
the polymeric formula have no effect on the outcome of treatment and nutritional status in pediatric
patients with CD.
Moreover, our study has shown that there was no difference in weight change or BMI change
during EEN in children receiving EEN orally or via NG tube. Importantly, there was no difference
in energy intake between children receiving ENN orally or via NG tube. The only other study that
has compared oral to continuous EEN via NG tube (Rubio et al., 2011) found no difference in
remission induction, however, opposite to our study, they did find significant difference in weight
gain, which was significantly higher in the continuous EEN group – which could partially be
explained by the fact that patients in our study received EEN as a bolus treatment.
The type and the amount of formula could both potentially impact the extent of change of
microbiota composition. Even though the amount of EEN formula (and energy intake) ingested by
CD patients was not estimated in this retrospective study, we assume it did not differ between the
two groups, since there was no difference in weight gain between the two groups. Moreover, we
have demonstrated that the route of delivery and characteristics of the polymeric formula have no
impact on the remission of the disease – which we know is related to microbiota alterations caused
by EEN. Therefore, we hypothesize that the extent of microbiota composition change caused by
EEN is not dependent on the route of delivery or type of formula used.
4.4. Impact of EEN on the microbiota composition of CD patients and their healthy siblings
(Paper 4)
Perhaps the strongest evidence for the role of diet in CD is the therapeutic effect of EEN in the
treatment of active CD (Ruemmele et al., 2014). This effect does not depend on the protein source
(type of formula) (Hojsak et al., 2019), but is very dependent on exclusion of ordinary table food
(Johnson et al., 2006; Lee et al., 2015). The mechanism by which EEN leads to reduction of
inflammation and mucosal healing is not well understood, however studies have shown that EEN
modifies the microbiota of CD patients, which in turn supports intestinal homeostasis and the

45
immune system function (MacLellan et al., 2017). No study to date has investigated if EEN has a
similar effect on the microbiota of healthy children, as compared to children with CD.
Therefore, our study investigated, for the first time, the differences in the stool microbial content
in the response to EEN in children with CD compared to their healthy siblings. Furthermore, we
have investigated changes in microbiota composition in children with CD during the course of the
disease. In children with CD, we have demonstrated that EEN causes significant changes in
microbiota composition, however, those changes are delayed and become apparent on the last day
of EEN. In healthy siblings, these changes were already observed on the second day of EEN.
Similarly, other studies have demonstrated significant changes in microbiota composition during
EEN, indicating that CD is not associated with a single bacteria change, but rather with
community-level imbalances in the gut microbiome (MacLellan et al., 2017). We have shown
lower abundance of the phylum Firmicutes in CD patients compared to healthy siblings before the
start of EEN. Moreover, we have shown higher abundances of the phylum Proteobacteria in CD
patients compared to healthy siblings, however, we have failed to reach statistical significance. As
discussed in the previous chapters, two important factors in pathogenesis od CD have been
discussed in the literature – the loss of symbionts with anti-inflammatory properties (Takahashi et
al., 2016) along with expansion of potentially pathogenic symbionts that can cause activation of
the immune response and consequently cause inflammation when this activation is overstimulated
(Zechner, 2017). We could speculate that in our cohort, altered microbiota composition of CD
patients this is possibly consequence of both the disease (inflammation) and altered dietary intake,
characterized by high intake “Western diet” food and low intake of fruits, which predisposed to
the diagnosis of the disease, as discussed in the previous chapters. With that in mind, therapy that
would result with less “dysbiotic” microbiota, i.e. the one that would be more similar to the
microbiota of healthy controls, might lead to remission of disease in children with CD. Our results
have confirmed this hypothesis and have shown a tendency towards the increase in abundance of
phylum Firmicutes and a decrease in abundance of phylum Proteobacteria, similar to what was
observed in a study by D’Argenio et al (D’Argenio et al., 2013) and Schwerd et al. (Schwerd et
al., 2016). These studies, along with ours, would suggest that EEN “normalizes” previous
dysbiosis, leading to reduction of inflammation. However, other studies have shown opposing
results (Gerasimidis et al., 2014a; Kaakoush et al., 2015; Lewis et al., 2015; Quince et al., 2015)

46
and have suggested that EEN leads to even more dysbiotic state and have even suggested that
reduction in relative abundance of families within the Firmicutes phylum correlated with clinical
improvement. Interestingly, Lewis et. al (Lewis et al., 2015) have demonstrated that there was a
marked difference in microbiome composition between patients who ultimately responded to EEN
and those who did not, with those patients who have responded to treatment exhibiting microbiota
profiles that were more similar to healthy controls.
Moreover, we wanted to see if similar changes occur in both patients with CD and their healthy
siblings during the 2-day course of EEN. A time period of two days of EEN was chosen as not to
be overly demanding for otherwise healthy children and because limited data in the literature
showed that intestinal microbiota changes are already present one day after initiation of EEN
(Meister et al., 2002). Moreover, a dramatic and rapid rearrangement in the human microbiome
within 24 hours after reduction of carbohydrate (including fiber) was observed in a recent study
(Mardinoglu et al., 2018), showing that changes in the diet lead to rapid changes in microbiota
composition. We have found that EEN has caused significant changes in microbiota composition
in both children with CD and healthy siblings. However, microbiota of healthy siblings responded
“more rapidly” to EEN introduction, with significant changes being observed already on the
second day of EEN, similar to those that were observed in children with CD on the last day of
EEN. Furthermore, significant increase in microbial diversity was already apparent on the second
day of EEN in healthy siblings while diversity did not significantly change throughout the EEN
course in diseased children. Since children with CD might have dysbiosis that is both a cause and
a consequence of the disease, they tend to present with slower change in microbiota composition
caused by persistent severe gut inflammation that could not be rapidly changed by day 2.
Moreover, it could be that “healthier” microbiota, present in healthy siblings, responds more
rapidly and uniformly to the diet change, whereas CD patients exhibited divergent microbiome
changes in response to EEN. Therefore, though our data could help in clarifying the role of
different microbiota in CD patients, the major conundrum of whether it is the cause or the
consequence of inflammation remains.
Interestingly, newer studies have demonstrated that specific changes in the diet, with regard to the
exclusion of potentially proinflammatory ingredients, coupled with partial enteral nutrition (PEN)
can lead to similar changes in microbiota composition as those observed with the use of EEN. This

47
diets were developed as an answer to a challenge that EEN poses to physicians and patients, mostly
related to monotony of food and taste fatigue, which limits access and availability of the therapy.
The most promising approach to this date is CD exclusion diet (CDED), whose mechanism of
action is based on the exclusion of foods that have been associated with altered host barrier or
bacterial clearance, dysbiosis and virulence factors that may allow bacteria to become mucosa-
associated and enable translocation (Levine and Wine, 2013). This diet has recently been used for
induction and maintenance of remission along with partial enteral nutrition (PEN) in CD patients
(Levine et al., 2019). In the recent multinational randomized controlled trial, CDED diet was
compared with EEN in inducing and sustaining remission in children with mild to moderate CD
(Levine et al., 2019). Investigators have demonstrated that both diets were associated with high
and comparable rates of clinical remission and a significant and similar decrease in inflammation
by week 6. Furthermore, both groups had similar changes in the microbiome induced by diet by
week 6. The initial preliminary analyses of CDED study indicate that there is a clear difference in
the modulation of the intestinal microbiota in patients coming into and maintaining remission on
CDED compared with those failing remission (Pigneur and Ruemmele, 2019).
Our studies have some limitations. They are mainly related to small sample size, however, it is
comparable to other studies and adds important information to the still scarce literature. Moreover,
we have investigated dietary intake in the previous month using FFQ, since 3-day food diary was
not feasible in the case of patients who were referred to the hospital once the patient was suspected
of having IBD. Moreover, FFQ used in this study was compared and correlates strongly with the
results of a 3-day nutritional intake diary (Mocic Pavic et al., 2015). As for the analysis of
microbiota, by using other sequencing methodology such as strain-level shotgun metagenomics
with deep sequencing, we would have been able to provide strain-level taxonomic classification.
Nevertheless, an advantage of this methodology is hypothesis-free approach, non-selective of
certain bacterial species. Moreover, the period of two days of EEN in healthy siblings might not
have been long enough to detect more profound changes in microbiota composition. Nonetheless,
data in the literature have shown that intestinal microbiota changes already within one day after
initiation of EEN which was also confirmed by our results (Meister et al., 2002). Moreover, we do
not know if changes in the microbiota of CD patients were apparent already before the end of EEN
since we did not analyze stools between the day 2 and the last day of EEN.

48
Strengths of our studies include that all controls, healthy unrelated and siblings, were younger than
18 years of age, ensuring that age was not a confounder in this cohort. Second, all the patients were
treatment naïve and recruited at the time of diagnosis, which excludes the effect of treatment on
the microbiota profiles. Moreover, important strengths of our study are in the unique design which
included healthy siblings receiving EEN that was not investigated before.

49
CHAPTER V Conclusions

50
5. CONCLUSIONS
The most important results of this dissertation thesis are:
- Lower intake of energy, macronutrients and various micronutrients in patients with UC and
lower intake of fruits, calcium and animal protein in patients with CD compared to healthy controls
was observed.
- IBD patients have altered body composition, with significantly lower lean mass-for-age z-
scores at diagnosis compared to healthy controls.
- Altered microbiota composition, with reduced presence of genus Eubacterium,
Lactobacillus, Enterobacter and Clostridium, and increased presence of genus Streptococcus,
Prevotella and Escherichia was observed in IBD patients as compared to healthy siblings and
healthy controls.
- None of the factors including age, disease location, type of formula (with taste vs tasteless
and isocaloric vs hypercaloric) and mode of delivery (orally vs through NG tube for the whole
duration of EEN) are associated with EEN failure in children with CD.
- Significant difference in microbial diversity between children with CD and healthy siblings
was observed the second day of EEN, but not before the start of EEN and on the last day of EEN.
- In healthy controls, significant changes in microbiota composition were apparent already
on the second day of EEN, contrary to children with CD in whom similar changes in microbiota
composition were apparent on the last day of EEN.
Our studies build on the existing literature and confirm that children with IBD exhibit significant
difference in microbiota composition already at the time of diagnosis of the disease. We have also
confirmed that EEN leads to significant changes in microbiota composition of children with CD,
probably being one of the leading mechanisms involved in the remission of the disease. Moreover,
for the first time, we have shown that the similar changes occur in the siblings of children with
CD. Opposite to other studies, we haven’t detected significant changes in microbiota diversity as
an effect of EEN in our cohort. We have also demonstrated that children with IBD show some

51
important differences in nutritional intake as opposed to healthy children, which emphasizes the
importance of early nutritional intervention in these children. Moreover, we have confirmed that
children with IBD often present malnourished and have altered body composition compared to
healthy children.
Our studies confirm the importance of the diet in microbiota composition in children with IBD but
also nutritional status (including micronutrients). Although we do not know if the diet that
predisposed to diagnosis of the disease was associated with dysbiosis that was observed in our
cohort, results of other studies have confirmed that the diet plays significant role in both the
development, but also in the treatment of the diseases, and therefore, special attention to the
nutrition of these children should be given.

52
REFERENCES
Addo, O.Y., Himes, J.H. (2010) Reference curves for triceps and subscapular skinfold thicknesses
in US children and adolescents. Am J Clin Nutr. 91, 635–642.
Alhagamhmad, M.H., Day, A.S., Lemberg, D.A., Leach, S.T. (2016) An overview of the bacterial
contribution to Crohn disease pathogenesis. J Med Microbiol. 65, 1049–1059.
Ananthakrishnan, A.N. (2015) Environmental Risk Factors for Inflammatory Bowel Diseases: A
Review. Dig Dis Sci. 60, 290–298.
Ananthakrishnan, A.N., Bernstein, C.N., Iliopoulos, D., Macpherson, A., Neurath, M.F., Ali,
R.A.R., Vavricka, S.R., Fiocchi, C. (2018) Environmental triggers in IBD: a review of progress
and evidence. Nat Rev Gastroenterol Hepatol. 15, 39–49.
Ananthakrishnan, A.N., Cagan, A., Gainer, V.S., Cai, T., Cheng, S.-C., Savova, G., Chen, P.,
Szolovits, P., Xia, Z., De Jager, P.L., Shaw, S.Y., Churchill, S., Karlson, E.W., Kohane, I., Plenge,
R.M., Murphy, S.N., Liao, K.P. (2013) Normalization of plasma 25-hydroxy vitamin D is
associated with reduced risk of surgery in Crohn’s disease. Inflamm Bowel Dis. 19, 1921–1927.
Ananthakrishnan, A.N., Khalili, H., Higuchi, L.M., Bao, Y., Korzenik, J.R., Giovannucci, E.L.,
Richter, J.M., Fuchs, C.S., Chan, A.T. (2012) Higher Predicted Vitamin D Status Is Associated
With Reduced Risk of Crohn’s Disease. Gastroenterology 142, 482–489.
Ananthakrishnan, A.N., Khalili, H., Konijeti, G.G., Higuchi, L.M., de Silva, P., Fuchs, C.S.,
Willett, W.C., Richter, J.M., Chan, A.T. (2014) Long-term intake of dietary fat and risk of
ulcerative colitis and Crohn’s disease. Gut 63, 776–784.
Andoh, A., Kuzuoka, H., Tsujikawa, T., Nakamura, S., Hirai, F., Suzuki, Y., Matsui, T., Fujiyama,
Y., Matsumoto, T. (2012) Multicenter analysis of fecal microbiota profiles in Japanese patients
with Crohn’s disease. J Gastroenterol. 47, 1298–1307.
Assa, A., Shamir, R. (2017a) Exclusive enteral nutrition for inducing remission in inflammatory
bowel disease in paediatric patients. Curr Opin Clin Nutr Metab Care. 20, 384–389.
Assa, A., Shamir, R. (2017b) Exclusive enteral nutrition for inducing remission in inflammatory
bowel disease in paediatric patients. Curr Opin Clin Nutr Metab Care. 20, 384–389.
Azad, M.B., Konya, T., Maughan, H., Guttman, D.S., Field, C.J., Chari, R.S., Sears, M.R., Becker,
A.B., Scott, J.A., Kozyrskyj, A.L., CHILD Study Investigators (2013) Gut microbiota of healthy
Canadian infants: profiles by mode of delivery and infant diet at 4 months. Can Med Assoc J. 185,
385–394.
Azad, M.B., Konya, T., Persaud, R.R., Guttman, D.S., Chari, R.S., Field, C.J., Sears, M.R.,
Mandhane, P.J., Turvey, S.E., Subbarao, P., Becker, A.B., Scott, J.A., Kozyrskyj, A.L., CHILD
Study Investigators (2016) Impact of maternal intrapartum antibiotics, method of birth and
breastfeeding on gut microbiota during the first year of life: a prospective cohort study. Int J Obstet
Gynaecol. 123, 983–993.

53
Bager, P., Simonsen, J., Nielsen, N.M., Frisch, M. (2012) Cesarean section and offspring’s risk of
inflammatory bowel disease: a national cohort study. Inflamm Bowel Dis. 18, 857–862.
Baldassano, R.N., Piccoli, D.A. (1999) Inflammatory bowel disease in pediatric and adolescent
patients. Gastroenterol Clin North Am. 28, 445–458.
Barclay, A.R., Russell, R.K., Wilson, M.L., Gilmour, W.H., Satsangi, J., Wilson, D.C. (2009)
Systematic Review: The Role of Breastfeeding in the Development of Pediatric Inflammatory
Bowel Disease. J Pediatr. 155, 421–426.
Beattie, R.M., Croft, N.M., Fell, J.M., Afzal, N.A., Heuschkel, R.B., 2006. Inflammatory bowel
disease. Arch. Dis. Child. 91, 426–432. https://doi.org/10.1136/adc.2005.080481
Bengtson, M.-B., Solberg, I.C., Aamodt, G., Jahnsen, J., Moum, B., Vatn, M.H., IBSEN Study
Group (2010) Relationships between inflammatory bowel disease and perinatal factors: both
maternal and paternal disease are related to preterm birth of offspring. Inflamm Bowel Dis. 16
Bernstein, C.N., Banerjee, A., Targownik, L.E., Singh, H., Ghia, J.E., Burchill, C., Chateau, D.,
Roos, L.L. (2016) Cesarean Section Delivery Is Not a Risk Factor for Development of
Inflammatory Bowel Disease: A Population-based Analysis. Clin Gastroenterol Hepatol. 14, 50–
57.
Bianco-Miotto, T., Craig, J.M., Gasser, Y.P., van Dijk, S.J., Ozanne, S.E. (2017) Epigenetics and
DOHaD: from basics to birth and beyond. J Dev Orig Health Dis. 8, 513–519.
Borrelli, O., Cordischi, L., Cirulli, M., Paganelli, M., Labalestra, V., Uccini, S., Russo, P.M.,
Cucchiara, S. (2006) Polymeric diet alone versus corticosteroids in the treatment of active pediatric
Crohn’s disease: a randomized controlled open-label trial. Clin Gastroenterol Hepatol. 4, 744–
753.
Britton, G.J., Contijoch, E.J., Mogno, I., Vennaro, O.H., Llewellyn, S.R., Ng, R., Li, Z., Mortha,
A., Merad, M., Das, A., Gevers, D., McGovern, D.P.B., Singh, N., Braun, J., Jacobs, J.P.,
Clemente, J.C., Grinspan, A., Sands, B.E., Colombel, J.F., Dubinsky, M.C., Faith, J.J. (2019)
Microbiotas from Humans with Inflammatory Bowel Disease Alter the Balance of Gut Th17 and
RORγt+ Regulatory T Cells and Exacerbate Colitis in Mice. Immunity. 50, 212-224.
Bryant, R.V., Trott, M.J., Bartholomeusz, F.D., Andrews, J.M. (2013) Systematic review: body
composition in adults with inflammatory bowel disease. Aliment Pharmacol Ther. 38, 213–225.
Cameron, F.L., Gerasimidis, K., Papangelou, A., Missiou, D., Garrick, V., Cardigan, T.,
Buchanan, E., Barclay, A.R., McGrogan, P., Russell, R.K. (2013) Clinical progress in the two
years following a course of exclusive enteral nutrition in 109 paediatric patients with Crohn’s
disease. Aliment Pharmacol Ther. 37, 622–629.
Carr, I., Mayberry, J.F. (1999) The effects of migration on ulcerative colitis: a three-year
prospective study among Europeans and first- and second- generation South Asians in Leicester
(1991-1994). Am J Gastroenterol. 94, 2918–2922.

54
Cashman, K.D., Shanahan, F. (2003) Is nutrition an aetiological factor for inflammatory bowel
disease? Eur J Gastroenterol Hepatol. 15, 607–613.
Cezard, J.P., Touati, G., Alberti, C., Hugot, J.P., Brinon, C., Czernichow, P. (2002) Growth in
paediatric Crohn’s disease. Horm Res. 58 Suppl 1, 11–15.
Chan, S.S.M., Luben, R., Olsen, A., Tjonneland, A., Kaaks, R., Lindgren, S., Grip, O., Bergmann,
M.M., Boeing, H., Hallmans, G., Karling, P., Overvad, K., Venø, S.K., van Schaik, F., Bueno-de-
Mesquita, B., Oldenburg, B., Khaw, K.-T., Riboli, E., Hart, A.R. (2014) Association between high
dietary intake of the n-3 polyunsaturated fatty acid docosahexaenoic acid and reduced risk of
Crohn’s disease. Aliment Pharmacol Ther. 39, 834–842.
Cohen, L.J., Cho, J.H., Gevers, D., Chu, H. (2019) Genetic Factors and the Intestinal
Microbiome Guide Development of Microbe-Based Therapies for Inflammatory Bowel Diseases.
Gastroenterology. 156, 2174-2189.
Culman, S.W., Bukowski, R., Gauch, H.G., Cadillo-Quiroz, H., Buckley, D.H. (2009) T-REX:
software for the processing and analysis of T-RFLP data. BMC Bioinformatics 10, 171
D’Argenio, V., Precone, V., Casaburi, G., Miele, E., Martinelli, M., Staiano, A., Salvatore, F.,
Sacchetti, L. (2013) An Altered Gut Microbiome Profile in a Child Affected by Crohn’s Disease
Normalized After Nutritional Therapy. Am J Gastroenterol. 108, 851–852.
de Bie, C.I., Escher, J.C., de Ridder, L. (2012) Antitumor necrosis factor treatment for pediatric
inflammatory bowel disease. Inflamm Bowel Dis. 18, 985–1002.
de Bie, C.I., Paerregaard, A., Kolacek, S., Ruemmele, F.M., Koletzko, S., Fell, J.M.E., Escher,
J.C., EUROKIDS Porto IBD Working Group of ESPGHAN (2013) Disease phenotype at diagnosis
in pediatric Crohn’s disease: 5-year analyses of the EUROKIDS Registry. Inflamm Bowel Dis. 19,
378–385.
Desai, M.S., Seekatz, A.M., Koropatkin, N.M., Kamada, N., Hickey, C.A., Wolter, M., Pudlo,
N.A., Kitamoto, S., Terrapon, N., Muller, A., Young, V.B., Henrissat, B., Wilmes, P.,
Stappenbeck, T.S., Núñez, G., Martens, E.C. (2016) A Dietary Fiber-Deprived Gut Microbiota
Degrades the Colonic Mucus Barrier and Enhances Pathogen Susceptibility. Cell 167, 1339-
1353.e21.
Diederen, K., Krom, H., Koole, J.C.D., Benninga, M.A., Kindermann, A. (2018) Diet and
Anthropometrics of Children With Inflammatory Bowel Disease: A Comparison With the General
Population. Inflamm Bowel Dis. 24, 1632–1640.
Dohil, R., Hassall, E., Wadsworth, L.D., Israel, D.M. (1998) Recombinant human erythropoietin
for treatment of anemia of chronic disease in children with Crohn’s disease. J Pediatr. 132, 155–
159.
Duricova, D., Burisch, J., Jess, T., Gower-Rousseau, C., Lakatos, P.L., ECCO-EpiCom (2014)
Age-related differences in presentation and course of inflammatory bowel disease: an update on
the population-based literature. J Crohns Colitis 8, 1351–1361.

55
Dziechciarz, P., Horvath, A., Shamir, R., Szajewska, H. (2007) Meta-analysis: enteral nutrition in
active Crohn’s disease in children. Aliment Pharmacol Ther. 26, 795–806.
Emond, A.M., Blair, P.S., Emmett, P.M., Drewett, R.F. (2007) Weight faltering in infancy and IQ
levels at 8 years in the Avon Longitudinal Study of Parents and Children. Pediatrics 120, e1051-
1058.
Even Dar, R., Mazor, Y., Karban, A., Ish-Shalom, S., Segal, E. (2019) Risk Factors for Low Bone
Density in Inflammatory Bowel Disease: Use of Glucocorticoids, Low Body Mass Index, and
Smoking. Dig Dis. 37, 284–290.
Faiman, A., Mutalib, M., Moylan, A., Morgan, N., Crespi, D., Furman, M., Kader, A. (2014)
Standard versus rapid food reintroduction after exclusive enteral nutritional therapy in paediatric
Crohn’s disease. Eur J Gastroenterol Hepatol. 26, 276–281.
Fell, J.M.E. (2012) Update of the management of inflammatory bowel disease. Arch Dis Child.
97, 78–83.
Filippi, J., Al-Jaouni, R., Wiroth, J.-B., Hébuterne, X., Schneider, S.M. (2006) Nutritional
deficiencies in patients with Crohn’s disease in remission. Inflamm Bowel Dis. 12, 185–191
Firouzbakhsh, S., Mathis, R.K., Dorchester, W.L., Oseas, R.S., Groncy, P.K., Grant, K.E.,
Finklestein, J.Z. (1993) Measured Resting Energy Expenditure in Children. J Pediatr
Gastroenterol Nutr. 16, 136–142.
Fofanova, T.Y., Petrosino, J.F., Kellermayer, R. (2016) Microbiome-Epigenome Interactions and
the Environmental Origins of Inflammatory Bowel Diseases. J Pediatr Gastroenterol Nutr. 62,
208–219.
Forbes, A., Escher, J., Hébuterne, X., Kłęk, S., Krznaric, Z., Schneider, S., Shamir, R., Stardelova,
K., Wierdsma, N., Wiskin, A.E., Bischoff, S.C. (2017) ESPEN guideline: Clinical nutrition in
inflammatory bowel disease. Clin Nutr. 36, 321–347.
Fritz, J., Walia, C., Elkadri, A., Pipkorn, R., Dunn, R.K., Sieracki, R., Goday, P.S., Cabrera, J.M.
(2019) A Systematic Review of Micronutrient Deficiencies in Pediatric Inflammatory Bowel
Disease. Inflamm Bowel Dis. 25, 445–459.
Frivolt, K., Schwerd, T., Werkstetter, K.J., Schwarzer, A., Schatz, S.B., Bufler, P., Koletzko, S.
(2014) Repeated exclusive enteral nutrition in the treatment of paediatric Crohn’s disease:
predictors of efficacy and outcome. Aliment Pharmacol Ther. 39, 1398–1407.
Furusawa, Y., Obata, Y., Fukuda, S., Endo, T.A., Nakato, G., Takahashi, D., Nakanishi, Y.,
Uetake, C., Kato, K., Kato, T., Takahashi, M., Fukuda, N.N., Murakami, S., Miyauchi, E., Hino,
S., Atarashi, K., Onawa, S., Fujimura, Y., Lockett, T., Clarke, J.M., Topping, D.L., Tomita, M.,
Hori, S., Ohara, O., Morita, T., Koseki, H., Kikuchi, J., Honda, K., Hase, K., Ohno, H. (2013)
Commensal microbe-derived butyrate induces the differentiation of colonic regulatory T cells.
Nature 504, 446–450.

56
Gailhoustet, L., Goulet, O., Cachin, N., Schmitz, J. (2002) Study of psychological repercussions
of 2 modes of treatment of adolescents with Crohn’s disease. Arch Pediatr Organe Off Soc
Francaise Pediatr. 9, 110–116.
Galler, J.R., Ramsey, F. (1989) A Follow-up Study of the Influence of Early Malnutrition on
Development: Behavior at Home and at School. J Am Acad Child Adolesc Psychiatry 28, 254–
261.
Galler, J.R., Ramsey, F., Solimano, G., Lowell, W.E. (1983) The Influence of Early Malnutrition
on Subsequent Behavioral Development: II. Classroom Behavior. J Am Acad Child Psychiatry 22,
16–22.
Geerling, B.J., Badart-Smook, A., Stockbrügger, R.W., Brummer, R.J. (1998) Comprehensive
nutritional status in patients with long-standing Crohn disease currently in remission. Am J Clin
Nutr. 67, 919–926.
Gerasimidis, K., Bertz, M., Hanske, L., Junick, J., Biskou, O., Aguilera, M., Garrick, V., Russell,
R.K., Blaut, M., McGrogan, P., Edwards, C.A. (2014a) Decline in presumptively protective gut
bacterial species and metabolites are paradoxically associated with disease improvement in
pediatric Crohn’s disease during enteral nutrition. Inflamm Bowel Dis. 20, 861–871.
Gerasimidis, K., Edwards, C., Stefanowicz, F., Galloway, P., McGrogan, P., Duncan, A., Talwar,
D. (2013) Micronutrient status in children with inflammatory bowel disease. True deficiencies or
epiphenomenon of the systemic inflammatory response? J Pediatr Gastroenterol Nutr. 56, 50–51.
Gerasimidis, K., McGrogan, P., Edwards, C.A. (2011) The aetiology and impact of malnutrition
in paediatric inflammatory bowel disease. J Hum Nutr Diet Off J Br Diet Assoc. 24, 313–326.
Gerasimidis, K., Russell, R., Hansen, R., Quince, C., Loman, N., Bertz, M., Hanske, L., Blaut, M.,
McGrogan, P., Edwards, C.A. (2014b) Role of Faecalibacterium prausnitzii in Crohn’s Disease:
friend, foe, or does not really matter? Inflamm Bowel Dis. 20, E18-19.
Glassner, K.L., Abraham, B.P., Quigley, E.M.M. (2020) The microbiome and inflammatory
bowel disease. J Allergy Clin Immunol. 145, 16-27.
Gominak, S.C. (2016) Vitamin D deficiency changes the intestinal microbiome reducing B vitamin
production in the gut. The resulting lack of pantothenic acid adversely affects the immune system,
producing a “pro-inflammatory” state associated with atherosclerosis and autoimmunity. Med
Hypotheses. 94, 103–107.
Gower-Rousseau, C., Vasseur, F., Fumery, M., Savoye, G., Salleron, J., Dauchet, L., Turck, D.,
Cortot, A., Peyrin-Biroulet, L., Colombel, J.F. (2013) Epidemiology of inflammatory bowel
diseases: new insights from a French population-based registry (EPIMAD). Dig Liver Dis. 45, 89–
94.
Gubatan, J., Mitsuhashi, S., Zenlea, T., Rosenberg, L., Robson, S., Moss, A.C. (2017) Low Serum
Vitamin D During Remission Increases Risk of Clinical Relapse in Patients With Ulcerative
Colitis. Clin Gastroenterol Hepatol. 15, 240-246.e1.

57
Hart, J.W., Bremner, A.R., Wootton, S.A., Beattie, R.M. (2005) Measured versus predicted energy
expenditure in children with inactive Crohn’s disease. Clin Nutr. 24, 1047–1055.
Hartman, C., Eliakim, R., Shamir, R. (2009) Nutritional status and nutritional therapy in
inflammatory bowel diseases. World J Gastroenterol. 15, 2570–2578.
Hartman, C., Marderfeld, L., Davidson, K., Mozer-Glassberg, Y., Poraz, I., Silbermintz, A., Zevit,
N., Shamir, R. (2016) Food Intake Adequacy in Children and Adolescents With Inflammatory
Bowel Disease. J Pediatr Gastroenterol Nutr. 63, 437–444.
Hedin, C.R., van der Gast, C.J., Stagg, A.J., Lindsay, J.O., Whelan, K. (2017) The gut microbiota
of siblings offers insights into microbial pathogenesis of inflammatory bowel disease. Gut
Microbes. 8, 359–365.
Heuschkel, R.B., Menache, C.C., Megerian, J.T., Baird, A.E. (2000) Enteral nutrition and
corticosteroids in the treatment of acute Crohn’s disease in children. J Pediatr Gastroenterol Nutr.
31, 8–15.
Hojsak, I., Matic, K., Sila, S., Trivić, I., Mišak, Z., Kolaček, S. (2019) Characteristics of polymeric
formula and route of delivery of exclusive enteral nutrition have no effect on disease outcome and
weight gain in pediatric Crohn’s disease. Clin Nutr. 39, 1008-1111.
Hojsak, I., Pavić, A.M., Mišak, Z., Kolaček, S. (2014) Risk factors for relapse and surgery rate in
children with Crohn’s disease. Eur J Pediatr. 173, 617–621.
Holick, M.F. (2007) Vitamin D deficiency. N Engl J Med. 357, 266–281.
Hou, J.K., Abraham, B., El-Serag, H. (2011) Dietary intake and risk of developing inflammatory
bowel disease: a systematic review of the literature. Am J Gastroenterol. 106, 563–573.
Human Microbiome Project Consortium (2012) Structure, function and diversity of the healthy
human microbiome. Nature 486, 207–214.
Hwang, C., Ross, V., Mahadevan, U. (2012) Micronutrient deficiencies in inflammatory bowel
disease: from A to zinc. Inflamm Bowel Dis. 18, 1961–1981.
Hyams, J.S., Ferry, G.D., Mandel, F.S., Gryboski, J.D., Kibort, P.M., Kirschner, B.S., Griffiths,
A.M., Katz, A.J., Grand, R.J., Boyle, J.T. (1991) Development and validation of a pediatric
Crohn’s disease activity index. J Pediatr Gastroenterol Nutr. 12, 439–447.
Ivković, L., Hojsak, I., Trivić, I., Sila, S., Hrabač, P., Konjik, V., Senečić-Čala, I., Palčevski, G.,
Despot, R., Žaja, O., & Kolaček, S. (2020) Incidence and Geographical Variability of Pediatric
Inflammatory Bowel Disease in Croatia: Data From the Croatian National Registry for Children
With Inflammatory Bowel Disease. Clinical pediatrics. 59, 1182–1190.
Johnson, T., Macdonald, S., Hill, S.M., Thomas, A., Murphy, M.S. (2006) Treatment of active
Crohn’s disease in children using partial enteral nutrition with liquid formula: a randomised
controlled trial. Gut 55, 356–361.

58
Joossens, M., Huys, G., Cnockaert, M., Preter, V.D., Verbeke, K., Rutgeerts, P., Vandamme, P.,
Vermeire, S. (2011) Dysbiosis of the faecal microbiota in patients with Crohn’s disease and their
unaffected relatives. Gut 60, 631–637.
Jostins, L., Ripke, S., Weersma, R.K., Duerr, R.H., McGovern, D.P., Hui, K.Y., Lee, J.C.,
Schumm, L.P., Sharma, Y., Anderson, C.A., Essers, J., Mitrovic, M., Ning, K., Cleynen, I.,
Theatre, E., Spain, S.L., Raychaudhuri, S., Goyette, P., Wei, Z., Abraham, C., Achkar, J.-P.,
Ahmad, T., Amininejad, L., Ananthakrishnan, A.N., Andersen, V., Andrews, J.M., Baidoo, L.,
Balschun, T., Bampton, P.A., Bitton, A., Boucher, G., Brand, S., Büning, C., Cohain, A., Cichon,
S., D’Amato, M., De Jong, D., Devaney, K.L., Dubinsky, M., Edwards, C., Ellinghaus, D.,
Ferguson, L.R., Franchimont, D., Fransen, K., Gearry, R., Georges, M., Gieger, C., Glas, J.,
Haritunians, T., Hart, A., Hawkey, C., Hedl, M., Hu, X., Karlsen, T.H., Kupcinskas, L.,
Kugathasan, S., Latiano, A., Laukens, D., Lawrance, I.C., Lees, C.W., Louis, E., Mahy, G.,
Mansfield, J., Morgan, A.R., Mowat, C., Newman, W., Palmieri, O., Ponsioen, C.Y., Potocnik, U.,
Prescott, N.J., Regueiro, M., Rotter, J.I., Russell, R.K., Sanderson, J.D., Sans, M., Satsangi, J.,
Schreiber, S., Simms, L.A., Sventoraityte, J., Targan, S.R., Taylor, K.D., Tremelling, M.,
Verspaget, H.W., De Vos, M., Wijmenga, C., Wilson, D.C., Winkelmann, J., Xavier, R.J., Zeissig,
S., Zhang, B., Zhang, C.K., Zhao, H., International IBD Genetics Consortium (IIBDGC),
Silverberg, M.S., Annese, V., Hakonarson, H., Brant, S.R., Radford-Smith, G., Mathew, C.G.,
Rioux, J.D., Schadt, E.E., Daly, M.J., Franke, A., Parkes, M., Vermeire, S., Barrett, J.C., Cho, J.H.
(2012) Host-microbe interactions have shaped the genetic architecture of inflammatory bowel
disease. Nature 491, 119–124.
Kaakoush, N.O., Day, A.S., Leach, S.T., Lemberg, D.A., Nielsen, S., Mitchell, H.M. (2015) Effect
of Exclusive Enteral Nutrition on the Microbiota of Children With Newly Diagnosed Crohn’s
Disease. Clin Transl Gastroenterol. 6, e71.
Kabbani, T.A., Koutroubakis, I.E., Schoen, R.E., Ramos-Rivers, C., Shah, N., Swoger, J.,
Regueiro, M., Barrie, A., Schwartz, M., Hashash, J.G., Baidoo, L., Dunn, M.A., Binion, D.G.
(2016) Association of Vitamin D Level With Clinical Status in Inflammatory Bowel Disease: A
5-Year Longitudinal Study. Am J Gastroenterol. 111, 712–719.
Kaić-Rak, A., Antonić, K. (1990) Tablice o sastavu namirnica i pića. Zavod za zaštitu zdravlja SR
Hrvatske, 1st edition, Zagreb, Croatia.
Khalili, H., Huang, E.S., Ananthakrishnan, A.N., Higuchi, L., Richter, J.M., Fuchs, C.S., Chan,
A.T. (2012) Geographical variation and incidence of inflammatory bowel disease among US
women. Gut 61, 1686–1692.
Khor, B., Gardet, A., Xavier, R.J. (2011) Genetics and pathogenesis of inflammatory bowel
disease. Nature 474, 307–317.
Klement, E., Cohen, R.V., Boxman, J., Joseph, A., Reif, S. (2004) Breastfeeding and risk of
inflammatory bowel disease: a systematic review with meta-analysis. Am J Clin Nutr. 80, 1342–
1352.
59
Kolaček, S. (2009) Treatment Methods and Goals in Pediatric Malnutrition. Ann Nestlé. 67, 85–
93.
Kolaček, S., Hojsak, I. (2017) Chronic inflammatory bowel diseases in children – novelties in the
etiology, phenotype, diagnosis and treatment. Paediatr Croat. 61, 10–25.
Koletzko, B. (2004) Nutritional needs of children and adolescents. In: Sobotka L (ed). Basics in
Clinical Nutrition. Prague, Galén, 3rd ed,:45-55.
Kostic, A.D., Xavier, R.J., Gevers, D. (2014) The microbiome in inflammatory bowel disease:
current status and the future ahead. Gastroenterology 146, 1489–1499.
Kugathasan, S., Nebel, J., Skelton, J.A., Markowitz, J., Keljo, D., Rosh, J., LeLeiko, N., Mack, D.,
Griffiths, A., Bousvaros, A., Evans, J., Mezoff, A., Moyer, S., Oliva-Hemker, M., Otley, A.,
Pfefferkorn, M., Crandall, W., Wyllie, R., Hyams, J., Wisconsin Pediatric Inflammatory Bowel
Disease Alliance, Pediatric Inflammatory Bowel Disease Collaborative Research Group (2007)
Body mass index in children with newly diagnosed inflammatory bowel disease: observations
from two multicenter North American inception cohorts. J Pediatr. 151, 523–527.
Laakso, S., Valta, H., Verkasalo, M., Toiviainen-Salo, S., Viljakainen, H., Mäkitie, O. (2012)
Impaired bone health in inflammatory bowel disease: a case-control study in 80 pediatric patients.
Calcif Tissue Int. 91, 121–130.
Lambert, B., Lemberg, D.A., Leach, S.T., Day, A.S. (2012) Longer-Term Outcomes of Nutritional
Management of Crohn’s Disease in Children. Dig Dis Sci. 57, 2171–2177.
Lavoie, S., Conway, K. L., Lassen, K. G., Jijon, H. B., Pan, H., Chun, E., Michaud, M., Lang, J.
K., Gallini Comeau, C. A., Dreyfuss, J. M., Glickman, J. N., Vlamakis, H., Ananthakrishnan, A.,
Kostic, A., Garrett, W. S., & Xavier, R. J. (2019) The Crohn's disease polymorphism, ATG16L1
T300A, alters the gut microbiota and enhances the local Th1/Th17 response. eLife. 8, e39982.
Leach, S.T., Mitchell, H.M., Eng, W.R., Zhang, L., Day, A.S. (2008) Sustained modulation of
intestinal bacteria by exclusive enteral nutrition used to treat children with Crohn’s disease.
Aliment Pharmacol Ther. 28, 724–733.
Lee, D., Baldassano, R.N., Otley, A.R., Albenberg, L., Griffiths, A.M., Compher, C., Chen, E.Z.,
Li, H., Gilroy, E., Nessel, L., Grant, A., Chehoud, C., Bushman, F.D., Wu, G.D., Lewis, J.D.
(2015) Comparative Effectiveness of Nutritional and Biological Therapy in North American
Children with Active Crohn’s Disease. Inflamm Bowel Dis. 21, 1786–1793.
Levin, A.D., Wadhera, V., Leach, S.T., Woodhead, H.J., Lemberg, D.A., Mendoza-Cruz, A.C.,
Day, A.S. (2011) Vitamin D deficiency in children with inflammatory bowel disease. Dig Dis Sci.
56, 830–836.
Levine, A., Koletzko, S., Turner, D., Escher, J.C., Cucchiara, S., de Ridder, L., Kolho, K.-L.,
Veres, G., Russell, R.K., Paerregaard, A., Buderus, S., Greer, M.-L.C., Dias, J.A., Veereman-
Wauters, G., Lionetti, P., Sladek, M., Carpi, J.M. de, Staiano, A., Ruemmele, F.M., Wilson, D.C.

60
(2013) The ESPGHAN Revised Porto Criteria for the Diagnosis of Inflammatory Bowel Disease
in Children and Adolescents. J Pediatr Gastroenterol. 58, 795–806.
Levine, A., Sigall Boneh, R., Wine, E. (2018) Evolving role of diet in the pathogenesis and
treatment of inflammatory bowel diseases. Gut 67, 1726–1738.
Levine, A., Wine, E. (2013) Effects of Enteral Nutrition on Crohn’s Disease: Clues to the Impact
of Diet on Disease Pathogenesis. Inflamm Bowel Dis. 19, 1322–1329.
Levine, A., Wine, E., Assa, A., Sigall Boneh, R., Shaoul, R., Kori, M., Cohen, S., Peleg, S.,
Shamaly, H., On, A., Millman, P., Abramas, L., Ziv-Baran, T., Grant, S., Abitbol, G., Dunn, K.A.,
Bielawski, J.P., Van Limbergen, J. (2019) Crohn’s Disease Exclusion Diet Plus Partial Enteral
Nutrition Induces Sustained Remission in a Randomized Controlled Trial. Gastroenterology 157,
440-450.
Lewis, J.D., Chen, E.Z., Baldassano, R.N., Otley, A.R., Griffiths, A.M., Lee, D., Bittinger, K.,
Bailey, A., Friedman, E.S., Hoffmann, C., Albenberg, L., Sinha, R., Compher, C., Gilroy, E.,
Nessel, L., Grant, A., Chehoud, C., Li, H., Wu, G.D., Bushman, F.D. (2015) Inflammation,
Antibiotics, and Diet as Environmental Stressors of the Gut Microbiome in Pediatric Crohn’s
Disease. Cell Host Microbe 18, 489–500.
Li, F., Hullar, M.A.J., Lampe, J.W. (2007) Optimization of terminal restriction fragment
polymorphism (TRFLP) analysis of human gut microbiota. J Microbiol Methods. 68, 303–311.
Lim, W.-C., Hanauer, S.B., Li, Y.C. (2005) Mechanisms of disease: vitamin D and inflammatory
bowel disease. Nat Clin Pract Gastroenterol Hepatol. 2, 308–315.
Liu, J.Z., van Sommeren, S., Huang, H., Ng, S.C., Alberts, R., Takahashi, A., Ripke, S., Lee,
J.C., Jostins, L., Shah, T., Abedian, S., Cheon, J.H., Cho, J., Dayani, N.E., Franke, L., Fuyuno,
Y., Hart, A., Juyal, R.C., Juyal, G., Kim, W.H., Morris, A.P., Poustchi, H., Newman, W.G.,
Midha, V., Orchard, T.R., Vahedi, H., Sood, A., Sung, J.Y., Malekzadeh, R., Westra, H.J.,
Yamazaki, K., Yang, S.K., International Multiple Sclerosis Genetics Consortium, International
IBD Genetics Consortium, Barrett, J.C., Alizadeh, B.Z., Parkes, M., Bk, T., Daly, M.J., Kubo,
M., Anderson, C.A., Weersma, R.K. (2015) Association analyses identify 38 susceptibility loci
for inflammatory bowel disease and highlight shared genetic risk across populations. Nat Genet.
47, 979-986.
Loftus, E.V. (2004) Clinical epidemiology of inflammatory bowel disease: Incidence, prevalence,
and environmental influences. Gastroenterology 126, 1504–1517.
Long, M.D., Crandall, W.V., Leibowitz, I.H., Duffy, L., del Rosario, F., Kim, S.C., Integlia, M.J.,
Berman, J., Grunow, J., Colletti, R.B., Schoen, B.T., Patel, A.S., Baron, H., Israel, E., Russell, G.,
Ali, S., Herfarth, H.H., Martin, C., Kappelman, M.D., ImproveCareNow Collaborative for
Pediatric IBD (2011) Prevalence and epidemiology of overweight and obesity in children with
inflammatory bowel disease. Inflamm Bowel Dis. 17, 2162–2168.

61
Ludvigsson, J.F., Krantz, M., Bodin, L., Stenhammar, L., Lindquist, B. (2004) Elemental versus
polymeric enteral nutrition in paediatric Crohn’s disease: A multicentre randomized controlled
trial. Acta Paediatr. 93, 327–335.
MacLellan, A., Connors, J., Grant, S., Cahill, L., Langille, M.G.I., Van Limbergen, J. (2017) The
Impact of Exclusive Enteral Nutrition (EEN) on the Gut Microbiome in Crohn’s Disease: A
Review. Nutrients 9, 447.
Maconi, G., Ardizzone, S., Cucino, C., Bezzio, C., Russo, A.-G., Bianchi Porro, G. (2010) Pre-
illness changes in dietary habits and diet as a risk factor for inflammatory bowel disease: a case-
control study. World J Gastroenterol. 16, 4297–4304.
Malmborg, P., Hildebrand, H. (2016) The emerging global epidemic of paediatric inflammatory
bowel disease--causes and consequences. J Intern Med. 279, 241–258.
Mardinoglu, A., Wu, H., Bjornson, E., Zhang, C., Hakkarainen, A., Räsänen, S.M., Lee, S.,
Mancina, R.M., Bergentall, M., Pietiläinen, K.H., Söderlund, S., Matikainen, N., Ståhlman, M.,
Bergh, P.-O., Adiels, M., Piening, B.D., Granér, M., Lundbom, N., Williams, K.J., Romeo, S.,
Nielsen, J., Snyder, M., Uhlén, M., Bergström, G., Perkins, R., Marschall, H.-U., Bäckhed, F.,
Taskinen, M.-R., Borén, J. (2018) An Integrated Understanding of the Rapid Metabolic Benefits
of a Carbohydrate-Restricted Diet on Hepatic Steatosis in Humans. Cell Metab. 27, 559-571.e5.
Matsumoto, M., Sakamoto, M., Hayashi, H., Benno, Y. (2005) Novel phylogenetic assignment
database for terminal-restriction fragment length polymorphism analysis of human colonic
microbiota. J Microbiol Methods 61, 305–319.
Meister, D., Bode, J., Shand, A., Ghosh, S. (2002) Anti-inflammatory effects of enteral diet
components on Crohn’s disease-affected tissues in vitro. Dig Liver Dis. 34, 430–438.
Middleton, J.P., Bhagavathula, A.P., Gaye, B., Alvarez, J.A., Huang, C.S., Sauer, C.G., Tenjarla,
G., Schoen, B.T., Kumar, A., Prasad, M., Okou, D.T., Ifeadike, W.C., Dhere, T.A., Conneely,
K.N., Ziegler, T.R., Tangpricha, V., Kugathasan, S. (2013) Vitamin D Status and Bone Mineral
Density in African American Children with Crohn’s Disease. J Pediatr Gastroenterol Nutr. 57,
587-593.
Miele, E., Shamir, R., Aloi, M., Assa, A., Braegger, C., Bronsky, J., de Ridder, L., Escher, J.C.,
Hojsak, I., Kolaček, S., Koletzko, S., Levine, A., Lionetti, P., Martinelli, M., Ruemmele, F.,
Russell, R.K., Boneh, R.S., van Limbergen, J., Veereman, G., Staiano, A. (2018) Nutrition in
Paediatric Inflammatory Bowel Disease: A Position Paper on Behalf of The Porto IBD Group of
ESPGHAN. J Pediatr Gastroenterol Nutr. 66, 687-708.
Mocic Pavic, A., Detelic, D., Hojsak, I., Kolacek, S. (2015) Validation of a food frequency
questionnaire for adolescents in Croatia. J Pediatr Gastroenterol Nutr. 60, 835–836.
Ng, S.C., Tang, W., Leong, R.W., Chen, M., Ko, Y., Studd, C., Niewiadomski, O., Bell, S., Kamm,
M.A., de Silva, H.J., Kasturiratne, A., Senanayake, Y.U., Ooi, C.J., Ling, K.-L., Ong, D., Goh,
K.L., Hilmi, I., Ouyang, Q., Wang, Y.-F., Hu, P., Zhu, Z., Zeng, Z., Wu, K., Wang, X., Xia, B.,

62
Li, J., Pisespongsa, P., Manatsathit, S., Aniwan, S., Simadibrata, M., Abdullah, M., Tsang, S.W.C.,
Wong, T.C., Hui, A.J., Chow, C.M., Yu, H.H., Li, M.F., Ng, K.K., Ching, J., Wu, J.C.Y., Chan,
F.K.L., Sung, J.J.Y. (2015) Environmental risk factors in inflammatory bowel disease: a
population-based case-control study in Asia-Pacific. Gut. 64, 1063–1071.
Ni, J., Wu, G.D., Albenberg, L., Tomov, V.T. (2017) Gut microbiota and IBD: causation or
correlation? Nat Rev Gastroenterol Hepatol. 14, 573–584.
Nielsen, O.H., Rejnmark, L., Moss, A.C. (2018) Role of Vitamin D in the Natural History of
Inflammatory Bowel Disease. J Crohns Colitis. 12, 742–752.
Nishida, A., Inoue, R., Inatomi, O., Bamba, S., Naito, Y., Andoh, A. (2018) Gut microbiota in the
pathogenesis of inflammatory bowel disease. Clin J Gastroenterol. 11, 1–10.
Orrhage, K., Nord, C.E. (1999) Factors controlling the bacterial colonization of the intestine in
breastfed infants. Acta Paediatr Suppl. 88, 47–57.
Peloquin, J.M., Goel, G., Villablanca, E.J., Xavier, R.J. (2016) Mechanisms of Pediatric
Inflammatory Bowel Disease. Annu Rev Immunol. 34, 31–64.
Persson, P.G., Ahlbom, A., Hellers, G. (1992) Diet and inflammatory bowel disease: a case-control
study. Epidemiol Camb Mass 3, 47–52.
Peter Irving, Corey Siegel, David Rampton, Fergus Shanahan (2011) Clinical Dilemmas in
Inflammatory Bowel Disease: New Challenges, Second Edition, Wiley-Blackwell, New-York.
Pigneur, B., Lepage, P., Mondot, S., Schmitz, J., Goulet, O., Doré, J., Ruemmele, F.M. (2019)
Mucosal Healing and Bacterial Composition in Response to Enteral Nutrition Vs Steroid-based
Induction Therapy—A Randomised Prospective Clinical Trial in Children With Crohn’s Disease.
J Crohns Colitis. 13, 846–855.
Pigneur, B., Ruemmele, F.M. (2019) Nutritional interventions for the treatment of IBD: current
evidence and controversies. Ther Adv Gastroenterol. 12, 1-12.
Pituch-Zdanowska, A., Kowalska-Duplaga, K., Jarocka-Cyrta, E., Stawicka, A., Dziekiewicz, M.,
Banaszkiewicz, A. (2019) Dietary Beliefs and Behaviors Among Parents of Children with
Inflammatory Bowel Disease. J Med Food. 22, 817–822.
Pons, R., Whitten, K.E., Woodhead, H., Leach, S.T., Lemberg, D.A., Day, A.S. (2009) Dietary
intakes of children with Crohn’s disease. Br J Nutr. 102, 1052–1057.
Powrie F. (1995) T cells in inflammatory bowel disease: protective and pathogenic
roles. Immunity. 3, 171–174.
Powrie, F., Leach, M. W., Mauze, S., Menon, S., Caddle, L. B., & Coffman, R. L. (1994) Inhibition
of Th1 responses prevents inflammatory bowel disease in scid mice reconstituted with CD45RBhi
CD4+ T cells. Immunity. 1. 553–562.
63
Qin, J., Li, R., Raes, J., Arumugam, M., Burgdorf, K.S., Manichanh, C., Nielsen, T., Pons, N.,
Levenez, F., Yamada, T., Mende, D.R., Li, J., Xu, J., Li, Shaochuan, Li, D., Cao, J., Wang, B.,
Liang, H., Zheng, H., Xie, Y., Tap, J., Lepage, P., Bertalan, M., Batto, J.-M., Hansen, T., Le
Paslier, D., Linneberg, A., Nielsen, H.B., Pelletier, E., Renault, P., Sicheritz-Ponten, T., Turner,
K., Zhu, H., Yu, C., Li, Shengting, Jian, M., Zhou, Y., Li, Y., Zhang, X., Li, Songgang, Qin, N.,
Yang, H., Wang, Jian, Brunak, S., Doré, J., Guarner, F., Kristiansen, K., Pedersen, O., Parkhill, J.,
Weissenbach, J., Bork, P., Ehrlich, S.D., Wang, Jun (2010) A human gut microbial gene catalogue
established by metagenomic sequencing. Nature. 464, 59–65.
Quince, C., Ijaz, U.Z., Loman, N., Eren, A.M., Saulnier, D., Russell, J., Haig, S.J., Calus, S.T.,
Quick, J., Barclay, A., Bertz, M., Blaut, M., Hansen, R., McGrogan, P., Russell, R.K., Edwards,
C.A., Gerasimidis, K. (2015) Extensive Modulation of the Fecal Metagenome in Children With
Crohn’s Disease During Exclusive Enteral Nutrition. Am J Gastroenterol. 110, 1718–1729.
Racine, A., Carbonnel, F., Chan, S.S.M., Hart, A.R., Bueno-de-Mesquita, H.B., Oldenburg, B.,
van Schaik, F.D.M., Tjønneland, A., Olsen, A., Dahm, C.C., Key, T., Luben, R., Khaw, K.-T.,
Riboli, E., Grip, O., Lindgren, S., Hallmans, G., Karling, P., Clavel-Chapelon, F., Bergman, M.M.,
Boeing, H., Kaaks, R., Katzke, V.A., Palli, D., Masala, G., Jantchou, P., Boutron-Ruault, M.-C.
(2016) Dietary Patterns and Risk of Inflammatory Bowel Disease in Europe: Results from the
EPIC Study. Inflamm Bowel Dis. 22, 345–354.
Roberts, C.L., Rushworth, S.L., Richman, E., Rhodes, J.M. (2013) Hypothesis: Increased
consumption of emulsifiers as an explanation for the rising incidence of Crohn’s disease. J Crohns
Colitis. 7, 338–341.
Rodrigues, A.F., Johnson, T., Davies, P., Murphy, M.S. (2007) Does polymeric formula improve
adherence to liquid diet therapy in children with active Crohn’s disease? Arch Dis Child. 92, 767–
770.
Rodriguez-Palmero, M., Koletzko, B., Kunz, C., Jensen, R. (1999) Nutritional and biochemical
properties of human milk: II. Lipids, micronutrients, and bioactive factors. Clin Perinatol. 26,
335–359.
Rosen, C.J. (2011) Clinical practice. Vitamin D insufficiency. N Engl J Med. 364, 248–254.
Rosen, M.J., Dhawan, A., Saeed, S.A. (2015) Inflammatory Bowel Disease in Children and
Adolescents. JAMA Pediatr. 169, 1053–1060.
Rubio, A., Pigneur, B., Garnier‐Lengliné, H., Talbotec, C., Schmitz, J., Canioni, D., Goulet, O.,
Ruemmele, F.M. (2011) The efficacy of exclusive nutritional therapy in paediatric Crohn’s
disease, comparing fractionated oral vs. continuous enteral feeding. Aliment Pharmacol Ther. 33,
1332–1339.
Rudolf, M.C.J., Logan, S. (2005) What is the long term outcome for children who fail to thrive?
A systematic review. Arch Dis Child. 90, 925–931.
64
Ruel, J., Ruane, D., Mehandru, S., Gower-Rousseau, C., Colombel, J.-F. (2014) IBD across the
age spectrum—is it the same disease? Nat Rev Gastroenterol Hepatol. 11, 88–98.
Ruemmele, F.M., Veres, G., Kolho, K.L., Griffiths, A., Levine, A., Escher, J.C., Amil Dias, J.,
Barabino, A., Braegger, C.P., Bronsky, J., Buderus, S., Martín-de-Carpi, J., De Ridder, L.,
Fagerberg, U.L., Hugot, J.P., Kierkus, J., Kolacek, S., Koletzko, S., Lionetti, P., Miele, E., Navas
López, V.M., Paerregaard, A., Russell, R.K., Serban, D.E., Shaoul, R., Van Rheenen, P.,
Veereman, G., Weiss, B., Wilson, D., Dignass, A., Eliakim, A., Winter, H., Turner, D., European
Crohn’s and Colitis Organisation, European Society of Pediatric Gastroenterology, Hepatology
and Nutrition (2014) Consensus guidelines of ECCO/ESPGHAN on the medical management of
pediatric Crohn’s disease. J Crohns Colitis. 8, 1179–1207.
Sakamoto, M., Hayashi, H., Benno, Y. (2003) Terminal restriction fragment length polymorphism
analysis for human fecal microbiota and its application for analysis of complex bifidobacterial
communities. Microbiol Immunol 47, 133–142.
Salminen, S., Gibson, G.R., McCartney, A.L., Isolauri, E. (2004) Influence of mode of delivery
on gut microbiota composition in seven year old children. Gut. 53, 1388–1389.
Sawczenko, A., Ballinger, A.B., Savage, M.O., Sanderson, I.R. (2006) Clinical Features Affecting
Final Adult Height in Patients With Pediatric-Onset Crohn’s Disease. Pediatrics 118, 124–129.
Sawczenko, A., Sandhu, B.K. (2003) Presenting features of inflammatory bowel disease in Great
Britain and Ireland. Arch Dis Child. 88, 995–1000.
Schwerd, T., Frivolt, K., Clavel, T., Lagkouvardos, I., Katona, G., Mayr, D., Uhlig, H.H., Haller,
D., Koletzko, S., Bufler, P. (20169 Exclusive enteral nutrition in active pediatric Crohn disease:
Effects on intestinal microbiota and immune regulation. J Allergy Clin Immunol. 138, 592–596.
Sentongo, T.A., Semaeo, E.J., Stettler, N., Piccoli, D.A., Stallings, V.A., Zemel, B.S. (2002)
Vitamin D status in children, adolescents, and young adults with Crohn disease. Am J Clin Nutr.
76, 1077–1081.
Shaw, S.Y., Blanchard, J.F., Bernstein, C.N. (2013) Association between early childhood otitis
media and pediatric inflammatory bowel disease: an exploratory population-based analysis. J
Pediatr. 162, 510–514.
Shaw, S.Y., Blanchard, J.F., Bernstein, C.N. (2011) Association between the use of antibiotics and
new diagnoses of Crohn’s disease and ulcerative colitis. Am J Gastroenterol. 106, 2133–2142.
Shaw, S.Y., Blanchard, J.F., Bernstein, C.N. (2010) Association between the use of antibiotics in
the first year of life and pediatric inflammatory bowel disease. Am J Gastroenterol. 105, 2687–
2692.
Sheehan, D., Shanahan, F. (2017) The Gut Microbiota in Inflammatory Bowel Disease.
Gastroenterol. Clin North Am. 46, 143–154.

65
Shouval, D.S., Rufo, P.A. (2017) The Role of Environmental Factors in the Pathogenesis of
Inflammatory Bowel Diseases: A Review. JAMA Pediatr. 171, 999–1005.
Sigall-Boneh, R., Levine, A., Lomer, M., Wierdsma, N., Allan, P., Fiorino, G., Gatti, S., Jonkers,
D., Kierkuś, J., Katsanos, K.H., Melgar, S., Yuksel, E.S., Whelan, K., Wine, E., Gerasimidis, K.
(2017) Research Gaps in Diet and Nutrition in Inflammatory Bowel Disease. A Topical Review
by D-ECCO Working Group [Dietitians of ECCO]. J Crohns Colitis. 11, 1407–1419.
Sila, S., Trivić, I., Pavić, A. M., Niseteo, T., Kolaček, S., Hojsak, I. (2019) Nutritional status and
food intake in pediatric patients with inflammatory bowel disease at diagnosis significantly differs
from healthy controls. Eur J Pediatr. 178, 1519–1527.
Sila, S., Jelić, M., Trivić, I., Tambić Andrašević, A., Hojsak, I., & Kolaček, S. (2020) Altered Gut
Microbiota Is Present in Newly Diagnosed Pediatric Patients With Inflammatory Bowel Disease. J
Pediatr Gastroenterol Nutr. 70, 497–502.
Sila, S., Jelić, M., Trivić, I., Tambić Andrašević, A., Kolaček, S., & Hojsak, I. (2020) Healthy
Siblings of Children With Crohn's Disease Exhibit More Rapid Changes in Microbiota
Composition as a Response to Exclusive Enteral Nutrition. J Parenter Enteral Nutr.
10.1002/jpen.1981. Advance online publication.
Sokol, H., Langella, P. (20149 Beneficial effects of exclusive enteral nutrition in Crohn’s disease
are not mediated by Faecalibacterium prausnitzii. Inflamm Bowel Dis. 20, E18.
Sonnenburg, E.D., Smits, S.A., Tikhonov, M., Higginbottom, S.K., Wingreen, N.S., Sonnenburg,
J.L. (2016) Diet-induced extinction in the gut microbiota compounds over generations. Nature.
529, 212–215.
Strisciuglio, C., Giugliano, F., Martinelli, M., Cenni, S., Greco, L., Staiano, A., Miele, E. (2017)
Impact of Environmental and Familial Factors in a Cohort of Pediatric Patients With Inflammatory
Bowel Disease. J Pediatr Gastroenterol Nutr. 64, 569–574.
Svolos, V., Hansen, R., Nichols, B., Quince, C., Ijaz, U.Z., Papadopoulou, R.T., Edwards, C.A.,
Watson, D., Alghamdi, A., Brejnrod, A., Ansalone, C., Duncan, H., Gervais, L., Tayler, R.,
Salmond, J., Bolognini, D., Klopfleisch, R., Gaya, D.R., Milling, S., Russell, R.K., Gerasimidis,
K. (2019) Treatment of Active Crohn’s Disease With an Ordinary Food-based Diet That Replicates
Exclusive Enteral Nutrition. Gastroenterology. 156, 1354-1367.
Sýkora, J., Pomahačová, R., Kreslová, M., Cvalínová, D., Štych, P., Schwarz, J. (2018) Current
global trends in the incidence of pediatric-onset inflammatory bowel disease. World J
Gastroenterol. 24, 2741–2763.
Sylvester, F.A., Leopold, S., Lincoln, M., Hyams, J.S., Griffiths, A.M., Lerer, T. (2009) A two-
year longitudinal study of persistent lean tissue deficits in children with Crohn’s disease. Clin
Gastroenterol Hepatol. 7, 452–455.

66
Szilagyi, A., Galiatsatos, P., Xue, X. (2016) Systematic review and meta-analysis of lactose
digestion, its impact on intolerance and nutritional effects of dairy food restriction in inflammatory
bowel diseases. Nutr J. 15, 67-80.
Takahashi, K., Nishida, A., Fujimoto, T., Fujii, M., Shioya, M., Imaeda, H., Inatomi, O., Bamba,
S., Sugimoto, M., Andoh, A. (2016) Reduced Abundance of Butyrate-Producing Bacteria Species
in the Fecal Microbial Community in Crohn’s Disease. Digestion. 93, 59–65.
Theodoratou, E., Tzoulaki, I., Zgaga, L., Ioannidis, J.P.A., 2014. Vitamin D and multiple health
outcomes: umbrella review of systematic reviews and meta-analyses of observational studies and
randomised trials. BMJ. 348, 2035-2054.
Thomas, A.G., Taylor, F., Miller, V. (1993) Dietary intake and nutritional treatment in childhood
Crohn’s disease. J Pediatr Gastroenterol Nutr. 17, 75–81.
Torki, M., Gholamrezaei, A., Mirbagher, L., Danesh, M., Kheiri, S., Emami, M.H. (2015) Vitamin
D Deficiency Associated with Disease Activity in Patients with Inflammatory Bowel Diseases.
Dig Dis Sci. 60, 3085–3091.
Tsiountsioura, M., Wong, J.E., Upton, J., McIntyre, K., Dimakou, D., Buchanan, E., Cardigan, T.,
Flynn, D., Bishop, J., Russell, R.K., Barclay, A., McGrogan, P., Edwards, C., Gerasimidis, K.
(2014) Detailed assessment of nutritional status and eating patterns in children with
gastrointestinal diseases attending an outpatients clinic and contemporary healthy controls. Eur J
Clin Nutr. 68, 700–706.
Turner, D., Levine, A., Escher, J.C., Griffiths, A.M., Russell, R.K., Dignass, A., Dias, J.A.,
Bronsky, J., Braegger, C.P., Cucchiara, S., de Ridder, L., Fagerberg, U.L., Hussey, S., Hugot, J.-
P., Kolacek, S., Kolho, K.L., Lionetti, P., Paerregaard, A., Potapov, A., Rintala, R., Serban, D.E.,
Staiano, A., Sweeny, B., Veerman, G., Veres, G., Wilson, D.C., Ruemmele, F.M., European
Crohn’s and Colitis Organization, European Society for Paediatric Gastroenterology, Hepatology,
and Nutrition (2012) Management of pediatric ulcerative colitis: joint ECCO and ESPGHAN
evidence-based consensus guidelines. J Pediatr Gastroenterol Nutr. 55, 340–361.
Turner, D., Otley, A.R., Mack, D., Hyams, J., de Bruijne, J., Uusoue, K., Walters, T.D., Zachos,
M., Mamula, P., Beaton, D.E., Steinhart, A.H., Griffiths, A.M. (2007) Development, validation,
and evaluation of a pediatric ulcerative colitis activity index: a prospective multicenter study.
Gastroenterology. 133, 423–432.
Tysk, C., Lindberg, E., Järnerot, G., Flodérus-Myrhed, B. (1988) Ulcerative colitis and Crohn’s
disease in an unselected population of monozygotic and dizygotic twins. A study of heritability
and the influence of smoking. Gut. 29, 990–996.
Ungaro, R., Bernstein, C.N., Gearry, R., Hviid, A., Kolho, K.-L., Kronman, M.P., Shaw, S., Van
Kruiningen, H., Colombel, J.-F., Atreja, A. (2014) Antibiotics associated with increased risk of
new-onset Crohn’s disease but not ulcerative colitis: a meta-analysis. Am J Gastroenterol. 109,
1728–1738.

67
Vagianos, K., Bector, S., McConnell, J., Bernstein, C.N. (2007) Nutrition Assessment of Patients
With Inflammatory Bowel Disease. J Parenter Enter Nutr. 31, 311–319.
Verma, S., Brown, S., Kirkwood, B., Giaffer, M.H. (2000) Polymeric versus elemental diet as
primary treatment in active Crohn’s disease: a randomized, double-blind trial. Am J Gastroenterol.
95, 735–739.
Voitk, A.J., Echave, V., Feller, J.H., Brown, R.A., Gurd, F.N. (1973) Experience with elemental
diet in the treatment of inflammatory bowel disease. Is this primary therapy? Arch Surg. 107, 329–
333.
Wells, C.W., Lewis, S., Barton, J.R., Corbett, S. (2006) Effects of changes in hemoglobin level on
quality of life and cognitive function in inflammatory bowel disease patients. Inflamm Bowel Dis.
12, 123–130.
Wells, J.C.K., Williams, J.E., Chomtho, S., Darch, T., Grijalva-Eternod, C., Kennedy, K., Haroun,
D., Wilson, C., Cole, T.J., Fewtrell, M.S. (2012) Body-composition reference data for simple and
reference techniques and a 4-component model: a new UK reference child. Am J Clin Nutr. 96,
1316–1326.
White, J.H. (2018) Vitamin D deficiency and the pathogenesis of Crohn’s disease. J Steroid
Biochem Mol Biol. 175, 23–28.
WHO (2006) WHO child growth standards: length/height-for-age, weight-for-age, weight-for-
length, weight-for-height and body mass index-for-age ; methods and development. WHO – World
Health Organization, Geneva.
Wiecek, S., Wos, H., Winnicki, I., Komraus, M., Chlebowczyk, U. (2014) Disaccharidase activity
in children with inflammatory bowel disease. Turk J Gastroenterol. 25, 185–191.
Wild, C.P. (2012) The exposome: from concept to utility. Int J Epidemiol. 41, 24–32.
Wine, E. (2014) Should we be treating the bugs instead of cytokines and T cells? Dig Dis. 32, 403–
409.
Wiskin, A.E., Wootton, S.A., Cornelius, V.R., Afzal, N.A., Elia, M., Beattie, R.M. (2012) No
relation between disease activity measured by multiple methods and REE in childhood Crohn
disease. J Pediatr Gastroenterol Nutr. 54, 271–276.
Wiskin, A.E., Wootton, S.A., Culliford, D.J., Afzal, N.A., Jackson, A.A., Beattie, R.M. (2009)
Impact of disease activity on resting energy expenditure in children with inflammatory bowel
disease. Clin Nutr. 28, 652–656.
Yatsunenko, T., Rey, F.E., Manary, M.J., Trehan, I., Dominguez-Bello, M.G., Contreras, M.,
Magris, M., Hidalgo, G., Baldassano, R.N., Anokhin, A.P., Heath, A.C., Warner, B., Reeder, J.,
Kuczynski, J., Caporaso, J.G., Lozupone, C.A., Lauber, C., Clemente, J.C., Knights, D., Knight,
R., Gordon, J.I. (2012) Human gut microbiome viewed across age and geography. Nature. 486,
222–227.

68
Zachos, M., Tondeur, M., Griffiths, A.M. (2007) Enteral nutritional therapy for induction of
remission in Crohn’s disease. Cochrane Database Syst Rev. CD000542.
Zechner, E.L. (2017) Inflammatory disease caused by intestinal pathobionts. Curr Opin Microbiol.
35, 64–69.

69
Paper 1
Nutritional status and food intake in pediatric patients with
inflammatory bowel disease at diagnosis significantly differs
from healthy controls
European Journal of Pediatrics 178 (2019) 1519‐1527

70
Nutritional status and food intake in pediatric patients with inflammatory bowel disease at
diagnosis significantly differs from healthy controls
Sara Sila1*, Ivana Trivić1*, Ana Močić Pavić1*, Tena Niseteo1, Sanja Kolaček1,2, Iva Hojsak1,2,3
1Children’s Hospital Zagreb, Zagreb, Croatia
2University of Zagreb, School of Medicine, Zagreb, Croatia
3University J.J. Strossmayer, School of Medicine Osijek, Osijek, Croatia
* All authors contributed equally and share first authorship
Corresponding author
Iva Hojsak, MD, PhD,
Referral center for pediatric gastroenterology and nutrition
Children’s Hospital Zagreb
Klaićeva 16, 10000 Zagreb
Croatia
Phone: +38514600130; Fax: +38514600160
e-mail: [email protected]

71
ABSTRACT
Nutritional status and dietary intake in pediatric-onset inflammatory bowel disease are complex
and need to be further explored. Therefore, we have assessed anthropometric measures, body
composition, and dietary intake of newly diagnosed pediatric patients and compared them with
healthy controls. This was a prospective cross-sectional study including newly diagnosed patients
with inflammatory bowel disease (n=89) and healthy controls (n=159). Mean energy intake was
significantly higher in healthy controls compared to patients with ulcerative colitis, but not in
patients with Crohn's disease. Intake of all macronutrients, dietary fiber and calcium was
significantly lower in patients with ulcerative colitis, whereas only intake of animal protein, fruit,
and calcium differed significantly in patients with Crohn's disease. There were no significant
differences in the body fat percentage between patients with ulcerative colitis or Crohn's disease
vs. controls, however, lean mass-for-age z scores were significantly lower in patients with both
disease in comparison to controls.
Conclusion: Food intake of newly diagnosed pediatric patients with inflammatory bowel disease
significantly differed from healthy controls. Altered anthropometry and body composition are
present already at the time of diagnosis.
Key words inflammatory bowel disease, children, adolescents, diet, anthropometry
72
INTRODUCTION
Inflammatory bowel disease (IBD) is a group of chronic relapsing and remitting
inflammatory diseases of the alimentary tract, consisting of Crohn's disease (CD), ulcerative
colitis (UC) and, if undistinguishable, IBD-unclassified (IBD-U). Approximately a quarter of
patients with IBD present in childhood [1] and, according to a recent systematic survey, the
incidence and prevalence of pediatric-onset IBD is on the rise while the overall incidence of
IBD has stabilized [2]. The exact etiology of IBD has yet to be elucidated. Continued progress
has been made in identifying potential genetic risk factors. However, the genetic contribution
seems to be low (with the exception of monogenic IBD) compared to environmental risk
factors, among which dietary factors are receiving considerable attention [3]. Dietary factors
play a key role in child's growth and development, but they may also have an important role in
altering gut microbiota, metabolome, host barrier function and innate immunity, thus
contributing to the disease development [4].
In IBD malnutrition is a well-recognized condition, especially in children with CD in
whom linear growth failure often precedes gastrointestinal symptoms [5] and around two thirds
of them are underweight at the time of diagnosis [1]. Malnutrition is not only found in the acute
phases of CD [6] but has also been documented during clinical remission [7]. Symptoms of
IBD include, but are not limited to, abdominal pain, change in bowel habits, impaired general
well-being and malnutrition. The latter is often caused by suboptimal energy and nutrient
intake, malabsorption and increased energy requirements [8]. Even so, children with IBD are
affected by current population trends towards overweight and obesity [9]. A recent study reports
that up to 1/5 of children with CD and 1/3 of children with UC included in a multi-center
registry in the United States are overweight or obese during the follow up [10]. Abnormal
nutritional status is a result of complex pathophysiological processes such as, but not limited
to, genetic predisposition, inappropriate food intake, malabsorption, increase in basal

73
metabolism due to present inflammatory processes, disturbances of the growth
hormone/insulin-like growth factor axis and the use of drugs such as corticosteroids [11].
Current evidence across studies regarding the diet of adults with IBD has been rather
inconsistent [3] and the number of studies on the diet of children with IBD is even smaller [12-
16]. Moreover, the relationship between nutritional status and dietary intake in pediatric-onset
IBD is complex and needs to be further explored. Therefore, the aim of this study was to assess
the anthropometric measurements, body composition and data regarding dietary intake in
children and adolescents with newly diagnosed IBD and to compare that data to the age and sex
matched healthy controls.
METHODS
Study design
This was a prospective cross-sectional study. Newly diagnosed patients with IBD who
were diagnosed and treated in tertiary medical center (Children’s Hospital Zagreb) and healthy
controls were included into the study, provided they were 18 years of age or younger. Healthy
controls were matched by age, gender and area of residence. They were recruited from
randomly selected elementary and high schools in urban and rural area in Croatia that responded
positively to the invitation to participate in the study. Written consent was obtained from the
patients who were 9 years of age or older and one of their parents. In patients who were younger
than 9 years of age, written consent was obtained only from their parents or caregivers. As for
healthy controls, permission for the study was obtained from appropriate authorities, parents
were informed about the survey from the school principals, and their written consent was
obtained. Study was approved by Ethics Committee Children’s Hospital Zagreb (IRB number:
21102014).
The IBD diagnosis has been established according to the Porto criteria [17] and
localization was determined based on Paris classification [18]. Severity of the disease has been

74
estimated by the Pediatric Crohn’s disease activity index (PCDAI) and the Pediatric ulcerative
colitis activity index (PUCAI) [19,20]. Patients in whom, based on the dietary intake interview,
it was recognized that there was a recent significant change in the diet were excluded from the
study. Exclusion criteria in healthy controls included chronic illness or family history positive
for chronic intestinal diseases (celiac disease, IBD, gastrointestinal carcinoma).
Anthropometric measurements, body composition and food intake were measured in
patients and healthy controls.
Anthropometric measurements and body composition
Anthropometric measurements and body composition were assessed for each
participant. In children with IBD the measurements were made within 24 hours of the diagnosis.
The anthropometric assessment included measurements of body weight (BW), body height
(BH), middle upper arm circumference (MUAC), triceps skinfold thickness (TST), subscapular
skinfold thickness (SST) and handgrip strength (HS) and were measured by the same two
trained persons. BW was measured on an electronic scale with subjects being dressed in a light-
weight gym clothes. BH was measured with a portable stadiometer. TST and SST were
estimated using a Holtain skinfold caliper. Jamar hydraulic handgrip dynamometer was used to
estimate both right and left handgrip strength in children older than 6 years old.
Bioelectrical impedance was used to estimate subjects’ body composition (Maltron
BF906, Maltron International Ltd, Rayleigh, Essex, United Kingdom). Z-scores for BW, BH,
body mass index (BMI) and MUAC were estimated by the Growth Analyzer software. TSF and
SSF were estimated using CDC (Center for disease control and prevention) reference curves
[21]. Z-scores for lean mass (LM) were estimated using UK reference data for pediatric body
composition [22].
The nutritional status of participants was determined using the World Health
Organization (WHO) Growth reference data for children and adolescents (5-19 years) [23].

75
Estimated energy requirements for each child were calculated using Schofield equation.
Since data about physical activity hasn’t been collected, it was presumed that most of
participants had “light” physical activity level (PAL) [24].
Dietary intake
Information about food consumption was obtained at the time of diagnosis for all
included patients. In healthy controls, food consumption was estimated during late winter and
early spring. Food consumption was obtained using a Food Frequency Questionnaire (FFQ)
version which was previously validated for Croatian children and adolescents [25]. FFQ is a
tool that estimates frequency of consumption of different foods as well as their quantity. FFQ
that was used contained 87 different food items divided into 8 different food groups: ‘Milk and
milk products’, ‘Cereals and grains’, ‘Juices and sodas’, ‘Fruits’, ‘Vegetables’, ‘Snacks’, ‘Meat,
poultry, eggs and fat’ and ‘Fast food’. FFQ included frequently consumed national foods and
estimated frequency and quantity of consumption of food items in the last month. Available
frequencies of food consumption were: ‘never’, ‘1-3 times a month’, ‘once a week’, ‘2-4 times
per week’, ‘5-6 times per week’, ‘once a day’, ‘2-3 times per day’, ‘4-5 times per day’ or „’6+
times per day’. Available portion sizes were small, medium and large and simple portion sizes
photos were used to distinguish the former. The frequency of consumption was obtained in a
form of a personal interview with trained interviewers, with the presence of the caregivers (in
children younger than 12 years of age) or without their presence in older participants.
The individual food records data obtained by the FFQ were analyzed by Microsoft
Office Excel 2007 worksheet that was generated by using a combination of USDA [26] and
Kaić-Rak et al. [27] food composition databases. Approximately 10 minutes were taken to
administer the FFQ for each participant by a trained interviewer. The frequency of consumption
of food items was multiplied by the portion size to calculate the amount of nutrients consumed

76
in a 30-day period, from which an average daily energy and nutrient intake per each participant
were calculated.
Statistics
The differences between categorical variables were assessed by chi-square test. The
differences for non-categorical variables were assessed by one-way ANOVA followed by
Bonferroni test for post hoc analysis. Pearson correlation was performed in order to assess
correlation between nutritional status and body composition and food intake. P values less than
0.05 were considered significant. Statistical analysis was performed using SPSS 19.0 (IBM
Corporation, Chicago, Illinois, United States of America) statistical software.
RESULTS
Patient characteristics
Table 1 summarizes baseline characteristics of enrolled participants. Overall, there were
89 patients with newly diagnosed IBD and 159 healthy controls included into the study. Of
those, 49 (55%) patients were affected by CD and 40 (45%) by UC. No significant difference
in age was found between the CD patients, UC patients and healthy controls (mean age: 14.6 ±
2.6 years for CD; 14.0 ± 3.7 years for UC; 14.7 ± 2.3 years for healthy controls; p=0.349).
Based on PCDAI/PUCAI scoring, 54 patients (63.5%) had mild disease and 31 patients (36.5%)
had moderate to severe disease at the time of diagnosis.
Table 1. Baseline characteristics of enrolled patients.
CD (n=49) UC (n=40) Healthy controls
(n=159)
Age, mean (SD) 14.6 (2.6) 14.0 (3.7) 14.7 (2.3)
Male, n (%) 29 (59.2) 23 (57.5) 80 (50.3)
BW, mean (SD) 51.5 (14.6) 51.0 (16.8) 59.0 (14.2)

77
BH, mean (SD) 163.2 (14.7) 161.1 (18.7) 167.4 (11.9)
BMI, mean (SD) 19.6 (2.8) 18.2 (2.8) 20.7 (3.2)
Duration of symptoms in
months, mean (SD)
7.6 (2.1) 4.2 (1.0) -
Localization of the
disease*
L1 (ileal): 12
(24.5%)
L2 (colonic): 6
(12.2%)
L3 (ileocolonic): 31
(63.3%)
L4 (additional upper
gastrointestinal
disease): 18 (36.7%)
E1 (proctitis): 1
(2.5%)
E2 (left sided): 8
(20%)
E3 (extensive): 5
(12.5%)
E4 (pancolitis): 26
(65%)
-
BM – body weight; BH – body height; BMI – body mass index; SD-standard deviation
*Paris classification of the inflammatory bowel disease [17].
Anthropometric measurements and body composition
BMI z-score was used to estimate nutritional status of all participants. Nutritional status
of newly diagnosed IBD patients and healthy controls is shown in Figure 1. Overall, 32.6% of
CD-patients and 25% of UC-patients were malnourished according to the WHO criteria (22).
Overweight was found in 16.3% and 17.5% of CD and UC patients, respectively. None of the
patients were obese. Only 4 (4.5%) IBD patients were stunted (BH-for-age z-score <-2SD), of
whom 3 were CD patients.

78
Figure 1. Comparison of nutritional status according to WHO criteria between IBD patients and
healthy controls.
There was a significant difference in BW-for-age, BMI-for-age and basal metabolic rate
(BMR) but not for triceps- and subscapular skinfold thickness between both CD patients and
UC patients vs. healthy controls (Table 2). Significant difference in BH-for-age z-score and
MUAC-for-age z-score was found only between CD patients vs. healthy controls. There was
no significant difference in any of anthropometric measures between CD and UC patients.
As for body composition estimated by bioelectrical impedance, there was no statistically
significant difference in body fat percentage between CD and UC patients vs. healthy controls.
However, both CD and UC patients had significantly lower lean mass-for-age z-scores
compared to healthy controls (Table 2.)

79
Table 2. Difference in anthropometric characteristics between CD patients, UC patients and
healthy controls.
CD (n=49) UC (n=40) Healthy controls
(n=159)
p-value
BW-for-age, mean (SD) -0,5 (1,2) -0,2 (1,1) 0.3 (1.1) <0.001*
BH-for-age, mean (SD) -0,5 (1,0) -0,2 (0,9) 0.0 (1.0) 0.013**
BMI-for-age, mean (SD) -0,4 (1,3) -0,2 (1,2) 0.4 (1.1) <0.001*
EER (kj), mean (SD) 8743.0
(1524.8)
8694.7 (1744.3) 9451.3 (1602.6) 0.003*
MUAC-for-age, mean
(SD)
-0,7 (1,0) -0,5 (0,8) -0.3 (0.8) 0.009**
Triceps skinfold thickness-
for-age, mean (SD)
0,8 (0,8) 0,7 (0,9) 0.8 (0.7) 0.871
Subscapular skinfold
thickness-for-age, mean
(SD)
0,7 (0,8) 0,7 (0,6) 0.7 (0.8) 0.998
Handgrip strength
Right hand (kg),
mean (SD)
20.2 (9.9) 20.7 (14.1) 25.3 (9.3) 0.006**
Left hand (kg),
mean (SD)
17.9 (9.9) 16.3 (9.7) 23.2 (8.6) <0.001*
Body fat %, mean (SD) 19.3 (7.6) 18.5 (7.6) 20.7 (7.7) 0.239

80
BMR (kcal), mean (SD) 1438.1
(315.3)
1469.4 (301.9) 1598.4 (237.3) 0.001
Lean mass-for-age, mean
(SD)
0.2 (1.4) 0.4 (1.2) 1.2 (1.4) <0.001*
BM – body weight; BH – body height; BMI – body mass index; EER – estimated energy
requirements; MUAC – middle upper arm circumference; BMR – basal metabolic rate; SD-
standard deviation
Post hoc analysis: *p<0.05 for CD and UC vs. healthy controls; **p<0.05 for CD vs. healthy
controls
There was no association between duration of symptoms and anthropometric measures
or body composition. Similarly, nutritional status did not significantly differ depending on the
disease severity estimated by PUCAI/PCDAI score.
Dietary intake
The mean energy intake differed significantly between UC patients and healthy controls
(7780.9 ± 2774.5 kj; 10198.3 ± 4409.5 kj; p=0.003), but not CD patients (8915.4 ± 3377.6 kj;
10198.3 ± 4409.5 kj; p=0.202). On average, CD patients satisfied 90 ± 52.8%, UC patients 86.6
± 39.6% and healthy controls 109.3 ± 45.9% of their estimated energy requirements.
Lower intake of all macronutrients and dietary fiber has been found between UC patients
vs. healthy controls (Table 3). In CD patients, significant difference was found only for animal
proteins when compared to healthy controls (46.0 ± 21.5 g in CD; 57.2 ± 27.4 g in healthy
controls; p=0.037). There was no difference in energy and macronutrient intake between UC
and CD patients.
Table 3 shows the mean intake of micronutrients. When compared to healthy controls,
there was no significant difference in intake of most micronutrients, except for intake of
phosphorus and calcium between CD and UC patients vs. healthy controls and for iron and zinc
in UC patients vs. healthy controls.

81
When contributions of different food groups to total energy intake were estimated, a
difference was found for intake of fruits in CD patients compared to healthy controls. The
contribution of other food groups to total energy intake did not differ significantly (Table 3).
Table 3. Difference in nutritional intake between CD patients, UC patients and healthy
controls.
CD (n=49) UC (n=40) Healthy
controls
(n=159)
p-value
Energy intake (kj), mean (SD) 8915.4
(3377.6)
7780.9
(2774.5)
10198.3
(4409.5)
0.002***
% EER (%), mean (SD) 90.0 (52.8) 86.6 (39.6) 109.3 (45.9) 0.004*
Total proteins (g), mean (SD) 92.4 (33.3) 83.5 (31.6) 107.1 (43.8) 0.002***
Vegetable proteins (g), mean
(SD)
25.7 (11.1) 23.6 (8.7) 29.0 (14.3) 0.043
Animal proteins (g), mean
(SD)
46.0 (21.5) 43.7 (20.7) 57.2 (27.4) 0.002*
Total fat (g), mean (SD) 102.1 (45.9) 81.1 (31.1) 108.1 (52.9) 0.010***
Saturated fat (g), mean (SD) 35.9 (17.3) 30.3 (13.8) 43.6 (22.0) 0.001***
Unsaturated fat (g), mean (SD) 31.9 (14.5) 25.6 (10.7) 54.0 (27.2) 0.006***
Total carbohydrates (g), mean
(SD)
252.7 (100.8) 228.7 (85.1) 292.9 (133.9) 0.007***
Mono- and disaccharides (g),
mean (SD)
107.8 (62.3) 98.5 (51.8) 131.3 (59.3) 0.002***
Fibers (g), mean (SD) 21.8 (9.2) 20.8 (8.0) 25.8 (12.3) 0.014***

82
Calcium (mg), mean (SD) 765.1 (399.7) 766.6 (385.1) 987.4 (446.2) 0.001*
Magnesium (mg), mean (SD) 247.3 (193.3) 219.1 (123.5) 279.5 (160.4) 0.091
Phosphorus (mg), mean (SD) 1455.7
(521.1)
1364.9 (508.3) 1742.2 (674.1) 0.001*
Iron (mg), mean (SD) 13.2 (5.5) 11.3 (4.5) 14.7 (6.4) 0.005***
Zinc (mg), mean (SD) 8.6 (3.9) 7.3 (3.5) 8.9 (3.6) 0.047***
Proteins (% EI), mean (SD) 17.3 (2.8) 17.9 (2.8) 17.7 (2.5) 0.622
Carbohydrates (% EI), mean
(SD)
46.5 (7.1) 48.8 (5.6) 47.6 (7.5) 0.355
Fat (% EI), mean (SD) 41.8 (7.0) 38.7 (5.7) 39.0 (6.8) 0.044
Fruits (%EI), mean (SD) 3.3 (3.9) 5.2 (5.3) 6.2 (4.7) 0.002**
Vegetables (%EI), mean (SD) 3.7 (1.7) 4.2 (2.0) 3.8 (2.3) 0.535
Juices and sodas (%EI), mean
(SD)
5.2 (4.0) 5.2 (3.9) 4.9 (4.0) 0.814
Snacks (%EI), mean (SD) 10.8 (9.9) 8.7 (6.2) 9.9 (6.6) 0.444
Fast food (%EI), mean (SD) 13.5 (6.9) 11.3 (4.2) 13.0 (6.3) 0.246
EI – energy intake
Post hoc analysis: *p<0.05 for CD and UC vs. healthy controls; **p<0.05 for CD vs. healthy
controls; ***p<0.05 for UC vs. healthy controls.
There was no association between duration of symptoms and dietary intake in both CD
and UC patients.
Pearson correlation revealed no significant correlation in BMI z-score, lean mass-for-
age z-scores, and TST and dietary intake (total energy and micronutrient intake). A positive
correlation was found for SST and total energy (correlation coefficient 0.282, p=0.015), total
carbohydrates (correlation coefficient 0.252, p=0.026), total protein (correlation coefficient
0.282, p=0.012) and total fat (correlation coefficient 0.275, p=0.015) intake.

83
DISCUSSION
This study is, best to our knowledge, the first study which investigated food intake at
diagnosis of pediatric patients with IBD compared to healthy controls and showed lower intake
in energy and all macronutrients in IBD patients. This difference was mainly contributed to UC
patients.
Energy and macronutrient intake
Previously, studies have looked into dietary intake of IBD patients [12-16,28]. However,
these studies have assessed dietary intake in children and adolescents with already established
disease, which was both active and in relapse [14,12,13,15,16]. One study estimated
consumption of food items of newly diagnosed IBD patients over a past year (using a yearly
FFQ) and did not include a control group [28]. Results of all previously published studies are
not unified; study by Hartman et al. [13], found that patients with active and inactive IBD had
lower intake of energy, carbohydrates and dietary fiber in comparison with healthy Israeli
children. However, this study did not stratify patients by disease type. Diederen et al. [15]
included CD, UC and IBD-U patients, of which 46% had active disease. Energy intake and total
carbohydrate intake in all IBD patients was lower, while intake of vegetable proteins and total
fat intake was higher compared to the reference population. When distributed by the type of
IBD, energy intake of CD patients was lower compared to that of general population, while UC
patients did not significantly differ from the reference population. These results are opposite to
ours, where patients with UC had lowest energy and macronutrients consumption. This
difference could be at least partially explained by the acute symptoms (bloody diarrhea and
abdominal cramps) at the time of the UC diagnosis. The acute symptoms could cause the
restriction in the food intake and increase the likelihood of restrictive diet introduction.
However, it should be noted that in the study by Diederen et al. [15], dietary intake of IBD
patients was estimated using FFQ, while dietary intake of reference population was estimated

84
by 24-hour recalls. Interestingly, studies mentioned above did not find difference in
macronutrient intake when stratified by the disease activity, meaning that restriction was noted
also in patients who were in the clinical remission [13,15]. Opposite to that, in an older study
by Pons et al. [12], total energy and all macronutrient intake were lower in children with active
CD, compared with children with CD in remission and controls. In our cohort, neither disease
activity nor duration of symptoms was associated with dietary intake. This could be related to
our relatively coherent population of patients, in whom PCDAI/PUCAI scoring was fairly
similar as well as duration of the disease.
Micronutrient intake
As for micronutrients, lower intakes of calcium, iron and zinc in UC patients and of calcium
in CD patients were detected in our study. Results of other studies have shown mixed results.
In a study by Thomas et al. [14] where food diary records were used to estimate dietary intake,
intake of iron and zinc in CD patients in relapse was significantly lower compared to controls.
Using the same methods as Thomas et al. [14], Hartman et al. [13] detected lower intakes of
calcium in Israeli IBD patients. Pons et al. [12] have used FFQ to estimate nutritional intake
and haven't detected lower intakes of calcium in CD patients compared to controls. In addition
to the IBD itself, low calcium intake has been described as a risk factor for fractures among
adult IBD patients [29]. Additional to low calcium intake, risk of developing osteoporosis in
IBD patients is related to malnutrition, altered absorption of nutrients, lower physical activity
and due to administration of corticosteroids amongst others [30]. IBD patients are prone to
reduce the intake of milk and milk products for fear of lactose consumption [31]. Although this
could be a plausible explanation, we do not know whether this was a case in our cohort.
Intake of different food groups
Although this study was not designed to assess causality of different diets and IBD, we
confirmed a lower contribution of fruits to total energy intake in CD patients compared to

85
healthy controls. Opposite to ours, Diederen et al. [15] have found higher intakes of vegetable
and fruit in children with IBD, but as previously mentioned, those were the patients with
established diagnosis and, thus, could be advised during their treatment to increase the intake
of “healthy foods” like fruits and vegetables. Regarding our study, we could speculate that
patients with CD avoided fruit intake due to active symptoms of their disease, however this is
highly unlikely since intake of other nutrients and food groups (vegetables, soda and juices,
snacks and fast food) did not differ from that of healthy population.
Anthropometry measurements and body composition
As reported by others, our study found significant difference in anthropometric
measurements and lean mass between CD and UC patients vs. healthy controls. One of the most
prominent presenting features of IBD includes malnutrition [32]. In our cohort, 10.2% of CD
and 10% of UC patients were undernourished (Z-score <-2 SD) at the time of diagnosis.
Compared to ours, in the French cohort, even 32% of pediatric patients with CD had BMI z-
score <-2 SD at the time of diagnosis [33], similar to the results of El Mouzan et al. [34] where
35% of CD and 24% of UC patients had BMI z-score <-2 SD. Contrary to undernutrition, 16.3%
of CD and 17.5% of UC patients in our cohort had BMI z-score >1 SD, similar to that of general
population [35]. Our results are comparable to the results of other countries [34,9]. Whether the
lower proportion of undernourished patients in our cohort is a result of overall increase in the
BMI of general population that can influence the BMI at the diagnosis is yet to be determined.
Some studies suggested a possible shared environmental link between the increase in the IBD
and obesity incidence. Moreover, it was also observed that obesity might impact disease
development and response to therapy in patients with IBD [36]. It has been emphasized recently
that assessing body composition, rather than simple anthropometric changes, gives a much
better indication of nutritional status in all chronic diseases as well as in IBD [37]. In our cohort,
despite having lower BMI-for-age z-scores compared to healthy controls, both CD and UC
86
patients had significantly lower z-scores for lean body mass while having same body fat
percentage. That clearly confirms that BMI is not an ideal marker of body composition in
children with IBD. Similarly, Burnham et al. [37] reported fat mass adjusted for age and fat
mass adjusted for height that was not significantly different from controls. Furthermore, in our
cohort, no difference in skinfold thickness has been found in IBD patients compared to healthy
controls, which could be explained by higher body fat percentage in relation to total body mass
in these children. Comparable to ours, in their study, Wiskin et al. [38] found lower values of
proxies for lean tissue but not for fat only in children with CD, and not in those with UC. Our
results together with previously published studies indicate that nutritional assessment should
not be solely based on anthropometric measures and should include estimation of body
composition. Interestingly, in our cohort, symptoms duration and disease activity were not
associated with anthropometric measures and body composition, which could be related to our
relatively coherent population of patients. Furthermore, this study has found that only SST, but
not TST, BMI and lean mass-for-age z score, positively correlates with total energy and all
macronutrients intake in IBD patients. This could indicate that higher energy intake was
associated with more truncal deposition of body fat even in children with IBD.
Our study has several limitations mainly related to the relatively small sample size and
usage of FFQ for estimation of dietary intake. For more accurate nutritional intake, 3-day food
diary would be more appropriate. However, FFQ used in this study was compared and correlates
strongly with the results of a 3-day nutritional intake diary [25]. Nevertheless, this study
compared newly diagnosed patients with IBD and healthy matched controls, and as previously
mentioned, for the first time provides an insight into the nutritional intake in patients with newly
diagnosed IBD.
In conclusion, this study showed significantly lower intake of energy, macronutrients and
various micronutrients in patients with UC compared to healthy controls, while patients with

87
CD had lower intake of fruits, calcium and animal protein. Furthermore, altered anthropometry,
and more importantly, body composition in both CD and UC patients, at the diagnosis has been
shown. This study indicates that specific nutritional interventions should be implemented early
after diagnosis, since malnutrition and its consequences are often seen in pediatric IBD patients.
Furthermore, IBD patients are prone to unnecessary restrictions in their diets, which can further
deteriorate their nutritional status. This study contributes to the still scarce literature on diet and
anthropometry in pediatric patients with IBD.

88
Funding: This study was part of a research project IP-2014-09-3788 funded by Croatian
Science Foundation.
Conflict of Interest: Iva Hojsak received payment/honorarium for lectures or consultation
from BioGaia, Nutricia, Nestle, GM pharma, Chr Hansen, Sanja Kolaček received fees for
lectures from Abbott, AbbVie, Fresenius, Mead and Johnson, Nestle, Nutricia, Oktal Pharma.
Tena Niseteo received fee for lectures from 4U Pharma. Sara Sila, Ivana Trivić and Ana
Močić Pavić declare no conflict of interest.
Ethical approval: All procedures performed in studies involving human participants were in
accordance with the ethical standards of the institutional ethics committee and with the 1964
Helsinki declaration and its later amendments or comparable ethical standards.
Study was approved by Ethics Committee Children’s Hospital Zagreb (IRB number:
21102014).
Informed consent: Informed consent was obtained from all individual participants and at least
one of their parents included in the study.
Acknowledgments: We thank Professor Mary Fewtrell for her kind help in the calculation of
SD scores for lean mass in our patients and healthy controls, with the new UK reference data
for pediatric body composition developed as a part of her research.

89
REFERENCES
1. Sawczenko A, Sandhu BK, Logan RF, Jenkins H, Taylor CJ, Mian S, Lynn R (2001)
Prospective survey of childhood inflammatory bowel disease in the British Isles. Lancet 357
(9262):1093-1094
2. Ng SC, Shi HY, Hamidi N, Underwood FE, Tang W, Benchimol EI, Panaccione R, Ghosh
S, Wu JCY, Chan FKL, Sung JJY, Kaplan GG (2018) Worldwide incidence and prevalence of
inflammatory bowel disease in the 21st century: a systematic review of population-based
studies. Lancet 390 (10114):2769-2778. doi:10.1016/S0140-6736(17)32448-0
3. Amre DK, D'Souza S, Morgan K, Seidman G, Lambrette P, Grimard G, Israel D, Mack D,
Ghadirian P, Deslandres C, Chotard V, Budai B, Law L, Levy E, Seidman EG (2007)
Imbalances in dietary consumption of fatty acids, vegetables, and fruits are associated with
risk for Crohn's disease in children. Am J Gastroenterol 102 (9):2016-2025.
doi:10.1111/j.1572-0241.2007.01411.x
4. Levine A, Sigall Boneh R, Wine E (2018) Evolving role of diet in the pathogenesis and
treatment of inflammatory bowel diseases. Gut 67 (9):1726-1738. doi:10.1136/gutjnl-2017-
315866
5. Hildebrand H, Karlberg J, Kristiansson B (1994) Longitudinal growth in children and
adolescents with inflammatory bowel disease. J Pediatr Gastroenterol Nutr 18 (2):165-173
6. Jakobsen C, Paerregaard A, Munkholm P, Faerk J, Lange A, Andersen J, Jakobsen M,
Kramer I, Czernia-Mazurkiewicz J, Wewer V (2011) Pediatric inflammatory bowel disease:
increasing incidence, decreasing surgery rate, and compromised nutritional status: A
prospective population-based cohort study 2007-2009. Inflamm Bowel Dis 17 (12):2541-
2550. doi:10.1002/ibd.21654

90
7. Filippi J, Al-Jaouni R, Wiroth JB, Hebuterne X, Schneider SM (2006) Nutritional
deficiencies in patients with Crohn's disease in remission. Inflamm Bowel Dis 12 (3):185-191.
doi:10.1097/01.MIB.0000206541.15963.c3
8. Hyams JS (2005) Inflammatory bowel disease. Pediatr Rev 26 (9):314-320.
doi:10.1542/pir.26-9-314
9. Kugathasan S, Nebel J, Skelton JA, Markowitz J, Keljo D, Rosh J, LeLeiko N, Mack D,
Griffiths A, Bousvaros A, Evans J, Mezoff A, Moyer S, Oliva-Hemker M, Otley A,
Pfefferkorn M, Crandall W, Wyllie R, Hyams J, Wisconsin Pediatric Inflammatory Bowel
Disease A, Pediatric Inflammatory Bowel Disease Collaborative Research G (2007) Body
mass index in children with newly diagnosed inflammatory bowel disease: observations from
two multicenter North American inception cohorts. J Pediatr 151 (5):523-527.
doi:10.1016/j.jpeds.2007.04.004
10. Long MD, Crandall WV, Leibowitz IH, Duffy L, del Rosario F, Kim SC, Integlia MJ,
Berman J, Grunow J, Colletti RB, Schoen BT, Patel AS, Baron H, Israel E, Russell G, Ali S,
Herfarth HH, Martin C, Kappelman MD, ImproveCareNow Collaborative for Pediatric IBD
(2011) Prevalence and epidemiology of overweight and obesity in children with inflammatory
bowel disease. Inflamm Bowel Dis 17 (10):2162-2168. doi:10.1002/ibd.21585
11. Gerasimidis K, McGrogan P, Edwards CA (2011) The aetiology and impact of
malnutrition in paediatric inflammatory bowel disease. J Hum Nutr Diet 24 (4):313-326.
doi:10.1111/j.1365-277X.2011.01171.x
12. Pons R, Whitten KE, Woodhead H, Leach ST, Lemberg DA, Day AS (2009) Dietary
intakes of children with Crohn's disease. Br J Nutr 102 (7):1052-1057.
doi:10.1017/S0007114509359085
13. Hartman C, Marderfeld L, Davidson K, Mozer-Glassberg Y, Poraz I, Silbermintz A, Zevit
N, Shamir R (2016) Food Intake Adequacy in Children and Adolescents With Inflammatory
91
Bowel Disease. J Pediatr Gastroenterol Nutr 63 (4):437-444.
doi:10.1097/MPG.0000000000001170
14. Thomas AG, Taylor F, Miller V (1993) Dietary intake and nutritional treatment in
childhood Crohn's disease. J Pediatr Gastroenterol Nutr 17 (1):75-81
15. Diederen K, Krom H, Koole JCD, Benninga MA, Kindermann A (2018) Diet and
Anthropometrics of Children With Inflammatory Bowel Disease: A Comparison With the
General Population. Inflamm Bowel Dis 24 (8):1632-1640. doi:10.1093/ibd/izy027
16. Tsiountsioura M, Wong JE, Upton J, McIntyre K, Dimakou D, Buchanan E, Cardigan T,
Flynn D, Bishop J, Russell RK, Barclay A, McGrogan P, Edwards C, Gerasimidis K (2014)
Detailed assessment of nutritional status and eating patterns in children with gastrointestinal
diseases attending an outpatients clinic and contemporary healthy controls. Eur J Clin Nutr 68
(6):700-706. doi:10.1038/ejcn.2013.286
17. Levine A, Koletzko S, Turner D, Escher JC, Cucchiara S, de Ridder L, Kolho KL, Veres
G, Russell RK, Paerregaard A, Buderus S, Greer ML, Dias JA, Veereman-Wauters G,
Lionetti P, Sladek M, Martin de Carpi J, Staiano A, Ruemmele FM, Wilson DC, European
Society of Pediatric Gastroenterology H, Nutrition (2014) ESPGHAN revised porto criteria
for the diagnosis of inflammatory bowel disease in children and adolescents. J Pediatr
Gastroenterol Nutr 58 (6):795-806. doi:10.1097/MPG.0000000000000239
18. Levine A, Griffiths A, Markowitz J, Wilson DC, Turner D, Russell RK, Fell J, Ruemmele
FM, Walters T, Sherlock M, Dubinsky M, Hyams JS (2011) Pediatric modification of the
Montreal classification for inflammatory bowel disease: the Paris classification. Inflamm
Bowel Dis 17 (6):1314-1321. doi:10.1002/ibd.21493
19. Hyams JS, Ferry GD, Mandel FS, Gryboski JD, Kibort PM, Kirschner BS, Griffiths AM,
Katz AJ, Grand RJ, Boyle JT, et al. (1991) Development and validation of a pediatric Crohn's
disease activity index. J Pediatr Gastroenterol Nutr 12 (4):439-447

92
20. Turner D, Otley AR, Mack D, Hyams J, de Bruijne J, Uusoue K, Walters TD, Zachos M,
Mamula P, Beaton DE, Steinhart AH, Griffiths AM (2007) Development, validation, and
evaluation of a pediatric ulcerative colitis activity index: a prospective multicenter study.
Gastroenterology 133 (2):423-432. doi:10.1053/j.gastro.2007.05.029
21. Addo OY, Himes JH (2010) Reference curves for triceps and subscapular skinfold
thicknesses in US children and adolescents. Am J Clin Nutr 91 (3):635-642.
doi:10.3945/ajcn.2009.28385
22. Wells JC, Williams JE, Chomtho S, Darch T, Grijalva-Eternod C, Kennedy K, Haroun D,
Wilson C, Cole TJ, Fewtrell MS (2012) Body-composition reference data for simple and
reference techniques and a 4-component model: a new UK reference child. Am J Clin Nutr 96
(6):1316-1326. doi:10.3945/ajcn.112.036970
23. WHO Multicentre Growth Reference Study Group. WHO Child Growth Standards:
Length/height-for-age, weight-for-age, weight-for-length, weight-for-height and body mass
index-for-age: Methods and development. Geneva: World Health Organization, 2006 (312
pages).
24. Firouzbakhsh S, Mathis RK, Dorchester WL, Oseas RS, Groncy PK, Grant KE,
Finklestein JZ (1993) Measured resting energy expenditure in children. J Pediatr
Gastroenterol Nutr 16 (2):136-142
25. Mocic Pavic A, Detelic D, Hojsak I, Kolacek S (2015) Validation of a food frequency
questionnaire for adolescents in Croatia. J Pediatr Gastroenterol Nutr 60:835-836.
26. Nutrient Data Laboratory (U.S.), & Consumer and Food Economics Institute (U.S.).
(1999). USDA nutrient database for standard reference. Riverdale, Md: USDA, Nutrient Data
Laboratory, Agricultural Research Service.
27. Kaic-Rak A, Antonic K (1990) Tablice o sastavu namirnica i pića. Zavod za zaštitu
zdravlja R Hrvatske, Zagreb

93
28. Hagin S, Lobato DJ, Sands BE, Korzenik J, Merrick M, Shah S (2017) Dietary behaviors
in newly diagnosed youth with inflammatory bowel disease. Child Health Care 46 (4):408-
420
29. Serrano-Montalban B, Arias A, Friginal-Ruiz AB, Lucendo AJ (2017) The Use of the
Fracture Risk Assessment (FRAX(R)) Tool in Predicting Risk of Fractures in Patients With
Inflammatory Bowel Disease: A Systematic Review. J Clin Densitom 20 (2):180-187.
doi:10.1016/j.jocd.2016.08.010
30. Donnellan CF, Yann LH, Lal S (2013) Nutritional management of Crohn's disease.
Therap Adv Gastroenterol 6 (3):231-242. doi:10.1177/1756283X13477715
31. Owczarek D, Rodacki T, Domagala-Rodacka R, Cibor D, Mach T (2016) Diet and
nutritional factors in inflammatory bowel diseases. World J Gastroenterol 22 (3):895-905.
doi:10.3748/wjg.v22.i3.895
32. Veereman-Wauters G, de Ridder L, Veres G, Kolacek S, Fell J, Malmborg P, Koletzko S,
Dias JA, Misak Z, Rahier JF, Escher JC, Group EIP (2012) Risk of infection and prevention
in pediatric patients with IBD: ESPGHAN IBD Porto Group commentary. J Pediatr
Gastroenterol Nutr 54 (6):830-837. doi:10.1097/MPG.0b013e31824d1438
33. Vasseur F, Gower-Rousseau C, Vernier-Massouille G, Dupas JL, Merle V, Merlin B,
Lerebours E, Savoye G, Salomez JL, Cortot A, Colombel JF, Turck D (2010) Nutritional
status and growth in pediatric Crohn's disease: a population-based study. Am J Gastroenterol
105 (8):1893-1900. doi:10.1038/ajg.2010.20
34. El Mouzan MI, Al Edreesi MH, Al-Hussaini AA, Saadah OI, Al Qourain AA, Al
Mofarreh MA, Al Saleem KA (2016) Nutritional status of children with inflammatory bowel
disease in Saudi Arabia. World J Gastroenterol 22 (5):1854-1858.
doi:10.3748/wjg.v22.i5.1854

94
35. Croatian Institute of Public Health. Health Behaviour in School-aged Children – HBSC
2013/2014.
36. Harper JW, Zisman TL (2016) Interaction of obesity and inflammatory bowel disease.
World J Gastroenterol 22 (35):7868-7881. doi:10.3748/wjg.v22.i35.7868
37. Burnham JM, Shults J, Semeao E, Foster BJ, Zemel BS, Stallings VA, Leonard MB
(2005) Body-composition alterations consistent with cachexia in children and young adults
with Crohn disease. Am J Clin Nutr 82 (2):413-420. doi:10.1093/ajcn.82.2.413
38. Wiskin AE, Wootton SA, Hunt TM, Cornelius VR, Afzal NA, Jackson AA, Beattie RM
(2011) Body composition in childhood inflammatory bowel disease. Clin Nutr 30 (1):112-
115. doi:10.1016/j.clnu.2010.07.014

95
Paper 2
Altered gut microbiota is present in newly diagnosed pediatric
patients with inflammatory bowel disease
Journal of Pediatric Gastroenterology and Nutrition 70 (2020) 497-502

96
Altered gut microbiota is present in newly diagnosed pediatric patients with
inflammatory bowel disease
Sara Sila, MSc1, Marko Jelić, PhD2, Ivana Trivić, MD1, Arjana Tambić Andrašević2, MD;
PhD2,3, Iva Hojsak, MD, PhD1,4,5*, Sanja Kolaček, MD, PhD1,5*
1Children’s Hospital Zagreb, Zagreb, Croatia
2University Hospital for Infectious Diseases, Zagreb, Croatia
3 University of Zagreb, School of Dental Medicine, Zagreb, Croatia
4University J.J. Strossmayer, School of Medicine Osijek, Osijek, Croatia
5University of Zagreb, School of Medicine, Zagreb, Croatia
*Authors contributed equally and share last authorship
Corresponding author
Iva Hojsak, MD, PhD,
Referral center for pediatric gastroenterology and nutrition
Children’s Hospital Zagreb
Klaićeva 16, 10000 Zagreb
Croatia
Phone: +38514600130; Fax: +38514600160
e-mail: [email protected]

97
ABSTRACT
Background and aims: Clinical and experimental data suggest that gut microbiota plays an
important role in the pathogenesis of inflammatory bowel disease. The aim of this study was to
determine intestinal microbiota in newly diagnosed patients with inflammatory bowel disease
and to compare it to patients’ healthy siblings who share same genetic and environmental
background and to healthy unrelated controls.
Methods: Molecular approach targeting 16S ribosomal RNA was employed for analyzing the
gut microbiota of participants’ stool samples. Terminal restriction fragment length
polymorphphism analysis was performed.
Results: Newly diagnosed pediatric patients with inflammatory bowel disease (n=19, 68.4%
CD, mean age 14.8 ± 0.65 years), their unaffected healthy siblings (n=20, mean age 12.8 ± 0.85
years) and unrelated healthy controls (n=19, mean age 10.7 ± 0.8 years) were included.
Microbial diversity differed significantly between inflammatory bowel disease patients, healthy
siblings and healthy controls (p=0.018 for MspI-digestion, p=0.013 for HhaI-digestion). No
significant difference in microbial diversity was found between healthy siblings and healthy
controls. In patients reduced presence of genus Eubacterium, Lactobacillus, Enterobacter and
Clostridium, and increased presence of genus Streptococcus, Prevotella and Escherichia,
compared to healthy siblings and healthy controls, was found.
Conclusion: Newly diagnosed pediatric patients with inflammatory bowel disease show
significantly less diverse microbiota and microbial composition compared to healthy siblings
and healthy controls.
Key words: microbiology; pediatrics; Crohn’s disease; ulcerative colitis; children; microbiome

98
What is known
Clinical and experimental data suggests that microbiome plays an important role in the
development of inflammatory bowel disease.
Both increased and decreased abundance of specific bacterial taxa, as well as difference
in microbial diversity has been described in patients with inflammatory bowel disease.
What is new
This study found significant difference in microbiota composition in newly diagnosed,
treatment naive pediatric patients with inflammatory bowel disease compared to healthy
siblings and healthy controls.
Lower abundance of the phylum Firmicutes and higher abundance of the phylum
Proteobacteria was observed in patients compared to healthy siblings and healthy
controls.
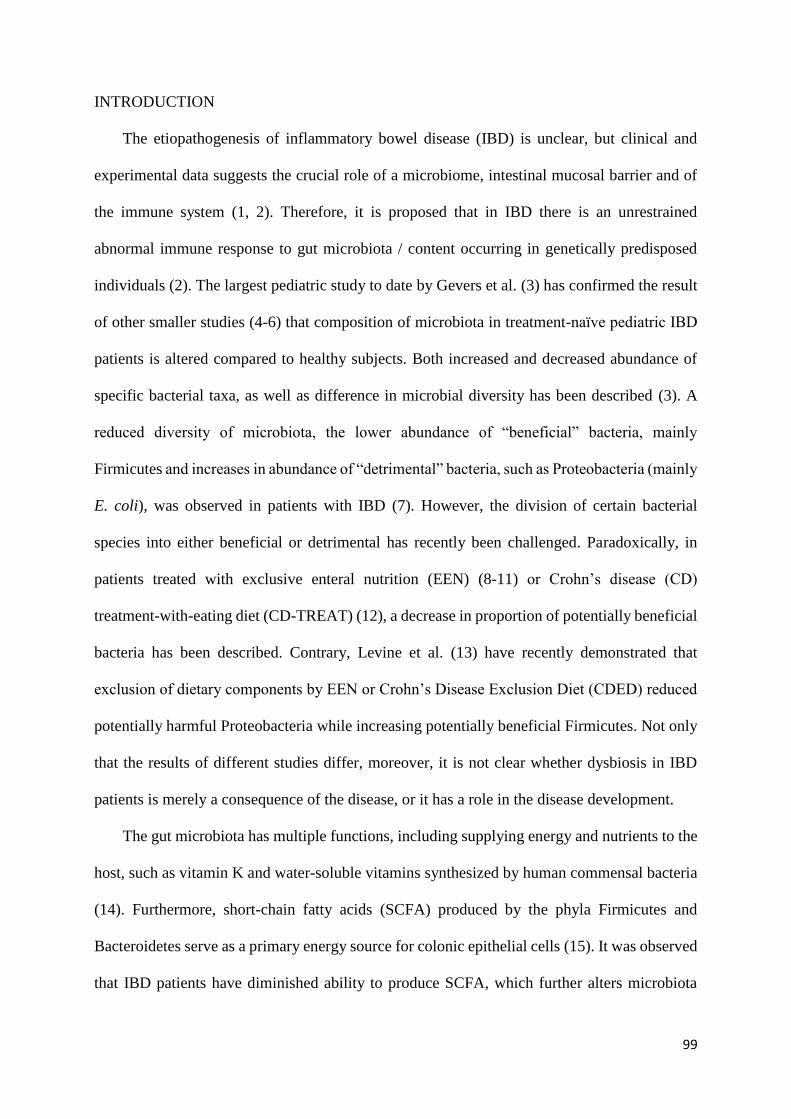
99
INTRODUCTION
The etiopathogenesis of inflammatory bowel disease (IBD) is unclear, but clinical and
experimental data suggests the crucial role of a microbiome, intestinal mucosal barrier and of
the immune system (1, 2). Therefore, it is proposed that in IBD there is an unrestrained
abnormal immune response to gut microbiota / content occurring in genetically predisposed
individuals (2). The largest pediatric study to date by Gevers et al. (3) has confirmed the result
of other smaller studies (4-6) that composition of microbiota in treatment-naïve pediatric IBD
patients is altered compared to healthy subjects. Both increased and decreased abundance of
specific bacterial taxa, as well as difference in microbial diversity has been described (3). A
reduced diversity of microbiota, the lower abundance of “beneficial” bacteria, mainly
Firmicutes and increases in abundance of “detrimental” bacteria, such as Proteobacteria (mainly
E. coli), was observed in patients with IBD (7). However, the division of certain bacterial
species into either beneficial or detrimental has recently been challenged. Paradoxically, in
patients treated with exclusive enteral nutrition (EEN) (8-11) or Crohn’s disease (CD)
treatment-with-eating diet (CD-TREAT) (12), a decrease in proportion of potentially beneficial
bacteria has been described. Contrary, Levine et al. (13) have recently demonstrated that
exclusion of dietary components by EEN or Crohn’s Disease Exclusion Diet (CDED) reduced
potentially harmful Proteobacteria while increasing potentially beneficial Firmicutes. Not only
that the results of different studies differ, moreover, it is not clear whether dysbiosis in IBD
patients is merely a consequence of the disease, or it has a role in the disease development.
The gut microbiota has multiple functions, including supplying energy and nutrients to the
host, such as vitamin K and water-soluble vitamins synthesized by human commensal bacteria
(14). Furthermore, short-chain fatty acids (SCFA) produced by the phyla Firmicutes and
Bacteroidetes serve as a primary energy source for colonic epithelial cells (15). It was observed
that IBD patients have diminished ability to produce SCFA, which further alters microbiota

100
composition and consequently influences intestinal and immune homeostasis (16). Finally,
microbial products released into the bowel lumen can epigenetically influence the long-term
function of both, intestinal immunity and the mucosal barrier (17, 18).
In approximately a quarter of patients, disease is diagnosed before the age of 18 years with
the significant increase in incidence being observed in this specific age group (19, 20). Thus, it
is of utmost importance to understand the contributing factors for disease development, which
may provide the possibility for disease prevention and/or treatment that is more efficient. With
the exception of rare monogenic diseases, most commonly occurring in the first years of life
(21), only about 7.5% of incidence of CD and 13.6% of ulcerative colitis (UC) can be explained
by genetics (22). Therefore, the current emphasize is on different environmental factors, which
could play a crucial role in the etiopathogenesis of IBD (23). Studying currently healthy siblings
of patients with IBD, who share both, the genetic background and environmental exposures,
may provide further insights into IBD pathogenesis.
To our knowledge, only few studies have compared fecal microbiota of IBD patients to
their unaffected siblings/relatives (24-29). The results of these studies have not been conclusive.
Some studies have shown that dysbiosis was present in both IBD patients and healthy siblings,
suggesting that dysbiosis in IBD patients is not merely a consequence of intestinal inflammation
(24, 28). However, not all studies have confirmed these results (26, 29).
The aim of this study is, therefore, to determine the composition of intestinal microbiota in
newly diagnosed IBD patients and to compare it to patients’ healthy siblings and healthy
unrelated controls. To our knowledge, this is the first study that compared microbiota of newly
diagnosed, treatment naive pediatric IBD patients with that of healthy pediatric siblings and
healthy unrelated pediatric controls.

101
MATERIALS AND METHODS
Patients and study design
Newly diagnosed pediatric IBD patients and their unaffected healthy siblings were
recruited at the Referral Centre for Pediatric Gastroenterology and Nutrition at the Children’s
Hospital Zagreb from June 2016 to April 2019. Unrelated healthy controls were recruited by
circular e-mail sent to hospital staff who accepted their children’s participation. All participants
older than 9 years of age and their parents gave written informed consent. The diagnosis of IBD
was established according to the revised Porto criteria (30), while disease location was defined
using the Paris classification (31). Severity of the disease was estimated by Pediatric Crohn’s
disease activity index (PCDAI) and Pediatric ulcerative colitis activity index (PUCAI) (32, 33).
Exclusion criteria in healthy controls included chronic illness or family history positive for
chronic intestinal diseases (celiac disease, IBD, gastrointestinal carcinoma). In healthy siblings,
exclusion criteria included unintentional weight loss in the last 6 months, changes in stool
frequency or consistency or other symptoms suggestive of undiagnosed IBD. For each
participant, retrospective data on type of delivery (vaginal birth or C-section), months of total
breastfeeding, months of exclusive breastfeeding, time of weaning, number of siblings and
owning of pets were collected. Stool samples of all participants were collected in sample
containers, prior to therapy introduction. They were stored in the hospital or at home at -20°C
for a maximum of 24 hours, after which they were transferred in the cold packs to the
Department of Clinical Microbiology at the University Hospital for Infectious Diseases and
stored at -80°C. Stool samples of newly diagnosed patients were collected prior to therapy
introduction.
Total fecal bacterial DNA extraction, from ~150 mg of stool samples, was performed
using Quick-DNATM Fecal/Soil Microbe Miniprep Kit (Zymo Research, USA) according to
manufacturer’s instructions.

102
PCR amplification and T-RFLP analysis
PCR amplification and terminal restriction fragment length polymorphphism (T-RFLP)
analysis were performed according to Andoh et al 2012 with slight modifications(34) 6'-
carboxyfluorescein (6-FAM) labeled 27-F primer (6-FAM-5'-
AGAGTTTGATCCTGGCTCAG-3') and 1492R (5'-GGTTACCTTGTTACGACTT-3')
(Thermo Fisher Scientific, USA) were used for the amplification of the 16S rRNA gene from
the human fecal DNA (34). The PCR amplification (20 ng of DNA) was performed in 50 µL
reactions, in triplicates, according to previously described protocol (35). Amplified DNA was
purified using QIAquick PCR Purification Kit (Qiagen, Germany) and diluted in 50 µL of
elution buffer.
HhaI and MspI enzymes were used for the restriction of amplified 16S rRNA genes
(34). 120 ng of purified PCR product was digested separately in 30 µL reaction volumes, using
1 µL of FastDigest HhaI and FastDigest MspI (Thermo Fisher Scientific, USA) at 37°C for one
hour. Restriction products were purified by ethanol/ sodium acetate/EDTA precipitation and
resuspended in 12 µL deionized formamide (Thermo Fisher Scientific, USA) to a final
concentration of 10 ng/ µL (36). 3 µL of restriction digest product (~36 ng) was mixed with 11
µL of deionized formamide and 0.5 µL of fourfold diluted GS2500ROX (Thermo Fisher
Scientific, USA). The length of the terminal restriction fragments (T-RFs) was determined with
an ABI PRISM 310 genetic analyzer in GeneScan mode (20s injection time; 15 kV, and 60°C
for 48 min for each sample) (Thermo Fisher Scientific, USA) (37).
Fragment sizes were estimated by using the Local Southern Method GeneMapper 3.7
software (Thermo Fisher Scientific, USA). T-RFs in the range of 50–810 bp with a peak height
greater than 25 fluorescence units were included in the analysis. Alignment of T-RFs was
performed by T-REX software (http://trex.biohpc.org/) (38). Binning treshold of 2 bp was used

103
for assignment of T-RFs to operational taxonomic units (OTUs) (36). The OTUs were
quantified as the percentage values of an individual OTU per total OTU area, and this was
expressed as the % area of the underpeak curve (% AUC) (39).
Assignment of OTUs to bacterial taxa was performed in silico using the web-based
analysis tool (PAT+) provided by MiCA3 (http://mica.ibest.uidaho.edu/pat.php), based on the
RDP (Ribosomal Database Project) release 10 16s rRNA gene database (40).
Statistics
The differences between categorical variables were assessed by chi-square test. The
differences for non-categorical variables were assessed based on distribution and number of
groups by ANOVA or t test and Kruskal-Wallis or Mann-Whitney U test. The relative
abundance of OTUs was used to calculate Shannon-Wiener diversity index in order to compare
diversity between different sample groups. Cluster analyses were performed using
BioNumerics software (Applied Maths, Belgium) based on the HhaI or MspI T-RFLP patterns.
A dendrogram representing calculated similarity distances was generated using Pearson’s
similarity coefficient analysis and the unweighted pair-group methods with arithmetic means
(UPGMA). P values less than 0.05 were considered significant. Statistical analysis was
performed using SPSS 19.0 (Chicago, IL) statistical software.
Study was approved by Ethics Committee of the Children’s Hospital Zagreb (IRB
number: 21102014).
RESULTS
Baseline characteristics of enrolled participants (IBD patients, healthy siblings and
healthy controls) are summarized in Table 1. Overall, with the exception of age (healthy
controls being significantly younger compared to IBD patients and healthy siblings) there were
no differences in study populations in respect to gender, duration of breastfeeding, time of
weaning, number of siblings, mode of delivery and owning of pets. At the time of assessment,

104
12 CD patients (92.3%) had mild disease according to PCDAI scoring (PCDAI score between
10 and 30), while 1 patient (7.7%) had moderate to severe disease (PCDAI score higher than
30). In UC patients, 3 patients (50%) had mild disease (PUCAI score between 10 and 34) and
3 patients (50%) had moderate disease (PCDAI score between 35 and 64) according to PUCAI
score.
Table 1. Baseline characteristics of study population.
IBD (n=19) Healthy
siblings
(n=20)
Healthy
controls
(n=19)
p-value
Male, n (%) 63.2% 13/7 10/9 0.212
Crohn’s disease, n (%) 13 (68.4%)
Age (years), mean (SD) 14.77 (0.65)
12.84 (0.85) 10.72 (0.84) 0.005
Breastfeeding (months),
mean (SD)
13.29 (2.59) 13.7 (3.39) 10.0 (1.57) 0.606
Weaning (months), mean
(SD)
5.4 (0.3) 5.35 (0.27) 5.26 (0.21) 0.994
Number of siblings, mean
(SD)
1.4 (0.11) 1.4 (0.11) 1.05 (0.21) 0.055
Vaginal delivery, n (%) 15 (79.0%) 16/4 14/5 0.881
Owning of pets, n (%) 12 (63.2) 8/12 7/12 0.973
PCDAI, mean (SD) 21.4 (7.5)
PUCAI, mean (SD) 36.7 (21.4)
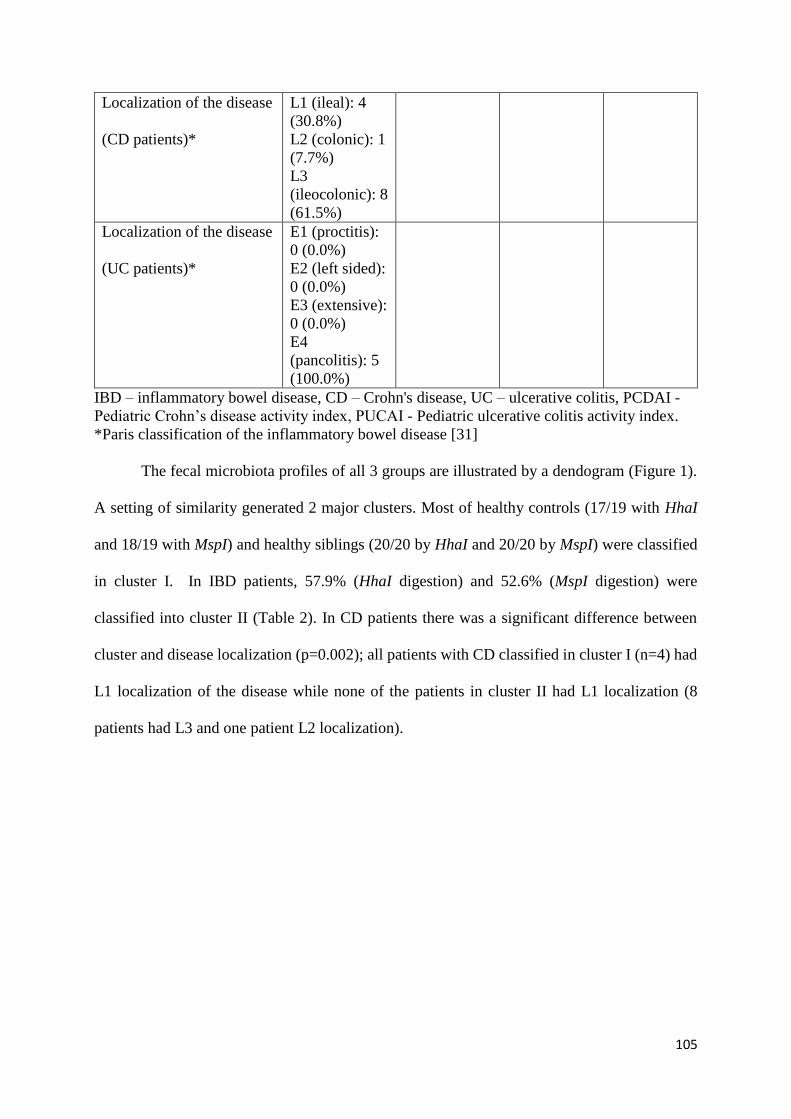
105
Localization of the disease
(CD patients)*
L1 (ileal): 4
(30.8%)
L2 (colonic): 1
(7.7%)
L3
(ileocolonic): 8
(61.5%)
Localization of the disease
(UC patients)*
E1 (proctitis):
0 (0.0%)
E2 (left sided):
0 (0.0%)
E3 (extensive):
0 (0.0%)
E4
(pancolitis): 5
(100.0%)
IBD – inflammatory bowel disease, CD – Crohn's disease, UC – ulcerative colitis, PCDAI -
Pediatric Crohn’s disease activity index, PUCAI - Pediatric ulcerative colitis activity index.
*Paris classification of the inflammatory bowel disease [31]
The fecal microbiota profiles of all 3 groups are illustrated by a dendogram (Figure 1).
A setting of similarity generated 2 major clusters. Most of healthy controls (17/19 with HhaI
and 18/19 with MspI) and healthy siblings (20/20 by HhaI and 20/20 by MspI) were classified
in cluster I. In IBD patients, 57.9% (HhaI digestion) and 52.6% (MspI digestion) were
classified into cluster II (Table 2). In CD patients there was a significant difference between
cluster and disease localization (p=0.002); all patients with CD classified in cluster I (n=4) had
L1 localization of the disease while none of the patients in cluster II had L1 localization (8
patients had L3 and one patient L2 localization).

106
Figure 1. Dendrogram of the fecal microbiota profiles of IBD patients, healthy unrelated
controls and healthy siblings (A. HhaI-digestion, B. MspI-digestion).
Table 2. Distribution of fecal microbiota profiles in IBD patients, healthy siblings and healthy
controls.
Cluster I
(HhaI-digestion/MspI-
digestion)
Cluster II
(HhaI-digestion/MspI-
digestion)
IBD patients (n=19) 8 (42.1%) / 9(47.4%) 11 (57.9%) / 10 (52.6%)
CD patients (n=13) 5 (38.5%) / 5 (38.5%) 8 (61.5%) / 8 (61.5%)
UC patients (n=6) 3 (50%) / 3 (50%) 3 (50%) / 3 (50%)
Healthy siblings (n=20) 20 (100%) / 20 (100%) 0 (0%) / 0 (0%)
Healthy controls (n=19) 17 (89.5%) / 18 (94.7%) 2 (10.5%) / 1 (5.2%)
IBD – inflammatory bowel disease, CD – Crohn's disease, UC – ulcerative colitis
There was no association between cluster distribution and disease severity based on
PUCAI (p=0.10) or PCDAI score (p=0.825), age (p=0.503 for CD and p=1.0 for UC),
a b
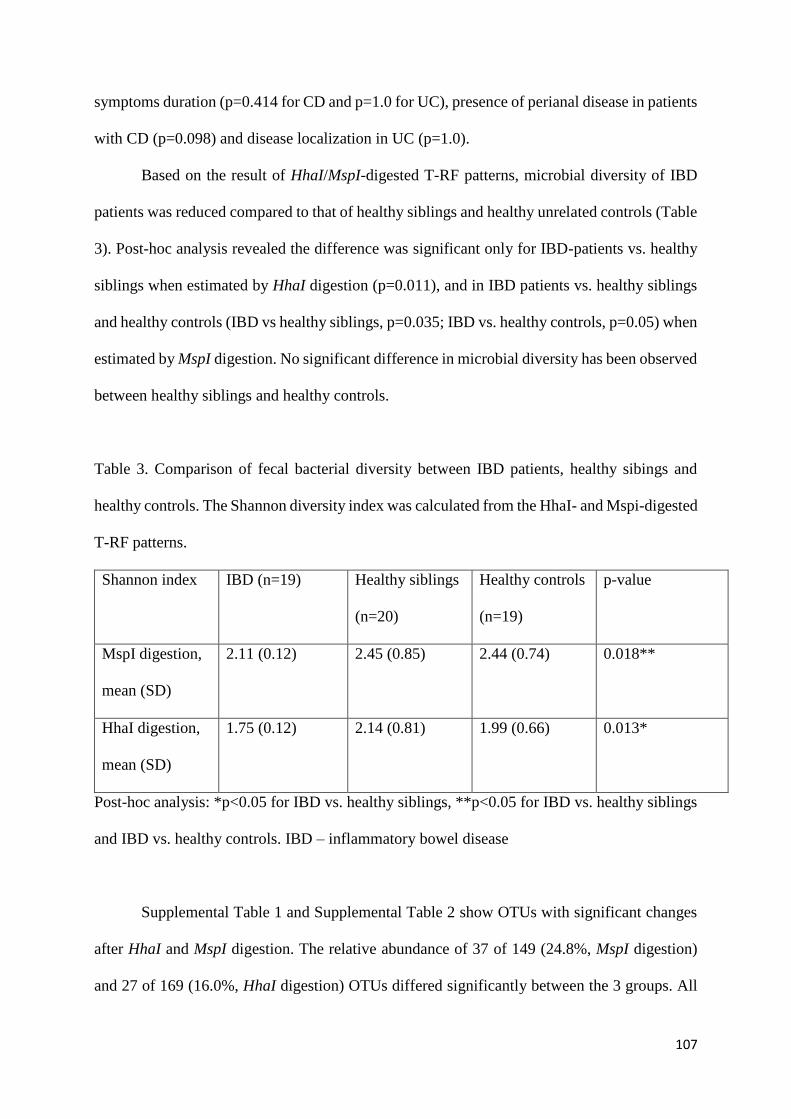
107
symptoms duration (p=0.414 for CD and p=1.0 for UC), presence of perianal disease in patients
with CD (p=0.098) and disease localization in UC (p=1.0).
Based on the result of HhaI/MspI-digested T-RF patterns, microbial diversity of IBD
patients was reduced compared to that of healthy siblings and healthy unrelated controls (Table
3). Post-hoc analysis revealed the difference was significant only for IBD-patients vs. healthy
siblings when estimated by HhaI digestion (p=0.011), and in IBD patients vs. healthy siblings
and healthy controls (IBD vs healthy siblings, p=0.035; IBD vs. healthy controls, p=0.05) when
estimated by MspI digestion. No significant difference in microbial diversity has been observed
between healthy siblings and healthy controls.
Table 3. Comparison of fecal bacterial diversity between IBD patients, healthy sibings and
healthy controls. The Shannon diversity index was calculated from the HhaI- and Mspi-digested
T-RF patterns.
Shannon index IBD (n=19) Healthy siblings
(n=20)
Healthy controls
(n=19)
p-value
MspI digestion,
mean (SD)
2.11 (0.12) 2.45 (0.85) 2.44 (0.74) 0.018**
HhaI digestion,
mean (SD)
1.75 (0.12) 2.14 (0.81) 1.99 (0.66) 0.013*
Post-hoc analysis: *p<0.05 for IBD vs. healthy siblings, **p<0.05 for IBD vs. healthy siblings
and IBD vs. healthy controls. IBD – inflammatory bowel disease
Supplemental Table 1 and Supplemental Table 2 show OTUs with significant changes
after HhaI and MspI digestion. The relative abundance of 37 of 149 (24.8%, MspI digestion)
and 27 of 169 (16.0%, HhaI digestion) OTUs differed significantly between the 3 groups. All

108
HhaI- and MspI-associated OTUs predicting the genus Clostridium, among others, were
significantly decreased in IBD patients at the time of diagnosis compared to healthy siblings
and healthy controls. There was no significant difference between OTUs predicting the genus
Clostridium between healthy siblings and healthy controls. However, all mentioned OTUs were
lower in healthy siblings compared to healthy controls and were approaching OTU values of
IBD patients.
Some other HhaI- and MspI-associated OTU-s representing phylum Firmicutes which
include bacteria from the genus Paenibacillus, Bacillus, Lactobacillus, Blautia, Eubacterium,
Roseburia and Ruminoccocus were significantly reduced in IBD patients compared to healthy
siblings and healthy controls (Supplemental tables 1 and 2). Although the difference was not
significant, the same bacteria were lower in healthy siblings compared to healthy controls and
were approaching values of IBD patients. Only one MspI associated OTU (128-bp MspI OTU)
representing the genus Citrobacter, Collinsella and Paenibacillus differed significantly
between healthy siblings and healthy unrelated controls, with healthy siblings having lower
values, similarly to that in IBD patients.
On the contrary, the genus Streptococcus, Lactococcus and Enterococcus predicted by
the MspI-associated 555-bp and 563-bp were significantly increased in IBD patients. The same
has been noticed for the phylum Proteobacteria, represented by genus Enterobacter,
Citrobacter, Escherichia and Klebsiella (495-bp MspI OTUs). For one HhaI-associated OTU
(374-bp OTU) representing phylum Proteobacteria, abundance was significantly lower in
patients with IBD.

109
DISCUSSION
In this study we have replicated previous findings that newly diagnosed pediatric
patients with IBD have significantly less diverse microbial composition compared to healthy
controls, but also to healthy siblings. Furthermore, lower abundance of the phylum Firmicutes
and higher abundance of the phylum Proteobacteria was observed in IBD patients compared to
healthy siblings and healthy controls, while no significant difference in microbiota composition
was observed in healthy siblings and healthy controls. To our knowledge, this was the first
study that compared microbiota of newly diagnosed, treatment-naive pediatric IBD patients
with healthy pediatric siblings and healthy unrelated controls.
We identified six studies that have compared microbiota composition of IBD patients
with that of healthy siblings/relatives (24-29). Of those, four have included healthy unrelated
controls (24, 26, 29) and only three have included pediatric patients with IBD (25-27).
Methodologies of these studies have differed by the type of IBD patients (both CD and UC
patients, only CD patients), age of control group (healthy minor or adult siblings/relatives),
disease activity (patients with active or inactive disease) and methods used for microbiota
analysis (DNA extraction, sequencing methodology and data analysis).
Previous studies have consistently shown that de novo pediatric IBD is strongly
associated with microbiota alterations (7). Microbial communities of new pediatric IBD
patients could be differentiated with high accuracy from those of healthy unrelated controls (3,
41). In our study, dendrograms comparing the gut microbiota separated patients and controls
into two major clusters. Almost all healthy siblings and healthy controls were included in one
cluster, while about 55% or IBD patients were included in a second cluster. Remaining IBD
patients were included in the same cluster with healthy siblings and healthy unrelated controls.
In CD group of patients, all patients that were in cluster I (together with healthy siblings and
controls) had L1 localization of the disease (ileal/ileocecal disease), while all CD patients with

110
colonic involvement were in cluster II. In a study by Andoh et al. (34) almost all healthy
individuals were included in one cluster, while 74.6% of adult CD patients (active disease,
remission-achieved, remission-maintained patients) were forming two separate clusters.
Similarly, in a study by Ijaz et al. (26) the gut microbiota community structure (β-diversity) of
pediatric CD patients was different to the microbiota of the unaffected adult relatives of CD
children and adult healthy unrelated controls. Additionally, similar to our results, no difference
in the gut microbiota community structure between the healthy relatives and healthy unrelated
controls was seen (26).
Dysbiosis, besides reduced microbial diversity, involves also changes in abundances of
potentially pathogenic and/or beneficial taxa (7, 42). Consistent with the results of other studies
(24-29), in our study, microbial diversity of IBD patients was significantly lower compared to
healthy siblings and healthy controls. Furthermore, abundance of specific taxa has been
increased/reduced in IBD patients. In their review, Ni et al. (43) have reported that the phylum
Firmicutes is often reduced in adult IBD patients (44-48). Our study confirmed these results
and has shown lower abundance of the phylum Firmicutes in IBD patients, more specifically
OTUs representing bacteria from the genus Paenibacillus, Bacillus, Lactobacillus, Blautia,
Eubacterium, Roseburia and Ruminoccocus. OTUs representing phylum Proteobacteria have
been increased in patients with IBD, observation which has also been reported previously (44,
49). Previously mentioned changes in the composition of the gut microbiota could lead to
metabolite alterations, primarily reduction in amino acid biosynthesis and carbohydrate
metabolism pathways and increase in expression of genes related to oxidative stress, that are
likely to have a role in the IBD pathogenesis (43). However, there are studies in pediatric
patients showing different results, implicating that the abovementioned pathogenesis may not
be valid – at least not in pediatric patients (10, 13).

111
Comparing microbiota profiles of healthy siblings with that of healthy unrelated
controls, we have not found significant differences neither in microbiota diversity, nor in
specific bacteria genus, which is not in accordance with previous research findings (24, 25, 27).
In our study, only one MspI associated OTU (representing genus Citrobacter, Collinsella and
Paenibacillus) differed significantly between healthy siblings and healthy unrelated controls.
However, some differences observed between healthy siblings and healthy controls were
similar to the differences observed when comparing IBD-patients to healthy controls. More
specifically, most OTUs representing bacteria from phylum Firmicutes, but not from phylum
Proteobacteria observed in healthy siblings, differed from that of healthy controls and were
approaching values observed in IBD patients. Those differences were not statistically
significant, but we might have been underpowered to find a significant difference in our cohort.
The former may indicate that, to some extent, dysbiosis does exists in the microbiota of healthy
siblings of IBD patients, but only with regard to reduced 'beneficial' bacteria, which has been
observed in other study as well (24). However, as speculated by Ijaz et al. (26) dysbiosis
reported in paeditric IBD patients occurs to a much lower extent in their healthy genetically
linked counterparts. Similarly, in a study by Joossens et al. (29) dysbiosis signature found in
adult patients with CD was markedly characteristic for the disease as it was not observed in
unaffected relatives. The described pattern of decrease in “beneficial” bacteria in microbiota of
siblings could be attributed to shared genetics and environmental exposures in siblings. Even
more so, shared exposures to different risk factors in early perinatal and postnatal life when the
microbiota is developing and becoming stabilized could lead to permanent changes in
microbiota, that could influence the risk of developing IBD later in life (18).
The main limitation of this study is small number of subjects, which is nevertheless,
comparable to other studies. Furthermore, by using other sequencing methodology such as
strain-level shotgun metagenomics with deep sequencing, we would have been able to provide

112
strain-level taxonomic classification. There are several strengths to our study. First, all controls,
healthy unrelated and siblings, were younger than 18 years of age, ensuring that age was not a
confounder in this cohort. Second, all the patients were treatment naïve and recruited at the time
of diagnosis, which excludes the effect of treatment on the microbiota profiles.
In conclusion, significantly different microbiota composition is present already at
diagnosis, in treatment naive patients with IBD. Although the conundrum on the causes and
consequences cannot be resolved by our findings, we have also identified the differences in
microbiota composition between healthy siblings and healthy unrelated controls, but the extent
of them is small.
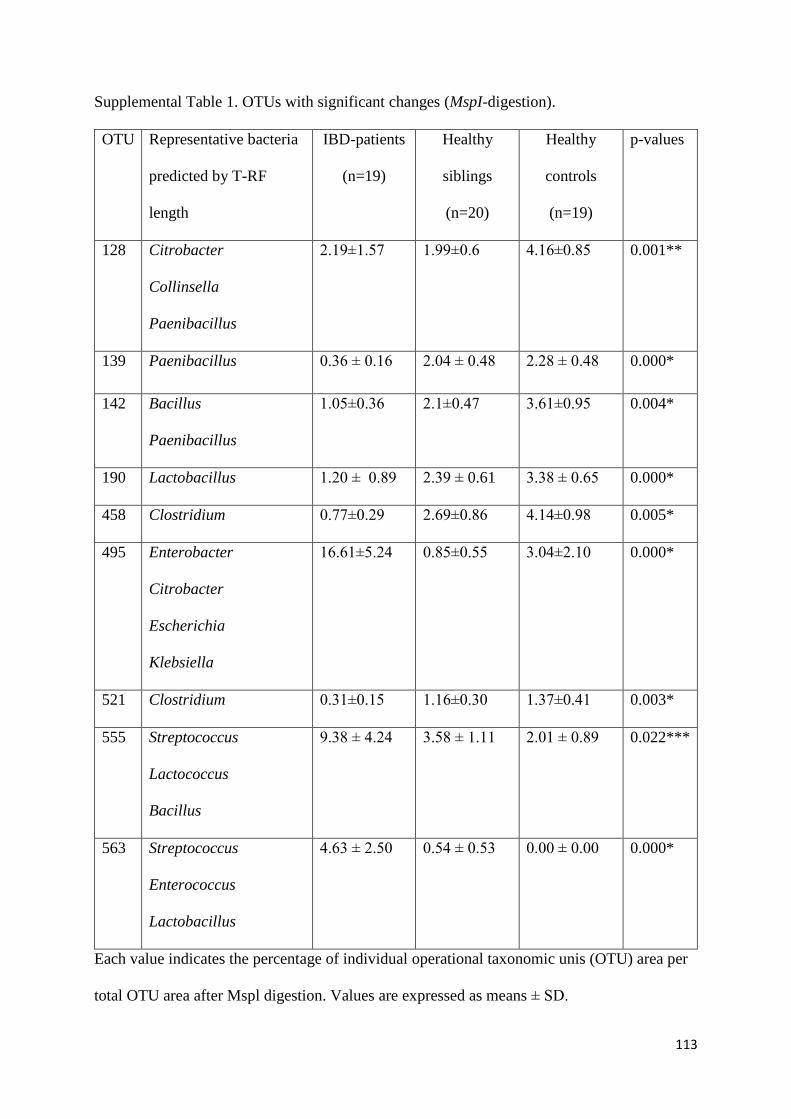
113
Supplemental Table 1. OTUs with significant changes (MspI-digestion).
OTU Representative bacteria
predicted by T-RF
length
IBD-patients
(n=19)
Healthy
siblings
(n=20)
Healthy
controls
(n=19)
p-values
128 Citrobacter
Collinsella
Paenibacillus
2.19±1.57 1.99±0.6 4.16±0.85 0.001**
139 Paenibacillus 0.36 ± 0.16 2.04 ± 0.48 2.28 ± 0.48 0.000*
142 Bacillus
Paenibacillus
1.05±0.36 2.1±0.47 3.61±0.95 0.004*
190 Lactobacillus 1.20 ± 0.89 2.39 ± 0.61 3.38 ± 0.65 0.000*
458 Clostridium 0.77±0.29 2.69±0.86 4.14±0.98 0.005*
495 Enterobacter
Citrobacter
Escherichia
Klebsiella
16.61±5.24
0.85±0.55
3.04±2.10
0.000*
521 Clostridium 0.31±0.15 1.16±0.30 1.37±0.41 0.003*
555 Streptococcus
Lactococcus
Bacillus
9.38 ± 4.24 3.58 ± 1.11
2.01 ± 0.89
0.022***
563 Streptococcus
Enterococcus
Lactobacillus
4.63 ± 2.50
0.54 ± 0.53
0.00 ± 0.00
0.000*
Each value indicates the percentage of individual operational taxonomic unis (OTU) area per
total OTU area after Mspl digestion. Values are expressed as means ± SD.

114
Post hoc analysis: *p<0.05 for IBD vs. healthy siblings and IBD vs. healthy controls;
**p<0.05 for IBD vs. healthy controls and healthy siblings vs. healthy controls, *** p<0.05
for IBD vs. healthy controls.

115
Supplemental Table 2. OTUs with significant changes (HhaI-digestion).
OTU Representative
bacteria predicted by
T-RF length
IBD patients
(n=19)
Healthy
siblings
(n=20)
Healthy
controls
(n=19)
p-values
189 Clostridium
Blautia
Eubacterium
Roseburia
Ruminococcus
0.76± 0.31
9.83± 2.62
13.27 ± 2.94
0.000*
225 Lactobacillus
Clostridium
Bacillus
Paenibacillus
2.51± 1.04 3.99± 0.88 2.15± 0.45 0.014*
230 Clostridium
Bacillus
0.23± 0.13
0.93± 0.33
1.27± 0.47
0.013**
374 Citrobacter
Enterobacter
Escherichia
Klebsiella
2.34± 2.03
4.59± 1.85
7.32± 2.48
0.001*
Each value indicates the percentage of individual operational taxonomic unis (OTU) area per
total OTU area after HhaI digestion. Values are expressed as means ± SD.
Post hoc analysis: *p<0.05 for IBD vs. healthy siblings and IBD vs. healthy controls;
**p<0.05 for IBD vs. healthy controls.

116
Funding: This study was part of a research project IP-2014-09-3788 funded by Croatian
Science Foundation.
Conflict of interest statement: Iva Hojsak received payment/honorarium for lectures or
consultation from BioGaia, Nutricia, Nestle, Chr Hansen, Biocodex, Oktal Pharma; Sanja
Kolaček received fees for lectures from Abbott, AbbVie, Fresenius, Mead and Johnson,
Nestle, Nutricia, Oktal Pharma; Arjana Tambić Andrašević received honorarium for lectures
or consultation from Xellia, Pfeizer, Pliva and MSD; Sara Sila, Marko Jelić and Ivana Trivić
declare no conflict of interest.
Ethical approval: All procedures performed in studies involving human participants were in
accordance with the ethical standards of the institutional ethics committee and with the 1964
Helsinki declaration and its later amendments or comparable ethical standards.
Study was approved by Ethics Committee Children’s Hospital Zagreb (IRB number:
21102014).
Informed consent: Informed consent was obtained from all individual participants and at least
one of their parents included in the study.

117
REFERENCES
1. Sheehan D, Moran C, Shanahan F. The microbiota in inflammatory bowel disease. J
Gastroenterol 2015;50:495-507.
2. Miller T, Suskind DL. Exclusive enteral nutrition in pediatric inflammatory bowel
disease. Curr Opin Pediatr 2018;30:671-676.
3. Gevers D, Kugathasan S, Denson LA, et al. The treatment-naive microbiome in new-
onset Crohn's disease. Cell Host Microbe 2014;15:382-392.
4. Papa E, Docktor M, Smillie C, et al. Non-invasive mapping of the gastrointestinal
microbiota identifies children with inflammatory bowel disease. PLoS One
2012;7:e39242.
5. Morgan XC, Tickle TL, Sokol H, et al. Dysfunction of the intestinal microbiome in
inflammatory bowel disease and treatment. Genome Biol 2012;13:R79.
6. Kaakoush NO, Day AS, Huinao KD, et al. Microbial dysbiosis in pediatric patients
with Crohn's disease. J Clin Microbiol 2012;50:3258-66.
7. Sheehan D, Shanahan F. The Gut Microbiota in Inflammatory Bowel Disease.
Gastroenterol Clin North Am 2017;46:143-154.
8. Gerasimidis K, Bertz M, Hanske L, et al. Decline in presumptively protective gut
bacterial species and metabolites are paradoxically associated with disease
improvement in pediatric Crohn's disease during enteral nutrition. Inflamm Bowel Dis
2014;20:861-71.
9. Gerasimidis K, Russell R, Hansen R, et al. Role of Faecalibacterium prausnitzii in
Crohn's Disease: friend, foe, or does not really matter? Inflamm Bowel Dis
2014;20:E18-9.
10. Pigneur B, Lepage P, Mondot S, et al. Mucosal Healing and Bacterial Composition in
Response to Enteral Nutrition Vs Steroid-based Induction Therapy-A Randomised

118
Prospective Clinical Trial in Children With Crohn's Disease. J Crohns Colitis
2019;13:846-855.
11. Sokol H, Langella P. Beneficial effects of exclusive enteral nutrition in Crohn's
disease are not mediated by Faecalibacterium prausnitzii. Inflamm Bowel Dis
2014;20:E18.
12. Svolos V, Hansen R, Nichols B, et al. Treatment of Active Crohn's Disease With an
Ordinary Food-based Diet That Replicates Exclusive Enteral Nutrition.
Gastroenterology 2019;156:1354-1367 e6.
13. Levine A, Wine E, Assa A, et al. Crohn's Disease Exclusion Diet Plus Partial Enteral
Nutrition Induces Sustained Remission in a Randomized Controlled Trial.
Gastroenterology 2019;157:440-450 e8.
14. LeBlanc JG, Laino JE, del Valle MJ, et al. B-group vitamin production by lactic acid
bacteria--current knowledge and potential applications. J Appl Microbiol
2011;111:1297-309.
15. Marchesi JR, Adams DH, Fava F, et al. The gut microbiota and host health: a new
clinical frontier. Gut 2016;65:330-9.
16. Machiels K, Joossens M, Sabino J, et al. A decrease of the butyrate-producing species
Roseburia hominis and Faecalibacterium prausnitzii defines dysbiosis in patients with
ulcerative colitis. Gut 2014;63:1275-83.
17. Cortese R, Lu L, Yu Y, Ruden D, Claud EC. Epigenome-Microbiome crosstalk: A
potential new paradigm influencing neonatal susceptibility to disease. Epigenetics
2016;11:205-15.
18. Bianco-Miotto T, Craig JM, Gasser YP, van Dijk SJ, Ozanne SE. Epigenetics and
DOHaD: from basics to birth and beyond. J Dev Orig Health Dis 2017;8:513-519.

119
19. Chouraki V, Savoye G, Dauchet L, et al. The changing pattern of Crohn's disease
incidence in northern France: a continuing increase in the 10- to 19-year-old age
bracket (1988-2007). Aliment Pharmacol Ther 2011;33:1133-42.
20. Benchimol EI, Mack DR, Nguyen GC, et al. Incidence, outcomes, and health services
burden of very early onset inflammatory bowel disease. Gastroenterology
2014;147:803-813 e7; quiz e14-5.
21. Ruemmele FM, El Khoury MG, Talbotec C, et al. Characteristics of inflammatory
bowel disease with onset during the first year of life. J Pediatr Gastroenterol Nutr
2006;43:603-9.
22. Kolaček S, Hojsak I. Chronic inflammatory bowel diseases in children – novelties in
the etiology, phenotype, diagnosis and treatment. Pediatr Croat 2017;61:10–25.
23. Jostins L, Ripke S, Weersma RK, et al. Host-microbe interactions have shaped the
genetic architecture of inflammatory bowel disease. Nature 2012;491:119-24.
24. Hedin CR, van der Gast CJ, Stagg AJ, Lindsay JO, Whelan K. The gut microbiota of
siblings offers insights into microbial pathogenesis of inflammatory bowel disease.
Gut Microbes 2017;8:359-365.
25. Knoll RL, Forslund K, Kultima JR, et al. Gut microbiota differs between children with
Inflammatory Bowel Disease and healthy siblings in taxonomic and functional
composition: a metagenomic analysis. Am J Physiol Gastrointest Liver Physiol
2017;312:G327-G339.
26. Ijaz UZ, Quince C, Hanske L, et al. The distinct features of microbial 'dysbiosis' of
Crohn's disease do not occur to the same extent in their unaffected, genetically-linked
kindred. PLoS One 2017;12:e0172605.

120
27. Jacobs JP, Goudarzi M, Singh N, et al. A Disease-Associated Microbial and
Metabolomics State in Relatives of Pediatric Inflammatory Bowel Disease Patients.
Cell Mol Gastroenterol Hepatol 2016;2:750-766.
28. Hedin C, van der Gast CJ, Rogers GB, et al. Siblings of patients with Crohn's disease
exhibit a biologically relevant dysbiosis in mucosal microbial metacommunities. Gut
2016;65:944-53.
29. Joossens M, Huys G, Cnockaert M, et al. Dysbiosis of the faecal microbiota in patients
with Crohn's disease and their unaffected relatives. Gut 2011;60:631-7.
30. Levine A, Koletzko S, Turner D, et al. ESPGHAN revised porto criteria for the
diagnosis of inflammatory bowel disease in children and adolescents. J Pediatr
Gastroenterol Nutr 2014;58:795-806.
31. Fell JM. Update of the management of inflammatory bowel disease. Arch Dis Child
2012;97:78-83.
32. Hyams JS, Ferry GD, Mandel FS, et al. Development and validation of a pediatric
Crohn's disease activity index. J Pediatr Gastroenterol Nutr 1991;12:439-47.
33. Turner D, Otley AR, Mack D, et al. Development, validation, and evaluation of a
pediatric ulcerative colitis activity index: a prospective multicenter study.
Gastroenterology 2007;133:423-32.
35. Andoh A, Kuzuoka H, Tsujikawa T, et al. Multicenter analysis of fecal microbiota
profiles in Japanese patients with Crohn's disease. J Gastroenterol 2012;47:1298-307.
36. Matsumoto M, Sakamoto M, Hayashi H, Benno Y. Novel phylogenetic assignment
database for terminal-restriction fragment length polymorphism analysis of human
colonic microbiota. J Microbiol Methods 2005;61:305-19.

121
37. Li F, Hullar MA, Lampe JW. Optimization of terminal restriction fragment
polymorphism (TRFLP) analysis of human gut microbiota. J Microbiol Methods
2007;68:303-11.
38. Sakamoto M, Hayashi H, Benno Y. Terminal restriction fragment length
polymorphism analysis for human fecal microbiota and its application for analysis of
complex bifidobacterial communities. Microbiol Immunol 2003;47:133-42.
39. Culman SW, Bukowski R, Gauch HG, Cadillo-Quiroz H, Buckley DH. T-REX:
software for the processing and analysis of T-RFLP data. BMC Bioinformatics
2009;10:171.
40. Andoh A, Imaeda H, Aomatsu T, et al. Comparison of the fecal microbiota profiles
between ulcerative colitis and Crohn's disease using terminal restriction fragment
length polymorphism analysis. J Gastroenterol 2011;46:479-86.
41. Shyu C, Soule T, Bent SJ, Foster JA, Forney LJ. MiCA: a web-based tool for the
analysis of microbial communities based on terminal-restriction fragment length
polymorphisms of 16S and 18S rRNA genes. Microb Ecol 2007;53:562-70.
42. de Meij TGJ, de Groot EFJ, Peeters CFW, et al. Variability of core microbiota in
newly diagnosed treatment-naive paediatric inflammatory bowel disease patients.
PLoS One 2018;13:e0197649.
43. Petersen C, Round JL. Defining dysbiosis and its influence on host immunity and
disease. Cell Microbiol 2014;16:1024-33.
44. Ni J, Wu GD, Albenberg L, Tomov VT. Gut microbiota and IBD: causation or
correlation? Nat Rev Gastroenterol Hepatol 2017;14:573-584.
45. Frank DN, St Amand AL, Feldman RA, et al. Molecular-phylogenetic characterization
of microbial community imbalances in human inflammatory bowel diseases. Proc Natl
Acad Sci U S A 2007;104:13780-5.

122
46. Halfvarson J, Brislawn CJ, Lamendella R, et al. Dynamics of the human gut
microbiome in inflammatory bowel disease. Nat Microbiol 2017;2:17004.
47. Hansen R, Russell RK, Reiff C, et al. Microbiota of de-novo pediatric IBD: increased
Faecalibacterium prausnitzii and reduced bacterial diversity in Crohn's but not in
ulcerative colitis. Am J Gastroenterol 2012;107:1913-22.
48. Rehman A, Rausch P, Wang J, et al. Geographical patterns of the standing and active
human gut microbiome in health and IBD. Gut 2016;65:238-48.
49. Walker AW, Sanderson JD, Churcher C, et al. High-throughput clone library analysis
of the mucosa-associated microbiota reveals dysbiosis and differences between
inflamed and non-inflamed regions of the intestine in inflammatory bowel disease.
BMC Microbiol 2011;11:7.
50. Sartor RB. Therapeutic correction of bacterial dysbiosis discovered by molecular
techniques. Proc Natl Acad Sci U S A 2008;105:16413-4.

123
Paper 3
Characteristics of polymeric formula and route of delivery of
exclusive enteral nutrition have no effect on disease outcome
and weight gain in pediatric Crohn's disease
Clinical Nutrition 39 (2019) 1108‐1111

124
Characteristics of polymeric formula and route of delivery of exclusive enteral nutrition
have no effect on disease outcome and weight gain in pediatric Crohn’s disease
Iva Hojsaka,b,c, Karlo Maticb, Sara Silaa, Ivana Trivića, Zrinjka Mišaka,b, Sanja Kolačeka,b
Affiliation:
aReferral Center for Pediatric Gastroenterology and Nutrition, Children’s Hospital Zagreb,
Zagreb, Croatia
bUniversity of Zagreb, School of Medicine, Zagreb, Croatia
cUniversity J.J. Strossmayer, School of Medicine, Osijek, Croatia
Corresponding author:
Iva Hojsak, MD, PhD
Referral Center for Pediatric Gastroenterology and Nutrition,
Children’s Hospital Zagreb
Klaićeva 16, Zagreb, Croatia
Phone:+385-1-4600130, Fax: +385-1-4600160
e-mail: [email protected]

125
ABSTRACT
Background and aims: This study aimed to evaluate the effect of the route of exclusive enteral
nutrition (EEN) delivery (orally or via nasogastric (NG) tube) and type of polymeric formula
(with taste vs tasteless and isocaloric vs hypercaloric) on the disease outcome and nutritional
status in children with Crohn’s disease (CD).
Methods: This was a single center retrospective study which included all CD patients whose
active disease at diagnosis was treated with EEN in the period from October 2007 to November
2017. All patients received polymeric formula orally or through a NG tube, which was based
on the physicians and child’s preference.
Results: A total of 92 CD patients were included in the study (mean age 13.6±3.0 years; 45.7%
female). Overall, 42 (45.7%) patients received EEN via NG tube until the end of the EEN
period. Remission was achieved in 71 (77.2%) children. There was no difference in the EEN
failure status, remission duration, inflammatory markers, and weight gain at the end of the EEN
period between oral intake and NG tube groups.
None of the factors including age, disease location, type of formula (with taste vs tasteless and
isocaloric vs hypercaloric) and mode of delivery (orally vs through NG tube for the whole
duration of EEN) demonstrated an association with EEN failure.
Conclusion: This study failed to demonstrate an effect of the route of EEN delivery and the
characteristics of the polymeric formula on the outcome of treatment in pediatric patients with
CD.
Key words: Crohn’s disease; enteral nutrition; naso-gastric tube; polymeric feeds;

126
INTRODUCTION
Crohn’s disease (CD) is a lifelong, chronic inflammatory disease mainly involving the
gastrointestinal tract which is characterized by periods of remission and relapses (1). It has been
known for years that exclusive enteral nutrition (EEN) is efficacious in inducing remission,
along with improving nutritional status in children with CD (2). The overall combined
remission rate for EEN is 73% (relative risk (RR) 0.95, 95% confidence interval (CI) 0.67–
1.3428) (3) and has the same efficacy in the induction of remission as corticosteroids, but with
much less side effects (4). EEN is, therefore, recommended as a first line therapy for remission
induction in children/adolescents with active luminal CD (5). There are studies demonstrating
that the protein source does not affect the efficacy of EEN (6-8), therefore, polymeric formula
is preferred due to the better palatability and the lower costs (4, 9).
The recently published position paper of the European Society of Pediatric
Gastroenterology, Hepatology and Nutrition (ESPGHAN) recommends that EEN should
comprise of polymeric formula taken orally, while nasogastric (NG) tube may be used when
there is failure to achieve adequate oral intake (4). However, it was recognized that there is no
strong evidence whether the route of delivery and characteristics of polymeric formula have an
influence on disease course and weight gain in children with CD.
Therefore, this study aimed to evaluate whether the treatment outcome and nutritional
status differ in respect to the route of EEN delivery (orally or via NG tube) and characteristics
of polymeric formula (with taste vs tasteless and isocaloric vs hypercaloric).
MATERIALS AND METHODS
We retrospectively analyzed data on all children who were diagnosed with CD and
followed up for at least one year at the Children’s Hospital Zagreb (tertiary medical center)
from October 2007 to November 2017. Only children in whom EEN was used as a first
remission induction therapy were included. All patients were seen and followed by 3 pediatric
gastroenterologists, from which two preferentially prescribed EEN by oral route, while one
preferred prescribing EEN by NG tube. Patient assignment to one of the senior pediatric
gastroenterologists was arbitrary and determined only by the initial physician contact. EEN was
given as a polymeric formula. All patients who received EEN via NG tube received standard,
isocaloric, flavorless enteral formula (Osmolite®, Abbott), while patients receiving EEN orally
usually received palatable oral enteral formula that was either isocaloric (PediaSure®, Abbott
or Modulen®, Nestle) or hypercaloric (1.5 kcal/ml) (Ensure Plus®, Abbott or Resource
127
Junior®, Nestle). The choice of formula depended on the taste preference of the
child/adolescent.
The caloric requirements were calculated for every specific patient and the optimal
volume of EEN was determined. EEN was initiated during hospital stay and the amount of
formula was step-wisely increased over a period of 2 to 5 days. Patients were advised to
distribute enteral formula into 4-5 even bolus feeds per day, but the method of intake was left
to their discretion. EEN was given over a period of 6 to 8 weeks as induction therapy and was
only prematurely ceased if the therapy was not tolerated or if remission was not achieved.
Methodological review of each chart was performed, and the following data was
extracted: type of the disease, age, gender, weight and height for age standard deviation score
(SDS) and body mass index (BMI) SDS, inflammatory markers, disease location, type of EEN,
route of EEN delivery, and maintenance treatment. All data was extracted from the diagnosis
(the time of introduction of EEN) and during the follow up at the end of EEN therapy. The
diagnosis of CD was established according to the revised Porto criteria (10), while disease
location was defined using the Paris classification (11). Relapse was defined as a Pediatric CD
Activity Index (PCDAI) score of >10 (12) and the need for other remission induction therapy
and remission as PCDAI ≤10 (12). EEN failure was defined as the inability to reduce symptoms
and normalize inflammatory markers during EEN use, along with the need for step up to
corticosteroid therapy. Malnutrition was defined using World Health Organization (WHO)
criteria and the BMI for age <−2 SDS was classified as undernutrition and BMI for age of >2
SDS as overweight (13).
As for the treatment, ECCO/ESPGHAN guidelines were followed whenever applicable
(5).
The primary outcome was to assess whether the route of EEN delivery (oral or via NG
tube) had an effect on EEN failure and remission duration. The secondary outcomes were to
assess whether route of EEN delivery (oral or via NG tube) had an impact on weight gain, need
for escalation in maintenance treatment, and the need for corticosteroid use in the first year of
diagnosis. Furthermore, it was assessed whether characteristics of polymeric formula
(isocaloric vs hypercaloric and with taste vs tasteless), route of EEN delivery (orally vs NG
tube), volume of EEN, and disease location have an influence on EEN failure.
Statistics. The differences between categorical variables were assessed by chi-square test. The
differences for non-categorical variables were assessed by two tailed Student t test for
independent samples. Binary logistic regression model was used to assess characteristics of

128
polymeric formula (isocaloric vs hypercaloric and with taste vs tasteless), mode of EEN
delivery (orally vs NG tube), volume of EEN, and disease location have an influence on EEN
failure. P values less than 0.05 were considered significant. Statistical analysis was performed
using SPSS 19.0 (Chicago, IL) statistical software.
RESULTS
A total of 92 CD patients were included in the study, majority were male (50, 54.3%).
Epidemiological data at the diagnosis is presented in Table 1. Majority of patients (n=70, 76%)
were well nourished at diagnosis, 19 (20.7%) were undernourished and 3 (3.3%) were
overweight.
Table 1. Epidemiological data at diagnosis; SD – standard deviation;
Age (mean ±SD, years) 13.6±3.0
Gender, female (%) 42 (45.7)
Duration of symptoms before diagnosis (mean ±SD, months) 4.6±4
Weight for age Z score (mean ±SD) -0.8±1.1
Height for age Z score (mean ±SD) -0.5±1.0
BMI for age Z score (mean ±SD) -0.6±1.4
Disease location (n, %)
L1
L2
L3
20 (21.7)
18 (19.6)
54 (58.7)
Upper gastrointestinal disease (n, %) 40 (43.5)
Perianal disease (n, %) 13 (14.1)
A total of 71 (77.2%) children treated with EEN achieved remission. Overall, 44
(47.8%) patients had a NG tube for the provision of EEN at the beginning of EEN, but 2 patients
reverted to oral intake, leaving 42 (45.7%) patients that received EEN via NG tube until the end
of the EEN period. None of the patients receiving oral EEN switched to a NG tube. Overall, 42
(45.7%) patients received formula with taste, from which 12 patients received a hypercaloric

129
formula (1.5 kcal/ml), 30 patients received an isocaloric formula (1 kcal/ml), and 50 received a
standard isocaloric, tasteless, polymeric formula.
There was no significant difference in the group receiving EEN orally vs via NG tube
in gender, age, disease location, presence of upper gastrointestinal or perianal disease, provided
energy, weight gain, laboratory indices and concomitant therapy (Table 2).
Table 2. Difference between patients treated with exclusive enteral nutrition (EEN) orally and
via nasogastric (NG) tube at diagnosis.
Oral (n=50) NG tube (n=42) p
Sex (female/male) 20/30 22/20 0.295
Age (mean ± SD, years) 13.5 ± 3.3 13.4 ± 2.7 0. 968
Location (n, %)
L1
L2
L3
12 (24)
8 (16)
30 (60)
8 (19.1)
10 (23.8)
24 (57.1)
0.606
Upper gastrointestinal disease (n, %) 26 (52) 14 (33.3) 0.092
Perianal disease (n, %) 4 (8) 9 (21.4) 0.078
Duration of EEN (mean ± SD, weeks) 5.2 ± 2.5 5.4 ± 2.4 0.46
Energy provided by EEN (kcal/kg,
mean ± SD)
47.7 ± 1.96 51.6 ± 1.93 0.166
CRP change after EEN (mg/L, mean ±
SD)
-21.6 ± 5.8 -36.3 ± 6.8 0.1
Hemoglobin change after EEN (g/L,
mean ± SD)
1.5 ± 1.4 2.8 ± 3.3 0.707
Weight change after EEN (kg, mean ±
SD)
0.1 ± 2.8 0.4 ± 2.8 0.252
BMI change after EEN (kg/m2, mean
± SD)
-0.1± 1.0 0.1 ± 1.1 0.553

130
Concomitant maintenance therapy (n,
%)
None
Azathioprine
Methotrexate
Mesalamine
7 (14)
36 (72)
1 (2)
6 (12)
3 (7.1)
28 (66.7)
1 (2.4)
10 (23.8)
0.403
EEN failure (n, %) 12 (24) 9 (21.4) 0.808
Number of the relapses in the first year 0.86 ± 0.12 0.86 ± 0.14 1.0
Need for corticosteroids in the first
year from diagnosis (n, %)
8 (16) 11 (26.2) 0.303
Duration of remission after EEN (time
to first relapse, months) (mean ± SD)
12.3 ± 2.3 12.9 ± 3.1 0.877
Need for escalation in the
maintenance treatment in the first year
(n, %)
28 (56) 27 (64.3) 0.523
BMI – body mass index, CRP - C reactive protein, SD – standard deviation.
Binary logistic regression multivariable analysis failed to connect any of the assessed
factors, including age, disease location, characteristics of the formula (with taste vs tasteless
and isocaloric vs hypercaloric), and mode of delivery (orally vs trough NG tube for the whole
duration of EEN) with EEN failure (Table 3).
Table 3. Risk factors at diagnosis evaluated with respect to exclusive enteral nutrition (EEN)
failure. Binary logistic regression multivariable model; NG- nasogastric.
HR 95% CI
Age 1.011 0.742-1.378
Disease location
L1
L2
0.254
1.518
0.045-1.429
0.423-5.449
Enteral formula with taste 0.412 0.086-1.960
Hypercaloric (1.5 kcal/ml) enteral formula 2.5 0.377-16.588

131
NG tube for the duration of EEN 1.001 0.286-3.504
Energy intake via EEN (kcal/kg body weight) 0.964 0.907-1.025
DISCUSSION
This retrospective study suggests that the route of delivery of EEN, as well as the
characteristics of the polymeric formula, have no influence on its effectiveness in remission
induction, disease course, and nutritional status. Current guidelines recommend EEN as a first
line therapy for luminal CD (4, 5). EEN has several beneficious effects. It induces remission,
decreases mucosal inflammation, and promotes weight gain (14-23). The mechanisms of action
for EEN are not yet fully elucidated, but include suppression of proinflammatory mediators in
the intestinal mucosa (15, 19, 24), reduced production of IL-1, IL-6, IL-8, and TNF-alpha (25),
and a significant impact on intestinal microbiota (26).
A recent meta-analysis (27) confirmed the effectiveness of EEN in the pediatric
population, contrary to adult patients. The reason as to why EEN is very effective in pediatric
patients is not completely clear. It could be partially explained by the lower tolerance and
compliance to EEN in adults, which is mainly related to the necessity for adults to wear a NG
tube (27).
Since EEN was introduced as a treatment strategy for children with CD, many different
protocols were evaluated, including the composition of enteral formula, mode of EEN delivery,
as well as duration of EEN. For some of the choices, there is reasonable evidence guiding the
clinical practice. First off, it was shown that there is no additional benefit if protein in the
formula was hydrolyzed (6-8). Therefore, current guidelines recommend the use of polymeric
formula (5). Otherwise, guidelines prefer an oral route of administration. The main reason why
oral intake is preferred in children and adolescents with CD, is the psychological impact linked
to the wearing of a NG tube (28). However, the recommendation to prefer oral intake is almost
solely based on expert opinions, as worldwide practices differ. There is only one retrospective
pediatric study which compared oral to continuous EEN via NG tube (20). That study found no
difference in remission induction, PCDAI, as well as the individual clinical and biological
parameters between groups at the end of an EEN period of 8 weeks. The only significant
difference found was in weight gain, which was significantly higher in the continuous EEN
group. Our study provided bolus feeding via oral route or via NG tube, but failed to show any
difference in the outcomes, including weight gain. The results involving weight gain was of a
much lower proportion in our study compared to a study reported by Rubio et al (20), but the

132
weight for age Z score at diagnosis in our cohort was significantly higher compared to the above
mentioned study (mean value of -1.2 and -1.3 SD in Rubio et al study vs -0.8 SD in this study).
The difference in weight gain could be partially explained by the fact that patients in our study
received EEN as a bolus treatment. Therefore, regardless of whether they had a NG tube or oral
EEN, they could decrease the volume of EEN per day without revealing this to their physician.
On the contrary, the study by Rubio et al, provided EEN via NG tube, but as a continuous feed
delivered by volumetric enteral pump. The volume was predefined and therefore less prone to
the patient’s influence.
In our study, EEN was able to induce remission in 77% of patients, which is similar to
previous reports (29, 30). None of the investigated factors related to EEN (route, characteristics
of the formula or volume of EEN), disease location and age were associated with treatment
failure.
There are several limitations to our study. It is a single-center retrospective study and
therefore, patients were not randomized, but rather inclusion into the group was dependent
solely on the recommendation of the physician and acceptance of the child/adolescent and their
family. Furthermore, caloric intake that was actually taken could not be measured. The total
duration of EEN also varied and therefore, nutritional status was not measured in the same time
points for all patients. Finally, it is important to emphasize that this study was initiated due to
an observation made in several patients who limited their oral bolus intake to the extent of
deterioration of their nutritional status. The main reason for this was the inability to drink the
prescribed/required amount of the EEN.
However, regardless of the limitations, to our knowledge, this is the first study that
looked at the role of EEN route on disease outcomes. In conclusion, our results support the
current recommendation that oral intake should be first choice together with palatable enteral
formula.

133
Ethical approval: All procedures performed in studies involving human participants were in
accordance with the ethical standards of the institutional ethics committee and with the 1964
Helsinki declaration and its later amendments or comparable ethical standards.
Study was approved by Ethics Committee Children’s Hospital Zagreb (IRB number:
21102014).
Informed consent: Informed consent was obtained from all individual participants and at least
one of their parents included in the study.
Conflict of interest statement: Iva Hojsak received honorarium for lectures or consultation for
BioGaia, Nutricia, Nestle, GM pharma, Chr Hansen. Sanja Kolaček received lecture fees from
Abbott, Abbvie, Fresenius, Nestle, Shire, Nutricia. Other authors have stated that they have no
conflict of interest.

134
REFERENCES
1. Shanahan F. Crohn's disease. Lancet 2002;359:62-9.
2. Zachos M, Tondeur M, Griffiths AM. Enteral nutritional therapy for induction of
remission in Crohn's disease. Cochrane Database Syst Rev 2007;CD000542.
3. Heuschkel RB, Menache CC, Megerian JT, Baird AE. Enteral nutrition and
corticosteroids in the treatment of acute Crohn's disease in children. J Pediatr
Gastroenterol Nutr 2000;31:8-15.
4. Miele E, Shamir R, Aloi M, et al. Nutrition in Pediatric Inflammatory Bowel Disease:
A Position Paper on Behalf of the Porto Inflammatory Bowel Disease Group of the
European Society of Pediatric Gastroenterology, Hepatology and Nutrition. J Pediatr
Gastroenterol Nutr 2018;66:687-708.
5. Ruemmele FM, Veres G, Kolho KL, et al. Consensus guidelines of ECCO/ESPGHAN
on the medical management of pediatric Crohn's disease. J Crohns Colitis 2014;8:1179-
207.
6. Akobeng AK, Miller V, Stanton J, Elbadri AM, Thomas AG. Double-blind randomized
controlled trial of glutamine-enriched polymeric diet in the treatment of active Crohn's
disease. J Pediatr Gastroenterol Nutr 2000;30:78-84.
7. Ludvigsson JF, Krantz M, Bodin L, Stenhammar L, Lindquist B. Elemental versus
polymeric enteral nutrition in paediatric Crohn's disease: a multicentre randomized
controlled trial. Acta Paediatr 2004;93:327-35.
8. Verma S, Brown S, Kirkwood B, Giaffer MH. Polymeric versus elemental diet as
primary treatment in active Crohn's disease: a randomized, double-blind trial. Am J
Gastroenterol 2000;95:735-9.
9. Rodrigues AF, Johnson T, Davies P, Murphy MS. Does polymeric formula improve
adherence to liquid diet therapy in children with active Crohn's disease? Arch Dis Child
2007;92:767-70.
10. Levine A, Koletzko S, Turner D, et al. ESPGHAN revised porto criteria for the
diagnosis of inflammatory bowel disease in children and adolescents. J Pediatr
Gastroenterol Nutr 2014;58:795-806.
11. Fell JM. Update of the management of inflammatory bowel disease. Arch Dis Child
2012;97:78-83.

135
12. Hyams JS, Ferry GD, Mandel FS, et al. Development and validation of a pediatric
Crohn's disease activity index. J Pediatr Gastroenterol Nutr 1991;12:439-47.
13. Bloem M. The 2006 WHO child growth standards. BMJ 2007;334:705-6.
14. Afzal NA, Van Der Zaag-Loonen HJ, Arnaud-Battandier F, et al. Improvement in
quality of life of children with acute Crohn's disease does not parallel mucosal healing
after treatment with exclusive enteral nutrition. Aliment Pharmacol Ther 2004;20:167-
72.
15. Beattie RM, Schiffrin EJ, Donnet-Hughes A, et al. Polymeric nutrition as the primary
therapy in children with small bowel Crohn's disease. Aliment Pharmacol Ther
1994;8:609-15.
16. Grover Z, Muir R, Lewindon P. Exclusive enteral nutrition induces early clinical,
mucosal and transmural remission in paediatric Crohn's disease. J Gastroenterol
2014;49:638-45.
17. Borrelli O, Cordischi L, Cirulli M, et al. Polymeric diet alone versus corticosteroids in
the treatment of active pediatric Crohn's disease: a randomized controlled open-label
trial. Clin Gastroenterol Hepatol 2006;4:744-53.
18. Berni Canani R, Terrin G, Borrelli O, et al. Short- and long-term therapeutic efficacy of
nutritional therapy and corticosteroids in paediatric Crohn's disease. Dig Liver Dis
2006;38:381-7.
19. Fell JM, Paintin M, Arnaud-Battandier F, et al. Mucosal healing and a fall in mucosal
pro-inflammatory cytokine mRNA induced by a specific oral polymeric diet in
paediatric Crohn's disease. Aliment Pharmacol Ther 2000;14:281-9.
20. Rubio A, Pigneur B, Garnier-Lengline H, et al. The efficacy of exclusive nutritional
therapy in paediatric Crohn's disease, comparing fractionated oral vs. continuous enteral
feeding. Aliment Pharmacol Ther 2011;33:1332-9.
21. Gerasimidis K, Talwar D, Duncan A, et al. Impact of exclusive enteral nutrition on body
composition and circulating micronutrients in plasma and erythrocytes of children with
active Crohn's disease. Inflamm Bowel Dis 2012;18:1672-81.
22. Werkstetter KJ, Schatz SB, Alberer M, Filipiak-Pittroff B, Koletzko S. Influence of
exclusive enteral nutrition therapy on bone density and geometry in newly diagnosed
pediatric Crohn's disease patients. Ann Nutr Metab 2013;63:10-6.

136
23. Azcue M, Rashid M, Griffiths A, Pencharz PB. Energy expenditure and body
composition in children with Crohn's disease: effect of enteral nutrition and treatment
with prednisolone. Gut 1997;41:203-8.
24. Breese EJ, Michie CA, Nicholls SW, et al. The effect of treatment on lymphokine-
secreting cells in the intestinal mucosa of children with Crohn's disease. Aliment
Pharmacol Ther 1995;9:547-52.
25. Yamamoto T, Nakahigashi M, Umegae S, Kitagawa T, Matsumoto K. Impact of
elemental diet on mucosal inflammation in patients with active Crohn's disease:
cytokine production and endoscopic and histological findings. Inflamm Bowel Dis
2005;11:580-8.
26. Leach ST, Mitchell HM, Eng WR, Zhang L, Day AS. Sustained modulation of intestinal
bacteria by exclusive enteral nutrition used to treat children with Crohn's disease.
Aliment Pharmacol Ther 2008;28:724-33.
27. Narula N, Dhillon A, Zhang D, et al. Enteral nutritional therapy for induction of
remission in Crohn's disease. Cochrane Database Syst Rev 2018;4:CD000542.
28. Gailhoustet L, Goulet O, Cachin N, Schmitz J. [Study of psychological repercussions
of 2 modes of treatment of adolescents with Crohn's disease]. Arch Pediatr 2002;9:110-
6.
29. Buchanan E, Gaunt WW, Cardigan T, et al. The use of exclusive enteral nutrition for
induction of remission in children with Crohn's disease demonstrates that disease
phenotype does not influence clinical remission. Aliment Pharmacol Ther 2009;30:501-
7.
30. Day AS, Whitten KE, Lemberg DA, et al. Exclusive enteral feeding as primary therapy
for Crohn's disease in Australian children and adolescents: a feasible and effective
approach. J Gastroenterol Hepatol 2006;21:1609-14.

137
Paper 4
Healthy siblings of children with Crohn’s disease exhibit more
rapid changes in microbiota composition as a response to
exclusive enteral nutrition
Journal of Parenteral and Enteral Nutrition (2021) [published online
ahead of print, 2020 Aug 2]

138
Healthy siblings of children with crohn’s disease exhibit more rapid changes in microbiota
composition as a response to exclusive enteral nutrition
Sara Sila, MSc1, Marko Jelić, PhD2, Ivana Trivić, MD1, Arjana Tambić Andrašević, MD,
PhD2,3, Sanja Kolaček, MD, PhD1,5*, Iva Hojsak, MD, PhD1,4,5*
Affiliation:
1Children’s Hospital Zagreb, Zagreb, Croatia
2University Hospital for Infectious Diseases, Zagreb, Croatia
3 University of Zagreb, School of Dental Medicine, Zagreb, Croatia
4University J.J. Strossmayer, School of Medicine Osijek, Osijek, Croatia
5University of Zagreb, School of Medicine, Zagreb, Croatia
*Authors contributed equally and share last authorship
Corresponding author
Assistant Professor Iva Hojsak, MD, PhD,
Referral center for pediatric gastroenterology and nutrition
Children’s Hospital Zagreb
Klaićeva 16, 10000 Zagreb, Croatia
Phone: +38514600130; Fax: +38514600160
e-mail: [email protected]

139
ABSTRACT
Background: The impact of exclusive enteral nutrition (EEN) on the microbiota of healthy
siblings of children with Crohn’s disease (CD) is not known. The aim of this study was to
determine the impact of EEN on the microbiota composition of the newly-diagnosed CD
patients and to determine the effect of EEN received for two days in siblings of patients with
CD.
Materials and Methods: Newly-diagnosed paediatric CD patients (n=17) and unaffected healthy
siblings (n=10) participated in the study. In CD patients stool samples were collected at three
time points: prior to therapy introduction, the second day and the last day of EEN therapy. In
healthy siblings stool samples were collected before the introduction of EEN and the second
day of EEN. Molecular approach targeting 16S ribosomal RNA was employed for analyzing
the gut microbiota of participants’ stool samples.
Results: There was no significant difference in microbial diversity between children with CD
and healthy siblings before EEN (p=0.127 for HhaI-digestion; p=0.604 for MspI-digestion) as
opposed to the second day of EEN (p=0.006 HhaI-digestion; p=0.023 MspI-digestion). In
healthy controls, significant changes in microbiota composition were apparent already on the
second day of EEN, contrary to children with CD in whom similar changes in microbiota
composition were apparent on the last day of EEN.
Conclusion: EEN leads to significant microbiota changes in both healthy and children with CD.
Changes in microbiota composition occur more rapidly in healthy children, while in children
with CD significant changes were detected at the end of EEN.
Keywords: Crohn’s disease, microbiota, exclusive enteral nutrition

140
CLINICAL RELEVANCY STATEMENT
Studies have shown that exclusive enteral nutrition (EEN) causes significant changes in
the microbiota composition of patients with Crohn’s disease (CD). However, no study to date
explored the impact of EEN on the microbiota of healthy children. Therefore, it is not known if
EEN would have the same effect on the microbiota of healthy individuals, and, more
specifically, on the microbiota of genetically related individuals. Studying microbiota of
healthy siblings of children with CD would give new insights into the mechanism of action of
EEN in children with CD.
INTRODUCTION
The etiopathogenesis of Crohn's disease (CD) is unclear, however, it has been proposed
that environmental, genetic and immune factors are interacting and triggering abnormal
immune response to gut microbiota/content in genetically predisposed individuals1. It could be
hypothesized, therefore, that gut microbial content has an important role in the development of
CD, particularly as it has already been shown that patients with CD have different microbiota
composition compared to healthy controls 2. However, whether this is a cause or a consequence
of the disease remains speculative. With the diet being one of the most prominent environmental
factors associated with changes in the gut microbiota, strong emphasis in the recent years has
been put on the influence of diet on the microbiota of CD patients 3.
The best evidence on the efficacy of a dietary intervention in treatment of CD is
available for exclusive enteral nutrition (EEN) 4. EEN administered for 6-8 weeks is as effective
as corticosteroid therapy 5,6, moreover it improves nutritional status, initiates mucosal healing,
and, as such, is recommended as a first line treatment in the newly-diagnosed paediatric patients
7. Although the mechanism of action of EEN has not been fully elucidated, studies have shown
that EEN causes significant changes in the microbiota composition of patients with CD, which

141
may lead to modification of microbial-based gut inflammation and consequently – remission of
the disease 4,8. Current evidence supports the notion that CD is associated with community-
level imbalances in gut microbiota, rather than presence or absence of certain bacterial species
9,10, therefore community level changes could have an influence on disease course.
Even though one would expect that EEN causes gut microbiota to change in a way that
would more closely resemble the microbiota composition of heathy controls, studies have
shown mixed results 4,8. More specifically, studies have shown that EEN, at least initially, may
increase microbial dysbiosis in patients with CD 11–14. It was proposed by MacLellan et al. 8,
that EEN perhaps disrupts established dysbiotic microbial communities, and allows for
recolonization and formation of a „heathier“ microbiota. However, no study to date explored
the impact of EEN on the microbiota of healthy children. Therefore, it is not known if EEN
would have the same effect on the microbiota of healthy individuals, and, more specifically, on
the microbiota of genetically related individuals, sharing the same environment, of whom only
one has developed the disease.
The aim of this study was to determine the impact of EEN on the microbiota of the
newly-diagnosed CD patients, and to determine the effect of EEN in siblings of patients with
CD who consent to receiving it for two days.
MATERIALS AND METHODS
Patients and study design
Newly diagnosed paediatric CD patients and their unaffected healthy siblings were
recruited at the Referral Centre for Pediatric Gastroenterology and Nutrition at the Children’s
Hospital Zagreb. All parents and participants older than 9 years of age gave written informed
consent. The diagnosis of inflammatory bowel disease (IBD) was established according to the
revised Porto criteria 15, while disease location was defined using the Paris classification 16.
Severity of the disease was estimated by Pediatric Crohn’s disease activity index (PCDAI) 17.

142
EEN failure was defined as the inability to reduce symptoms and normalize inflammatory
markers during EEN use, along with the need for step up to corticosteroid therapy. Exclusion
criteria in healthy siblings included unintentional weight loss in the last 6 months, changes in
stool frequency or consistency or other symptoms suggestive of undiagnosed IBD.
In CD patients in whom the first line of treatment was EEN, stool samples were collected
at three time points: prior to therapy introduction (in suspected patients, before the endoscopy
was performed), the second day of EEN therapy (between 24 and 48 hours after starting EEN)
and the last day of EEN therapy before the introduction of normal food (the last stool sample
was not collected only in those patients who haven’t finished the full course of EEN). The
duration of EEN depended on the choice of the physician, and lasted from 6 to 8 weeks. In
healthy siblings who accepted the invitation to participate in the study and who consented to
taking EEN for two days, stool samples were collected at two time points: before the
introduction of EEN (close to the time of diagnosis of CD in their siblings) and the second day
of EEN (before the introduction of normal food). EEN was given as a polymeric formula. The
choice of formula depended on the taste preference of the patient (in 6 children the formula
used was Osmolite, Ensure + was used in 5 children, Pediasure was used in 4 children, Modulen
IBD was used in 1 child and Resource Junior in 1 child). Healthy siblings used the same EEN
formula as the one that was provided to the patient with CD (except in the case of Osmolite
when another isocaloric formula was given to healthy siblings due to unpleasant taste). Quantity
of consumed formula was recorded in all patients and healthy siblings.
All stool samples were stored in the hospital or at home at -20°C for a maximum of 24
hours, after which they were transferred in the cold packs in the interval of 15 min to the
Department of Clinical Microbiology at the University Hospital for Infectious Diseases and
stored at -80°C.

143
Additionally, for each CD patient, type of the disease, age, gender, weight and height
for age standard deviation score (SDS) and body mass index (BMI) SDS, inflammatory
markers, disease location, type of EEN, and maintenance treatment were collected at the
diagnosis and at the end of EEN.
Total fecal DNA extraction, from ~150 mg of stool samples, was performed using
Quick-DNATM Fecal/Soil Microbe Miniprep Kit (Zymo Research, USA) according to
manufacturer’s instructions.
PCR amplification and T-RFLP analysis
PCR amplification and terminal restriction fragment length polymorphism (T-RFLP)
analysis were performed according to Andoh et al with slight modifications 18. 6'-
carboxyfluorescein (6-FAM) labeled 27-F (6-FAM-5'-AGAGTTTGATCCTGGCTCAG-3')
and 1492R (5'-GGTTACCTTGTTACGACTT-3') primers (Thermo Fisher Scientific, USA)
were used for the amplification of the 16S rRNA gene from the human fecal DNA 18. The PCR
amplification (20 ng of DNA) was performed in 50 µL reactions, in triplicates, according to
previously described protocol19. Amplified DNA was purified using QIAquick PCR
Purification Kit (Qiagen, Germany) and diluted in 50 µL of elution buffer.
HhaI and MspI enzymes were used for the restriction of amplified 16S rRNA genes 18.
120 ng of purified PCR product was digested separately in 30 µL reaction volumes, using 1 µL
of FastDigest HhaI and FastDigest MspI (Thermo Fisher Scientific, USA) at 37°C for one hour.
Restriction products were purified by ethanol/ sodium acetate/EDTA precipitation and
resuspended in 12 µL deionized formamide (Thermo Fisher Scientific, USA) to a final
concentration of 10 ng/ µL 20. 3 µL of restriction digest product (~36 ng) was mixed with 11
µL of deionized formamide and 0.5 µL of fourfold diluted GS2500ROX (Thermo Fisher
Scientific, USA). The length of the terminal restriction fragments (T-RFs) was determined with

144
an ABI PRISM 310 genetic analyzer in GeneScan mode (20s injection time; 15 kV, and 60°C
for 48 min for each sample) (Thermo Fisher Scientific, USA) 19.
Fragment sizes were estimated by using the Local Southern Method GeneMapper 3.7
software (Thermo Fisher Scientific, USA). T-RFs in the range of 50–810 bp with a peak height
greater than 25 fluorescence units were included in the analysis. Alignment of T-RFs was
performed by T-REX software (http://trex.biohpc.org/) 20. Binning threshold of 2 bp was used
for assignment of T-RFs to operational taxonomic units (OTUs) 18. The OTUs were quantified
as the percentage values of an individual OTU per total OTU area, and this was expressed as
the % area of the underpeak curve (% AUC) 21.
Water suspension of equivalently mixed E. coli, Lactobacillus and Staphylococcus
aureus bacterial cells was used as a positive control and Microbial DNA-Free Water (Qiagen,
Germany) was used as a negative control for DNA extraction.
Assignment of OTUs to bacterial taxa was performed in silico using the web-based
analysis tool (PAT+) provided by MiCA3 (http://mica.ibest.uidaho.edu/pat.php), based on the
RDP (Ribosomal Database Project) release 10 16s rRNA gene database 22.
Statistics
The differences between categorical variables were assessed by chi-square test. The
Kolmogorov–Smirnov test was applied to test whether the data have a normal distribution. As
quantitative variables were not normally distributed difference between healthy controls and
patients with CD were determined by Mann-Whitney U test. Repeated measures for CD patients
were analyzed by Friedman test; post hoc analysis was performed by Wilcoxon test (with
Bonferroni adjustment where p-values from the Wilcoxon tests were multiplied by the number
of tests being carried out). Repeated measures for heathy siblings were analyzed by Wilcoxon
test.

145
We have also performed a paired analysis between patients and their own siblings (only
patients who had sibling that participated) using a paired Wilcoxon sign rank to assess the
variation between the sample diversity.
The relative abundance of OTUs was used to calculate Shannon-Wiener diversity index
in order to compare diversity between different sample groups. Cluster analyses were
performed using BioNumerics software (Applied Maths, Belgium) based on the HhaI or MspI
T-RFLP patterns. Due to high number of variables in OTU comparisons, p values were adjusted
for multiple comparison (based on two groups and 3 comparisons in time, p value was decreased
by 5 times), values less than 0.01 were considered significant.
Difference in abundance of OTUs between patients and their sibling pairs was analyzed
with permutational multivariate analysis of variance (PERMANOVA) taking sampling time
into account (fixed effect, using type III sum of squares and unrestricted permutation of data
with 999 permutations). Data were transformed (square root), Bray-Curtis measure was used to
assess dissimilarities and centroids were determined for every group (patients and controls) and
sample time point (baseline, day 2 and day 42). Principal coordinates ordination analysis (PCO)
was used to visually present dissimilarities between conditions (patients and controls) at each
sampling time (baseline, day 2 and day 42).
Statistical analysis was performed using SPSS 23.0 (Chicago, IL) and Primer 7 software
(Auckland, New Zealand).
Study was approved by Ethics Committee of the Children’s Hospital Zagreb (IRB
number: 21102014).
RESULTS
Seventeen newly-diagnosed children with CD and 10 of their healthy siblings
participated in the study. Baseline characteristics of study participants are shown in Table 1.
Ten of the children with CD started with concomitant azathioprine treatment during EEN (at

146
the 3rd week of EEN treatment). The average quantity of formula in patients was 1900 ± 316.23
ml and in healthy siblings 1890 ± 433.21 ml per day (p=0.824).
In total, 48 samples were collected from children with CD. In 14 patients all 3 stool
samples were collected, while the last sample at the end of EEN was not collected in 3 patients
who failed EEN before the end of an EEN treatment. In 3 patients who have failed EEN before
the end of EEN course, pre-treatment sample and 2nd day of EEN sample were included into
the analysis. In two patients who have finished the whole course of EEN, but were not in full
remission by the end of EEN, stool samples on the last day of EEN were collected and included
into the analysis. On average, PCDAI decreased by 15.15 points (p=0.001) and remission was
achieved in 70.6% of patients using EEN.
Ten healthy siblings participated in the study (epidemiological data presented in Table
1). In total, 20 samples were collected from healthy controls, with all healthy controls providing
two stool samples – before EEN and on the second day of EEN. Since not all patients have
siblings which are under 18 years of age, the number of included siblings is lower than the
number of CD patients.

147
Table 1. Demographic characteristics of participants. BMI body mass index; CD Crohn's
disease; IQR – interquartile range (25th to 75th percentile); SD- standard deviation;
BMI, body mass index; CD, Crohn’s disease
Start of EEN
Difference in microbial diversity estimated by HhaI/MspI-digested T-RF patterns
between all children with CD and healthy siblings at the start of EEN is presented in Figure 1.
CD (n=17) Healthy siblings
(n=10)
p-value
Male, n (%) 9 (52.9%) 3 (30.0%) 0.247
Age (years), mean (SD) 15.98 (1.46) 14.20 (3.02) 0.127
Body weight (z-score), median
(min, max) [IQR]
-0.12 (-2.42, 1.36)
[-0.42-0.19]
0.72 (-1.83, 1.84)
[-0.31-0.96]
0.170
Body height (z-score), median (min,
max) [IQR]
-0.33 (-1.4, 1.81)
[-0.92-0.12]
0.17 (-1.68, 0.87)
[-0.87-0.66]
0.414
BMI (z-score), median (min, max)
[IQR]
0.24 (-3.59, 1.54)
[-0.39-0.65]
0.55 (-1.39, 2.18)
[0.22-1.11]
0.505
Duration of symptoms before
diagnosis (months), median (min,
max) [IQR]
3 (0, 19) [3-6]
Duration of exclusive enteral
nutrition (weeks), median (min,
max) [IQR]
6 (2, 8) [6-6]
Disease location, n (%)
L1 – ileal
L2 - colonic
L3 - ileocolonic
6 (35.29)
3 (17.65)
8 (47.10)
Upper gastrointestinal disease, n (%) 5 (29.41)
Perianal disease, n (%) 3 (17.65)
PCDAI at the beginning, median
(min, max) [IQR]
27.5 (15,60) [20-30]
Calprotectin at the diagnosis
(mg/kg), median (min, max) [IQR]
1415.5 (327, 3670)
[907.25-2000]
Calprotectin after 6 weeks of EEN
(mg/kg), median (min, max) [IQR]
742 (23, 1374)
[374.8-936]

148
Figure 1. Shannon diversity index for each EEN sample time for a) HhaI-digestion and b) MspI-
digestion. There was no difference in microbial diversity between healthy siblings and children
with CD before EEN. There was a significant difference between the two groups on the second
day of EEN. Diversity was not impacted during EEN in children with CD. In healthy siblings,
there was a significant increase in microbial diversity on the second day of EEN for HhaI-
digested TR-F patterns.
CD, Crohn's disease; EEN, exclusive enteral nutrition; T-RF, terminal restriction fragment
before EEN
day 2 of EEN
last day of EEN
before EEN
day 2 of EEN

149
There was no significant difference in microbial diversity between children with CD
and healthy siblings before EEN treatment (p=0.127 for HhaI-digestion; p=0.604 for MspI-
digestion). Paired analysis (included only patients who had siblings that participated in the
study) analyzing Shannon index before EEN showed no significant difference between patients
and their siblings (p=0.374 for HhaI-digestion; p=0.314 for MspI-digestion). Figure 2a
demonstrates the fecal microbiota profiles of patients with CD and healthy siblings before the
start of EEN.
Figure 2. Dendrograms of the fecal microbiota profiles of CD patients and healthy siblings (a.
before the introduction of EEN; b. the second day of EEN).
CD, Crohn’s disease; EEN, exclusive enteral nutrition
Table 2 shows OTUs that differed significantly between children with CD compared to
their siblings before EEN treatment. The relative abundance of 5 out of 191 (2.6%, HhaI
digestion) and 2 out of 162 (1.2%, MspI digestion) OTUs differed significantly (with adjusted
p value of ≤0.01) between the two groups before EEN treatment. Overall, OTUs predicting
Healthy siblings
Patients with CD
Healthy siblings
Patients with CD
a b
Similarity (%
)
Similarity (%
)

150
bacteria from the genera Clostridium, Blautia, Eubacterium, Bacillus and Lactobacillus, were
significantly lower in IBD patients compared to healthy siblings. On the contrary, OTUs
predicting bacteria from the genera, Desulfotomaculum, Burkholderiales and Streptococcus
were significantly higher in IBD patients compared to healthy siblings. Moreover, OTUs
predicting bacteria from the genera Roseburia, Ruminococcus, Fusobacterium and
Coprobacillus were lower, while bacteria from the genera Alistipes, Enterobacter and
Parabacteroides were higher in abundance in children with CD compared to healthy siblings,
however, those OTUs did not reach statistical significance. Generally, OTUs presenting
bacteria from the phylum Firmicutes were lower in abundance in CD patients compared to
healthy siblings.
Table 2. OTUs with significant differences before the start of EEN.
OTU Representative bacteria predicted
by T-RF length
Healthy siblings
(n=10)
CD patients
(n=17)
p-value
HhaI digestion
65B Blautia, Clostridium, Eubacterium 2.43 ± 2.45 0.51 ± 0.76 0.001*
171B Desulfotomaculum 4.13 ± 6.28 0.86 ± 1.92 0.036
203B Eubacterium 0.75±1.36 0.12±0.32 0.006*
206B Bacillus, Burkholderiales 0.06±0.16 3.39±5.91 0.007*
214B Paenibacillus 1.94±6.10 7.14±13.63 0.019
230B Clostridium, Bacillus 1.24±1.45 0.32±1.12 0.005*
381B Desulfotomaculum, Firmicutes 0.01±0.04 10.29±22.61 0.005*
MspI digestion
102 Bacillus 0.08±0.19 0.00±0.00 0.019

151
146 Bacillus, Clostridium,
Paenibacillus, Staphylococcus
0.39±0.70 0.05±0.11 0.049
190 Clostridium, Desulfotomaculum,
Lactobacillus
3.35±3.59 1.01±2.79 0.001*
211 Desulfotomaculum,
Lachnospiraceae
0.05±0.10 0.74±1.38 0.038
222 Blautia, Clostridium,
Desulfotomaculum, Eubacterium,
Roseburia, Ruminococcus
6.06±9.42 0.54±1.53 0.028
235 Eubacterium 0.10±0.10 0.02±0.05 0.021
268 Fusobacterium 4.83±9.77 1.05±2.98 0.033
485 Clostridium, Eubacterium 1.80±1.44 1.28±1.97 0.043
536 Eubacterium 0.08±0.12 0.82±1.02 0.043
540 Coprobacillus 0.57±0.61 0.17±0.33 0.022
561 Streptococcus 0.00±0.00 3.77±10.87 0.004*
CD, Crohn's disease; OTU, operational taxonomic units; T-RF, terminal restriction fragment
Each value indicates the absolute value of individual operational taxonomic units (OTU) area
per total OTU area. Values are expressed as means ± SD at the order of magnitude 10-2.
*Due to multiple comparisons p values ≤0.01 were considered significant.
Change in microbial diversity and composition during EEN
There was a significant difference in microbial diversity on the second day of EEN
between children with CD and healthy controls (p=0.006 HhaI-digestion; p=0.023 MspI-

152
digestion; Figure 1). Difference in microbial diversity was still significant for both HhaI-
digested (p=0.006) and MspI-digested (p=0.043) T-RF patterns when only children who
achieved remission were included into the analysis. Paired analysis (included only patients who
had siblings that participated in the study) analyzing Shannon index showed that patients after
2 days of EEN had lower index comparing to controls (median 1.96 (range 0.43-2.67) vs 2.42
(range 2.12-3.05); p=0.011 for HhaI-digestion; p=0.604 and median 2.42 (range 1.2 -2.79) vs
2.62 (range 2.31-2.99); p=0.051 for MspI-digestion). Figure 2b demonstrates the fecal
microbiota profiles of patients with CD and healthy siblings on the second day of EEN, forming
two major clusters.
As for microbial diversity change during course of EEN, there was no difference in
microbial diversity in CD children between start, second day and the end of EEN (p=0.319
HhaI-digestion; p=0.257 MspI-digestion; Figure 1). When compared for EEN failure, there was
no difference in microbial diversity before the start of EEN or on the second day of EEN
between children who have failed EEN compared to children in whom EEN was successful.
There was no difference in the microbial diversity between children in whom
immunosuppressive (azathioprine) was introduced during treatment of EEN and children who
did not receive immunosuppressive treatment. Moreover, sub-analysis showed that there was
no association between EEN failure and different disease location groups (p=0.093), stenosis
(p=0.870), fistula (p=0.506) and upper GI involvement (p=0.536).
To the contrary, median Shannon index in healthy siblings before EEN was significantly
lower compared to day 2 of EEN for HhaI-digested T-RF patterns (p=0.047, Figure 1). No
difference in microbial diversity was found for MspI-digested T-RF patterns.
PERMANOVA analysis showed significant difference in microbial communities
between patients and their paired siblings in different time points for HhaI-digestion (df = 1,
MS = 8722.1, pseudo F = 4.197, p = 0.001) and sampling time (df = 2, MS = 5027.1, pseudo F

153
= 2.419, p = 0.001) and for MspI – digestion for groups (df = 1, MS = 8034, pseudo F = 4.2537,
p = 0.001) and sampling time (df = 2, MS = 8993.2, pseudo F = 2.3808, p = 0.002). Figures 3
and 4 represent PCO on the basis of dissimilarity matrices of OUTs for HhaI (Figure 3) and
MspI digestion (Figure 4); there is a separation between groups (patients and their siblings) and
sampling time on baseline and day 2, while sample on day 42 from CD group shows shift
towards controls on days 2.
Figure 3. Principal coordinate ordination analysis (PCO) based on the OTU for HhaI-digestion.
Each data point represents an individual sample. PCO was analyzed using Bray-Curtis distances
(3a) and with centroids (3b). Color/shape is indicative of cohort and sampling time (baseline,
day 2 and day 42) and each symbol is accompanied with specific number of the patient.
CD0 – Crohn’s disease group at baseline; CD2 - Crohn’s disease group on day 2; CD42 Crohn’s
disease group on day 42; CONTR0 – healthy siblings group at baseline; CONTR2 - healthy
siblings group on day 2.

154
Figure 4. Principal coordinate ordination analysis (PCO) based on the OTU for MspI-digestion.
Each data point represents an individual sample. PCO was analyzed using Bray-Curtis distances
(3a) and with centroids (3b). Color/shape is indicative of cohort and sampling time (baseline,
day 2 and day 42) and each symbol is accompanied with specific number of the patient.
CD0 – Crohn’s disease group at baseline; CD2 - Crohn’s disease group on day 2; CD42 Crohn’s
disease group on day 42; CONTR0 – healthy siblings group at baseline; CONTR2 - healthy
siblings group on day 2.
There was a significant change (with adjusted p value of ≤0.01) in abundance of one out
of 191 OTUs (0.5%, HhaI-digestion) and 3 out of 162 OTUs (1.8%, MspI – digestion) in CD
children during the course of EEN (Table 3). OTUs representing bacteria from genera Bacillus,
Clostridium, Desulfotomaculum, Desulfovibrio Lactobacillus, Paenibacillus, Eggerthella and
Olsenella tended to increase during the course of EEN. Only OTU 485 (MspI-digestion)
(representing bacteria from genera Clostridium and Eubacterium) showed significant decrease
on the second and the last day of EEN compared to values before the start of EEN. In general,
most OTUs representing bacteria from the phylum Frimicutes tended to increase during the
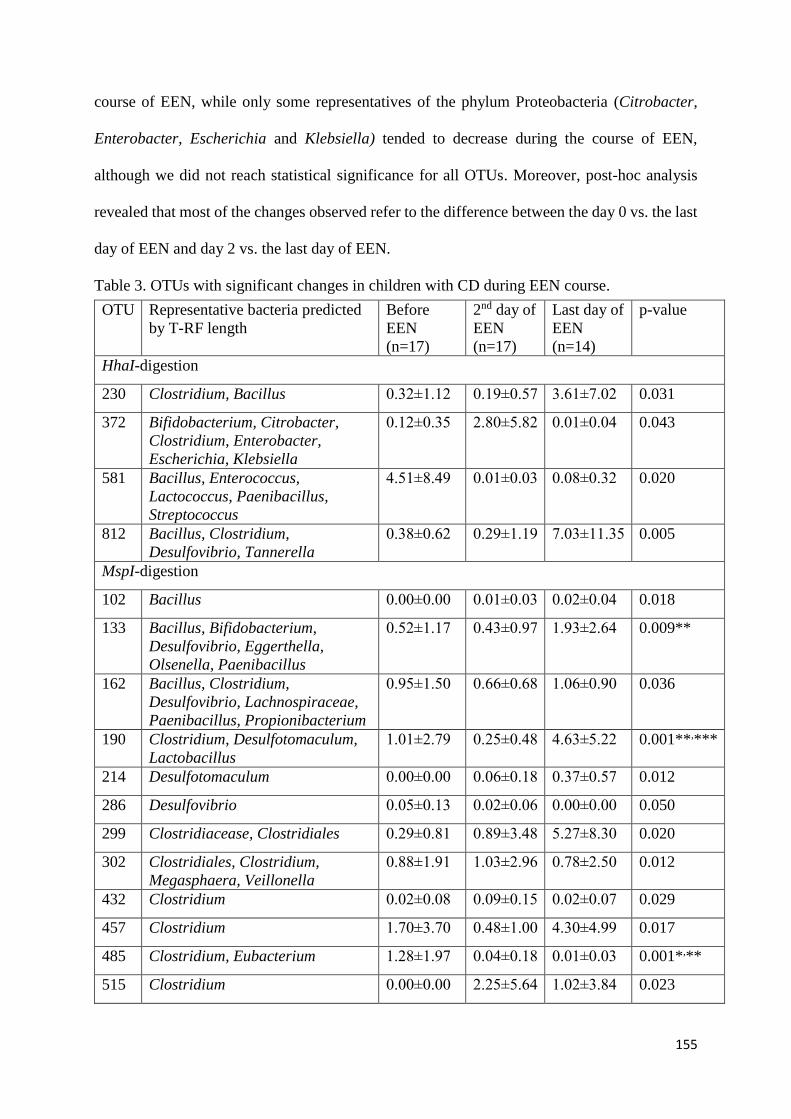
155
course of EEN, while only some representatives of the phylum Proteobacteria (Citrobacter,
Enterobacter, Escherichia and Klebsiella) tended to decrease during the course of EEN,
although we did not reach statistical significance for all OTUs. Moreover, post-hoc analysis
revealed that most of the changes observed refer to the difference between the day 0 vs. the last
day of EEN and day 2 vs. the last day of EEN.
Table 3. OTUs with significant changes in children with CD during EEN course.
OTU Representative bacteria predicted
by T-RF length
Before
EEN
(n=17)
2nd day of
EEN
(n=17)
Last day of
EEN
(n=14)
p-value
HhaI-digestion
230 Clostridium, Bacillus 0.32±1.12 0.19±0.57 3.61±7.02 0.031
372 Bifidobacterium, Citrobacter,
Clostridium, Enterobacter,
Escherichia, Klebsiella
0.12±0.35 2.80±5.82 0.01±0.04 0.043
581 Bacillus, Enterococcus,
Lactococcus, Paenibacillus,
Streptococcus
4.51±8.49 0.01±0.03 0.08±0.32 0.020
812 Bacillus, Clostridium,
Desulfovibrio, Tannerella
0.38±0.62 0.29±1.19 7.03±11.35 0.005
MspI-digestion
102 Bacillus 0.00±0.00 0.01±0.03 0.02±0.04 0.018
133 Bacillus, Bifidobacterium,
Desulfovibrio, Eggerthella,
Olsenella, Paenibacillus
0.52±1.17 0.43±0.97 1.93±2.64 0.009**
162 Bacillus, Clostridium,
Desulfovibrio, Lachnospiraceae,
Paenibacillus, Propionibacterium
0.95±1.50 0.66±0.68 1.06±0.90 0.036
190 Clostridium, Desulfotomaculum,
Lactobacillus
1.01±2.79 0.25±0.48 4.63±5.22 0.001**,***
214 Desulfotomaculum 0.00±0.00 0.06±0.18 0.37±0.57 0.012
286 Desulfovibrio 0.05±0.13 0.02±0.06 0.00±0.00 0.050
299 Clostridiacease, Clostridiales 0.29±0.81 0.89±3.48 5.27±8.30 0.020
302 Clostridiales, Clostridium,
Megasphaera, Veillonella
0.88±1.91 1.03±2.96 0.78±2.50 0.012
432 Clostridium 0.02±0.08 0.09±0.15 0.02±0.07 0.029
457 Clostridium 1.70±3.70 0.48±1.00 4.30±4.99 0.017
485 Clostridium, Eubacterium 1.28±1.97 0.04±0.18 0.01±0.03 0.001*,**
515 Clostridium 0.00±0.00 2.25±5.64 1.02±3.84 0.023

156
557 Bacillus, Lactococcus,
Streptococcus
6.69±16.97 0.00±0.00 0.00±0.00 0.050
CD, Crohn's disease; EEN, exclusive enteral nutrition; OTU, operational taxonomic units; T-
RF, terminal restriction fragment
Each value indicates the absolute value of individual operational taxonomic units (OTU) area
per total OTU area. Values are expressed as means ± SD at the order of magnitude 10-2.
Due to multiple comparisons p values ≤0.01 were considered significant.
Post hoc analysis (Wilcoxon test with Bonferroni adjustment): *p<0.05 for day 0 vs day 2;
**p<0.05 for day 0 vs the end of EEN, *** p<0.05 for day 2 vs the end of EEN
In healthy controls, changes in microbiota composition were already apparent on the
second day of EEN (Table 4). Four OTUs changed significantly during the course of EEN in
healthy siblings, with OTUs representing bacteria from genera Bacillus, Desulfovibrio,
Streptococcus and Staphylococcus increasing in abundance, while bacteria from genera
Clostridium and Eubacterium tended to decrease significantly during EEN course. Only OTU
485 (MspI-digestion) changed significantly in both healthy siblings and CD patients andshowed
similar decreases in bacterial abundance in both children with CD and healthy siblings.
Generally, abundance of different genera tended to increase for all but 3 OTUs presented in the
Table 4, although statistical significance was not reached for all presented OTUs.
Table 4. OTUs with significant changes in healthy siblings during EEN course.
OTU Representative bacteria predicted by T-RF
length
Before EEN
(n=10)
2nd day of
EEN
(n=10)
p-value
HhaI-digestion
58 Desulfovibrio 0.06±0.12 1.68±2.28 0.008*
199 Bacillus, Clostridium, Fusobacterium 0.04±0.10 0.32±0.54 0.028
206 Bacillus, Burkholderiales 0.06±0.16 0.11±0.12 0.050
222 Bacillus, Clostridium, Lactobacillus, Klebsiella,
Enterococcus, Streptococcus
0.01±0.04 0.15±0.20 0.043
241 Bacillus, Paenibacillus, Clostridium 0.01±0.05 0.12±0.15 0.012
372 Bifidobacterium, Citrobacter, Clostridium,
Enterobacter, Escherichia, Klebsiella
0.88±2.05 2.94±3.20 0.017
578 Bacillus, Streptococcus, Staphylococcus 0.09±0.20 4.10±4.42 0.008*
581 Bacillus, Enterococcus, Lactococcus,
Paenibacillus, Streptococcus
3.74±5.22 0.00±0.00 0.011
MspI-digestion

157
86 Alistipes, Desulfotomaculum, Enterobacter,
Parabacteroides, Streptococus
0.04±0.10 0.09±0.16 0.043
138 Bacillus, Bifidobacterium, Desulfotomaculum,
Eubacterium, Paenibacillus
1.35±2.48 2.03±2.58 0.047
206 Clostridium, Ruminococcus 0.58±0.83 1.18±1.61 0.017
485 Clostridium, Eubacterium 1.80±1.44 0.01±0.02 0.005*
499 Citrobacter 0.00±0.00 5.09±10.99 0.043
511 Clostridiaceae, Clostridium 0.00±0.00 0.11±0.16 0.028
520 Clostridiaceae, Clostridium, Eubacterium 1.34±1.42 0.00±0.01 0.008*
EEN, exclusive enteral nutrition; OTU, operational taxonomic units; T-RF, terminal
restriction fragment
Each value indicates the absolute value of individual operational taxonomic units (OTU) area
per total OTU area. Values are expressed as means ± SD at the order of magnitude 10-2.
*Due to multiple comparisons p values ≤0.01 were considered significant.
DISCUSSION
Our study investigated, for the first time, the differences in the stool microbial content
in the response to EEN in children with CD compared to their healthy siblings, i.e. children
having similar genetic background and sharing the same environment. The results obtained
confirmed that healthy siblings exert significant changes in microbiota composition already on
the second day of EEN, in contrast to children with CD where most of the changes were delayed
and became apparent on the last day of EEN. Microbiota composition tended to change in the
same direction in both children with CD and healthy siblings on EEN. Importantly, microbiota
diversity increased significantly in healthy siblings on EEN, while no change in microbiota
diversity was observed in children on EEN during the course of EEN.
Up to this day, most of the studies 11–14,23–28 have demonstrated significant changes in
microbiota composition during EEN, indicating that CD is not associated with a single bacteria
change, but rather with community-level imbalances in the gut microbiome 8. It is considered
that the mechanism of action of EEN involves exclusion of many dietary components which
might have had a deleterious effect on intestinal permeability 4. Therefore, different diets have
been developed given the limitation of EEN on the quality of life of the patients due to its
exclusivity, i.e. not allowing any additional food for the prolonged period (8-12 weeks) 29. The

158
two most promising approaches include Crohn’s disease exclusion diet (CDED) 30, and the CD-
TREAT diet 31.
In our cohort microbial communities of patients with CD couldn’t have been
differentiated from that of healthy siblings before the introduction of EEN, as presented by
dendrogram (Figure 2). However, similar to what was previously demonstrated 2, we have
confirmed significant difference in microbiota composition in children with CD compared to
healthy controls, with overall lower relative abundance of the phylum Firmicutes 10. In our
cohort, we have shown that the relative abundance of the phylum Proteobacteria was higher in
CD patients, however it was not statistically significant at the significance level 0.01. The loss
of symbionts with anti-inflammatory properties 32 along with expansion of potentially
pathogenic symbionts that can cause activation of the immune response and consequently cause
inflammation 33 are considered to be the main factors in pathogenesis of CD. Therefore, the
therapeutic effect of EEN was attributed to its effect on both the intestinal immune system and
intestinal microbiota 4.
With that in mind, therapy that would result with less “dysbiotic” microbiota may lead
to remission of disease in children with CD. In that regard, studies of limited number, have been
conducted to investigate how EEN affects the microbiota composition of children 4,8. Our
results have shown a tendency towards the increase in relative abundance of phylum Firmicutes
and, although not statistically significant, overall tendency of decrease in relative abundance of
phylum Proteobacteria, similar to what was observed in a study by D’Argenio et al 23 and
Schwerd et al. 27. However, other studies have shown opposing results 11–14 and have suggested
that EEN leads to even more dysbiotic state and have even suggested that reduction in relative
abundance of families within the Firmicutes phylum correlated with clinical improvement 12.
Moreover, Lewis et. al 13 have demonstrated that there was a marked difference in microbiome
composition between patients who ultimately responded to EEN and those who did not, with

159
those patients who have responded to treatment exhibiting microbiota profiles that were more
similar to healthy controls. However, our study didn’t confirm these results.
Recent studies have also focused on the difference in microbiota composition of
children with CD compared to their healthy siblings who share both the genetic background
and environmental exposures. Some studies have demonstrated that dysbiosis was present in
siblings of children with CD compared to healthy controls 34,35, however, results were
conflicting36,37. In our cohort we have recently shown that, while we did find the stool
microbiota composition of IBD patients to significantly differ from that of healthy controls and
healthy siblings, no significant difference in microbiota composition was observed between
healthy siblings and healthy controls 10. Interestingly, in this study, while we did find significant
differences in microbiota composition of children with CD compared to healthy siblings, cluster
analysis showed similar microbial community structures between the two groups (Figure 2).
In the present study we have identified, for the first time, gut microbiota changes in
healthy siblings receiving EEN in comparison to patients with CD. A time period of two days
of EEN was chosen as not to be overly demanding for otherwise healthy children and because
limited data in the literature showed that intestinal microbiota changes are already evident one
day after initiation of EEN 38. We have found that EEN has caused significant changes in
microbiota composition in both children with CD and healthy siblings. While microbial
communities of patients with CD couldn’t have been differentiated from that of healthy siblings
before the introduction of EEN, on the second day of EEN two major clusters separating CD
patients from healthy siblings were formed (Figure 2). Moreover, microbiota of healthy siblings
responded “more rapidly” to EEN introduction, with significant changes being observed
already on the second day of EEN (Table 4), as compared to children with CD where no
significant differences have been observed on the second day of EEN (Table 3). However, by
the last day of EEN, microbiota composition of children with CD was changed in a way to

160
resemble that of healthy siblings (Figures 3 and 4), with an overall statistically significant
increase in the phylum Firmicutes and a tendency for a decrease of the phylum Proteobacteria.
Furthermore, significant increase in microbial diversity was already apparent on the
second day of EEN in healthy siblings while diversity did not significantly change throughout
the EEN course in children with the disease. Our speculation is that the slower change in
microbiota composition in patients with CD are caused by persistent severe gut inflammation
that could not be rapidly changed by day 2. However, it could be that “healthier” microbiota,
present in healthy siblings, responds more rapidly and uniformly to the diet change, whereas
CD patients exhibited divergent microbiome changes in response to EEN. Therefore, though
our data could help in clarifying the role of different microbiota in CD patients, the major
conundrum of whether it is the cause or the consequence of inflammation remains.
We are aware of the main limitation of this study, which is primarily a small number of
subjects, which is, however, comparable to other published studies 11–14,23–28. Moreover, the
period of two days of EEN might not have been long enough to detect more profound changes
in microbiota composition. Nonetheless, data in the literature have shown that intestinal
microbiota changes already within one day after initiation of EEN 38 which was also confirmed
by our results. Moreover, we do not know if changes in the microbiota of CD patients were
apparent already before the end of EEN since we did not analyze stools between the day 2 and
the last day of EEN. Finally, by using molecular approach targeting 16S ribosomal RNA gene
we weren’t able to detect strain-level taxonomic classification, which can make interpretation
of the results challenging. However, an advantage of this methodology is hypothesis-free
approach, non-selective of certain bacterial species. Important strengths of our study are in the
unique design which included healthy siblings receiving EEN that was not investigated before,
as well as the treatment naivety of the patients who were recruited at the time of diagnosis,
which excludes the effect of treatment on the microbiota profiles.

161
CONCLUSION
This study demonstrated that EEN leads to significant microbiota changes in both
healthy children and children with CD. Furthermore, changes seem to be more uniform and
occur rapidly in healthy children, while in children with CD significant changes in the direction
similar to those found in healthy siblings, were detected only 6 weeks after EEN introduction.
ACKNOWLEDGMENTS: The authors would like to thank to all the children and their parents
who have complied to participate in the study.
FUNDING: This work was supported by Croatian Science Foundation (research project IP-
2014-09-3788).
CONFLICT OF INTEREST STATEMENT: Iva Hojsak received payment/honorarium for
lectures or consultation from BioGaia, Nutricia, Nestle, Chr Hansen, Biocodex, Oktal Pharma;
Sanja Kolaček received fees for lectures from Abbott, AbbVie, Fresenius, Mead and Johnson,
Nestle, Nutricia, Oktal Pharma; Arjana Tambić Andrašević received honorarium for lectures or
consultation from Xellia, Pfeizer, Pliva and MSD; Sara Sila received payment/honorarium for
lectures from Nutricia, AdeZ; Marko Jelić and Ivana Trivić declare no conflict of interest.
REFERENCES:
1. Miller T., Suskind DL. Exclusive enteral nutrition in pediatric inflammatory bowel
disease. Curr Opin Pediatr. 2018;30:671–676.
2. Gevers D., Kugathasan S., Denson LA., Vázquez-Baeza Y., Van Treuren W., Ren B.,
et al. The treatment-naïve microbiome in new-onset Crohn’s disease. Cell Host
Microbe. 2014;15:382–392.
3. Day AS., Lopez RN. Exclusive enteral nutrition in children with Crohn’s disease. World
J Gastroenterol. 2015;21:6809–6816.

162
4. Assa A., Shamir R. Exclusive enteral nutrition for inducing remission in inflammatory
bowel disease in paediatric patients. Curr Opin Clin Nutr Metab Care. 2017;20:384–
389.
5. Dziechciarz P., Horvath A., Shamir R., Szajewska H. Meta-analysis: enteral nutrition in
active Crohn’s disease in children. Aliment Pharmacol Ther. 2007;26:795–806.
6. Heuschkel RB., Menache CC., Megerian JT., Baird AE. Enteral nutrition and
corticosteroids in the treatment of acute Crohn’s disease in children. J Pediatr
Gastroenterol Nutr. 2000;31:8–15.
7. Zachos M., Tondeur M., Griffiths AM. Enteral nutritional therapy for induction of
remission in Crohn’s disease. Cochrane Database Syst Rev. 2007;(1):CD000542.
8. MacLellan A., Connors J., Grant S., Cahill L., Langille MGI., Van Limbergen J. The
Impact of Exclusive Enteral Nutrition (EEN) on the Gut Microbiome in Crohn’s
Disease: A Review. Nutrients. 2017;9:447.
9. Alhagamhmad MH., Day AS., Lemberg DA., Leach ST. An overview of the bacterial
contribution to Crohn disease pathogenesis. J Med Microbiol. 2016;65:1049–1059.
10. Sila S., Jelić M., Trivić I., Andrašević AT., Hojsak I., Kolaček S. Altered Gut
Microbiota is Present in Newly Diagnosed Pediatric Patients with Inflammatory Bowel
Disease. J Pediatr Gastroenterol Nutr. 2020;70:497–502.
11. Gerasimidis K., Bertz M., Hanske L., Junick J., Biskou O., Aguilera M., et al. Decline
in presumptively protective gut bacterial species and metabolites are paradoxically
associated with disease improvement in pediatric Crohn’s disease during enteral
nutrition. Inflamm Bowel Dis. 2014;20:861–871.
12. Kaakoush NO., Day AS., Leach ST., Lemberg DA., Nielsen S., Mitchell HM. Effect of
Exclusive Enteral Nutrition on the Microbiota of Children With Newly Diagnosed
Crohn’s Disease. Clin Transl Gastroenterol. 2015;6:e71.

163
13. Lewis JD., Chen EZ., Baldassano RN., Otley AR., Griffiths AM., Lee D., et al.
Inflammation, Antibiotics, and Diet as Environmental Stressors of the Gut Microbiome
in Pediatric Crohn’s Disease. Cell Host Microbe. 2015;18:489–500.
14. Quince C., Ijaz UZ., Loman N., Eren AM., Saulnier D., Russell J., et al. Extensive
Modulation of the Fecal Metagenome in Children With Crohn’s Disease During
Exclusive Enteral Nutrition. Am J Gastroenterol. 2015;110:1718–1729.
15. Levine A., Koletzko S., Turner D., Escher JC., Cucchiara S., de Ridder L., et al. The
ESPGHAN Revised Porto Criteria for the Diagnosis of Inflammatory Bowel Disease in
Children and Adolescents: J Pediatr Gastroenterol Nutr. 2014;58:795–806.
16. Fell JME. Update of the management of inflammatory bowel disease. Arch Dis Child.
2012;97:78–83.
17. Hyams JS., Ferry GD., Mandel FS., Gryboski JD., Kibort PM., Kirschner BS., et al.
Development and validation of a pediatric Crohn’s disease activity index. J Pediatr
Gastroenterol Nutr. 1991;12:439–447.
18. Andoh A., Kuzuoka H., Tsujikawa T., Nakamura S., Hirai F., Suzuki Y., et al.
Multicenter analysis of fecal microbiota profiles in Japanese patients with Crohn’s
disease. J Gastroenterol. 2012;47:1298–307.
19. Matsumoto M., Sakamoto M., Hayashi H., Benno Y. Novel phylogenetic assignment
database for terminal-restriction fragment length polymorphism analysis of human
colonic microbiota. J Microbiol Methods. 2005;61:305–19.
20. Li F., Hullar MAJ., Lampe JW. Optimization of terminal restriction fragment
polymorphism (TRFLP) analysis of human gut microbiota. J Microbiol Methods.
2007;68:303–311.

164
21. Sakamoto M., Hayashi H., Benno Y. Terminal restriction fragment length
polymorphism analysis for human fecal microbiota and its application for analysis of
complex bifidobacterial communities. Microbiol Immunol. 2003;47:133–142.
22. Culman SW., Bukowski R., Gauch HG., Cadillo-Quiroz H., Buckley DH. T-REX:
software for the processing and analysis of T-RFLP data. BMC Bioinformatics.
2009;10:171.
23. D’Argenio V., Precone V., Casaburi G., Miele E., Martinelli M., Staiano A., et al. An
Altered Gut Microbiome Profile in a Child Affected by Crohn’s Disease Normalized
After Nutritional Therapy. Am J Gastroenterol. 2013;108:851–852.
24. Dunn KA., Moore-Connors J., MacIntyre B., Stadnyk AW., Thomas NA., Noble A., et
al. Early Changes in Microbial Community Structure Are Associated with Sustained
Remission After Nutritional Treatment of Pediatric Crohn’s Disease. Inflamm Bowel
Dis. 2016;22:2853–62.
25. Guinet-Charpentier C., Lepage P., Morali A., Chamaillard M., Peyrin-Biroulet L.
Effects of enteral polymeric diet on gut microbiota in children with Crohn’s disease.
Gut. 2017;66:194–195.
26. Leach ST., Mitchell HM., Eng WR., Zhang L., Day AS. Sustained modulation of
intestinal bacteria by exclusive enteral nutrition used to treat children with Crohn’s
disease. Aliment Pharmacol Ther. 2008;28:724–733.
27. Schwerd T., Frivolt K., Clavel T., Lagkouvardos I., Katona G., Mayr D., et al. Exclusive
enteral nutrition in active pediatric Crohn disease: Effects on intestinal microbiota and
immune regulation. J Allergy Clin Immunol. 2016;138:592–596.
28. Shiga H., Kajiura T., Shinozaki J., Takagi S., Kinouchi Y., Takahashi S., et al. Changes
of faecal microbiota in patients with Crohn’s disease treated with an elemental diet and
total parenteral nutrition. Dig Liver Dis. 2012;44:736–742.
165
29. Pigneur B., Ruemmele FM. Nutritional interventions for the treatment of IBD: current
evidence and controversies. Therap Adv Gastroenterol. 2019;12: 1756284819890534.
30. Levine A., Wine E., Assa A., Sigall Boneh R., Shaoul R., Kori M., et al. Crohn’s Disease
Exclusion Diet Plus Partial Enteral Nutrition Induces Sustained Remission in a
Randomized Controlled Trial. Gastroenterology. 2019;157:440-450.e8.
31. Svolos V., Hansen R., Nichols B., Quince C., Ijaz UZ., Papadopoulou RT., et al.
Treatment of Active Crohn’s Disease With an Ordinary Food-based Diet That
Replicates Exclusive Enteral Nutrition. Gastroenterology. 2019;156:1354-1367.e6.
32. Takahashi K., Nishida A., Fujimoto T., Fujii M., Shioya M., Imaeda H., et al. Reduced
Abundance of Butyrate-Producing Bacteria Species in the Fecal Microbial Community
in Crohn’s Disease. Digestion. 2016;93:59–65.
33. Zechner EL. Inflammatory disease caused by intestinal pathobionts. Curr Opin
Microbiol. 2017;35:64–69.
34. Hedin C., van der Gast CJ., Rogers GB., Cuthbertson L., McCartney S., Stagg AJ., et
al. Siblings of patients with Crohn’s disease exhibit a biologically relevant dysbiosis in
mucosal microbial metacommunities. Gut. 2016;65:944–953.
35. Hedin CR., van der Gast CJ., Stagg AJ., Lindsay JO., Whelan K. The gut microbiota of
siblings offers insights into microbial pathogenesis of inflammatory bowel disease. Gut
Microbes. 2017;8:359–65.
36. Ijaz UZ., Quince C., Hanske L., Loman N., Calus ST., Bertz M., et al. The distinct
features of microbial “dysbiosis” of Crohn’s disease do not occur to the same extent in
their unaffected, genetically-linked kindred. PLoS ONE. 2017;12:e0172605.
37. Joossens M., Huys G., Cnockaert M., Preter VD., Verbeke K., Rutgeerts P., et al.
Dysbiosis of the faecal microbiota in patients with Crohn’s disease and their unaffected
relatives. Gut. 2011;60:631–637.

166
38. Meister D., Bode J., Shand A., Ghosh S. Anti-inflammatory effects of enteral diet
components on Crohn’s disease-affected tissues in vitro. Dig Liver Dis. 2002;34:430–
438.

167
CURRICULUM VITAE
Sara Sila, MSc, was born in Zagreb where she finished elementary and grammar school. She
graduated at the Faculty of Food technology and biotechnology, University of Zagreb in 2016.
Since 2016 she is working as an assistant on the project of Croatian Science Foundation named
“Pediatric inflammatory bowel disease: incidence and natural history, and the role of diet and
gut flora in etiopathogenesis” at the Children’s Hospital Zagreb. As a part of her assistant
position, she has enrolled Postgraduate University Doctoral Study at the Faculty of Food
Technology and Biotechnology, University of Zagreb.
During her work, she took part in various educational programs organized by the European
Society for Pediatric Gastroenterology, Hepatology and Nutrition (ESPGHAN) in Croatia and
abroad such as "Beyond Nutrients Nutrition School" in Italy, "Young Investigator Forum" in
the Netherlands and "Allied Health Professionals Summers School "in Croatia. She was a
project associate on 3 scientific projects and 5 educational and professional projects. She was
the main author or a coauthor of 12 scientific papers. Of the mentioned papers, 11 are indexed
in SCI-Expanded Base. She has attended 8 international congresses and on 6 of mentioned
congresses she has presented her work as abstract presentation.