the impact of diabetes mellitus in the united states
TRANSCRIPT

The Impact of Diabetes Mellitus in the
United States
Epidemiology, Costs, and Future Projections

EPIDEMIOLOGY Section 1

Epidemiology of Diabetes
• 29.1 million Americans, 9.3% of the population, have diabetes
• Diagnosed: 21.0 million • Undiagnosed: 8.1 million
• 1.25 million have type 1 diabetes
• Leading cause of kidney failure, nontraumatic lower-limb amputation, new cases of blindness among adults
• Major cause of heart disease and stroke
• Seventh leading cause of death
National Diabetes Information Clearinghouse. National Diabetes Statistics, 2014. Available at: http://diabetes.niddk.nih.gov/dm/pubs/statistics/

Diagnosed and Undiagnosed Diabetes in Adults ≥20 2012
• 1.7 million are newly diagnosed each year • 28.9 million (12.3%) have diabetes • By age
• <20 years 208,000 • 20-44 4.3 million (4.1%) • 45-64 13.4 million (16.2%) • >65 years, 11.2 million (25.9%)
• By sex • Men: 15.5 million (13.6%) • Women: 13.4 million (11.2%)
National Diabetes Information Clearinghouse. National Diabetes Statistics, 2014. Available at: http://diabetes.niddk.nih.gov/dm/pubs/statistics/

Racial/Ethnic Differences in Diagnosed Diabetes
Centers for Disease Control and Prevention 2014 National Diabetes Statistics Report Available http://diabetes.niddk.nih.gov/dm/pubs/statistics/
Race/Ethnicity %
Non-Hispanic whites 7.6
Asian Americans 9.0
Hispanics/Latinos Cuban Americans Central and South Americans Mexican Americans Puerto Ricans
12.8 9.3 8.5 13.9 14.8
Non-Hispanic whites 7.6
American Indians/Alaska Natives 15.9
2010-1012 data for people ages ≥20 Years or Older

Diagnosed and Undiagnosed Diabetes
National Diabetes Information Clearinghouse. National Diabetes Statistics, 2014. Available at: http://diabetes.niddk.nih.gov/dm/pubs/statistics/
Source: 2005-2008 National Health and Nutrition Examination Survey

New Cases of Diagnosed Diabetes
National Diabetes Information Clearinghouse. National Diabetes Statistics, 2014. Available at: http://diabetes.niddk.nih.gov/dm/pubs/statistics /
Source: 2005-2008 National Health and Nutrition Examination Survey estimates projected to the year 2010

Number of Americans with Diagnosed Diabetes, 1980-2011
Centers for Disease Control and Prevention www.cdc.gov/diabetes/statistics

CDC’s Division of Diabetes Translation. National Diabetes Surveillance System
available at http://www.cdc.gov/diabetes/statistics
Obesity (BMI≥30 kg/m2) Diabetes
<4.5% Missing data
4.5%–5.9% 6.0%–7.4%
7.5%–8.9% ≥9.0% 18.0%–21.9%
<14.0% Missing Data
14.0%–17.9%
22.0%–25.9% ≥26.0%
1994
Age-Adjusted Prevalence of Obesity and Diagnosed Diabetes Among US Adults
CDC’s Division of Diabetes Translation. National Diabetes Surveillance System
available at http://www.cdc.gov/diabetes/statistics
Obesity (BMI≥30 kg/m2) Diabetes
<4.5% Missing data
4.5%–5.9% 6.0%–7.4%
7.5%–8.9% ≥9.0% 18.0%–21.9%
<14.0% Missing Data
14.0%–17.9%
22.0%–25.9% ≥26.0%
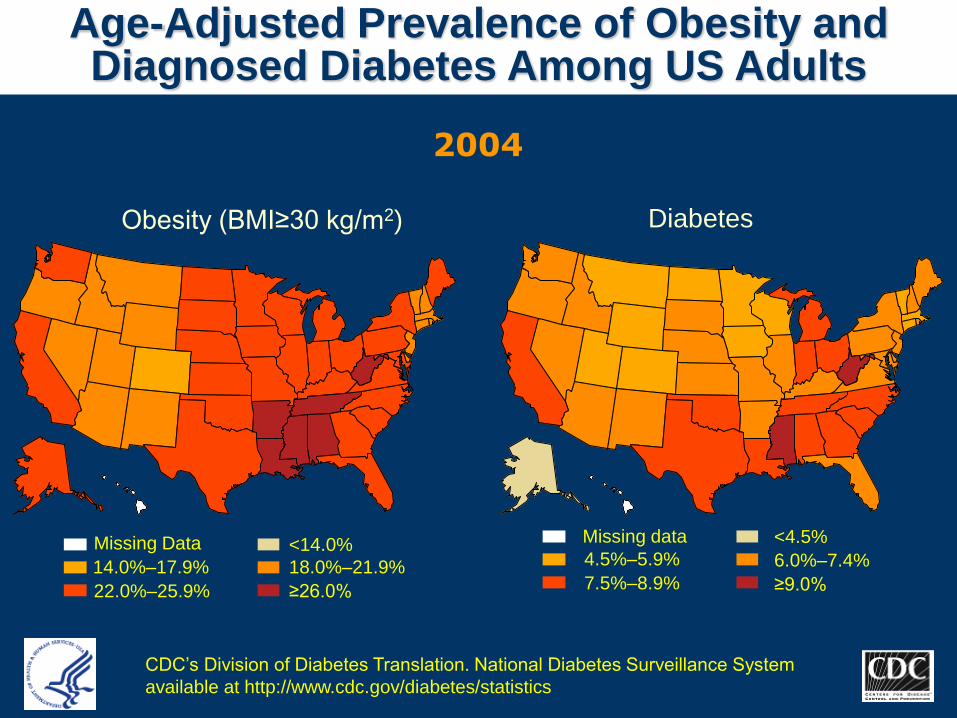
2004
Age-Adjusted Prevalence of Obesity and Diagnosed Diabetes Among US Adults

CDC’s Division of Diabetes Translation. National Diabetes Surveillance System
available at http://www.cdc.gov/diabetes/statistics
Obesity (BMI≥30 kg/m2) Diabetes
<4.5% Missing data
4.5%–5.9% 6.0%–7.4%
7.5%–8.9% ≥9.0% 18.0%–21.9%
<14.0% Missing Data
14.0%–17.9%
22.0%–25.9% ≥26.0%
2013
Age-Adjusted Prevalence of Obesity and Diagnosed Diabetes Among US Adults

Prevalence of Overweight and Obesity Among Adults with Diabetes
MMWR. 2004;53(45):1066-1068.
• CDC analysis of prevalence of overweight and obesity among U.S. adults ≥20 years with previously diagnosed diabetes
– Overweight or obesity: 85.2%
– Obesity: 54.8%
• Women aged 20-64 years had a significantly higher prevalence of obesity than women ≥65 years of age (64.7% vs 47.4%; P<0.05) during 1999-2002
• Among men, prevalence of overweight or obesity was 86.3% and obesity, 53.0%

SEARCH for Diabetes in Youth 0-9 Years by Race/Ethnicity
SEARCH for Diabetes in Youth Study Group. Pediatrics. 2006;118:1510-1518.
NHW=non-Hispanic white; AA=African-American; H=Hispanic; API=Asian/Pacific Islander; AI=American Indian
Prevalence
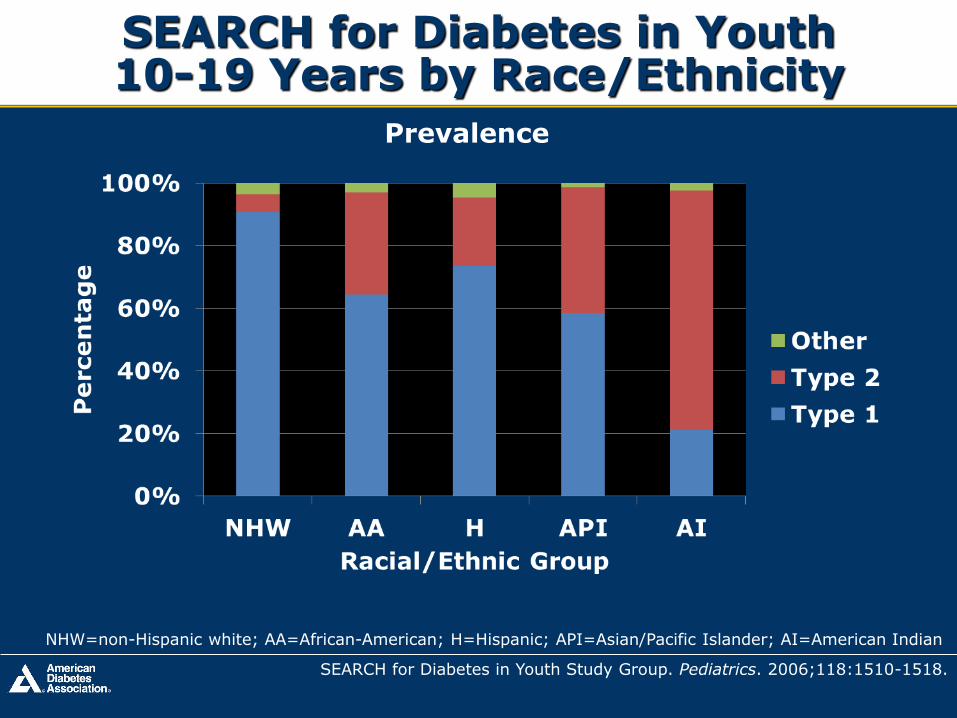
SEARCH for Diabetes in Youth 10-19 Years by Race/Ethnicity
SEARCH for Diabetes in Youth Study Group. Pediatrics. 2006;118:1510-1518.
Prevalence
NHW=non-Hispanic white; AA=African-American; H=Hispanic; API=Asian/Pacific Islander; AI=American Indian
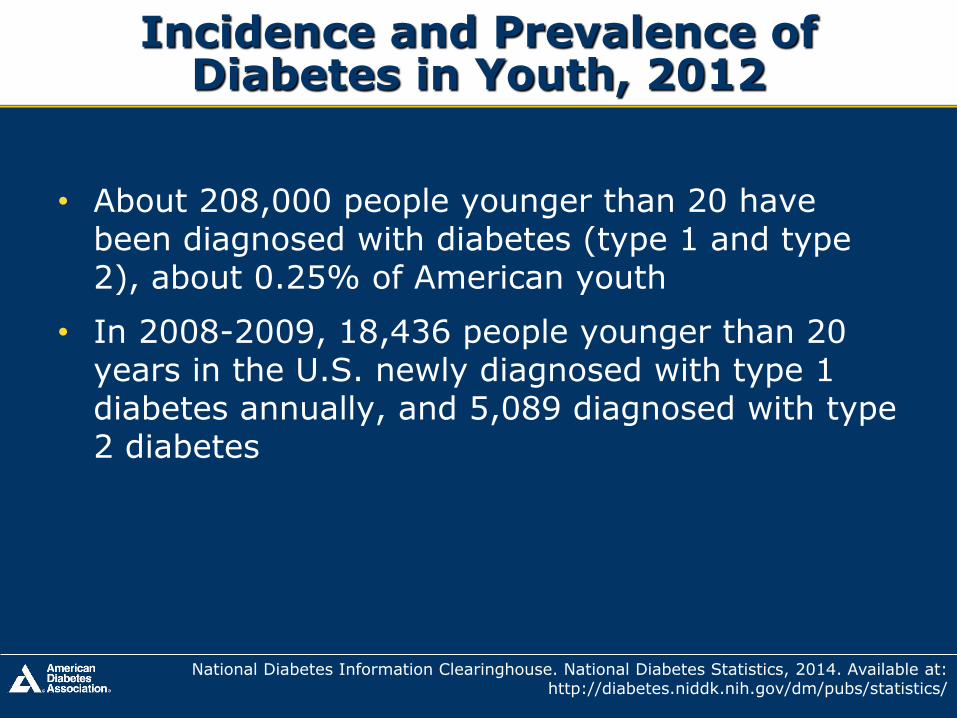
Incidence and Prevalence of Diabetes in Youth, 2012
• About 208,000 people younger than 20 have been diagnosed with diabetes (type 1 and type 2), about 0.25% of American youth
• In 2008-2009, 18,436 people younger than 20 years in the U.S. newly diagnosed with type 1 diabetes annually, and 5,089 diagnosed with type 2 diabetes
National Diabetes Information Clearinghouse. National Diabetes Statistics, 2014. Available at: http://diabetes.niddk.nih.gov/dm/pubs/statistics/

Prediabetes
• In 2009-2012, based on fasting glucose or A1C levels, prediabetes was detected in
– 37% of adults ages 20 years and older
– 51% of adults ages 65 years and older
– An estimated 86 million adults ages 20 years and older
• People with prediabetes have an increased risk of developing type 2 diabetes, heart disease, and stroke
National Diabetes Information Clearinghouse. National Diabetes Statistics, 2014. Available at: http://diabetes.niddk.nih.gov/dm/pubs/statistics/
Complications of Diabetes
• Hypertension
• Hyperlipidemia
• Heart disease and stroke
• Blindness, eye problems
• Renal disease
• Amputations
• Other complications
National Diabetes Information Clearinghouse. National Diabetes Statistics, 2014. Available at: http://diabetes.niddk.nih.gov/dm/pubs/statistics/

• In 2009–2012, of adults aged >18 years with diagnosed diabetes, 71% had blood pressure >140/90 mmHg or used blood pressure medications
• In 2003–2006 cardiovascular disease death rates were about 1.7 times higher among adults aged >18 with diagnosed diabetes than among adults without diagnosed diabetes
• In 2010 hospitalization rates for heart attack were 1.8 times higher and stroke were 1.5 times higher among adults with diagnosed diabetes >20 compared to those without diagnosed diabetes
Complications of Diabetes Heart Disease, Stroke, Hypertension
National Diabetes Information Clearinghouse. National Diabetes Statistics, 2014. Available at: http://diabetes.niddk.nih.gov/dm/pubs/statistics/

• Diabetes is leading cause of new cases of blindness among adults ages 20–74 years
• Of people with diabetes aged ≥40 years, 4.2 million (28.5%) had diabetic retinopathy in 2005-2008
• 655,000 (4.4% of those with diabetes) had advanced diabetic retinopathy that could lead to severe vision loss
Complications of Diabetes Blindness, Eye Problems
National Diabetes Information Clearinghouse. National Diabetes Statistics, 2014. Available at: http://diabetes.niddk.nih.gov/dm/pubs/statistics/
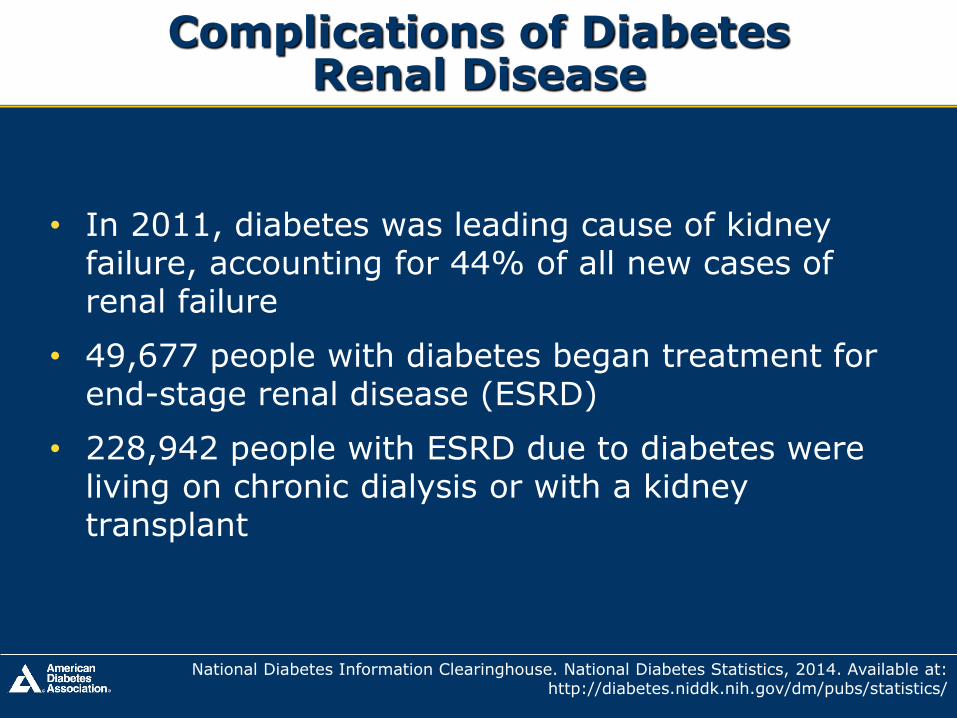
• In 2011, diabetes was leading cause of kidney failure, accounting for 44% of all new cases of renal failure
• 49,677 people with diabetes began treatment for end-stage renal disease (ESRD)
• 228,942 people with ESRD due to diabetes were living on chronic dialysis or with a kidney transplant
Complications of Diabetes Renal Disease
National Diabetes Information Clearinghouse. National Diabetes Statistics, 2014. Available at: http://diabetes.niddk.nih.gov/dm/pubs/statistics/

Trends in age-standardized rates of diabetes-related
complications among U.S. adults with diabetes, 1990-2010
Gregg et al. N Engl J Med 370: 1514—1523, 2014

• ~60%–70% of people with diabetes have mild to severe forms of nervous system damage
– Impaired sensation or pain in feet or hands
– Slowed digestion of food in the stomach
– Carpal tunnel syndrome
– Erectile dysfunction
• Severe forms are a major contributing cause of lower-extremity amputations: About 60% occur in people with diabetes ages ≥20
Complications of Diabetes Nervous System Disease
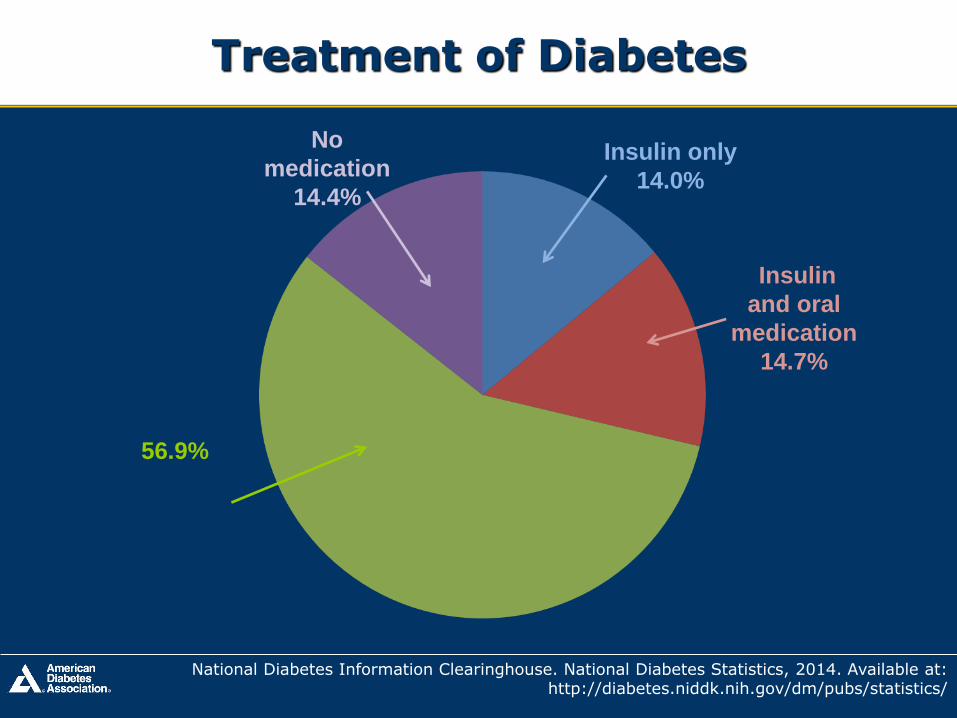
56.9%
No
medication
14.4%
Insulin only
14.0%
Insulin
and oral
medication
14.7%
Treatment of Diabetes
National Diabetes Information Clearinghouse. National Diabetes Statistics, 2014. Available at: http://diabetes.niddk.nih.gov/dm/pubs/statistics/
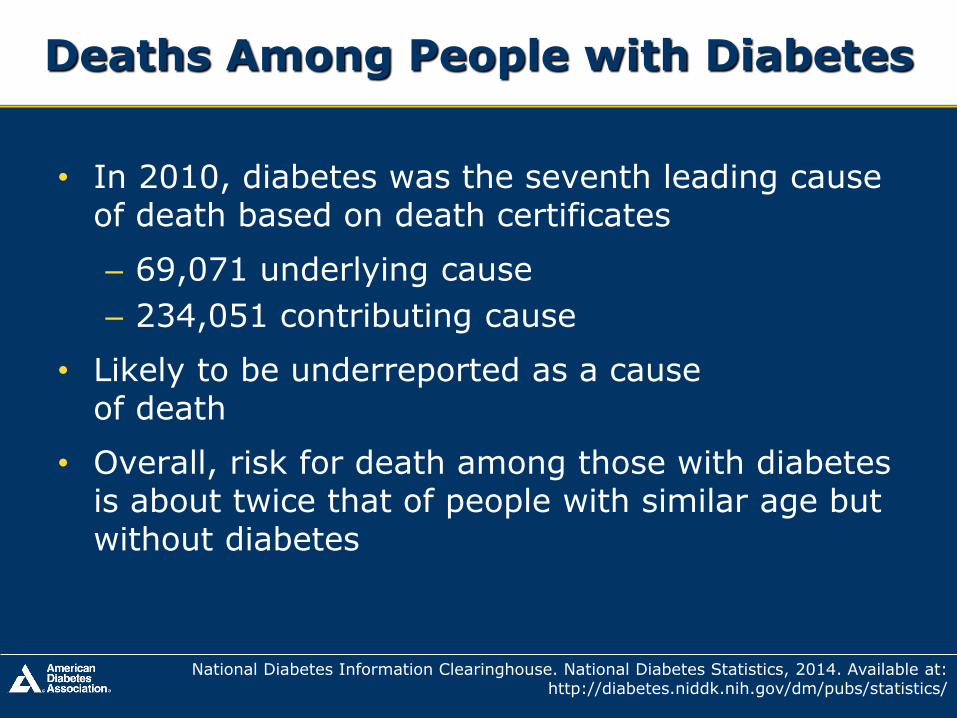
Deaths Among People with Diabetes
• In 2010, diabetes was the seventh leading cause of death based on death certificates
– 69,071 underlying cause
– 234,051 contributing cause
• Likely to be underreported as a cause of death
• Overall, risk for death among those with diabetes is about twice that of people with similar age but without diabetes
National Diabetes Information Clearinghouse. National Diabetes Statistics, 2014. Available at: http://diabetes.niddk.nih.gov/dm/pubs/statistics/

Age Distribution of Deaths Associated with Diabetes
Age 70+
206,791
73%
Age <18
488
0%
Age 18-34
1,918
1%
Age 35-44
5564
2%
Age 45-54
16,663
6% Age 55-59
13,907
5%
Age 60-64
17,634
6%
Age 65-69
20,656
7%
American Diabetes Association. Diabetes Care. 2008;31:596-615. Figure 4.

COSTS Section 2

Economic Costs of Diabetes, 2012
Total cost of diabetes: $245 billion
• $176 billion in direct medical costs, which
includes costs for hospital and emergency
care, office visits, and medications.
• $69 billion in indirect medical costs, which
includes costs for absenteeism, reduced
productivity, unemployment
American Diabetes Association. Diabetes Care. 2013;36:1033-1046.

Medical Expenditures Attributed to Diabetes, 2012
• Hospital inpatient care (43%)
• Retail prescriptions to treat complications of diabetes (18%)
• Diabetes medication and supplies (12%)
• Physician office visits (9%)
• Nursing/residential facility stays (8%)
– The absolute cost of hospital inpatient care for people with diabetes rose from $58 billion in 2007 to $76 billion in 2012. However, hospital inpatient care costs fell from 50 percent to 43 percent of total direct medical costs.
American Diabetes Association. Diabetes Care. 2013;36:1033-1046.

Costs Incurred by People with a Diagnosis of Diabetes in 2012
• Average annual expenditures: $13,700
• $7,900 attributed to directly to diabetes
• Medical expenditures for people with diabetes are 2.3 times higher than for those without diabetes.
• More than 1 in 5 health care dollars in the U.S. goes to the care of people with diagnosed diabetes
• More than 1 in 10 health care dollars in the U.S. are spent directly on diabetes and its complications
American Diabetes Association. Diabetes Care. 2013;36:1033-1046.

Health Care Expenditures in the U.S Attributed to Diabetes, 2012
American Diabetes Association. Diabetes Care. 2013;36:1033-1046. Table 4.
Health resource Dollars
($ millions) % of U.S.
total
Institutional care Hospital inpatient Nursing/residential facility Hospice
75,872 14,748 32
16% 17% 0.3%
Outpatient care Office-based physician visits Emergency visits Ambulance services Hospital outpatient Home health Podiatry
15,221 6,654 218 5,027 4,466 212
8% 6% 11% 6% 9% 12%

Indirect Costs Attributed to Diabetes, 2012
American Diabetes Association. Diabetes Care. 2013;36:1033-1046. Table 9.
Cost component
Productivity loss
Total cost attributable to diabetes ($ billions)
Proportion of indirect costs (%)
Workdays absent 25 million days 5.0 7
Reduced performance at work
113 million days 20.8 30
Reduced productivity days for those not in labor force
20 million days 2.7 4
Reduced labor force participation due to disability
130 million days 21.6 31
Mortality 246,000 deaths 18.5 27
Total 68.6 100

Mortality Costs Attributed to Diabetes, 2012
American Diabetes Association. Diabetes Care. 2013;36:1033-1046. Table 10.
Primary cause of death
Total US deaths
Deaths attributed to diabetes
Deaths
% of total of US deaths
Value of lost
productivity ($ millions)
Diabetes 73,000 73,000 100.0 7,147
Renal disease 46,000 25,000 55.0 2,004
Cerebrovascular disease
136,000 38,000 28.0 1,484
Cardiovascular disease
687,000 110,000 16.0 7,827
Total NA* 246,000 NA* 18,462
*Total comprises mortality for reasons other than those listed here

Economic Costs of Prediabetes, GDM and Diabetes, 2012
• Total national cost: $322 billion
• Higher medical costs: $244 billion
• Productivity loss: $78 billion
– $245 billion for diagnosed diabetes
– $32.8 billion for undiagnosed diabetes
– $43.9 billion for prediabetes
– $1.3 billion for gestational diabetes
Dall TM, et al. Diabetes Care. 2014; 3172–3179.

FUTURE PROJECTIONS Section 3

IDF Diabetes Atlas, 4th ed. ©International Diabetes Federation, 2009.
IDF Global Projections for Number of People with Diabetes, 2010-2030

Estimated Number of People with Diabetes Worldwide, 2010 and 2030
IDF Diabetes Atlas, 4th ed. ©International Diabetes Federation, 2009.
Country/Territory 2010
Millions Country/Territory
2030 Millions
1 India 50.8 1 India 87.0
2 China 43.2 2 China 62.6
3 USA 26.8 3 USA 36.0
4 Russian Federation 9.6 4 Pakistan 13.8
5 Brazil 7.6 5 Brazil 12.7
6 Germany 7.5 6 Indonesia 12.0
7 Pakistan 7.1 7 Mexico 11.9
8 Japan 7.1 8 Bangladesh 10.4
9 Indonesia 7.0 9 Russian Federation 10.3
10 Mexico 6.8 10 Egypt 8.6

Annual U.S. Diabetes Burden in 2050
• By 2050, prevalence of total diabetes (diagnosed
and undiagnosed) is projected to increase from 1
in 10 adults to between 1 in 5 and 1 in 3 adults
• Incidence: from 8 in 1000 to 15 in 1000
• Largely attributed to three key factors
– Aging of the U.S. population
– Increasing size of higher-risk minority
populations
– Declining mortality among those with diabetes
Boyle JP, et al. Popul Health Metr. 2010;8:29.

Boyle JP, et al. Popul Health Metr. 2010;8:29.
Total U.S. Adult Population Diabetes Prevalence Projections