the impact of demographic changes on united states · pdf filethe impact of demographic...
TRANSCRIPT

The Impact of Demographic Changes on United States Higher Education
2000-2050
Janet Lopez Postsecondary Education Policy Analysis Intern
University of North Carolina at Chapel Hill Summer 2006
State Higher Education Executive Offices

The Impact of Demographic Changes on United States Higher Education: 2000-2050
Table of Contents ............................................................................................................... i List of Figures.................................................................................................................... ii Acknowledgements .......................................................................................................... iii I. Introduction ....................................................................................................................1 II. Demographic Trends ....................................................................................................2
Age ...........................................................................................................................2 Growth Areas by Geographic Region ..................................................................4 Children living in the United States .....................................................................4 Ethnicity..................................................................................................................5 Immigration............................................................................................................6 Distribution of Income...........................................................................................8 Education ................................................................................................................9
• K-12 Enrollment.........................................................................................9 • Higher Education Enrollment ................................................................11
Synopsis.................................................................................................................13 III. Focusing on the 2050 Future ....................................................................................14 Birth to 12th Grade...........................................................................................................14
Children in Poverty..............................................................................................14 Immigrant Students .............................................................................................15 Low Income and Students of Color Needs ........................................................16
• High School Reform.................................................................................16 • Rigor and High Expectations ..................................................................17 • Teaching Kids the How, Why, and What to Learn ..............................18 • Support Networks ....................................................................................18
Higher Education .............................................................................................................19 Affordability .........................................................................................................19 Serving Students ..................................................................................................20 Degree Programs..................................................................................................22 Accountability Systems........................................................................................22
IV. Conclusion ..................................................................................................................23 References .........................................................................................................................25
Lopez, J.K. State Higher Education Executive Officers
i
The Impact of Demographic Changes on United States Higher Education: 2000-2050
List of Figures
Figure 1 ...............................................................................................................................2 Year-to-Year Change in U.S. Population, 2002-2020, Source: US Census Bureau Figure 2 ...............................................................................................................................3 Percent Change in Projected Population for the United States by Age Group, 2000-2050, Source: Population Change in the United States: Implications for Human and Socioeconomic Resources in the 21st Century (Steve R. Murdock) Figure 3 ...............................................................................................................................6 Percent of Net Population Change Due to Each Race/Ethnicity Group for the United States, 2000-2005, Source: Population Change in the United States: Implications for Human and Socioeconomic Resources in the 21st Century (Steve R. Murdock). Figure 4 ...............................................................................................................................7 Citizenship and Legal Status of U.S. Immigrants, 2003. Source: Urban Institute. Figure 5 ...............................................................................................................................8 Projected Changes in Personal Income Per Capita, 2000 to 2020, Based on Three Assumptions, Source: National Center for Public Policy and Higher Education, Policy Alert, November 2005 Figure 6 .............................................................................................................................10 Percent Change for Selected Time Periods for Projected Total, Elementary and Secondary Enrollment in the United States by Race/Ethnicity 1990-2050, Source: Population Change in The United States: Implications for Human and Socioeconomic Resources in the 21st Century (Steve R. Murdock). Figure 7 .............................................................................................................................11 Students Enrolled in Degree-Granting Institutions, by Race/Ethnicity, Fall 2002, Source: U.S. Department of Education, National Center for Education Statistics. Figure 8 .............................................................................................................................12 Projected Percent of Public University Enrollment by Race/Ethnicity in 2000 and Projections for 2040, Source: Population Change in the United States: Implications for Human and Socioeconomic Resources in the 21st Century (Steve R. Murdock).
Lopez, J.K. State Higher Education Executive Officers
ii
The Impact of Demographic Changes on United States Higher Education: 2000-2050
Acknowledgements I would like to express my deep appreciation to the national SHEEO staff for allowing me the opportunity to explore the world of policy and to push myself into new areas of research regarding access to higher education. Special thank yous to individual staff members are in order. Many thanks to Paul Lingenfelter for bringing me to the SHEEO office and encouraging me to step beyond my comfort zone, while at the same time engaging me even further regarding my passions surrounding access to higher education for students of color. I am also deeply indebted to Paul and his wife Carol for opening up their home and their hearts to me during my time in Boulder. Thank you also to Hans L’Orange and Charlie Lenth for supporting my internship through open dialogue. A special thank you to Sharmila Basu Conger who was a model of a young professional in the field, and just a whole lot of fun to be around during the internship. I will take many kind thoughts of the SHEEO staff with me when I leave this summer including those of Gladys, Gloria, Susan, Takeshi, David and Diane. I would be remiss if I did not mention how much I enjoyed dialogue I was able to have with my office mate and policy intern partner-in-crime David Tandberg. David’s knowledge in the area of policy finance and politics is unquestionably one of the best in his field, and his general good nature made his company greatly appreciated. Exploring the demographic shifts in the United States has only left me more committed to serving as an advocate for those in this society who have so long been denied access to the benefits of higher education. The policy arena is yet another space where we must continue to work for the impoverished and underrepresented communities of people who so equally deserve to reap the benefits of a college education.
Lopez, J.K. State Higher Education Executive Officers
iii
The impact of demographic changes on United States higher education: 2000-2050
I. Introduction Miners bring canaries to work because a canary’s fragile lungs will collapse from dangerous gases long before a miner would be affected. In The Miner’s Canary: Enlisting Race, Resisting Power, Transforming Democracy, Lani Guinier and Gerald Torres (2002) suggest that the problems faced by racial minorities in the United States can be compared to dangerous gases in a mine. If minorities cannot thrive in the “mine,” everyone is in danger, not just those who are most vulnerable and disadvantaged. Demographers in the United States have foreshadowed major changes in the nation’s make-up, in age, immigration, ethnicity, distribution of income, and school enrollment. Higher education policymakers, and institutions must consider how they will respond to the unique challenges of these sweeping demographic changes. It is important to note that the problems in one community affect everyone, because ultimately, we all breathe the same air. The purpose of this brief is to take a step back and identify the key demographic trends that have been identified as major changes over the next 50 years, considering demographic shifts in age, areas of population growth, race and ethnicity, immigration, young children, distribution of wealth, projections of K-12 enrollment and projections of higher education enrollment. Because of these demographic trends the educational, social, and economic advancement of communities of color will be the central issue in our future. After surveying the landscape we will consider the impact these demographic trends will have on higher education, identifying many of the challenges already affecting institutions and communities. We will then explore what key policy experts have suggested as possible responses to these challenges, and identify what we believe to be the key considerations for the future, focusing on improvement of the K-16 pipeline. This synopsis is intended to alert higher education policymakers to the needs, to make the case for expanding support for currently successful programs, and to encourage the development of essential, additional initiatives. While some states will likely experience more demographic change than others no state or region of the country can afford to be complacent about these issues.
Lopez, J.K. State Higher Education Executive Officers
1
The impact of demographic changes on United States higher education: 2000-2050
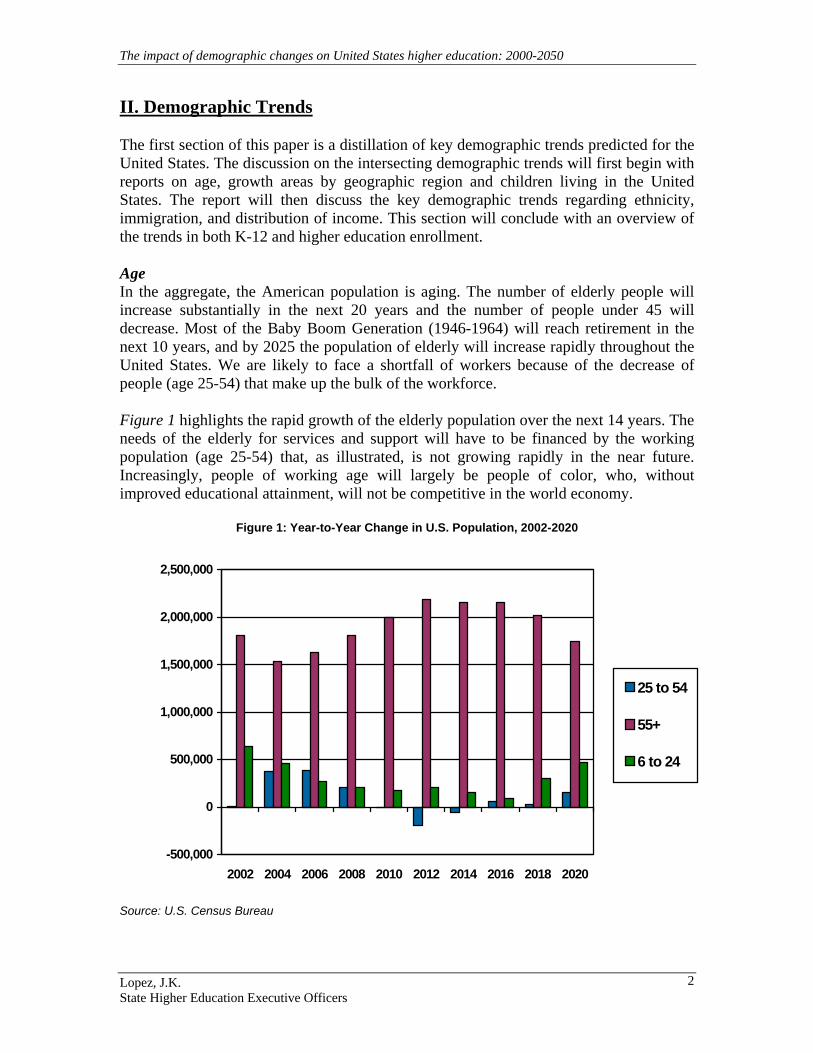
II. Demographic Trends The first section of this paper is a distillation of key demographic trends predicted for the United States. The discussion on the intersecting demographic trends will first begin with reports on age, growth areas by geographic region and children living in the United States. The report will then discuss the key demographic trends regarding ethnicity, immigration, and distribution of income. This section will conclude with an overview of the trends in both K-12 and higher education enrollment. Age In the aggregate, the American population is aging. The number of elderly people will increase substantially in the next 20 years and the number of people under 45 will decrease. Most of the Baby Boom Generation (1946-1964) will reach retirement in the next 10 years, and by 2025 the population of elderly will increase rapidly throughout the United States. We are likely to face a shortfall of workers because of the decrease of people (age 25-54) that make up the bulk of the workforce. Figure 1 highlights the rapid growth of the elderly population over the next 14 years. The needs of the elderly for services and support will have to be financed by the working population (age 25-54) that, as illustrated, is not growing rapidly in the near future. Increasingly, people of working age will largely be people of color, who, without improved educational attainment, will not be competitive in the world economy.
Figure 1: Year-to-Year Change in U.S. Population, 2002-2020
-500,000
0
500,000
1,000,000
1,500,000
2,000,000
2,500,000
2002 2004 2006 2008 2010 2012 2014 2016 2018 2020
25 to 54
55+
6 to 24
Source: U.S. Census Bureau
Lopez, J.K. State Higher Education Executive Officers
2

The impact of demographic changes on United States higher education: 2000-2050
Looking ahead to 2050, nearly 42% of the population is projected to between the ages of 45-85 years old. Only 31% of the population will be between the ages of 20-44, and a mere 26% of the population will be between the ages of 4-19 years of age. Due to the aging of the baby boomers and improving longevity, the number of people in 85+-year-old age group will grow by 389% between 2000 and 2050. The working age population will be smaller than the elderly population and only slightly larger than the school-age population.
Figure 2: Percent Change in Projected Population for the United States by Age Group, 2000-2050 Source: Population Change in The United States: Implications for Human and Socioeconomic Resources in the 21st Century, Steve R. Murdock The aging baby boom generation, overwhelmingly Anglo, will be the most well-educated elderly population the United States has ever witnessed. On the other side of the coin, youth will be increasingly Latino1 and African-American.2
Currently, the state of Colorado has one of the fastest growing elderly populations. While it ranks near the top for states with adults who have completed a bachelor degree, the state ranks 41st in the number of low-income students attending college in 2000.1 Colorado is a textbook case of a state that needs to pay more attention to demographics and the education of its younger generation.
1 The term Latino rather than Hispanic is used throughout this paper to recognize a more inclusive term for people with both Spanish and Latin American indigenous heritage. 2 Demographic trends cited in this paper were taken, unless otherwise noted, from Steve Murdock’s demographic presentations, courtesy of the Texas State Data Center and the Office of the State Demographer.
Lopez, J.K. State Higher Education Executive Officers
3
The impact of demographic changes on United States higher education: 2000-2050
Growth Areas by Geographic Region
Over the next thirty years the Western states will grow twice as fast as the national average, while the Midwest and Northeast will experience the opposite, growing at half the rate of the entire United States. While the West will experience the most rapid population growth, the South will continue to be the most populated region in the nation. Throughout the next thirty years more than one-third of the U.S. population is projected to reside in the southern states.
The rapid growth in the South and the West over the last 25 years will continue with force. These two areas are projected to account for over 80% of the persons added to the nation’s population over the next 30 years – 72 million persons. During this period the Midwest and Northeast will add a projected 7 million persons and 6 million persons respectively, but their populations will decline overall in relation to the entire United States.
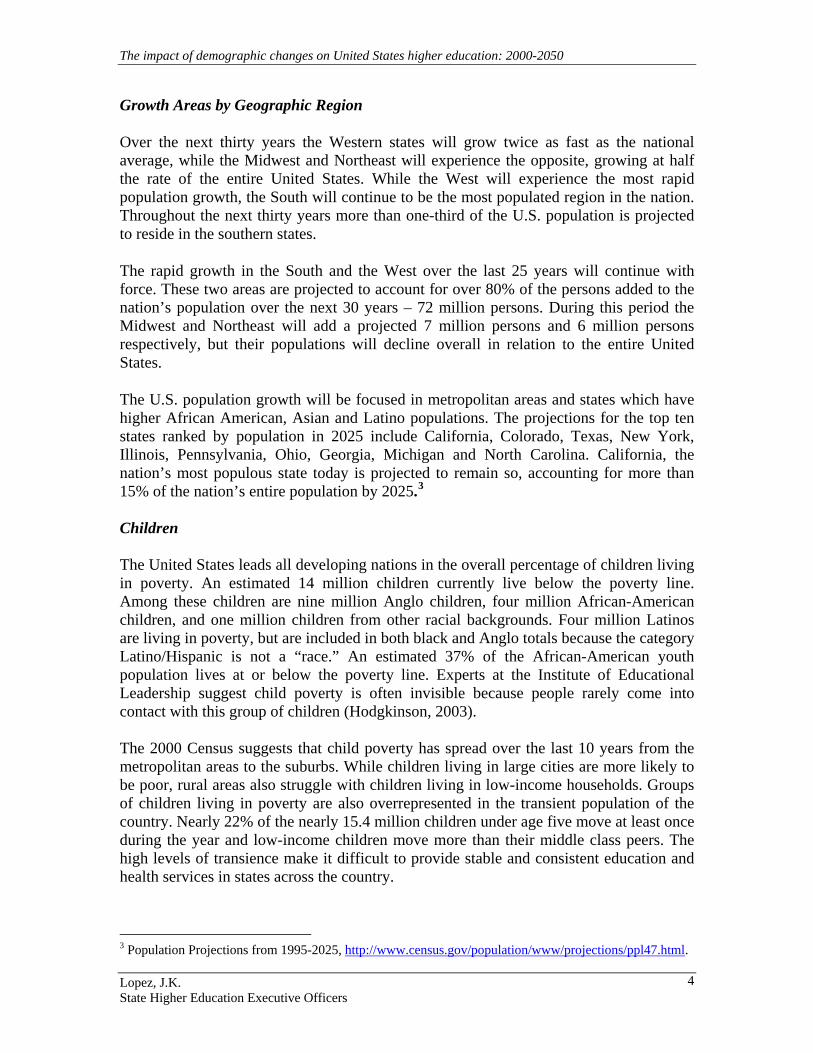
The U.S. population growth will be focused in metropolitan areas and states which have higher African American, Asian and Latino populations. The projections for the top ten states ranked by population in 2025 include California, Colorado, Texas, New York, Illinois, Pennsylvania, Ohio, Georgia, Michigan and North Carolina. California, the nation’s most populous state today is projected to remain so, accounting for more than 15% of the nation’s entire population by 2025.3 Children The United States leads all developing nations in the overall percentage of children living in poverty. An estimated 14 million children currently live below the poverty line. Among these children are nine million Anglo children, four million African-American children, and one million children from other racial backgrounds. Four million Latinos are living in poverty, but are included in both black and Anglo totals because the category Latino/Hispanic is not a “race.” An estimated 37% of the African-American youth population lives at or below the poverty line. Experts at the Institute of Educational Leadership suggest child poverty is often invisible because people rarely come into contact with this group of children (Hodgkinson, 2003). The 2000 Census suggests that child poverty has spread over the last 10 years from the metropolitan areas to the suburbs. While children living in large cities are more likely to be poor, rural areas also struggle with children living in low-income households. Groups of children living in poverty are also overrepresented in the transient population of the country. Nearly 22% of the nearly 15.4 million children under age five move at least once during the year and low-income children move more than their middle class peers. The high levels of transience make it difficult to provide stable and consistent education and health services in states across the country.
3 Population Projections from 1995-2025, http://www.census.gov/population/www/projections/ppl47.html.
Lopez, J.K. State Higher Education Executive Officers
4
The impact of demographic changes on United States higher education: 2000-2050
With the percentage of single-parent mothers and low-income households increasing over the next 50 years, a slight increase in children born into poverty is expected. For instance, women whose household incomes are less than $10,000 per year have 73 births per every 1,000 women of childbearing age; this is almost 50% higher than women with incomes of over $75,000, who only have 50 births per 1,000 women of childbearing age. The percentage of children born to unmarried parents continues to rise each year to slightly more than 34% in 2000. And for every ethnic group in the United States, a child being raised by a single mother is two to three times more likely to be raised in poverty than a child being raised by both parents.
The risks for young children in our country include poverty, infant and child mortality, low birth weight, single parents, teen mothers, transience, child abuse and neglect, lack of quality day care, low wage jobs for parents, unemployed parents, lack of access to health and medical care, low parent educational levels, and poor nutrition.
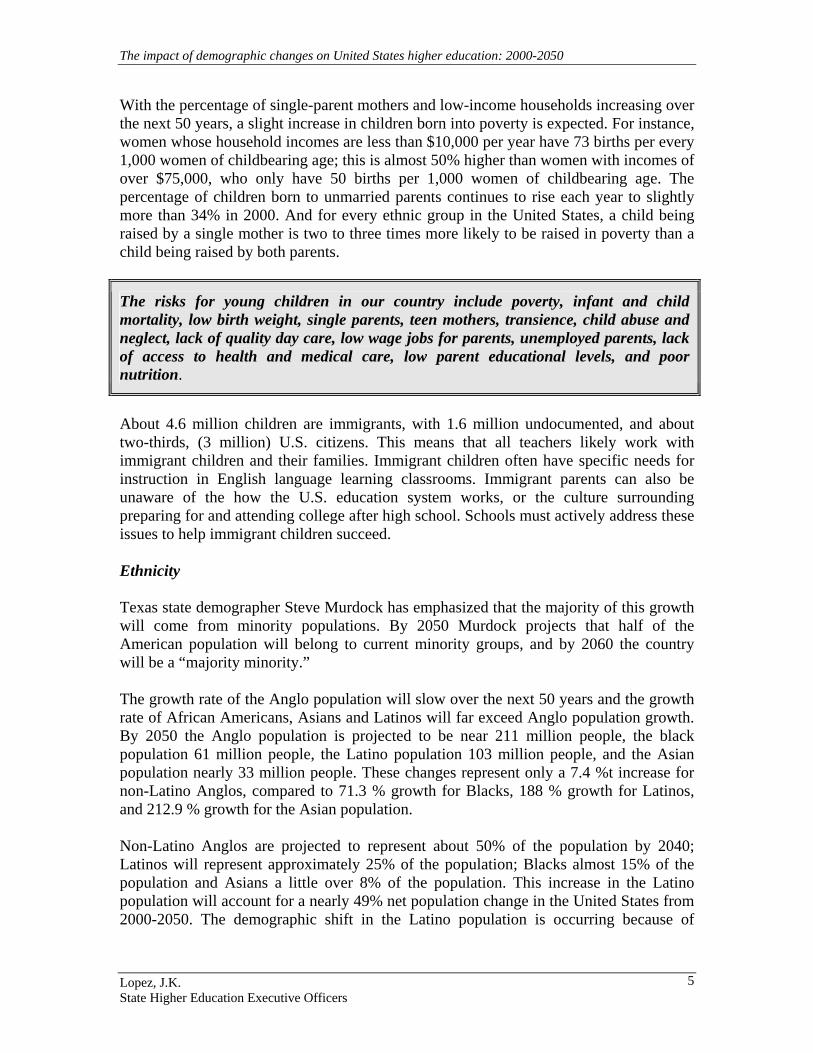
About 4.6 million children are immigrants, with 1.6 million undocumented, and about two-thirds, (3 million) U.S. citizens. This means that all teachers likely work with immigrant children and their families. Immigrant children often have specific needs for instruction in English language learning classrooms. Immigrant parents can also be unaware of the how the U.S. education system works, or the culture surrounding preparing for and attending college after high school. Schools must actively address these issues to help immigrant children succeed. Ethnicity Texas state demographer Steve Murdock has emphasized that the majority of this growth will come from minority populations. By 2050 Murdock projects that half of the American population will belong to current minority groups, and by 2060 the country will be a “majority minority.” The growth rate of the Anglo population will slow over the next 50 years and the growth rate of African Americans, Asians and Latinos will far exceed Anglo population growth. By 2050 the Anglo population is projected to be near 211 million people, the black population 61 million people, the Latino population 103 million people, and the Asian population nearly 33 million people. These changes represent only a 7.4 %t increase for non-Latino Anglos, compared to 71.3 % growth for Blacks, 188 % growth for Latinos, and 212.9 % growth for the Asian population. Non-Latino Anglos are projected to represent about 50% of the population by 2040; Latinos will represent approximately 25% of the population; Blacks almost 15% of the population and Asians a little over 8% of the population. This increase in the Latino population will account for a nearly 49% net population change in the United States from 2000-2050. The demographic shift in the Latino population is occurring because of
Lopez, J.K. State Higher Education Executive Officers
5
The impact of demographic changes on United States higher education: 2000-2050
immigration, the youthfulness of the Latino population, and the number of children individual Latinos choose to have.
Figure 3: Percent of Net Population Change Due to Each Race/Ethnicity Group for the United States, 2000-2050
Source: Population Change in The United States: Implications for Human and Socioeconomic Resources in the 21st Century, Steve R. Murdock
The increase in the Latino population in many states in the South has far exceeded the rates expected. Between 1990 and 2004, North Carolina saw its Latino population grow from 76,000 to nearly 600,000. From the school year 2000-2001 to 2004-2005, Latino students accounted for 57% of the total growth in the North Carolina public schools.
Immigration Of the nearly 300 million people living in the United States, an estimated 35 million (both documented and undocumented) are foreign-born. Immigrants now account for 12% of the total U.S. population, and the proportion is growing. In less than a decade the percentage of immigrants is projected to account for more than 14% of the population, above the peak of 1910 when nearly 14% of the population was foreign-born. In 2005 the top ten sending countries for immigrants were Mexico, China, Philippines, India,
Lopez, J.K. State Higher Education Executive Officers
6
The impact of demographic changes on United States higher education: 2000-2050
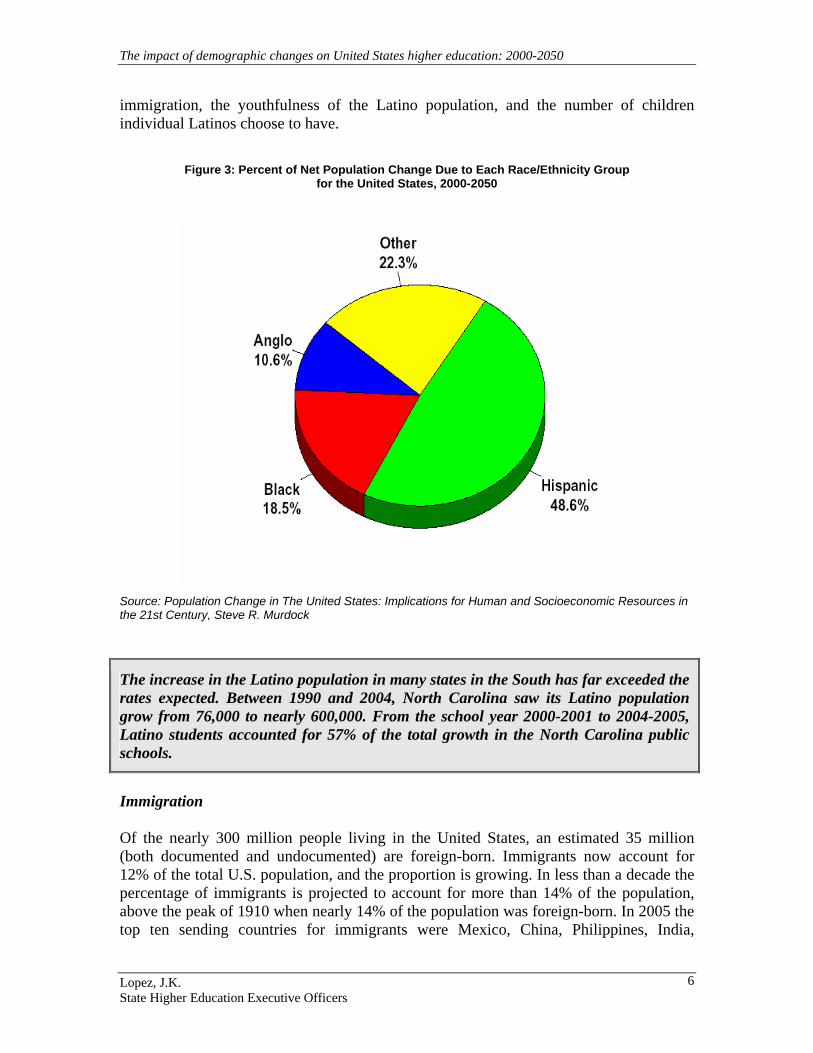
El Salvador, Vietnam, Cuba, Dominican Republic, Canada and Korea.4 The immigrant population is a key resource to the U.S. economy, filling both low-wage jobs and higher skilled jobs where the nation has an undersupply of trained workers. In 2005 The Urban Institute presented a series of trends concerning immigrants and schools, which are particularly relevant to higher education. Currently in the United States more than 1 in 9 residents is an immigrant, and 1 in 5 of those immigrants is a low-wage worker. Nearly 1 in 5 children is a child of an immigrant, and 1 in every 4 children of an immigrant is low-income. It is imperative for our future knowledge-based economy that these immigrants continue through the education pipeline into colleges and universities. Within the 35 million immigrant population, nearly 28% are undocumented immigrants, 31% are legal, permanent residents, 31% are naturalized citizens, 3% are temporary legal residents, and 7% are refugees. Among this population, 30% of the adult population has not completed high school, nearly 30% of immigrant headed households utilize at least one welfare service, and about 30% of the immigrant population lack health insurance. The Center for Immigration Studies comments that, “The low educational attainment of many immigrants and resulting low wages are the primary reasons so many live in poverty, use welfare programs, or lack health insurance, not their legal status or an unwillingness to work.”
Figure 4: Citizenship and Legal Status of U.S. Immigrants, 2003
Source: Urban Institute estimates based on March 2003 Current Population Survey, adjusted for undercount, and U.S. Homeland Security data. While the number of undocumented immigrants adds to the margin of error in population projections, U.S. population growth without immigration from 2000-2050 would add
4 Center for Immigration Studies at www.cis.org/articles/2005/back1405.html
Lopez, J.K. State Higher Education Executive Officers
7

The impact of demographic changes on United States higher education: 2000-2050
only about 35 million people to the population, compared to the 107.9 million with immigration. Without immigration, the workforce in the United States would suffer even more severe worker shortages. Because immigrants are younger and closer to working age, their addition to the workforce is crucial for U.S. economic growth and stability. Raising their educational attainment levels will be equally as important. Distribution of Income In 1999 the median household income in an Anglo household was $45,367; in a black household it was $29,423; in a Latino household, it was $33,676; and in an Asian household, the median income was $51,908. If these income disparities persist over the next 50 years, the nation as a whole will become poorer in constant dollars than we are today. In earlier generations the U.S. economy included a large number of manufacturing jobs; jobs that paid well, included health care and retirement benefits, and often supported a middle class lifestyle. These jobs are disappearing rapidly in today’s knowledge-based economy. For example, personal income per capita in the United States is projected to decline $395 in inflation-adjusted dollars from $21,591 in 2000 to $21,196 in 2020. The National Center for Public Policy and Higher Education reports the U.S. would see a net gain in personal income of nearly $805 billion if education levels nationwide were raised for African Americans, Latinos and American Indians to the levels of education completed by Anglos in the five-best performing states. Improving educational attainment for communities of color would benefit the entire country.
Figure 5: Projected Changes in Personal Income Per Capita, 2000 to 2020, Based on Three Assumptions
Source: U.S. Census Bureau, 5% Public Use Micro data Samples (based on 2000 Census). Taken from the report Income in U.S. Workforce Predicted to Decline if Education Doesn’t Improve, National Center for Public Policy and Higher Education, Policy Alert, November 2005.
Lopez, J.K. State Higher Education Executive Officers
8
The impact of demographic changes on United States higher education: 2000-2050
Anthony Carnevale and Donna Desrochers have predicted that if the college attainment rates for students of color persist at their current rate, the U.S. could face a shortfall in 2020 of 14 million workers with the necessary skills and knowledge to compete for jobs in the global economy.
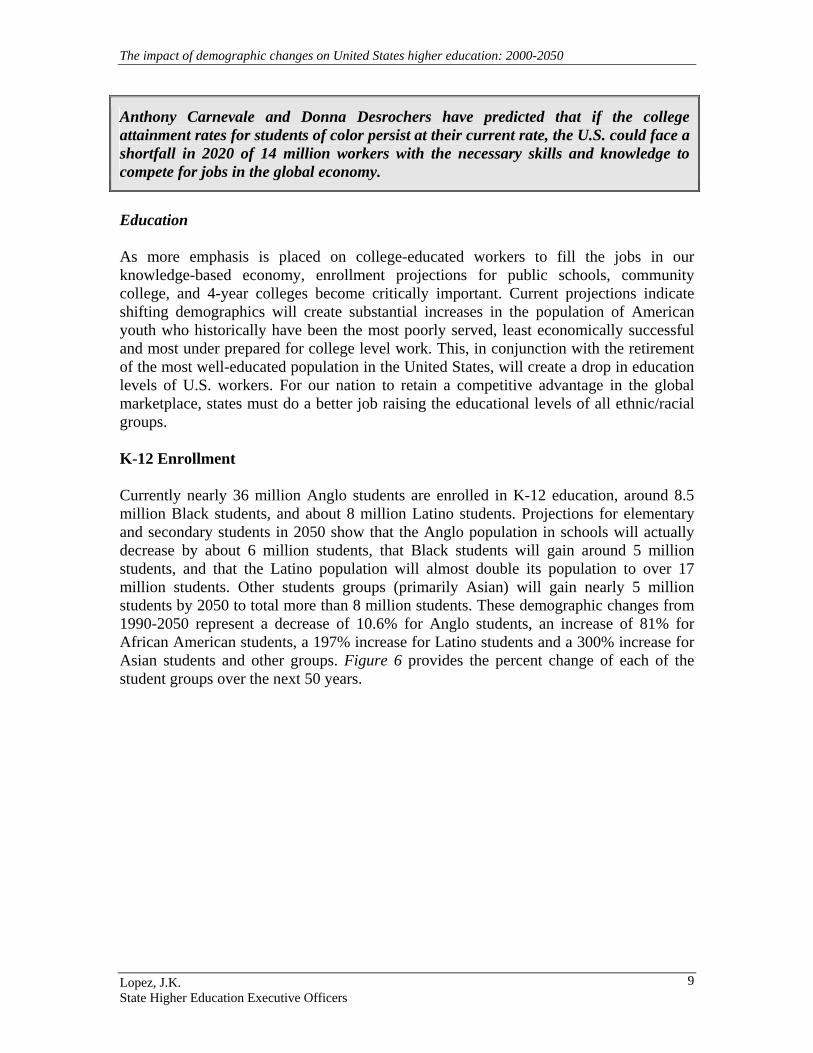
Education As more emphasis is placed on college-educated workers to fill the jobs in our knowledge-based economy, enrollment projections for public schools, community college, and 4-year colleges become critically important. Current projections indicate shifting demographics will create substantial increases in the population of American youth who historically have been the most poorly served, least economically successful and most under prepared for college level work. This, in conjunction with the retirement of the most well-educated population in the United States, will create a drop in education levels of U.S. workers. For our nation to retain a competitive advantage in the global marketplace, states must do a better job raising the educational levels of all ethnic/racial groups. K-12 Enrollment Currently nearly 36 million Anglo students are enrolled in K-12 education, around 8.5 million Black students, and about 8 million Latino students. Projections for elementary and secondary students in 2050 show that the Anglo population in schools will actually decrease by about 6 million students, that Black students will gain around 5 million students, and that the Latino population will almost double its population to over 17 million students. Other students groups (primarily Asian) will gain nearly 5 million students by 2050 to total more than 8 million students. These demographic changes from 1990-2050 represent a decrease of 10.6% for Anglo students, an increase of 81% for African American students, a 197% increase for Latino students and a 300% increase for Asian students and other groups. Figure 6 provides the percent change of each of the student groups over the next 50 years.
Lopez, J.K. State Higher Education Executive Officers
9
The impact of demographic changes on United States higher education: 2000-2050
Figure 6: Percent Change for Selected Time Periods for Projected Total, Elementary and Secondary Enrollment in the United States by Race/Ethnicity 1990-2050
-20-10
0102030405060
Anglo 6.4 -7.4 -2.8 -0.2 -4.8 -1.8Black 17.4 7.3 9.7 10 8.7 9.7Hispanic 35.3 21.8 19.3 17.6 14 12.7Other 49.3 34 25 20.5 16.8 13.7
1990-2000
2000-2010
2010-2020
2020-2030
2030-2040
2040-2050
Source: Graph created by numbers provided in Population Change in The United States: Implications for Human and Socioeconomic Resources in the 21st Century, Steve R. Murdock, Institute for Demographic and Socioeconomic Research, University of Texas San Antonio
In 2000 the public elementary and secondary school enrollment in Texas for non-Hispanic Anglos was 43.2%, for Blacks was 14.4%, and for Latinos was 39.5%. By 2040 non-Hispanic Anglos are projected to account for only 19.9% of the K-12 population, Blacks are projected to be 8.3%, and Latinos are projected to be nearly 66.3% of enrollments.
The dramatic increases in the Asian, Latino and African American populations over the next 50 years will make demographic make-up of the elementary and secondary schools look drastically different from anything we might even be able to imagine today. While the total Anglo population of schools today is nearly 70%, in 50 years the Anglo student population will represent a little less than 45% of the student population. On the other hand, the African American community will represent 20% of the overall school population and the Latino population will account for nearly 25% of the school-going population. The Asian community, the fastest growing but not the largest in terms of sheer numbers, will represent nearly 12% of the public school enrollment. Higher Education Enrollment
Lopez, J.K. State Higher Education Executive Officers
10
The impact of demographic changes on United States higher education: 2000-2050
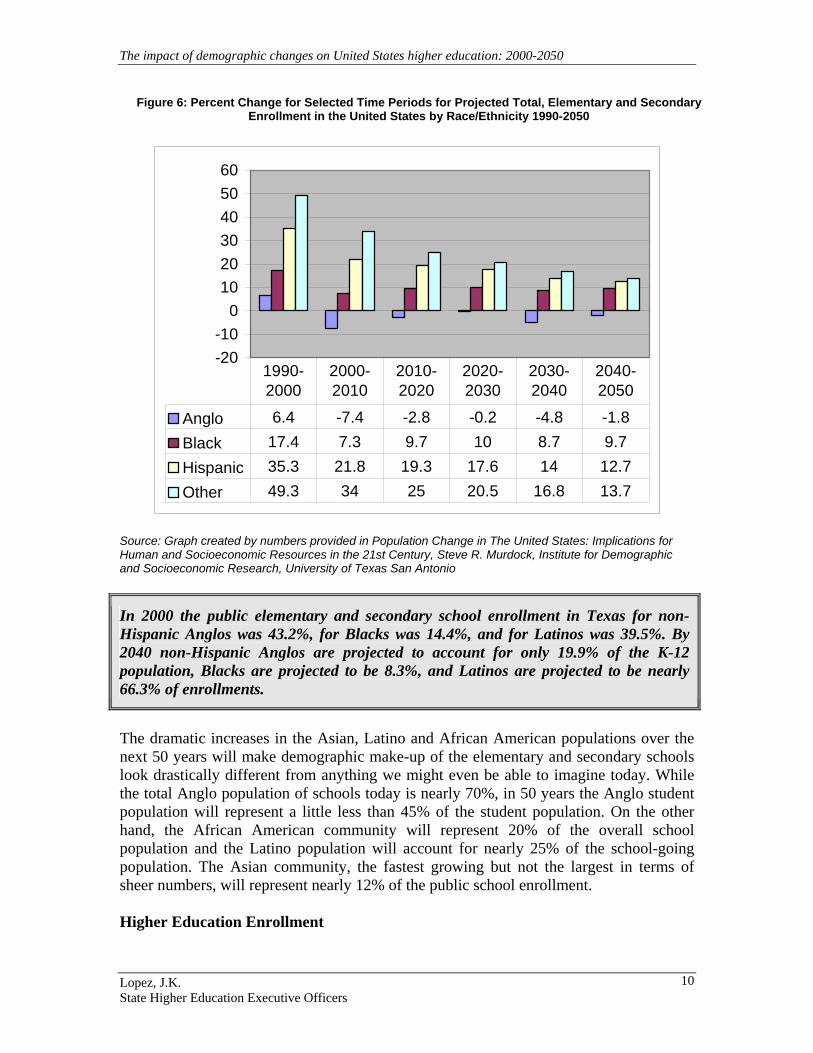
Higher education demographics will experience dramatic change as well. Currently, enrollments in most institutions do not accurately reflect the general population of the United States. The Anglo population is still overrepresented in higher education, even more so at private and 4-year colleges nationwide. In the future, demographers predict that these disparities of enrollment by race and ethnicity will continue.
Figure 7: Students Enrolled in Degree-Granting Institutions, by Race/Ethnicity, Fall 2002
67%
12%
10%
6%
1%4% Anglo
Black
Latino
Asian
AmericanIndianNonresidentalien
Source: U.S. Department of Education, National Center for Education Statistics. (2005). Digest of Education Statistics, 2004 (NCES 2006-005), Tables 171, 186, 187, 188. If Murdock’s 2050 projections for college are correct, the Anglo community will still hold the majority of college and university positions (both public and private) (at nearly 57%), and the African American, Latino, and Asian populations will have nearly the same amount of college students at around 14% each. Although public community colleges and universities are predicted to have larger Latino than Anglo student populations, the Anglo population will be over represented in private colleges nationwide. An increase in the total number of students of color attending college is projected, but the disparities in educational levels of the majority (which will no longer be Anglo, but Black and Latino) will be increasingly evident.
Lopez, J.K. State Higher Education Executive Officers
11

The impact of demographic changes on United States higher education: 2000-2050
Figure 8: Projected Percent of Public University Enrollment by Race/Ethnicity in 2000 and Projections for 2040
Source: Population Change in The United States: Implications for Human and Socioeconomic Resources in the 21st Century, Steve R. Murdock, Institute for Demographic and Socioeconomic Research, University of Texas San Antonio. Within higher education, Murdock projects that community colleges will enroll an increasingly disproportionate number of Latino students. In 2000, Anglo students represented the majority of students enrolled in community college (54.7%), while Latinos represented the next largest percentage at community colleges at slightly over 29%. The Black and Asian communities represented 11.1% and 4.7% respectively. In 2040 the Latino student body is projected to be the majority at community colleges, representing nearly 57% of the student body. The Anglo population is expected to hold a quarter of the enrollment and the Asian community (10.2%) will surpass the Black population (8.1%) at community colleges. At public universities the demographics will shift as well. Anglo students currently represent about 61% of the student body, Latino students follow with 21%, the Black student population is slightly over 10% and the Asian community represents 6.9%. In 2040 the demographic projections suggest that Latino students will account for over 44% of the student population, that Anglo students will account for 32%, Blacks will account for 8.1% of the student population and Asians for slightly over 15%. By 2040 the public universities will likely serve a majority Latino population in their institutions. While the college population demographics will change in response to the sheer number of Latino and Black students that will be born and educated in the United States, the educational attainment rates, which will heavily influence the income of the different populations in the country, are projected to remain severely unequal. The projections for 2040 of persons who are at least 25 years of age and who have a bachelor’s degree are as
Lopez, J.K. State Higher Education Executive Officers
12
The impact of demographic changes on United States higher education: 2000-2050
follows: 47.8% of the Anglo population, 29.6% of the Black population, 18% of the Latino population, and 68% for the Asian and other group population. The pattern of large percentage of students failing to complete high school and to continue in higher education is most severe within the African American and Latino populations. As the knowledge-based economy continues to demand more educated workers institutions of higher education will have to respond by bringing more students from ethnically and economically diverse backgrounds into their institutions. If institutions cannot recruit and retain more of these diverse groups of students, the overall personal income levels of persons in the United States will decrease. Making sure these “projections” do not come true must become a national priority. Synopsis: Dramatic changes in the demographic make-up of our country have already begun and are projected to accelerate in the coming decades. The most educated generation of our country, the baby boomers, will retire, and in their place will be a young and ethnically diverse workforce. If predictions remain accurate, the large Latino and African American population will grow substantially, yet if their educational levels do not rise as substantially, the nation’s economic disparities between the social classes will increase, and make the United States poorer as a whole. The K-12 public school systems will undergo a dramatic transformation and minority (African American, Latino and Asian) populations will become the majority population in large numbers of school systems nationwide. Teachers across the country will be working with more diverse social and ethnic backgrounds regardless of the types of school districts and neighborhoods that their schools are located within. While the South and West will experience the most dramatic population increases, because of the predominance of Latinos and African Americans living in those areas, no area of the country will be unaffected by the population shifts. The higher education system will also serve a much more diverse population of students than in the past. While few leading and flagship public colleges and universities have large numbers of students of color (with the exception of Historically Black Colleges and Universities - HBCUs, Hispanic Serving Institutions - HSIs, and Tribal Colleges), institutions will have to diversify their student body in order to serve the needs of their general state’s populations. As the diversity of the youth population grows, special attention must be given to the needs of those children living in poverty, children from immigrant households, and children from ethnically diverse backgrounds. Currently, 75% of the children who have immigrant parents are U.S. citizens; therefore, many of the children being born into the system will be more ethnically diverse, and the majority of U.S. citizens in schools will be students of color.
Lopez, J.K. State Higher Education Executive Officers
13

The impact of demographic changes on United States higher education: 2000-2050
The demographic predictions are important because they warn us of problems ahead if we fail to raise the educational achievement of low-income students and students of color. We must take a closer look at the problems that create barriers to access and learn how to remove them. IV. Focusing on the 2050 Future Changes occurring currently in higher education and the trends forecast for the next 50 years underscore the need to focus our efforts on the advancement of minority and low-income communities. As the nation becomes more ethnically diverse, social stratification will become more prominent. If trends regarding income disparities and access to education persist, the uneducated and unskilled workforce will be a social and economic detriment to the nation. It is imperative to consider what will be necessary for colleges and high schools to do to attract learners in the future. We use the language of “attracting learners” to emphasize that many K-12 programs are failing to engage (and, in turn, graduate) their high school students. At the next level, public colleges, both community colleges and four-year universities, continue to have dismal graduation rates as compared to many of our international counterparts.5. If we are not able to engage communities of needy students we will not be able to get the education results we desire, and educational inequality will continue to exist. The final section of this paper will highlight crucial issues and solutions to these issues from birth to grade 12 and in higher education. Birth To 12th grade: Children in Poverty Hodgkinson (2003) asserts that poverty is a “universal handicapping conditioning, regardless of ethnicity.” He stresses this point by demonstrating that over 70% of the National Assessment of Education Progress test scores can be predicted by the household income of the child taking the test. While reducing poverty is a huge challenge, evidence shows that access to education can reduce the effects of poverty in a child’s life.
Young children in poverty benefit greatly from high quality education, and those benefits are important in terms of social, cognitive and emotional development for later success in school. Programs such as Head Start provide child-development programs for those living in poverty, and have demonstrated long-term, positive results for both the child and the communities in which they live. Children in a longitudinal study of a pre-school program in Michigan found that at age 27 the participants showed significant differences
5 Organization for Economic Co-operation and Development, Education at a Glance 2004, 2004
Lopez, J.K. State Higher Education Executive Officers
14
The impact of demographic changes on United States higher education: 2000-2050
over the control group including higher educational attainment, higher levels of homeownership, lower rates of incarceration and higher incomes. 6
These programs should be fully funded and required for all who are eligible. The results of current longitudinal early childhood research should indicate more clearly what types of universal childcare and education will be necessary to give children in poverty a fair chance to succeed like their middle and upper class peers. Along with child education, we will have to promote parental involvement and education for the young children in these programs. This will include serving working-class families in innovative ways including high-quality pre-school programs, health information and guidance programs, and innovative before and after-school programs.
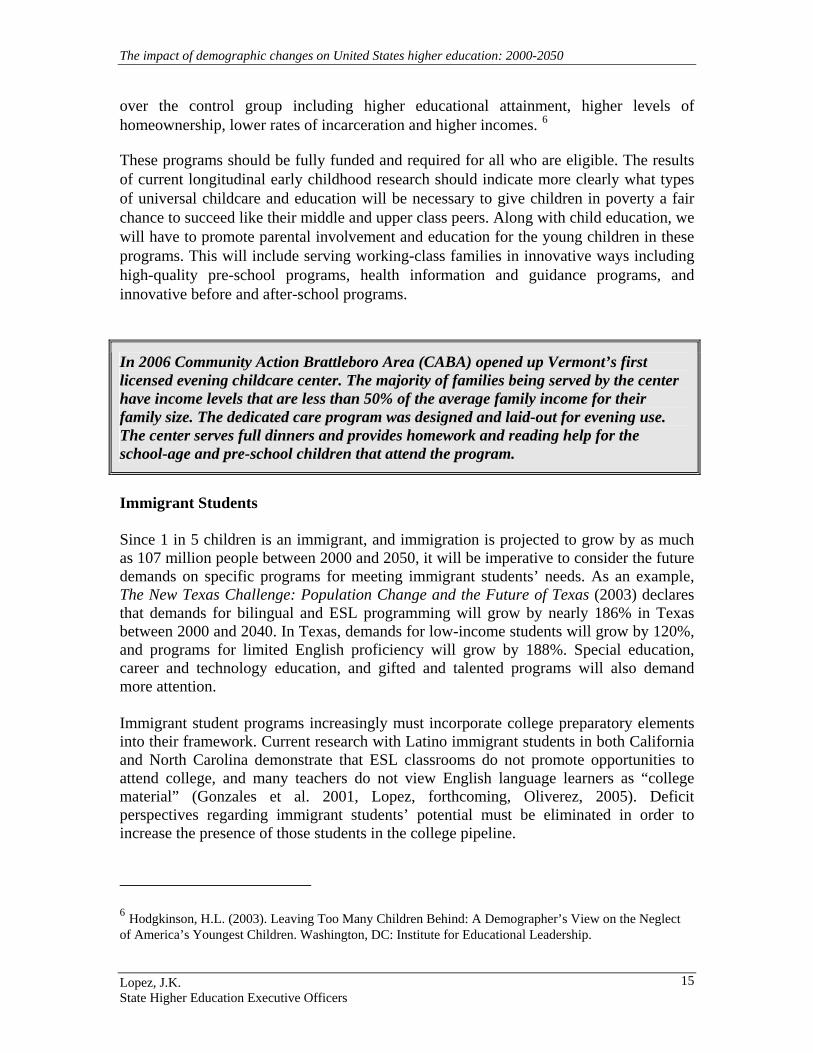
In 2006 Community Action Brattleboro Area (CABA) opened up Vermont’s first licensed evening childcare center. The majority of families being served by the center have income levels that are less than 50% of the average family income for their family size. The dedicated care program was designed and laid-out for evening use. The center serves full dinners and provides homework and reading help for the school-age and pre-school children that attend the program.
Immigrant Students Since 1 in 5 children is an immigrant, and immigration is projected to grow by as much as 107 million people between 2000 and 2050, it will be imperative to consider the future demands on specific programs for meeting immigrant students’ needs. As an example, The New Texas Challenge: Population Change and the Future of Texas (2003) declares that demands for bilingual and ESL programming will grow by nearly 186% in Texas between 2000 and 2040. In Texas, demands for low-income students will grow by 120%, and programs for limited English proficiency will grow by 188%. Special education, career and technology education, and gifted and talented programs will also demand more attention. Immigrant student programs increasingly must incorporate college preparatory elements into their framework. Current research with Latino immigrant students in both California and North Carolina demonstrate that ESL classrooms do not promote opportunities to attend college, and many teachers do not view English language learners as “college material” (Gonzales et al. 2001, Lopez, forthcoming, Oliverez, 2005). Deficit perspectives regarding immigrant students’ potential must be eliminated in order to increase the presence of those students in the college pipeline.
6 Hodgkinson, H.L. (2003). Leaving Too Many Children Behind: A Demographer’s View on the Neglect of America’s Youngest Children. Washington, DC: Institute for Educational Leadership.
Lopez, J.K. State Higher Education Executive Officers
15

The impact of demographic changes on United States higher education: 2000-2050
Estela Bensimon (2006) has developed the Equity Scorecard Project to confront the deficit perspectives that individuals often hold regarding students of color. This project helps college campuses understand how racial inequalities are viewed and to transform how people view racial inequities. Bensimon comments, “While deficit minded individuals construe unequal outcomes as originating from student’s characteristics, equity minded individuals will reflect on institution-based dysfunctions and consider their own roles and responsibilities as well as those of their colleagues in the production of equitable outcomes.”
Low Income and Students of Color Needs High School Reform Improving access to higher education starts with improving America’s high schools. As K-12 education increasingly serves a majority student-of-color populations, action steps for engaging all types of student learners will have to be implemented. The National Education Summit of High Schools (2005) proposed suggestions for improving the quality of high school education include raising teacher salaries, creating alternative preparatory programs for prospective teachers in high demand fields, and encouraging and helping train principals on managing and utilizing data.7 These solutions will require a larger financial investment in K-12 public education. Many reform initiatives recognize that the high school senior year is not often used to prepare for college. Increasing dual enrollment to motivate high school students and to connect them to the college environment is one proposed solution. Dual enrollment may also reduce the time and money spent to graduate from college.
A study of Florida high school students found that those students who took one or more dual enrollment classes were enrolled at higher rates in postsecondary education than those who were not. 8
Jobs for the Future (2004), a non-profit research and advocacy organization, has suggested several innovative policy proposals to create a fast track between high school, college, and work arenas. Proposals include an academic head start on college (similar to the early-college high schools currently being developed by the Gates Foundation), an accelerated career and technical college career path that would give students an early start on transferable credits while at the same time preparing them for entry-level jobs, and a gap year between high school and college that would combine both a year of community service and work experience. All fast-track proposals would be initiated by the beginning of a student’s senior year with the idea that a more rigorous curriculum will better prepare students for high school exit standards.
7 National Education Summit High School, Action Agenda for Improving America’s High Schools 8 Southern Regional Education Board Challenge to Lead Series (2006)
Lopez, J.K. State Higher Education Executive Officers
16
The impact of demographic changes on United States higher education: 2000-2050
These bold proposals reject a “one-size-fits-all” model for high school programs and advocate several inclusive models to respond to changing demographics. In a classroom of diverse learners, teachers will have to teach to different learning styles to connect with students who come from varied backgrounds. Rigor and High Expectations The emerging national consensus argues that all students should have access to the rigor and standards of a college prep program curriculum, and high school standards must be more firmly anchored in the skills demanded by colleges and real world employers. The debate around rigor, and what rigor means, has been driven by the troubling statistic that more than 40% of all students who attend 4-year colleges, and 60% of those in 2-year colleges, need to take remedial coursework. The National Education Summit’s Action Agenda for Improving American High Schools (2005) suggests that states must keep better track of those students who need remedial coursework in college and must intervene in those low-performing high schools that are producing such graduates. It also suggests that the government should provide financial incentives for higher education leaders to work with high school faculty and local community officials. One such model of collaboration between high schools and colleges is the University Park Campus School/Clark University.9 Since 1996 Clark University has worked in collaboration with the campus school to create one of the most successful and high-performing high schools in Massachusetts. Through training and professional development, Clark University has created an institute for excellence in teacher training which should be a model for others to replicate. Clark has done this with a student body whose majority is of low-income, English-as-a-second-language learners; and over 95% are first-generation students. Efforts to increase rigor and high expectations must examine the role of insufficient instruction in the classroom, and high school standards that line up with college expectations. While some states have attempted to align their graduation requirements with college entrance requirements, little is known about whether such alignment produces the rigor, and perhaps more importantly, the engagement, of low-income students and students of color. More research is needed to understand how aligning standards can result in student engagement for increased retention at the high school level.
9 http://www.upcsinstitute.org/
Lopez, J.K. State Higher Education Executive Officers
17
The impact of demographic changes on United States higher education: 2000-2050
Teaching Kids the How, Why, and What to Learn The national debate around high school reform emphasizes the imperative for schools to teach children not only how to learn, but what is important to learn, and why. Many students are unmotivated because they do not understand the usefulness of many learning activities in school. In addition, the gap between what high schools are teaching and what colleges and businesses see as necessary skills and knowledge for success in the college and work environment is a problem. The WorkKeys Assessment by ACT 10 has helped students assess their own skills and the skills necessary for particular jobs. Assessment tests are available for students in various areas including writing, applied mathematics, teamwork, and applied technology. This program helps students understand what skill levels are necessary for specific jobs and careers to help students make better job and educational decisions in the future. In the report Ready or Not: Creating a High School Diploma that Counts (2004), The American Diploma Project (ADP) has also attacked the problem regarding the disconnect between a high school diploma and what skills are needed for college and the work environment by creating a guide to the English and Mathematics benchmarks necessary for completing workplace tasks. In an effort to align high school courses with needed work skills, ADP has provided workplace tasks for numerous job arenas. Such skills alignment can help place more academically prepared students into the college and knowledge-based workplace pipeline. Support Networks While college prep programs exist nationwide, many low-income communities still lack a “college culture”. Although communities of color have numerous strengths, when no one has attended college in one’s nuclear family, a child may not be receiving the message that college is an option. In the recent ETS report, Patricia Gandara (2005) demonstrates that high-achieving Latinos are much more likely than Anglo peers to have parents with low levels of educational achievement. Latino high-achievers are 50% less likely to have a parent with a college education. For this reason, schools play a vital role helping students of color access information and social networks regarding college. Gandara suggests that students of color should be targeted as early as preschool and kindergarten in order to help develop a culture supportive of achievement and college attendance. The Carolina Covenant program at UNC-Chapel Hill11 and the 21st Century Scholars Program in Indiana12 have succeeded in creating awareness about the opportunity to attend and pay for college. The Covenant guarantees that any student admitted to UNC who falls at or below 200% of the poverty level will be guaranteed a scholarship and
10 www.act.org/workkeys/assess/index.html 11 www.unc.edu/carolinacovenant/12www.in.gov/ssaci/programs/21st/index.html
Lopez, J.K. State Higher Education Executive Officers
18
The impact of demographic changes on United States higher education: 2000-2050
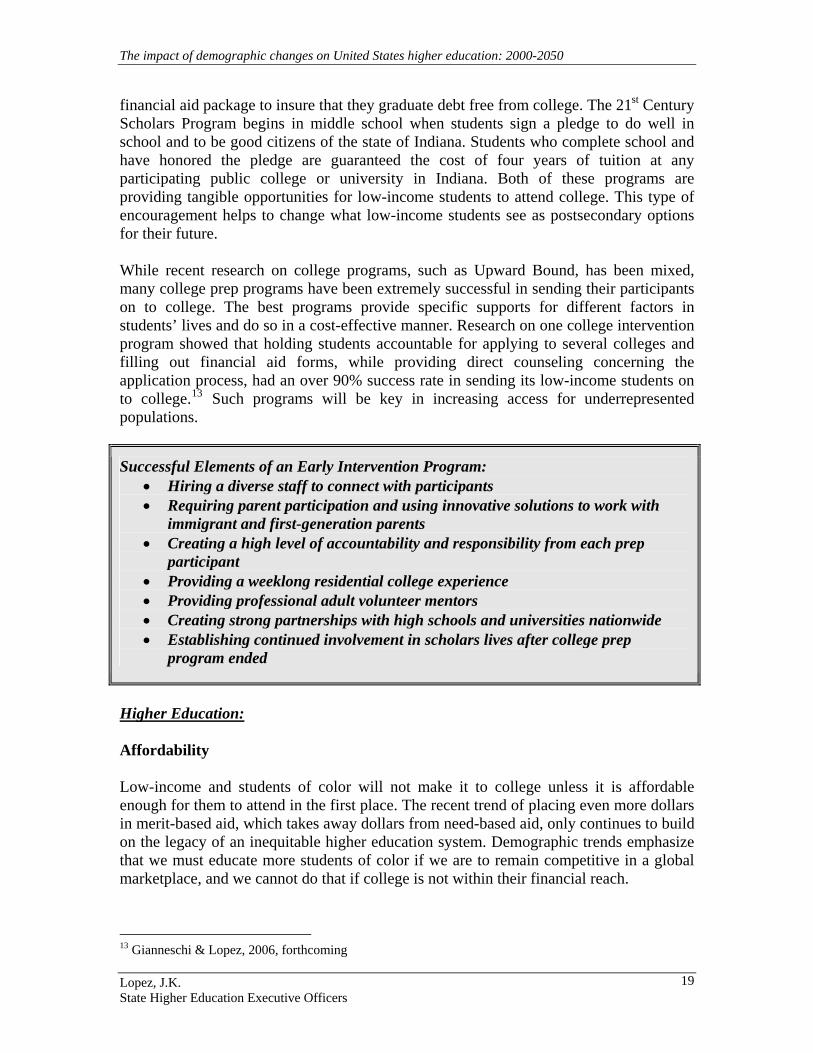
financial aid package to insure that they graduate debt free from college. The 21st Century Scholars Program begins in middle school when students sign a pledge to do well in school and to be good citizens of the state of Indiana. Students who complete school and have honored the pledge are guaranteed the cost of four years of tuition at any participating public college or university in Indiana. Both of these programs are providing tangible opportunities for low-income students to attend college. This type of encouragement helps to change what low-income students see as postsecondary options for their future. While recent research on college programs, such as Upward Bound, has been mixed, many college prep programs have been extremely successful in sending their participants on to college. The best programs provide specific supports for different factors in students’ lives and do so in a cost-effective manner. Research on one college intervention program showed that holding students accountable for applying to several colleges and filling out financial aid forms, while providing direct counseling concerning the application process, had an over 90% success rate in sending its low-income students on to college.13 Such programs will be key in increasing access for underrepresented populations.
Successful Elements of an Early Intervention Program: • Hiring a diverse staff to connect with participants • Requiring parent participation and using innovative solutions to work with
immigrant and first-generation parents • Creating a high level of accountability and responsibility from each prep
participant • Providing a weeklong residential college experience • Providing professional adult volunteer mentors • Creating strong partnerships with high schools and universities nationwide • Establishing continued involvement in scholars lives after college prep
program ended
Higher Education: Affordability Low-income and students of color will not make it to college unless it is affordable enough for them to attend in the first place. The recent trend of placing even more dollars in merit-based aid, which takes away dollars from need-based aid, only continues to build on the legacy of an inequitable higher education system. Demographic trends emphasize that we must educate more students of color if we are to remain competitive in a global marketplace, and we cannot do that if college is not within their financial reach.
13 Gianneschi & Lopez, 2006, forthcoming
Lopez, J.K. State Higher Education Executive Officers
19
The impact of demographic changes on United States higher education: 2000-2050
The Institute for Higher Education Policy’s report entitled Convergence: Trends Threatening to Narrow College Opportunity in America (2006), sets out three concrete principles: resources should be focused on those who need them, rewards should flow to those who could not otherwise attend, and programs that already exist and are successful should be expanded. The trend of aid policies that focus on merit rather than need stand in direct opposition to opening access for the neediest students. Programs, such as the Carolina Covenant and 21st Century Scholars, which help students graduate with little to no debt, should be expanded to more public universities where the majority of students of color will attend in the future.
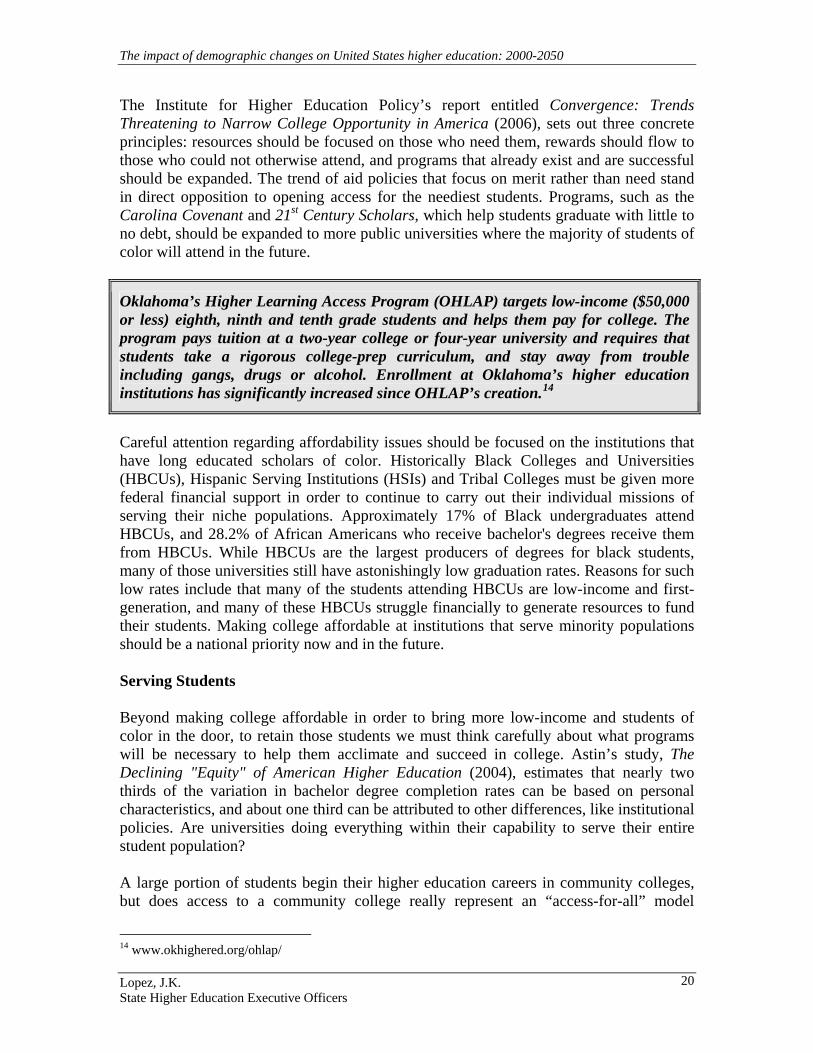
Oklahoma’s Higher Learning Access Program (OHLAP) targets low-income ($50,000 or less) eighth, ninth and tenth grade students and helps them pay for college. The program pays tuition at a two-year college or four-year university and requires that students take a rigorous college-prep curriculum, and stay away from trouble including gangs, drugs or alcohol. Enrollment at Oklahoma’s higher education institutions has significantly increased since OHLAP’s creation.14
Careful attention regarding affordability issues should be focused on the institutions that have long educated scholars of color. Historically Black Colleges and Universities (HBCUs), Hispanic Serving Institutions (HSIs) and Tribal Colleges must be given more federal financial support in order to continue to carry out their individual missions of serving their niche populations. Approximately 17% of Black undergraduates attend HBCUs, and 28.2% of African Americans who receive bachelor's degrees receive them from HBCUs. While HBCUs are the largest producers of degrees for black students, many of those universities still have astonishingly low graduation rates. Reasons for such low rates include that many of the students attending HBCUs are low-income and first- generation, and many of these HBCUs struggle financially to generate resources to fund their students. Making college affordable at institutions that serve minority populations should be a national priority now and in the future. Serving Students Beyond making college affordable in order to bring more low-income and students of color in the door, to retain those students we must think carefully about what programs will be necessary to help them acclimate and succeed in college. Astin’s study, The Declining "Equity" of American Higher Education (2004), estimates that nearly two thirds of the variation in bachelor degree completion rates can be based on personal characteristics, and about one third can be attributed to other differences, like institutional policies. Are universities doing everything within their capability to serve their entire student population? A large portion of students begin their higher education careers in community colleges, but does access to a community college really represent an “access-for-all” model
14 www.okhighered.org/ohlap/
Lopez, J.K. State Higher Education Executive Officers
20
The impact of demographic changes on United States higher education: 2000-2050
(Solórzano et al., 2004)? Often less than half of all students who begin at a community college transition into a four-year university. What elements of the community college experience are making that transition difficult and what can colleges do to make that transition more likely? Because students of color will continue to utilize this route to a 4-year degree, we must increase their success in those institutions and in the transition process.
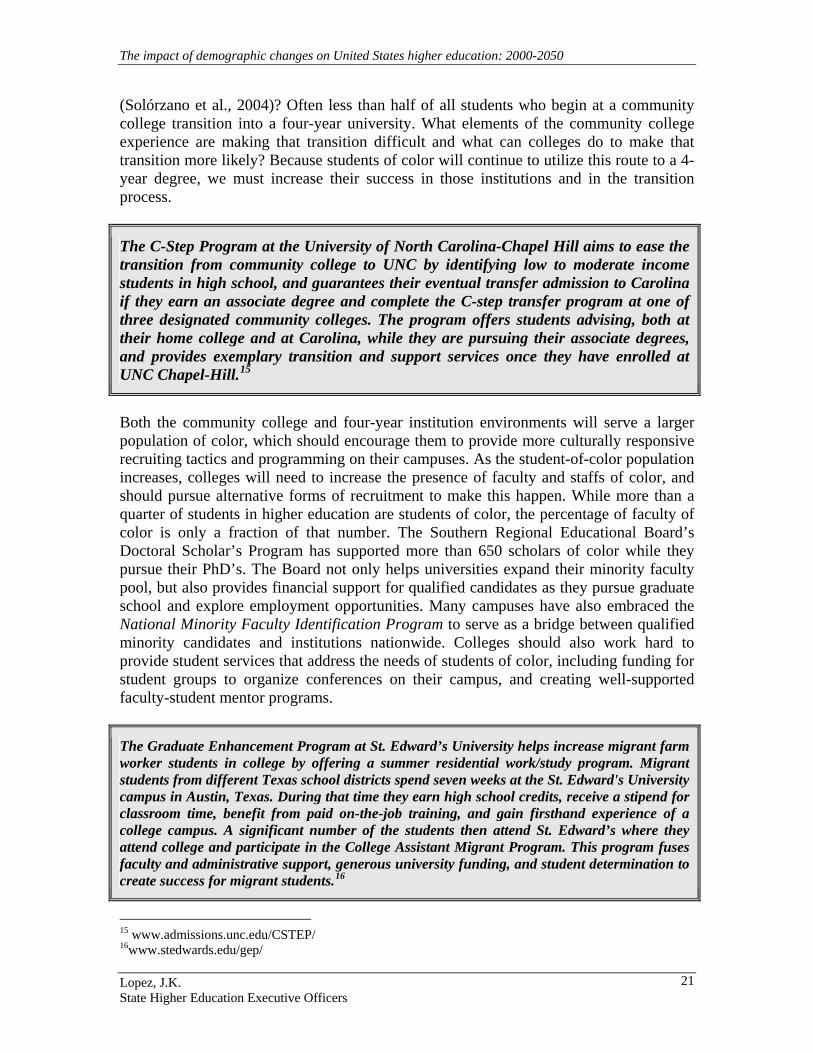
The C-Step Program at the University of North Carolina-Chapel Hill aims to ease the transition from community college to UNC by identifying low to moderate income students in high school, and guarantees their eventual transfer admission to Carolina if they earn an associate degree and complete the C-step transfer program at one of three designated community colleges. The program offers students advising, both at their home college and at Carolina, while they are pursuing their associate degrees, and provides exemplary transition and support services once they have enrolled at UNC Chapel-Hill.15
Both the community college and four-year institution environments will serve a larger population of color, which should encourage them to provide more culturally responsive recruiting tactics and programming on their campuses. As the student-of-color population increases, colleges will need to increase the presence of faculty and staffs of color, and should pursue alternative forms of recruitment to make this happen. While more than a quarter of students in higher education are students of color, the percentage of faculty of color is only a fraction of that number. The Southern Regional Educational Board’s Doctoral Scholar’s Program has supported more than 650 scholars of color while they pursue their PhD’s. The Board not only helps universities expand their minority faculty pool, but also provides financial support for qualified candidates as they pursue graduate school and explore employment opportunities. Many campuses have also embraced the National Minority Faculty Identification Program to serve as a bridge between qualified minority candidates and institutions nationwide. Colleges should also work hard to provide student services that address the needs of students of color, including funding for student groups to organize conferences on their campus, and creating well-supported faculty-student mentor programs.
The Graduate Enhancement Program at St. Edward’s University helps increase migrant farm worker students in college by offering a summer residential work/study program. Migrant students from different Texas school districts spend seven weeks at the St. Edward's University campus in Austin, Texas. During that time they earn high school credits, receive a stipend for classroom time, benefit from paid on-the-job training, and gain firsthand experience of a college campus. A significant number of the students then attend St. Edward’s where they attend college and participate in the College Assistant Migrant Program. This program fuses faculty and administrative support, generous university funding, and student determination to create success for migrant students.16
15 www.admissions.unc.edu/CSTEP/ 16www.stedwards.edu/gep/
Lopez, J.K. State Higher Education Executive Officers
21

The impact of demographic changes on United States higher education: 2000-2050
Degree Programs Many of the new college students in the future will be students of color and, because of this, we will need to respond to their curricular interests. While we know that Asian, Black and Latino families value higher education, little research has been conducted regarding how they would prefer to consume and invest in the higher education system. More research is needed regarding this issue. We now recognize that in a fast-paced society people want their education delivered to them in different and more concise methods. Whether or not we agree with non-traditional education methods, their existence is no longer a discussion but a reality. Thousands of students are utilizing proprietary and distance-education options. The integration of education and technology must be taken under consideration. Will online degree programs and distance education be able to reach out to more low-income and students of color? Will such degree programs be as marketable to employers as a traditional degree? Will the opportunity to attend a more traditional 4-year residential program versus an on-line degree create yet more social stratification? These are all questions which deserve our consideration. Global competition will continue to grow and the United States will have to build a strong base of students in the science, technology, engineering, and mathematics (STEM) fields. Recruiting students of color to these degree fields is already difficult but must be pursued if we are to have an educated workforce. The steady flow of immigrants into our country will also make the diversification of our nation’s educators a high priority. Among the recent recommendations from the College Board’s Report, Teachers and the Uncertain American Future (2006) is a national effort to create a teaching force that looks like America; this means that the percentage of minority teachers should match the percentage of minority students. The importance of getting more students into the STEM and education fields cannot be overstated.
From 1994 to 2004 the National Science Foundation and NASA successfully drew students of color into the STEM fields through the Model Institutions for Excellence Program. The total number of undergraduate degrees conferred on the campuses of Bowie State University, Oyate Consortium, Spelman College, UT-El Paso, Universidad Metropolitana and Xavier University increased by 47% – from 602 students to 886 between 1993-1994 and 2003-2004. The program has increased the capacity of minority-serving institutions to train students in STEM fields through individualized goals, objectives and action plans to fit each campus’s needs.
Accountability Systems Better accountability systems for higher education are needed to give the general public a clearer idea regarding how students are recruited and retained in the system. Statewide
Lopez, J.K. State Higher Education Executive Officers
22

The impact of demographic changes on United States higher education: 2000-2050
accountability systems give those states which already have them in place a much better idea of how education systems are serving their students throughout the educational pipeline. P-16 statewide data systems, such as the model in Florida, hold all levels of public education accountable for student progress. With the great increase of proprietary, distance, and non-degree-seeking classes being offered we will also need a greater understanding of who is utilizing those degree programs and what types of money and time are being invested into those degree programs. Currently, there is an overrepresentation of students of color in proprietary institutions. That they are overrepresented in this area of education, and that we know so little about their education and career paths in these types of schools should be of great concern to our future workforce. Greater accountability for these types of programs is necessary as well.
In the spring of 2006 the Colorado State Legislature passed HB 06-1046 concerning regulation of private occupational schools. This bill requires the Private Occupational School Board (PSOB) to prescribe uniform academic reporting policies and procedures for private occupational schools. The bill will help collect individual data on students or personnel when requested by the PSOB. Data on students attending these types of schools in Colorado will now be collected and will create a more detailed understanding of those students who attend such postsecondary schools.
IV. Conclusion This paper has distilled the major demographic changes in the United States over the next 50 years. The summary of these trends indicates that the workforce for our most educated population of baby boomers will be people of color. Without more access to higher education, the income disparities that create social and racialized hierarchies will continue, and our country will face a shortfall of educated workers. The K-16 education pipeline will play the most critical role in determining whether the demographers’ predictions regarding income inequalities persist. Policymakers must facilitate change in the inequitable education of opportunities available to growing disadvantaged populations. High school reform, a focus on rigor and high expectations, support networks, and teaching transferable skills to students must be key focus areas in the K-12 pipeline. Colleges must become more accessible by not only being more affordable, but also by creating a “college-going culture” for low-income students and students of color. In addition to considering how to best serve the students entering the system, more attention should be given to what types of education will give more people the opportunity to attend and complete college. To reach these goals, schools, colleges, and policymakers must be accountable for effective practices and policies. The predicted demographic changes will affect everyone in society. Increasing numbers of immigrants, children in poverty, baby boomers in retirement, communities of color,
Lopez, J.K. State Higher Education Executive Officers
23
The impact of demographic changes on United States higher education: 2000-2050
and low-income students will shape our shared future. While weak responses to demographic changes can have negative consequences, there is an opportunity to build on the strengths of the projected changes Young people of color with effective access to education can add strength in a knowledge economy. Immigrant students, with their understanding of two languages and two cultures are valuable resources in the global workforce. Public schools with a rigorous curriculum that is innovative and engaging for every student in the classroom will better serve all students. By anticipating change and responding creatively and productively, our nation can become better and stronger. Dangerous gas in the coalmine is a problem for all miners, and for the community in which those miners live. The demographers’ warnings should mobilize the higher education community to respond with creative interventions, and to expand those ideas that have proven successful. The risk is not the demographic changes, but inertia and apathy to respond.
Lopez, J.K. State Higher Education Executive Officers
24
The impact of demographic changes on United States higher education: 2000-2050
References: Achieve Inc. (2004). Ready or not: Creating a high school diploma that counts. Washington,
DC: The American Diploma Project. Achieve Inc. (2005). An action agenda for improving America’s high schools. National
education summit on high schools. Washington, DC. The American Diploma Project. Achieve Inc. (2006). Closing the expectations gap: An annual 50-state progress report on the
alignment of high school policies with the demands of college and work. Washington, DC: American Diploma Project Network.
Astin, A.W. (2004). The declining "equity" of American higher education.
The Review of Higher Education, 27 (3), 321-341. Bensimon, E.M. (2006). Learning equity-mindedness: Equality in educational outcomes. In The
Academic Workplace: NERCHE, Spring, 17 (1), 2-5; 18-21. Callan, P., Finney, J., Kirst, M., Usdan, M., Venezia, A. (2006). Claiming common ground: State
policymaking for improving college readiness and success. National Center Report #06-01. San Jose, CA: The National Center for Public Policy and Higher Education.
Camarota, S. (2002). Immigration in the United States-2002: A snapshot of America’s foreign
born population. Washington, DC: Center for Immigration Studies. Retrieved on June 15, 2006 at http://www.cis.org/articles/2002/back1302.html
Campbell, P. (1996). Population projections for states by age, sex, race, and Hispanic origin:
1995 to 2025. US Census Bureau. Retrieved on June 15, 2006 at http://www.census.gov/population/www/projections/ppl47.html.
College Board (July, 2006). Teachers and the uncertain American future. New York:
CollegeBoard. Capps, R., Fix, M. Murray, J., Ost, J., Passel, J., Herwantoro, S. (2005). The new demography of
American’s schools: Immigration and the no child left behind act. Washington, DC: The Urban Institute.
Carnevale, A. & Desrochers, S. (2002). The missing middle: Aligning education and the
knowledge economy. Princeton, NJ: Educational Testing Services. Colorado Commission on Higher Education (2005). CCHE executive summary, State higher
education finance, FY 2005, executive overview 2005. Retrieved on June 20, 2006 at http://www.state.co.us/cche/blueribbon/final/summary.pdf,
Lopez, J.K. State Higher Education Executive Officers
25

The impact of demographic changes on United States higher education: 2000-2050
Couturier, L. (2006). Convergence: Trends threatening to narrow college opportunity in America. Washington DC: Institute for Higher Education Policy.
Gandara, P. (2006). Fragile futures: Risk and vulnerability among Latino high achievers.
Princeton, NJ: Educational Testing Services. Gonzalez, K. P., Stoner, C., & Jovel, J. (2003). Understanding the role of social capital in
access to college for Latinas: Toward a College Opportunity Framework. Journal of Hispanic Higher Education, 2, 146-147.
Guiner, L. & Torres, G. (2002). The miner’s canary: Enlisting race, resisting power,
transforming democracy. Cambridge, Massachusetts: Harvard University Press. Hodgkinson, H.L. (2003). Leaving too many children behind: A demographer’s view on the
neglect of America’s youngest children. Washington, DC: Institute for Educational Leadership.
Hunt, J. & Tierney, T. (2006). American higher education: How does it measure up for the 21st
century. San Jose, CA: The National Center for Public Policy and Higher Education. Kasarda, J. & Johnson, J. (2006). The economic impact of the Hispanic population on the state of
North Carolina. Chapel Hill, NC: Kenan-Flagler Business School, The University of North Carolina at Chapel Hill.
Kay, R., Lord, J. & Bottoms, G. (2006). Getting students ready for college and careers. Atlanta,
GA: Southern Regional Education Board Challenge to Lead Series. Lopez, J. (forthcoming). We asked for workers and they sent us people: College-ready
undocumented student in North Carolina. Paper presentation for the Association for the Study of Higher Education Annual Conference (Anaheim, CA, November 11-14, 2006).
Martinez, M. (2004). Postsecondary participation and state policy: Meeting the future demand.
Sterling, VI: Stylus Publishing. Mingle, J. (2000). Higher education’s future in the “corporatized economy”: Occasional paper
No. 44. Washington, DC: Association of Governing Boards of Universities and Colleges. Murdock, S. (2003). The new Texas challenge: Population change and the future of Texas.
College Station, TX: Texas A&M Press. Murdock, S. (2006). Population change in the United States: Implications for human and
socioeconomic resources in the 21st century. San Antonio, TX: Institute for Demographic and Socioeconomic Research, University of Texas San Antonio.
Lopez, J.K. State Higher Education Executive Officers
26

The impact of demographic changes on United States higher education: 2000-2050
Murdock, S. (2006). Population change in Texas: implications for human and socioeconomic resources in the 21st century. San Antonio, TX: Institute for Demographic and Socioeconomic Research, University of Texas San Antonio.
National Center for Public Policy and Higher Education (November, 2005). Income of U.S.
workforce predicted to decline if education doesn’t improve, policy alert. San Jose, CA: National Center for Public Policy and Higher Education.
National Center for Public Policy and High Education (July, 2005). State capacity for higher
education policy: A special supplement to national crosstalk. San Jose, CA: National Center for Public Policy and Higher Education.
Oliverez, P. (2006). Too little but not too late. A discussion of polices and practices shaping
college access for undocumented immigrant students in the United States. Newsletter of the Association for the Study of Higher Education, 19 (1), 4-6.
Schleicher, A. (2004). Education at a glance 2004. Paris, France: Organization for economic co-
operation and Development (2004). Pennington, H. (2004). Fast track to college: Increasing postsecondary success for all students.
Boston, MA: Jobs for the Future. Plucker, J., Chien, R., Zaman, K. (2006). Enriching the high school curriculum through
postsecondary credit-based transition programs. Center for Evaluation and Education Policy, 4 (2), 1-12
Portes, A. (2005). The new Latin nation: Immigration and the Hispanic population of the United
States. Los Angeles, CA: Tomas Rivera Policy Institute. Mortenson, T. (July, 2005). Inherited educational opportunity. Oskaloosa, IA: Postsecondary
Educational Opportunity, 157. Swail, W.S. (2002, July/August). Higher education and the new demographics, questions for
policy. Change Magazine,15-22. State Higher Education Executive Offices (2006). State higher education finance FY 2005,
executive overview. Boulder, Colorado: SHEEO Press. The Journal of Blacks in Higher Education (2005). The nation’s colleges show a modest
improvement in African-American graduation rates, but a huge racial gap remains. Retrieved on July 25, 2006 at http://www.jbhe.com/features/50_blackstudent_gradrates.html.
Lopez, J.K. State Higher Education Executive Officers
27