the impact of credit rating changes on a …etd.lib.metu.edu.tr/upload/12616869/index.pdf · the...
TRANSCRIPT

THE IMPACT OF CREDIT RATING CHANGES ON
THE GOVERNMENT COST OF BORROWING IN TURKEY
A THESIS SUBMITTED TO
THE GRADUATE SCHOOL OF SOCIAL SCIENCES
OF
MIDDLE EAST TECHNICAL UNIVERSITY
BY
MURAT GÜRER
IN PARTIAL FULLFILLMENT OF THE REQUIREMENTS
FOR
THE DEGREE OF MASTER OF SCIENCE
IN
THE DEPARTMENT OF ECONOMICS
JANUARY 2014

Approval of the Graduate School of Social Sciences
Prof. Dr. Meliha Altunışık
Head of Graduate School
I certify that this thesis satisfies all the requirements as a thesis for the degree of
Master of Science.
Prof. Dr. Nadir Öcal
Head of Department
This is to certify that we have read this thesis and that in our opinion it is fully
adequate, in scope and quality, as a thesis for the degree of Master of Science.
Assist. Prof. Dr. Pınar Derin Güre
Supervisor
Examining Committee Members
Prof. Dr. Özlem Yılmaz (METU, BA)
Assist. Prof. Dr. Pınar Derin Güre (METU, ECON)
Dr. Dilem Yıldırım (METU, ECON)

iii
I hereby declare that all information in this document has been obtained and
presented in accordance with academic rules and ethical conduct. I also declare
that, as required by these rules and conduct, I have fully cited and referenced
all material and results that are not original to this work.
Name, Last Name: Murat GÜRER
Signature:
iv
ABSTRACT
THE IMPACT OF CREDIT RATING CHANGES ON
THE GOVERNMENT COST OF BORROWING IN TURKEY
Gürer, Murat
M.Sc., Department of Economics
Supervisor: Assist. Prof. Dr. Pınar Derin Güre
January 2014, 70 pages
Standard and Poor’s (S&P), Moody’s and Fitch have been producing credit ratings
for government bonds and corporate bonds. Changes in credit ratings affect the
investors’ decisions and government cost of borrowing as well. 2008 global financial
crisis is an important milestone for the credit rating agencies since during the crisis
period high rated countries faced with deep economic fluctuations which decreased
the creditworthiness of these agencies. This thesis investigates the relationship
between sovereign bond spreads and rating changes during the post-crisis period for
Turkey. We perform vector autoregression (VAR) model including Granger causality
test and impulse response functions (IRFs) analysis to investigate the effects of rating
changes on the Turkish government bond spreads from July 2007 to March 2013. We
also perform event study analysis in order to capture the dynamic effects of rating
changes on Turkish government bond spreads. We find some evidence that rating
announcement are often anticipated by the market so investors take their position
before announcement day which give us insignificant results in VAR estimates.
Keywords: Credit Rating, Government Borrowing, Vector Autoregression,, Event
Study, Market Anticipation

v
ÖZ
KREDİ NOTU DEĞİŞİKLİKLERİNİN TÜRKİYE’NİN DEVLET BORÇLANMA
MALİYETLERİNE ETKİSİ
Gürer, Murat
Yüksek Lisans, İktisat Bölümü
Tez Yöneticisi: Yrd. Doç. Dr. Pınar Derin Güre
Ocak 2014, 70 sayfa
Standard and Poor's (S&P), Moody’s ve Fitch şirket ve devlet tahvilleri için kredi
notu üretmektedir. Ülke kredi derecelerinde değişiklikler yatırımcıların kararlarını ve
dolayısıyla devlet borçlanma maliyetlerini etkiler. 2008 küresel finansal krizi kredi
derecelendirme kuruluşları için önemli bir kilometre taşıdır çünkü kriz sürecinde
yüksek dereceli ülkeler derin ekonomik dalgalanmalarla karşı karşıya kaldı ve bu
durum kredi derecelendirme kuruluşlarının güvenirliliğini azalttı. Bu çalışma kriz
sonrası dönemde Türkiye’nin devlet tahvili spreadleri ile kredi notu değişikleri
arasındaki ilişkiyi inceliyor. Temmuz 2007- Mart 2013 arasında vektör otoregresyon
(VAR), Granger nedenselliği, etki-tepki fonksiyonları ve olay çalışması yöntemleri
kullanılarak Türkiye’nin kredi notlarındaki değişikliklerin spread değişimleri
üzerindeki etkisi incelenmiştir. Ayrıca kredi notu değişiklerinin Türkiye’nin devlet
tahvili spreadleri üzerindeki dinamik etkisini incelemek için olay çalışmasını
uyguladık. Bu çalışmalar sonucunda kredi notu değişiklerinin genellikleri piyasa
tarafından sezildiğine dair kanıtlar bulunmuş olup not değişikliği öncesinde pozisyon
alan yatırımcılar VAR sonuçlarında önemsiz sonuçlar çıkmasına neden oluyor.
Anahtar Kelimeler: Kredi Notu, Devlet Borçlanması, Vektör Otoregresyon (VAR),
Olay Çalışması, Piyasa Beklentisi

vi
To My Parents
vii
ACKNOWLEDGMENTS
The author wishes to express his deepest gratitude to her supervisor Assit. Prof. Dr.
Pınar Derin Güre for her guidance, advice, patience, criticism, encouragements and
insight throughout the research.
We also would like to thank Dr. Dilem Yıldırım and Prof. Dr. Özlem Yılmaz for
their helpful comments.
This study was supported by The Scientific and Technological Research Council of
Turkey (TÜBİTAK) Grant No: 2210- Yurt İçi Yüksek Lisans Burs Programı.
viii
TABLE OF CONTENTS
PLAGIARISM...........................................................................................................iii
ABSTRACT ........................................................................................................ ..…iv
ÖZ .............................................................................................................................. v
DEDICATION .......................................................................................................... vi
ACKNOWLEDGMENTS ...................................................................................... vii
TABLE OF CONTENTS ........................................................................................ viii
LIST OF TABLES ..................................................................................................... x
LIST OF FIGURES/ILLUSTRATIONS/SCHEMES .............................................. xi
LIST OF SYMBOLS/ABBREVIATIONS ............................................................. xii
CHAPTER
1. INTRODUCTION ........................................................................................... 1
2. REVIEW OF THE LITERATURE ................................................................. 8
3. DATA AND METHODOLOGY ................................................................... 16
3.1 Data ........................................................................................................ 16
3.1.a. Introduction of Variables and Data Sources.............................. 16
3.1.b. Yield Spreads and Bond Yields ................................................ 19
3.1.c. Unit Root Tests .......................................................................... 20
3.2 Methodology .......................................................................................... 23
3.2.a. Vector Autoregression (VAR) Model ....................................... 23
3.2.b. Granger Causality...................................................................... 24
3.2.c. Impulse Response Function (IRF) ............................................ 25
3.2.d. Event Study Analysis ................................................................ 26
4. EMPIRICAL ANALYSES ............................................................................ 29
4.1 VAR Analysis ........................................................................................ 29
4.2 Granger Causality................................................................................... 35
4.3 IRF Analysis .......................................................................................... 38
4.4 Event Study Analysis ............................................................................. 42
5. CONCLUSIONS ............................................................................................ 46
REFERENCES ......................................................................................................... 49

ix
APPENDICES
A. SUPPLEMENTARY FIGURES AND TABLES ....................................... 52
B. TURKISH SUMMARY ............................................................................... 55
C. TEZ FOTOKOPİ İZİN FORMU .................................................................... 70

x
LIST OF TABLES
TABLES
Table 1.1 Ratings of the Agencies ............................................................................. 2
Table 3.1 Variable Names ........................................................................................ 20
Table 3.2 ADF Unit Root Test Results .................................................................... 21
Table 3.3 Phillips-Peron Unit Root Test Results ..................................................... 22
Table 3.4 Lag Selection............................................................................................ 24
Table 3.5 Number of Clean Events with 21 day Event Window ............................. 27
Table 4.1.a Vector Autoregression Estimates for Eurobond Spread of Turkey ....... 30
Table 4.1.b Vector Autoregression Estimates for Eurobond Spread of Turkey ...... 30
Table 4.1.c Vector Autoregression Estimates for Eurobond Spread of Turkey ....... 31
Table 4.1.d Vector Autoregression Estimates for Eurobond Spread of Turkey ...... 31
Table 4.1.e Vector Autoregression Estimates for Eurobond Spread of Turkey ....... 31
Table 4.1.f Vector Autoregression Estimates for Eurobond Spread of Turkey ....... 32
Table 4.2.a Vector Autoregression Estimates for EMBI Global Spread for Turkey 32
Table 4.2.b Vector Autoregression Estimates for EMBI Global Spread for Turkey 33
Table 4.2.c Vector Autoregression Estimates for EMBI Global Spread for Turkey 33
Table 4.2.d Vector Autoregression Estimates for EMBI Global Spread for Turkey 34
Table 4.2.e Vector Autoregression Estimates for EMBI Global Spread for Turkey 34
Table 4.2.f Vector Autoregression Estimates for EMBI Global Spread for Turkey 35
Table 4.3 Granger Causality for Eurobond Spread Change for Turkey .................. 36
Table 4.4 Granger Causality for EMBI Global Spread Change for Turkey ............ 37
Table A.1 Lag Length Selection for Spread Change Variable ................................ 53
Table A.2 Lag Length Selection for EMBIG Change Variable ............................... 54
Tablo B.1 Değişken İsimleri .................................................................................... 63
xi
LIST OF FIGURES
FIGURES
Figure 3.1: Turkey Eurobond Spread ....................................................................... 17
Figure 3.2: Turkey EMBIG Spread .......................................................................... 17
Figure 4.1 Impulse Responses of Eurobond Spread Change ................................... 39
Figure 4.2 Impulse Responses of EMBI Global of Turkey Spread Change ............ 41
Figure 4.3 Event Study Analyses for Turkey ........................................................... 43
Figure A.1 First difference of Spread ...................................................................... 52
Figure A.2 First difference of EMBIG ..................................................................... 52
Şekil B.1 Spread Değişimlerinin Kredi Notu / Görünüm Değişimlerine Tepkisi.... 65
Şekil B.2 Olay Çalışması Analizi............................................................................. 67

xii
LIST OF ABBREVIATIONS
AIC Akaike Information Criterion
CDO Collateralized Debt Obligation
CRA Credit Rating Agency
EMBI Emerging Market Bond Index
EMBIG Emerging Markets Bond Index Global
HQIC Hannan-Quinn Information Criterion
IRF Impulse-Response Function
MBS Mortgage-Backed Security
S&P Standard and Poor’s
SBIC Schwarz's Bayesian Information Criterion
VAR Vector Autoregression

1
CHAPTER 1
INTRODUCTION
Standard and Poor’s (S&P), Fitch, and Moody’s are the largest credit rating agencies
and they are private companies issuing ratings of state and other debt obligations.
The notes are issued by these agencies as letter grade which indicates the
creditworthiness of debt issuers such as governments, corporates etc. Even though
there is no legal obligation for issuers of bonds to get a credit rating, financial market
participants pay more attention to the assessment of rating agencies before investing
a bond. The sovereign credit rating indicates the risk level of a country’s investment
environment, taking political risk of that particular country into account and is used
by investors looking to invest abroad. Credit rating agencies (CRAs) have been
producing credit ratings for sovereign bonds (government bonds) and corporate
bonds for many years. CRAs each have their own rating methodology and rating
scale. They might change country’s rating or outlook when country’s sovereign
creditworthiness has changes significantly. Table 1.1 shows the characterization of
debt and issuer, letter grades and linear transformation of these grades according to
scale 21 and 17.
To believe that the rating agencies can influence financial markets and so, investors’
decisions, there exist several reasons. The main influence of CRAs’ arises from
whether rating announcements adding new and valuable information on the
sovereign credit markets. However there is a controversy whether rating changes
provide new information to markets at all because sovereign yield spreads as an
indicator of government credit risk are determined daily by the market and there is a
possibility that any information provided by announcing rating change might be

2
previously included in a change of sovereign yield spreads. The fact that rating
announcements of CRAs are based on public information makes this case stronger.
This situation causes a conflict of noise in the financial markets, that is, if yield
spreads and rating grades really follow the same unobserved facts then one of them
may simply introducing noise in the financial markets.
Table 1.1 Ratings of the Agencies
Source: Moody’s
As a key method of funding many economies employ debt securities and this method
generate an important asset class for many investors. In international financial
market investors pay more attention to the government bond yield spreads in order to
take position. Country bond yield spreads often represent the governments cost of
borrowing in the international financial markets. The country bond yield spreads is
adopted as an average measure of country default risk and it is calculated by
differencing the yield of country bond from the yield of a developed bond which
have same currency denomination and maturity. Policymakers and practitioners have
to be interested in understanding what drives the developments in spreads.

3
Policymakers and investors try to clarify the question of whether the government
bond spread is priced according to the country specific indicators. In this perspective,
if sovereign debt spreads remain at low levels for a long time without reflecting
economy’s specific indicators then a unexpected change in market participants’
perception of risk can lead to sudden changes in the debt spreads (borrowing cost)
for that country. Sovereign debt spreads are also very important for governments
because governments have huge amount of debts so a small deviations in bond prices
may result in significant cost for tax payers. In addition to that, in modern financial
markets, government bonds play crucial role on allocating assets and pricing assets.
The fact that rating announcements have significant impact for government bond
yields more than expected information contained in country specific indicators have
found in many papers. Cantor and Packer (1996) find that low inflation, low ratio of
foreign currency external debt to exports, more rapid growth, high per capita income,
and high level of economic development are all associated with high ratings. This
study is conducted by using rating data from S&P and Moody’s for 49 countries.
Their analysis shows that the information contained in macroeconomic indicators are
effectively summarized and supplemented by sovereign ratings. Also, authors
observe in their study that these indicators can be explanatory variables in the
explanation of bond spread as well. Therefore, they conclude that credit ratings are
strongly correlated with market determined government bond spreads so rating
changes influence sovereign spreads due to their correlation with macroeconomics
indicators. In follow-up study, Larrain, Reisen, and Maltzan (1997) employing panel
data analysis and event study analysis provides econometric analysis on the fact that
changes in credit rating have a significant effect on global financial market.
There exist some studies showing that credit ratings are the main determinants in the
process of pricing government bonds so government bond spreads incorporate the
investors’ expectation to credit rating changes. Erb, Harvey, and Viskanta (1996)
investigate the relation between country risk rating and countries’ bond yield spreads
for a sample of developed countries. The conclusion supports view that country risk
ratings are main determinants in the explanation of the cross-section of real yields.
Therefore, portfolio managers track changes in credit ratings closely because their

4
investment decisions basically depend on credit ratings especially for institutional
investors.
This thesis tries to find out the relationship between the rating changes and sovereign
bond spreads by taking the long-term foreign currency credit rating for Turkish
government bonds. In this study we aim to construct a broader outline for the effects
of CRAs’ views on financial markets by observing the Turkish government bond
instruments. As a main methodology in this study we use vector autoregressive
(VAR) method to examine the inter-relationship between variables of credit
rating/outlook change and spread changes (Eurobond or EMBI Global) of Turkey.
We continue with Granger causality test and impulse response functions (IRFs) in
order to increase the strength of the VAR analysis for Turkey case study. The study
of anticipation effects is crucial for these types of studies to obtain unbiased results
because rating or outlook changes are generally anticipated by market participants. In
this study delayed effects of rating and outlook changes is investigated because
rating/outlook changes can be made at any time of day. Using Turkish governments
bond spreads and CRAs’ ratings for long term foreign currency debt from July 2007
to March 2013, we analyze a few stylized facts and explain how the relationship
between Turkish government bond spreads and credit ratings can be used in order to
analyze the market and CRAs’ views to financial markets, especially for Turkish
government bonds.
We contribute some basic facts to the existence literature and our main contribution
to the literature as following. First, in our study we take latest period as a sample
period so our sampling period is more recent compared to others (Kaminsky and
Schmukler (2002), Cantor and Packer (1996), Larrain, Reisen, and J. Von Maltzan
(1997) and etc.) and this allows us to examine the impact of the 2008 global crisis to
the financial markets, especially, for Turkish government bonds. We examine not
only crisis period but also post crisis period to reach a reasonable result. Global
financial crisis is an important milestone for the credit rating agencies since during
the crisis high rated countries faced with deep economic fluctuations. The success
and reliability of a credit rating agency depends on its reputation, that is, how a credit
rating agency (CRA) produces information in an unbiased, timely, and accurate way
5
then its reputation increases. The global financial crisis has proven that ratings can be
inaccurate, untimely, and biased. According to Bahena (2010) the central problem
that leads to the global financial crisis is the inaccurate rating of agencies. CRAs
rated billions of dollars of structured finance instruments such as mortgage-backed
securities (MBSs) and collateralized debt obligations (CDOs) too highly, although
these instruments were very risky and caused the financial crisis. An additional
concern that decreased the reputation of CRAs is that the US firms’ dominance of the
CRA market. There exist an American CRAs oligopoly (S&P, Moody’s, and Fitch)
in the rating industry so CRA market requires listed companies and governments
around the world to conform to American business ideals to get high marks. A study
conducted by Reurink (2012) investigates the political aspect of CRAs in the
international financial system. The author evaluates the question of why American
CRAs are at the heart of the international financial system and then he evaluates their
position during the global financial crisis. Reurink reaches the conclusion that there
exists and American CRAs oligopoly in the rating industry so this situation produces
biased information for the financial market. These types of studies indicate that
global financial crisis starts a controversy about the CRAs reputation and their
position in the world economy. In the light of these controversies focusing on the
post-crisis period to evaluate the relationship between Turkish government bond
spreads and ratings is more reasonable than taking pre-crisis period. Most of the
literatures about this issue take pre-crisis period as a time zone and there are few
studies that take crisis and post-crisis period. Also for Turkey we deal with such an
issue in the first time and we think this thesis stimulates such studies for Turkey.
Therefore, taking updated time zone and focusing on the Turkey’s government bonds
will be our main contribution to the existence literature. Second, at literature
researchers generally use Emerging Market Bond Index (EMBI)1 spreads issued by
JP Morgan. The EMBI spreads are constructed by taking weighted average of
spreads on a variety of Brady bonds issued by the governments of developing
countries and these bonds typically have a long term maturity. However, in our
study we use Turkey five year government bond yields (Eurobonds) occurring at the
1 A benchmark to measure the total performance of government bonds issued by emerging countries
that are considered sovereign.
6
secondary market and Emerging Market Bond Index Global (EMBIG) spreads for
Turkey. EMBI Global includes U.S.dollar-denominated Brady bonds, loans, and
Eurobonds with an outstanding face value of at least $500 million and it is issued by
JP Morgan as well. Since EMBIG spreads include long term maturity Turkish
government bonds researchers look at the relation between the credit rating changes
and government bond yield spreads on the long-term view. However, we investigate
the medium-term and long-term effect of rating changes on the sovereign
government bonds yields for Turkey. While there is no set definition of what
constitutes the medium-term, it is generally accepted bonds are those that mature
somewhere between two and ten years so we take five year government bond spreads
as a represent of the medium term. We obtained data from Bloomberg so my data set
is shaped by limited Bloomberg data pool.
In literature there are few studies for Turkey how rating changes affect government
cost borrowing but these studies investigate this relation in narrow sense so they do
not give us reasonable results for Turkey. In this thesis we investigate this relation in
more detail sense for Turkey, although, narrowed study performed by Banking
Regulation and Supervision Agency (BDDK, 2009) in financial market report
prepared by BRSA in 2009.
According to analysis at the end of this thesis we reach some remarks:
i) according to vector autoregressive (VAR) model there is no inter-
relationship between the variables of credit rating/outlook change and spread
change for Turkey;
ii) according to Granger causality test results there exists no Granger causality
between variable of credit/outlook rating change and spread change for
Turkey;
iii) according to performed impulse response functions (IRFs) study market
participants’ attention to credit rating agencies’ announcement does not
significantly affect their decision for the Turkish government bond after the
2008 global financial crisis;

7
iv) event study analysis indicates that spreads begin to move in the anticipated
path before the announcement day for Turkish government bonds.
The rest of the thesis is organized as follows. In chapter 2, existing literature on the
relationship between credit rating announcements and the government bond yield
spreads is summarized. Chapter 3 describes the data and methodology facts. Chapter
4 discusses the details of empirical analyses of VAR, Granger causality test, IRFs,
and event study analysis results. In chapter 5, we present our main findings and we
provide the some possible further directions for the research investigated in this
study.

8
CHAPTER 2
REVIEW OF THE LITERATURE
In this chapter we aim to summarize the existing literature which dealing with the
effect of credit rating changes on the government cost of borrowing.
The existing studies which deal with credit ratings announced by agencies can be
generally divided into two groups. First group of studies focuses on the determinants
of credit rating. In these papers some methods are used such as linear estimation
methods and ordered response methods to reveal what the determinants of credit
rating are. For example, Afonso, 2003; Bissoondoyal-Bheenick, 2005 and Afonso,
Gomes and Rother, 2011 try to investigate the determinants of credit rating. They
conclude that real GDP growth, the public debt level, level of GDP per capita,
external debt, and the government budget balance mainly explain the rating scale. At
the second group of studies there exist papers that are investigating the impact of
credit rating changes on the government bond spreads. That is, they focus on the how
credit rating changes affect the cost of government borrowing. Kräussl (2005)
performs an event study analysis by using long-term foreign currency denominated
credit ratings from S&P and Moody’s for the period of January 1997 to December
2000. In this study an index is constructed in order to measure the speculative market
pressure that is used for the evaluation of rating effect on the financial market. Paper
concludes that credit rating and outlook changes have significant effect on the
government bond spreads, especially rating downgrade and negative outlook changes
significantly affect the government bond spreads. Furthermore, by performing event
study analysis for the period 1989-1997 Reisen and von Maltzan (1999) conclude in
their study that when a country faces with a downgrade in rating then there occurs a
significant change in sovereign bond spreads. Also, in this paper authors conclude
that there exists a two-way causality between credit ratings and sovereign bond
spreads for 29 emerging markets-Argentina, Australia, Austria, Belgium, Brazil,
Canada, Chile, Colombia, Czech Republic, Denmark, Finland, Germany, Hungary,
9
Indonesia, Ireland, Italy, Korea, Malaysia, Mexico, New Zealand, Norway,
Philippines, Poland, Portugal, South Africa, Spain, Sweden, Switzerland, Thailand,
Turkey, UK, USA, and Venezuela. Event study analysis explores the market reaction
for 30 trading days before and after the rating changes and authors finds a significant
impact of rating changes for a set of ratings by the three leading rating agencies of
S&P, Fitch, and Moody’s, although, there exists strong market anticipation for rating
changes. Furthermore, Granger causality test indicates that changes in credit rating
and changes in bond yields are mutually interdependent.
Afonso, Furceri, and Gomes (2011) examines the how the sovereign credit rating
changes affect the government bond yield spreads by taking European Union
countries’ daily data from January 1995 to October 2010. In this study event study
analysis is conducted for two day window, that is, authors examine the reaction of
bond yield spreads within two days of the rating change. Also, authors apply the
Granger causality test between the credit ratings and the yield spreads and their main
findings are as follows: i) rating/outlook change, especially negative changes,
significantly affect the government bond yield spreads; ii) rating and outlook changes
are not expected in the previous one or two months however; iii) there exist two-way
causality between sovereign credit ratings and government bond yield spreads in a
one or two week window; iv) there exist a transmission mechanism from countries
that have lower credit rating to countries that have higher credit rating; v) countries
face higher spreads if they have faced downgrade less than six months ago compared
to countries having same rate but they have not faced downgrade within the last six
months. Actually these type of findings shed light on the behavior of financial
markets in relation to sovereign credit rating changes.
Flore (2010) investigate the impact of rating and outlook changes on the domestic
and foreign financial market by using 18 emerging market data- Argentina, Brazil,
Bulgaria, Chile, China, Colombia, Indonesia, Korea, Malaysia, Mexico, Peru, the
Philippines, Poland, the Russian Federation, Thailand, Turkey, Uruguay, and
Venezuela. The sampling period in the paper is from January 1997 to December
2010 and EMBI Global spreads has been used as sovereign bond yield spreads. In
this paper panel estimations are performed to release the immediate effects of a
10
rating or outlook changes, then, the author performs event study analysis to
investigate the dynamic reaction of financial markets by considering relative returns
of bonds during the pre-announcement, post-announcement, and during the credit
rating announcement time. The paper suggests the following results: i) domestic
rating and outlook changes significantly affect the government bond yield spreads,
for example, author finds that domestic rating upgrades leaded to a 1.7% decrease in
government bond yield spreads and domestic outlook upgrades leaded to a 0.8%
decrease in spreads; ii) foreign rating changes also significantly affects the domestic
markets but in smaller absolute terms; iii) foreign country rating changes are more
effective than foreign county outlook changes for domestic country; iv) large rating
changes are greater effect than smaller one; v) lastly author finds that rating changes
are mostly expected by the market players. The event studies supported this result by
observing the expected movement direction in bond spreads before announcement is
actually made.
Larrain, Reisen, and von Maltzan (1997) present econometric evidence using panel
data analysis and event studies to evaluate the effect of the credit rating changes on
global financial markets. Authors perform Granger causality test using yearly
observed unbalanced data for period 1988-1995; also, they investigate the effect of
rating changes on the sovereign yield spreads for period 1987 and 1996 and for 26
OECD and non-OECD countries. Their event study analysis indicates that there is a
highly significant rating change effect when emerging-market government bond take
negative outlook. Findings of paper indicate that negative rating change announced
by CRAs has stimulated the private capital inflows to the countries that have lower
default risk- higher credit ratings. Granger causality is also tested and a bi-directional
causality is found which indicates changes in credit rating and changes in bond yields
are mutually interdependent. Furthermore, authors catch the market expectation
towards the rating change as a critical point in the explanation of the government
bond spreads which is a represent of the governments’ cost of borrowing.
Sy (2001) documents a few stylized facts and shows how the rating changes effect
the sovereign spreads by using J.P. Morgan EMBI+ data. This study conducted for
17 emerging markets countries from January 1994 to April 2001 by following
11
unbalanced panel data estimation instead of cross-sectional analysis- Argentina,
Brazil, Bulgaria, Colombia, Ecuador, Korea, Mexico, Morocco, Panama, Peru, the
Philippines, Poland, Qatar, Russia, South Africa, Turkey, and Venezuela. In this
paper author tries to explore the relationship how credit rating changes affect the
country spreads by taking EMBI+ country indices as a country spreads. He concludes
that higher ratings are linked to lower spreads, that is, a negative relation is found in
the Spearman rank correlation. He also finds that a one-notch increase in credit rating
decreases government bond yield spreads on average by 14%. He argues that rating
downgrade follows often spreads “excessively high” countries. Similarly, spreads
“too low” are often followed by upgrades, suggesting that markets anticipate future
changes in ratings, that is, credit rating agencies are late to change ratings. Focusing
on the relationship between secondary market spreads on the EMBI+ country indices
and rating changes differs this study from others and we followed similar
methodology in our study.
In Kaminsky and Schmukler (2002), the authors examine data from 16 emerging
countries, covering the period from January 1990 to June 2000- Argentina, Brazil,
Chile, Colombia, Indonesia, Malaysia, Mexico, Peru, the Philippines, Poland, the
Republic of Korea, the Russian Federation, Taiwan (China), Thailand, Turkey, and
Venezuela. Countries are chosen from three regions such that countries suffered
crises and contagion and have available data. EMBI is used as sovereign bond yield
spreads and they estimate panel regressions and perform event study analysis to
examine how dynamically rating and outlook change affect the sovereign spreads.
Authors reach six outcomes for the effect of credit rating changes on financial
markets. First, bond market is significantly affected by rating/outlook changes;
government bond yield spreads increase 2 percentage points as a response to a
domestic downgrade. Second, rating announcements cause the spillover effects, that
is, rating changes in one emerging country triggers changes in yield spreads of bonds
in other emerging countries. The spillover effect due to the credit rating changes
arises mostly at the regional level as in the case of contagious crises. Third, domestic
markets and global financial markets are both affected more in times of crises by
changes in credit ratings and outlooks. Also contagion effects are stronger during
crises. Crises-contingent theories that explain the how shocks are transmitted
12
internationally are supported by this theory. Mason (1998) indicates that a crisis in
one country can coordinate expectation of investors’, moving them from good
position to a bad position so it causes deterioration in the other country’s financial
markets. CRAs announcements give idea about this coordinating signal. Fourth,
credit rating changes contains more information for nontransparent countries
compared to transparent countries since investors do not get further information for
nontransparent countries so investors’ pay more attention to credit rating changes for
nontransparent markets to get information for the situation of that country. Fifth,
CRAs upgrade countries in good times and downgrade them in bad times so the
perception of credit rating agencies might contribute to the instability of financial
markets in emerging markets is consistent with this evidence. Since CRAs announce
bad news in bad times and good news in good times, the impact of
upgrades/downgrades do not appear to be large, although, they are statistically
significant. Finally, changes in US interest rates affects fragile countries more
severely than other countries. In fact, the rising interest in fuel financial centers
increase in sovereign risk by 50 percent more in weaker countries compared to
countries having higher level of credit rating. Understanding of the effects of credit
rating and outlook change will be improved by the several possible extensions to this
research.
Scholtens (1999) tries to find the relationship how country risk in the 1990s affects
the Eurobond yield spreads by calculating rank correlations for countries including
developing and industrialized countries. Furthermore, regression equations
describing the relationship between yield spreads and country risk are built and
interpreted. Then he examines this relationship through time, whether it holds or not.
To obtain best judgment on the association between yield spreads and country risks
he calculates as many Spearman rank correlations as possible. He concludes that
there is a strong and positive association between yield spread and country risk.
Steiner and Heinke (2001) investigate the association of daily excess Eurobond
returns with rating changes by S&P and Moody’s for period 1985 to 1996. For
downgrading announcements and negative watch listings there exists a significant
bond price responses are observed while upgrading announcements and outlook
13
upgrades do not have any significant effect on the bond price responses. According
to authors nationality of issuer is the main factor in determining the strength of price
reactions after credit rating changes. Also, rating downgrade into speculative grade
level causes significant and stronger bond price reactions. The main finding of this
paper show us that volatility of daily bond prices in the key determinant of the
market reactions to CRAs’ announcements.
Gande and Parsley (2003) study the effect of a sovereign credit rating change of a
country on the government bond yield spreads of other countries by using sample
data for period 1991 to 2000. Authors take the market closing market data for the
interest rate spread for period that cover January 1991 to December 2000. For this
analysis 34 countries are used- Argentina, Austria, Belgium, Brazil, Canada, Chile,
China, Columbia, Denmark, Finland, Greece, Hungary, Iceland, Indonesia, Ireland,
Israel, Italy, Korea, Lebanon, Malaysia, Mexico, New Zealand, Panama, Philippines,
Poland, South Africa, Spain, Sweden, Thailand, Tunisia, Turkey, United Kingdom,
Uruguay, and Venezuela. They find the evidence of spillover effects which is a
significant effect on bond spreads for countries that are affected by other country’s
rating announcements. This effect is asymmetric: the association of negative ratings
events with increase in spreads does not have detectable impact. Authors find that
one-notch decrease in rating for government bonds associated with a 12 basis point
increase in spreads of other countries’ government bond spreads. These types of
studies indicate us that rating changes not only affect domestic sovereign spreads but
also affect the foreign spreads.
As mentioned in previous part for Turkey we deal with such an issue in the first time
and till now we summarize the literature related to our issue. For Turkey Banking
Regulation and Supervision Agency (BDDK, 2009) performed a narrowed study and
in this study it is seen that the credit ratings of countries and the path of this credit
ratings is key factor on both pricing the bonds and changes in sovereign bond
spreads. Bond spreads of the countries whose credit ratings are expected to increase
may decrease. That is, it is useful to analyze the effect of credit rating changes on
borrowing cost by clarifying the magnitude of impact of possible credit rating
changes of countries on sovereign bond spreads. In this context, the impact of

14
changes in credit ratings of Turkey on monthly Turkey’s Eurobond spread is
investigated. In the study, regression analysis is done with monthly data for the
period February 2001 and November 2009. Eurobond spreads is used as dependent
variable and credit ratings announced by S&P, Moody’s and Fitch is used as
independent variables. The main findings of this study as follows:
i) A 1 percent increase (decrease) in Turkey’s credit rating by S&P
decreases (increases) Eurobond spreads by 0.5 percent; a 1 percent
increase (decrease) in credit rating by Fitch decreases Eurobond spreads
by 0.4 percent. A 1 percent increase (decrease) in combined rating created
by taking arithmetic average of 3 credit rating decreases (increases)
Eurobond spreads by 0.63 percent, that is , there exist a negative relation
between these two variables,
ii) Borrowing cost decreases/increases as response to decrease/increase in
Eurobond spreads which is the result of increase/decrease in credit
ratings. Increase of combined rating to investment grade BBB will
decrease Eurobond spreads about 160 basis points. This situation causes a
16 million dollars decrease in cost for 1 billion dollars borrowing. That is,
borrowing cost of turkey decreases as a result of increase of credit rating
to investment grade. About 1.6 percent decrease in borrowing cost
provides better opportunities for borrowing. Because the rating of the
country is used as a reference for borrowing of private sector, this
situation also makes positive impact on borrowing costs of private sector.
When the country has investment grade credit rating, it helps the country
get less affected liquidity conditions resulted by global fluctuations.
During 2008 financial crisis high rated countries faced with deep economic
fluctuations which decreased the creditworthiness of credit rating agencies.
Therefore, post-crisis period is new field in order to investigate the relationship
between credit rating changes and government bond yield spreads. The studies
explained above aimed to examine different questions and investigate the effects of
credit rating changes on bond yield spreads. Most of these studies use panel data or
15
simple regression models during the analysis process. However in this study we
follow the VAR and event study analysis to evaluate the impact of credit
rating/outlook change on the Turkish government bond spreads.
We use five year Turkish government bond spreads and EMBI Global spread for
Turkey with credit ratings/outlooks announced by S&P, Moody’s, and Fitch. In this
thesis we document few facts and demonstrate how the relationship between Turkish
government bond yield spreads and credit rating changes can be used in the analysis
of market and CRAs’ views of financial market for Turkish government bonds.

16
CHAPTER 3
DATA AND METHODOLOGY
3.1. DATA
3.1.a. Introduction of Variables and Data Sources
We examine the Turkey’s five year government bond spreads, EMBIG (Emerging
Markets Bond Index Global) spreads and rating changes announced by S&P,
Moodys, and Fitch. Also we use VIX (volatility index) in our model as an indicator
of global risk or degree of risk appetite of investors. Three variables are used in our
model; Eurobond Spread/EMBIG Spread, rating/outlook change, and VIX. Among
these variables Eurobond Spread/EMBIG Spread is the dependent variable however
all other variables are used as explanatory variables. Data set used in the model
consists of daily data and the data period is from June 2007 to March 2013.
For dependent variable we use two types of variables; one is Eurobond spread which
is calculated and the other one EMBIG spread for Turkey announced by JP Morgan.
EMBI Global includes U.S.dollar-denominated Brady bonds, loans, and Eurobonds
with an outstanding face value of at least $500 million. Sovereign Eurobond yields
spreads are calculated by using five year foreign currency denominated government
bond yields and five year US government bond yields as a benchmark instrument. In
financial market countries’ default risk usually is demonstrated by government bond
yield spreads. When default risk increases then bond prices decrease and bond yield
spreads increase. The data for bond yields are taken from Bloomberg and the data for
credit ratings come from sovereign rating agency’s web pages. Figure 3.1 and 3.2
shows the Eurobond spread and EMBI Global spread for Turkey respectively.

17
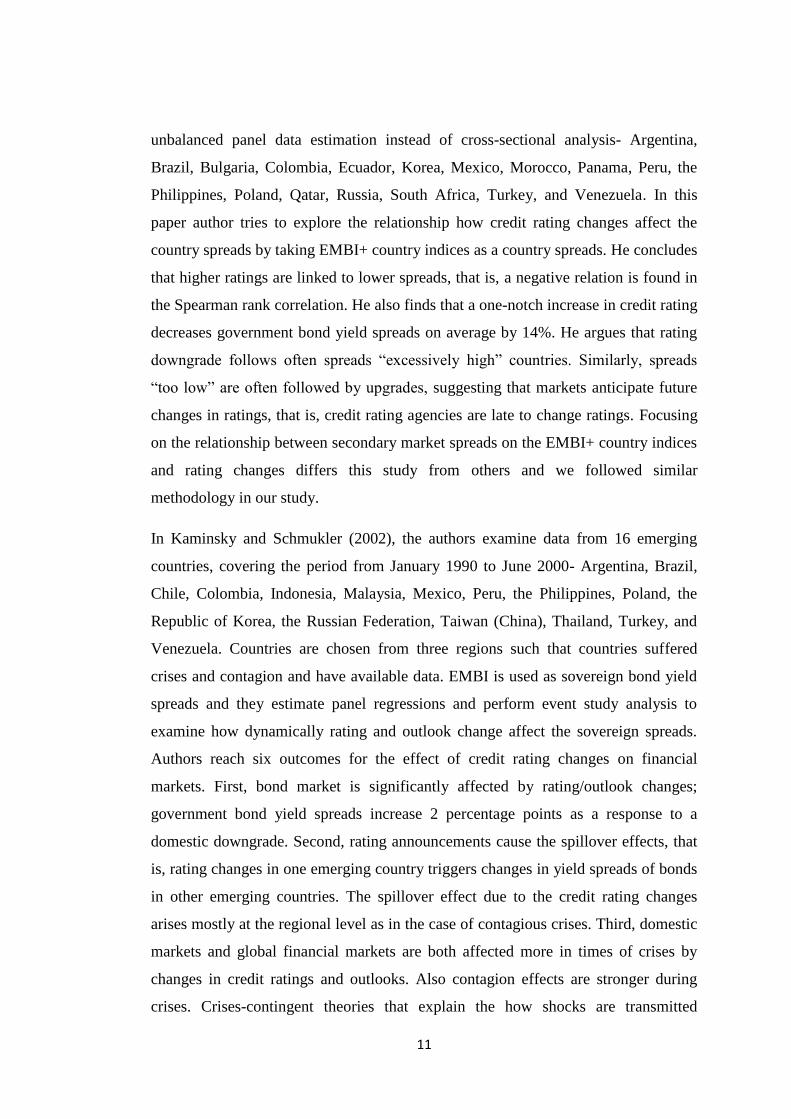
Figure 3.1: Turkey Eurobond Spread
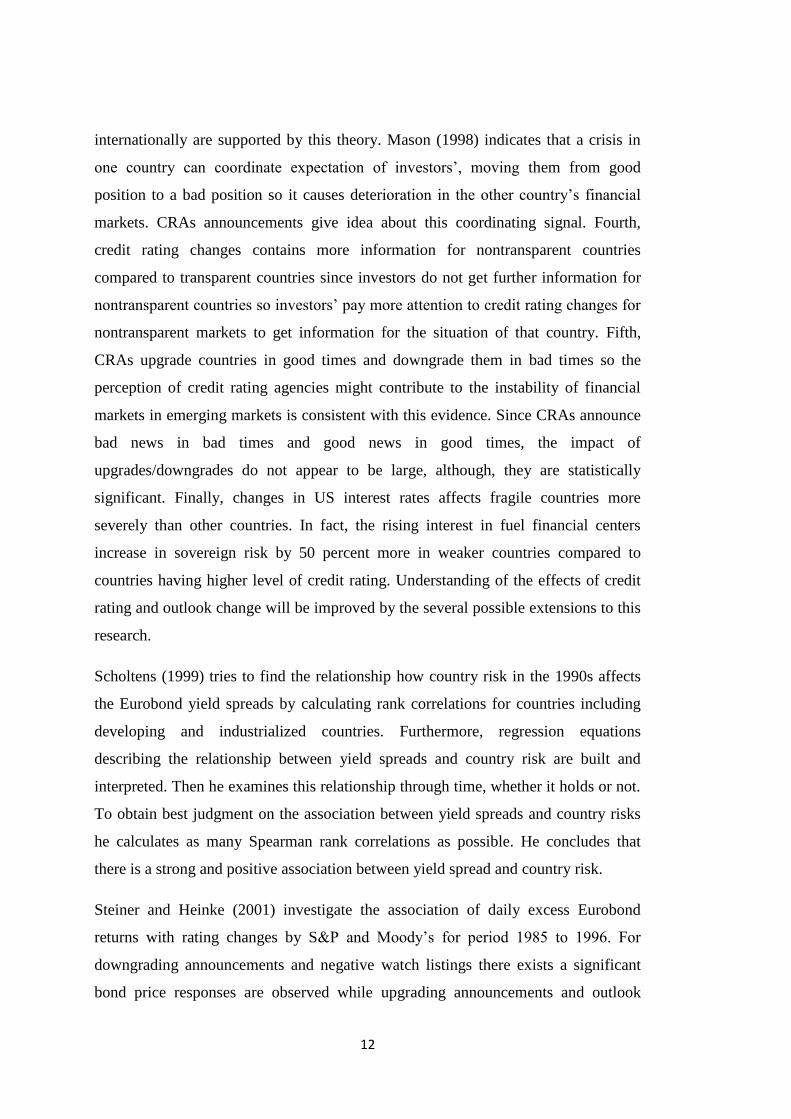
Figure 3.2: Turkey EMBIG Spread
510
1520
25
Spr
ead
01jan2007 01jan2008 01jan2009 01jan2010 01jan2011 01jan2012 01jan2013
DateSource:Bloomberg
Turkey Eurobond Spread20
040
060
080
010
00
EM
BIG
01jan2007 01jan2008 01jan2009 01jan2010 01jan2011 01jan2012 01jan2013Date
Source: Bloomberg
Turkey EMBIG Spread
18
In this thesis and in literature authors mostly focus on the emerging markets for these
types of studies since rating/outlook changes are prone to provide new information
for emerging market that have less transparent economic structure compared to
developed ones. On the other hand, for developed countries rating and outlook
changes are most likely to support the completeness and the transparency of the
economy. The more crucial benefit of CRAs to investors arises from the fact that if
investors have limited information for the solvency of any country, CRAs provide
these people more information about the country via assigning a rate for these
countries. The sample period runs from June 2007 to April 2013. The main reason of
why this period is chosen arises from the 2008 global financial crisis and Eurozone
crisis. In this thesis we focus only on the effect of credit rating changes on the
Turkish government bond spreads-Eurobond spread and EMBI Global spread for
Turkey.
In our thesis and other studies volatility index (VIX) is used as an indicator of global
risk or degree of risk appetite of investors. Using VIX as explanatory variable gives
us the chance of accounting global economic trend in our estimates. In the
construction progress of the VIX the implied volatilities of a wide range of options
on the 500 S&P index is used.
Sovereign ratings and outlooks are taken from sovereign credit rating agencies’ web
pages. In general, most rating agencies publish credit ratings for long and short-term
local and foreign currency denominated bonds. In addition, they assign the credit
outlook for each country in both currencies, although the rating agencies noted that
their outlook does not guarantee future changes in the assessments themselves.
Short-tern ratings, however, do not seem to add very basic information from the time
of their development coincides generally with the changes in long-term ratings.
Although many studies take log of bond yield spread and examine the relationship
between spreads and an index of cardinal numbers assigned to the sovereign credit
ratings of long-term, there is little evidence to support provided to this specification.
Often, the index is formed such that its value increases by a certain increment when
classified deteriorates, or vice versa. In this thesis we perform vector autoregression

19
(VAR) model to capture the linear interdependencies among multiple times series
variables of Turkish government bond spreads, credit rating changes, and VIX.
3.1.b. Yield Spreads and Bond Yields
The spread of financial credit term is the yield spread; it is calculated by differencing
the yields of the different credit quality securities. That means differencing yield of
lower credit quality bonds from the yield of higher credit quality bonds. Usually US
treasuries or LIBOR are used as reference rate or risk free benchmark security that
represents the higher credit quality.
Treasury spread or government bond spread is the basic relative value calculated by
using appropriate government bond. In this thesis the bond spread is calculated as
follows;
BS= Y –T
T: US five year bond yield
Y: Country five year bond yield
BS: Bond Yield Spread
According to this formula bond yield spread is calculated by deducting yield of
government bond from the yield of risk free bond and in this thesis five year US
government bonds are used as a risk free benchmark security. In financial market
spread value is used to price bonds and to comprise the different credit quality bonds
as a relative value. For example, for bonds having a spread of 50 basis points above
the five year US government bond means that yield to maturity of that bond is 0.50%
greater than the yield to maturity of the five year US government bond. As
previously mentioned yield spread is calculated by differencing the yield of one bond
from the benchmark bond, therefore, higher the spread of country mean the higher
the default risk for that country.
In using yield spreads in country risk analysis a basic assumption is that one
country’s bonds is accepted as risk-free like US bonds. From this assumption we
accept that US T-bond yield is the country risk free interest rate. Most of the

20
existence literature uses the EMBI as country spreads, however, in our thesis we
calculate country spread values for five year maturity bonds as an Eurobond spread
and we use EMBI Global spread for Turkey.
Variable names are displayed in Table 3.1.
Table 3.1 Variable Names
EMBIG Emerging Markets Bond Index Global
Spread Turkey Eurobond Spread
SPGrade Standard & Poor's (S&P) Credit Rating Change
SPOutlook Standard & Poor's (S&P) Outlook Change
FitchG Fitch Credit Rating Change
FitchO Fitch Outlook Change
MoodysG Moodys Credit Rating Change
MoodysO Moodys Outlook Change
VIX Volatility Index
SPGrade, SPOutlook, FitchG, FitchO, MoodysG, and MoodysO are dummy
variables and they take values according to rating/outlook changes.
{
3.1.c. Unit Root Tests
Before moving vector autoregressive analysis (VAR) for our case study, testing the
order of integration is essential in VAR method because the order of integration is an
crucial subject to construct appropriate VAR model and make the correct inferences.
Augmented Dickey-Fuller (ADF) and Phillips–Perron (PP) tests are the most
21
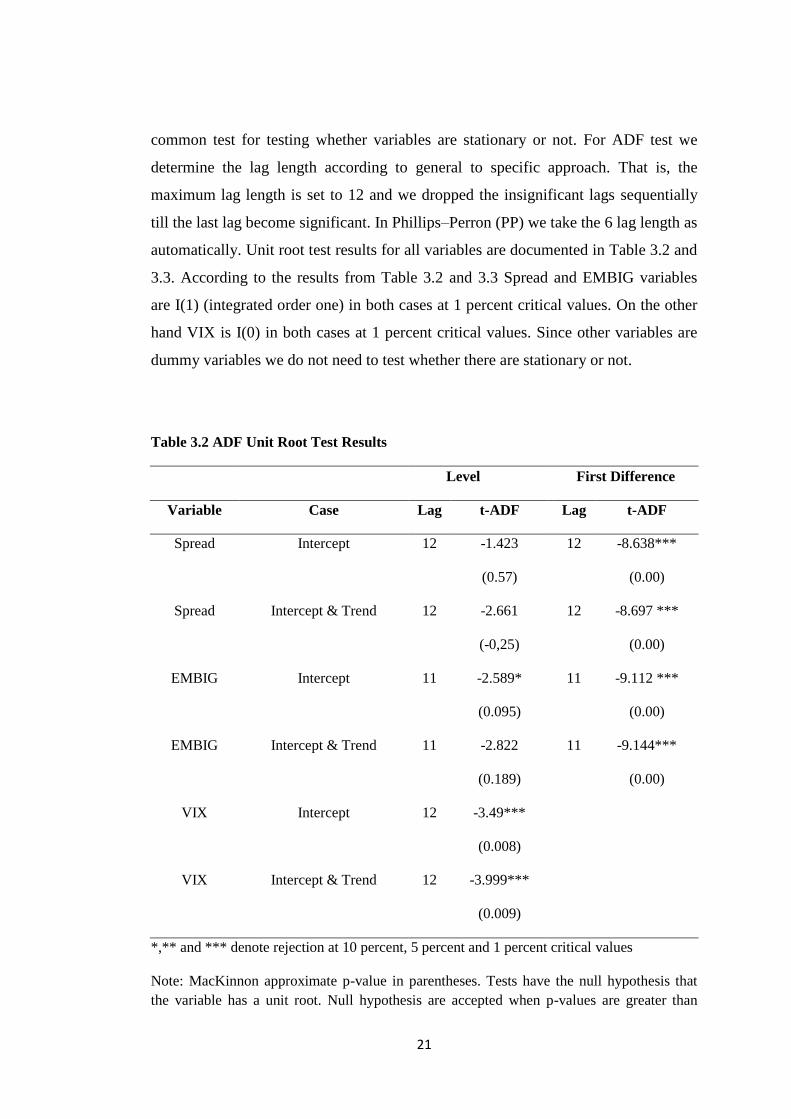
common test for testing whether variables are stationary or not. For ADF test we
determine the lag length according to general to specific approach. That is, the
maximum lag length is set to 12 and we dropped the insignificant lags sequentially
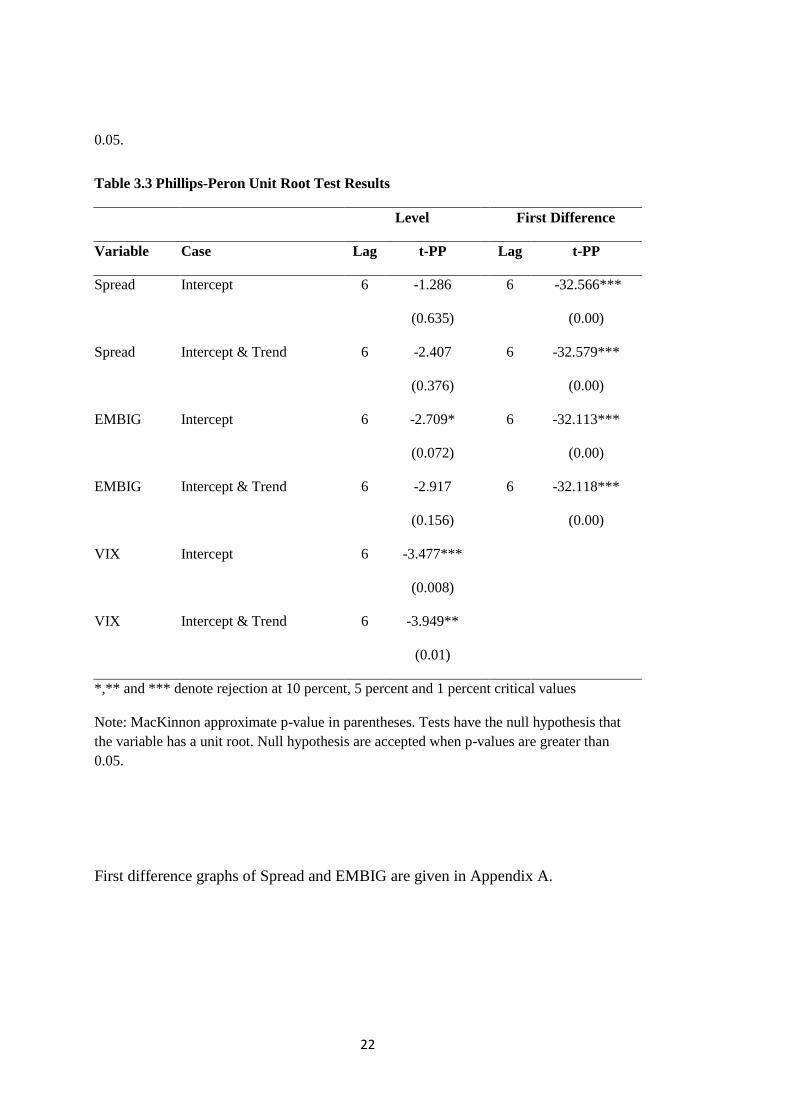
till the last lag become significant. In Phillips–Perron (PP) we take the 6 lag length as
automatically. Unit root test results for all variables are documented in Table 3.2 and
3.3. According to the results from Table 3.2 and 3.3 Spread and EMBIG variables
are I(1) (integrated order one) in both cases at 1 percent critical values. On the other
hand VIX is I(0) in both cases at 1 percent critical values. Since other variables are
dummy variables we do not need to test whether there are stationary or not.
Table 3.2 ADF Unit Root Test Results
Level First Difference
Variable Case Lag t-ADF Lag t-ADF
Spread Intercept 12 -1.423 12 -8.638***
(0.57) (0.00)
Spread Intercept & Trend 12 -2.661 12 -8.697 ***
(-0,25) (0.00)
EMBIG Intercept 11 -2.589* 11 -9.112 ***
(0.095) (0.00)
EMBIG Intercept & Trend 11 -2.822 11 -9.144***
(0.189) (0.00)
VIX Intercept 12 -3.49***
(0.008)
VIX Intercept & Trend 12 -3.999***
(0.009)
*,** and *** denote rejection at 10 percent, 5 percent and 1 percent critical values
Note: MacKinnon approximate p-value in parentheses. Tests have the null hypothesis that
the variable has a unit root. Null hypothesis are accepted when p-values are greater than
22
0.05.
First difference graphs of Spread and EMBIG are given in Appendix A.
Table 3.3 Phillips-Peron Unit Root Test Results
Level First Difference
Variable Case Lag t-PP Lag t-PP
Spread Intercept 6 -1.286
6 -32.566***
(0.635)
(0.00)
Spread Intercept & Trend 6 -2.407
6 -32.579***
(0.376)
(0.00)
EMBIG Intercept 6 -2.709*
6 -32.113***
(0.072)
(0.00)
EMBIG Intercept & Trend 6 -2.917
6 -32.118***
(0.156)
(0.00)
VIX Intercept 6 -3.477***
(0.008)
VIX Intercept & Trend 6 -3.949**
(0.01)
*,** and *** denote rejection at 10 percent, 5 percent and 1 percent critical values
Note: MacKinnon approximate p-value in parentheses. Tests have the null hypothesis that
the variable has a unit root. Null hypothesis are accepted when p-values are greater than
0.05.
23
3.2. METHODOLOGY
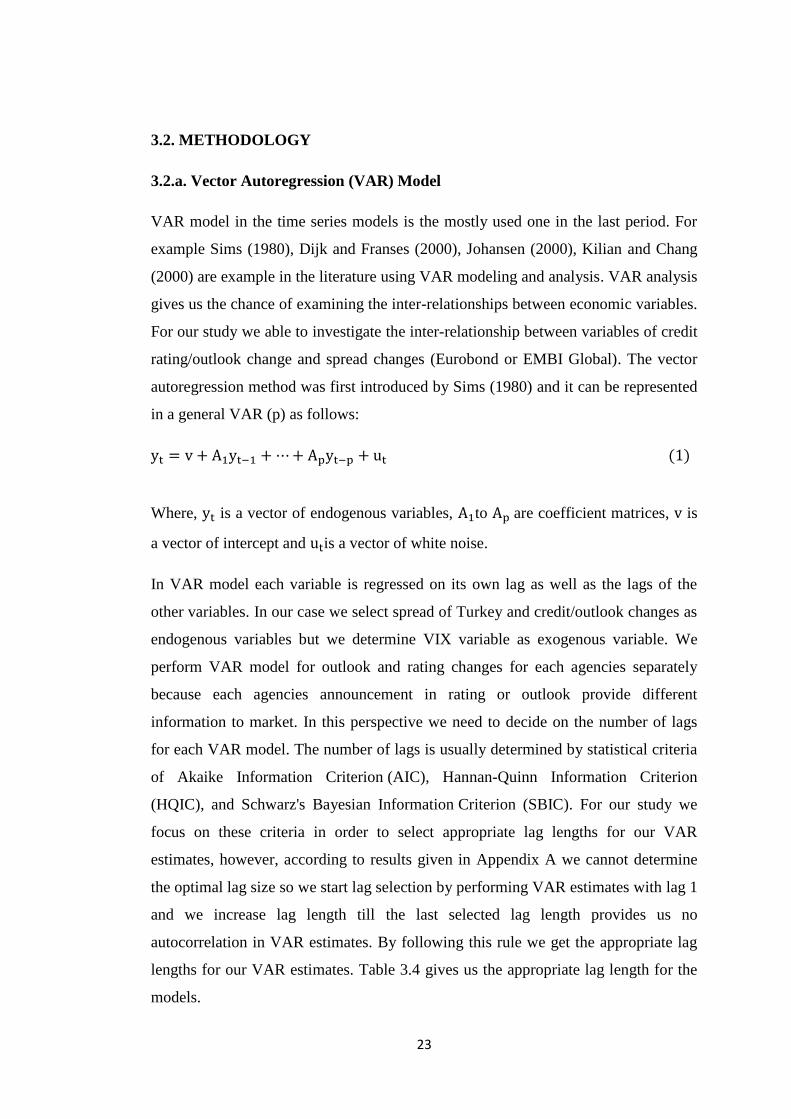
3.2.a. Vector Autoregression (VAR) Model
VAR model in the time series models is the mostly used one in the last period. For
example Sims (1980), Dijk and Franses (2000), Johansen (2000), Kilian and Chang
(2000) are example in the literature using VAR modeling and analysis. VAR analysis
gives us the chance of examining the inter-relationships between economic variables.
For our study we able to investigate the inter-relationship between variables of credit
rating/outlook change and spread changes (Eurobond or EMBI Global). The vector
autoregression method was first introduced by Sims (1980) and it can be represented
in a general VAR (p) as follows:
Where, is a vector of endogenous variables, to are coefficient matrices, is
a vector of intercept and is a vector of white noise.
In VAR model each variable is regressed on its own lag as well as the lags of the
other variables. In our case we select spread of Turkey and credit/outlook changes as
endogenous variables but we determine VIX variable as exogenous variable. We
perform VAR model for outlook and rating changes for each agencies separately
because each agencies announcement in rating or outlook provide different
information to market. In this perspective we need to decide on the number of lags
for each VAR model. The number of lags is usually determined by statistical criteria
of Akaike Information Criterion (AIC), Hannan-Quinn Information Criterion
(HQIC), and Schwarz's Bayesian Information Criterion (SBIC). For our study we
focus on these criteria in order to select appropriate lag lengths for our VAR
estimates, however, according to results given in Appendix A we cannot determine
the optimal lag size so we start lag selection by performing VAR estimates with lag 1
and we increase lag length till the last selected lag length provides us no
autocorrelation in VAR estimates. By following this rule we get the appropriate lag
lengths for our VAR estimates. Table 3.4 gives us the appropriate lag length for the
models.

24
Table 3.4 Lag Selection
Eurobond Spread Change
(Turkey) EMBI Global Change (Turkey)
Variable Lag Lag
SPGrade 2 4
SPOutlok 1 3
FitchG 1 4
FitchO 1 3
MoodysG 1 7
MoodysO 2 3
For example, for the VAR model constructed with endogenous variables of SPGrade
and Eurobond Spread Change we determine lag length of 2. Also for the case of
SPGrade and EMBI Global spread change we determine lag length of 4.
3.2.b. Granger Causality
The three hypothesis-credit/outlook change affects spread changes, spread changes
affects credit/outlook change, and both demonstrate a reciprocal relationship- were
tested using the Granger causality approach. Before performing Granger causality
test we make stationary tests of ADF and PP in previous part. After getting stationary
variable we determine the lag length of VAR models. Then we perform VAR model
and Granger causality test with these stationary variables and determined lag lengths.

25
To test whether SPGrade Granger causes Spread Change ( ) in the above
system, the joint significance of the coefficients, = =0 in (2) was tested
and similar testing procedure was applied to test the hypothesis of Spread Change
Granger causes SPGrade, = =0. By following same logic we perform the
other VAR models and we get the relation how credit rating changes affect the
government bond spreads or vice versa.
3.2.c. Impulse Response Function (IRF)
By performing Granger causality test we can determine the predictive power of
SPGrade change to Spread change or vice versa. However, in order to explain the
sign and the power of relationship between these variables we need to create an
impulse response function (IRF). By performing IRF we can catch out the effect of a
shock to one variable to the other variables in the system. Impulse response function
measures the effects of a shock to endogenous variable on itself or on another
endogenous variable. For our case study we aim to trace the effect of any shock
occur in credit rating to government bond spread changes. For example, we can
observe the movement of Eurobond spread change or EMBI Global spread change
due to a shock arises from SPGrade change. We perform IRF for each VAR
estimates and we get some conclusions about the power of the relationship between
variables of credit rating change and the government bond spread (Eurobond &
EMBIG spread) changes. In our study IRF based on a VAR model so IRF tracks the
effect of one standard deviation shock to credit/outlook change on the spread
changes.
For Impulse Response Functions (IRFs) to be computed, VAR estimates need to be
stable so we perform stability test for each VAR estimates and we get stabile VAR
models. According to results all eigenvalues lie inside the unit circle so VAR models
satisfy the stability condition.
26
3.2.d. Event Study Analysis
In finance event study methodology is generally used to examine the price reactions
of financial instruments to the occurred events. To examine this reaction generally
financial instruments’ relative price changes are considered according to event date.
To illustrate, assume there are two companies in financial market and assume their
profitability information announced to market on February 10 and March 10 for
companies Alpha and Beta respectively. To examine the how these announcements
affect the companies’ share prices we take two base periods for companies – for
Company Alpha it is February 10 (t=0) and for Company Beta it is March 10 (t=0).
February 11 and March 11-one day after the events- will be represented as t=1 for
these companies. Therefore, in event study analysis timing of announcement events
for companies are standardized which enables us to measure the average security
price reactions at day 1,2, etc. days after or before the event occurs. By following the
similar logic we focus on the Turkey’s government bond spreads reactions by taking
rating or outlook announcement date as base period so timing of rating agencies’
announcements are standardized.
In VAR, Granger Causality and IRF analysis we able to examine the inter-
relationships between the credit rating/outlook change and spread change. Also, we
able to investigate the dynamic effect of credit rating/outlook change on the spread
change by using these analyses. However in event study analysis we able to evaluate
the dynamic effect of rating/outlook changes on the relative price changes instead of
focusing on the spread change. Actually event study analysis provides us the
evidence on whether CRAs act procyclically or market participants anticipate their
actions, that is, downgrading countries grade or outlook during the countries have
weak macroeconomic indicators and upgrading them during the countries have
strong macroeconomic indicators. Therefore, event studies give us a clue about
market anticipation towards to rating agencies actions. If there exists market
anticipation towards the rating changes than we expect a noticeable trend in bond
spreads even before the announcement is made. Also, by performing event studies
we can observe the effects of rating announcements whether they are temporary or
not.

27
In this thesis we use 21-day event window for event study analysis and in this
window rating changes are occurring on day 11. The evolution of sovereign bond
yield spreads is examined during ±10day window around an upgrade or downgrade
of a credit rating/outlook change. Event study analysis normally interested in excess
return during the event window so we can detect the behavior of the government
bond spreads relative to a benchmark of US bonds in this window. In event study
analysis other events may take place with rating/outlook changes, since we cannot
control those factors we accept that these events do not bring bias results in our
analysis. That is, we accept that there exists randomness in other factors influencing
bond spreads both positively and negatively. On the other hand, if CRAs changes
country ratings/outlook in a series sequence then the results of the event study
analysis will be biased. In order to eliminate these types of biases we deal with the
“clean events” in which rating/outlook changes do not overlap during the 21 day
event window. Particularly during crisis periods CRAs announce ratings/outlook
serially so sometimes rating/outlook changes overlap in this event window. Since it
is difficult to distinguish the effects of one rating change from another we reach
biased results at the end of the event study analysis. During crisis period rating
changes from three leading CRAs follow each other so many changes occurred in
this period were not clean that cause the biased result in event study analysis.
Therefore, many rating/outlook changes made during crisis period are dropped from
our sample and we examine only clean events as sample data. By following this way,
we ensure that only the effects of one upgrade or downgrade in each event is
examined for Turkey case study. Table 2 shows the number of clean events with 21-
day window taken as sample for event study methodology.
Table 3.5 Number of Clean Events with 21 day Event Window
Upgrade Downgrade Total
Ratings 7 0 7
Outlooks 6 5 11
In event study analysis we focus on the bond returns relative to the base period
(t=11) instead of taking daily change of the bond yield. We normalize the total 18

28
events by taking the announcement date as starting point for Turkey and then we
apply the following formula for the government bond spreads to reach the relative
return of bond yield according to starting point.
where t represent time in 21 event window (1 to 21). represents bond yield
spreads on day t and represents the bond yield spread at rating/outlook
announcement date that is the first day of the event window.
In this thesis we expect the behavior of the bond yield spreads changes according to
market anticipation for the CRAs’ actions, that is, if CRAs’ actions anticipated by the
market bond yield spreads begin to increase (decrease) before announcement day for
the case of rating/outlook downgrade (upgrades).

29
CHAPTER 4
EMPIRICAL ANALYSES
4.1 VAR Analysis
In this part, VAR models are generated to investigate the dynamic relationship
between credit rating changes and government bond spread changes. As a represent
of government bond spread we take two variables; Turkey Eurobond spread and
EMBI Global spread for Turkey. We perform VAR models according to these
variables separately. In the literature in order to get reliable results in the VAR
analysis all variable used in VAR estimation need to ensure stationary condition. In
this perspective we perform unit root test for the variables and we conclude that
Eurobond spread and EMBI Global spread variables are non-stationary so we use
their first differences which satisfy the stationary assumption. For VIX as a proxy for
global factor we perform stationary test we conclude that VIX is stationary and no
need to take its first differences in VAR estimates. Furthermore, we use the VIX
variable as an exogenous variable in VAR models. As mentioned for dummy
variables no need to check stationary test so we perform VAR estimates under these
conditions.
After satisfying stationary condition we determine the lag length of VAR estimates
as mentioned in previous part. Then we perform VAR estimates according to
stationary variables and determined lag lengths.
Based on the lag lengths given in Table 3.4 we perform VAR estimates and the
related results are given in Table 4.1.a, 4.1.b, 4.1.c, 4.1.d, 4.1.e, 4.1.f for Turkey
Eurobond spread and Table 4.2.a, 4.2.b, 4.2.c, 4.2.d, 4.2.e, 4.2.f for EMBI Global
spread for Turkey. Main findings in VAR analysis indicate us that only intercept and
VIX (exog) terms seem to have a noteworthy effect on the spread changes. Estimated
VAR models for the variable of rating/outlook changes indicate us that
rating/outlook changes and their lagged values are not statistically significant
30
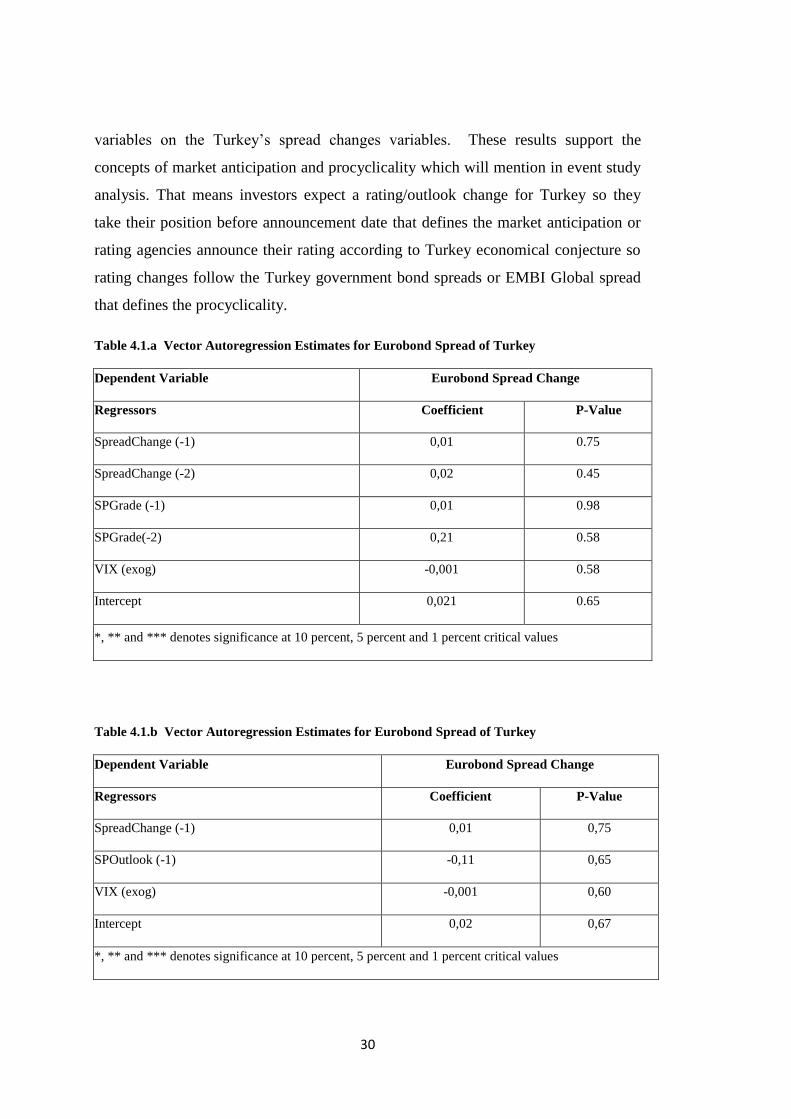
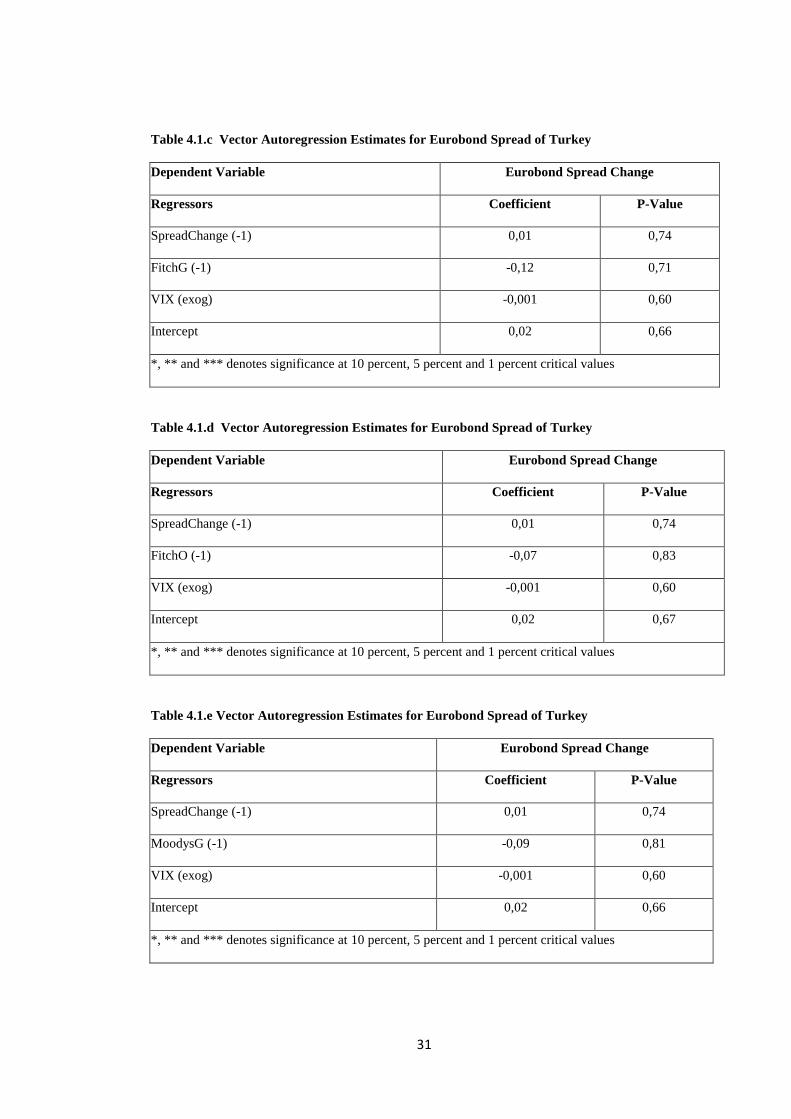
variables on the Turkey’s spread changes variables. These results support the
concepts of market anticipation and procyclicality which will mention in event study
analysis. That means investors expect a rating/outlook change for Turkey so they
take their position before announcement date that defines the market anticipation or
rating agencies announce their rating according to Turkey economical conjecture so
rating changes follow the Turkey government bond spreads or EMBI Global spread
that defines the procyclicality.
Table 4.1.a Vector Autoregression Estimates for Eurobond Spread of Turkey
Dependent Variable Eurobond Spread Change
Regressors Coefficient P-Value
SpreadChange (-1) 0,01 0.75
SpreadChange (-2) 0,02 0.45
SPGrade (-1) 0,01 0.98
SPGrade(-2) 0,21 0.58
VIX (exog) -0,001 0.58
Intercept 0,021 0.65
*, ** and *** denotes significance at 10 percent, 5 percent and 1 percent critical values
Table 4.1.b Vector Autoregression Estimates for Eurobond Spread of Turkey
Dependent Variable Eurobond Spread Change
Regressors Coefficient P-Value
SpreadChange (-1) 0,01 0,75
SPOutlook (-1) -0,11 0,65
VIX (exog) -0,001 0,60
Intercept 0,02 0,67
*, ** and *** denotes significance at 10 percent, 5 percent and 1 percent critical values
31
Table 4.1.c Vector Autoregression Estimates for Eurobond Spread of Turkey
Dependent Variable Eurobond Spread Change
Regressors Coefficient P-Value
SpreadChange (-1) 0,01 0,74
FitchG (-1) -0,12 0,71
VIX (exog) -0,001 0,60
Intercept 0,02 0,66
*, ** and *** denotes significance at 10 percent, 5 percent and 1 percent critical values
Table 4.1.d Vector Autoregression Estimates for Eurobond Spread of Turkey
Dependent Variable Eurobond Spread Change
Regressors Coefficient P-Value
SpreadChange (-1) 0,01 0,74
FitchO (-1) -0,07 0,83
VIX (exog) -0,001 0,60
Intercept 0,02 0,67
*, ** and *** denotes significance at 10 percent, 5 percent and 1 percent critical values
Table 4.1.e Vector Autoregression Estimates for Eurobond Spread of Turkey
Dependent Variable Eurobond Spread Change
Regressors Coefficient P-Value
SpreadChange (-1) 0,01 0,74
MoodysG (-1) -0,09 0,81
VIX (exog) -0,001 0,60
Intercept 0,02 0,66
*, ** and *** denotes significance at 10 percent, 5 percent and 1 percent critical values

32
Table 4.1.f Vector Autoregression Estimates for Eurobond Spread of Turkey
Dependent Variable Eurobond Spread Change
Regressors Coefficient P-Value
SpreadChange (-1) 0,01 0,75
SpreadChange (-2) 0,02 0,45
MoodysO (-1) -0,04 0,91
MoodysO (-2) 0,09 0,78
VIX (exog) -0,001 0,59
Intercept 0,02 0,66
*, ** and *** denotes significance at 10 percent, 5 percent and 1 percent critical values
Table 4.2.a Vector Autoregression Estimates for EMBI Global Spread for Turkey
Dependent Variable EMBIG Spread Change
Regressors Coefficient P-Value
EMBIGChange (-1) 0,004 0,89
EMBIGChange (-2) 0,03 0,29
EMBIGChange (-3) -0,01 0,79
EMBIGChange (-4) 0,01 0,78
SPGrade (-1) 8,07 0,36
SPGrade (-2) 15,68 0,075*
SPGrade (-3) -23,22 0,008 ***
SPGrade (-4) -4,12 0,008 ***
VIX (exog) 0,23 0,000***
Intercept -5,14 0,000***
*, ** and *** denotes significance at 10 percent, 5 percent and 1 percent critical values

33
Table 4.2.b Vector Autoregression Estimates for EMBI Global Spread for Turkey
Dependent Variable EMBIG Spread Change
Regressors Coefficient P-Value
EMBIGChange (-1) 0,003 0,93
EMBIGChange (-2) 0,03 0,34
EMBIGChange (-3) -0,01 0,75
SPOutlook (-1) 0,99 0,86
SPOutlook (-2) 1,08 0,85
SPOutlook (-3) -4,85 0,39
VIX (exog) 0,23 0,000 ***
Intercept -5,23 0,000 ***
*, ** and *** denotes significance at 10 percent, 5 percent and 1 percent critical values
Table 4.2.c Vector Autoregression Estimates for EMBI Global Spread for Turkey
Dependent Variable EMBIG Spread Change
Regressors Coefficient P-Value
EMBIGChange (-1) 0,002 0,94
EMBIGChange (-2) 0,03 0,34
EMBIGChange (-3) -0,01 0,74
FitchO (-1) -2,26 0,75
FitchO (-2) 3,36 0,64
FitchO (-3) 4,83 0,50
VIX (exog) 0,23 0,000***
Intercept -5,24 0,000***
*, ** and *** denotes significance at 10 percent, 5 percent and 1 percent critical values

34
Table 4.2.d Vector Autoregression Estimates for EMBI Global Spread for Turkey
Dependent Variable EMBIG Spread Change
Regressors Coefficient P-Value
EMBIGChange (-1) 0,002 0,94
EMBIGChange (-2) 0,03 0,34
EMBIGChange (-3) -0,01 0,68
EMBIGChange (-4) 0,009 0,77
FitchG (-1) -7,65 0,29
FitchG (-2) 2,97 0,68
FitchG (-3) -2,38 0,74
FitchG (-4) 0,90 0,90
VIX (exog) 0,23 0,000***
Intercept -5,18 0,000***
*, ** and *** denotes significance at 10 percent, 5 percent and 1 percent critical values
Table 4.2.e Vector Autoregression Estimates for EMBI Global Spread for Turkey
Dependent Variable EMBIG Spread Change
Regressors Coefficient P-Value
EMBIGChange (-1) 0,004 0,90
EMBIGChange (-2) 0,03 0,37
EMBIGChange (-3) -0,01 0,76
MoodysO (-1) 6,32 0,38
MoodysO (-2) -3,59 0,62
MoodysO (-3) 1,68 0,82
VIX (exog) 0,23 0,000***
Intercept -5,24 0,000***
*, ** and *** denotes significance at 10 percent, 5 percent and 1 percent critical values
35
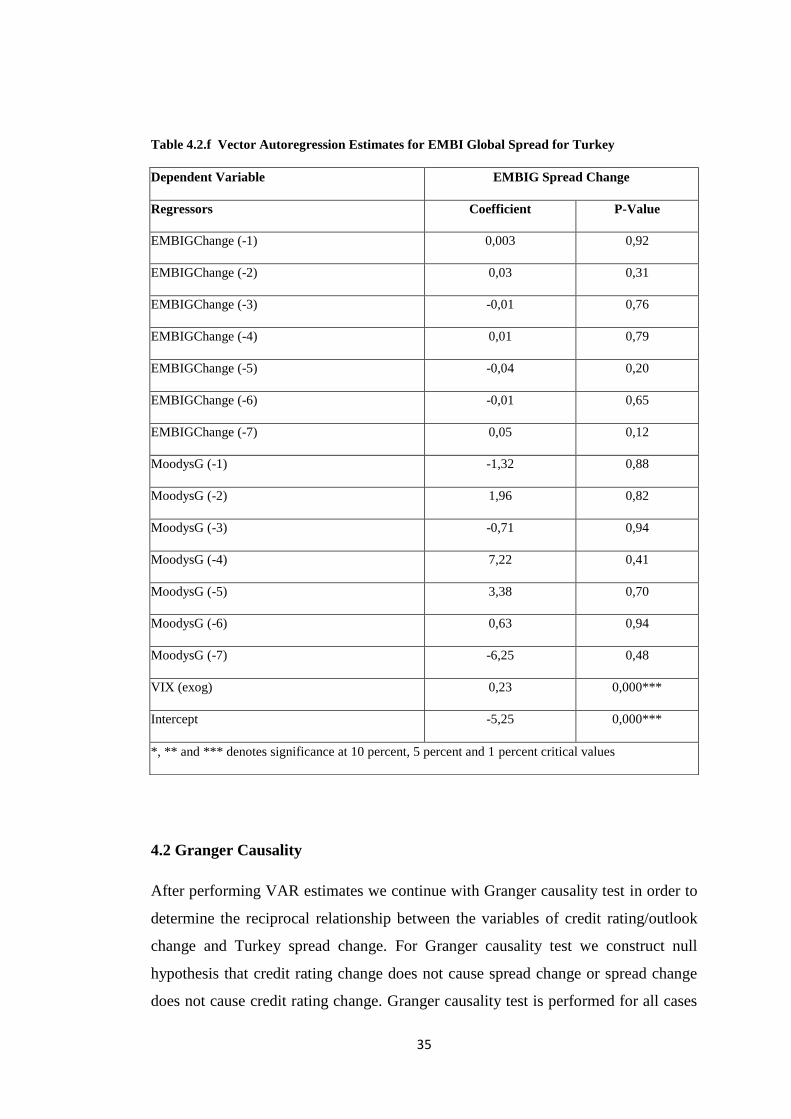
4.2 Granger Causality
After performing VAR estimates we continue with Granger causality test in order to
determine the reciprocal relationship between the variables of credit rating/outlook
change and Turkey spread change. For Granger causality test we construct null
hypothesis that credit rating change does not cause spread change or spread change
does not cause credit rating change. Granger causality test is performed for all cases
Table 4.2.f Vector Autoregression Estimates for EMBI Global Spread for Turkey
Dependent Variable EMBIG Spread Change
Regressors Coefficient P-Value
EMBIGChange (-1) 0,003 0,92
EMBIGChange (-2) 0,03 0,31
EMBIGChange (-3) -0,01 0,76
EMBIGChange (-4) 0,01 0,79
EMBIGChange (-5) -0,04 0,20
EMBIGChange (-6) -0,01 0,65
EMBIGChange (-7) 0,05 0,12
MoodysG (-1) -1,32 0,88
MoodysG (-2) 1,96 0,82
MoodysG (-3) -0,71 0,94
MoodysG (-4) 7,22 0,41
MoodysG (-5) 3,38 0,70
MoodysG (-6) 0,63 0,94
MoodysG (-7) -6,25 0,48
VIX (exog) 0,23 0,000***
Intercept -5,25 0,000***
*, ** and *** denotes significance at 10 percent, 5 percent and 1 percent critical values
36
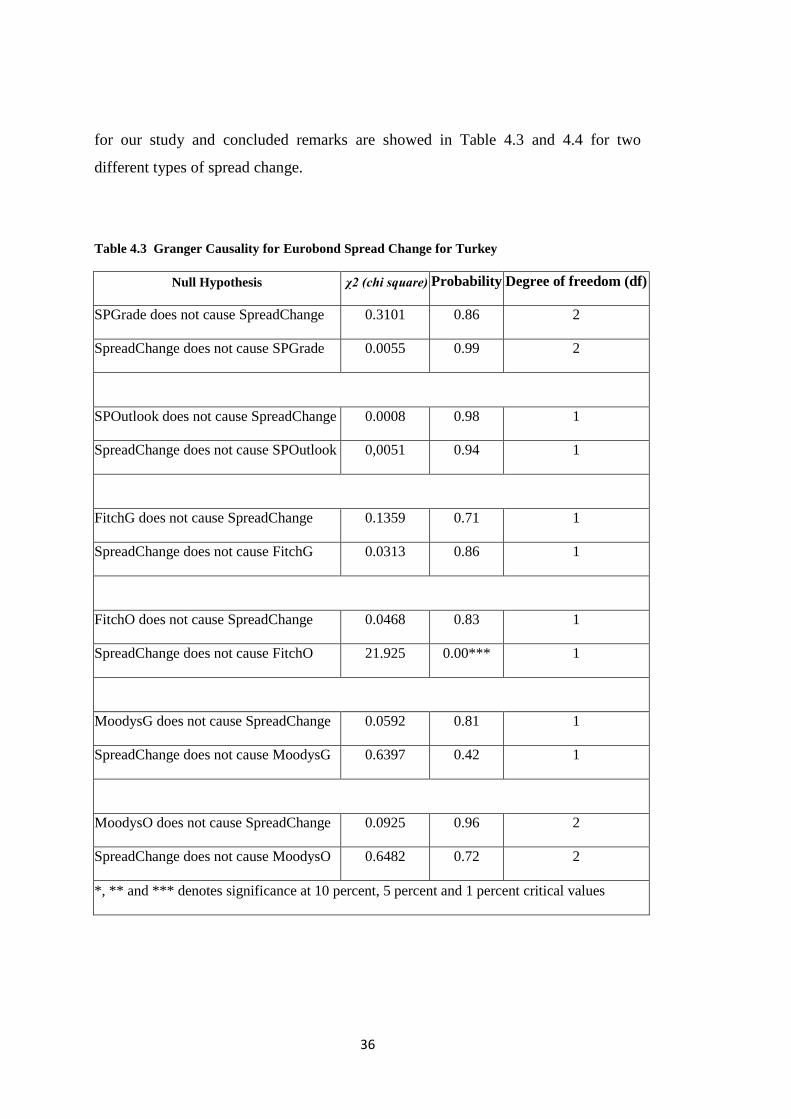
for our study and concluded remarks are showed in Table 4.3 and 4.4 for two
different types of spread change.
Table 4.3 Granger Causality for Eurobond Spread Change for Turkey
Null Hypothesis χ2 (chi square) Probability Degree of freedom (df)
SPGrade does not cause SpreadChange 0.3101 0.86 2
SpreadChange does not cause SPGrade 0.0055 0.99 2
SPOutlook does not cause SpreadChange 0.0008 0.98 1
SpreadChange does not cause SPOutlook 0,0051 0.94 1
FitchG does not cause SpreadChange 0.1359 0.71 1
SpreadChange does not cause FitchG 0.0313 0.86 1
FitchO does not cause SpreadChange 0.0468 0.83 1
SpreadChange does not cause FitchO 21.925 0.00*** 1
MoodysG does not cause SpreadChange 0.0592 0.81 1
SpreadChange does not cause MoodysG 0.6397 0.42 1
MoodysO does not cause SpreadChange 0.0925 0.96 2
SpreadChange does not cause MoodysO 0.6482 0.72 2
*, ** and *** denotes significance at 10 percent, 5 percent and 1 percent critical values
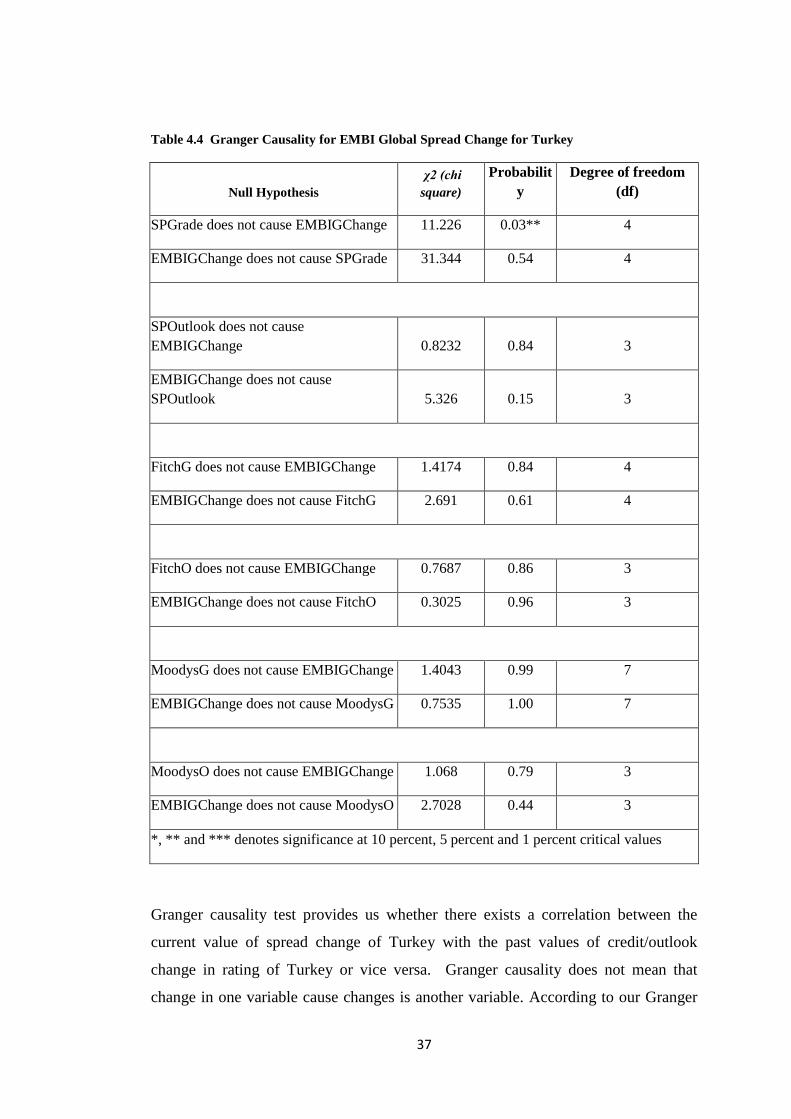
37
Table 4.4 Granger Causality for EMBI Global Spread Change for Turkey
Null Hypothesis
χ2 (chi
square)
Probabilit
y
Degree of freedom
(df)
SPGrade does not cause EMBIGChange 11.226 0.03** 4
EMBIGChange does not cause SPGrade 31.344 0.54 4
SPOutlook does not cause
EMBIGChange 0.8232 0.84 3
EMBIGChange does not cause
SPOutlook 5.326 0.15 3
FitchG does not cause EMBIGChange 1.4174 0.84 4
EMBIGChange does not cause FitchG 2.691 0.61 4
FitchO does not cause EMBIGChange 0.7687 0.86 3
EMBIGChange does not cause FitchO 0.3025 0.96 3
MoodysG does not cause EMBIGChange 1.4043 0.99 7
EMBIGChange does not cause MoodysG 0.7535 1.00 7
MoodysO does not cause EMBIGChange 1.068 0.79 3
EMBIGChange does not cause MoodysO 2.7028 0.44 3
*, ** and *** denotes significance at 10 percent, 5 percent and 1 percent critical values
Granger causality test provides us whether there exists a correlation between the
current value of spread change of Turkey with the past values of credit/outlook
change in rating of Turkey or vice versa. Granger causality does not mean that
change in one variable cause changes is another variable. According to our Granger

38
causality test results in Table 4.3 and 4.4 we find that there exists no Granger
causality between variable of credit/outlook rating change and spread change for
Turkey. In order to examine the price reactions of financial instruments to
credit/outlook rating changes we perform event study analysis which is generally
used in finance literature.
4.3 IRF Analysis
By performing Granger causality test we can determine the predictive power of
SPGrade change to Spread change or vice versa. However with impulse response
function of VAR we able to examine the effect of a shock to one variable to the other
variables in the system. For our case study we aim to trace the effect of any shock
occur in credit rating to government bond spread changes. Aim of using these
functions is to explain the sign and the power of relationship between these variables.
In this analysis we give a particular exogenous shock on an endogenous variable of
credit/outlook rating change and then we can able to measure the movement of other
endogenous variable of Turkey spreads. Before calculating and plotting IRFs we
firstly perform the stability test for the VAR estimates and we conclude that all the
eigenvalues lie inside the unit circle so VAR estimates satisfy the stability condition.
Before moving to the impulse-response graphs it is useful to explain some points
about the impulse response functions (IRFs) in order to understand and interpret
graphs accurately. Horizontal axis (X-axis) of IRF graph indicate us that length of
response and the vertical axis (Y-axis) of graph indicate us the size of the response as
a standard error. Continuous line in the graph indicate the response of Turkey’s
spread change variables against the shock (1 standard error) occurring in error terms.
Grey area shows the confidence intervals according to ±2 standard error.
As mentioned the impulse response function of VAR is to analysis dynamic effects
of the system when system received the impulse (shock). In our model we have two
variables of credit/outlook rating change and spread change. We work with response
of Turkey’s spread change to the impulse of credit rating/outlook change. In our
models we used two types of spread for Turkey which are Turkey’s five year

39
Eurobond spreads and EMBI Global spread of Turkey. We perform VAR model to
these variables separately in order to get broader conclusions about the impact of
credit rating/outlook changes on the Turkish government marginal cost of borrowing.
In order to display the response function clearer, we plot the chart as figure 4.1 and
figure 4.2 according to response of Eurobond spread change and EMBI Global
spread change of Turkey.
Response of SpreadChange to SPGrade Response of SpreadChange to SPOutlook
Response of SpreadChange to FitchG Response of SpreadChange to FitchO
Figure 4.1 Impulse Responses of Eurobond Spread Change
-.04
-.02
0
.02
.04
0 2 4 6 8
Response of SpreadChange to SPGrade
95% CI orthogonalized irf
step
-.04
-.02
0
.02
0 2 4 6 8
Response of SpreadChange to SPOutlook
95% CI orthogonalized irf
step
-.04
-.02
0
.02
.04
0 2 4 6 8
Response of SpreadChange to FitchG
95% CI orthogonalized irf
step
-.04
-.02
0
.02
.04
0 2 4 6 8
Response of SpreadChange to FitchO
95% CI orthogonalized irf
step
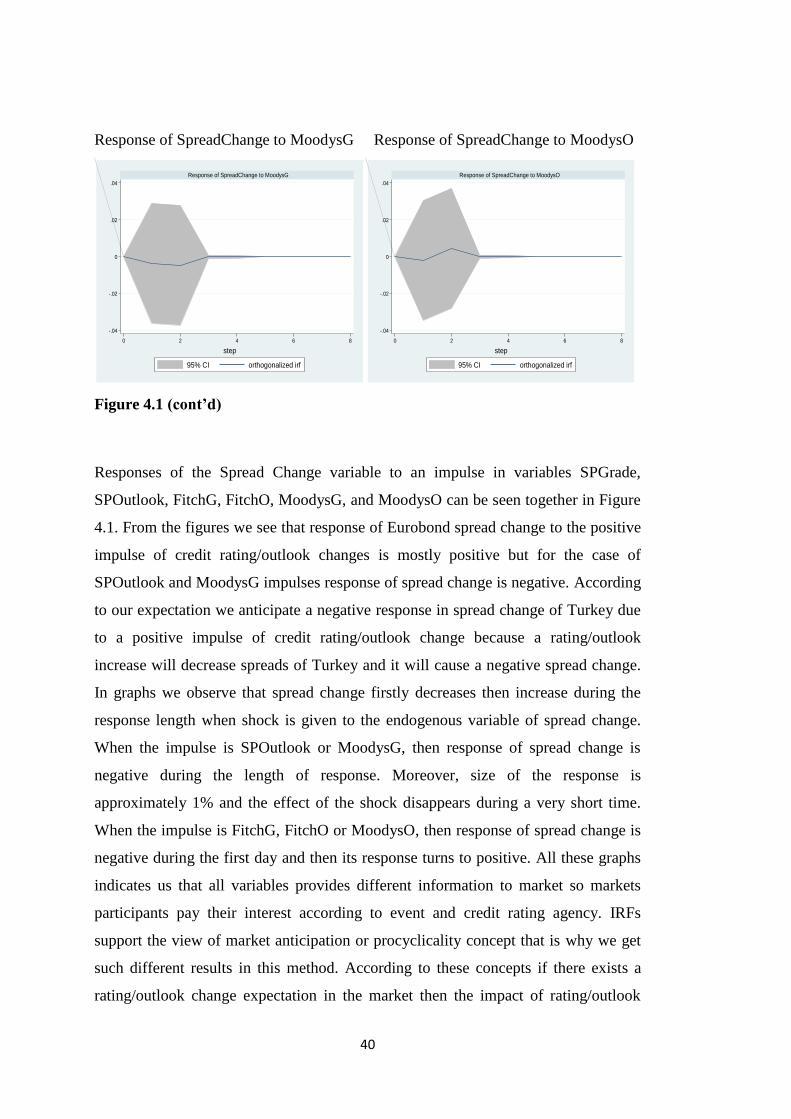
40
Response of SpreadChange to MoodysG Response of SpreadChange to MoodysO
Figure 4.1 (cont’d)
Responses of the Spread Change variable to an impulse in variables SPGrade,
SPOutlook, FitchG, FitchO, MoodysG, and MoodysO can be seen together in Figure
4.1. From the figures we see that response of Eurobond spread change to the positive
impulse of credit rating/outlook changes is mostly positive but for the case of
SPOutlook and MoodysG impulses response of spread change is negative. According
to our expectation we anticipate a negative response in spread change of Turkey due
to a positive impulse of credit rating/outlook change because a rating/outlook
increase will decrease spreads of Turkey and it will cause a negative spread change.
In graphs we observe that spread change firstly decreases then increase during the
response length when shock is given to the endogenous variable of spread change.
When the impulse is SPOutlook or MoodysG, then response of spread change is
negative during the length of response. Moreover, size of the response is
approximately 1% and the effect of the shock disappears during a very short time.
When the impulse is FitchG, FitchO or MoodysO, then response of spread change is
negative during the first day and then its response turns to positive. All these graphs
indicates us that all variables provides different information to market so markets
participants pay their interest according to event and credit rating agency. IRFs
support the view of market anticipation or procyclicality concept that is why we get
such different results in this method. According to these concepts if there exists a
rating/outlook change expectation in the market then the impact of rating/outlook
-.04
-.02
0
.02
.04
0 2 4 6 8
Response of SpreadChange to MoodysG
95% CI orthogonalized irf
step
-.04
-.02
0
.02
.04
0 2 4 6 8
Response of SpreadChange to MoodysO
95% CI orthogonalized irf
step
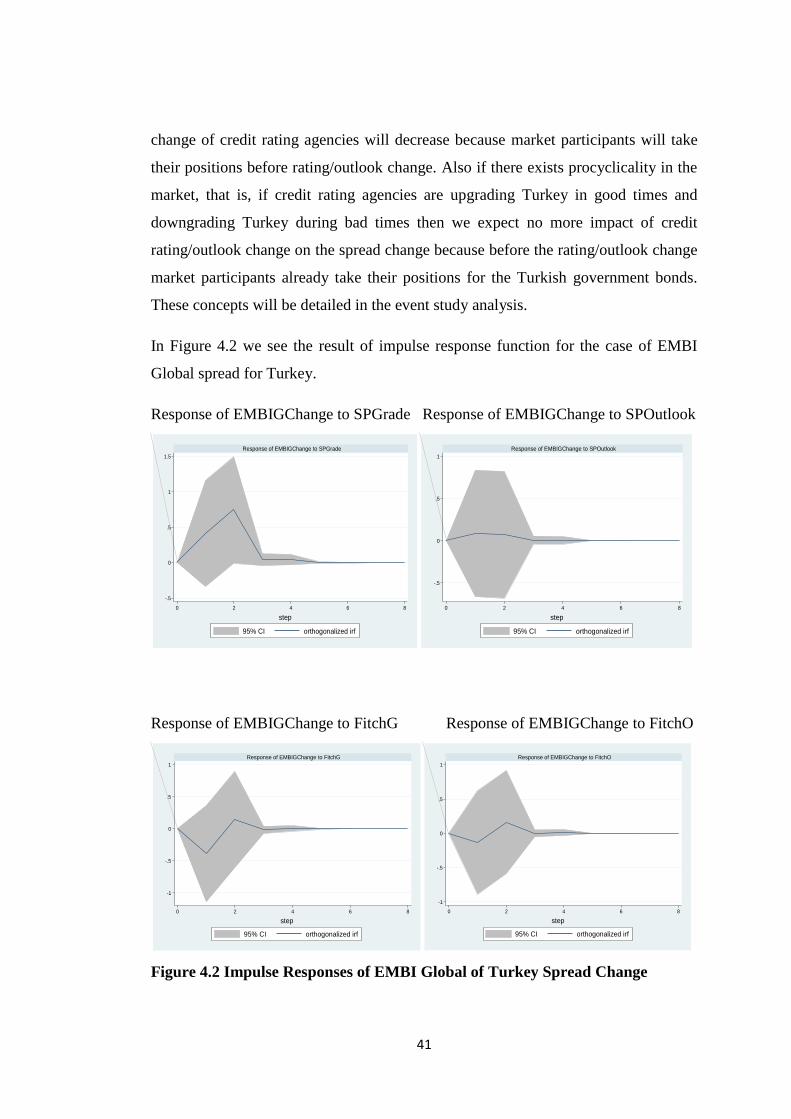
41
change of credit rating agencies will decrease because market participants will take
their positions before rating/outlook change. Also if there exists procyclicality in the
market, that is, if credit rating agencies are upgrading Turkey in good times and
downgrading Turkey during bad times then we expect no more impact of credit
rating/outlook change on the spread change because before the rating/outlook change
market participants already take their positions for the Turkish government bonds.
These concepts will be detailed in the event study analysis.
In Figure 4.2 we see the result of impulse response function for the case of EMBI
Global spread for Turkey.
Response of EMBIGChange to SPGrade Response of EMBIGChange to SPOutlook
Response of EMBIGChange to FitchG Response of EMBIGChange to FitchO
Figure 4.2 Impulse Responses of EMBI Global of Turkey Spread Change
-.5
0
.5
1
1.5
0 2 4 6 8
Response of EMBIGChange to SPGrade
95% CI orthogonalized irf
step
-.5
0
.5
1
0 2 4 6 8
Response of EMBIGChange to SPOutlook
95% CI orthogonalized irf
step
-1
-.5
0
.5
1
0 2 4 6 8
Response of EMBIGChange to FitchG
95% CI orthogonalized irf
step
-1
-.5
0
.5
1
0 2 4 6 8
Response of EMBIGChange to FitchO
95% CI orthogonalized irf
step
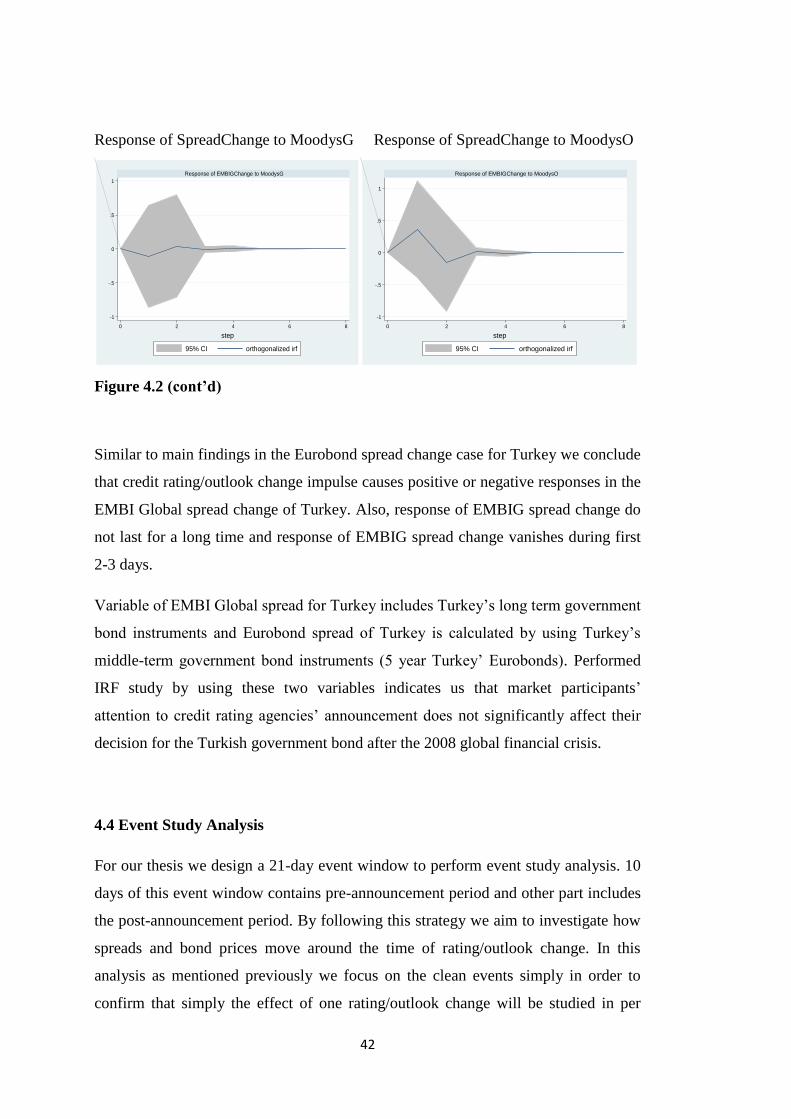
42
Response of SpreadChange to MoodysG Response of SpreadChange to MoodysO
Figure 4.2 (cont’d)
Similar to main findings in the Eurobond spread change case for Turkey we conclude
that credit rating/outlook change impulse causes positive or negative responses in the
EMBI Global spread change of Turkey. Also, response of EMBIG spread change do
not last for a long time and response of EMBIG spread change vanishes during first
2-3 days.
Variable of EMBI Global spread for Turkey includes Turkey’s long term government
bond instruments and Eurobond spread of Turkey is calculated by using Turkey’s
middle-term government bond instruments (5 year Turkey’ Eurobonds). Performed
IRF study by using these two variables indicates us that market participants’
attention to credit rating agencies’ announcement does not significantly affect their
decision for the Turkish government bond after the 2008 global financial crisis.
4.4 Event Study Analysis
For our thesis we design a 21-day event window to perform event study analysis. 10
days of this event window contains pre-announcement period and other part includes
the post-announcement period. By following this strategy we aim to investigate how
spreads and bond prices move around the time of rating/outlook change. In this
analysis as mentioned previously we focus on the clean events simply in order to
confirm that simply the effect of one rating/outlook change will be studied in per
-1
-.5
0
.5
1
0 2 4 6 8
Response of EMBIGChange to MoodysG
95% CI orthogonalized irf
step
-1
-.5
0
.5
1
0 2 4 6 8
Response of EMBIGChange to MoodysO
95% CI orthogonalized irf
step

43
window. In this perspective we drop some events to get clean events and we deal
with 18 domestic. Main featured property of event study methodology arises from
dealing with the excessive returns of bond yield spreads. That is, for our study event
study analysis deal with excessive returns of Turkish government bond spreads
according to rating/outlook change day. In this view we construct a 21-day event
window where rating/outlook changes are occurred on day 11 and we able to observe
how sovereign yield spreads behave in this window.
Our findings in event study analysis indicate that sovereign yield spreads start to
increase or decrease before the rating/outlook change occurs that support our
expectation. For example, for rating increases case excessive returns of Turkish
government bond have already decreased before the CRAs announce the rating
change. For outlook downgrade case spreads have already increased by the time of
the outlook change which ensures us that market participants take their position
before the agencies’ rating announcements. Figure 4.3 illustrates the event study
analysis for the case study of Turkey.
Figure 4.3 Event Study Analyses for Turkey
9
9,2
9,4
9,6
9,8
10
10,2
10,4
10,6
10,8
11
-2,5
-2
-1,5
-1
-0,5
0
0,5
1
1,5
1 2 3 4 5 6 7 8 9 10 11 12 13 14 15 16 17 18 19 20 21
Re
lati
ve B
on
d R
etu
rn
Window
Rating Upgrade
Bond Return
Rating Scale

44
Figure 4.3 (cont’d)
These results could be interpreted as an indication that there exists market
anticipation towards to rating/outlook change or CRAs behave procyclically. That is,
CRAs make decision according to the price of financial instruments. When the price
of financial instruments increases then credit rating agencies decide to downgrade the
related country. Otherwise, the price action in the days before rating/outlook changes
may reveal an effect of market anticipation. Investors expect the rating/outlook
changes so they consider this effect before they take positions.
-0,4
-0,2
0
0,2
0,4
0,6
0,8
-0,06
-0,05
-0,04
-0,03
-0,02
-0,01
0
1 2 3 4 5 6 7 8 9 101112131415161718192021
Re
lati
ve B
on
d R
retu
rn
Window
Outlook Upgrades
Bond Return
Rating Scale
-0,4
-0,2
0
0,2
0,4
0,6
0,8
0
0,005
0,01
0,015
0,02
0,025
0,03
1 2 3 4 5 6 7 8 9 101112131415161718192021
Re
lati
ve B
on
d R
etu
rn
Window
Outlook Downgrade
Bond Return
Rating Scale
45
When we look at the literature we face with different approach explaining the
behavior of bond yield spreads over the event window. According to Kaminsky and
Schmukler (2002) movement of bond yield spreads before announcement day
indicates that credit rating agencies act procyclically. However, Cavallo, Powell, and
Rigobon (2008) evaluate the same situation from different perspective that
movement of bond yield spreads before rating/outlook change is the evidence of
market anticipation of the rating/outlook change for them. In this perspective
investors anticipate CRAs’ actions so they take their position before announcement
day which cause sovereign bond yield spreads move before the actual rating change
is announced. It should be noted that although Kaminsky and Schmukler (2002) do
not mention market anticipation effects and they points out the procyclically action
of CRAs, there is a clear issue that spreads show the expected movement even before
a rating/outlook change occurred.

46
CHAPTER 5
CONCLUSIONS
Most of the existent literatures for the studies that investigate the impact of rating
changes on the government bond yield spreads find a negative and significant
relation and most of them use panel regression model as a main method. However in
this thesis we use the VAR method in order to investigate the inter-relationship
between the variables of credit rating/outlook change and Turkish government bond
spread changes. For Turkey bond spread we use two types of data; Turkey’s five year
Eurobond spread change and EMBI Global spread change. Difference of our study
arises from the fact that we use newest data set and we use different types of data for
Turkey spread variables- Eurobond spread and EMBI Global spread for Turkey. Our
sample period includes 2008 global financial crisis so we able to investigate how
rating agencies’ influence on the financial market is affected by the crisis. After 2008
global financial crises credit rating agencies’ business started to be debated so in this
study we examine the after crisis period for Turkish government bonds. Having
different types of data set gives us the chance of getting broader remarks. We, also,
perform event study analysis to investigate the dynamic effect of government bond
yield spreads to rating and outlook changes by focusing on the excessive returns of
bond. During our analysis we perform vector autoregression (VAR) model including
Granger causality and Impulse Response Function (IRF) analysis and lastly we
perform event study analysis. VAR model focuses on the dynamic relationship
between credit rating changes and government bond spread changes. VAR analysis
gives us the chance of examining the inter-relationships between economic variables.
For our study we able to investigate the inter-relationship between variables of credit
rating/outlook change and spread changes (Eurobond or EMBI Global). By event
study analysis we able to analyze market anticipation and procyclicality effect for
Turkish government bonds.

47
At the end of this study we get two main findings that somehow contribute useful
remarks for the related literature. Especially, for Turkey we deal with such an issue
in the first time and we think this thesis stimulates such studies for Turkey. Our first
finding is that results of VAR, Granger causality, and IRF analysis support the view
that there is no inter-relationship between the variables of credit rating/outlook
change and spread change for Turkey in contrast to findings in literature for this
issue. According to our Granger causality test results we find that there exists no
Granger causality between variable of credit/outlook rating change and spread
change for Turkey. Also, with impulse response function of VAR we able to examine
the effect of a shock to one variable to the other variables in the system. For our case
study we aim to trace the effect of any shock occur in credit rating to government
bond spread changes. Aim of using these functions is to explain the sign and the
power of relationship between these variables. IRF study indicates us that market
participants’ attention to credit rating agencies’ announcement does not significantly
affect their decision for the Turkish government bond after the 2008 global financial
crisis.
Our second finding is related to market anticipation for the rating/outlook changes.
We observe in the event study analysis that sovereign spreads move in a certain
event window according to market anticipation concept. However, when we
investigate the rating action literature we see that most of the related literature does
not consider the market anticipation as factor that affect the sovereign spread
movement. In this study we focus on the market anticipation and procyclicality
concepts since VAR model gives us no inter-relationship between the variables of
credit rating/outlook change and spread change for Turkey in contrast to findings in
literature for this issue. In order to explain this situation we pay more attention the
event study analysis which shed light to market anticipation and procyclicality.
Therefore, the most crucial strength of this thesis is that it considers the market
anticipation and procyclicality factor as a key factor in the rating action so that it
provides a more proper analysis in the estimation of market reaction to rating/outlook
changes. What the event study analysis indicates us that government bond yield
spreads has started to move according to our expectation before rating/outlook
change is announced. In previous parts two approaches are explained that explain

48
such movement of spreads, these approaches are market anticipation and procyclical
action of credit rating agencies. Actually, event study analysis gives us some clue
about the creditworthiness of rating agencies after the 2008 global financial crisis.
After 2008 global financial crises credit rating agencies’ business started to be
debated by investors and academicians. Due to their inability in foreseeing the 2008
global crisis, in fact, giving higher rates to very risky financial instruments which
caused the crisis decreased the creditworthiness of the agencies. However after the
crisis period and uptill now CRAs improve their creditworthiness in market even if
just a bit. This is our starting point to write this thesis in order to evaluate whether
rating/outlook change still provide information to market participants. However, the
results of VAR estimates indicate us that rating changes by agencies do not add new
information for investors, that is, rating or outlook changes are mostly anticipated by
market. Other aspect of this type of studies is that daily data of bond spreads is
formed in the market and it mostly possible that any information transmitted by
changing rating/outlook may already be included in a daily change of bond spreads.
That means according to this aspect credit rating agencies and market are feeding
from the mostly same source-publicly available indicators- so bond spreads and
ratings follow the same indicators thereby rating changes is introducing noise in the
financial markets. That is, if CRAs announcements are entirely anticipated then
market participants take their positions before announcement so we would see any
relation between the rating/outlook changes and sovereign spreads.
For further studies performing same study by using corporate bonds will give us
broader remarks. In this study we use foreign currency denominated instruments-five
year government Eurobonds- so performing same study by using domestic currency
denominated instruments will give us more workable results.
49
REFERENCES
Afonso, A. (2003). Understanding The Determinants of Sovereign Debt Rating:
Evidence for The Two Leading Agencies. Journal of Economics and Finance, 27 (1),
56-74.
Afonso, A., Gomes, P., Furceri, D. (2011). Sovereign Credit Ratings and Financial
Markets Linkages Application to European Data. European Central Bank Working
Papers 1347.
Afonso, A., Gomes, P., Rother, P. (2011. Short and Long-run Determinants of
Sovereign Debt Credit Ratings. International Journal of Finance and Economics,
16(1), 1-15.
Alper, E. and Ciğerli, B. (2005). Determinants of Turkish Sovereign Spreads:
Fundamentals and Global Liquidity.
Bahena, A. (2010). What Role Did Credit Rating Agencies Play in the Credit
Crisis?”. The University of Iowa Center for International Finance and Development,
available at http://blogs.law.uiowa.edu/ebook/sites/default/files/Part_5_3.pdf
BDDK Finansal Piyasalar Raporu Eylül/2009:20-21.
Beck, R. (2001). Do Country Fundamentals Explain Emerging Market Bond
Spreads?. CFS Working Paper No.2001/02.
Bissoondoyal-Bheenick, E. (2005). An analysis of the determinants of sovereign
ratings. Global Finance Journal, 15 (3), 251-280.
Cantor, Richard, and Frank Packer. Determinants and Impact of Sovereign Credit
Ratings. FRBNY Economic Policy Review/October (1996): 37-54.
Cavallo, Eduardo A., Andrew Powell, and Roberto Rigobón. Do Credit Rating
Agencies Add Value? Evidence from the Sovereign Rating Business Institutions.
Washington, D.C.: Inter-American Development Bank, 2008. Working Paper 674.

50
Erb, C., C. Harvey, and T. Viskanta. 1996b. The Influence of Political, Economic
and Financial Risk on Expected Fixed Income Returns. Journal of Fixed Income
6(1):7-31.
Flores, E. (2010). Do Sovereign Credit Rating Changes Have Spillover Effects on
Other Countries?. Unpublished master dissertation, Stanford University, Stanford.
Gande, A. and Parsley, D. (2003). News Spillovers in the Sovereign Debt Market.
Journal of Financial Economics.
Hartelius, K., K. Kashiwase, and L.E. Kodres (2008), Emerging Market Spread
Compression: Is it Real or is it Liquidity?. IMF Working Paper 08/10.
Heinke, V. and Steiner, M. (2001). Event Study Concerning International Bond Price
Effects of Credit Rating Actions. International Journal of Finance and Economics 6:
139–157.
Jaramillo, L. and Tejada, C. (2011). Sovereign Credit Ratings and Spreads in
Emerging Markets: Does Investment Grade Matter?. IMF Working Paper WP/11/44.
Jickling, M. (2011). Standard & Poor’s Downgrade of U.S. Government Long-Term
Debt. Congressional Research Service R41955.
Johansen, S., 1991. Estimation and hypothesis testing of cointegration vectors, in
Gaussian vector autoregressive models. Econometrica, 59:1551-1580.
Kaminsky, Graciela, and Sergio L. Schmukler. Emerging Market Instability: Do
Sovereign Ratings Affect Country Risk and Stock Returns?. The World Bank
Economic Review16.2 (2002): 171-195.
Kräussl, R. (2005). Do credit rating agencies add to the dynamics of emerging
market crises?. Journal of Financial Stability, 1 (3), 355-385.
Larrain, G., H. Reisen, and J. Von Maltzan. 1997. Emerging Market Risk and
Sovereign Credit Rating. OECD Development Centre Technical Paper 124.

51
Manganelli, S. and Wolswijk,G. (2009). What drives spreads in the euro area
government bond market?. Economic Policy, April 2009 pp.191-240, Printed in Great
Britain.
Masson, P. (1998). Contagion: Monsoonal Effects, Spillovers, and Jumps between
Multiple Equilibria. International Monetary Fund Working Paper WP/98/142. IMF,
Washington , D.C.
Özatay, F., Özmen, E., and Şahinbeyoğlu, G. (2007). Emerging Market Sovereign
Spreads, Global Financial Conditions and US Macroeconomic News. ERC Working
Papers in Economics 07/07.
Reisen, H. and Maltzan, J. (1999). Boom and Bust and Sovereign Ratings.
International Finance, 2 (2), 273-293.
Reurink, A. (2012). Credit Rating Agencies and the Politics of Creditworthiness: the
pre-Crisis Evolution and the post-Crisis Renegotiation of the Global Credit Rating
Regime. University of Amsterdam.
Scholtens, B. (1999). Bond Yield Spreads and Country Risk. Paper presented at the
8th Symposium on Finance, Banking, and Insurance Universität Karlsruhe (TH),
Germany, December 15-18, 1999.
Sy, A. (2001). Emerging Market Bond Spreads and Sovereign Credit Ratings:
Reconciling Market Views with Economic Fundamentals. IMF Working Paper
WP/01/65.
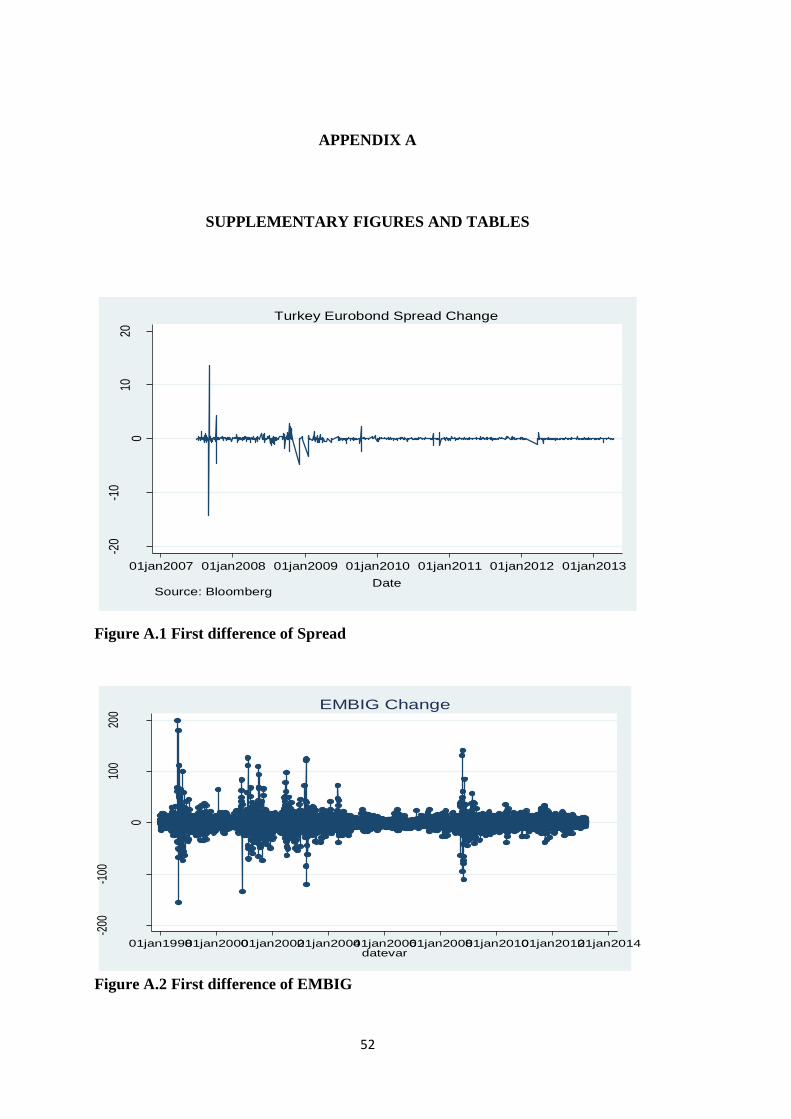
52
APPENDIX A
SUPPLEMENTARY FIGURES AND TABLES
Figure A.1 First difference of Spread
Figure A.2 First difference of EMBIG
-20
-10
010
20
Spr
eadC
hang
e
01jan2007 01jan2008 01jan2009 01jan2010 01jan2011 01jan2012 01jan2013
DateSource: Bloomberg
Turkey Eurobond Spread Change
-200
-100
0
100
200
EM
BIG
Cha
nge
01jan199801jan200001jan200201jan200401jan200601jan200801jan201001jan201201jan2014datevar
EMBIG Change

53
Tab
le A
.1 L
ag L
ength
Sel
ecti
on
for
Sp
read
Ch
an
ge
Vari
ab
le

54
Tab
le A
.2 L
ag L
ength
Sel
ecti
on
for
EM
BIG
Ch
an
ge
Vari
ab
le

55
APPENDIX B
TURKISH SUMMARY
KREDİ NOTU DEĞİŞİKLİKLERİNİN TÜRKİYE’NİN DEVLET
BORÇLANMA MALİYETLERİNE ETKİSİ
GİRİŞ ve LİTERATÜR TARAMASI
Standard and Poor’s (S&P) , Fitch ve Moody's üç büyük kredi derecelendirme
kuruluşları olup şirket ve devlet tahvilleri için kredi notu üretmektedirler. Bu
kuruluşlar tarafından üretilen kredi notları tahvil ihraç eden kurumların kredi
güvenilirliğini gösteriyor olup tahvil ihraç edenler için kredi notu almak yasal
zorunluluk olmamasına rağmen yatırımcılar yatırım tercihlerinde derecelendirme
notlarını dikkate almakta. Ülke derecelendirmesi (sovereign rating), ana amacı
itibariyle tahvil veya kredi yoluyla borçlanan ülkelerin ödeme taahhütlerini yerine
getirememe olasılıklarını değerlendirir. Uluslararası tahvil piyasalarında geçerli
olan derecelendirme, ülkenin döviz cinsinden kredi notudur. Uluslararası piyasada
ülke notu o ülkenin yatırım ortamı riskini gösteriyor olması nedeniyle kredi
derecelendirme kuruluşlarının yayınladığı notlar çoğunlukla yatırımcılar tarafından
dikkate alınır ve yatırımcılar bu notlardaki gidişata göre pozisyon alırlar. Her bir
kredi derecelendirme kuruluşunun kendisine ait derecelendirme metodolojisi olup
bu metodoloji çerçevesinde yıllardır şirket ve devlet tahvilleri için derecelendirme
notu yayınlamaktadırlar ve ülkenin kredibilitesinde önemli değişiklikler olduğunda
bu direkt olarak derecelendirme notuna da yansıtılmaktadır.
Derecelendirme notlarının finansal piyasaları ve yatırımcıların kararlarını etkileyip
etkilemediği yıllardır tartışılagelmiştir. Özellikle derecelendirme notlarının
yatırımcılara devlet tahvilleri hakkında yeni enformasyon sağlayıp sağlamadığı
1990’lı yıllardan itibaren tartışılmaktadır. Bu konuda yapılan en önemli tartışma
devlet tahvili getiri spreadlerinin günlük piyasada oluşuyor olması ve kredi
derecelendirme kuruluşlarının açıkladığı kredi notlarının mevcut günlük spread
değişimlerinin içinde yer alma olasılığı. Derecelendirme kuruluşları genelde
kamuya açık bilgileri modellerinde kullanarak ülkeler için bir kredi notu

56
oluşturmaktadır. Bundan dolayı bazı araştırmacılar devlet tahvili getiri
spreadlerindeki değişimin nedeni olarak makro-ekonomik verilerin açıklanmasını
göstermektedir. Yani kredi notu değişimi öncesinde açıklanan makro-ekonomik
veriler devlet tahvili getiri spreadlerini etkilemekte ve aslında kredi notu
açıklamalarının yatırımcılar için yeni bir enformasyon sağlamadığı belirtilmektedir.
Derecelendirme sisteminin başlıca eleştiri konusu olan konjonktürü takip etme
(procyclicality) özelliği ve derecelendirme kuruluşlarının finansal piyasada
etkinliğini azaltan piyasa beklentisi (market anticipation) bu çalışma kapsamında
ilerleyen bölümlerde tartışılacaktır.
Uluslararası finans piyasasında yatırımcılar ülkelerin tahvil getiri spreadlerine ve
kredi kuruluşlarının özellikle Standard and Poor’s (S&P) , Fitch ve Moody's gibi üç
büyük derecelendirme kuruluşunun yayınladığı kredi notlarına büyük önem
vermekte. Tahvil getiri spreadleri devletlerin dış piyasalardan borçlanma
maliyetlerini gösteriyor olup bu çalışma kapsamında üç büyük kredi
derecelendirme kuruluşunun yayınladığı kredi notlarının Türkiye’nin kamu dış
borçlanma maliyetlerine etkisi üzerine çeşitli incelemelerde bulunulacaktır.
Devletlerin ihraç ettiği ve ikincil piyasalarda işlem gören Eurobondların, finansal
sistemde dünya çapında risksiz getiri olarak kabul edilen aynı vadeli ABD devlet
tahvilleriyle olan ve diğer Gelişmekte Olan Ülkelerin (GOÜ) tahvillerine göre
oluşan getiri marjları, gerek devletlerin Eurobond ihracı yoluyla dış borçlanma
olanaklarını uygun maliyetler üzerinden sürdürebilmesi, gerekse böylece oluşan
risk primlerinin analizi yoluyla ekonominin gidişatının değerlendirilmesi açısından
önem taşımaktadır. Bu çalışma kapsamında kredi derecelendirme kuruluşlarının
yayınlamış olduğu kredi notlarının Türkiye’nin kamu borçlanma maliyetleri üzerine
etkisini çeşitli yönlerden inceleyen çalışmalardan elde edilen bulgulardan
bahsedilmiştir.
Cantor ve Packer (1996) gerek derecelendirme notlarını belirleyen faktörlerin,
gerekse derecelendirme notlarının tahvil getirileri üzerindeki etkilerinin karşılıklı
analizini yapmıştır. Makalede gelişmiş ve gelişmekte olan 49 ülkeye S&P ve
Moody’s tarafından verilen notları belirleyen faktörlerin analizi yapılmıştır. Cantor
ve Packer’e göre ülke derecelendirme notlarını kişi başına düşen Gayri Safi Millî
57
Hâsıla (GSMH), enflasyon oranı, bütçe dengesi, cari denge, dış borç stoku gibi
makro değişkenler etkilemekte. Cantor ve Packer aynı makalede, S&P ve Moody’s
tarafından derecelendirilmiş 35 ülkenin notları ile ülkelerin Eurobondlarının getiri
spreadleri arasındaki ilişkiyi panel veri analizi ile incelemiş olup derecelendirme
notlarının tahvil getiri farkını açıklama gücünü %92 olarak bulmuştur.
Derecelendirme notlarının ülke faiz marjları üzerindeki etkisini inceleyen Cantor ve
Packer’e göre ülke notlarının makro-ekonomik verilerin etkisini taşıdığı ve tahvil
getiri spreadleri üzerinde istatistiki olarak önemli derecede ve beklenen yönde
değişim oluşturduğunu tespit etmiştir.
Sy, 2001 yılında yayınladığı makalesinde 1994-2001 yılları arasında EMBI+
Endeksine dahil 17 ülkenin uzun vadeli döviz cinsinden derecelendirme notları ile
endeksin ilişkisini araştırmıştır. Sy derecelendirme kuruluşlarının yapmış olduğu
açıklamaların endeks üzerindeki etkisinin asimetrik olduğunu öne sürmüş, endeks
yükselişlerinin kredi not düşüşlerinden ortalama 1 ay sonra etkisinin görüldüğünü
vurgulamıştır. Bir başka bulgusunda ise bir harflik kredi notu artışının %14’lük
endeks düşüşüne neden olduğunu tespit etmiştir. Ayrıca Sy çalışmasında tahvil
getiri spreadlerinin yüksek olduğu ülkelerde genellikle kredi notu düşüşünün ve
tahvil getiri spreadlerinin düşük olduğu ülkelerde ise kredi notu artışının olduğunu
gözlemlemiş olup bunu derecelendirme kuruluşlarının kredi notu değişimlerinde
piyasadan geç reaksiyon verdiğini vurgulamıştır. Sy’ın yapmış olduğu çalışmayı
farklı kılan ise bizim yapmış olduğumuz çalışmaya yöntem olarak yakın olmasıdır.
Biz de çalışmamızda Sy’ın yapmış olduğu gibi devlet tahvili getiri spreadleri için
ikincil piyasalarda oluşan günlük verileri kullandık. Zira ikincil tahvil piyasaları,
yatırımcı ve alım-satım yapanların piyasa algılamasını daha iyi yansıtmaktadır.
Beck (2001) yapmış olduğu çalışmada reel milli gelir büyümesi ve enflasyonun
tahvil marjları üzerinde en çok etkili iki makro değişken olduğunu, uluslararası
piyasalardaki faiz değişikliklerinin de bu etkilere katkıda bulunduğunu öne
sürmüştür. Beck makalesinde panel veri analizi yaparak devlet tahvili spreadlerinde
değişimin nedeni olarak uzun ve orta vadeli makro-ekonomik değişkenlerin
olduğunu ileri sürmekte. Bu değişkenleri ise reel GSYİH artışı, enflasyon oranı ve
uluslararası piyasalardaki faiz değişikleri olarak ifade etmekte. Beck, sonuç olarak

58
ülke makro verilerinin devlet tahvili getiri spreadlerinde kredi derecelendirme
kuruluşlarının yayınladığı notlardan daha çok belirleyici olduğunu öne sürmekte.
Bu kapsamda aslında kredi derecelendirme kuruluşlarının yayınlamış oldukları
kredi notlarının yatırımcılar için yeni bir enformasyon sağlamadığı sonucuna
ulaşılıyor.
BDDK’nın 2009 yılında yayınlanan Finansal Piyasalar Raporu’nda yer alan
çalışmada Türkiye’nin kredi derecelendirme notlarıyla borçlanma maliyeti
arasındaki ilişki analiz edilmiş olup kredi notundaki artış/azalış sonucu Eurobond
spreadlerinin azalmasına/artmasına bağlı olarak borçlanma maliyetinin düşmekte/
artmakta olduğu tespit edilmiştir. Türkiye’nin borçlanma maliyetleri kredi notunun
yatırım yapılabilir seviyeye yükselmesine bağlı olarak azalmaktadır.
Scholtens (1999) çalışmasında ülke riski ile tahvil getiri değişimi arasında kuvvetli
bir ilişki bulmuştur. 1990lı yıllarda gelişmekte olan ülkelerin ve sanayileşmiş 12
ülkenin tahvil getirileri-ülke riski ilişkisini araştırdığı makalesinde bu ülkeler için
çeşitli Spearman’ın sıralama korelasyon katsayısı hesaplamıştır. Scholtens sonuçta
çalışmasında tahvil getiri değişimi ile ülke riski arasında kuvvetli ilişki bulmuştur.
Söz konusu makalelerden önemli olarak nitelendirilenlerin sonuçları dikkate
alındığında derecelendirme notlarının, ülkenin borç stoku, milli gelir, faiz dışı fazla
ve net döviz rezervi başta olmak üzere makro-ekonomik verilerinin bir özet
göstergesi olduğu sonucu ortaya çıkmaktadır. Ancak derecelendirme sisteminin
makro-ekonomik veri açıklamaları ile olan ilişkisi çerçevesinde oluşan konjonktürü
etkileme/izleme etkisi ve derecelendirme kuruluşlarının tartışılan konumu,
makalelerde tahvil getiri marjları ve ülke risk primleri üzerinde farklı görüş ve
yorumların oluşmasına yol açmaktadır.
Bazı makalelerde ülke risk primlerinin okunmasında borsa endekslerinden
yararlanılmıştır. Fakat borsa endeksleri kredi riskini ifade etmekten çok, yatırımcı
davranışlarının ve kararlarının kısa vadeli izdüşümlerini gösterdiği için birçok
makalede uluslararası risk primleri karşılaştırmasında ağırlıklı olarak JP Morgan
EMBI endeksleri kullanılmaktadır. Bu çalışmayı diğer çalışmalardan farklı kılan ise
Türkiye’nin ülke risk priminin göstergesi olarak EMBI Global ve ikincil
piyasalarda oluşan 5 yıllık Eurobond devlet tahvili getiri spreadlerinin kullanılıyor
59
olmasıdır. Bu çalışma için Türkiye’nin Temmuz 2007-Nisan 2013 arasında ikincil
piyasalarda oluşan 5 yıllık devlet tahvili spreadlerini ve Türkiye’nin EMBI Global
spread verilerini vektör otoregresyon (VAR) ve olay çalışmasında (event study
analysis) kullanarak Türkiye’nin uzun vadeli yabancı para kredi notlarının ülke
borçlanma maliyetleri üzerinde etkisi incelenmiştir. Bu tür bir çalışmaya
girmemizin en önemli nedeni olarak özellikle 2008 küresel finans krizi kredi
derecelendirme kuruluşları için önemli bir kilometre taşı olup kriz sürecinde yüksek
kredi derecesine sahip ülkeler derin ekonomik dalgalanmalarla karşı karşıya
kalmıştır. Bu durumun ortaya çıkmasıyla kredi derecelendirme kuruluşlarının
özellikle önde gelen kredi derecelendirme kuruluşları olan S&P, Moody’s ve
Fitch’in finansal piyasalardaki güvenirliliği ve pozisyonları tartışılmaya
başlanmıştı. Kredi derecelendirme kuruluşlarının başarısı ve güvenilirliğini onların
saygınlıklarına bağlıdır yani kredi derecelendirme kuruluşları tarafsız, doğru ve
hızlı bir şekilde piyasaya enformasyon sağladıkça saygınlıkları artar. 2008 küresel
finans krizinde kredi kuruluşlarının vermiş olduğu taraflı, yanlış ve zamansız
enformasyonların sonucunda piyasa katılımcıları kredi derecelendirme
kuruluşlarının görevlerini tartışmaya başladı. Derecelendirme kuruluşları ile ilgili
en önemli problem çıkar çatışmasıdır (conflict of interest). Bankalarla ve diğer mali
kuruluşlarla ilgili notlar veren derecelendirme kuruluşları bu firmalar tarafından
finanse edilmektedir. Hal böyle olunca derecelendirme kuruluşlarının objektif
değerlendirme yapma kabiliyetleri azalmaktadır.
Reurink 2012 yılında yapmış olduğu çalışmasında kredi derecelendirme
kuruluşlarının küresel finansal sistem içerisindeki politik yanını incelemiştir.
Araştırmacı bu çalışmasında Amerikan kredi derecelendirme kuruluşları olan S&P,
Moody’s ve Fitch gibi şirketlerin neden uluslararası finans sisteminin merkezinde
yer aldığını sorgulamış ve bu şirketlerin uluslararası finans sistemindeki
pozisyonlarını analiz edip çeşitli sonuçlara ulaşmıştır. Reurink çalışmasında ulaştığı
en önemli nokta kredi derecelendirme sektöründe Amerikan şirketleri oligopol bir
yapı oluşturduğu dolayısıyla sektörde bu şirketlerin piyasaya taraflı (biased)
enformasyon sağladığı vurgulanmıştır. Özellikle 2008 kriz öncesinde krize neden
olan ipoteğe dayalı menkul kıymetlerin (mortgage-backed securities) ve
teminatlandırılmış borç yükümlülüklerinin (collateralized debt obligations) bu kredi
60
derecelendirme kuruluşları tarafından yüksek bir notla derecelendirilmesi kriz
sonrasında kredi derecelendirme kuruluşlarının finansal piyasalardakini rolünü
tartışmaya açmıştır. Aynı zamanda bu durumun oluşması üç önemli kredi
derecelendirme kuruluşu olan S&P, Moody’s ve Fitch gibi şirketlerin uluslararası
finansal piyasadaki saygınlıklarının kaybolmasına neden olmuştur. Bu tartışmalar
ışığında 2008 küresel finans krizi sonrasında kredi derecelendirme kuruluşlarının
finans piyasasına sağladığı enformasyonun piyasalar tarafından ne ölçüde
değerlendirildiğini analiz eden çalışmaların yapılması gerekliliği doğmakta.
Yukarıda bahsettiğimiz makalelerin birçoğu 2008 küresel finans krizi öncesi
dönemde yapılmış olup kredi derecelendirme kuruluşlarının açıkladığı not
değişimleri ülkelerin EMBI+ spreadleri üzerinde etkili olduğu gözlenmiştir. Bizim
bu çalışmamızı farklı kılan en önemli özelliği 2008 kriz sonrasında oluşan piyasa
koşulları göz önünde bulundurarak gerekli analizlerin yapılmış olmasıdır. Ayrıca bu
kapsamda Türkiye için kredi derecelendirme kuruluşlarının yaptığı not
değişimlerinin yabancı para cinsinden Türkiye’nin kamu borçlanma maliyetleri
üzerine etkisini incelemiş olduk. Bu çalışma Türkiye için bir ilk olup özellikle 2008
küresel finans krizi sonrasında kredi notlarındaki değişimin devlet borçlanma
maliyetlerini nasıl etkilediği ayrı bir bölümde detaylıca incelenmiştir. Burada
borçlanma maliyetinden kastedilen yabancı para cinsinden çıkarılan devlet tahvili
getiri spreadlerindeki değişimdir. Bu çalışma kapsamında kullanılan veri seti,
metotlar ve elde edilen sonuçlar bir sonraki kısımda aktarılmıştır.
VERİ SETİ
Bu çalışmamızda Türkiye’nin Temmuz 2007-Mart 2013 arasında günlük şekilde
oluşan 5 yıllık devlet tahvili getiri spreadleri ve Türkiye’nin EMBI Global spread
verileriyle birlikte bu aralıkta üç büyük kredi derecelendirme kuruluşu tarafından
yayınlanmış kredi notları veri seti olarak kullanılmıştır. Ayrıca yine bu dönem
içerisinde küresel riski veya yatırımcıların risk iştahını gösteren volatility index
(VIX) verisi dışsal değişken olarak analizlerimizde kullanılmıştır. Bu veriler için
Bloomberg veri tabanından ve kredi derecelendirme kuruluşlarının web
sayfalarından yararlanılmıştır. Bu dönem içerisinde Türkiye’nin 18 defa kredi notu

61
ya da görünüm değişikliği olmuştur. Bu değişimlerin 13 tanesi kredi notu ya da
görünüm artışı olup geriye kalan 5 tanesi ise kredi notu ya da görünüm düşüşünü
oluşturmaktadır. Türkiye’nin kamu tahvili getirisi spread değerleri hesaplanırken
aşağıdaki formül kullanılmakta olup spread hesaplamasında Türkiye’nin yabancı
para cinsinden çıkardığı beş yıllık devlet tahvili getirisinden aynı vadeli risksiz
kabul edilen US devlet tahvili getirisinden çıkarılmıştır.
BS= Y –T
T: US beş yıllık tahvil getirisi
Y: Ülke beş yıllık tahvil getirisi
BS: Devlet tahvili getiri spreadı
Devlet tahvili getiri spreadı devletlerin diğer ülkelere göre risk primini gösteriyor
olup bu değer artıkça ülkelerin kredi riskinin arttığını ve devletlerin dolayısıyla
borçlanma maliyetlerinin de arttığını söyleyebiliriz. Yukarıda da bahsettiğimiz gibi
birçok makalede ülkeler için kredi riskinin gösteren devlet tahvili spread
hesaplamaları yerine JP Morgan tarafından yayınlanan EMBI endeksi
kullanılmıştır. Dolayısıyla bu çalışmada farklı veri setiyle 2008 küresel finans krizi
sonrasında kredi notu değişimlerinin Türkiye’nin kamu borçlanma maliyeti
üzerindeki etkisi incelenmiş olup bu konuda yapılmış olan mevcut çalışmalara yeni
bir bakış açısı kazandırılmıştır.
METODOLOJİ
Bu çalışmamızda kredi derecelendirme kuruluşlarının yapmış olduğu not
değişimlerinin kamu borçlanma maliyetleri üzerindeki etkisini incelemek için
vektör otoregresyon (VAR) tekniği ve olay çalışması metodundan yararlanılmıştır.
Ayrıca VAR tekniğinden elde edilen etki-tepki fonksiyonları (IRF) sayesinde rassal
hata terimlerinden birindeki bir standart sapmalık şokun, içsel değişkenlerin şimdiki
ve gelecekteki değerlerine olan etkisi incelenmiştir. Bu analiz sayesinde
Türkiye’nin kredi notu değişimleriyle spread değişimleri arasındaki etkileşimin

62
gücü tespit edilmeye çalışılmıştır. Kredi notları değişimleriyle spread değişimleri
arasındaki karşılıklı ilişkiyi tespit etmek için ise yine VAR tekniğine dayalı
Granger nedensellik testlerinden yararlanılmıştır. Olay çalışması analiziyle
Türkiye’nin kamu tahvillerinin göreceli getiri hareketleri incelenerek piyasa
beklentisi (market anticipation) ve konjonktürü takip etme (procyclicality)
konseptleri üzerine incelemelerde bulunulurmuştur. Yukarıda da belirttiğimiz gibi
bu çalışma Türkiye için bir ilk olup elde edilen bulgularla bu konuda akademik
dünyada yapılan çalışmalara yenilikler katılmakta. Bundan sonraki kısımlarda
kullanılan teknikler hakkında ve bu tekniklerden elde edilen sonuçlar hakkında bilgi
verilecektir.
Vektör Otoregressif Model (VAR)
VAR modeli zaman serisi modelleri içinde son zamanlar en fazla kullanılanı olup
bu konuda Sims (1980), Dijk ve Franses (2000), Johansen (2000), Kilian ve Chang
(2000) çalışmaları son dönemde yapılan VAR modellemesi ve analizi konusunda
örnek verilebilir. VAR modellemesi bize değişkenler arasındaki ilişkiyi analiz etme
şansını sunuyor. VAR modellemesiyle birlikte Türkiye’nin kredi notu veya
görünüm değişiklikleriyle Türkiye’nin kamu tahvilleri spread değişimleri
arasındaki ilişkiyi analiz ediyoruz. Bir VAR'daki tüm değişklenler, modeldeki
değişkenin kendi gecikmeleri ve diğer tüm değişkenlerin gecikmelerine bağlı
olarak, değişkenin gelişimini açıklayan her bir değişken için bir denklem ile
simetrik olarak ele alınıyor. Bu sayede Türkiye’nin kredi notu veya görünüm
değişiklikleriyle Türkiye’nin kamu tahvilleri spread değişimleri arasındaki analizler
yapılırken gecikmelerde göz önünde bulundurulduğundan daha kapsamlı sonuçlar
elde etmiş oluyoruz. VAR analizi esnasında kullanmış olduğumuz değişkenler
Tablo 1’de yer almakta olup SPGrade, SPOutlook, FitchG, FitchO, MoodysG ve
MoodysO değişkenleri kukla (dummy) değişkendir. Bu değişkenler not
değişimlerine göre 1,0 veya -1 değeri alırlar.

63
{
Tablo B.1 Değişken İsimleri
EMBIG Emerging Markets Bond Index Global
Spread Türkiye’nin Eurobond Spreadı
SPGrade Standard & Poor's (S&P) Kredi Notu Değişimi
SPOutlook Standard & Poor's (S&P) Görünüm Değişimi
FitchG Fitch Kredi Notu Değişimi
FitchO Fitch Görünüm Değişimi
MoodysG Moodys Kredi Notu Değişimi
MoodysO Moodys Görünüm Değişimi
VIX Volatilite Endeksi
VAR analizine göre, analiz sonuçlarının güvenilir olması için, analizde kullanılan
serilerin durağanlığının sağlanması gereklidir. Tablo 1’deki değişkenler EMBIG ve
Spread değişkenleri durağan olmadığından bu değişkenlerin durağan olan ilk
farkları analiz sürecinde kullanılmıştır. Durağanlık testlerinden sonra gecikme
uzunluğunun tespiti için Akaike, Hannan-Quinn ve Schwarz kriterlerinden
yararlanılarak en uygun gecikme uzunlukları bulunmaya çalışılmıştır. Elde edilen
gecikme uzunluklarıyla kredi not veya görünüm değişimi ile tahvil spread
değişimleri arasında ikili VAR modelleri tahmin edilmiştir. Kredi notu değişimi ve
görünüm değişimi piyasaya farklı bilgiler sunduğundan VAR modelleri ayrı ayrı
tahmin edilmiştir. VAR analizi sonucunda elde edilen bulgulara göre kredi notu
veya görünüm değişimleri ve bunları gecikmeli değerleri Türkiye’nin devlet tahvil
spreadlerinde üzerinde istatistiki olarak bir önemi yoktur. Böyle bir sonucun
yıkması özellikle 2008 küresel kriz sonrasında oluşan güvensizlik ortamında
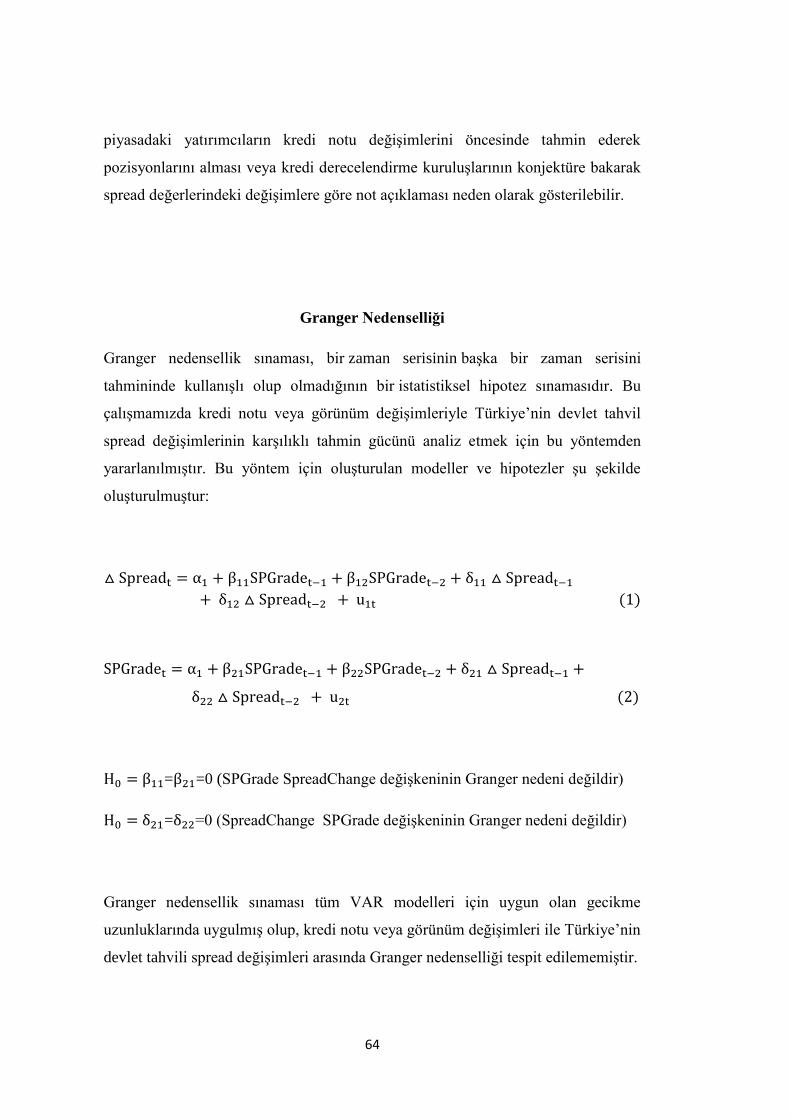
64
piyasadaki yatırımcıların kredi notu değişimlerini öncesinde tahmin ederek
pozisyonlarını alması veya kredi derecelendirme kuruluşlarının konjektüre bakarak
spread değerlerindeki değişimlere göre not açıklaması neden olarak gösterilebilir.
Granger Nedenselliği
Granger nedensellik sınaması, bir zaman serisinin başka bir zaman serisini
tahmininde kullanışlı olup olmadığının bir istatistiksel hipotez sınamasıdır. Bu
çalışmamızda kredi notu veya görünüm değişimleriyle Türkiye’nin devlet tahvil
spread değişimlerinin karşılıklı tahmin gücünü analiz etmek için bu yöntemden
yararlanılmıştır. Bu yöntem için oluşturulan modeller ve hipotezler şu şekilde
oluşturulmuştur:
= =0 (SPGrade SpreadChange değişkeninin Granger nedeni değildir)
= =0 (SpreadChange SPGrade değişkeninin Granger nedeni değildir)
Granger nedensellik sınaması tüm VAR modelleri için uygun olan gecikme
uzunluklarında uygulmış olup, kredi notu veya görünüm değişimleri ile Türkiye’nin
devlet tahvili spread değişimleri arasında Granger nedenselliği tespit edilememiştir.

65
Etki-Tepki Fonksiyonları
Etki-tepki fonksiyonları, rassal hata terimlerinden birindeki bir standart sapmalık
sokun, içsel değişkenlerin şimdiki ve gelecekteki değerlerine olan etkisini yansıtır.
Etki-tepki fonksiyonları sayesinde sisteme içsel şoklar vererek bu şokların diğer
değişkenler üzerindeki etkisini inceleme fırsatı buluyoruz. Bizim çalışmamızda
kredi notu veya görünüm değişimlerini sisteme şoklayarak Türkiye’nin kamu tahvil
spread değişimleri üzerindeki hareketliliği tespit edebiliyoruz. Özet olarak bu metot
bize kredi notu veya görünüm değişimlerinin tahvil spread değişimleri için ne kadar
önem arz ettiğini görmemizi sağlıyor. Türkiye’nin 5 yıllık kamu tahvil spread
değişimlerini inceleyecek olursak Şekil 1’de görüldüğü gibi kredi notu veya
görünüm değişimlerinin tahvil spread değişimlerine etkisinin çok olmadığı ve
verilen şokun etkisinin kısa sürede söndüğünü görüyoruz. Bu metotla elde edilen
bulgular piyasa beklentisi (market anticipation) ve konjonktürü takip etme
(procyclicality) konseptlerini destekleyici nitelikte olup bu konudaki son metot
olarak olay çalışması (event study) uygulanmıştır.
SpreadChange vs SPGrade SpreadChange vs SPOutlook
Şekil B.1 Spread Değişimlerinin Kredi Notu / Görünüm Değişimlerine Tepkisi
-.04
-.02
0
.02
.04
0 2 4 6 8
Response of SpreadChange to SPGrade
95% CI orthogonalized irf
step
-.04
-.02
0
.02
0 2 4 6 8
Response of SpreadChange to SPOutlook
95% CI orthogonalized irf
step
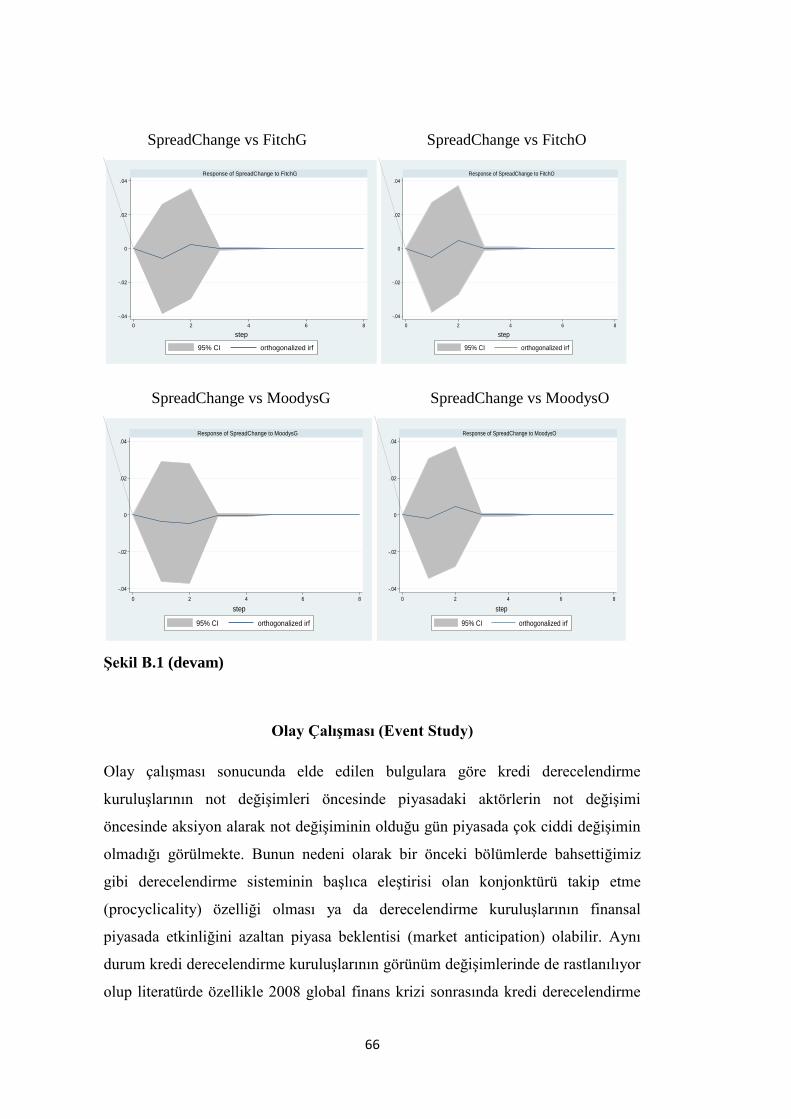
66
SpreadChange vs FitchG SpreadChange vs FitchO
SpreadChange vs MoodysG SpreadChange vs MoodysO
Şekil B.1 (devam)
Olay Çalışması (Event Study)
Olay çalışması sonucunda elde edilen bulgulara göre kredi derecelendirme
kuruluşlarının not değişimleri öncesinde piyasadaki aktörlerin not değişimi
öncesinde aksiyon alarak not değişiminin olduğu gün piyasada çok ciddi değişimin
olmadığı görülmekte. Bunun nedeni olarak bir önceki bölümlerde bahsettiğimiz
gibi derecelendirme sisteminin başlıca eleştirisi olan konjonktürü takip etme
(procyclicality) özelliği olması ya da derecelendirme kuruluşlarının finansal
piyasada etkinliğini azaltan piyasa beklentisi (market anticipation) olabilir. Aynı
durum kredi derecelendirme kuruluşlarının görünüm değişimlerinde de rastlanılıyor
olup literatürde özellikle 2008 global finans krizi sonrasında kredi derecelendirme
-.04
-.02
0
.02
.04
0 2 4 6 8
Response of SpreadChange to FitchG
95% CI orthogonalized irf
step
-.04
-.02
0
.02
.04
0 2 4 6 8
Response of SpreadChange to FitchO
95% CI orthogonalized irf
step
-.04
-.02
0
.02
.04
0 2 4 6 8
Response of SpreadChange to MoodysG
95% CI orthogonalized irf
step
-.04
-.02
0
.02
.04
0 2 4 6 8
Response of SpreadChange to MoodysO
95% CI orthogonalized irf
step

67
kuruluşlarının finans piyasasındaki yatırımcıların gözündeki güvenilirliğini
kaybettiği üzerine tartışmalar başlamıştı. Yapmış olduğumuz bu çalışmayla 2008
global krizi sonrasında kredi derecelendirme kuruluşlarının Türkiye’nin kamu
borçlanma maliyetleri üzerinde etkin olmadığı sonucuna ulaşılmıştır. Bu konuda
yapmış olduğumuz çalışmaların sonucuna göre Şekil 2’deki grafiklerden görüleceği
gibi not değişimin olduğu gün olan 11. günün öncesinde tahvilin getirisinin 11.
güne göre azaldığı ya da arttığını görebiliyoruz. Grafiğin sağ eksenine göre
ayarlanmış yeşil çizgi not ve görünüm değişimlerini gösteriyor olup, grafiğin sol
eksenine göre ayarlanmış kırmızı çizgi göreceli tahvil getirilerini temsil etmekte.
Şekil B.2 Olay Çalışması Analizi
9
9,5
10
10,5
11
-2,5
-2
-1,5
-1
-0,5
0
0,5
1
1,5
1 2 3 4 5 6 7 8 9 10 11 12 13 14 15 16 17 18 19 20 21
Gö
rece
li Ta
hvi
l Ge
tiri
si
Pencere
Not Artışı
Bond Return
Rating Scale
-0,4
-0,2
0
0,2
0,4
0,6
0,8
-0,06
-0,05
-0,04
-0,03
-0,02
-0,01
0
1 2 3 4 5 6 7 8 9 101112131415161718192021
Gö
rece
li Ta
hvi
l Ge
tiri
si
Pencere
Görünüm Artışı
Bond Return
Rating Scale
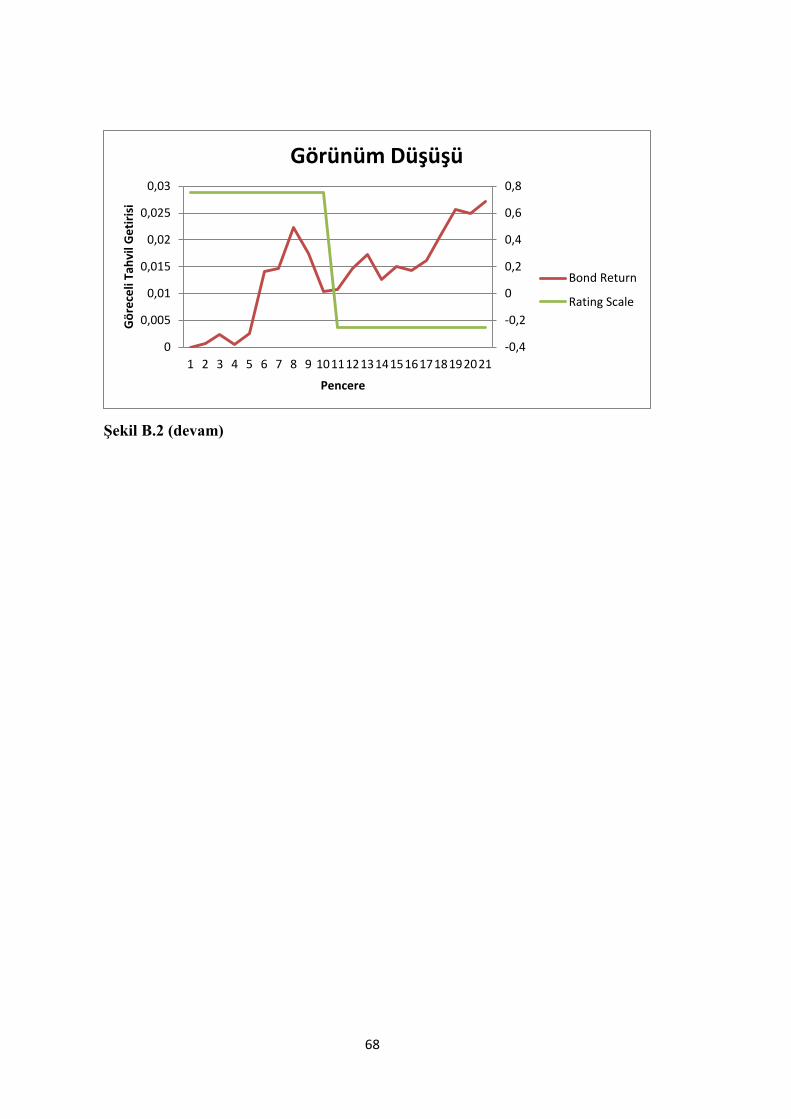
68
Şekil B.2 (devam)
-0,4
-0,2
0
0,2
0,4
0,6
0,8
0
0,005
0,01
0,015
0,02
0,025
0,03
1 2 3 4 5 6 7 8 9 101112131415161718192021
Gö
rece
li Ta
hvi
l Ge
tiri
si
Pencere
Görünüm Düşüşü
Bond Return
Rating Scale

69
SONUÇ
Bu çalışmaya başlarken merak etmiş olduğumuz 2008 küresel finans krizi
sonrasında kredi derecelendirme kuruluşlarının yatırımcıların gözündeki
güvenilirliğinin azalıp azalmadığına ilişkin sorunun cevabı olarak kredi
derecelendirme kuruluşlarının yapmış olduğu not değişimlerinin Türkiye’nin kamu
borçlanma maliyetlerine etkisinin olup olmadığı incelenmiştir. Bu kapsamda ele
almış olduğumuz veri setinde VAR modeli, Granger nedenselliği sınaması, Etki-
tepki analizi ve Olay çalışmaları uygulanmıştır. Bu çalışmalar sonucunda elde
edilen en önemli bulgular şu şekilde olmuştur:
VAR modeli, Granger nedenselliği sınaması, Etki-tepki analizi ve olay çalışması
sonucunda elde edilen bulgulara göre kredi notu değişimleri Türkiye’nin kamu
tahvili spreadlerinde istatistiki olarak değişime neden olmadığı; not değişimi
öncesinde piyasa oyuncularının gerekli hamleleri yaparak not değişimin etkisini
azalttığı sonucuna varılmıştır. Bu durumun karşılığı olaraksa literatürde iki
durumdan söz ediliyor. Bunlardan ilki market beklentisinden dolayı (market
anticipaiton) piyasa katılımcıları not değişimini beklediği için not değişiminin
olduğu gün öncesinde gerekli pozisyonları aldığı. Diğer açıklama ise kredi
derecelendirme kuruluşlarının konjonktürü (procyclicality) takip ettiği yönündeki
görüş; yani kredi derecelendirme kuruluşları piyasa koşullarına bakarak oluşan
piyasa koşullarına geç tepki vererek piyasanın gerisinde kalması. Bu açıklamalar
çerçevesinde özellikle 2008 küresel krizi sonrasında piyasada oluşan belirsizlikten
ötürü piyasa katılımcılarının Türkiye’nin kamu tahvilleri için kredi notu
değişimlerini çok dikkate almadığı sonucuna varabiliriz.

70
APPENDIX C
TEZ FOTOKOPİSİ İZİN FORMU
ENSTİTÜ
Fen Bilimleri Enstitüsü
Sosyal Bilimler Enstitüsü
Uygulamalı Matematik Enstitüsü
Enformatik Enstitüsü
Deniz Bilimleri Enstitüsü
YAZARIN
Soyadı : GÜRER Adı : MURAT Bölümü : İKTİSAT
TEZİN ADI (İngilizce) : THE IMPACT OF CREDIT RATING CHANGES ON
THE GOVERNMENT COST OF BORROWING IN TURKEY
TEZİN TÜRÜ : Yüksek Lisans Doktora
1. Tezimin tamamından kaynak gösterilmek şartıyla fotokopi alınabilir.
2. Tezimin içindekiler sayfası, özet, indeks sayfalarından ve/veya bir bölümünden kaynak gösterilmek şartıyla fotokopi alınabilir.
3. Tezimden bir bir (1) yıl süreyle fotokopi alınamaz.
TEZİN KÜTÜPHANEYE TESLİM TARİHİ:
x
X
X