the impact of class size on student evaluationsecon.ucsb.edu/~kelly/ucsb4.pdfclass size effects on...
TRANSCRIPT
Where Class Size Really Matters: Class Size and Student Ratings of Instructor Effectiveness
Kelly Bedard and Peter Kuhn* Department of Economics
University of California, Santa Barbara
August 2005 Abstract We examine the impact of class size on student evaluations of instructor performance using data on all economics classes offered at the University of California, Santa Barbara from Fall 1997 to Spring 2004. A particular strength of this data is the opportunity to control for both instructor and course fixed effects. In contrast to the literature examining class size effects on test-based outcomes – where results can vary considerably across specifications – we find a large, highly significant, and nonlinear negative impact of class size on student evaluations of instructor effectiveness that is highly robust to the inclusion of course and instructor fixed effects. * Please direct all inquiries to Kelly Bedard at [email protected]. We thank Irene Altman for assistance in assembling the data.
1
1. Introduction
There is a longstanding debate regarding the return to small classes, especially in
elementary and secondary education. In our reading, recent reviews of this literature (for
example Hanushek (2003) and Krueger (2003)) suggest that (a) results can depend
considerably on econometric specification, and (b) the profession has not yet reached a
consensus estimate of the impact of class size on student performance.
Compared to the above literature, research on class size effects at the college level
is much more limited. In one sense, this is surprising since the range of college class
sizes dwarfs the typical range of primary and secondary class sizes: at many institutions,
class sizes range from four or five students to five hundred or more. Even when the a
course is taught by the same instructor, class size can vary considerably from semester to
semester. Thus, college courses may constitute a relatively under-exploited laboratory
from which to infer class size effects. Further, if class sizes do matter in higher
education, this huge size variation might be some cause for concern. Indeed, the
perception that college class size matters appears to be widespread: parents seem willing
to pay a large tuition premium for small class sizes.
Existing research on postsecondary class size effects focuses on two outcome
measures: course grades and test scores. Like the literature on primary and secondary
education, this literature is perhaps best characterized as not having reached a consensus.
For example, Gramlich and Greenlee (1993) and Stratton, Myer, and King (1994) find
little or no evidence of a relationship between class size and course grades in introductory
and intermediate college economics courses. These results are confirmed by Saunders
(1980) and Kennedy and Siegfried (1997) using a different outcome measure: scores on
2
the Test of Understanding College Economics (TUCE) exam. In contrast, using the same
data as Kennedy and Sigfried (1997), Lopus and Maxwell (1995) find a positive
relationship between class size and student performance on the TUCE III exam.1 In a
similar vein, Raimondo, Esposito, and Gershenberg (1990), find no relationship between
introductory microeconomics class size and subsequent performance in intermediate
microeconomics, but do find a negative relationship between introductory
macroeconomics class size and subsequent performance in intermediate
macroeconomics.
The often somewhat contradictory results found in the college class size literature
may at least partly reflect three important complexities. First, test score-based
performance measures may lead to quite different estimates when different tests,
measuring different skills, are used. Secondly, while one might be tempted to think that
this issue can be avoided by using contemporaneous course grades, this is a highly
questionable approach since grades are generally at the discretion of the instructor.2 And
thirdly, introductory class size may have a differential impact on immediate performance
at the end of the introductory course of interest compared to the longer run impact on
intermediate, or even advanced, level performance. Thus, estimates may be sensitive to
the timing of measurement. Further, it is somewhat difficult to determine which “post”
course to match with which “pre” course, and attrition between these courses is likely
nonrandom.
1 The contradictory conclusions of these two studies may stem from differences in the level of analysis (student level scores versus class averages), different definitions of class size, and/or different control vector specifications. 2 In some cases, such as Gramlich and Greenlee (1993), this is not of particular concern since the data being analyzed is from a school using common exams and grading policies across multiple sections at the same university. In other words, instructors have very little discretion over student grades.
3
Given the difficulties associated with estimating the impact of class size on
student performance using test scores and course grades, it seems reasonable to ask
whether other measures of course quality exist. In this paper, we examine such a
measure that is peculiar to postsecondary education: Unlike grade-school and high
school students, college students are routinely asked to rate their instructors’
effectiveness using a standardized questionnaire. While conceptually distinct from the
above measures –which explicitly attempt to measure knowledge acquisition–, these
measures both (a) have some intrinsic interest, and (b) if correlated with actual learning,
have some important advantages over existing test-based measures of learning. In
particular, since standardized instructor ratings are typically available for all courses
taught at a university, sample sizes can be much larger than in studies where a course-
specific post-test is used. Thus, results can be generated that are broadly representative
of course size effects in undergraduate education, rather than for a particular level of
instruction in a particular discipline (typically introductory economics). In addition, it is
not clear whether students’ evaluations provide a worse or better measure of the extent to
which courses impart economically useful, labor-market-related skills, than test scores
do.
To date, only a few studies of college class size and student ratings exist. Among
these, McConnell and Sosin (1984), DeCanio (1986), and Siegfried and Walstad (1990)
find that students dislike larger classes. However, their results may confound the effects
of class size and instructor quality since, for example, department chairs might
4
systematically assign better instructors to larger (or smaller) classes.3 Existing estimates
may also confound course size and course difficulty, since college administrators may
make an effort to assign smaller class sizes when the subject matter is more difficult. In
this paper we confront both these problems by using data that allow us to control for both
instructor and course fixed effects.4 More specifically, we use student evaluations of
instructor performance in all economics classes offered at the University of California,
Santa Barbara (UCSB) from Fall 1997 to Spring 2004, which includes multiple
observations per instructor across the entire range of courses and class sizes. To the best
of our knowledge, no study of college-level course evaluations has used such a fixed
effects approach.
In contrast to the results for test-based outcomes at both primary/secondary and
college levels, our estimates of the impact of class size on student evaluations of
instructor effectiveness are remarkably consistent across pooled cross-section, instructor
fixed effect, and instructor-and-course fixed effect specifications. Under all of these
specifications, and using a variety of sampling rules and class size functional forms we
consistently find a large, nonlinear, and statistically significant negative impact of class
size on student evaluations. Perhaps this explains, at least in part, the high value
apparently placed by parents and college-rating agencies on college class size.
The remainder of the paper is organized as follows. The next section describes
the student evaluation data used in this study. Section 3 presents a preliminary analysis
3 This problem could potentially be quite severe since (as shown by Aigner and Thum (1986)), the major explanation for differences in instructor ratings in cross-sections is instructor style and student perceptions of instructor ability. 4 Another possible concern that is addressed by our fixed-effects approach is the potential correlation between instructors’ grading standards and student evaluations of instructor effectiveness. Since our approach only compares classes taught by the same instructor it is not affected by the possibility that some instructors receive higher evaluations simply because they have lower grading standards.
5
of the data. Section 4 describes the econometric approach. Section 5 reports the results
and Section 6 concludes.
2. Student Evaluation Data
As noted, the data for this study include all economics classes offered at UCSB
from Fall 1997 to Spring 2004: During this period 655 economics courses were offered
by 64 instructors. Our data include information about class size (enrollment),5 the
number of students who completed the evaluation form, the quarter (fall, winter, or
spring) the year that each course was offered, the level of the class (lower division, upper
division, Master’s, or PhD), whether or not the course is a program requirement, the
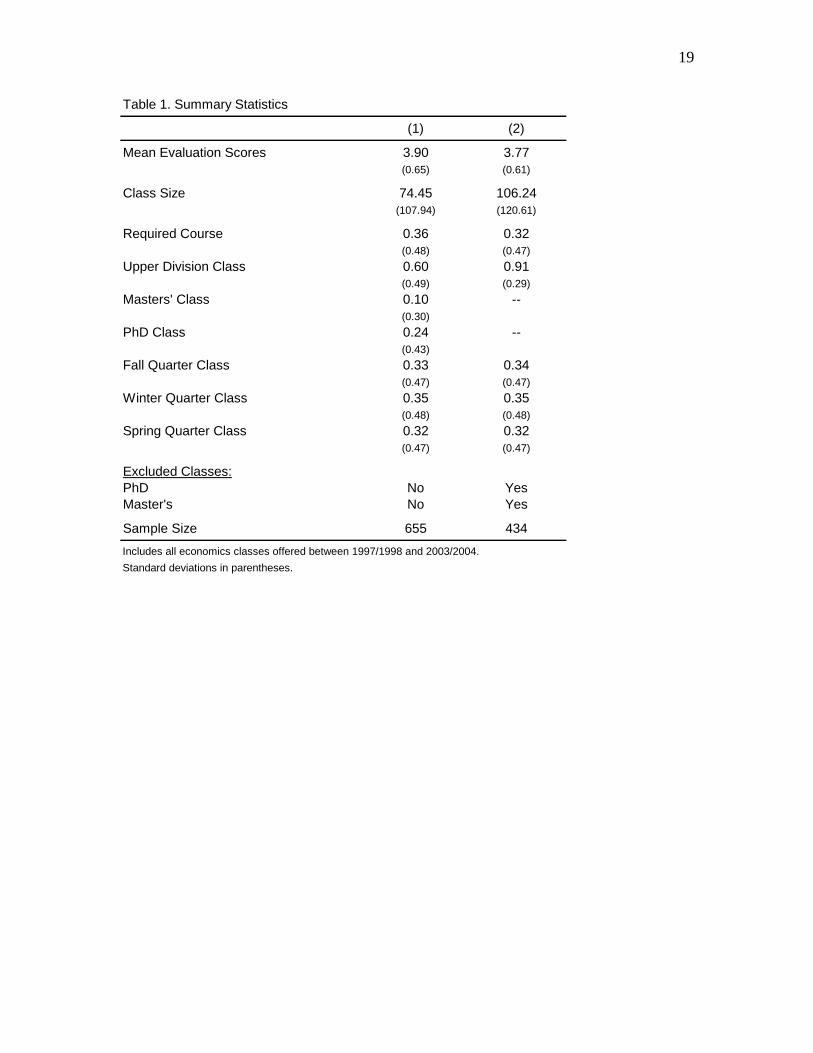
instructor, and the average evaluation score. Summary statistics for all variables are
reported in Table 1. For our purposes, class size, the average evaluation score, and the
instructor are the most important variables. As such, we will discuss each of these in
turn.
Class size is defined as the number of students enrolled in the class as of the third
week of the quarter. Throughout this paper we will use a variety of class size
specifications to explore the relationship between class size and student evaluations of
instructor effectiveness. In particular, we will use linear, quadratic, and cubic
specifications for class size, as well as categorical class size indicators to allow for the
flexible estimation of any non-linearity in the relationship between class size and student
evaluations of instructor effectiveness.
5 It is important to use enrollment to measure class size rather than the number of students filling out the evaluation form as the later is endogenous and may render a biased estimate.
6
Since the natural unit of observation is at the class level, student evaluation scores
are aggregated to class means.
1tciR
tcijjtci
tci
eE
R==
∑ (1)
where e denotes individual student evaluation scores, E is the average class evaluation
score, R is the number of evaluation responses, t denotes year t = 1997,…,2004), c
denotes course, and i denotes instructor. Three features of the data warrant comment.
First, the student evaluation question that we are using reads as follows: “Please rate the
overall quality of the instructor’s teaching.” Second, the possible responses to this
question are, (1) poor, (2) fair, (3) good, (4) very good, and (5) excellent.6 Third, the
number of responses (R) differs from class size, or enrollment, due to absenteeism on the
day that evaluations are administered, late withdrawals from the course, voluntary non-
response, and students auditing courses (this is mostly relevant for graduate courses).
Finally, the course evaluation summary forms include the course number and
instructor of record. As discussed in Section 1, these are important because they allow us
to estimate instructor fixed effects models that control for time-invariant instructor
heterogeneity and instructor and course fixed effects models that control for both
instructor and course-specific heterogeneity.
3. Descriptive analysis
Before turning to the more formal analysis presented in the next section, it is
instructive to examine the raw mean evaluation scores across the distribution of class
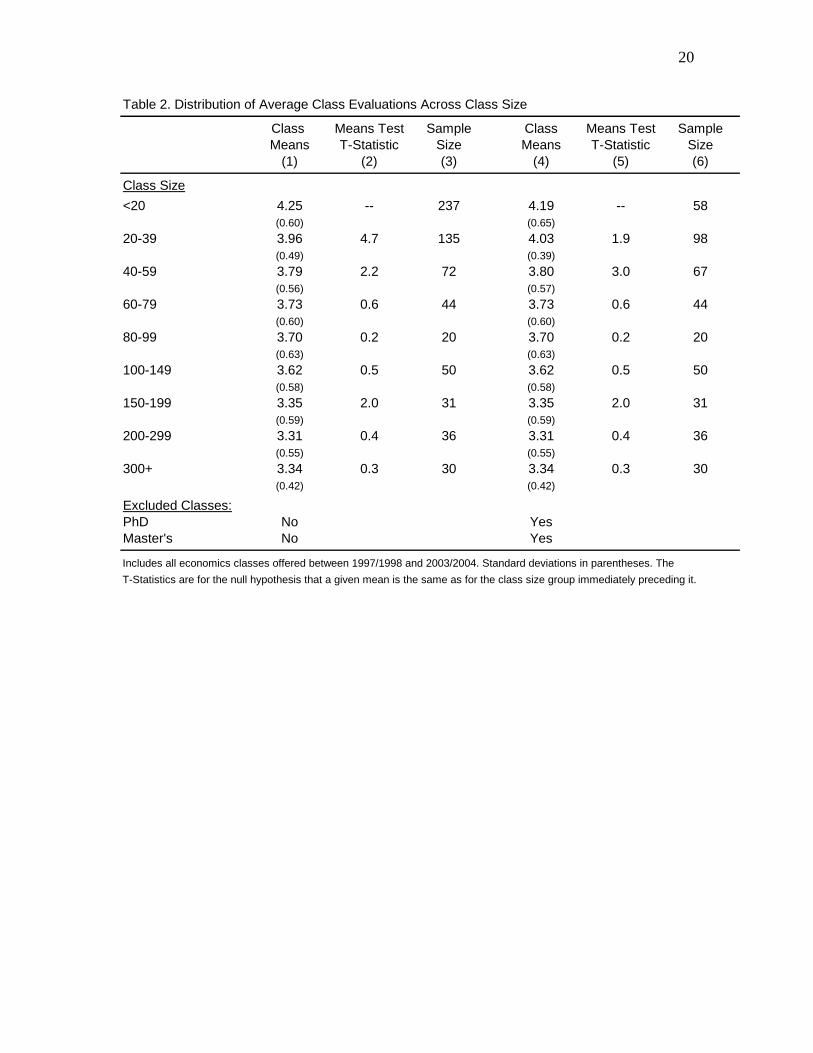
sizes. To facilitate this exercise, Table 2 reports the mean average evaluation score for 6 UCSB scores actually run from (1) excellent to (5) poor, but we have reversed them for interpretive ease.
7
classes size 1-19, 20-39, 40-59, 60-79, 80-99, 100-149, 150-199, 200-299, and 300+.
These cut-offs were chosen to ensure that all groups have reasonable sample size.
However, we experimented with several other group definitions and obtained similar
results.
The first three columns report the mean average evaluation score, test statistics for
the null hypothesis that a given mean is the same as the mean of the immediately
preceding class size group, and the sample size. The results reported in these columns
clearly show that there are large reductions in mean evaluation scores as class size rises
from 1-19 to 20-39 and from 20-39 to 40-59. At this point, scores become quite flat until
class size jumps over 150 students and then there is another 0.3 drop in the mean
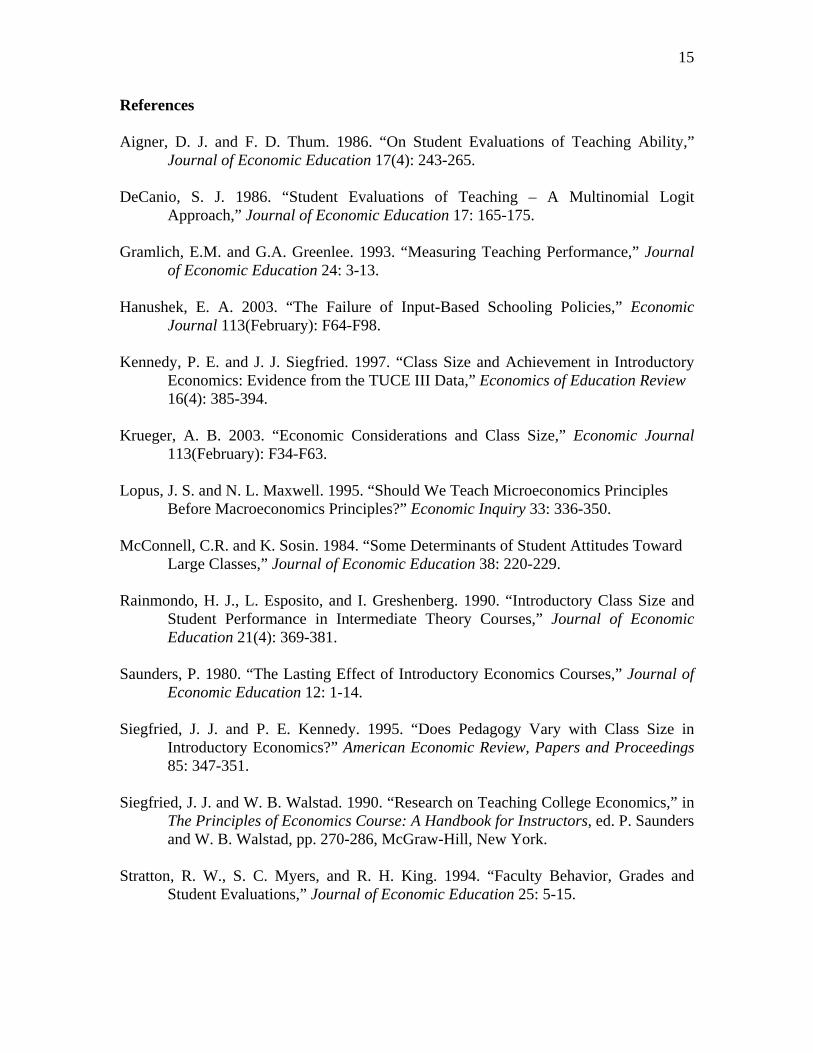
evaluation score. The general shape of the relationship between student evaluations and
class size can also be seen by simply plotting average student evaluation scores against
class size (see Figure 1). What may be somewhat surprising to many readers is that there
is no statistically significant evidence that increasing class size from 40-59 to 60-79, 80-
99, or even to 100-149 decreases student evaluations. This is an interesting finding given
that many of our colleagues believe that students dislike the jump from mid-sized classes
(40-79) to small lecture halls (100-149).
To ensure that these results are not driven by the inclusion of graduate courses,
columns 4-6 replicate columns 1-3 excluding Master’s and PhD classes from the sample.
While the average scores from small classes are somewhat lower once graduate classes
are excluded, the overall pattern is very similar.

8
4. A Basic Fixed Effects Model
While the results reported in Table 2 are suggestive of lower student evaluations
in large classes, they are not conclusive evidence since the raw mean differences do not
control for observables or time-invariant unobservables. For example, they will be biased
if instructors with different levels of teaching ability are assigned to classes of different
size. Since we know which instructors are teaching which classes, we can purge our
estimates of this type of bias using a fixed effects model.
The objective is to estimate the impact of class size on average student
evaluations. Let,
( )yci i yci yci yciE f S Xα β φ= + + + ε (2)
where a is a vector of instructor fixed effects, f(S ) is some function of class size (i.e.
linear, quadratic, cubic, or a set of indicator variables), X includes the time-varying
characteristics defined in Table 1, and ε is the usual error term. All models are weighted
by the square root of the number of student evaluation form responses per class to
address the heteroskedasticity resulting from the aggregation of individual outcomes.
An attractive feature of this panel specification is that the instructor fixed effects
allow us to purge the class size estimate of any potential bias induced by time-invariant
instructor heterogeneity. Although Siegfried and Kennedy (1995) find no evidence that
department chairs assign better instructors to large introductory economics classes (which
are generally the largest courses offered), our ability to include instructor fixed effects
across all economics classes ensures that any non-random assignment across economics
classes at large, based on instructor quality, are not biasing the estimated impact of class
size on student evaluations.
9
The model described by equation (2) has three major advantages over most of the
previously estimated models in the literature. First, as discussed above, the panel nature
of our data allows for the inclusion of instructor fixed effects. This is important because
instructors differ across important margins such as teaching ability and grading schemes.
Secondly, the pooling across courses and years ensures a sufficient sample size to allow
for the use of a variety of flexible class size functional forms. This is important because
there is no reason to believe that the relationship between student evaluations and class
size are linear, or even quadratic. In fact, as we will see in Section 5, the relationship
between student evaluations and class size is initially quite steeply negative, subsequently
becomes rather flat, and beyond 250 students may even rise slightly. Third, for the
substantial subset of the courses that are taught by more than one instructor during the
sample period we can also include course fixed effects to equation (2) to control for
course heterogeneity on such margins as difficulty and average student interest in
particular subject matters.
5. Results
The core set of results for the impact of class size on average student evaluations
of instructor effectiveness are reported in Table 3. The first pair of columns report the
pooled cross-section results. Column 1 specifies class size as a cubic function and
column 2 specifies it as a set of a flexible set of indicator variables. Although not
reported, all cross-section models also include indicators for required courses, upper
division courses, Master’s level courses, and PhD courses, as well as quarter and year
indicators. Focusing on the results reported in column 2, as class size initially rises from

10
1-19 to 20-39 and 40-59 average student evaluations fall by 0.17 and then another 0.19
(for a total of 0.36 lower than the 1-19 class size group). The initial decline then slows to
–0.05 as class size increases from 40-59 to 60-79 and then actually becomes positive,
+0.10, as class size increases from 60-79 to 80-99 before resuming its decline.
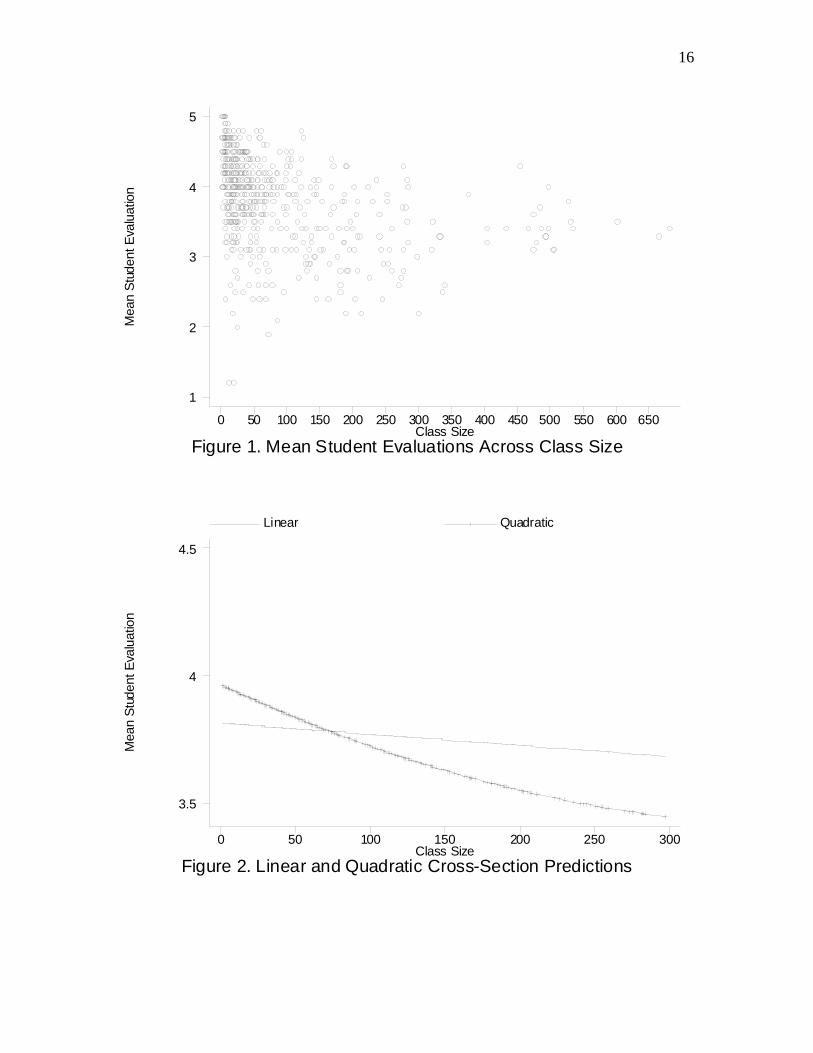
It is easier to describe the relationship between class size and class evaluations
graphically. For comparative purposes, Figure 2 begins by plotting the predicted mean
evaluations by class size based on a standard cross-sectional model with linear and
quadratic class size specifications. The solid line uses a linear class size specification and
the hatched line uses a quadratic function (all class size coefficients used in Figures 2-4
are reported in Appendix Table 1 and all figures are plotted for a non-required
undergraduate course in the fall of 2003). Comparing Figure 1 (a simple plot of the data)
and Figure 2 reveals the fact that a linear class size specification in a model that ignores
instructor heterogeneity matches the data very poorly. Further, the class size coefficient
reported in column 1 in Appendix Table 1 is extremely small and statistically imprecise.
This is the result of the fact that uncontrolled for instructor heterogeneity is biasing the
class size estimates as well as the fact that linearity is far too restrictive. The superior
description of the relationship between class size and evaluation scores as a quadratic
function rather than a linear function is clear from the hatched line in Figure 2 and the
much larger and statistically more precise class size estimates reported in column 2 in
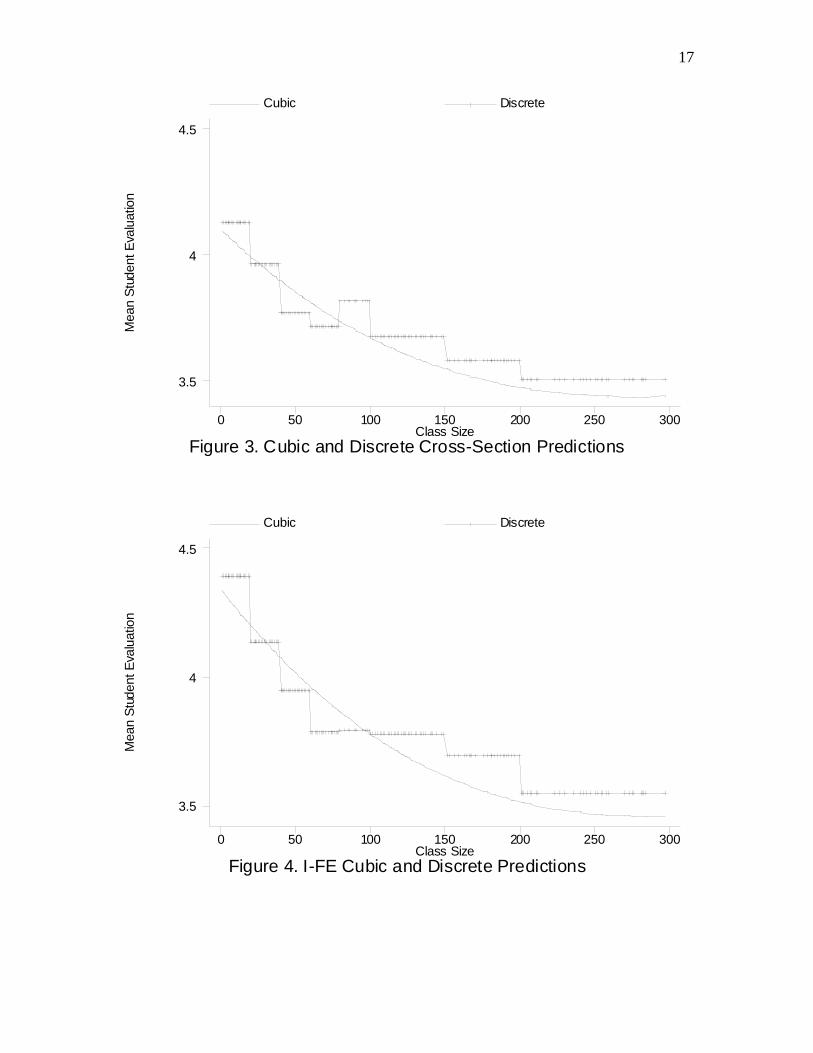
Appendix Table 1. However, even the quadratic is not sufficiently flexible. Figure 3
reports the estimates for the same cross-sectional model except that it includes the cubic
function class size reported in column 1 in Table 3 and the discrete class size dummies
11
defined in column 2 in Table 3. Figure 3 makes it clear that at least a cubic is required to
capture the sharp decline in evaluation scores for increases at small class sizes.
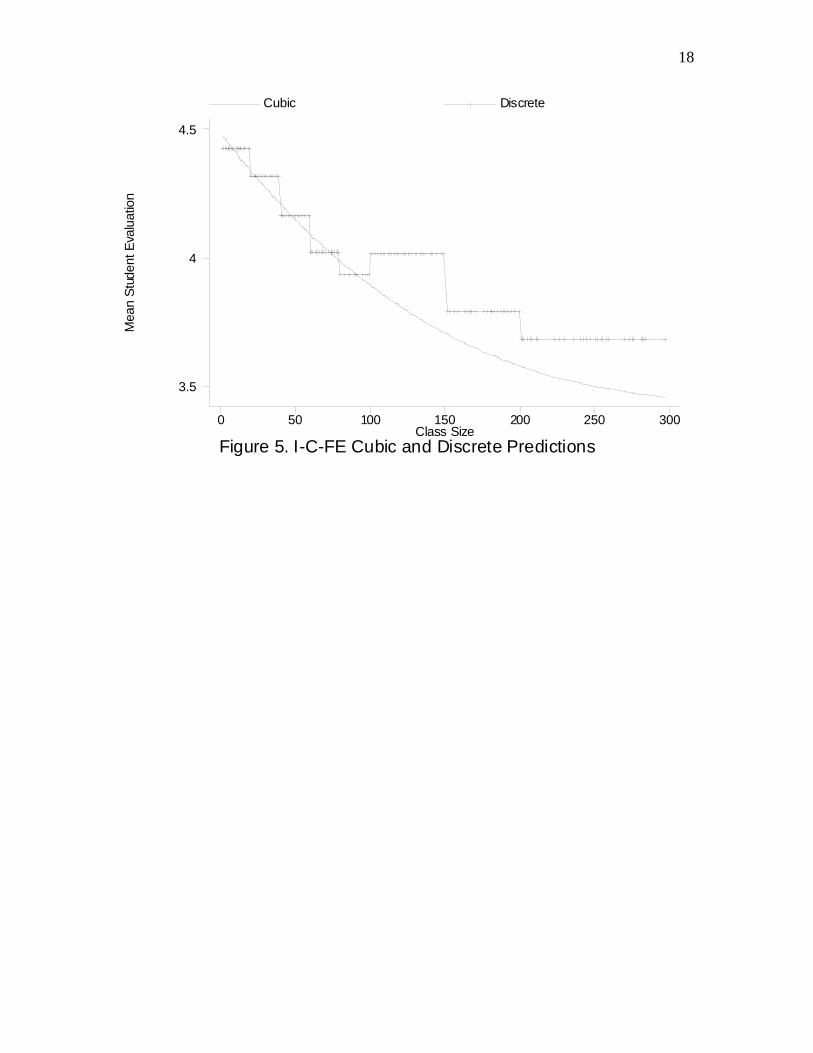
Columns 3 and 4 in Table 3 replicate columns 1 and 2 with the addition of
instructor fixed effects. Three features of the instructor fixed effects (I-FE) estimates
warrant comment. First, the sample is slightly smaller because instructors only observed
once during the sample period are excluded from the I-FE sample. Second, once time-
invariant instructor heterogeneity has been accounted for it is clear that omitted variables
bias flattens out the cross-sectional point estimates for the relationship between student
evaluations of instructor effectiveness across class size. In particular, the I-FE point
estimates for initial losses in evaluation scores as class size increases (for classes <80) is
too flat as are the point estimates for evaluation score losses as class size increases for
very large classes (200+). In other words, the differences between the cross-section and
I-FE results are consistent with department chairs assigning “better” instructors to larger
classes. This is most easily be seen by comparing Figures 3 and 4. Third, while the point
estimates appear to differ across the cross-section and I-FE specifications these
differences are not generally statistically significant. As such, non-random assignment of
instructors across class size seems to mute or flatten out the estimated return class size in
only a minor way.
As a final check for time invariant omitted variables bias we re-estimate equation
(2) adding course fixed effects to the model that already includes instructor fixed effects
(I-C-FE).
( )yci i c yci yci yciE f S Xα γ β φ ε= + + + + (3)

12
where γ is a vector of course fixed effects. This model allows us to control for course
heterogeneity on such margins as difficulty and average student interest in particular
subject matters as well as instructor fixed effects. It is important to note that the sample
is considerably smaller for these models because instructors who taught only one course
are excluded as well as courses taught by a single instructor during the entire sample
period. These exclusions reduce the sample size to 459 observations.
The I-C-FE results using a cubic function of class size and a flexible set of class
size indicators are reported in columns 5 and 6 in Table 3. The main difference between
the cross-section, I-FE and I-C-FE models is most obviously apparent by comparing the
specifications that include class size indicator variables. Since many courses are capped
at the same size every year, due to department/instructor preferences, class formats such
as seminar versus lecture style, or room capacity, in the absence of course controls the
point estimates for class size are somewhat overstated, for all but large lecture hall sized
classes. This most likely arises because more difficult courses, econometrics and
advance theory for example, and seminar style classes are more likely to attract more
motivated students, be of smaller size, and have higher student evaluations. As a result,
the omission of course fixed effects leads to exaggerated class sized coefficient estimates.
Although, once again the point estimates from the three specifications are not statistically
distinguishable from each other in most cases.
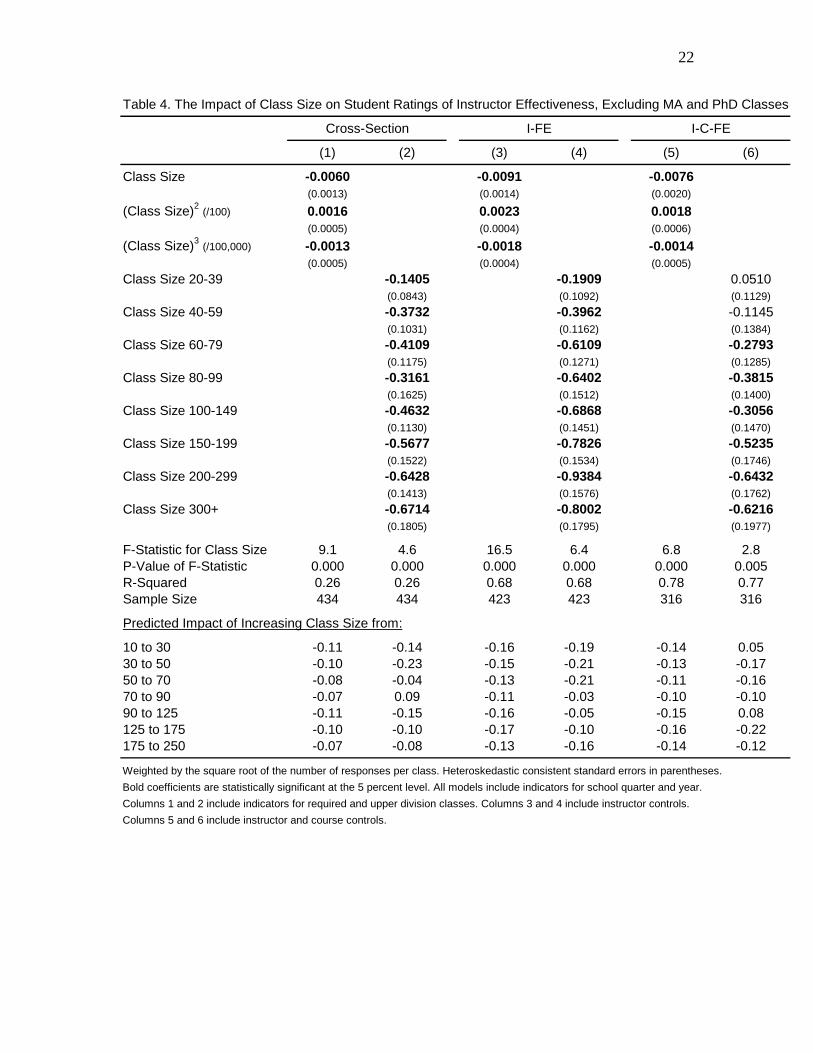
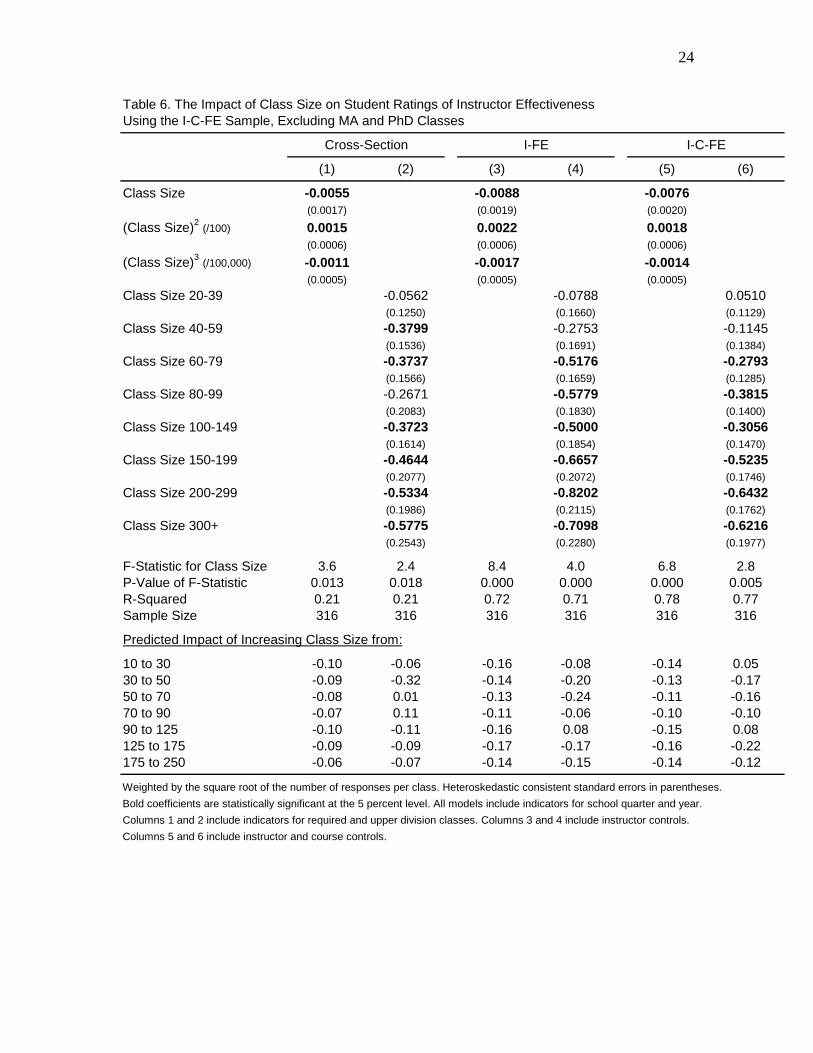
As a check that the results are not being driven by sample rules we run two sets of
sensitivity analysis. First, we replicate Table 3 excluding Master’s and PhD classes from
the sample. The results are reported in Table 4. Under all specifications the results are
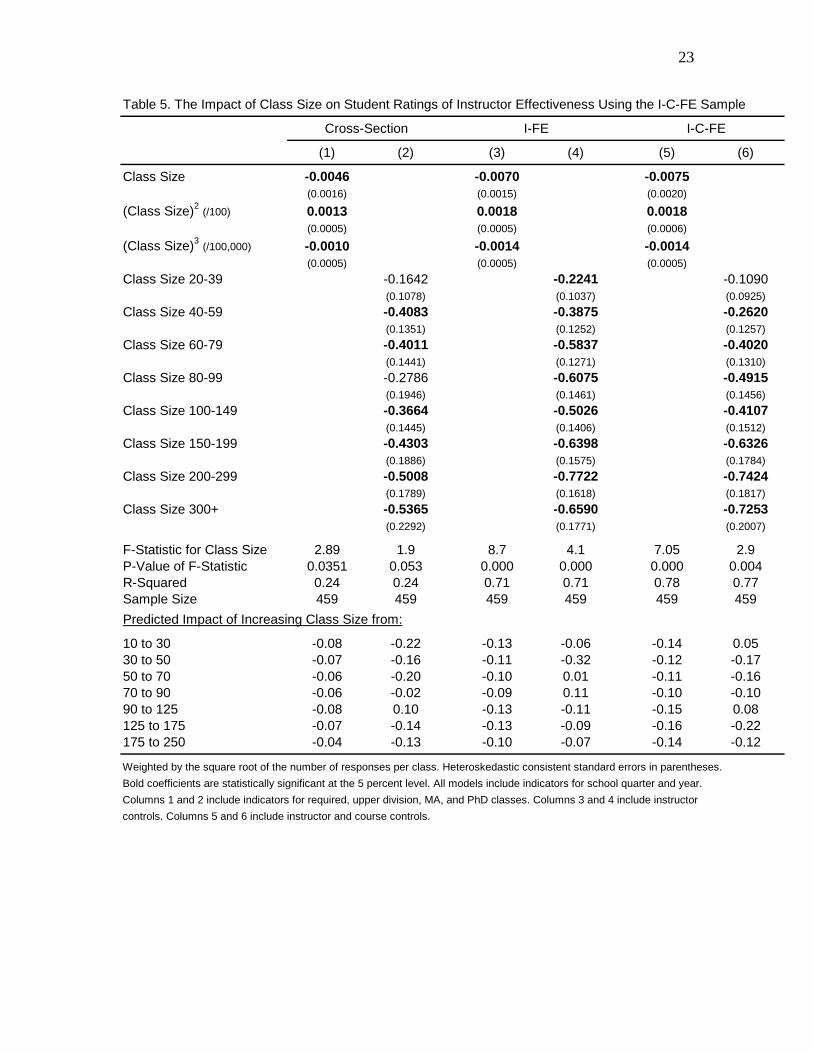
similar to the comparable previously reported point estimates. Second, we replicate
13
Table 3 using a single sample to ensure that the differences in the cross-section, I-FE, and
I-C-FE point estimates are not driven by sample differences (see Tables 5 and 6). Again
the results are similar to those reported in Table 3.
Overall, it therefore appears that the simple pooled cross-section estimates are not
badly biased by the omission of time-invariant instructor and course controls. But that
accurately estimating the impact of class size on student evaluations of instructor
effectiveness does require a flexible functional form for class size, regardless of the
inclusion or exclusion of instructor and/or course fixed effects.
6. Conclusion
Estimates of the impact of class size on test-based outcomes, at all levels of
education from primary school through college, seem to depend to a large extent on the
econometric specification. In contrast, our estimates of the impact of class size on
student evaluations of instructor effectiveness are remarkably consistent across pooled
cross-section, instructor fixed effect, and instructor-plus-course fixed effect
specifications. In all cases we consistently find a large negative impact of class size on
student evaluations of instructor effectiveness using a representative sample that
encompasses economics courses at all college levels.
We view our results as important for at least three distinct reasons. First, class
size clearly matters for this particular educational outcome measure. Secondly, the non-
linearity in the impact of class size on student evaluations of instructor effectiveness
might be of interest to college administrators interested in raising their mean student
evaluations. For example, according to our step-function estimates, it is in classes with
14
less than 80 students where evaluations fall the fastest per additional student in a class.
This result may not be surprising to the many parents who pay substantially higher tuition
for small class sizes at elite private colleges, but may be somewhat surprising to public
university administrators and faculty. In contrast, if there is a range over which student
evaluations are somewhat insensitive to small increases in class size it is in the small
lecture hall range. Again according to our step-function estimates, the smallest
evaluation score losses per additional student are found in the 80-150 person lecture hall
range.7
Finally, the results may help university administrators better evaluate instructors:
high student evaluations may not imply better teaching performance if the high
evaluations are caused purely by small class size. Using the estimates in this paper it is
possible to adjust individual instructors’ evaluation scores for class size effects, allowing
for comparison across instructors teaching a different mix of courses.
7 Of course, according to our quadratic and cubic specifications, the marginal (negative) impact of an additional student on evaluations diminishes smoothly in absolute value with class size. This has the intriguing implication that an administrator wishing to maximize course-weighted mean of student evaluations, subject to assigning N students to K courses, should operate K-1 classes with a single student in each and place the remaining students in a single class. Maximizing the student-weighted mean is more complex: In the case where the elasticity of evaluations with respect to class size is constant, equal class sizes are optimal when this elasticity is less than one in absolute value. Extreme class size differentials are optimal when it exceeds one. Since our data imply an elasticity of about -0.25, an administrator attempting to maximize a student-weighted average of course evaluations should opt for equal sized classes. Derivations of all these results are available from the authors.
15
References
Aigner, D. J. and F. D. Thum. 1986. “On Student Evaluations of Teaching Ability,” Journal of Economic Education 17(4): 243-265. DeCanio, S. J. 1986. “Student Evaluations of Teaching – A Multinomial Logit Approach,” Journal of Economic Education 17: 165-175. Gramlich, E.M. and G.A. Greenlee. 1993. “Measuring Teaching Performance,” Journal of Economic Education 24: 3-13. Hanushek, E. A. 2003. “The Failure of Input-Based Schooling Policies,” Economic Journal 113(February): F64-F98. Kennedy, P. E. and J. J. Siegfried. 1997. “Class Size and Achievement in Introductory Economics: Evidence from the TUCE III Data,” Economics of Education Review
16(4): 385-394. Krueger, A. B. 2003. “Economic Considerations and Class Size,” Economic Journal 113(February): F34-F63. Lopus, J. S. and N. L. Maxwell. 1995. “Should We Teach Microeconomics Principles
Before Macroeconomics Principles?” Economic Inquiry 33: 336-350. McConnell, C.R. and K. Sosin. 1984. “Some Determinants of Student Attitudes Toward
Large Classes,” Journal of Economic Education 38: 220-229. Rainmondo, H. J., L. Esposito, and I. Greshenberg. 1990. “Introductory Class Size and Student Performance in Intermediate Theory Courses,” Journal of Economic Education 21(4): 369-381. Saunders, P. 1980. “The Lasting Effect of Introductory Economics Courses,” Journal of Economic Education 12: 1-14. Siegfried, J. J. and P. E. Kennedy. 1995. “Does Pedagogy Vary with Class Size in Introductory Economics?” American Economic Review, Papers and Proceedings 85: 347-351. Siegfried, J. J. and W. B. Walstad. 1990. “Research on Teaching College Economics,” in The Principles of Economics Course: A Handbook for Instructors, ed. P. Saunders and W. B. Walstad, pp. 270-286, McGraw-Hill, New York. Stratton, R. W., S. C. Myers, and R. H. King. 1994. “Faculty Behavior, Grades and Student Evaluations,” Journal of Economic Education 25: 5-15.
16
Mea
n St
uden
t Eva
luat
ion
Figure 1. Mean Student Evaluations Across Class SizeClass Size
0 50 100 150 200 250 300 350 400 450 500 550 600 650
1
2
3
4
5
Mea
n St
uden
t Eva
luat
ion
Figure 2. Linear and Quadratic Cross-Section PredictionsClass Size
Linear Quadratic
0 50 100 150 200 250 300
3.5
4
4.5
17
Mea
n St
uden
t Eva
luat
ion
Figure 3. Cubic and Discrete Cross-Section PredictionsClass Size
Cubic Discrete
0 50 100 150 200 250 300
3.5
4
4.5
Mea
n St
uden
t Eva
luat
ion
Figure 4. I-FE Cubic and Discrete PredictionsClass Size
Cubic Discrete
0 50 100 150 200 250 300
3.5
4
4.5
18
Mea
n St
uden
t Eva
luat
ion
Figure 5. I-C-FE Cubic and Discrete PredictionsClass Size
Cubic Discrete
0 50 100 150 200 250 300
3.5
4
4.5
19
Table 1. Summary Statistics
(1) (2)
Mean Evaluation Scores 3.90 3.77(0.65) (0.61)
Class Size 74.45 106.24(107.94) (120.61)
Required Course 0.36 0.32(0.48) (0.47)
Upper Division Class 0.60 0.91(0.49) (0.29)
Masters' Class 0.10 --(0.30)
PhD Class 0.24 --(0.43)
Fall Quarter Class 0.33 0.34(0.47) (0.47)
Winter Quarter Class 0.35 0.35(0.48) (0.48)
Spring Quarter Class 0.32 0.32(0.47) (0.47)
Excluded Classes:PhD No YesMaster's No Yes
Sample Size 655 434
Includes all economics classes offered between 1997/1998 and 2003/2004.Standard deviations in parentheses.
20
Table 2. Distribution of Average Class Evaluations Across Class Size
Class Means Test Sample Class Means Test SampleMeans T-Statistic Size Means T-Statistic Size
(1) (2) (3) (4) (5) (6)
Class Size<20 4.25 -- 237 4.19 -- 58
(0.60) (0.65)20-39 3.96 4.7 135 4.03 1.9 98
(0.49) (0.39)40-59 3.79 2.2 72 3.80 3.0 67
(0.56) (0.57)60-79 3.73 0.6 44 3.73 0.6 44
(0.60) (0.60)80-99 3.70 0.2 20 3.70 0.2 20
(0.63) (0.63)100-149 3.62 0.5 50 3.62 0.5 50
(0.58) (0.58)150-199 3.35 2.0 31 3.35 2.0 31
(0.59) (0.59)200-299 3.31 0.4 36 3.31 0.4 36
(0.55) (0.55)300+ 3.34 0.3 30 3.34 0.3 30
(0.42) (0.42)
Excluded Classes:PhD No YesMaster's No Yes
Includes all economics classes offered between 1997/1998 and 2003/2004. Standard deviations in parentheses. TheT-Statistics are for the null hypothesis that a given mean is the same as for the class size group immediately preceding it.

21
Table 3. The Impact of Class Size on Student Ratings of Instructor Effectiveness
(1) (2) (3) (4) (5) (6)
Class Size -0.0057 -0.0074 -0.0075(0.0012) (0.0011) (0.0020)
(Class Size)2 (/100) 0.0015 0.0020 0.0018(0.0005) (0.0004) (0.0006)
(Class Size)3 (/100,000) -0.0012 -0.0016 -0.0014(0.0004) (0.0004) (0.0005)
Class Size 20-39 -0.1651 -0.2544 -0.1090(0.0751) (0.0690) (0.0925)
Class Size 40-59 -0.3555 -0.4413 -0.2620(0.0950) (0.0834) (0.1257)
Class Size 60-79 -0.4093 -0.6048 -0.4020(0.1151) (0.1006) (0.1310)
Class Size 80-99 -0.3096 -0.5966 -0.4915(0.1559) (0.1245) (0.1456)
Class Size 100-149 -0.4499 -0.6104 -0.4107(0.1079) (0.1101) (0.1512)
Class Size 150-199 -0.5453 -0.6944 -0.6326(0.1463) (0.1174) (0.1784)
Class Size 200-299 -0.6199 -0.8395 -0.7424(0.1354) (0.1158) (0.1817)
Class Size 300+ -0.6512 -0.7037 -0.7253(0.1723) (0.1414) (0.2007)
F-Statistic for Class Size 9.1 4.4 17.5 7.8 7.1 2.9P-Value of F-Statistic 0.000 0.000 0.000 0.000 0.000 0.004R-Squared 0.29 0.29 0.67 0.67 0.78 0.77Sample Size 655 655 640 640 459 459
Predicted Impact of Increasing Class Size from:
10 to 30 -0.10 -0.17 -0.13 -0.25 -0.14 -0.1130 to 50 -0.09 -0.19 -0.12 -0.19 -0.12 -0.1550 to 70 -0.08 -0.05 -0.10 -0.16 -0.11 -0.1470 to 90 -0.07 0.10 -0.09 0.01 -0.10 -0.0990 to 125 -0.10 -0.14 -0.13 -0.01 -0.15 0.08125 to 175 -0.10 -0.10 -0.13 -0.08 -0.16 -0.22175 to 250 -0.06 -0.07 -0.09 -0.15 -0.14 -0.11
Weighted by the square root of the number of responses per class. Heteroskedastic consistent standard errors in parentheses.Bold coefficients are statistically significant at the 5 percent level. All models include indicators for school quarter and year.Columns 1 and 2 include indicators for required, upper division, MA, and PhD classes. Columns 3 and 4 include instructorcontrols. Columns 5 and 6 include instructor and course controls.
Cross-Section I-FE I-C-FE
22
Table 4. The Impact of Class Size on Student Ratings of Instructor Effectiveness, Excluding MA and PhD Classes
(1) (2) (3) (4) (5) (6)
Class Size -0.0060 -0.0091 -0.0076(0.0013) (0.0014) (0.0020)
(Class Size)2 (/100) 0.0016 0.0023 0.0018(0.0005) (0.0004) (0.0006)
(Class Size)3 (/100,000) -0.0013 -0.0018 -0.0014(0.0005) (0.0004) (0.0005)
Class Size 20-39 -0.1405 -0.1909 0.0510(0.0843) (0.1092) (0.1129)
Class Size 40-59 -0.3732 -0.3962 -0.1145(0.1031) (0.1162) (0.1384)
Class Size 60-79 -0.4109 -0.6109 -0.2793(0.1175) (0.1271) (0.1285)
Class Size 80-99 -0.3161 -0.6402 -0.3815(0.1625) (0.1512) (0.1400)
Class Size 100-149 -0.4632 -0.6868 -0.3056(0.1130) (0.1451) (0.1470)
Class Size 150-199 -0.5677 -0.7826 -0.5235(0.1522) (0.1534) (0.1746)
Class Size 200-299 -0.6428 -0.9384 -0.6432(0.1413) (0.1576) (0.1762)
Class Size 300+ -0.6714 -0.8002 -0.6216(0.1805) (0.1795) (0.1977)
F-Statistic for Class Size 9.1 4.6 16.5 6.4 6.8 2.8P-Value of F-Statistic 0.000 0.000 0.000 0.000 0.000 0.005R-Squared 0.26 0.26 0.68 0.68 0.78 0.77Sample Size 434 434 423 423 316 316
Predicted Impact of Increasing Class Size from:
10 to 30 -0.11 -0.14 -0.16 -0.19 -0.14 0.0530 to 50 -0.10 -0.23 -0.15 -0.21 -0.13 -0.1750 to 70 -0.08 -0.04 -0.13 -0.21 -0.11 -0.1670 to 90 -0.07 0.09 -0.11 -0.03 -0.10 -0.1090 to 125 -0.11 -0.15 -0.16 -0.05 -0.15 0.08125 to 175 -0.10 -0.10 -0.17 -0.10 -0.16 -0.22175 to 250 -0.07 -0.08 -0.13 -0.16 -0.14 -0.12
Weighted by the square root of the number of responses per class. Heteroskedastic consistent standard errors in parentheses.Bold coefficients are statistically significant at the 5 percent level. All models include indicators for school quarter and year.Columns 1 and 2 include indicators for required and upper division classes. Columns 3 and 4 include instructor controls.Columns 5 and 6 include instructor and course controls.
Cross-Section I-FE I-C-FE
23
Table 5. The Impact of Class Size on Student Ratings of Instructor Effectiveness Using the I-C-FE Sample
(1) (2) (3) (4) (5) (6)
Class Size -0.0046 -0.0070 -0.0075(0.0016) (0.0015) (0.0020)
(Class Size)2 (/100) 0.0013 0.0018 0.0018(0.0005) (0.0005) (0.0006)
(Class Size)3 (/100,000) -0.0010 -0.0014 -0.0014(0.0005) (0.0005) (0.0005)
Class Size 20-39 -0.1642 -0.2241 -0.1090(0.1078) (0.1037) (0.0925)
Class Size 40-59 -0.4083 -0.3875 -0.2620(0.1351) (0.1252) (0.1257)
Class Size 60-79 -0.4011 -0.5837 -0.4020(0.1441) (0.1271) (0.1310)
Class Size 80-99 -0.2786 -0.6075 -0.4915(0.1946) (0.1461) (0.1456)
Class Size 100-149 -0.3664 -0.5026 -0.4107(0.1445) (0.1406) (0.1512)
Class Size 150-199 -0.4303 -0.6398 -0.6326(0.1886) (0.1575) (0.1784)
Class Size 200-299 -0.5008 -0.7722 -0.7424(0.1789) (0.1618) (0.1817)
Class Size 300+ -0.5365 -0.6590 -0.7253(0.2292) (0.1771) (0.2007)
F-Statistic for Class Size 2.89 1.9 8.7 4.1 7.05 2.9P-Value of F-Statistic 0.0351 0.053 0.000 0.000 0.000 0.004R-Squared 0.24 0.24 0.71 0.71 0.78 0.77Sample Size 459 459 459 459 459 459Predicted Impact of Increasing Class Size from:
10 to 30 -0.08 -0.22 -0.13 -0.06 -0.14 0.0530 to 50 -0.07 -0.16 -0.11 -0.32 -0.12 -0.1750 to 70 -0.06 -0.20 -0.10 0.01 -0.11 -0.1670 to 90 -0.06 -0.02 -0.09 0.11 -0.10 -0.1090 to 125 -0.08 0.10 -0.13 -0.11 -0.15 0.08125 to 175 -0.07 -0.14 -0.13 -0.09 -0.16 -0.22175 to 250 -0.04 -0.13 -0.10 -0.07 -0.14 -0.12
Weighted by the square root of the number of responses per class. Heteroskedastic consistent standard errors in parentheses.Bold coefficients are statistically significant at the 5 percent level. All models include indicators for school quarter and year.Columns 1 and 2 include indicators for required, upper division, MA, and PhD classes. Columns 3 and 4 include instructorcontrols. Columns 5 and 6 include instructor and course controls.
Cross-Section I-FE I-C-FE
24
Table 6. The Impact of Class Size on Student Ratings of Instructor Effectivenessing the I-C-FE Sample, Excluding MA and PhD Classes
(1) (2) (3) (4) (5) (6)
Class Size -0.0055 -0.0088 -0.0076(0.0017) (0.0019) (0.0020)
(Class Size)2 (/100) 0.0015 0.0022 0.0018(0.0006) (0.0006) (0.0006)
(Class Size)3 (/100,000) -0.0011 -0.0017 -0.0014(0.0005) (0.0005) (0.0005)
Class Size 20-39 -0.0562 -0.0788 0.0510(0.1250) (0.1660) (0.1129)
Class Size 40-59 -0.3799 -0.2753 -0.1145(0.1536) (0.1691) (0.1384)
Class Size 60-79 -0.3737 -0.5176 -0.2793(0.1566) (0.1659) (0.1285)
Class Size 80-99 -0.2671 -0.5779 -0.3815(0.2083) (0.1830) (0.1400)
Class Size 100-149 -0.3723 -0.5000 -0.3056(0.1614) (0.1854) (0.1470)
Class Size 150-199 -0.4644 -0.6657 -0.5235(0.2077) (0.2072) (0.1746)
Class Size 200-299 -0.5334 -0.8202 -0.6432(0.1986) (0.2115) (0.1762)
Class Size 300+ -0.5775 -0.7098 -0.6216(0.2543) (0.2280) (0.1977)
F-Statistic for Class Size 3.6 2.4 8.4 4.0 6.8 2.8P-Value of F-Statistic 0.013 0.018 0.000 0.000 0.000 0.005R-Squared 0.21 0.21 0.72 0.71 0.78 0.77Sample Size 316 316 316 316 316 316
Predicted Impact of Increasing Class Size from:
Us
10 to 30 -0.10 -0.06 -0.16 -0.08 -0.14 0.0530 to 50 -0.09 -0.32 -0.14 -0.20 -0.13 -0.1750 to 70 -0.08 0.01 -0.13 -0.24 -0.11 -0.1670 to 90 -0.07 0.11 -0.11 -0.06 -0.10 -0.1090 to 125 -0.10 -0.11 -0.16 0.08 -0.15 0.08125 to 175 -0.09 -0.09 -0.17 -0.17 -0.16 -0.22175 to 250 -0.06 -0.07 -0.14 -0.15 -0.14 -0.12
Weighted by the square root of the number of responses per class. Heteroskedastic consistent standard errors in parentheses.Bold coefficients are statistically significant at the 5 percent level. All models include indicators for school quarter and year.Columns 1 and 2 include indicators for required and upper division classes. Columns 3 and 4 include instructor controls.Columns 5 and 6 include instructor and course controls.
Cross-Section I-FE I-C-FE
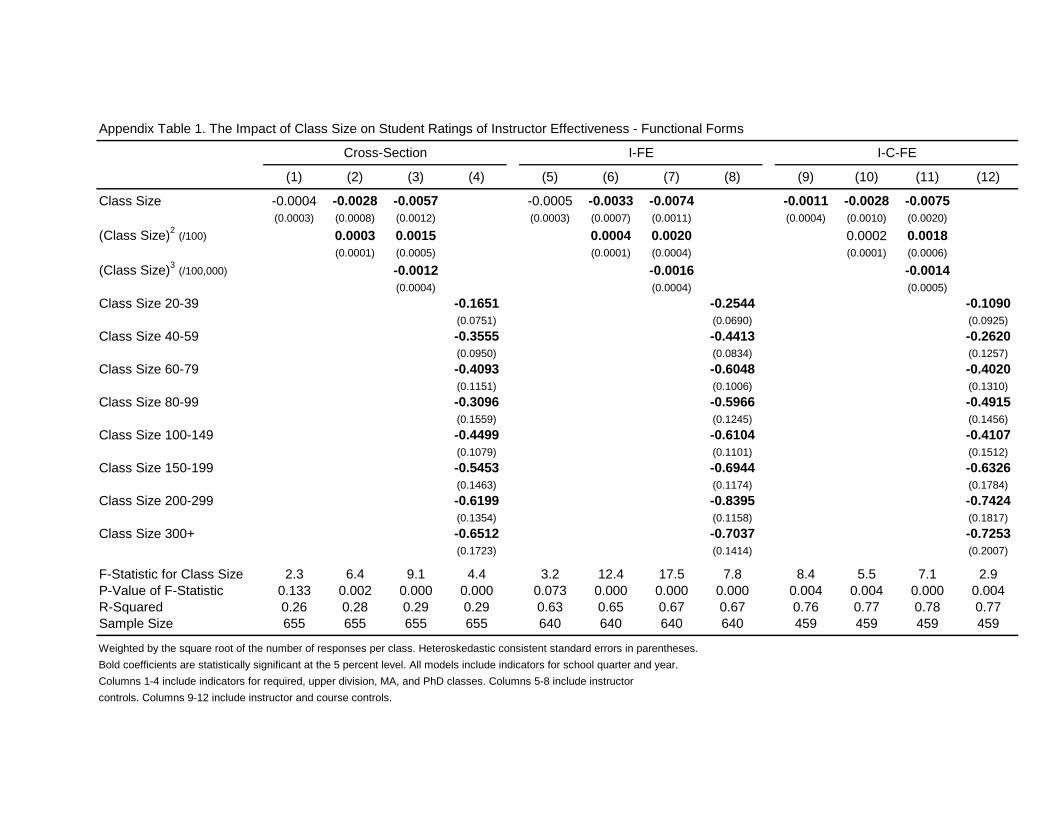
Appendix Table 1. The Impact of Class Size on Student Ratings of Instructor Effectiveness - Functional Forms
(1) (2) (3) (4) (5) (6) (7) (8) (9) (10) (11) (12)
Class Size -0.0004 -0.0028 -0.0057 -0.0005 -0.0033 -0.0074 -0.0011 -0.0028 -0.0075(0.0003) (0.0008) (0.0012) (0.0003) (0.0007) (0.0011) (0.0004) (0.0010) (0.0020)
(Class Size)2 (/100) 0.0003 0.0015 0.0004 0.0020 0.0002 0.0018(0.0001) (0.0005) (0.0001) (0.0004) (0.0001) (0.0006)
(Class Size)3 (/100,000) -0.0012 -0.0016 -0.0014(0.0004) (0.0004) (0.0005)
Class Size 20-39 -0.1651 -0.2544 -0.1090(0.0751) (0.0690) (0.0925)
Class Size 40-59 -0.3555 -0.4413 -0.2620(0.0950) (0.0834) (0.1257)
Class Size 60-79 -0.4093 -0.6048 -0.4020(0.1151) (0.1006) (0.1310)
Class Size 80-99 -0.3096 -0.5966 -0.4915(0.1559) (0.1245) (0.1456)
Class Size 100-149 -0.4499 -0.6104 -0.4107(0.1079) (0.1101) (0.1512)
Class Size 150-199 -0.5453 -0.6944 -0.6326(0.1463) (0.1174) (0.1784)
Class Size 200-299 -0.6199 -0.8395 -0.7424(0.1354) (0.1158) (0.1817)
Class Size 300+ -0.6512 -0.7037 -0.7253(0.1723) (0.1414) (0.2007)
F-Statistic for Class Size 2.3 6.4 9.1 4.4 3.2 12.4 17.5 7.8 8.4 5.5 7.1 2.9P-Value of F-Statistic 0.133 0.002 0.000 0.000 0.073 0.000 0.000 0.000 0.004 0.004 0.000 0.004R-Squared 0.26 0.28 0.29 0.29 0.63 0.65 0.67 0.67 0.76 0.77 0.78 0.77Sample Size 655 655 655 655 640 640 640 640 459 459 459 459
Weighted by the square root of the number of responses per class. Heteroskedastic consistent standard errors in parentheses.Bold coefficients are statistically significant at the 5 percent level. All models include indicators for school quarter and year.Columns 1-4 include indicators for required, upper division, MA, and PhD classes. Columns 5-8 include instructorcontrols. Columns 9-12 include instructor and course controls.
I-C-FECross-Section I-FE