the impact of automatic store replenishment systems on...
TRANSCRIPT

The Impact of Automatic Store
Replenishment Systems on Retail
DISSERTATION
of the University of St. Gallen
Graduate School of Business Administration,
Economics, Law and Social Sciences (HSG)
to obtain the title of
Doctor of Business Administration
submitted by
Alfred Angerer
from
Austria
Approved on the application of
Prof. Dr. Daniel Corsten
and
Prof. Fritz Fahrni, PhD
Dissertation no. 3123


The University of St. Gallen, Graduate School of Business Administration,
Economics, Law and Social Sciences (HSG) hereby consents to the printing of the
presented dissertation, without hereby expressing any opinion on the views herein
expressed.
St. Gallen, November 17, 2005
The President
Prof. Ernst Mohr, PhD


dedicado a las dos mujeres más importantes de mi vida:
mi madre y Anne

VI

VII
Foreword
Fast moving consumer goods retailing is a highly competitive market. European
retailers are continuously aiming to improve customer loyalty by offering good
service. At the same time, they are struggling to reduce costs in order to stay
competitive. One technology that promises to decrease the number of out-of-stocks
while simultaneously reducing store handling costs is automatic store replenishment
(ASR). At the heart of ASR systems lies software that automatically places an order
to replenish stocks. Many European grocery retailers have started to implement such
decision support systems.
Surprisingly, although several retailers have automated their order process in the last
few years, there is almost no academic source examining this topic at the level of the
store. It is worth noting that other technologies in retail, such as RFID (Radio
Frequency Identification) and the introduction of the barcode, have received far
greater attention from the public and from researchers. Furthermore, while the topic
of extent and root-causes of retail out-of-stock has received substantial interest over
the course of the last years, the question to what extent existing and new practices
remedy OOS is largely unanswered. In particular, there is a debate whether ASR
improve or worsen OOS. Therefore, Dr. Alfred Angerer has well chosen a topic of
both managerial and academic relevance.
Although there are many success stories from practitioners describing the enormous
advantages of introducing automatic store replenishment systems there has been
limited empirical proof of this. To the best of my knowledge no conceptual framework
exits that can help practitioners to choose an adequate automatic replenishment
system. In order to develop such a model research on relationship between
replenishment performance (e.g. OOS rate, inventory levels) and contextual variables
(such as store and product characteristics) is required. Finally, it is not clear how
retailers have to adapt its organization and processes to best support the chosen
ASR system.
Dr. Angerer confidently identifies and covers several research gaps and manages to
give answers to this research gaps by a skilful combination of quantitative and
qualitative research methodologies. In a first part an exhaustive data set of a
European retailer is examined. With this data analysis the performance of
replenishment system before and after the introduction of ASR systems is compared.

VIII
Dr. Angerer is able to statistically prove and quantify the positive impact of such
systems on inventory levels and out-of-stock rates. In the second part, several case
studies illustrate how ASR systems are implemented in practice. The given
recommendations on store processes help retailers to benefit most from automatic
replenishment systems.
Overall, this thesis makes an important contribution to the field of retail operations −
in practice and theory. I personally wish Dr. Angerer's work wide attention in both
academic and practitioner circles.
Prof. Dr. Daniel Corsten

IX
Acknowledgment
Rarely is a doctoral thesis the contribution of a single person. Many people supported
and consulted me during my three years of research at the University of St.Gallen.
Therefore, I would like to express my thanks to everyone who supported me in
finalising this work.
I am greatly indebted to my two advisors, Prof. Dr. Daniel Corsten and Prof. Dr. Fritz
Fahrni. They guided me through the inevitable ups and downs that characterise such
a long research project. I want to specially thank Daniel Corsten who supported my
research from the very outset. Without his never ending striving for improvement, the
present results would not have been gained. I also cordially thank my second
adviser, Fritz Fahrni, who always helped me to look for the big picture in my work.
Further, I am thankful to Prof. Dr. Frank Straube and Prof. Dr. Wolfgang Stölzle for
their backup as directors of the KLOG.
A special thanks goes to my colleagues Lars Dittmann and Christian Tellkamp, with
whom I shared several "research camps". They decisively influenced my research.
Jens Hamprecht deserves a special thank for his numerous advices as well as
Dorothea Wagner does. Her extensive knowledge about the consumer goods
industry was always a valuable contribution.
My time a the University of St.Gallen would only have been half the fun without my
colleagues. I want to thank Gunther Kucza, Marion Peyinghaus, Jörg Hofstetter, Jan
Felde, Jan Frohn, Elias Halsband, Florian Hofer, Petra Seeger, Dirk Voelz and all
other colleagues at the Kuehne-Institute for Logistics and the Institute for Technology
Management for being such good colleagues and for all the good moments we
shared.
Throughout the last years, I received valuable contributions form researchers and
students. Especially, I want to thank Johanna Småros and Michael Falck from the
HUT for the enriching discussions and research projects I shared with them. I would
also like to express my thanks to all the students whose bachelor and master thesis I
coached. Their interviews provided a basic foundation for my research.
Without the support from practitioners, this research would only have been a
theoretical contribution. A very warm thank you to Roland S., who invested his time to
provide me the data for the quantitative research. Further, I am very grateful to

X
Marianne S., Daniel B. and all the interview partners for the time they invested in my
research project.
Finally, I want to thank my mother and father, Toni, Lydia, Nic and Anne for their
never-ending moral support. Despite the distance, I always felt their affection
throughout my education and career.
St. Gallen, November 2005 Alfred Angerer

XI
Content Overview
1. Introduction ................................................................................................................................... 1
1.1. Logistics Contribution to Retail Excellence.............................................................................. 1 1.2. Excellence in Store Operations ............................................................................................... 3 1.3. New Technologies Enable Automatic Store Replenishment Systems..................................... 6 1.4. Research Deficit ...................................................................................................................... 8 1.5. Research Questions.............................................................................................................. 12 1.6. Thesis Structure .................................................................................................................... 14
2. Research Framework and Design ............................................................................................. 16
2.1. Research Framework ............................................................................................................ 16 2.2. Research Methodology ......................................................................................................... 18 2.3. Research Process ................................................................................................................. 23
3. Literature Research .................................................................................................................... 26
3.1. Inventory Management Perspective ...................................................................................... 26 3.2. Logistics and Operations Management Perspective ............................................................. 30 3.3. Business Information Systems Perspective .......................................................................... 41 3.4. Contingency Theory Perspective........................................................................................... 47 3.5. Literature Research Overview............................................................................................... 51
4. Development of Models.............................................................................................................. 53
4.1. A Descriptive Model of Replenishment Systems................................................................... 53 4.2. Classification of Automatic Replenishment Systems............................................................. 64 4.3. Explanatory Model................................................................................................................. 68
5. Quantitative Analysis.................................................................................................................. 85
5.1. Sample and Methodology...................................................................................................... 85 5.2. Hypothesis Testing: Dataset1................................................................................................ 99 5.3. Dataset2: Pretest/Posttest................................................................................................... 122 5.4. Quantitative Research–Conclusions ................................................................................... 128
6. Field Research and Managerial Implications.......................................................................... 132
6.1. Research Sample................................................................................................................ 132 6.2. Replenishment Processes................................................................................................... 137 6.3. Organizational Changes and Personnel Issues .................................................................. 151 6.4. ASR Performance ............................................................................................................... 157 6.5. Lessons Learned and Recommendations for Management ................................................ 161
7. Conclusion ................................................................................................................................ 181
7.1. Theoretical Contributions..................................................................................................... 181 7.2. Contribution for Practitioners ............................................................................................... 183 7.3. Further Research Fields ...................................................................................................... 186
8. Appendix and References ........................................................................................................ 189
8.1. Statistical Appendix ............................................................................................................. 189 8.2. References .......................................................................................................................... 193 8.3. List of Interviews.................................................................................................................. 210

XII

XIII
Table of Contents
1. Introduction ........................................................................................................................1
1.1. Logistics Contribution to Retail Excellence ...................................................................1 1.2. Excellence in Store Operations.....................................................................................3 1.3. New Technologies Enable Automatic Store Replenishment Systems..........................6 1.4. Research Deficit............................................................................................................8 1.5. Research Questions....................................................................................................12 1.6. Thesis Structure ..........................................................................................................14
2. Research Framework and Design ..................................................................................16
2.1. Research Framework..................................................................................................16 2.2. Research Methodology ...............................................................................................18 2.3. Research Process.......................................................................................................23
3. Literature Research .........................................................................................................26
3.1. Inventory Management Perspective............................................................................26 3.1.1. Optimization in Inventory Management Research ...............................................27 3.1.2. Theoretical Sources on OOS ...............................................................................28 3.1.3. Contributions and Deficits of an Inventory Management Perspective..................29
3.2. Logistics and Operations Management Perspective...................................................30 3.2.1. Supply Chain Management and ECR ..................................................................31 3.2.2. Automatic Replenishment Programmes...............................................................33 3.2.3. Operations Management in Retail........................................................................39 3.2.4. Contributions and Deficits of a Logistics and Operations Management
Perspective ..........................................................................................................40 3.3. Business Information Systems Perspective................................................................41
3.3.1. Characteristics of ERP Systems ..........................................................................42 3.3.2. ERP Implementation and Selection .....................................................................42 3.3.3. ERP and Human Agency .....................................................................................44 3.3.4. Contributions and Deficits of a Business Information Systems Perspective ........46
3.4. Contingency Theory Perspective ................................................................................47 3.4.1. Contingency Theory at the Organizational Level .................................................47 3.4.2. Contingency Theory on Information Technology and Processes.........................49 3.4.3. Contributions and Deficits of a Contingency Perspective ....................................50
3.5. Literature Research Overview.....................................................................................51
4. Development of Models...................................................................................................53
4.1. A Descriptive Model of Replenishment Systems ........................................................53 4.1.1. Inventory Visibility ................................................................................................56 4.1.2. Replenishment Logic............................................................................................57 4.1.3. Order Restrictions ................................................................................................60 4.1.4. Forecasts .............................................................................................................61
4.2. Classification of Automatic Replenishment Systems ..................................................64 4.3. Explanatory Model ......................................................................................................68
4.3.1. Purpose and Structure of the Explanatory Model ................................................68 4.3.2. Hypothesis Development: Product Characteristics ..............................................71 4.3.3. Hypothesis Development: Store Characteristics..................................................77 4.3.4. Hypothesis Development: ASR Characteristics ...................................................81

XIV
5. Quantitative Analysis...................................................................................................... 85
5.1. Sample and Methodology........................................................................................... 85 5.1.1. Dataset1: Testing of Out-of-Stock Hypotheses ................................................... 85 5.1.2. Dataset2: Pretest/Posttest Analysis .................................................................... 93
5.2. Hypothesis Testing: Dataset1 .................................................................................... 99 5.2.1. Influence of Product Characteristics.................................................................... 99 5.2.2. Influence of Store Characteristics ..................................................................... 113
5.3. Dataset2: Pretest/Posttest........................................................................................ 122 5.4. Quantitative Research–Conclusions ........................................................................ 128
6. Field Research and Managerial Implications.............................................................. 132
6.1. Research Sample..................................................................................................... 132 6.1.1. Company Selection ........................................................................................... 132 6.1.2. Market Characteristics....................................................................................... 134 6.1.3. Supply Chain Structure ..................................................................................... 134 6.1.4. Chains and Store Formats ................................................................................ 136 6.1.5. Delivery Frequency and Order-to-Deliver Lead Times...................................... 136
6.2. Replenishment Processes........................................................................................ 137 6.2.1. Inventory Visibility.............................................................................................. 138 6.2.2. Forecasts and Replenishment Logic ................................................................. 146 6.2.3. Order Restrictions ............................................................................................. 151
6.3. Organizational Changes and Personnel Issues ....................................................... 151 6.3.1. Structural Changes and Setup .......................................................................... 152 6.3.2. Personnel and Change Management................................................................ 154
6.4. ASR Performance .................................................................................................... 157 6.4.1. Performance Measurement............................................................................... 157 6.4.2. Inventory Level Performance ............................................................................ 158 6.4.3. OOS Reduction and Overall Performance ........................................................ 159
6.5. Lessons Learned and Recommendations for Management..................................... 161 6.5.1. The Adequate Automation Level: Recommendations ....................................... 161 6.5.2. ASR Introduction ............................................................................................... 165 6.5.3. Technical and Organizational Requirements .................................................... 166 6.5.4. Store Operations: Recommended Action.......................................................... 170 6.5.5. Cost-Benefit Analyses ....................................................................................... 175
7. Conclusion..................................................................................................................... 181
7.1. Theoretical Contributions ......................................................................................... 181 7.2. Contribution for Practitioners.................................................................................... 183 7.3. Further Research Fields........................................................................................... 186
8. Appendix and References ............................................................................................ 189
8.1. Statistical Appendix .................................................................................................. 189 8.1.1. Calculation of the Inventory Level ..................................................................... 189 8.1.2. ANOVA Considerations and Prerequisites........................................................ 191
8.2. References ............................................................................................................... 193 8.3. List of Interviews....................................................................................................... 210 8.4. Curriculum Vitae....................................................................................................... 212

XV
List of Abbreviations and Acronyms ANOVA Analysis Of Variance
ARP Automatic Replenishment Programme
ASR Automatic Store Replenishment
ASRx Automatic Store Replenishment System level x
CD Cross-Docking
CU Consumer Unit
CU/TU Consumer Unit per Trading Unit (=case pack size)
CRP Continuous Replenishment Planning
CPFR Collaborative Planning Forecasting and Replenishment
EAN European Article Numbering
ECR Efficient Consumer Response
EDI Electronic Data Interchange
ERP Enterprise Resource Planning
DC Distribution Centre
DSD Direct Store Delivery
DSS Decision Support System
HQ Headquarters
IS Information System
IT Information Technology
ITEM Institute for Technology Management
KLOG Kuehne-Institute for Logistics
KPI Key Performance Indicator
MAD Mean Absolute Deviation
MAPE Mean Absolute Percent Error
OOS Out-Of-Stock
OR Operations Research
OSA On-Shelf Availability
PC Personal Computer
PDA Personal Digital Assistant (handhelds)
POS Point Of Sales
QR Quick Response
SC Supply Chain
SCM Supply Chain Management
SKU Stock Keeping Unit
TU Trading Unit
VMI Vendor Managed Inventory

XVI

XVII
Figures
Figure 1: The importance of logistics for different industries ..................................... 2
Figure 2: Percentage of logistics costs on total costs by industry (in %) ................... 3
Figure 3: Summary of OOS root causes.................................................................... 5
Figure 4: Thesis structure ........................................................................................ 15
Figure 5: Focus of research ..................................................................................... 16
Figure 6: Integrative research procedure................................................................. 19
Figure 7: Case study research as iterative process between theory and
empiricism................................................................................................. 22
Figure 8: Research activities in this research project .............................................. 23
Figure 9: Spectrum of misfit resolution strategies.................................................... 44
Figure 10: Descriptive model of replenishment systems ........................................... 54
Figure 11: Exemplary time dependent course of the inventory stock level................ 56
Figure 12: Qualitative and quantitative forecasting techniques ................................. 62
Figure 13: Classification of automatic replenishment systems .................................. 65
Figure 14: Overview of hypotheses, product characteristics ..................................... 83
Figure 15: Overview of hypotheses, store characteristics ......................................... 84
Figure 16: Overview of hypotheses, ASR characteristics .......................................... 84
Figure 15: Distribution of the 84 products in Dataset1............................................... 88
Figure 16: Comparison of the replenishment systems by store................................. 92
Figure 17: Estimated OOS (order-related) rate by sales coefficient of variance...... 100
Figure 18: Estimated inventory range of coverage by sales coefficient of
variance ................................................................................................. 102
Figure 19: Estimated OOS (order-related) rate by speed of turnover...................... 103
Figure 20: Estimated inventory range of coverage by speed of turnover ................ 104
Figure 21: Estimated OOS (order-related) rate by price .......................................... 105
Figure 22: Estimated inventory range of coverage by price..................................... 106
Figure 23: Estimated OOS (order-related) rate by CU/TU group............................. 107
Figure 24: Estimated Inventory range of coverage by case pack ............................ 108
Figure 25: Estimated OOS (order-related) rate by product size .............................. 109
Figure 26: Estimated inventory range of coverage by product size ......................... 110
Figure 27: Estimated OOS (order-related) rate by shelf life..................................... 111
Figure 28: Estimated inventory range of coverage by shelf life ............................... 112
Figure 29: Estimated OOS (order-related) rate by store.......................................... 114
Figure 30: Estimated inventory range of coverage by store .................................... 115
Figure 31: Estimated inventory coefficient of variance by store............................... 116
Figure 32: Relationship between shrinkage and OOS............................................. 117
Figure 33: Relationship of OOS and SKU density ................................................... 118

XVIII
Figure 34: Relationship of OOS and number of personnel per m2 ...........................118
Figure 35: Relationship of OOS and number years of the store manager
working in the store.................................................................................119
Figure 36: Relationship of OOS and the size of the backroom ................................120
Figure 37: Relationship of OOS and customer satisfaction......................................121
Figure 38: Mean inventory range of coverage in days of dairy products and
Control1 ..................................................................................................123
Figure 39: Means of the repeated ANOVA on the coefficient of variance of
the stock level, ASR3 group and Control1 .............................................125
Figure 40: Mean inventory range of coverage in days of non-food
products and Control2.............................................................................126
Figure 41: Estimated means of the repeated ANOVA on the inventory range of
coverage, ASR2 group............................................................................127
Figure 42: Estimated means of the repeated ANOVA on the inventory
range of coverage, ASR2* group............................................................127
Figure 43: Mean inventory coefficient of variance in days of ASR2, ASR2* group
and Control2 ...........................................................................................128
Figure 44: Supply chain structure of sample ............................................................135
Figure 45: Delivery frequency of sample..................................................................137
Figure 46: Inventory storage places and product flow processes ............................138
Figure 47: Comparison of inventory records and real inventory in one store...........142
Figure 48: Decision tree for practitioners .................................................................162
Figure 49: Cost of forecasting versus cost of inaccuracy.........................................168
Figure 50: Overview of store operations recommendations.....................................170
Figure 51: Comparison of inventory on shelf and total store inventory for a
glue stick.................................................................................................172
Figure 52: Costs in relation to replenishment level ..................................................177
Figure 53: Theoretical contribution of thesis ............................................................181
Figure 54: Contribution for practitioners ...................................................................183
Figure 55: Relative inventory level curve without zero line ......................................189
Figure 56: Absolute inventory level curve after the correction .................................190

XIX
Tables
Table 1: Overview of research deficits................................................................... 12
Table 2: Overview of basic theoretical sources reviewed (excerpt)....................... 26
Table 3: Implementation of ARP-related items ...................................................... 35
Table 4: Effectiveness in achieving automatic replenishment-related goals.......... 36
Table 5: Information systems capabilities .............................................................. 37
Table 6: Summary of research streams perspectives............................................ 52
Table 7: Inventory notations................................................................................... 55
Table 8: Basic inventory decision rules.................................................................. 57
Table 9: Exemplary order restrictions .................................................................... 60
Table 10: Characteristics of automatic replenishment levels................................... 68
Table 11: Overview of hypotheses concerning product characteristics ................... 77
Table 12: Overview of hypotheses concerning store characteristics ....................... 81
Table 13: Overview of the utilization of the two datasets for hypothesis testing...... 85
Table 14: Overview of variables used in the analysis .............................................. 90
Table 15: Product characteristics of Dataset1 by replenishment system ................ 91
Table 16: OOS rates (order-related)of the sample .................................................. 92
Table 17: Inventory range of coverage of Dataset1................................................. 93
Table 18: Dataset for the pretest/posttest................................................................ 94
Table 19: Descriptive statistics of the dairy products (ASR3) and Control1
group (ASR0)........................................................................................... 95
Table 20: Descriptive statistics of the beauty and household group (ASR2) and
Control2 (ASR0) ...................................................................................... 97
Table 21: Descriptive statistics of the non-food group (ASR2*) and Control2
(ASR0) ..................................................................................................... 97
Table 22: ASR level and sales coefficient of variance ANOVA on OOS
(order-related)........................................................................................ 100
Table 23: ASR level and sales coefficient of variance ANOVA on inventory
range of coverage.................................................................................. 101
Table 24: ASR level and speed of turnover ANOVA on OOS (order-related)........ 103
Table 25: ASR level and speed of turnover ANOVA on inventory range of
coverage ................................................................................................ 104
Table 26: ASR level and price ANOVA on OOS (order-related)............................ 105
Table 27: ASR level and price ANOVA on inventory range of coverage ............... 106
Table 28: ASR level and CU/TU ANOVA on OOS (order-related)......................... 107
Table 29: ASR level and CU/TU on inventory range of coverage.......................... 108
Table 30: ASR level and product size ANOVA on OOS (order-related) ................ 109
Table 31: ASR level and product size ANOVA on inventory range of coverage.... 110

XX
Table 32: Regression of shelf life and shelf life squared on OOS..........................112
Table 33: Correlation between OOS per week and store characteristics
(Dataset1)...............................................................................................113
Table 34: ASR level and Store ANOVA on OOS (order-related) ...........................114
Table 35: ASR level and Store ANOVA on inventory range of coverage...............115
Table 36: ASR level and store ANOVA on inventory coefficient of variance..........116
Table 37: ASR level ANOVA on OOS (order-related) ............................................121
Table 38: ASR level ANOVA on inventory range of coverage ...............................122
Table 39: Performance of ASR3 group compared to the Control1 (ASR0)............124
Table 40: Repeated ANOVA on inventory range of coverage, ASR3 group ..........124
Table 41: Repeated ANOVA on the coefficient of variance of the stock
level, ASR3 group ..................................................................................125
Table 42: Repeated ANOVA on mean inventory range of coverage,
ASR2 group............................................................................................126
Table 43: Results overview: product characteristics hypotheses...........................129
Table 44: Results: store characteristics hypotheses ..............................................130
Table 45: Results: ASR hypotheses.......................................................................130
Table 46: Overview of the results of the hypotheses tested...................................131
Table 47: Selected companies for the field research .............................................133
Table 48: Inventory range of coverage of European grocery retailers in days.......158
Table 49: Technical requirements and recommendations on operations and
organization structure.............................................................................169
Table 50: Overview of possible benefits and costs following an ASR
system introduction ................................................................................177
Table 51: Overview of further research opportunities ............................................186

XXI
Abstract
European fast moving consumer goods retailers face a mature market with low
margins and high competition. To improve their situation, retailers are looking for
technologies and concepts to increase consumer satisfaction while at the same time
reducing costs. One technology that promises to increase the availability of the
products on the shelf while simultaneously reducing store handling costs is automatic
store replenishment (ASR). At the heart of ASR systems lies software that
automatically places an order to replenish stocks of a certain product. A majority of
European grocery retailers have implemented such decision support systems. Yet
research in this area is practically non-existent. Therefore, this thesis aims to
investigate the impact of this technology on retail, taking into account financial,
organizational and personnel aspects.
To answer this main research question, a quantitative and a qualitative methodology
was chosen. First of all, based on theoretical sources and more than 50 interviews, a
descriptive model and an ASR classification system is developed. Next, an
explanatory model is developed with a view to enabling identification of the
characteristics of products, stores and replenishment systems that influence the
replenishment performance of retail stores. To be able to test the hypothesis derived
from this explanatory model, exhaustive data from a grocery retailer is examined. The
quantitative analysis clearly shows that even simple automatic replenishment
systems are able to dramatically reduce the average shelf out-of-stock rate and at the
same time lower inventory level. In addition, a major advantage of automatic systems
over manual ones is that they show constant results, independently of product
characteristics. Yet the analysis also shows that badly-parameterised automatic
systems will fail to deliver the desired results. In order to better understand how ASR
systems are best implemented in practice, four major grocery retailers are analysed
in detail. These case studies illustrate the necessary technological and organizational
changes and highlight the influence of ASR systems on the working behaviour of
employees.
Overall, this thesis makes contributions to both practice and theory. On the one hand,
the results presented are a first stepping stone towards the creation of a basic theory
of ASR systems. A descriptive model enables further researchers to make
differentiated statements on the impact of ASR based on the classification
developed. Another contribution is the explanatory model which tests existing and
demonstrates new relationships hypothesised in inventory and operations
management research. On the other hand, practitioners receive an overview of the

XXII
existent systems by which they may automate store replenishment. The
determination of ASR benefits and necessary requirements help them to make a
cost-benefit analysis. In addition, the several implications of the automation of their
replenishment system for the organization and for human working patterns are
illustrated. Practical recommendations on store processes help retailers to benefit
most from automatic replenishment systems. And finally, a decision tree helps
practitioners to identify the best-suited ASR system for each product category.

1. Introduction 1
1. Introduction
Grocery retailing is a highly competitive market (e.g. Keh and Park 1997). European
retailers are continuously aiming to improve customer loyalty by offering good
service. At the same time, they are struggling to reduce costs in order to stay
competitive. The effort to achieve customer service excellence has only been partly
successful, as the low average product shelf availability rates of 92–95% (Gruen,
Corsten et al. 2002; Roland Berger 2003b) and a sunk store loyalty underline. The
major part of retailer costs are personnel costs, and in particular it is the operations in
the store that require intensive staff dedication (Broekmeulen, van Donselaar et al.
2004a). The German retailer Globus has calculated that the logistics costs of the last
50 meters in the store, i.e. from the backroom to the shelf, are three times as
expensive as the first 250 kilometres from the producer to the store gate (Shalla
2005). A technique that promises to reduce the out-of-stock (OOS) rate by
simultaneously reducing the store handling costs are so-called automatic store
replenishment (ASR) systems, the main research subject of this thesis.
This chapter provides an introduction to the business challenges faced by retailers
and the valuable role of logistics in retail, followed by a short introduction to ASR
systems. Later, research deficits in the literature are identified and the research
questions of this thesis are derived. Finally, an overview of the structure of this
research study is given.
1.1. Logistics Contribution to Retail Excellence
The major market developments that make retail challenging started in the 1990s and
still are prevalent today, namely high cost pressure, shorter innovation cycles,
increasing consumer expectations and globalization (Baumgarten and Wolf 1993;
Lee 2001). The common response of retailers has been a so-called quantity strategy:
They introduced more product variants, invested in new channels of distribution,
diversified store formats and expanded into new countries. However, the benefits
harvested from such a strategy seem to have come to an end, as the market has
become saturated. The fraction of private consumption that flows into food and near-
food retail has decreased continuously in the last two decades. In Germany, for
example, it sank from 44.2% in 1990 to 29.3% in 2004 (Körber 2003), and this trend
is typical for many developed countries. Nevertheless, a small group of retailers was
able to defy this trend and outperformed the market. As a study by Accenture (2000)
reports, approximately one-third of 63 examined retailers outperformed the other two-
thirds by far and showed a yearly revenue increase of at least 10% coupled with a

2 1. Introduction
higher-than-average increase in stock price. According to the study, this group had
developed the right strategy by focusing their investments in areas where the most
efficiency potentials were located.
One of the areas with such potential is without doubt logistics, as effective and
efficient logistics is the fundamental to successful retailing. Hans Joachim Körber
(2003), CEO of Metro AG, describes logistics as "the physical accomplishment of the
concern strategy."
Figure 1 depicts the great importance of logistics for retail and various industry
sectors under the aspects "differentiation" (i.e. logistics as a marketing tool) and
"rationalisation" (i.e. logistics as a method of saving costs).
Diffe
rentia
tion
Rationalisation
Retail/consumer goods
Automotive
Chemical industry
Machinebuilding
Paperindustry
Electronics
Plant construction
Figure 1: The importance of logistics for different industries1
The importance of logistics for the retail sector is based on the nature of the products
sold. Most consumer goods, for example daily food items, are relatively cheap and
the consumer generally buys without lengthy quality or price comparisons.
Nevertheless, the importance of logistics in other sectors is increasing as well, as
Pfohl (2004) stresses.
1 Source: Kowalski (1992).

1. Introduction 3
A precise estimation of the logistics costs is rather difficult. Pfohl compared studies
measuring the logistics costs as a percentage of turnover. The large differences in
the results can often be explained by geographical differences between countries and
their infrastructure levels. Yet even within a single country like Germany, there are
several studies with significantly divergent figures. This is the result of the varying
definition of logistics costs. One of the most cited studies is that by Baumgarten and
Thoms (2002). They estimate the retailers' logistics costs at up to 27% of total costs
(see Figure 2).
8.2% 12.8% 27.6%
Automotive Consumer
goods Retail
7.6% 12.2% 26.7%
Figure 2: Percentage of logistics costs on total costs by industry (in %)2
Even if other researchers have clearly lower estimations (e.g. Klaus 2003), there is a
common agreement that there exists a large savings potential. Two studies from the
year 1999 estimate the savings potentials at about 12–25% (Baumgarten and Wolf
1993; European Logistics Association and A.T. Kearney 1999).
In order to achieve these savings, new advanced logistics-technology is employed.
But logistics should never be reduced to its cost-reducing effect, as logistics concepts
can also be utilized to improve service and consequently increase sales (Angerer and
Corsten 2004). The next section deals with one of the most important measures used
to quantify customer-service levels: the on-shelf availability rate.3
1.2. Excellence in Store Operations
A high availability rate of products on the shelves is of utmost importance for
retailers. All the efforts made to improve the supply chain are futile if, in the end, the
consumer is unable to buy the product because it is not available on the shelf. There
2 Source: Baumgarten and Thoms (2002).
3 The on-shelf availability rate is the percentage of products that are available for purchasing on the store's
shelves at a particular moment in time.

4 1. Introduction
exist studies that show that out-of-stocks (OOS) in stores are the most frequently
mentioned cause of frustration for dissatisfied customers in retail (Sterns, Unger et al.
1981). Interviews with practitioners confirm the importance of high shelf availability:
"The three criteria that decide the success of a product are the right price,
the right forms of advertisement and high on-shelf availability. (...) In
particular, if there is a promotion, there is nothing more important than
having the goods on the shelf!"4
Obviously, the impact of an OOS depends on the reaction of the customer:
"The reaction of customers [on OOS] differs a great deal. If the customer
buys a different brand, we are happy. If he or she does not buy anything at
all, then we are not content. And if the customer buys the product in a
competitor's store, that is a catastrophe! Seventy percent of customers
change to the competition for good if they experience repeated OOS; and
that is a complete catastrophe!"5
Furthermore, there is a strategic component to high shelf availability, as it ensures an
advantage in increasingly competitive markets:
"If we want to compete with new aggressive retailers such as LIDL which are
planning to enter the Swiss market, we have to increase the turnover per
square meter. For that, we need to increase the on-shelf availability (...) to
make our stores more interesting for customers."6
The importance of a high availability is underlined by the research of Drèze, Hoch et
al. (1994) among others. They show that the total amount of money spent on any
store visit is an elastic quantity and is highly dependent on product presentation and
quantity on the shelf. Although the on-shelf availability rate plays such an important
role in the business of retailers, it seems that only a minority of European grocery
retailers systematically measures this important KPI (key performance indicator). A
case study of 12 leading European grocery retailers has shown that only four
companies have established a process for daily availability check (Småros, Angerer
et al. 2004a). Only one retailer had implemented an electronic-based system for
automatic checks. The magnitude of the OOS problem still appears not to have been
identified by many retailers. They tend to derive the availability rate in their stores
from the service level at their distribution centres (DCs). Their argument is that if the
4 Source: Arthur Mathys, Director Logistics, Denner, 04.08.2003.
5 Source: Wolfgang Mähr, Director IT, Spar Switzerland, 16.02.2004.
6 Source: Wolfgang Mähr, Director IT, Spar Switzerland, 16.02.2004.

1. Introduction 5
DC can fulfil 99% of the store orders, then one can expect an on-shelf availability rate
of 99%. This thought is not quite correct, as the work of Gruen, Corsten et al. (2002)
demonstrates. Their meta-study proves that in the last few decades the OOS rate
has not decreased. It seems to have remained rather stable at a level of about 8%.
This high figure is rather surprising for manufacturers and retailers, as they expected
a far better rate considering the progress made in technology and new logistic
concepts introduced in the last few years. In order to tackle this problem, the study
further examines the reasons for OOSs, as depicted in Figure 3.
Store forecasting
13%
Store ordering34%
Store shelving
25%
Distribution centre
10%
Retail HQ ormanufacturer
14%
Other cause
4%
Figure 3: Summary of OOS root causes7
Surprisingly, almost three-quarters of stock-outs are the direct result of retail store
practices and shelf restocking processes. A very similar result was found in a KLOG
project carried out with the European grocery retailer MYFOOD8. Sixty percent of the
OOS situations at this retailer were caused by the ordering behaviour in the stores. In
10% of the cases the goods were in the store but not on the shelves. Here lies a
possible answer for the ineffectiveness of existing ECR (Efficient Consumer
Response) activities on the OOS rate. Many of these ECR activities concentrate on
the smooth transportation of items up to the store gate. How replenishment orders
are placed, how order quantities are determined and processes in the so-called last
50 metres in the store still remains an area for research.
To see the financial implications of OOS incidents, Gruen, Corsten et al. (2002)
conducted an estimate of the overall effect of OOS on sales that takes into account
the response of consumers. The result is that on average, retailers might lose up to
7 Source: Gruen, Corsten et al. (2002).
8 The name of this retailer and of three others that are examined in the case study section 6 have been made
anonymous for confidentiality reasons.

6 1. Introduction
4% of their turnover due to SKUs (stock keeping units) being absent from the
shelves.
1.3. New Technologies Enable Automatic Store Replenishment
Systems
As half of all OOSs arise from incorrect ordering and forecasting processes, it is
sensible to have a closer look at stores' replenishment processes and systems.
Some decades ago, there was no alternative to manual store replenishment systems.
A planner, for example the store manager, was responsible for deciding the two main
parameters of replenishment systems, namely the amount to be ordered and the
when to place the order. In order to do this, the planner had to check manually the
quantity in stock. In the last decade, there has been an impressive diffusion of large-
scale information packages such as ERP (Enterprise Resource Planning) in
organizations (Kallinikos 2004). In addition, identification technology (such as
barcodes and scanners) and communication tools (such as EDI9) have become very
cheap, their implementation and use is nearly routine (Kuk 2004). Today, these and
other new technologies make it increasingly possible to automate the replenishment
decision-making. The interviews conducted with practitioners as well as other
surveys (Bearing Point 2003; Småros, Angerer et al. 2004a) clearly reveal a trend in
retailing towards automating store replenishment processes:
"The normal replenishment process has been until now consisted of store
personnel deciding what quantity to order by looking on the shelf. Now,
retailers want to let the systems take this decision."10
Semi-automatic systems merely support the planner in his decision, for example, by
showing him electronically the inventory and order restrictions. Advanced automatic
store replenishment systems are IT-based software systems that automatically
decide when to order which quantity. Nevertheless, there are several differences in
the complexity and performance of such ASR systems. The simplest systems just
place an order as soon as an article is sold or when a certain minimum stock level is
reached. No forecasts are made; the quantity to be ordered is calculated with a very
simple algorithm (e.g. fill up to a certain level). This kind of automatic system is, for
example, used by the Swiss retailers Mobile Zone, Marionnaud and Fust. One
example of a complex, state-of-the art ASR system comes from the company SAF
AG (Switzerland). The main advantage of their ASR software "SuperStore" is that it
9 Electronic Data Interchange.
10 Source: Wolfgang Mähr, Director IT, Spar Switzerland, 16.02.2004.
1. Introduction 7
makes a separate forecast for every item in every store. This is in contrast to other
software programs, which make their calculations at SKUs/stores clusters due to IT
performance restrictions (Beringe 2002). Furthermore, such forecasts do not rely only
on historic sales. Their sophisticated causal models also consider price, promotion,
seasons, holiday and other events when predicting demand. The introduction of this
product in the German over-the-counter chemist retailer dm-drogeriemarkt resulted in
a 70–80% reduction in OOS incidents and simultaneously reduced the inventory
stock level by 10–20% (Beringe 2002). A detailed classification of the various existing
ASR systems is provided in section 4.1.
Several technological developments were necessary to enable the implementation of
such sophisticated replenishment systems:
� Electronic inventory systems
� Identification technologies (barcodes, scanners)
� Data warehousing capacities (for historical sales data)
� Electronic data interchange (EDI)
� IT computation power (for forecasts at SKU level)
� Enterprise Resource Planning (ERP) systems
First, inventory management systems were introduced that made it possible to
manage quantities of a product in the electronic systems. These electronic inventory
systems profited markedly from identifying technologies such as the barcode. The
order process was simplified by using fax and electronic connections (e.g. EDI)
between companies. IT systems' storing capacity increased, making it possible to
handle larger amounts of data. The storing of huge quantities of POS (point of sales)
and inventory data became feasible with new data warehouses and storage
mediums. Furthermore, not only was it internal data that was more easily accessible;
thanks to larger communication bandwidths, it has became possible to access large
quantities of external data as well. This new external data includes competitive
information (e.g. the price of a competitor's products), market data (e.g. from
marketing institutes) and collaborative data (e.g. collaborative forecasts with
suppliers) (Beringe 2002). The increased IT-power performance has made it possible
to calculate in fractions of a second increasingly complicated forecasts at SKU level.
In a nutshell, IT-capabilities do not seem to be the decisive restriction anymore. This
statement is underlined by a study by Sabath, Autry et al. (2001) which shows that
the information system capabilities (such as timeliness of information or compatibility
of the IT) of the surveyed manufacturers and retailers are on average on a rather high

8 1. Introduction
level.11 The authors conclude that these companies already have the basic
requirements to operate automatic replenishment programmes.
Yet, IT is only one step towards ASR systems; other questions concerning the
organization and logistical processes arise. The introduction of ASR systems goes
hand in hand with the implementation of large-scale ERP systems, and thus has
radical implications for the organizations and processes of firms. For Kallinikos (2004,
p. 8), the introduction of these packages marks "a distinctive stage in the history of
computer-based information technology's influence in organizations." Their main
achievement is the new possibility for integrating operations and information across
functions, departments and modules. Therefore, the organizational and behavioural
implications have to be considered. One example is the role of employees; the
introduction of such automatic systems can result in a dramatic change of their
working habits:
"The changes resulting from the introduction of ASR systems are enormous. (...) It
is a change of paradigm. Who has today the same job as 5 years ago? (...)
Especially elderly employees have problems with the changes. Our planners have
been doing their jobs for 25 years; one has to take this into account."12
The importance of ordering for the store employees can be seen on the following
statement of a grocery employee, which altered René Descartes famous statement:
"I order, therefore I am."
1.4. Research Deficit
What is the contribution of academic research in the field of ASR? Surprisingly,
although several retailers have automated their order process in the last few years
(Småros, Angerer et al. 2004a), there is almost no academic source examining this
topic at the level of the store. It is worth noting that other technologies in retail, such
as RFID (Radio Frequency Identification) and the introduction of the barcode, have
received far greater attention from the public and from scholars.13 One explanation
could be that ASR is a technology working in the background. If it works properly,
consumers should notice it only indirectly, such as through higher availability in the
stores. Yet this would not explain the interest received by other technologies, such as
EDI, which also work in the background. To sum it up, the questions surrounding
11
See Table 5. 12
Source: Stefan Gächter, DC-director, COOP, 16.02.2004. 13
This statement can be illustrated by a look at the agenda of European ECR initiatives. There exist several
working groups dealing with RFID and barcodes, but none that deals with automatic replenishment.

1. Introduction 9
ASR systems arising for practitioners and researchers can only be partially answered
through a review of the literature. The few sources related to this topic are presented
in the following.
General Inventory Management Literature
The contributions that come from general inventory management literature are rather
basic. Existing academic sources of inventory modelling sources seek to answer the
two primary questions that arise when dealing with replenishment systems, namely
when should which quantity be ordered (Wagner 2002). Many papers in the
operations research (OR) field concentrate on the modelling of replenishment
systems, and try to identify an optimum under certain conditions (see Groote 1994;
Silver, Pyke et al. 1998; Bassok 1999; Gudehus 2001). Algorithms calculate minimal
inventory levels by choosing the right order quantity and order point so that certain a
priori set objectives are fulfilled (e.g. a certain percentage of service level, a
maximum out-of-stock rate, etc.). In general, much of the inventory management
literature remains very theoretical. The implementation of these models in daily
business is rather difficult (Wagner 2002). Many simplifications are made. When
calculating the optimum, the specific situation of retailers at store level is not taken
into account. The critical costs of retailers at store level are not inventory holding
costs, but handling costs, which can be between 3–5 times as large as the former
(Broekmeulen, van Donselaar et al. 2004b). Yet, store handling costs are seldom
taken into account in these mathematical models (cf. van Donselaar, van Woensel et
al. 2004).
ASR Related Literature
One of the few sources dealing directly with ASR systems is a dissertation published
by Norman Götz (1999). His main achievement has been to develop software that
enables the automation of order placement. This program uses existing forecasting
heuristics and combines them into a new one. The benefits of Götz's program are
shown with a simulation based on real data from two stores of a German drug
retailer. The theoretical benefit compared to the old system is an average cost
reduction of 14.5%, mostly from a reduction in the inventory holding costs. Götz's
simulation shows a strong effect of the automation on the OOS rate: Out-of-stocks
are reduced by almost 80%. The time savings for the stores are calculated at about 5
hours per ordering day. The remarkable contribution of this thesis is that for the first

10 1. Introduction
time the benefits of such systems were calculated, at least in theory.14 Götz stresses
that one of the main advantages of the system is that retailers have the power to
realize the described benefits on their own, independently from the rest of the market.
Nevertheless, his work is only the very beginning of the research on this topic. The IT
systems described in Götz's work are no longer state-of-the art.15 The overall focus of
his work is rather mathematical; the main goal is the development of an optimal
forecasting heuristic. Consequently, many aspects in the context of ARP systems
such as optimal implementation and organizational influences are not considered.16
Supply Chain Management
As valuable as Götz and other contributions from inventory management research
are, they show the limits of focusing strongly on mathematical or IT aspects when
dealing with ASR systems. An approach to the topic from a more abstract level could
be helpful, as the implementation of ASR systems is a fundamental change in the
way the flow of materials is triggered in a supply chain. Therefore, SCM research,
which deals with the importance of having demand-based replenishment systems
(pull systems), is examined in this thesis.17 One effect of such a pull-supply chain is a
major increase in efficiency and performance (Fiorito, May et al. 1995; Cottrill 1997;
Closs, Roath et al. 1998). Because the competition between grocery retailers is so
fierce, Bell, Davies et al. (1997) regard pull-supply chains as a necessity for every
retailer. A practical implementation of the idea of a demand driven supply chain are
automatic replenishment programmes (ARP). Common ARPs are Vendor Managed
Inventory (VMI), Continuous Replenishment Planning (CRP), Quick Response (QR)
and Collaborative Planning, Forecasting and Replenishment (CPFR).18 Overall, the
sources on this topic (e.g. Daugherty, Myers et al. 1999; Ellinger, Taylor et al. 1999;
Myers, Daugherty et al. 2000; Sabath, Autry et al. 2001) show the major benefits of
such programmes, because OOS and handling costs are reduced while the inventory
turn increases.
14
Götz (1999) used real data for his analysis. Yet, he did not prove that such systems would also work under real
life conditions. 15
For example, in order to save computing power, the products are clustered into 4 groups that have a common
forecast function. Today's systems have evolved rapidly in the last few years so that this constraint is no longer
relevant for today's ERP systems. 16
Only once does Götz acknowledge that performance could depend on the satisfaction of employees with the
new software and their commitment to it (Götz 1999, p. 186). 17
A pull system is driven by demand at the lowest point of the chain (Christopher 1998). In the context of this
thesis this would be the shopper in the store. 18
See for an explanation of these concepts Christopher 1998, chapter 7; Seifert 2002; Alicke 2003, pp.168-169
1. Introduction 11
Although the research methodology and findings of these researchers concerning the
performance and context influences of ARPs are remarkable, the transfer of their
results to the ASR systems context is limited. The research deficit in this field is that
the theoretical sources have concentrated up to now on pull systems from the
manufacturer to the retailer's distribution centres. In the context of ASR systems, it is
also necessary to consider the replenishing of stores. In ASR systems the demand is
being driven by the shopper in the store.19
Myers, Daugherty et al. (2000) recommend focusing future research on
replenishment automation in a single industry. Sabath, Autry et al. (2001, p. 103)
further state that "the issue of information systems capabilities is vital as well and
deserves further study." Furthermore, the authors point out the importance of making
additional investigations concerning organizational structure for developing decision
guidelines. All these research recommendations are considered in the conception of
this thesis.
Overview of Research Deficits
To sum up, more research on this topic is required because the subject of ASR has
not received in theory the attention it deserves considering its importance for
practitioners. The first deficit is that there is no academic source describing the
different systems in use; thus, a descriptive model and a classification has to be
developed. Furthermore, an examination of retailers has revealed that the
introduction of ASR was often part of changes taking places in the entire ERP
system, therefore significant financial and managerial inputs are necessary (Keh and
Park 1997). Although there are many success stories from practitioners describing
the enormous advantages of introducing automatic store replenishment systems
(see, for example, Beringe 2002; Anderson 2004; Hopp and Arminger 2005) there
has been only limited examination of such statements from academic sources.
Consequently, it is not surprising that some of the retailers interviewed are sceptical
about the sense of such systems. Even if practitioners are convinced as to the utility
of ASR, they remain insecure on the question of which system to choose for different
types of products. There is no conceptual framework available at the moment which
would help practitioners to choose an adequate replenishment system. In order to be
able to develop such a model more needs to be known about the relationship
between replenishment performance (e.g. OOS rate, inventory levels) and contextual
19
For a detailed explanation of the limitations of ARP see section 3.2.2.

12 1. Introduction
variables (such as store and product characteristics). Finally, it is not clear how
retailers have to adapt its organization and processes to best support the chosen
ASR system.
The research deficits in the context of ASR systems are summarized in Table 1.
Research Deficits Concerning ASR Systems
Missing:
� descriptive model and classification
� qualitative study on benefits
� knowledge about relationship between store and product
characteristics and the performance of replenishment systems
� method determining necessary replenishment system for each
product category
� knowledge on the change retailers' organization and
processes
Table 1: Overview of research deficits
1.5. Research Questions
In the last sections it was demonstrated that numerous unknowns exist in the context
of ASR systems. Therefore, this research aims to answer following main question:
Q: Under which conditions can retailers benefit from automatic store
replenishment systems?
Practitioners (cf. Bearing Point 2003) often speak of automatic replenishment
systems without taking into account that these systems can vary from very simple
heuristic- based decision systems to highly sophisticated ones with self-optimization
and complex forecasting models. This thesis aims to help practitioners choose the
right system for their business. This implies a need for identification as well as
categorization of the automatic replenishment systems available. For that, this thesis
first develops a descriptive model from which a classification is derived.
Consequently, the first sub-question, which provides support in answering the main
research question is:
Q1: How can automatic store replenishment systems be classified?

1. Introduction 13
The kind and magnitude of benefits discussed in theory and practice is very broad;
therefore, they are addressed in this thesis in particular. For three of the possible
benefits (fewer OOS incidents, lower inventory levels and lower inventory variability)
quantitative examinations are carried out. The second sub-question in this thesis is:
Q2: What benefits can a company expect from the implementation
of replenishment systems?
Practitioners want to know if the replenishment systems they are using are best
suited for them. To be able to choose the right systems for a given business and
product category, it is necessary to perceive the interrelations between the elements
of such systems and to understand the influence of environmental setting on
performance. Therefore, knowledge about the influence of store and product
characteristics on the ASR system outcome is necessary. Consequently, the next
sub-question is:
Q3: How is the performance of ASR systems influenced by product and
store characteristics?
A new automatic replenishment system does not only influence the performance of
replenishment it can also influence the entire distribution system, delivery frequencies
and employee working behaviour. Consequently, the choice of a new replenishment
system with all its implications for an organization is a strategic decision and will be
one focus of this thesis. Practitioners need a methodology for choosing the right
system. For this reason, the next sub-question is:
Q4: Which ASR system is recommended given the characteristics of a
certain product and retailer?
It can be assumed that some companies will not have a system that adequately
meets their needs. Consequently, the recommendation will be to implement another
type of ASR system. For an automatic replenishment system to reach its full
potential, next to technical requisites it is necessary to adapt the retailers'
organization and internal processes. Therefore, the last question that arises and
which will be examined is:
Q5: Which intra-organizational aspects of a company have to be changed to
adapt a new ASR system?
14 1. Introduction
1.6. Thesis Structure
This thesis is structured as follows:
� Chapter 1 highlights the major contribution of logistics for retailers and
describes current challenges in retail. This chapter ends with the derivation of
the principal research questions from the research deficits. The methodology
for addressing these research questions is depicted in
� Chapter 2. This chapter sets out the research framework, the methodologies
used to address the research questions and illustrates the activities
undertaken by the author to accompany and guide the research process.
� Chapter 3 highlights the contribution of theoretical sources for this thesis. Four
research perspectives are examined, namely inventory management, logistics
and operations management, business information systems and contingency
theory. The theoretical findings from this chapter, together with evidence from
interviews, are the foundation of
� Chapter 4. In this chapter, hypotheses and models concerning automatic
store replenishment systems are developed. First, a descriptive model and a
classification structure for ASR systems are presented (Q1). Second, an
explanatory model is developed that explores the correlation between the
performance of retailers and the store, product and ASR system
characteristics. The created hypotheses are tested in
� Chapter 5, in a quantitative analysis with the help of real inventory and sales
data from a grocery retailer. One part of the statistical analysis shows how the
OOS rate and the stock levels of the automated goods changed compared to
a control group (Q2). Another part of the chapter illustrates the correlation
between store/product characteristics and ASR performance (Q3). A major
finding described in this chapter is that ASR systems are indeed beneficial for
retailers, yet their contribution depends strongly on how they are implemented.
Therefore, in
� Chapter 6 there is a description of how four European retailers have
implemented sophisticated ASR systems. The case studies show the required
organization and processes for successful ASR implementation (Q5). This
chapter ends with several action recommendations for mangers as regards
store operations and choice of system (Q4).
� Finally, Chapter 7 summarizes contributions to theory and practice.
Figure 4 illustrates the structure of this thesis.

1. Introduction 15
2. Research Framework and Design
How can the research questions be answered?Result: Research framework and methodology
2. Research Framework and Design
How can the research questions be answered?Result: Research framework and methodology
8. References & Appendix8. References & Appendix
4. Development of Models
Descriptive model and classification of ASR systemsExplanatory modelResult: Models and hypotheses to describe and explain different ASR systems
4. Development of Models
Descriptive model and classification of ASR systemsExplanatory modelResult: Models and hypotheses to describe and explain different ASR systems
1. Introduction
The challenge of store replenishment for retailersResearch deficits and research questions
1. Introduction
The challenge of store replenishment for retailersResearch deficits and research questions
3. Literature Research
Four theoretical perspectives: inventory management, logistics/operations management, business information systems and contingency theory Result: Theoretical foundation of thesis
3. Literature Research
Four theoretical perspectives: inventory management, logistics/operations management, business information systems and contingency theory Result: Theoretical foundation of thesis
6. Field Research and Managerial Implications
Case studies from four European retailers Result: Required changes for successful ASR implementation
Decision tree: adequate ASR system Recommended store operations
6. Field Research and Managerial Implications
Case studies from four European retailers Result: Required changes for successful ASR implementation
Decision tree: adequate ASR system Recommended store operations
5. Quantitative Analysis
Sample and statistical methodologyTesting of hypothesesResult: Proof of the benefits of ASR systems
5. Quantitative Analysis
Sample and statistical methodologyTesting of hypothesesResult: Proof of the benefits of ASR systems
7. Conclusion
Contribution to practice and theoryResearch limitations
7. Conclusion
Contribution to practice and theoryResearch limitations
combined with interview results is the basis of
developed hypotheses are tested in
how to introduce ASR systems in practice is shown in
defines main focus of
Q1Q1
Q4Q4 Q5
Q5
Q2Q2 Q3
Q3
Figure 4: Thesis structure

16 2. Research Framework and Design
2. Research Framework and Design
The outcome of any research is strongly affected by the choice of the research
methods and strategies. As Scandura and Williams state (2000, p. 1249) "[a]ny
research method chosen will have inherent flaws, and the choice of that method will
limit the conclusions." This means that design choices about instrumentation, data
analysis and construct validation may affect the types of conclusions that are drawn
(Sackett and Larson 1990). Therefore, this chapter gives an overview of the research
methodology chosen for this thesis. First, a research framework narrows the research
field down. Second, the qualitative and quantitative research methods are depicted
before, finally, the research activities that led to this thesis are presented.
2.1. Research Framework
The research framework mainly focuses on the role of automatic replenishment
systems for European grocery retailers. The main research field of this thesis is not
the distribution system to the store itself, but the ordering logic that lies behind it
(see also Figure 5). This means that the focus of the thesis is the logic of the system
that decides at what time and in what quantity the goods are replenished in a store.
The routes taken by the goods or their mode of transportation are only secondary in
this context. Consequently, whenever in this thesis the term "supplier" is used, there
is no differentiation between products that have come from a retailer's own
distribution centre or directly from the manufacturer. The shop-floor logistics (i.e. how
the goods are transported from the backroom to the shelves) are a relevant part of
the research framework, especially when talking about changes in process due to
ASR implementation.
DC retailerDirect supplier
DC retailerDirect supplier
Store ordering processes
(major European
grocery retailers)
Store ordering processes
(major European
grocery retailers)Flow of material
(replenishment of products)
Flow of information(order-, inventory level-,
POS-data ...)
Pre-supplierPre-
supplier SupplierSupplier CustomerCustomer
Focus of thesis
Figure 5: Focus of research

2. Research Framework and Design 17
The focus on Europe does not mean that such systems are not interesting for other
retailers from other world regions as well. The OOS studies mentioned in the
introduction show a similar level of operational problems all over the world (Gruen,
Corsten et al. 2002; Roland Berger 2003b), and replenishment systems play an
important role for North American retailers as well. A Bearing Point technology study
(2003) shows that although 61% of the North American retailers studied use
automatic replenishment systems, only 38% have a well-documented and
established inventory management strategy and thus a clear view of how such
systems are best implemented within the organization. As there are no fundamental
differences in the logistics or store operations between these two regions, one can
presume that the findings will be significant for American retailers as well.20 The
same holds true for retailers from other regions so that the result of the European
research will be most probably globally relevant.
The grocery retailers group is among the most interesting ones in retail, as the
leading grocery retailers have in the last decades broadened their categories to
products that are not related to the food sector at all. Guptill and Wilkens (2002)
describe a grocery store as a retail store with at least 1,500 different food items
and/or $2 million in annual sales that sells dry grocery, canned goods and non-food
items plus some perishable items. A grocer is, according to the Oxford English
Dictionary, a "trader who deals in spices, dried fruits, sugar and, in general, all
articles of domestic consumption except those that are considered the distinctive
wares of some other class of tradesmen."21 This last definition does not seem to be
precise enough nowadays. The leading retailers sell through their distribution
channels almost all kinds of consumer goods that were some decades ago only
available at certain speciality stores (e.g. apparel, computers, household goods,
garden articles, etc.). The term modern grocery22 is sometimes used to separate the
core business of groceries (food and near food) from more exotic products (e.g.
financial services). This large variety of articles force retailers to have separate
logistics strategies for their items, depending on various factors such as speed of
turnover, value, demand volatility, etc. Some retailers have adopted different
strategies and channels to distribute their products. There exists a large variance of
stores, ranging from rather small supermarkets (200 m2) to huge hypermarkets
(10,000 m2 and larger). This breadth of product range and store size among grocery
20
This is a so-called analytical generalization as described by Punch (1998). 21
Source: definition found on the site http://www.oed.com (accessed 01.09.2005). 22
The term modern grocery is taken from the definition of Planet Retail: modern grocery distribution includes both
grocery and non-food sales from modern grocery distribution formats. It excludes sales from independent
specialist formats and wet markets. Source: http://www.planetretail.org (accessed 01.09.2005).

18 2. Research Framework and Design
retailers will facilitate the generalisation towards other retailers with similar product
categories or distribution channels. Another advantage of this group is the high
variance that exists within it: some grocery retailers still rely on completely manual
systems, while others have implemented very sophisticated systems with complex
forecasting algorithms (Småros, Angerer et al. 2004a). Grocery retailers have to fulfil
consumers' wishes immediately, as supermarket visitors are not normally willing to
wait for the delivery of their goods. This business has further a strong demand
volatility as many products are easily substituted, making SKU-level forecasts
difficult. Therefore, all the grocery retailers have adopted a make-to-stock strategy.23
Another benefit of studying grocery retailers is that they are rather well organized in
initiatives such as ECR-Europe. There are several project groups analysing their
supply chains and the benefit of collaboration, standardization, electronic data
interchange, identification and more so that additional information sources are more
easily available for researchers. And last but not least, the choice of grocery retailers
follows the research tradition of the institutes ITEM and KLOG at the University of
St.Gallen, where this subgroup of retailers has been examined for several years.
2.2. Research Methodology
The long tradition of the University of St.Gallen to focus on topics that are relevant to
business practice is fully continued by this work. One of the main advocates of this
statement is without doubt Hans Ulrich. For him, business science is understood as a
leading and managing-science and has thus the central objective of giving
practitioners the ability to act and to make decisions in a scientific way (Ulrich 1981).
The starting point for each research project in business science is an analysis of
existing practical problems. First of all, interesting situations, correlations and
contexts are observed from a practical point of view and then are conceptualised
(Ulrich 1981). The concepts that are developed are tested in practice again and again
and become gradually more refined. This iterative learning process will finally
generate at the end of the research process theoretical and practical solutions to the
identified problems that can again be tested in practice (Kromrey 2002). Ulrich's
design of a 7-step research process was the base for the structural approach of this
thesis (see Figure 6). The main characteristics of this procedure are the iterative
approach and the deep contact of the researcher with the practice.
23
For an explanation of make-to-stock see Alicke (2003, p. 50).

2. Research Framework and Design 19
Step 1: Identifying and structuring problems and their potential solutions that are relevant to business reality
Step 1: Identifying and structuring problems and their potential solutions that are relevant to business reality
Step 2: Identifying and interpreting theory and hypotheses of the empirical social sciences relevant for the targeted problem
Step 2: Identifying and interpreting theory and hypotheses of the empirical social sciences relevant for the targeted problem
Step 3: Identifying and specifying formal scientific procedures that are relevant for the targeted problem
Step 3: Identifying and specifying formal scientific procedures that are relevant for the targeted problem
Step 4: Identifying and assessing the relevant application contextStep 4: Identifying and assessing the relevant application context
Step 5: Deriving rules and modelsStep 5: Deriving rules and models
Step 6: Testing rules and models in the application contextStep 6: Testing rules and models in the application context
Step 7: Documenting research results and consulting of practitioners Step 7: Documenting research results and consulting of practitioners
Practice
Practice
Practice
Formalsciences
Empiricalsocial sciences
Figure 6: Integrative research procedure24
In the first part of the research process (steps 1 to 4), a mix of qualitative research
methodologies is used. These research steps are documented in this thesis in
chapter 2 and 3. Campbell and Fiske (1959) have stressed the importance of using
several methodologies to overcome the main deficiency of qualitative research: the
limited generalisation. Denzin (1978; 1989) in turn develops the term "multiple
triangulation" that applies when researchers combine multiple observers, theoretical
perspectives, sources of data and methodologies in one investigation. He further
states that "all the advantages that derive from triangulating single forms are
combined into a research perspective that surpasses any single-method approach"
(Denzin 1978, p. 304). The term triangulation is a metaphor from navigation which
"use[s] multiple reference points to locate an object's exact position" (Smith 1975, p.
273). The triangulation of data collection settings affects the external validity of the
results (McGrath 1982). Several researchers from social and business sciences,
such as Webb, Campbell et al. (1966), Smith (1975) and Jick (1979), recommend
triangulation. The research process used in this thesis adopts this methodology by
simultaneously combining different research methods and data collection forms.
24
Source: adapted and translated from Ulrich (2001, p. 222).

20 2. Research Framework and Design
Mc Grath (1982) defines eight research strategies used in management research.
The one strategy corresponding closest to the methodology used in this thesis is the
field study. Field studies investigate behaviour in its natural setting. The data is
collected by the researchers themselves on site. Scandura and Williams (2000, p.
1251) give the advantages and risks of this method:
"This strategy maximizes realism of context, but it can be low on precision of
measurement and control of behavioural variables (there is lack of experimental
control). It can also be low on generalizability to the population, with the study
population not representative of the target population."
Despite these drawbacks, this research strategy is extremely popular. In a review of
385 papers of the journals Academy of Management Journal, Administrative Science
Quarterly and Journal of Management from the years 1995–97, Scandura and
Williams (2000) found out that 67.5% of all papers had chosen field studies as the
research strategy. Ten years previously the percentage was only 54.1%, therefore a
significant increase had taken place. An example of this strategy in this thesis is the
KLOG OOS-project conducted for the grocery retailer MYFOOD. This was not an
experiment, as no variable was manipulated, and the researchers acted merely as
observers.
The data collection and its analysis comprise qualitative and quantitative research
strategies. Friedli, Billinger et al. (2005) state that the three most frequently used
methods of qualitative research are action research, grounded theory and case
study. The main methodology used in this thesis is the last. The basic idea behind
case studies is to investigate only a small number of cases, sometimes even only
one, yet these in a great detail. As Punch (1998, p. 150) states, "the general objective
is to develop as full an understanding of the case as possible." According to Yin
(1988, p. 23), a case is an empirical inquiry that:
" � Investigates a contemporary phenomenon within its real-life context; when
� the boundaries between phenomenon and context are not clearly evident;
and in which
� multiple sources of evidence are used."
As demonstrated in section 1.4, there are almost no existing academic sources that
investigate the topic of this thesis. The focus on the case study method seems
therefore to be most appropriate for this research project, as this methodology is
recommended for researching topics in new areas (Eisenhardt 1989). The external
validity of qualitative studies is sometimes considered to be limited. It is true that case
study research is not able to give statistical generalisation, hence the external validity

2. Research Framework and Design 21
comes from analytical generalisation (Gassmann 1999). In case study research,
however, generalisation is not always the goal. Some cases might be so important or
interesting that they deserve a study in their own right (Punch 1998). To achieve
generalisation, it is necessary to conduct the research at a sufficient level of
abstraction:
"The more abstract the concept, the more generalisable it is. Developing abstract
concepts and propositions raises the analysis above simple descriptions, and in
this way a case study can contribute potentially generalisable findings" (Punch
1998, p. 155).
The main advantage of case studies is that they are most appropriated for describing
and understanding complex social systems (Marshall and Rossmann 1995). Another
argument for the case study approach is that the phenomenon observed in this thesis
happens in the presence of but cannot be influenced by the researcher (Yin 1988).
The main reason for choosing the case study method is that case studies have a
holistic focus and aim to preserve and understand the wholeness and unity of a case
(Punch 1998).
More than 50 interviews with practitioners were conducted, with the aim of reaching
an in-depth understanding of retailers' logistics (see the interviews listed in section
1.1). These interviews are conducted orally, as the actuality and explorative character
of this research phase would not support a written interview technique (Lamnek
1993). The intimate connection with empirical reality that is demanded by Glaser and
Strauss (1967) in order to develop a sound, relevant and testable theory is
guaranteed with this approach. There are, nevertheless, also elements from another
two popular qualitative methods. The main idea from grounded theory is that
qualitative research has the goal of generating new theories (Punch 1998; Friedli,
Billinger et al. 2005). And from action research the idea is adopted that the starting
point for a research project is not a theory but a problem in practice (Coughlan and
Coghlan 2002). The aim of the action researcher is to attempt to change the
examined system and obtain a desired new status (Ulrich 1981; Coughlan and
Coghlan 2002). The author was not personally involved in this change; nevertheless
the last chapter of the thesis gives recommendations to managers as regards
technical and organizational changes that a retailer may undergo to reach a new
level of automation.
In order to derive and test rules and models (steps 5 and 6), four case studies of
retailers using advanced ASR systems are described (chapters 4 and 5 in this
thesis). This is the part of the research project with the greatest interaction with

22 2. Research Framework and Design
practice; several iterative loops between theory generation and theory verification are
carried out. On the one hand, the information gained from the interaction with the
chosen companies is used to verify and refine the descriptive model developed in
sections 4.1 and 4.2. On the other hand, the information gathered is the main source
for developing the explanatory model. Closure is achieved when the differences
between collected data and developed theory is small (Bansal and Roth 2000). A
good illustration of this iterative process can be seen in Figure 7.
Questions to reality
Questions to reality
Iterative learning
processData collectionData collection
Problems ofpractice
Problems ofpractice
Phenomenonof practice
Phenomenonof practice
Critical reflectionof gained picture
of reality
Critical reflectionof gained picture
of reality
Differentiation,abstraction, change
of perspective
Differentiation,abstraction, change
of perspective
Theoreticalcomprehension
Theoreticalcomprehension
Literaturereview
Literaturereview
Own constructs
Own constructs
THEORY EMPIRICISM
Figure 7: Case study research as iterative process between theory and empiricism25
For the creation and verification of the models, the author does not rely only on
qualitative data. As stated by Yin (1988) and Eisenhardt (1989), the data collection
method and the case study process can also include more qualitative elements.
While experiments have great internal validity because of their precise control of
variables, an additional external validity can be achieved by accompanying surveys
(Scandura and Williams 2000). Therefore, next to several in-depth interviews
(qualitative data), archival documents review, participant observation and analysis of
the data gained from the ERP system of one retailer is included. This process allows
the researcher to gain an even broader understanding of the company, or as Jick
(1979, p. 603) states: "a more complete, holistic and contextual portrayal of the
unit(s) under study." In addition, the quantitative analysis is a critical part of the
testing of the models and hypotheses created in section 4.3.
Some researchers criticise the simultaneous use of quantitative and qualitative
methods, as every method has different aims and purposes (Dey 1993). The
traditional distinction between two schools of social sciences, one oriented towards
25
Source: translated from Gassmann (1999).

2. Research Framework and Design 23
the qualitative development of theories, the other directed at the quantitative testing
of theories, is criticised by Baumard and Ibert (2001). The authors point out the
importance of not being dogmatic, as both forms of data are useful for constructing
and testing theories. Or, as Glaser and Strauss (1967, p. 17) formulate:
"There is no fundamental clash between the purpose and capacities of qualitative
and quantitative methods or data. (...) Each form of data is useful for both
verification and generation of theory."
The final step in this research project (step 7) is the developing of recommendations
for managers (chapter 6 of this thesis) and the documentation of the findings in form
of the presenting thesis.
2.3. Research Process
The research process was guided by several activities which can be seen in
Figure 8.
Summer2005
(1) Literature review(1) Literature review
(7) Synthesis of the results: writing of thesis(7) Synthesis of the results: writing of thesis
October2002
(6) Field research: qualitative and quantitative analysis(6) Field research: qualitative and quantitative analysis
(5) Consulting
projects
(5) Consulting
projects(2) Activities
with
ECR-Europe
(2) Activities
with
ECR-Europe
(4) European
grocery
research
study
(4) European
grocery
research
study
(3) Supervision
of Bachelor
and Master
theses
(3) Supervision
of Bachelor
and Master
theses
(5) Consulting
projects
(5) Consulting
projects(2) Activities
with
ECR-Europe
(2) Activities
with
ECR-Europe
(4) European
grocery
research
study
(4) European
grocery
research
study
(3) Supervision
of Bachelor
and Master
theses
(3) Supervision
of Bachelor
and Master
theses
Figure 8: Research activities in this research project
The investigation began, as expected, with a thorough review of the available
literature and other information sources (Activity 1). Due to the lack of academic
papers dealing with ASR systems, the research started with more general inventory
theory and logistics literature. Later, the research concentrated on papers targeting
typical retail problems, such as data accuracy, inventory visibility and other logistics

24 2. Research Framework and Design
challenges. A new perspective came from the study of papers dealing with business
IT and contingency theory.
The involvement in the ECR Europe community was critical to obtain first hand
information from practitioners (Activity 2). In several dialogues and meetings, the
author deepened his understanding of business practices and current challenges in
the retail and consumer goods industry. The involvement of the author in the ECR
community was:
� Personal involvement in the ECR-Switzerland working group "On-shelf
availability"
� Participation in the quarterly ECR-Switzerland working meetings and the
official ECR Europe Conferences in Berlin (2003), Brussels (2004) and Paris
(2005).
� Participation in various activities of the ECR Europe Academic Partnership,
including the publishing of the ECR Journal and the organization of the annual
ECR Student Award.
The supervision of bachelor and master theses was an additional important source of
first hand information from practitioners in the industry (Activity 3). All supervised
works focused on actual problems of enterprises in the consumer goods sector and
gave a broad overview of the performance of logistics within retailers:
� CPFR in the sports industry. Simon Steiner (2003)
� CPFR in the fashion and apparel sector. Marion Brägger (2003)
� CPFR in the German grocery retail market. Juerg Neuenschwander (2004)
� CPFR in the consumer electronics industry. Thomas Köhl (2004)
� Chances and limits of CPFR in the Swiss grocery retail. Diego Rütsch (2004)
� Limits and possibilities of CPFR in the Swiss grocery retail. Dominic Loher
(2004)
� Supply Chain Management in the fashion industry: critical factors. Benjamin
Brechbühler (2004)
� The operational control of stores with inventory management systems. Remo
Maggi (2004)
� Efficient Consumer Response. Impacts on consumer and welfare. Gabriella
Todt (2005)
The supervision of this work resulted in over 45 documented interviews with directors
and managers in charge of logistics and supply chain management, category
management, or information technology. The chosen companies were mainly
retailers, followed by logistics and technology services providers. This more

2. Research Framework and Design 25
explorative approach led to a deep understanding of the current logistics processes
within retailers. The result of this inductive qualitative approach was the creation of
the descriptive and parts of the explanatory model (see chapter 4.3).
The next information source for the creation of the models and hypotheses was the
pan-European study "Logistics processes of European grocery retailers" (Activity 4).
It was launched in autumn 2003 and lasted for about a year. The aim of the study
was to investigate the current logistics processes and performance of leading
European grocery retailers. The study was conducted as a collaborative project
involving researchers representing five different European universities.
The consulting projects conducted together with industrial partners were another
important source of information (Activity 5). The most valuable project for the
research into on-shelf availability was conducted with the grocery retailer MYFOOD.
The data gained through this project is the main data source for the quantitative
analysis (see chapter 5). In addition, close contact with employees from MYFOOD
gave helpful insights into retailers' replenishment operations.
The last activity before finishing the thesis (Activity 7) was the creation of field
research of European retailers that have ASR systems in use (Activity 6). First, in
short interviews (about 15 minutes), some 30 German, Swiss and Austrian retailers
from very different consumer goods sectors were asked about their replenishment
practices. The information gained in this survey was used to choose the four
companies for the case study and also to design a semi-structured interview for the
analysis. The selected companies and the outcome can be seen in chapter 6.

26 3. Literature Research
3. Literature Research
There exists almost no academic source that deals directly with automatic store
replenishment systems at retail store level. Yet, even if theory cannot provide direct
answers to the research questions, it is fruitful to consider the presented practical
problem from different theoretical perspectives in order to obtain new impulses for
this research project. Therefore, four theoretical research sources are addressed
below in detail to verify, what contribution further theoretical streams can offer. The
literature research focuses on sources dealing with inventory management, logistics
and operations management, business IT and contingency theory (see Table 2).
Perspective Contribution to the Thesis/ Research Question
Inventory Management
� Definition of decisions an ASR system has to take (descriptive model) � Existing replenishment logics and strategies for replenishment systems
(classification) � Performance of different replenishment logics � OOS research: reasons and interrelations � Forecasting methods and typologies
Q1
Q3
Logistics and Operations Management
� Benefits of well specified and organized logistics systems and programmes
� Best practice in store operations � Coordination of structures, processes and systems to increase the
efficiency of the SC
Q2
Q5
Business IT Theories
� Role of Enterprise Resource Planning (ERP) systems � Organizational and human agency changes due to new technology
Q4
Q5
Contingency Theory
� Importance of the choice of the right ASR system for a given environment � Organizational perspective: influence of the contextual factors within an
organization on performance of ASR systems
Q4
Q5
Table 2: Overview of basic theoretical sources reviewed (excerpt)
3.1. Inventory Management Perspective
The first perspective that is used to examine the research problems focuses on the
challenge of right inventory management. Existing academic sources in inventory
modelling seek to answer the two primary questions that arise when dealing with a
replenishment system, namely when should which quantity be ordered (Wagner
2002). Many sources in the operations research (OR) field concentrate on the
modelling of replenishment systems, and try to identify an optimum under certain
restrictions (see Groote 1994; Silver, Pyke et al. 1998; Bassok 1999; Gudehus 2001).
They seek to obtain a minimal inventory level by choosing the right order quantity and
order point so that certain a priori set objectives are fulfilled (e.g. a certain percentage

3. Literature Research 27
of service level, a maximum rate of out-of-stock, etc.). This approach has been widely
used in practice for many years (cf. Chang 1967). More sophisticated models seek to
optimize a specific utility function. The challenge here is to identify and quantify all
the relevant logistics costs that should be included in this function. Inventory costs
include factors such as the cost of carrying stock, order costs, safety stock costs,
transport costs and an estimate of the out-of-stocks costs. For example, Galliher,
Morse et al. (1959) and Dalrymple (1964) explicitly consider OOS-costs in their
inventory control systems.26 The financial importance of optimal inventory control for
companies is stressed by many authors such as Vollmann, Berry et al. (1992) and
Dubelaar, Chow et al. (2001). Some sources even investigate the importance of the
inventory for entire economies. In the United States, for example, the inventory value
as a percentage of the GDP was in 1993 as high as 17.7% (Silver, Pyke et al. 1998).
In the following sections, first theoretical inventory management sources dealing with
mathematical models are highlighted. Papers and studies that in particular examine
OOS situations in retail form the second part of the inventory management
perspective.
3.1.1. Optimization in Inventory Management Research
Inventory control systems have the aim of balancing demand and supply, reducing
overall inventory costs and assuring an adequate service level (Wegener 2002).
There are countless papers dealing with the modelling of sophisticated mathematical
solutions for such inventory management systems (see e.g. Chang 1967; Inderfurth
and Minner 1998; Ketzenberg, Metters et al. 2000).27 Wagner (2002) criticises the
rather theoretical approach of these papers; their implementation in real life
applications is problematic.
Several other authors concentrate on retailers and their specific inventory
management challenges. An identified central strategic issue that influences the
success of a retailer is the setting of the right service level (Balachander and
Farquhar 1994; Gudehus 2001; Zinn, Mentzer et al. 2002). Other papers deal directly
with the optimal ordering policy for retailers from a marketing point of view, i.e. they
look for the optimal assortment and shelf combination to maximize sales. In the
1960's and 70's, several experiments were conducted to measure the effect of shelf
facings and inventory quantity on sales (e.g. Kotzan and Evanson 1969;
26
A detailed discussion of this cost function can be found in section 4.1.2. 27
For an overview of the history of OR research on inventory control, see Wagner (2002).

28 3. Literature Research
Krueckenberg 1969; Cox 1970; Curhan 1972). In the following decades, other
models sought to calculate an optimum in order to minimize inventory, shelf space
costs and backorder (c.f. Corstjens and Doyle 1981; Cachon 2001). In these models,
the handling costs are normally ignored. An exception is the paper by Broekmeulen,
van Donselaar et al. (2004a). These last researchers state that the inventory carrying
costs are low compared to the handling costs, therefore they suggest a
replenishment logic that takes shelf space and package restrictions more strongly
into account.
3.1.2. Theoretical Sources on OOS
A group of inventory management papers reviewed deals directly with OOSs. These
papers can be split into two sub-groups. The first group empirically studies the extent
and causes of OOSs. The first OOS study, conducted nearly 40 years ago, reports
an average OOS rate of 12.2% (Progressive Grocer 1968). More recent studies
report an OOS rate between 7% and 10% (Andersen Consulting 1996; Gruen,
Corsten et al. 2002; Roland Berger 2003b; Stölzle and Placzek 2004). The second
sub-group takes a marketing and behavioural perspective and studies the reaction of
consumers towards out-of-stock that crucially influence retailers' sales (e.g.
Emmelhainz, Stock et al. 1991; Drèze, Hoch et al. 1994; Zinn and Liu 2001; Sloot,
Verhoef et al. 2002). Retailers try to increase their sales with two groups of
market-driven tactics. On the one hand, there are "out-of-stores" tactics, which try to
bring more consumers into the stores. Avoiding OOSs is, by contrast, an "in-store
tactic." The latter tactics generally attempt to extract more surplus from shoppers
once they are in the store. An attractive, full shelf attracts the attention of the
consumer, making a purchase more probable. As shelf space is expensive28, retailers
have to decide whether to place another facing of a certain product (to increase its
visibility and/or reduce the OOS probability) or to place an additional SKU (Drèze,
Hoch et al. 1994). Several studies prove the value of such store specific micro-
merchandising; consumer decision-making can be strongly influenced. Only one third
of purchases are specifically planned in advance of a shopping trip (Dagnoli 1987).
Many buying decisions are made on a low level of involvement and very quickly
(Hoyer 1984). In addition, the average shopper shops in 3–4 supermarkets each
week (Coca-Cola Retailing Research Council 1994). With these facts in mind it is
easy to see the magnitude of the impact OOS still has today for grocery retailers'
28
In the USA store occupancy costs range between $20 per square foot for dry grocery and $70 per square foot
for frozen goods (Drèze, Hoch et al. 1994).

3. Literature Research 29
sales. The knowledge of consumer behaviour is necessary to calculate the losses
connected with OOSs.
3.1.3. Contributions and Deficits of an Inventory Management Perspective
The inventory management perspective has a significant contribution to this thesis:
� Basis of descriptive model
� Foundation of relationships in explanatory model
� OOS magnitude and impact
The descriptive and explanatory models developed in chapter 4 are based on
contributions from inventory management sources.29 In particular, the sources that
deal with challenges of replenishment in retail are of major value for this thesis. The
papers and studies dealing with OOS highlight the magnitude of this problem in
practice, illustrate the underlying reasons for low product availability and demonstrate
possible solutions.
Nevertheless, there are also some limits to the potential contribution of the theoretical
inventory approach to this research field:
� Simplified view of reality
� Context parameters are regarded as given
� Missing organizational and contextual aspects
First, all mathematical inventory models assume a very simplified view of reality so
that it is often very difficult to apply such systems a given real-life situation. Second, it
is often assumed that the parameters in such systems are given. What is overlooked
is that many parameters can be changed by the organization (e.g. delivery frequency,
case pack size) so that the strategic dimension of such decisions are not examined.
And third, these OR papers normally neglect the organizational and contextual
aspects of replenishment systems, which are nonetheless critical for the performance
of such systems. An exception to the last statement is the paper by Zomerdijk and
Vries (2002), as the authors place their research focus on environmental influences
of inventory control systems. The basic message of the authors is that, beside the
traditional points of attention such as order quantities and replenishment strategies, it
is critical to take care of contextual and organizational factors. The authors identify
four significant aspects in the organizational context of inventory management: task
allocation, decision-making and communication processes as well as the behaviour
29
For an overview of authors see Table 6.

30 3. Literature Research
of personnel. The notion of examining the contextual focus of replenishment systems
is a fundamental concept that is incorporated into the research questions (see
section 1.5).
Overall, a purely mathematical approach to inventory management is not appropriate,
as Wagner (2002) states. He sees a major problem in the fact that classical inventory
research is blind to all the "dirty data" issues that challenge companies (i.e. the data
in the system is not accurate enough to be used for control and calculations). As
Wagner further states, inventory modelling research is far removed from the
entrenched software that now drives supply chain systems. Therefore, it is necessary
to implement a comprehensive discussion of ERP and inventory holding systems, as
will be accomplished in section 3.3.
3.2. Logistics and Operations Management Perspective
Academic sources dealing with logistics and operations management form the
second perspective addressed in this thesis. Logistics research can be defined as the
systematic and objective search for and analysis of information relevant to the
identification and solution of any problem in the field of logistics (Chow and
Henriksson 1993). The basic assumption behind logistics research is that a particular
course of action will be correlated with logistics performance (Chow, Heaver et al.
1994). The problem starts with the definition of performance, sometimes hard
measures are meant (such as delivery time or net income), and sometimes more soft
measures are in the focus (such as consumer happiness ratings or flexibility). Both
perspectives have their strengths and weaknesses. A comprehensive overview of the
literature on this topic is made by Chow, Heaver et al. (1994). Their main criticizing
point is that none of these studies examines logistics performance in the context of
supply chains. Yet this statement has to be revised today in the light of the
comprehensive literature on this topic (cf. Stölzle, Heusler et al. 2001; Karrer,
Placzek et al. 2004; Stölzle 2004).
The logistics research cannot be completely separated from another research stream
that is of great relevance for this thesis: operations management. Operations
management is an area of business that is concerned with the production of goods
and services, and involves the responsibility of ensuring that business operations are
efficient and effective.30
30
Definition by Wikipedia (URL: http://www.wikipedia.org, accessed 1.09.2005).

3. Literature Research 31
In the following, three research streams are looked at: sources dealing with Supply
Chain Management (SCM) and Efficient Consumer Response (ECR), with Automatic
Replenishment Programmes (ARP) and sources examining retail operations.
3.2.1. Supply Chain Management and ECR
Supply Chain Management describes an approach between interdependent firms to
collaboratively manage material and information flows (Corsten 2002). One of the
basic principles of SCM is the management of connected activities that involve
several units in a supply chain. The term "units" can refer to departments within an
organization, but SCM also deals with "the management of upstream and
downstream relationships with suppliers and customers" (Christopher 1998) that are
outside the company. One of the goals of SCM is to reduce the inefficiencies, e.g. the
bullwhip effect (Lee, Padmanabhan et al. 1997a), observed in many supply chains.
The term SCM is understood here in broader terms; the explicit distinction between
logistics management and supply chain management that is sometimes found in the
American literature is not made.
Many SCM papers focus on the ideal design of supply chains (Lee and Billington
1992; Anupindi 1999; Gudehus 2001; Gudehus 2004; Pfohl 2004), how to control
them (Lee and Billington 1993), how to cope with the uncertainty of demand (Fisher,
Hammond et al. 1994; Feitzinger and Lee 1997) and the importance of sharing
information between firms (Lee, Padmanabhan et al. 1997b; Cachon and Fisher
2000; Chen, Drezner et al. 2000). Hines, Holweg et al. (2000), for instance, have built
a very colourful model of supply chains, comparing supply chain systems with waves
breaking on a beach. The book of Womack and Jones (1996) brought new
momentum to logistics and operations management by describing the authors' notion
of a lean supply chain.
One field of SCM deals with the creation of pull-based systems and is therefore
closely related to the ASR topic. Several authors stress the need for push systems
for obtaining efficient supply chains (Fiorito, May et al. 1995; Cottrill 1997). As Bell,
Davies et al. (1997) state, one of the main opportunities and at the same time
challenges for food retailers nowadays is the transformation of supply chains from a
push to a pull strategy. A pull system is driven by demand at the lowest point of the
chain (Christopher 1998). In the framework of this thesis, the lowest point is the
shopper. The simulation of Closs, Roath et al. (1998) demonstrates the benefits of a
response-based system. Their pull-replenishment model is able to reduce uncertainty
by sharing information between supply chain partners. The created automatic

32 3. Literature Research
replenishment system reduces (at least in theory) system-wide inventory by 25%,
delivers 2–3 percentage points better service level and gives more robust results
across a wide range of environments than traditional retail order-based systems. An
additional finding of major interest is that most of the inventory reduction happens at
retailer level. As a study of 12 major European groceries shows (Småros, Angerer et
al. 2004a), this is the part of the supply chain with the most need for improvement in
the stock situation. The new pull-replenishment system described by Closs, Roath et
al. (1998) creates benefits for all partners in the supply chain. A prerequisite for this
system, apart from investment in information technology, is the integrated inter-
organizational management of relationships. This means a change in the mindset of
the buyers and sellers, as the risks and the rewards have to be shared in a
cooperative approach. The first hurdle in such a cooperative attitude is the initial cost
associated with the IT introduction. A drawback of Closs, Roath et al.'s (1998)
approach is that their model stops at the retailer DCs, and does not take into account
retailers' stores. Yet, the aim of a responsive supply chain cannot be solved by just
the implementation of such technical systems. How retailer's processes and
structures have to change to adapt such a demand-based supply chain is, for
example, partly described in the case study by Fisher, Hammond et al. (1994) on the
apparel retailer Obermeyer. Again the contextual situation plays a major role when
designing the supply chain and replenishment systems and processes.
Lee (2001) stresses that it is impossible for the human mind to optimize all the
operations necessary for such demand-based systems. Lee therefore promotes the
utilization of computer-based tools in retail. He has created a list with characteristics
and requirements necessary for such systems to perform, such as the capability of
doing precise demand forecasts based on marketing data and the capability of
self-learning to adapt to new environments.
Finally, there are some very useful articles by practitioners highlighting the
importance of processes and organization for the performance of the entire supply
chain, and how changes in these two factors can influence the performance of the
entire company (Duffy 2004). Processes are in many of today's companies supported
by Enterprise Resource Systems (ERPs).31 An interesting study that examines the
influence of ERP systems on SCM is the work of Akkermans, Bogerd et al. (1999).
The authors argue that once an ERP system is installed, this system can act as the
backbone supporting business developments in many areas, among them SCM.
However, the original ERP systems were never designed to specifically support
31
See also section 3.3 for more details on ERP systems.

3. Literature Research 33
SCM, and companies may find that such a system becomes a disadvantage, as
Akkermans, Bogerd et al. (1999, p. 20) state:
"Their architectural advantage of being fully integrated for one firm becomes a
strategic disadvantage in this new business environment, where modular, open
and flexible IT solutions are required."
Since this Delphi study was conducted, several of the ERP software vendors have
adapted to the trend towards inter-company SCM and have enhanced their ERP
systems.32 Time will show how successful these new systems are in supporting SCM
processes across multiple enterprises.
Efficient Consumer Response (ECR) started originally as a supply chain initiative
for the fast-moving consumer goods industry (Corsten 2002). Its main purpose is the
collaboration between suppliers and retailers (Kurt Salmon Associates 1993). Since
then ECR has developed and now includes marketing elements such as category
management alongside SC elements (ECR Europe 2000). There are several
publications of the ECR community that are cited in this thesis, dealing mainly with
store operations and OOS. Yet the core element of ECR, collaboration, is not within
the scope of this work.
3.2.2. Automatic Replenishment Programmes
Automatic Replenishment Programmes (ARP) are a practical implementation of the
idea of pull-supply chains. In these programmes, the vendor is responsible for the
replenishing of the retailer's stock. To be able to do this, the vendor receives data
such as inventory level information and POS data from the retailer. Replenishment is
then pulled by the actual sales; thus no orders have to be actively placed by the
retailer. The first successful implementation of such a system was between Wal-Mart
and Procter & Gamble in the late 1980's (Kuk 2004). Common ARPs are Vendor
Managed Inventory (VMI), Continuous Replenishment Planning (CRP), Quick
Response (QR) and Collaborative Planning, Forecasting and Replenishment (CPFR).
According to Davis (1993), the benefits of ARP concepts such as VMI are generally
accepted, namely the possibility to reduce OOS rates and inventory levels.
An interesting ARP paper related closely to the ASR topic is the contribution of
Achabal, McIntyreet al. (2000). In this paper a decision support system (DSS) is
described that was used by an apparel manufacturer to forecast the demand of
32
For example, the company SAP has introduced a software package called "mySAP SCM."
34 3. Literature Research
selected VMI retailers. It is worth noting that the system described uses a forecasting
model to optimize the supplier retailer deliveries to the retail DC. Yet, the system
does not take into account the replenishment at the store level. Nevertheless, the
contribution of this paper is that for the first time a DSS in use is described that
combines inventory replenishment decisions with advanced causal forecasting
models derived from marketing theory. Their multiplicative forecasting model takes
into account effects from price elasticity, promotional influences and seasonal effects
and bases on pooled, weekly product data. The DSS system was tested for 30
retailers in a three-year period. The result was a dramatic OOS rate reduction of
70%. In addition, the service level at the DC increased from about 73% to 92%. A
minor drawback was a slight fall in the inventory turnover. Further benefits for the
vendor were better production planning, as retailers' orders were more stable and
reliable with the new system. This is mostly attributed to the fact that an inflation of
orders, resulting from "shortage gaming" (cf. Lee, Padmanabhan et al. 1997b), is
avoided. In addition, the retailers had the usual benefits of VMI systems: they had
lower costs and expended less effort on order placement and they profited from a
cost-effective and more precise sales forecasting tool. The increase in forecasting
accuracy is attributed to the utilization of several vendors' data and to the fact that
more time is spent on the customization of the models. The main achievement of
Achabal, McIntyre et al. (2000) is to show in practice that such DSS systems can
dramatically improve inventory efficiency and are profitable for vendors and retailers.
Yet, their paper concentrates mainly on the development of an efficient forecasting
model and less on the automatic replenishment or on the contextual prerequisites of
such systems. A deficit of their contribution is the missing description of new
processes necessary for the effectiveness of automatic replenishment systems.
A major empirical contribution to the investigation of ARPs comes from an American
research group that based their findings on a survey of 75 American manufacturers
and 23 retailers (Ellinger, Taylor et al. 1999; Stank, Daugherty et al. 1999). The
authors see the main problem in modern retailing as the increased number of SKUs
that have to be handled. The retailer's aim is to cope with this complexity without
increasing the number of OOSs or inventory levels. In their first papers (Daugherty,
Myers et al. 1999; Ellinger, Taylor et al. 1999), the research group studies the
appearance and effects of such systems. First, the implementation of ARP-related
elements in companies is measured. These are elements that are considered by the
authors necessary for the implementation of ARP. As can be seen in Table 3, it is not
only technological capabilities that are mentioned but also operations and
organizational elements are to a certain degree a prerequisite for ARP. This table has

3. Literature Research 35
a major relevance for this work, as in section 6.5.3 the technological and
organizational requirements for ASR systems are examined.
Item Mean* Standard Deviation
Bar coding at retail level 5.66 2.31
Electronic data interchange 5.46 1.77
Automatic replenishment of basic goods 5.45 1.76
Automatic forecasting for staple goods 5.33 1.90
Pre-season planning with trading partners 5.26 1.93
Cross-functional teams 5.26 1.65
Automatic forecasting for fashion/seasonal goods 5.22 2.45
Bar coding on container labels 5.20 1.86
Direct store delivery of products 4.91 2.42
Joint planning or replenishment of products 4.79 1.84
Electronic payment 4.74 1.91
Electronic point-of-sale scanners 4.66 2.74
Advanced ship notices 4.53 2.18
Cross-docking operations 4.46 2.17
Joint forecasting 4.21 1.89
Vendor-marked merchandise 3.93 2.56
Activity-based costing 3.77 2.19
*7-point scale: 1=not implemented 4=somehow implemented 7=fully implemented
Table 3: Implementation of ARP-related items33
Ellinger, Taylor et al. (1999) come to the conclusion that for a basic involvement in
ARP programmes, the most important elements are bar coding at retail level and
electronic data interchange. With these elements in place, a basic level of automation
is possible. For more sophisticated replenishment programmes, advanced elements
such as joint planning and electronic payments, are necessary. The second question
Ellinger, Taylor et al. (1999) looked at was the effectiveness of such programmes.
Effectiveness was judged with the help of several scales as can be seen in Table 4.
The authors showed that the group having a high ARP implementation level (more
than 20% of total dollar sales involved automatic replenishment) has significantly
faster inventory turns and at the same time reduced product handling, inventory
holdings and costs. A reduction of OOSs could not be proved. However, higher
profitability and overall relationship performance for the high ARP involvement group
could be shown. These are important findings, as in this thesis the effect of ASR
systems will be measured on three scales: inventory level reduction, inventory level
variance and OOS.
33
Source: Ellinger, Taylor et al. (1999, p. 29).

36 3. Literature Research
Goal High ARP
involvement
Low
ARP involvement
Improved/increased customer service 5.61 5.40
Fewer stock-outs 5.42 5.33
Improved reliability of deliveries 5.42 5.19
Reduction of discounting 5.35 4.86
Reduced return and refusals 5.12 5.03
Faster inventory turns 5.35 4.44
Reduced over-stocks 4.95 4.92
Reduced product damage 4.81 5.06
Reduced inventory holdings 5.28 4.17
Reduced handling 4.93 4.23
Reduced costs 5.08 4.06
*7-point scale: 1=not at all effective 7=extremely affective. Bold: significant difference between groups (p<.05)
Table 4: Effectiveness in achieving automatic replenishment-related goals34
In a third paper Myers, Daugherty et al. (2000) test a series of hypotheses related to
the antecedents and outcomes of automatic replenishment programmes. In their
model, the authors postulate that the effectiveness (cost and service quality) of ARP
systems will depend on three factors:
� Transaction-specific factors (factors influencing transaction costs, such as the
standardization level of the ARP)
� Strategic factors (the market and profit orientation of the firm)
� Organizational factors (characteristic factors of the firm, such as the firm size)
This model could only be partly supported by the data. Market-oriented companies
had indeed as expected a greater service effectiveness at the cost of lower cost
effectiveness. Service effectiveness was positively influenced by the firm size, but
astonishingly, larger firms had lower cost effectiveness. A similar finding was
reported by Kuk (2004). In his analysis of 25 electronics industry companies, the
members of small rather than large organizations expected and perceived higher
returns from ARPs. Another surprise was that decentralized companies did not have
lower service effectiveness as expected. Not surprising was the fact that with
increasing managerial commitment also the cost and service effectiveness rises.
Further, Myers, Daugherty et al. (2000) expected a positive correlation between
companies markets' competitiveness and their service effectiveness. According to the
34
Source: adapted from Ellinger, Taylor et al. (1999, p. 33). The results depicted in this table vary slightly from
paper to paper of the American research group, though they come from the same empirical base. The authors
do not explain the reasons for these differences.

3. Literature Research 37
data, the opposite was true, in highly competitive markets the ARP-related service
effectiveness went down. This effect is explained by the fact that the fast-changing
demand for goods has made accurate replenishment very difficult for ARPs. The
authors also looked at the implications of ARP effectiveness for overall firm
performance. They could prove a significant positive relation between the
effectiveness of ARP and strategic performance (creation of barriers to competitors).
The results of this paper deliver important insights for this thesis. Myers' and
Daugherty's paper pinpoints that many of the factors influencing ARP success lie in
organizational structure and human agency. Firm size, centralization of
replenishment decisions and commitment to ASR seem to play an important role. But
also the environment has to be taken into account, as the degree of market
competitiveness plays a role.
The last work analysed that is based on this American survey is by Sabath, Autry et
al. (2001). In this paper, the authors first of all analyse the information systems
capabilities of the companies in the sample using nine items. As can seen in Table 5,
most IT systems are able to provide basic information, yet their capability for internal
and external connectivity as well as speed and exception management are perceived
to be rather low.
Information Systems Capabilities Overall Mean
(n=97) Centralized Group
Decentralized Group
Daily download of information 5.70 5.49 5.88
Accuracy of information 5.33 5.19 5.45
Timeliness of information 5.16 4.97 5.33
Formatted to facilitate usage 5.07 5.11 5.03
Availability of information 5.01 4.58 5.39
Internal connectivity/compatibility 4.88 5.31 4.49
Formatted on exception basis 4.65 4.41 4.87
Real-time information 4.59 4.19 4.95
External connectivity/compatibility 4.58 4.29 4.85
*7-point scale: 1=not at all effective; 7=extremely affective; Bold: significant difference between groups at .01
Table 5: Information systems capabilities35
Another question posed by the authors is whether there is a significant difference
between the IT capabilities of decentralized companies compared to centralized
ones. This is not a trivial question, as the theories on this topic are ambiguous. For
example, the coordination theory states that to decide whether new communication
technology will lead to more or less centralization, one has to look at which cost types
are reduced (Gurbaxani and Whang 1991). If the cost to collect the information
35
Source: adapted from Sabath, Autry et al. (2001, p. 100).

38 3. Literature Research
required to take a decision falls, then the result will be greater centralization of the
organization. On the other hand, if the agency costs sink (i.e. the costs of the
controlling of the single independent units, in the case of this thesis, the stores), the
utilization of new coordination technology will lead to greater decentralization.36
According to the survey of Sabath, Autry et al. (2001), the decentralized group tends
to have higher IT capabilities. This could be a sign that the agency costs are more
effectively reduced by the implementation of such IT technologies. An exception here
is the internal compatibility that is stronger in the centrally-organized group. This
phenomenon is explained by the authors on the basis of coordination theory. In
centralized organizations it is necessary to have the information in the upper levels of
the organization, therefore internal connectivity and compatibility is most important.
Further, Sabath, Autry et al. (2001) examine the influence of the degree of
centralization on the performance of ASR systems. Their basic result is that, in all
examined areas, a decentralized organization will tend to achieve better results.
Decentralized firms with ASR systems in use tend to perform better in relation to
OOSs, reduction of overstocks, returns, handling costs and product damages. This
strong argument for a decentralized system is contrary to the trend of power
centralization which has been observed within European grocery firms (Småros,
Angerer et al. 2004a).
This American research group explains the sometimes ambiguous results of their
studies by the relatively small number of companies in the sample and by the relative
short period these automatic programmes have been in place. In addition, three more
problematic issues can be seen. First of all, the way the effectiveness was measured
could be misleading. The benefits of the systems are measured by a self-estimation
of the interviewees on a 7-step Likert scale.37 Consequently, it is possible that
companies that introduce sophisticated replenishment systems will also have a
clearer view of the costs and performance of their supply chains. Problems that were
hidden before are now visible; the benefits from ASR systems are therefore not
adequately estimated. Second, it could be problematic that the researchers do not
differentiate between the effects of ARP for retailers and manufacturers. It is a
common statement from practitioners and researchers that, for example, VMI
36
For an overview on agency costs and theory, see Kieser (2002, p. 209). 37
In the experience of the author, with this approach there is the risk of obtaining biased results. In the European
survey by Småros, Angerer et al. (2004a) the authors asked a group of retailers about their happiness with their
OOS rate. It is remarkable that the retailers who did not have implemented systematic methods to measure
their OOS rate tended to be more satisfied with their on-shelf availability than the other group.

3. Literature Research 39
programmes create different costs and benefits for retailers and manufacturers.38
And third, although the replenishment programmes are called "automatic," this term is
not used in the significance of this thesis (i.e. "not manual; executed by a machine").
The term "automatic" means in this context that the replenishment is managed by the
vendor and not by the retailer. But whether the replenishment itself really happens
automatically, i.e. the vendors' IT system takes the replenishment decisions, is not
differentiated in these papers. Thus the contribution of these papers on the
implications of having an IT system take over the replenishment decisions is limited.
3.2.3. Operations Management in Retail
The sources studied from the operations management field have a focus on
operations in the retail environment. In the following, some challenges found in the
literature concerning store operations and replenishment systems are highlighted.
One weighty issue when dealing with automatic replenishment systems is the data
accuracy. As noted by both practitioners and researchers, the performance of
automatic replenishment systems dramatically depends on the accuracy of the data.
There are very few papers that investigate this subject (Raman, DeHoratius et al.
2001b; Wagner 2002; Fleisch and Tellkamp 2004; Tellkamp, Angerer et al. 2004),
although it is highly relevant for retailers. In a case study with a US retailer, Raman
(2000) found that inventory was inaccurate for over 70% of stock-keeping units
(SKUs) in the store. These figures are based on physical inventory counts at six
stores. Each store had on average 9,000 SKUs. Physical inventory was below book
inventory for 42% of SKUs and above for 29% of SKUs. The total difference was
61,000 units or a mean of 6.8 units per SKU. This compares to an average inventory
of 150,000 units per store.
One of the major challenges of accurate inventories is shrinkage. A German study
examining 104 German retailers estimates the inventory difference at 4.1 billion euro
in the year 2004 (Horst 2005), and half of these losses are due to theft. The inventory
differences add up to 1.1% of the gross product value. According to another US
survey, shrinkage in the retail industry amounted to 1.7% of sales in 2002 (Hollinger
and Davis 2002). The importance of this topic for practice is seen in the high sums
invested in anti-theft measures, for instance, Germany's companies spent 900 million
euro (Horst 2005).
38
See for a list of benefits and disadvantages, e.g. Alicke (2003, p. 171).

40 3. Literature Research
The replenishment of the shelves is one of the most time-consuming store
operations found. The German grocery retailer Globus has calculated that 47% of its
internal logistics costs are caused by in-store shelf replenishment. In comparison, the
costs for the transport of the goods to the store (and back in the case of returns)
represents only 14% of total costs (Shalla 2005). The replenishment effort is
influenced by the size of the shelf, the available space in the backroom, the case
pack size (CU/TU) and the store replenishment frequency. Retailers, such as Globus
and Manor (Switzerland), have therefore started to design stores without a backroom
in hopes of reducing this costly and error-prone process.
Most of the European grocery retailers examined are centrally organized.
Nevertheless, the role of the store manager in the performance of the store is still
important. This person is responsible for several employees, has many freedoms
regarding the processing of store operations and has decision rights over operating
expenses such as labour costs. One of the ways discussed in the literature to
oversee and motivate store managers is through appropriate incentives (see e.g.
DeHoratius and Raman 2005). The role of store managers during and after
introduction of an ASR system was found during the research for this thesis to be a
critical element. The store manager's influence on the success of the replenishment
system change was stressed by all interviewees.
Overall, the review of the operations literature was very fruitful. The literature helped
to identify the relevant fields for the field research in this paper. This was possible as,
contrary to the literature about mathematical inventory management, the operations
management literature examines topics very close and relevant to retailers' daily
challenges.
3.2.4. Contributions and Deficits of a Logistics and Operations Management
Perspective
The logistics and operations management research explores a very wide range of
topics. This is due to the integrating function that logistics has in today's enterprises
(Pfohl 2004). As the implementation of ASR impacts so many areas of a retailer's
business, logistics' holistic approach is a valuable knowledge source. In concrete
terms, the contributions of these theories are:
� Expected benefits of ASR system
� Technologies and processes necessary for ASR implementation
� Conception of store operations

3. Literature Research 41
First of all, this thesis benefits from the ARP literature and their methodologies for
measuring the performance of replenishment systems (research sub-question Q2).
Second, the hypotheses found in theoretical sources regarding the correlation
between IT capabilities, context of the organization and the outcome of automatic
replenishment system implementation are extremely helpful in creating the models in
the next chapter and in determining the IT requirements for each ASR level (see
Table 49). Finally, the examination of store operations literature brought a major
contribution for this thesis. As the field research in chapter 6 will show, the
implementation of an ASR system fundamentally changes some of the processes in
the stores as well as the organization structure. The best practices identified in the
literature are compared to the processes of the retailers in the sample. Therefore, this
theoretical perspective will be most helpful for the answering of research sub-
question Q5, recommendations on how to re-engineer a company to adapt to a new
ASR level.
Yet, it has to be said that the contribution of the research streams ECR and SCM for
this thesis is limited. The focus of this research project is on the replenishment of
goods to the point of sales of the retailers. For this research context, the distribution
systems along the supply chain, from the suppliers up to the retailers, play a
secondary role. Concepts that are mainly centred on collaboration and which aim to
reach a global inventory optimization across the supply chain are not considered in
this thesis. The only contribution of suppliers for the success of advanced ASR
systems is to ensure high inventory visibility. This is realized by having an
identification system (e.g. barcodes) at item level and by the use of EDI messages
such as dispatch advice. Yet for future research, the role of the supplier might
increase when automatic replenishment systems are implemented across several
supply chain tiers.
3.3. Business Information Systems Perspective
A stream of the business information systems research focuses in particular on the
impact of new information technologies on companies and the human agency. This
research branch has a longstanding tradition. It began as a stream of social research
on the influence of human behaviour and technology in general (e.g. Mumford 1934;
Noble 1984), focusing later on the impact of information technology (e.g. Zuboff
1988; Kling 1996). In this last section of the theoretical foundation, the role of
Enterprise Resource Planning (ERP) systems is examined. First of all, the
characteristics of ERP systems are analysed. Second, an overview of literature

42 3. Literature Research
regarding successful implementation is given before finally, the influence of ERP
packages on human agency is depicted.
3.3.1. Characteristics of ERP Systems
Watson and Schneider (1999) see ERP as a generic term for an integrated enterprise
computing system. In order to integrate the different functions of a company, a
common database is necessary (Gronau 2004). Today's ERP systems have
developed from systems used in production to determine the necessary material
quantities, so-called material requirements planning systems. By now these systems
are widespread in all industry sectors and have expanded their functionality to
include also human resources and finance elements. A recent paper on the influence
of ERP on companies is the work of Kallinikos (2004). For him, the widespread
introduction of ERP packages in organizations is radically changing human agency at
work. Kallinikos (2004, p. 9) states that a main characteristic of an ERP system is
"the reconstruction of the very micro-ecology of organizational tasks to which any
single transaction belongs." This means that in a company with advanced ERP
systems isolated tasks no longer exist. Even the smallest transaction is recorded and
thus must be accounted for. This has two effects.
First, the effects of one's actions become visible to others and to the individual
undertaking the activity. For instance, the connection of the SAP R/3 modules
"Financial Accounting" and "Warehouse Management" helps in recognizing the
financial effects of one choice on the rest of the organization (Bancroft, Seip et al.
1996; Soh, Kien et al. 2000). This interconnection is the reason why ERP systems
have had a more profound effect on human agency in organizations than other expert
systems (Kallinikos 2004). ERP systems are not only a structured rendering of
operations; they create a manageable organizational reality.
The second effect of ERP systems is that the order in which transactions are
correctly executed is stipulated by the system and thus makes the way tasks are
executed by employees homogeneous.
3.3.2. ERP Implementation and Selection
Integrated ERP systems are regarded by some authors to be of strategic importance
for the competitiveness of companies. Therefore, some years ago, Vossen (2000)
complained that German retailers were lagging behind the competition. He estimated
lost turnover due to antiquated systems at 3.5% and stressed the necessity for a
change of the IT system. Researchers have examined factors influencing the

3. Literature Research 43
successful selection and implementation of ERP packages (Kumar, Maheshwari et
al. 2001; Sarpola 2003) and the impact of organizational and cultural factors
(Krumbholz, Galliers et al. 2000; Soh, Kien et al. 2000). More practical managerial
guidelines (e.g. O'Leary 2000; Ptak and Schragenheim 2000; Merkel 2003) became
more popular in dealing with ERP choice and usage, as the implementation of an
ERP system can be extremely costly. The list of failed and abandoned ERP
introductions is long (Markus and Cornelius 2000), making the necessity for such
guidelines clear. A study from the year 1999 shows that, on average, ERP projects
are 178% over budget, take 2.5 times as long as intended and deliver only 30% of
the promised benefits (Densley 1999). This goes hand in hand with the existing
complaints of many practitioners that IT expenditure has failed to show significant
productivity gains. In the literature, this phenomenon is known under the term
"productivity paradox" (Stratopoulos and Dehning 2000). It was first described in
1987 by Steven Roach, the chief economist at Morgan Stanley (Brynjolfsson and Hitt
1998). The paradox is that although the amount of computing power used in the
service industry increased dramatically in the 1970's and 80's, the measured
productivity remained flat. Other studies have partly contradicted these findings
(Brynjolfsson and Hitt 1995; Dewan and Min 1997; Malone 1997). It is argued that
ERP as well as other complex IT systems, fail to deliver benefits because the
process of organizational change was not properly addressed (Hong and Kim 2002)
and working practices were not changed (Brynjolfsson and Hitt 1998). Therefore,
ERP implementation guidelines stress the need for a comprehensive re-engineering.
Chircu and Kaufmann (2000) speak of two types of barriers that have to be overcome
for a successful implementation: valuation barriers (how compatible is the technology
to industry standards?) and conversion barriers (which supporting resources have to
be considered to ensure the implementation succeeds?). The technical barriers are
rather low, as much of the IT and identification technology has become ready
available and comparatively inexpensive (Kuk 2004). The organizational barriers, on
the contrary, are much more difficult to surmount. Soh, Kien et al. (2000, p. 47) speak
of a "necessary disruptive organizational change." A change in the organization and
its processes is also necessary in the case of a misfit between the ERP system and
the existing company. A misfit occurs when the functionality offered by the ERP
system and the requirements of the company differ. In case of a misfit, a spectrum of
solutions is possible, requiring more or less change within the company (see Figure
9). An example for a greater required adaptation is when ASR systems presuppose
an electronic inventory record. The working habits of store employees can be
radically changed by this new process. Such electronic records need, for instance, an

44 3. Literature Research
accurate scanning of every product that is sold. The consequence is that a significant
part of employees' time will be dedicated to inventory counts and data administration.
Greater organizational change
Greater customisation of ERP
Accept shortfall
in ERP
functionality
Accept shortfall
in ERP
functionality
Adapt to the new
ERP functionality
Adapt to the new
ERP functionality
Customisation to
achieve the
required
functionality
Customisation to
achieve the
required
functionality
Workarounds to
provide the
needed
functionality
Workarounds to
provide the
needed
functionality
Figure 9: Spectrum of misfit resolution strategies39
3.3.3. ERP and Human Agency
Kallinikos (2004) notes that many sources dealing with the influence of ERP on the
organization have a strictly technical perspective. The behavioural assumptions
underlying ERP implementation are seldom examined in detail. For example, not
enough attention is paid to the construction of roles centred around new processes
(cf. Markus, Axline et al. 2000; Sheer and Habermann 2000). A detailed investigation
of the constitutive effects ERP packages have on work, human agency and
organizational action has not yet been systematically researched. The influence of
ERP on personnel that has been identified in theory is threefold:
� Change of working patterns
� Reduction of personal communication
� Retreat to own zone of duties, loss of interest in overall goals
The direct influence of ERP implementation on human working patterns has
already been stressed. Many ERP packages specify in detail every required work
process and have therefore a significant influence on human agency. The system
might constrain the way less structured human beings work by institutionalising
patterns of action. For instance, some higher ASR systems suggest an exactly
defined procedure for checking orders. For example, store employees may be
required to check the order suggested by the IT system during a small, defined time
window. In addition, the visibility of employees' actions increases. Increased visibility
means that actions (e.g. the placing of orders) can be monitored from every PC
39
Source: adapted from Soh, Kien et al. (2000, p. 50).
3. Literature Research 45
connected to the ERP system. At the same time, because transactions are stored
electronically, there is also the possibility to assess actions conducted in the past, a
convenience often not available in manual systems. For example, in an OOS
situation, it might be unclear in a manual system whether an order was placed in time
or not, and every party can blame another for the fault.
The second effect found in the literature describes the reduction of personal
communication between employees (cf. Fleck 1994; Sawyer and Southwick 2002).
In the case of advanced ASR systems, the contact between store employees and the
central office takes place by digital means. Johansson (2002) has made several
propositions on how the retailer-supplier relationship may change, when increasingly
quantities of information are interchanged via EDI, Internet and market places. He
examines the effects on three fields: relationship formation and development,
distribution of power and influence and the responsiveness and flexibility in supplier-
retailer relationships. The author states that co-ordination of activities is easier
through digital communication, at the cost of the richness of the communication and
the building of knowledge. Johansson further argues that with the use of digital
channels it is easier to handle continuous change in the supplier-retailer environment.
An example for continuous change is the change of consumers' consumption quantity
of a certain existing product. Yet for discontinuous changes, such as consumers
demanding completely new products, personal communication channels would be
the better choice. The findings of Johansson (2002) can only be partly transferred to
the head office-store relationship, as this is a relationship within an organization. The
distribution of power is another: there is no danger that the store will decide to
change the supplier due to, for example, lack of trust.
Finally, IT systems do not only reduce personal communication. In addition, typical
human behaviour, such as improvisation, exploration and playing, is often limited.
Kallinikos (2004) sees the danger of losing one of the ultimate goals of the company–
responding successfully to the demands of the market and customers–in a maze of
thousands of ERP transactions: "Concern with internal processes may obscure and
finally replace external adaptation" (Kallinikos 2004, p. 18). The ordinary user, when
overwhelmed by thousands of transactional possibilities, tends to retreat to his limited
zone of duties (Zuboff 1988; March and Olsen 1989). The wider purpose of their work
might be lost of sight. An aim of good ASR system design must therefore be to avoid
the loss of employee interest and motivation. When the retailer MYFOOD introduced
its ASR systems, one problem was that store employees lost any interest in the
placing of orders, as it was, in their eyes, no longer their duty. There were fewer
controls of the computer-generated ordering suggestions as wished by the central
46 3. Literature Research
office. The retailer had to make a significant effort to abolish the "if the goods are out-
of-stock, then it was the computer's fault" mentality. Therefore, by encouraging
employees to make a minimum number of interventions, they were made to feel as if
the orders placed were still "theirs". Employees should perceive the computer as a
mere assisting technology.
3.3.4. Contributions and Deficits of a Business Information Systems
Perspective
The discussion of ERP-related theoretical sources offers several contributions for this
thesis:
� ERP's major influence on business
� Pitfalls and success factors
� Change of human agency
The literature has shown the major impact ERP systems have on business. Several
authors stressed that to remain competitive, implementation of ERP systems has
become mandatory. However, the implementation of such systems is a challenging
task. ERP systems radically change the way employees work. Their effectiveness
depends to a great extent on the design of the organization and processes. The right
system can create an awareness of the effects of the actions taken by employees
(Kallinikos 2004). As higher ASR systems are usually integrated into ERP system,
the mentioned implication of the information business research can be transferred to
the ASR context. This research stream therefore provides valuable insights on how to
change the organization and organizational processes (sub-question Q5) and on
which system to take, considering the available technology (Q4).
The limits of the application of the ERP research to the subject of this thesis are that
traditional ERP systems only target procedures of action and execution. Modules with
real decision support logic are not common standard (Metaxiotis, Psarras et al.
2003).
Advanced ASR systems go a step further than traditional ERP packages in that they
implement knowledge aspects as well. Thus, additional considerations from the field
of expert systems have to be taken into consideration. Decision support systems
(DSS) are rule-based programs that often involve statistical or algorithmic analysis of
data. Their decisions are made in real-time after weighing all the data and rules for a
particular case (Davenport 2004). The implications of DSS systems for the business
community cannot yet be fully anticipated. For Davenport, the impact of this new

3. Literature Research 47
technology on the employment market will be much greater than the effects of
offshoring. From 2001 to 2004, 2.7 million US jobs were lost due to the increase of
productivity, compared to only 3,000 lost through offshoring (Davenport 2004).
Davenport recommends companies to incorporate DSS into their strategy to remain
competitive in today's markets.
3.4. Contingency Theory Perspective
Fred E. Fiedler is considered to be the founder of contingency theory. He carried out
research on the optimal leadership style. Fiedler (1967) examined the influence of
two factors–the leader's characteristics and the leading situation–on the performance
of employees. The result was that there is no optimal solution; the best leadership
style depends on the situation. This was the beginning of contingency theory. In
essence, contingency theory states that the effective level of an endogenous variable
depends on the level of an environmental (exogenous) variable (Staehle 1991;
Cadeaux 1994). In Fiedler's example, the contingency aspect is that the leadership
type (endogenous variable) has to fit to certain characteristics of the situation
(exogenous variable) in order to bring about the desired results. This theory can be
applied at different levels of abstraction (e.g. organization, process level) as
discussed in the following.
3.4.1. Contingency Theory at the Organizational Level
One of the first contexts in which contingency theory was applied was the
organization. Lawrence and Lorsch (1967) conducted empirical studies to formulate a
contingency theory of the organization. They argued that differences between types
of organizations are mainly due to the different environmental conditions they act in.
In their study, the authors characterize the environment with the pairs
secure-insecure and homogeneous-heterogeneous. The security dimension of an
environment can be measured with the help of following three criteria:
� Certainty and reliability of information (environmental stability)
� Frequency of changes of the information (environmental change)
� Duration of the feedback cycle (between system and environment)
Organizations reduce the complexity of their environments by creating sub-systems.
For instance, the complex environmental factor "supplier" leads to the creation of the
functional unit known as "purchasing department." Another example is provided by
Staehle (1991). He examined the plastics industry and discovered that it has a
heterogeneous environment: production is very secure, yet the basic research

48 3. Literature Research
department is classified as very insecure. Staehle then makes suggestions as to how
to organize a company depending on his environmental classification.
An application of contingency theory to logistics is made by Pfohl and Zöllner (1987).
In their theoretical work, they examine the influence of contingency factors on
organization design. They put into question the effectiveness of the popular strategy
of aggregating all logistical tasks into a major department. The authors look for
alternative organization forms. Pfohl and Zöllner argue that the choice of logistics
organization should no be limited to just quantitative aspects (such as the size of the
company). There are other important contingency factors that have to be considered
as well:
� The complexity and uncertainty of the criteria
� Requirements of the decision-making levels
� Relationships with other functional units
� The behaviour of the employees
The main conclusion of the authors is that the structures found in practice can only
be partly explained by contingency theory. Decisive roles are played by the
managers that set the overall strategy of the organization. Such managers choose
structures that coincide with their cognitive and motivational orientation (Bobitt and
Ford 1980). Different structures for logistics will emerge, depending on how the
importance of logistics in an organization has been assessed (Pfohl and Zöllner
1987). The authors cannot make a standard recommendation on how to implement
best logistics in an organization, because this will depend on the requirements of the
logistical task. For the type of companies in the focus of this thesis the consequence
is clear. Logistics is for retailers a pivotal task (Körber 2003). Pfohl and Zöllner (1987)
recommend that in this case, companies should determine the organizational
structure based strongly on logistical contingency factors.
A last example for contingency theory at the organizational level stems from Kahn
and Mentzer (1996). These authors suggest that the choice of the level of integration
and interaction between departments should depend on the situational context, in this
case the stability of the market.
3.4.2. Contingency Theory on Information Technology and Processes
Contingency theory also plays a role when assessing the appropriateness of
processes. Cadeaux (1994), for example, shows that the benefits from a
branch-flexible planning of the store assortment strongly depends on the volatility of

3. Literature Research 49
the product category. Another example is the contingency between supply chain
responsiveness and the need for forecasting abilities. It can be observed that
suppliers have invested more in forecasting capabilities than retailers (Småros,
Angerer et al. 2004b). An explanation given by these authors is that the need of
retailers for forecasting is different, as their supply chain is more responsive (i.e.
shorter lead times and higher service levels).
Another branch of the contingency research stream examines the impact of
information technology on business performance under the aspect of contingency
theory. A good overview can be found in Bergeron, Raymond et al. (2001). In this
paper, the authors list research executed on the study of specific impacts of IT,
among them studies on the IT impact on learning (Leidner and Jarvenpaa 1995), the
impact of IT problem-solving on task performance (Vessey 1991; Vessey and Galleta
1991), and the impact of IT on organizational performance (Chan and Huff 1993;
Bergeron, Raymond et al. 1998). A common proposition among these papers is that
a turbulent environment will induce firms to a more extensive use of information
systems (Pfeffer and Leblebici 1971; Lederer and Mendelow 1990). Chagué (1996)
argues that in risky environments, IT should be more flexible and managers more
alert to adapt information systems to external changes. In addition, information
acquisition should be more wide-ranging and continuous (Huber 1984). Generally
speaking, there are many papers including the environmental fit as a contingency
variable (Bergeron, Raymond et al. 2001) of IT performance. But very few show the
link between the fit of such systems on environmental uncertainty and performance.
An exception is, for example, the work of Sabherwal and Vijayasarathy (1994) which
examines telecommunications technology fits and performance.
Another application of contingency theory is the development of a contingency
approach for the selection of logistics performance measures as conducted by Chow,
Heaver et al. (1994). For example, the authors expect for a firm that has
concentrated its strategy on cost dimensions, to focus its performance measures on
cost dimensions as well. The transfer of these theories to the context of this research
project means that retailers that have more complex replenishment systems will have
at the same time a higher demand for elaborated performance measurements. If, for
example, a complex forecasting algorithm is in use that requires more care on data
accuracy, the company requires a more accurate image of the performance of this
algorithm. Therefore key performance indicators (KPIs) such as MAPE40 would
probably be introduced to test and control the algorithm.
40
Mean Absolute Percentage Error. For an explanation of MAPE see section 4.1.4.
50 3. Literature Research
3.4.3. Contributions and Deficits of a Contingency Perspective
The basic idea behind contingency theory is of great relevance for the answering of
research questions Q4 and Q5. The main contributions of the contingency theory for
this thesis are:
� Choice of the right ASR system for each product category
� Fit of organization and processes to ASR system
� Consideration of the influence of store and product characteristics on ASR
performance
One of the main goals in this thesis is to help retailers to choose the right
replenishment system. Yet it would be wrong to rely just on inventory management
research for this, as with this approach the contextual factors of retail are not taken
into consideration. A more differentiated approach is necessary. For example, a
possible implication drawn from the inventory literature is the hypothesis that for
turbulent products (i.e. products for which demand cannot be predicted) retailers
should choose higher ASR levels. Yet in practice there are retailers that nevertheless
prefer a manual approach for some high-demand-variance products such as fruit.
The reason for this is that these retailers see their green grocery category as a way
to differentiate themselves from the competition. As IT systems are not able to
assess the quality of the products, these retailers prefer to have specialised planers
making this decision manually.
As this example shows, it would be wrong to give any recommendations without
taking into consideration the context. This thesis therefore examines how the
organization and the replenishment processes influence the performance of ASR
systems. In section 6.5.3 technical and organizational requirements for each ASR
system are presented, while in section 6.5.4 recommended store operations are
proposed. A last implication of contingency theory is that ASR performance will also
depend on product and store characteristics, as illustrated in the explanation model in
section 4.3.
Nevertheless, one has to be aware of the limits of the contingency approach:
� Missing definition of term "fit"
� Explanation of "reality" limited
The basic statement of contingency theory, namely that context and structure have to
fit to each other, is at the same time the most critical part of this theory. The lack of

3. Literature Research 51
the definition of the term "fit" could alter the meaning and the relevance of the entire
theory, as methodological rigor is missing (Schoonhoven 1981; Drazin and van de
Ven 1985). As Bergeron, Raymond et al. (2001, p. 125) state:
"Researchers were not cautious enough in defining the concept of fit–which is
central to any contingency model–and in selecting the most suitable data analysis
approach to a given definition of fit."
A second drawback of contingency theory is that it is useful for giving normative
recommendations: in situation A, choose action B. Yet, it can be misleading to try to
use this theory to explain existing structures and practices found in industry. An
illustration of this statement is the paper by Ketokivi and Schroeder (2004) which
shows that contingency arguments do not adequately explain why certain companies
adopt innovative manufacturing practices such as TQM and lean management while
others do not. Another example is Tidd (1993), which demonstrates that in many
cases, organizational policies do not support technology strategies. This means that
the contingency between a market's technological complexity and firm organization
cannot be shown. In this example, there might be a tendency for companies to
display certain structures depending on environmental influences. But there is no
inevitability in this, other influences might be stronger, thus hiding the contingency
effect. This obscuring effect can be the reason why in this thesis certain theoretical
relationships do not correspond with observations made in reality.
3.5. Literature Research Overview
In the following table, the research streams analysed as well as exemplary sources
are listed.

52 3. Literature Research
Research
Stream
Research Focus Exemplary Sources
Importance of inventory
management for business
(Vollmann, Berry et al. 1992; Balachander and Farquhar 1994;
Silver, Pyke et al. 1998; Dubelaar, Chow et al. 2001; Gudehus 2001)
Mathematical optimization
of inventory
(Galliher, Morse et al. 1959; Dalrymple 1964; Chang 1967; Groote
1994; Inderfurth and Minner 1998; Bassok 1999; Ketzenberg,
Metters et al. 2000; Cachon 2001; Wagner 2002; Gudehus 2004)
Retail inventory control and
OOS
(Kotzan and Evanson 1969; Krueckenberg 1969; Cox 1970; Curhan
1972; Corstjens and Doyle 1981; Emmelhainz, Stock et al. 1991;
Drèze, Hoch et al. 1994; Andersen Consulting 1996; Taylor and
Fawcett 2001; Zinn and Liu 2001; Gruen, Corsten et al. 2002; Sloot,
Verhoef et al. 2002; Zinn, Mentzer et al. 2002; Roland Berger 2003b;
Broekmeulen, van Donselaar et al. 2004a; Stölzle and Placzek 2004)
Inventory
management
systems and
OOS
Organizational context of
inventory control
(Zomerdijk and Vries 2002)
SCM: optimization along the
supply chain
(Lee and Billington 1992; Fisher, Hammond et al. 1994; Womack
and Jones 1996; Feitzinger and Lee 1997; Lee, Padmanabhan et al.
1997b; Christopher 1998; Anupindi 1999; Chen, Drezner et al. 2000;
Hines, Holweg et al. 2000; Gudehus 2001; Duffy 2004; Pfohl 2004)
Demand-based supply
chains (Pull-SC)
(Lee and Billington 1993; Fisher, Hammond et al. 1994; Fiorito, May
et al. 1995; Bell, Davies et al. 1997; Cottrill 1997; Christopher 1998;
Closs, Roath et al. 1998; Lee 2001)
Automatic replenishment
programmes (e.g. VMI,
CRP, QR)
(Davis 1993; Daugherty, Myers et al. 1999; Ellinger, Taylor et al.
1999; Stank, Daugherty et al. 1999; Achabal, McIntyre et al. 2000;
Myers, Daugherty et al. 2000; Sabath, Autry et al. 2001; Kuk 2004)
ECR and information
sharing
(Kurt Salmon Associates 1993; Cachon and Fisher 2000; Corsten
2002)
Logistics
and
operations
management
Retail operations
management
(Raman, DeHoratius et al. 2001b; Wagner 2002; Fleisch and
Tellkamp 2004; Tellkamp, Angerer et al. 2004; DeHoratius and
Raman 2005)
Guidelines for successful
implementation of ERP
systems
(Dreyfus and Dreyfus 1986; Akkermans, Bogerd et al. 1999; Chircu
and Kauffman 2000; Markus, Axline et al. 2000; O'Leary 2000; Ptak
and Schragenheim 2000; Kumar, Maheshwari et al. 2001; Hong and
Kim 2002; Merkel 2003; Sarpola 2003)
Organizational implications (Mumford 1934; Noble 1984; Fleck 1994; Bancroft, Seip et al. 1996;
Ciborra 2000; Soh, Kien et al. 2000; Kallinikos 2004)
Implications for employees
and mode of work
(Zuboff 1988; March and Olsen 1989; Fleck 1994; Brynjolfsson and
Hitt 1998; Markus, Axline et al. 2000; Sheer and Habermann 2000;
Johansson 2002; Sawyer and Southwick 2002; Kallinikos 2004)
Business
information
systems
perspective
ERP and decision support
systems
(Metaxiotis, Psarras et al. 2003; Davenport 2004)
Contingency organizational
level
(Lawrence and Lorsch 1967; Perrow 1967; Bobitt and Ford 1980;
Pfohl and Zöllner 1987; Staehle 1991; Cadeaux 1994; Kahn and
Mentzer 1996)
Contingency
theory
Contingency at process
level
(Fiedler 1967; Pfeffer and Leblebici 1971; Huber 1984; Lederer and
Mendelow 1990; Vessey 1991; Vessey and Galleta 1991; Chan and
Huff 1993; Cadeaux 1994; Chow, Heaver et al. 1994; Sabherwal and
Vijayasarathy 1994; Leidner and Jarvenpaa 1995; Chagué 1996;
Bergeron, Raymond et al. 1998; Bergeron, Raymond et al. 2001)
Table 6: Summary of research streams perspectives

4. Development of Models 53
4. Development of Models
4.1. A Descriptive Model of Replenishment Systems
The first milestone in this work is the creation of a descriptive model of ASR systems.
It provides an answer to the first research question Q1: how can automatic store
replenishment systems be classified? This model does not claim to include all
possible kinds of replenishment systems, as new, revolutionary, decentralized
systems may be developed in the future.41 Yet it provides a helpful structure to
examine the replenishment systems of today's retailers. As it is created on an
abstract level, its core results can be applied to other industries dealing with piece
goods replenishment processes as well.
Regarded from a more abstract OR perspective, the store and the supplier are nodes
in a network (cf. Carter and Price 2001). The store is herein viewed as a material
sink, i.e. the place where the products are consumed.42 As stated before, material for
the store can be either sourced from the retailer's DC or directly from a supplier.
Obviously, supplier and retailer are only a small part of the entire distribution network.
The initial source would be the raw material producer (e.g. a wheat supplier), the final
sink would be the consumer (in contrast to the shopper43). In terms of information
flows, stores and suppliers can be sinks and sources at the same time. In some
systems, for example, the store sends an order to the supplier, the latter sends a
dispatch advice back with the expected delivery time and quantity.44
The basic function of a replenishment system is to decide, when to order which
amount (Wagner 2002). Characteristics of replenishment systems with make-to-stock
policy (i.e. the product is already built when the order comes in) can therefore be
captured with four elements (see Figure 10). To be able to decide which quantity to
order, it is obviously necessary to know how many items are on stock. This is called
inventory visibility, the ability to track the status of inventory in a supply chain tier or
41
For example, research has been conducted on transport networks where no central control is required, as the
system controls itself by a non-centralized network of intelligent items (e.g. Gausemeier and Gehnen 1998). 42
As illustrated in Figure 5, the store can also be a material source, as products are sometimes sent back to the
supplier. However, these quantities are negligible. 43
To illustrate the difference between shopper and consumer, here is an example: over 80% of all Gillette Mach-3
razor blades are purchased by women. However, over 90% of all Gillette Mach-3 razor blades are used by
men. In this example, women are the shoppers and men are the consumers (Hofstetter 2004). In this thesis,
though, no exact differentiation will be made between the two terms. 44
Cash flow between the parties, the third typical flow considered in logistics, does not play a role in the research
framework of this project.

54 4. Development of Models
even across the entire supply chain (Woods 2002). The replenishment logic defines
the business rules that are followed in order to decide when to order (Silver, Pyke et
al. 1998). Some systems take into account order restrictions as well. For example,
if the system can only order items in six-packs, an order of 10 units must not be
placed. The last element is the forecasting part. Some systems try to anticipate
future consumer demand by computing forecasts.
Fore-casts
Fore-casts
Order restrictions
Order restrictions
Inventory
visibility
Replenishment
logic
Figure 10: Descriptive model of replenishment systems
Depending on the replenishment system, these four modules can be either IT-based
or not. The sophistication of each of the four modules varies greatly between different
systems. When automating replenishment processes, the question of which decision
can be handled by the system autonomously and which not has to be examined. All
replenishment systems have a replenishment logic module and require inventory
visibility.45 The other two modules are facultative. For example, a Kanban-system
functions without forecasts or explicit restrictions.46
In the following sections, the notations outlined in Table 7 will be used. The notation
is based on Gudehus (2002), extended with elements of Silver and Pyke (1998) and
the author's own contributions.
45
In theory, it is possible to have a replenishment system without a module for inventory visibility. Instead, the
replenishment is triggered only by sales. Yet, the high shrinkage rates of grocery retailers would make this
system very inefficient in practice. 46
Kanbans are cards attached to units or containers that trigger replenishment. For a detailed description of
Kanban systems see Christopher (1998, p. 185) and Gudehus (2004, p. 261).

4. Development of Models 55
C: Cost function
Ci: Inventory carrying costs
Cs: Ordering costs
Coos: OOS costs
D(i): Demand rate of item in period i in a store
i: Time period
iS: Time period with an order
IA: Mean inventory accuracy
In, system: Inventory record of SKU n in the system
In, system: Real inventory stock quantity of SKU n in store
L: Replenishment lead time
m(i): Inventory position in store
mO(i): Inventory on stock
mS(i): Inventory ordered in store, not yet arrived
n: SKU
N: Number of SKUs
Q: Fixed order quantity
Q(i): Order quantity in period i
Q*(i): Optimal order quantity for period i
Qmax: Restriction, maximal order quantity
Qmin: Restriction, minimal order quantity
p: Period length
s: Order point
S: Order-up-to-level
SS: Safety stock
T: Order frequency
z: Safety factor
α: Service level
σD: Standard deviation of demand 1
,µ σ−Φ : Inverse of standard normal distribution
Table 7: Inventory notations

56 4. Development of Models
4.1.1. Inventory Visibility
As stated before, inventory visibility is the ability to track the status of
inventory across the supply chain (Woods 2002). This can be realized by
defining "buckets" for every location and status of inventory. Simple systems do this
with pen and paper, more sophisticated systems use identification technologies (e.g.
barcode, RFID) and electronic systems (inventory management systems).
For this research project, only the inventory in the store and in the pipeline towards
the store is of interest. The physical stock level in a store is called the on hand stock
mO(i). The inventory on the way to the store is called net stock mS(i). Both quantities
have to be taken in to account before reordering. Therefore, the inventory position
m(i) is defined as the sum of the on hand stock and net stock (see Figure 11).
m(i)= mO(i)+ mS(i)
Inventory level
Time
Q(i)
iS
L
s
SS
-D(i)
mO(i)
m(i)
mS(i)
iS
p
Figure 11: Exemplary time dependent course of the inventory stock level47
Another important descriptive parameter that is closely related to inventory visibility is
inventory accuracy IA. The accuracy of a store with N SKUs can be measured as the
mean difference between recorded inventory levels and real inventory levels.
47
Adapted from Silver, Pyke et al. (1998, p. 250) and Gudehus (2004, p. 371).

4. Development of Models 57
IA =, ,
1
| |N
n system n real
N
I I−∑
The inventory accuracy has not yet received the attention it deserves, though
practitioners stress the importance of maintaining high data quality. There are very
few papers concerning physical audits of retailers' inaccuracy levels; an exception is
a study by DeHoratius and Raman (2005). The authors found, after having examined
a US-retailer, that for 65% of the SKUs the inventory records in the systems do not
equal the real physical inventory. An older empirical study shows that the distribution
centres of a logistics operator had an inaccuracy rate of 36% (Millet 1994).
4.1.2. Replenishment Logic
The store has to have an on hand stock mO(i) at the beginning of the
period i that is bigger than the demand D(i), otherwise an OOS occurs
and the demand cannot be completely filled.
A replenishment system has to decide for every SKU whether it is time to place an
order or not. Formally, it means that it has to decide whether i=iS. How does the
system know that it is time to place the order? There are several sources dealing with
the issue of describing the decision rules of inventory systems (e.g. Vollmann, Berry
et al. 1992; Silver, Pyke et al. 1998; Arnold, Isermann et al. 2004; Stölzle, Heusler et
al. 2004). The decision rules determines, when and in what quantity a replenishment
order is made. The basic inventory decision rules are shown in
Table 8.
Order Quantity
Order Frequency Fixed Variable
Fixed (T,Q) (T,S)
Variable (s,Q) (s,S)
Table 8: Basic inventory decision rules48
The four basic decision rules are therefore:
� (T,Q) Order every T period the fixed quantity Q
� (T,S) Order every T period, fill up to level S
� (s,Q) Whenever inventory drops below s, order Q
� (s,S) Whenever inventory drops below s, fill up to level S
48
Adapted from Vollmann, Berry et al. (1992, p. 701).

58 4. Development of Models
For a discussion of the advantages of each decision rule see e.g. Silver, Pyke et al.
(1998, section 7.3).
Order Frequency
(s,Q) and (s,S) rules can have either a periodic review, making them (T,s,Q) and
(T,s,S) or a continuous review (T=0). Most grocery retailers have a periodic review
once per day (T=p=1 day).
Systems that do not forecast use simple heuristics, such as the following:
IF(m(i)<s; i=iS; 0)49
(An order will be placed in period i if the inventory position is below the reorder point).
More sophisticated systems calculate whether there is a chance of an OOS in the
case that the order is not placed until the next period. This means that the system
compares whether the inventory position is larger than the demand at the time p+L
(taking into account a certain desired service level). Consequently, the decision rule
is
IF(mO(i)<D(i+p+L); i=iS ; 0)
Order Quantity
If the system decides to order, then the system orders the quantity Q(i):
IF(i= iS; Q(i); 0)
Which amount is to be ordered? Simple systems have a fixed quantity Q set or just fill
up to a certain level S. More complex systems calculate the quantity Q(i) taking into
account an optimal order quantity Q* and some other restrictions.50 This quantity is
the result of optimizing a cost function C:
C= CS+ CI+ COOS51
49
The function IF(A;B;C) stands for: If the condition A is true, than do B, otherwise do C. "0" stands for "do
nothing." 50
For an overview of existing restrictions see section 4.1.3. 51
Cf. Gudehus (2004).

4. Development of Models 59
The cost function takes into account several parameters such as:
� CS: ordering costs
- Cost of creating and placing orders
This includes costs for creating the order, costs for sending it to the supplier
and also costs for the supplier caused by the handling of the order.
- Transport costs
The cost of the physical transport of the goods, such as truck costs, road
tolls and customs.
� CI: inventory carrying costs
- Place-in storage costs
These are costs that are created when the items are moved from the store
gate to the back room. The time taken for reshelving is responsible for the
major part of these costs. Additional costs may occur for bulky or heavy
items that require special transport methods.
- Unit variable cost
Not the selling price of the unit, more its value. It is necessary together with
the
- Carrying charge
to calculate the inventory carrying costs. The latter is the cost of having one
money unit of the item tied up in inventory.
- Backroom space cost
The cost of having one unit in one backroom space.
� COOS: OOS costs
These are probably the costs that are most hard to calculate. OOS costs can
be split into lost sales, backorder and lost customers. Therefore, the
computation needs not only to take into account the lost sales, but also the
reduction in customer satisfaction and the risk of losing her for good. To
reduce complexity, most retailers set a desired availability level and then
calculate the optimal order quantity, without explicitly calculating the OOS
costs.
Safety Stock
It is worth noting that because the demand function has a certain distribution and
variance, it is necessary to implement a safety stock to cope with this uncertainty.
The lead time and the delivered quantity might have high volatility as well, therefore
creating the need for additional safety stock. It is self-evident that the more volatile
these factors are, the higher the safety stock will be to maintain a certain service

60 4. Development of Models
level. For instance, if the demand varies (in a normal standard distribution) with a
standard deviation of σD , then the safety stock will be
SS= zσD p L+
where z is the safety factor. For normal distributions, z is calculated as
z= 1
, ( )µ σ α−Φ
for a normal demand distribution N(µ,σ), where α is the service level the company
wants to maintain (Alicke 2003).
4.1.3. Order Restrictions
Inventory replenishment systems are forced by many restrictions to
deviate from an optimal calculated order quantity and replenishment
time. For example, if minimum and maximum restrictions exist for the order quantity,
the determination rule for the order quantity would be
Q(i)= MAX(Qmin; MIN(Qmax;Q*))52
These order restrictions are necessary as retailers face certain business and logistics
limitations. Many of these aspects were not taken into account in the optimization
formula, and so the result has to be adapted. One of the most comprehensive order
restrictions compilations was made by Bernard (1999) and it is seen in Table 9.
Restriction Type Explanation
Minimum quantity Quantity constraint Meet a specified minimum order quantity
Meet a contractually agreed minimum quantity
Maximum quantity Quantity constraint Meet a specified maximum order quantity
Meet physical storage restrictions
Meet physical shipping restrictions
Minimum value Cost constraint Meet an order minimum charge
Maximum value Cost constraint Limit orders to defined signature levels
Security limit to reduce system errors
Minimum days supply Time constraint Prevent multiple orders in a time period
Reduce handling associated with frequent orders
Maximum days
supply
Time constraint Constrain the order quantity to meet inventory turns limits
Limit excessive purchases of low value parts
Limit parts with a shelf life to defined days of supply
Price break quantity Qualifier Take advantage of volume discounts
Rounding quantity Qualifier Order in case pack multiples
Minimum demand
quantity
Qualifier Increase quantity to cover a minimum, average demand or period quantity
Order quantity
multiplier
Qualifier Adjust quantity to account for spoilage, processing, shrinkage, inspections
rejects, etc.
Table 9: Exemplary order restrictions53
52
This formula assures that the calculated optimum quantity Q* is bigger that the minimum quantity Qmin and at
the same time smaller than the maximum quantity Qmax.
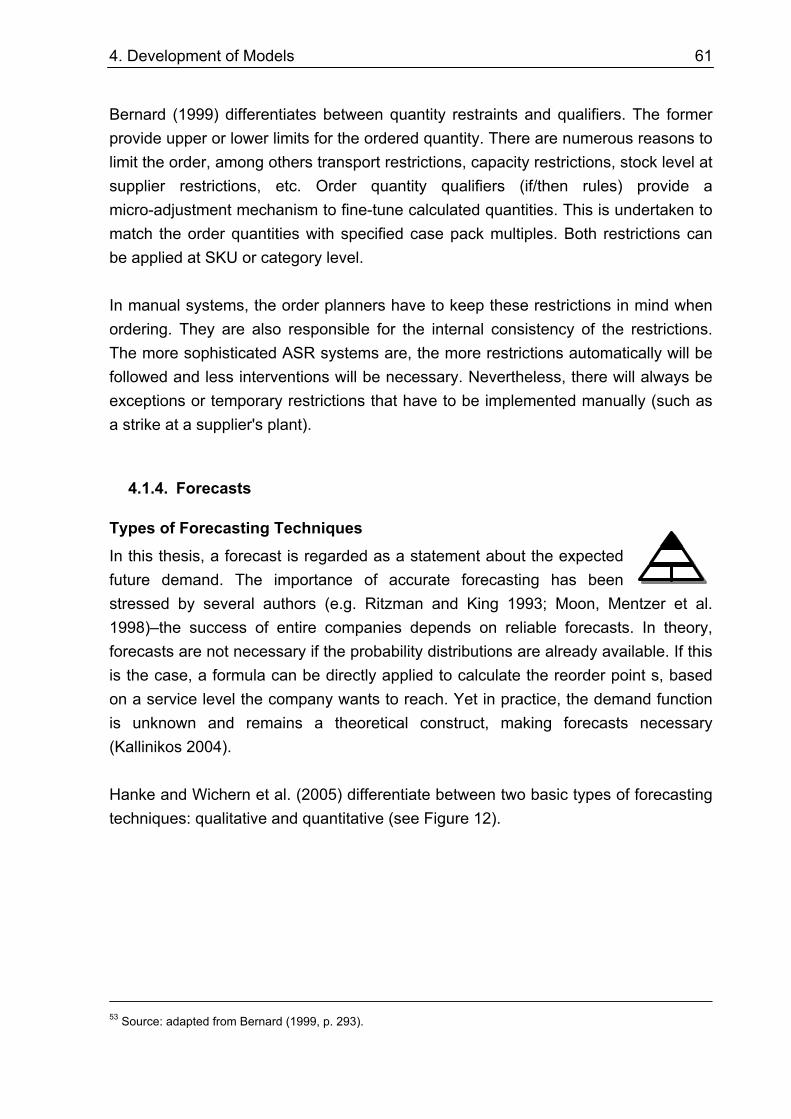
4. Development of Models 61
Bernard (1999) differentiates between quantity restraints and qualifiers. The former
provide upper or lower limits for the ordered quantity. There are numerous reasons to
limit the order, among others transport restrictions, capacity restrictions, stock level at
supplier restrictions, etc. Order quantity qualifiers (if/then rules) provide a
micro-adjustment mechanism to fine-tune calculated quantities. This is undertaken to
match the order quantities with specified case pack multiples. Both restrictions can
be applied at SKU or category level.
In manual systems, the order planners have to keep these restrictions in mind when
ordering. They are also responsible for the internal consistency of the restrictions.
The more sophisticated ASR systems are, the more restrictions automatically will be
followed and less interventions will be necessary. Nevertheless, there will always be
exceptions or temporary restrictions that have to be implemented manually (such as
a strike at a supplier's plant).
4.1.4. Forecasts
Types of Forecasting Techniques
In this thesis, a forecast is regarded as a statement about the expected
future demand. The importance of accurate forecasting has been
stressed by several authors (e.g. Ritzman and King 1993; Moon, Mentzer et al.
1998)–the success of entire companies depends on reliable forecasts. In theory,
forecasts are not necessary if the probability distributions are already available. If this
is the case, a formula can be directly applied to calculate the reorder point s, based
on a service level the company wants to reach. Yet in practice, the demand function
is unknown and remains a theoretical construct, making forecasts necessary
(Kallinikos 2004).
Hanke and Wichern et al. (2005) differentiate between two basic types of forecasting
techniques: qualitative and quantitative (see Figure 12).
53
Source: adapted from Bernard (1999, p. 293).

62 4. Development of Models
Forecasting TechniquesForecasting Techniques
Qualitative TechniquesQualitative Techniques Quantitative TechniquesQuantitative Techniques
Based on the subjective expectations
and experiences of persons
Based on the subjective expectations
and experiences of personsBased on statistical analysis of historical dataBased on statistical analysis of historical data
One-dimensional
Time series based forecasts
One-dimensional
Time series based forecasts
Multidimensional
Causal forecasts
Multidimensional
Causal forecasts
Figure 12: Qualitative and quantitative forecasting techniques54
In practice, qualitative techniques, also known as judgemental techniques, are very
popular among managers (Chase 1995). Such forecasts are based on the subjective
expectations of a single person or group (Schneckenburger 2000). This means that
demand is estimated based on personal experience and knowledge, and forecasts of
this kind are often somewhat intuitive in character. The forecaster's judgement is a
result of the mental extrapolation of past historical data (Hanke, Wichern et al. 2005).
Popular techniques are (Mentzer and Kahn 1995):
� Estimates by the sales force ("sales force composite")
� Commissions of experts ("jury of executive opinion")
� Delphi method
On the other hand, quantitative techniques are purely mechanical procedures that
compute quantitative results and do not require any input of judgement. These
statistical techniques estimate future demand based on historic sales data. There is a
distinction made between one-dimensional forecasts (also called time series
forecasts) and multidimensional forecasts (also called causal forecasts). The
difference is that while time series techniques try to explain demand based on merely
one parameter (i.e. time), causal techniques try to improve forecast accuracy by
implementing more parameters that could have an influence on demand. Examples
for such causal variables are, among others, price, weather and promotional
activities. In the following, the focus is laid on quantitative techniques, as they are the
ones that are used by higher ASR systems.
Accuracy of Forecasts
A common statement in forecast literature is that every forecast is per se wrong (cf.
Alicke 2003), as it is impossible to perfectly anticipate future sales. Therefore, a point
54
Source: based on Schneckenburger (2000).

4. Development of Models 63
forecast is never to be believed blindly. The credibility of a forecast is related to the
strength of the theory underlying it (Wacker and Lummus 2002). The output is only
an estimate of mean future demand (Wagner 2002); its accuracy will strongly depend
on the variation of the demand. With formulas such as MAD (Mean Absolute
Deviation) and MAPE (Mean Absolute Percent Error), the variability of forecasts can
be measured:
MAD=1
1 *| |N
ii iND D
=
−∑
MAPE=1
* *| |1 N
i i
i i
N
D D
D=
−
∑
D* is the predicted demand, D the real demand.
Managers face the challenge to choose the right forecasting methods. If two different
forecasting methods are available, the one producing the lower MAD or MAPE is to
be chosen. A practical solution to this problem was found by Fischhoff (1994). He has
created a 4-level forecast classification enabling managers to decide how reliable a
forecast is. Such classifications can be used to decide, whether an article can be
ordered automatically or not (Toporowski and Herrmann 2003).
All replenishment systems that make quantitative forecasts rely heavily on the quality
of historical demand data. As in a typical store the demand cannot be observed
directly (customers do not place an order, they just buy what is on the shelves), the
actual sales data is regarded as an approximation to the true demand. It is not
difficult to see that this approach is somewhat problematic. For example, if an OOS
occurs and customers do not buy at all, then the sales data will underestimate the
true demand. Wagner (2002) has coined the phrase "dirty data" for this and other
similar problems. In Wagner's paper one can find a comprehensive list of data
challenges companies face in reality that are often neglected in mathematical
models.
The data aggregation level has a major influence on forecast accuracy. An
aggregation is possible regarding time dimensions (days-months-year), product
dimensions (SKU-category) and geographical dimensions (city-region-country). The
higher the aggregation level, the higher the forecast accuracy will be. However, at the
same time the lower the information-richness of the forecast (Jain 2003). An example
of aggregation levels found in retail is given by Achabal, McIntyre et al. (2000). The
authors suggest for categories such as fashion goods, where due to different sizes,
colours, etc. many SKUs exist, to pool four to ten articles within one category and to

64 4. Development of Models
use this to compute a common forecast. This clustering is made subjectively by
selecting products that are expected to appeal to similar customers (e.g. a cluster of
eight different styles of men's casual pants). For a stable forecast they recommend
having at least 100 SKUs sold per time period. The allocation on store and SKU level
is carried out based on historical fractions of sales. Achabal, McIntyre et al. claim that
this is a better way to come to a forecast compared to store level forecasts. This is a
contradiction for some software producers, who claim that only forecasts at SKU and
store level will lead to the desired result (e.g. Beringe 2002).
Forecasts in Automatic Replenishment Systems
Automatic replenishment systems that use forecasts have to decide at the time of
order placement, whether the expected demand in the review period plus lead time is
higher than the current inventory position. Some systems take into account in
addition the uncertainty in demand and lead time. The order is triggered if the
inventory position does not provide enough service protection; otherwise another
period is waited (Wagner 2002) :
IF(mk(i)> Dk(i+L+p) ; PLACE Order Qk(i); 0)
An example of a multidimensional forecast formula used in an replenishment system
is provided by Achabal, McIntyre et al. (2000). Their model is as follows:
Sales = Baseline_sales * Seasonal_effects * Merchandising_effects
This multidimensional model takes into account merchandising effects, effects from
the elasticity of markdown prices, promotional frequency and length, advertisement
size, among other events. However, the authors stress the importance of having as
few parameters as possible ("parsimonious forecasts") as too many parameters can
be counterproductive. In their experiment, with an increasing number of parameters
the adjusted R-square increased in the estimation phase. This means that the
models were quite good in explaining historical data. But these over-sophisticated
forecasts were less accurate in prediction of future periods.
4.2. Classification of Automatic Replenishment Systems
A classification of the different ASR systems was developed based on the
examination of dozens of retailers. Based on the degree of automation, the following
classification system was developed, as seen in Figure 13.

4. Development of Models 65
Sophistication
of the store
replenishment
system
Electronic inventory-
based ordering
Electronic inventory-
based ordering
ASR1ASR1
ManualorderingManualordering
ASR0ASR0
Simpleordering
heuristics
Simpleordering
heuristics
ASR2ASR2
Time series-based
forecasts
Time series-based
forecasts
ASR3ASR3
Causal model-based
forecasts
Causal model-based
forecasts
ASR4ASR4
Manual IT-supported Sales-based Demand-based
Figure 13: Classification of automatic replenishment systems
In the following, the differences between the single levels of the presented
classification will be discussed.55
ASR0: Manual Replenishment Systems
This is the level where all replenishment systems were before retailers introduced IT
systems. A manual replenishment system relies solely on the information and
intelligence of the employees. This kind of system is still in use nowadays; in grocery
retailers (e.g. VOLG), bakeries (Kamps), discounters (Denner) and opticians
(McOptic). But only three out of 12 major European grocery retailers still rely solely
on such manual ordering systems (Småros, Angerer et al. 2004a).
ASR1: Electronic Inventory-Based Replenishment Systems
As soon as retailers have their inventory levels administered by an IT system, one
can say that a state of semi-automation has been attained.56 In the descriptive model,
this step means that the first module "Inventory Visibility" is represented electronically
in the IT system. With this electronic information, it is for the first time possible to
move replenishment decisions away from the store. A centralized system is now
thinkable, where a central organizational unit monitors inventories at all the outlets
and makes decisions concerning deliveries. In order to do so, a certain degree of
inventory records accuracy has to be reached.
It is worth noting that decisions about the time and quantity of the order are still made
manually; therefore, the module "Replenishment Logic" is still not IT-based. Order
restrictions can be displayed on an IT systems, but the planner still has to take them
55
See Table 10 for an overview of ASR differences. 56
The term semi-automation is used because the inventory records are now automatically administered by the IT
system, yet the ordering itself still takes place manually.
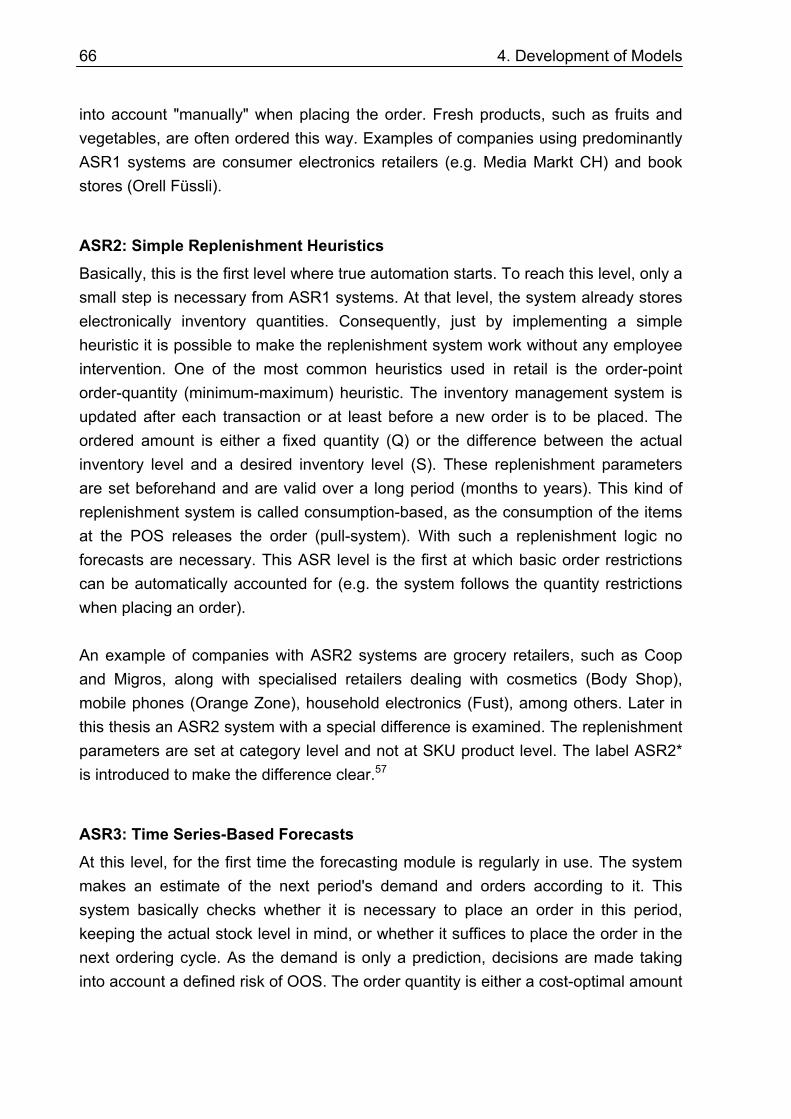
66 4. Development of Models
into account "manually" when placing the order. Fresh products, such as fruits and
vegetables, are often ordered this way. Examples of companies using predominantly
ASR1 systems are consumer electronics retailers (e.g. Media Markt CH) and book
stores (Orell Füssli).
ASR2: Simple Replenishment Heuristics
Basically, this is the first level where true automation starts. To reach this level, only a
small step is necessary from ASR1 systems. At that level, the system already stores
electronically inventory quantities. Consequently, just by implementing a simple
heuristic it is possible to make the replenishment system work without any employee
intervention. One of the most common heuristics used in retail is the order-point
order-quantity (minimum-maximum) heuristic. The inventory management system is
updated after each transaction or at least before a new order is to be placed. The
ordered amount is either a fixed quantity (Q) or the difference between the actual
inventory level and a desired inventory level (S). These replenishment parameters
are set beforehand and are valid over a long period (months to years). This kind of
replenishment system is called consumption-based, as the consumption of the items
at the POS releases the order (pull-system). With such a replenishment logic no
forecasts are necessary. This ASR level is the first at which basic order restrictions
can be automatically accounted for (e.g. the system follows the quantity restrictions
when placing an order).
An example of companies with ASR2 systems are grocery retailers, such as Coop
and Migros, along with specialised retailers dealing with cosmetics (Body Shop),
mobile phones (Orange Zone), household electronics (Fust), among others. Later in
this thesis an ASR2 system with a special difference is examined. The replenishment
parameters are set at category level and not at SKU product level. The label ASR2*
is introduced to make the difference clear.57
ASR3: Time Series-Based Forecasts
At this level, for the first time the forecasting module is regularly in use. The system
makes an estimate of the next period's demand and orders according to it. This
system basically checks whether it is necessary to place an order in this period,
keeping the actual stock level in mind, or whether it suffices to place the order in the
next ordering cycle. As the demand is only a prediction, decisions are made taking
into account a defined risk of OOS. The order quantity is either a cost-optimal amount

4. Development of Models 67
Q* or determined by a preset order-up-to-level point S. The main difference to the
former levels is that the placing of the order becomes demand driven. The forecast is
created by observing the behaviour of demand data in the past and making
assumptions about future consumption. On this level, forecasts are computed with
time series methods (one-dimensional techniques). More sophisticated programs
take into account trends, cyclical variations, seasonal patterns and irregular random
fluctuations (cf. Silver, Pyke et al. 1998). However, even such complex algorithms
remain one-dimensional, as the only independent variable is time. As the IT systems
used in ASR3 systems are more advanced, it is theoretically possible for them to take
into account more order restrictions when ordering. Retailers such as Spar
Switzerland, Orange SA and Spengler use these systems for some of their products.
ASR4: Causal Model-Based Forecasts
The difference between ASR4 systems and the former level is the complexity of the
forecasts used. Causal-based forecasts are obtained by taking into account not only
past patterns, but also by anticipating the effects that future events will have. These
systems claim to be able to predict the effect of promotions, price reductions, actions
of the competition, the weather and more, on the demand. For this, the systems have
to understand and compute the underlying effects influencing consumer demand.
Demand is consequently treated as the dependent variable, and explained within a
causal model with several, independent variables. This kind of system represents at
the moment the most sophisticated software tools available on the market. These
causal models have been successfully implemented, for example, at retailers such as
dm-drogeriemarkt, Woolworth and Metro Group.
ASR5: Multi-Echelon Systems
This level somehow breaks with the linear order of Figure 13. It is possible to
enhance any of the ASR0–4 systems towards a multi-echelon replenishment system.
This means that a system simultaneously controls the inventory stock and makes
replenishment decisions on several levels of the supply chain. An example would be
an ASR system that automatically and simultaneously calculates the optimal orders
for retailers' stores and DCs. Such systems would need even more intelligence than
normal systems, as the complexity of a multi-echelon system increases. The
optimization becomes more difficult due to more restrictions. As stated on section
57
The difference between ASR2 and ASR2* is described in detail in section 6.2.2 in the case of MYFOOD.

68 4. Development of Models
2.1, multi-echelon systems are not included in the focus of this thesis, therefore they
will not be further examined here.
The following table summarizes the differences of ASR systems.
Multi-dimensional
(causal) forecasts
Uni-dimensional (time series-
based)forecasts
NoneNone or qualitative
techniques
Forecasts
Complex restrictions implemented into IT systems
Medium complex
restrictions implemented
into IT systems
Basic restrictions shown in IT
systems
Manual conside-ration of
restrictions
Order restrictions
(s,Q*) or (s,S)
Simple heuristics,
e.g. (T,Q) (T,S) (s,Q), (s,S)
Manual decision: time and quantity
Replenish-ment logic
Electronic inventory record systemManual records
Inventory visibility
ASR4ASR3ASR2ASR1ASR0
Necessary inventory records accuracy increases
Table 10: Characteristics of automatic replenishment levels
4.3. Explanatory Model
4.3.1. Purpose and Structure of the Explanatory Model
The explanatory model in this paper is intended to be a representation of predicted
relationships between factors that influence ASR performance. The explanatory
model helps to quantify ASR1–ASR4 system benefits (research question Q2) and to
find the adequate level of automation for each retailer (Q4). The definition of the unit
of analysis is critical for the further understanding of the model. In theory, retailers will
face an optimal automation level for each SKU in every single store. Yet for practical
reasons, a retailer can only have a certain number of ASR systems running in
parallel. Therefore, retailers will have to define product clusters of items with similar
characteristics that will be managed through a single system that fits the
characteristics of that cluster best. For instance, a cluster could comprise
slow-moving canned products with good demand predictability and low value. The
explanatory model is also the basis for giving recommendations as to how to change
the organization and replenishment processes (Q5).

4. Development of Models 69
A question that has occupied many practitioners is the question of reasons
underlying OOS incidents. In the literature, there are many sources dealing with this
question (eg.Gruen, Corsten et al. 2002; Roland Berger 2003b). Although these
sources examine the underlying reasons, they remain descriptive. Furthermore, a
question that has not been discussed in full detail in theory is the quantitative
correlation between OOS and other variables such as product, store and
replenishment system characteristics. In the model constructed in this thesis, it is
postulated that it is possible to explain, at least partly, the OOS and inventory level
performance of retailers by having the product, store and replenishment
characteristics as independent variables. Therefore, the additive model that is
explored in this thesis is:
Y= M + ASR + P + S + (ASR x P) + (ASR x S) + e
where
Y: OOS rate or inventory performance measure
M: Overall mean
P: Effect from the product characteristics
S: Effect from the store and personnel characteristics
ASR: Effect from the replenishment system in use
ASR x P: Interaction effect replenishment system and product
ASR x S: Interaction effect between replenishment system and store
e: Error term, unidentified effects
The model consists of three main effects and two interaction terms.
The first effect implemented is the replenishment system characteristics (ASR). It
is the main hypothesis of this thesis that the inventory performance and the OOS
rate58 can be influenced decisively by ASR system choice.
The second main effect in the model consists of product characteristics. There are
several statements found in literature and practice that product characteristics will
influence the OOS rate and inventory performance (e.g. Andersen Consulting 1996;
Grocery Manufacturers of America and Roland Berger 2002). For example, from the
58
In this thesis, the OOS definition formulated by Gruen, Corsten et al. (2002) is employed: the OOS rate is
measured as a percentage of SKUs that are out-of-stock on the retail store shelf at a particular moment in time
(i.e., the consumer expects to find the item but it is not available).

70 4. Development of Models
inventory management literature it is known that products with higher demand
uncertainty need higher stock levels to achieve the same availability percentage
(Alicke 2003).59
The third main effect implemented in the model consists of store characteristics. It
is self-evident that this variable can play an important role in inventory performance.
Several studies have stressed that OOS rates vary widely between stores (e.g.
Gruen, Corsten et al. 2002; Roland Berger 2003b). In the case of MYFOOD–the
retailer that will be studied in detail in the quantitative analysis–all stores have exactly
the same distribution system; therefore logistics should not play a role. But the stores
have different sizes, assortments, regions and managers. These differences most
probably influence store performance. Furthermore, another difference in the results
could stem from the personnel, as they still have a significant influence on the
ordering and the quality of store operations (Grocery Manufacturers of America and
Roland Berger 2002). Therefore, it is sensible to include this variable in the model, as
a significant influence on the dependent variable can be expected.
In addition to these three main effects, two interaction effects are included in the
model. If the characteristics of a product have an influence on replenishment system
performance, the ASR x P variable should be statistically significant. This would be
the case, for instance, if store employees are influenced by the product's price when
ordering while the ASR systems are not. One of the interviewees stressed that some
store managers tend to have higher availability rates for products which they
personally like. A machine doing the order is emotionless and is therefore less
influenced by product characteristics. A similar result can be expected from the
ASR x S interaction. It can be assumed that for retailers, such as MYFOOD, where
store employees have greater influence on replenishment parameters, ASR
performance will differ from store to store, making this interaction variable significant.
In the following, hypotheses concerning possible interrelations between the
dependent variables OOS and inventory performance and other independent
variables are constructed. These hypotheses are constructed based on results from
KLOG projects, interviews with practitioners and literature research. The hypotheses
are tested in chapter 5 with the help of data from the grocery retailer MYFOOD. As
59
Sometimes the correlation is not as intuitive. For instance, Kotler and Bliemel (1999) emphasise that only 5% of
unsatisfied customers complain to store employees. Products where consumers complain more often will
probably tend to have a higher availability, as the employees are aware of the importance of the problem. As
customers will tend to complain for certain products more than for others, there is clearly a strong relation
between the product characteristics and the OOS rate.

4. Development of Models 71
this company has mostly ASR0 and ASR2 systems in use, the hypotheses are based
on a comparison of these two systems. The quantitative analysis of the hypotheses
will be carried out with the help of different types of analysis of variance.60
4.3.2. Hypothesis Development: Product Characteristics
Sales Variance
For a retailer it is more challenging to have the right amount of items on the shelves if
there is a large sales variance in a store. There are two problems that arise when
facing irregular selling behaviour. First, the replenishment system must be flexible
enough to cope with the increased complexity. For example, I must be able to order
on one day 50, on another only 5 items of a certain product. The case pack size
(CU/TU ratio) will play a role here as it determines the minimum possible order
quantity. Nevertheless, much more difficult to handle is the second effect. If, in
addition to the high sales variance of a certain product, there is also low predictability,
the replenishment becomes very complex.61 The amount of safety stock is strongly
influenced by this parameter: higher sales variance leads to higher inventory levels
(Krane 1994; Fafchamps, Gunning et al. 2000; Alicke 2003). The higher the demand
uncertainty, the higher the OOS rates will be. For store employees, it is very difficult
to keep track of inventory levels for products that have high sales variance. Besides,
some store managers prefer regular ordering patterns, i.e. they order every second
Monday a case pack (cf. Broekmeulen, van Donselaar et al. 2005). It is obvious that
the bigger the sales variance, the worse such simple ordering patterns will work. For
automatic systems, such as ASR2, inventory visibility is not affected by the sales rate
or variance, the system always knows the quantity in the stores (inventory records
accuracy aside). Besides, ASR2 systems decide every replenishment period (i.e.
every day in the case of MYFOOD) whether it is necessary to place the order. For
these reasons, one can expect that store personnel will have more difficulties
replenishing correctly high-sales-variance products compared to ASR2 systems.
Consequently, the following relationships are expected:
60
This procedure goes hand in hand with Backhaus, Erichson et al.'s (2003) recommendations, as the authors
emphasise the necessity of having a priori hypotheses about the effects of the independent variables on the
dependent variable before using ANOVAs. 61
For the products analysed in this thesis it is not possible to say whether a product has a good predictability or
not. To be able to compare the variance of slow and fast moving products the sales coefficient of variance is
used. This coefficient is calculated by dividing the daily sales' standard deviation of each product by its mean
sales.

72 4. Development of Models
H1a: ASR0 products62 with high sales variance have more OOSs than products
with a low sales variance.
H1b: For ASR2 products, the influence of sales variance on the OOS rate is
smaller than for ASR0 systems.
H1c: ASR0 products with a high sales variance have higher inventory levels than
products with a low sales variance.
H1d: For ASR2 products, the influence of sales variance on inventory level is
smaller than for ASR0 products.
Speed of Turnover
A product's purchasing frequency can have an influence on OOS rate. In the study by
Andersen Consulting (1996) the OOS rates were higher for fast-moving products.
Products that sell very often per day have to be replenished more often than those
with lower sales. Therefore, the danger of an OOS is far greater. On the other side,
very slow moving goods that are only seldom sold have the danger of being
overlooked when ordered manually. In the study by Stölzle and Placzek (2004) slow
moving products had the highest OOS rate. The authors explain this by the fact that
slow moving products receive less attention. This statement is confirmed in the study
by Andersen Consulting (1996), where the authors, in addition, stress the risk for
these products of remaining OOS for a long time. Therefore, for manual systems
(ASR0) a quadratic curve is expected, meaning that products with very low and very
high speed of turnover will have the most OOS incidents. As automatic systems do
not have the danger of overlooking orders, only a small influence of the speed of
turnover on the OOS rate should occur.
The inventory level in a store is determined by logistics aspects but also by marketing
aspects. Retailers want to avoid having too few products on the shelf. The reason for
this is explained by one interviewed store manager, who said, "we create demand by
having full shelves." Therefore, one can expect to see for slow moving SKUs more on
stock than is actually necessary from a logistical point of view. In addition, for some
slow moving units a single case pack size lasts for weeks, therefore increasing
average inventory levels. This means that the lower the turnover of a product, the
higher will be the inventory range of coverage. The situation is similar for ASR2
systems. Their inventory level will also depend on case pack size and turning speed:
the slow moving products will have higher inventory levels. Yet, there should be a
difference for very slow moving products. While store managers tend to have a
simple procedure for such items (e.g. order a case pack every third week) (cf.
62
The wording "ASRx product" is a short form for "a product that is ordered through an ASR level x system."

4. Development of Models 73
Broekmeulen, van Donselaar et al. 2005), MYFOOD's ASR2 systems check the
inventory position daily, therefore optimizing the ordering and thus reducing
inventory. Overall, it is hypothesised:
H2a: ASR0 products have higher OOS rates for very fast moving and very slow
moving articles than for the other products.
H2b: For ASR2 products, the influence of speed of turnover on the OOS rate is
smaller than for ASR0 products.
H2c: ASR0 products with a low speed of turnover have higher inventory levels
than fast moving products.
H2d: For ASR2 products, the influence of speed of turnover on inventory levels is
smaller than for ASR0 products.
Price
The effect of price on OOS and inventory level is ambiguous. DeHoratius and Raman
(2002) found that inexpensive goods were more likely to have inaccurate records
than expensive ones, as expensive SKUs receive more attention. According to this
fact, one would expect more expensive goods to be less often OOS, for both manual
and automatic systems. Normally, store managers would try to reduce the amount of
expensive goods on stock, as they are bounded capital. Yet, in the data set of this
thesis the most expensive goods are only worth 17 euro, 90% of all goods are
cheaper than six euro. This price range is very small compared to the range in
DeHoratius and Raman's (2002) work, where the most expensive goods had a value
of 2,800 euro. Yet, as Broekmeulen, van Donselaar et al. (2004b) show, the inventory
costs are secondary for typical grocery retailers, as they only represent 10% of
logistics costs. Much more important are the handling costs in the store, which are
five times as high. Therefore, it is reasonable to argue that for the observed grocery
retailer MYFOOD another relationship between price and inventory performance will
appear. Assuming that the more expensive goods have higher margins, the store
manager will tend to have a higher inventory level on the shelves to avoid any OOS
and consequently customer dissatisfaction. Yet, it is not clear if this strategy is
successful, as many sources from the just-in-time and lean management literature
have stressed the negative impact of high stock levels on availability (Schonberger
1982; Krafcik 1988; Fisher 2004). The higher inventory levels may even worsen the
availability rate of these products. For automatic systems, on the other hand, the
product price should not play such an important role, as the automatic system
reorders the product despite its price. Based on this research it is expected that:
H3a: ASR0 products with high prices have more OOSs than lower priced goods.

74 4. Development of Models
H3b: For ASR2 products, the influence of price on OOS is smaller than for ASR0
products.
H3c: ASR0 products with higher prices have higher inventory levels than
low-priced goods.
H3d: For ASR2 products, the influence of price on inventory level is smaller than
for ASR0 products.
Case Pack Size (CU/TU)
Trading units (TUs) are the cases used to transport the products to the stores and
contain several small consumer units (CUs)–the units that are finally bought by
shoppers. For a typical grocery retailer, the size of the case packs is the same for all
stores, as it is often determined by the supplier without taking into account the store's
individual demand. The consequence is high inventory levels. Broekmeulen, van
Donselaar et al. (2005) found in their research that 96% of the items in their sample
had a larger order case pack size than the stores needed in a reordering period.
Therefore, stores typically order a single case pack unit or wait a longer time to place
the order. The higher the CU/TU ratio, the stronger this effect and the more inventory
will be on stock. On the other hand, the smaller the CU/TU ratio is, the better a
store's replenishment system can work. It is not only manual systems that are
influenced by the CU/TU ratio. Falck (2005) has shown in theory that ASR3 systems
will only manage to reduce inventory compared to ASR2 systems if the CU/TU ratio
is small.63 Therefore, it is hypothesised that ASR2 systems will also be influenced by
the CU/TU ratio.
Big case packs force employees to place orders more seldom. Therefore, the danger
of forgetting to replenish the item is greater. As automatic systems do not forget any
order, one can assume that the OOS rate will be higher for manually ordered
products compared to ASR2 ordered products.
One effect that might cover the influence of the CU/TU ratio on OOS rate is shelf
space. Depending on the shelf space allocation, a certain case pack may or may not
be beneficial. Wegener (2002) hypothesises that the OOS rate will strongly be
63
It is worth noting that the resulting effect of the CU/TU ratio on performance depends on the store. Small stores
are more affected by the CU/TU ratio than bigger stores. For example, for some non-food products of
MYFOOD (e.g. shoe laces) the smallest case pack lasts in small stores for several months, while in a bigger
store one case pack is sold within days. Therefore, instead of looking at the absolute case pack value, all
analyses are made looking at the relative case pack size (case pack size divided by average daily sales),
analogous to Falck's procedure.

4. Development of Models 75
influenced by whether it is possible to place the whole case pack directly on the shelf
or whether part of its contents has to be stored in the backroom. The replenishment
from the backroom not only creates high handling costs, it is also one of the major
reasons for OOS incidents (Gruen, Corsten et al. 2002). Taking these studies into
consideration, it is hypothesised:
H4a: ASR0 products with a small CU/TU ratio have smaller OOS rates than
products with a bigger CU/TU ratio.
H4b: For ASR2 products, the influence of CU/TU on the OOS rate is smaller than
for ASR0 products.
H4c: Products with a small CU/TU ratio have lower inventory levels than products
with a bigger CU/TU ratio.
H4d: Products with a small CU/TU ratio have lower inventory levels than products
with a bigger CU/TU ratio.
Product Size
In the study by Andersen Consulting (1996) different findings on the effect of product
size on OOS are encountered. One could argue that bulky products need more
space on the shelf; therefore, retailers may opt to allocate them less shelf space than
would be advisable from a logistical point of view. Consequently, small products will
tend to have more facings to increase visibility to customers and therefore should be
comparatively more on stock in the store. Wegener's (2002) data analysis of four
product families from the beauty and household category showed that products with
bigger package size were indeed more often OOS than products with small package
sizes. The explanation for this effect given by an interviewed manufacturer was that
especially for bulky products that are not visually pleasing (such as toilet paper),
retailers tend to reduce the amount of facings on the shelves. Yet Wegener (2002)
relativises this result: for other product categories the correlation effect of product
size and OOS is likely to be smaller, as other product characteristics (such as speed
of turnover) are probably the predominant influence. As regards inventory level,
Broekmeulen, van Donselaar et al. (2004b) found in their analysis of two Dutch
retailers that smaller products had more shelf space than required from a logistical
point of view. Therefore, one can expect to see higher inventory levels for small
products. For automatic systems, on the other hand, the product size should not play
such an important role, as the automatic system reorders the product despite its size.
This is why it is predicted that:
H5a: ASR0 products with a small size have lower OOS rates than big-size
products.

76 4. Development of Models
H5b: For ASR2 products, the influence of product size on the OOS rate is smaller
than for ASR0 products.
H5c: ASR0 products with a big size have lower inventory levels than small
products.
H5d: For ASR2 systems, the influence of product size on inventory level is smaller
than for ASR0 products.
Shelf Life
Retailers are constantly aiming to offer products with longer remaining shelf life, as
consumers demand fresh products (Petrak 2005). Therefore, for products with a very
short shelf life (e.g. fresh pasta), store managers seek to reduce the amount of store
inventory. It is clear that the smaller the average inventory of any SKU (compared
relatively to its mean sales) the fresher the product will be due to a higher turnover.
Therefore, it is reasonable to expect low inventory levels for short-shelf-life products.
This finding is supported by physical audits such as that carried out by Broekmeulen,
van Donselaar et al. (2004b).
Small (safety) stocks reduce the danger of spoilage, but at the same time increase
the danger of OOS. On the other hand, fresh products such as green grocery are, in
terms of marketing, the most important goods for many grocery retailers. Therefore,
skilled store employees will pay extra attention to these products. In the study by
Stölzle and Placzek (2004), cooled products with a short shelf life had smaller OOS
rates. For products with a longer shelf life the retailer can afford to have bigger
quantities stored, as the danger of spoilage is less. Consequently, inventory levels
will increase as well as the time between the ordering thus increasing the danger of
OOS incidents. Overall, this leads to a quadratic effect of shelf life on OOS: products
with very short and very long shelf life will experience more OOS situations. Yet, the
effect of shelf life on OOS could be covered by other factors, such as sales variance,
that have probably a stronger influence on the inventory level. The reasons
mentioned for the influences of shelf life on inventory performance do not hold for
automatic systems. Systems such as ASR2 do not pay more or less attention to
products with a certain shelf life, consequently there should be no influencing effect
visible. Overall, it can be expected that:
H6a: ASR0 products with a very short shelf life have an increased OOS rate, as
well as products with a very long shelf life.

4. Development of Models 77
H6b: For ASR2 products, the influence of shelf life on the OOS rate is smaller than
for ASR0 products.
H6c: ASR0 products with a long shelf life have higher inventory levels than
products with a short shelf life.
H6d: For ASR2 products, the influence of shelf life on inventory levels is smaller
than for ASR0 products.
The following table summarizes the product characteristics hypotheses H1–H6:
Dependent Variables
Independent Variables
Out-of-Stock Inventory Level
+ (H1a, ASR0) + (H1c, ASR0) Sales variance
0 (H1b, ASR2) 0 (H1d, ASR2)
+ - + (H2a, ASR0) - (H2c, ASR0) Speed of turnover
0 (H2b, ASR2) 0 (H2d, ASR2)
+ (H3a, ASR0) + (H3c ASR0) Price
0 (H3b, ASR2) 0 (H3d, ASR2)
+ (H4a, ASR0) + (H4c, ASR0) CU/TU
0 (H4b, ASR2) + (H4d, ASR2)
+ (H5a, ASR0) - (H5c ASR0) Product size
0 (H5b, ASR2) 0 (H5d, ASR2)
+ - + (H6a, ASR0) + (H6c, ASR0) Shelf life
0 (H6b, ASR2) 0 (H6d, ASR2)
"+" Positive effect "-" Negative effect "0" Smaller effect of ASR2 system compared to ASR0
"+ - +" quadratic relationship
Table 11: Overview of hypotheses concerning product characteristics
4.3.3. Hypothesis Development: Store Characteristics
Several descriptive OOS studies have mentioned that there is a strong variance in
the OOS rates between countries and retailers studied (e.g. Gruen, Corsten et al.
2002; Roland Berger 2003b). The same sources also indicate that the OOS rate
differs from store to store, even though the stores' contexts (i.e. ASR system,
distribution network, assortment, marketing activities, etc.) are fairly similar. This
latter phenomenon will be analysed in the data of MYFOOD. In the following,
hypotheses concerning the influence of store characteristics on the OOS rate are
derived, as the understanding of these influences is important when assessing the
effect of ASR systems.

78 4. Development of Models
Different Performance Between Stores
As stated before, one of the common results found in previous availability studies is
that the OOS rate differs significantly between stores (e.g. Gruen, Corsten et al.
2002; Roland Berger 2003b; Stölzle and Placzek 2004). A transfer thought would be
that the same relationship holds true for inventory performance (i.e. inventory levels
and inventory variance). As MYFOOD managers are at liberty to change the
parameters of their replenishment system they have an important influence on the
inventory level. The hypotheses are therefore:
H7a: The mean OOS level of a store differs from store to store.
H7b: The mean inventory performance of a store differs from store to store.
Shrinkage and OOS
The pivotal question is how some stores manage to have lower OOS rates other
stores facing the same logistical context and using the same replenishment systems.
A possible answer could be that store managers decide willingly to reduce OOSs by
having more shrinkage. Yet, the interviewed practitioners from MYFOOD stressed
the importance of the capabilities of the store managers to the performance of the
store. The literature has often stressed the importance of good management for
performance (e.g. Fahrni 1998). In MYFOOD's interviewees' opinion, stores with
experienced mangers are able to reduce shrinkage and OOSs at the same time.
Consequently, the hypothesis is:
H8: There are some excellently-managed stores that are able to reduce OOSs and
shrinkage at the same time.
SKU Density
The more complex a store is, the more difficult it will be to manage. Raman,
DeHoratius et al. (2001a) report how difficult it is for employees ordering manually to
keep track of a product's availability. Yet it would be misleading to compare the
absolute number of products between stores. Bigger stores will tend to have higher
sales and a broader product range, but at the same time there will be more store staff
and more space on the shelves for the product. Therefore one cannot conclude that
bigger stores will have higher OOS rates. A way to compare different-sized stores
may be looking at the SKU density. The assumption is that the amount of products
per square metre is a good way of quantifying the complexity of a particular store.
This variable has also been used by DeHoratius and Raman (2002). The authors
were able to prove a positive correlation between the inaccuracy of records in a store
and the SKU density. The authors argue that in crowded stores it is more difficult to

4. Development of Models 79
track data inaccuracy, therefore increasing the danger of OOS incidents. Besides, the
more products a store has per m2, the less space there will be on the shelves for
each SKU, thus increasing the chances of an OOS. The hypothesis reflecting this
considerations is:
H9: Stores with high SKU density will have more OOSs than low-density stores.
Work Intensity
The economic theory of work states that there is a quadratic relationship of work
effort and efficiency (cf. Fairris 2004). Transferred to this context this means that the
number of employees in the store should also have a quadratic influence on the
quality of store operations. When there are very few employees in a store, every
single one has to work more; exhaustion and stress can set in, thus reducing the
efficiency of work. The replenishment of shelves and the accuracy of data will suffer.
Gruen, Corsten et al. (2002) found overworked staff to be one of the reasons for
OOSs. On the other hand, if there are too many employees, boredom can set in
(Fairris 2004), motivation can sink (Connell 2001), the responsibility for tasks can
become unclear, and store managers find it more difficult to coordinate tasks (Anon.
2004). Wegener (2002) states that the marginal rate of productivity sinks, therefore
she expects stores with an average personnel intensity to have the lowest OOS
rates. To be comparable, the number of staff should be seen relative to the size of
the store. The bigger a store the more the staff necessary to manage the shelves
accurately. Overall, the hypothesis can be formulated as:
H10: Stores with too many or too few employees per m2 sales area will have more
OOSs.
Store Managers' Experience
For retailers that have a very decentralized decision system, the single store can be
regarded as a little independent company. Therefore, the influence of the store
manager as an entrepreneur on the performance of the store will be significant, as
stated in classical entrepreneur theory (cf. Schumpeter 1935; Fahrni 1998). Stores
with good leadership will tend to have lower OOS rates. The more experience the
store manager has, the better the performance of the store will be as store operations
have a radical impact on the OOS rate (Gruen, Corsten et al. 2002). In the case of
MYFOOD, store operations are still within the responsibility of store managers; they
have a strong influence on replenishment parameters. A rather crude way to asses
the experience of a store manager is by looking at the number of years he or she has
worked in that particular store. The longer the store manager has been working in a

80 4. Development of Models
particular store, the better the performance should be. Already Raman, DeHoratius et
al. (2001a) confirm that store managers who have been working for a long time on a
particular store had a smaller rate of misplaced SKUs (i.e. items that were in the
backroom but not on the shelf). Another advantage of experienced managers is that
they have gained knowledge about the demand behaviour of their customers. For
instance, experienced managers know to quantify the influence of a soccer game in
the city on beverage consumption. However, an effect of diminishing returns will most
probably appear. This means that for managers that have been on site for a long
time, additional years in the store only result in small improvements. Based on these
statements it is hypothesised:
H11: Store managers that have been working in the same store for a long time
have lower OOS rates than other store managers.
Backroom
Authors such as Krafcik (1988) and Schonberger (1982) from the just-in-time and
lean management philosophy argue that inventory hides problems in manufacturing.
Transferred to this thesis, this means that having too much stock can be
counterproductive to the availability rate. First, in backrooms that are crammed with
goods, it will be very difficult to achieve a high visibility. And second, high inventory
impedes process improvement, as errors of suboptimal replenishment systems are
obscured by high inventories. Raman, DeHoratius et al. (2001a) report on a case in
which a certain shop suffered a substantial deterioration in performance after the
capacity of the backroom was increased. Fisher (2004, p. 14) therefore demands
from retailers "to get rid of the backroom." If this is really recommendable can be
tested by the following hypothesis:
H12: Stores with large backrooms have higher OOS rates than stores with small
backrooms.
Customer Satisfaction
Finally, a question asked by many retailers is, whether it is worth putting effort into
improving the OOS rate at all. Although a high availability is crucial for the
satisfaction of consumers (Sterns, Unger et al. 1981; Angerer 2004) one could argue
that by investing too much time in increasing availability (by having, for example,
store employees replenishing the shelves more frequently) the direct service to the
customer could suffer, as e.g. less check-out lanes are open. In addition accurate
scanning of goods takes longer, and is therefore not welcomed by customers.

4. Development of Models 81
Therefore, it is interesting to analyse whether there is indeed a positive correlation
between customer satisfaction and OOS rate:
H13: Stores with lower OOS rates have more satisfied customers than stores with
high OOS rates.
The following table summarizes the store characteristics hypotheses H7–H13:
OOS rate differs from store to store (H7a)
Inventory performance differs from store to store (H7b)
Reduction of OOSs and shrinkage is at the same time possible (H8)
The more SKUs per m2 the more OOSs (H9)
Too many and too few staff increases OOSs (H10)
More experienced store managers have fewer OOSs (H11)
Bigger backrooms lead to more OOSs (H12)
Stores with low OOS rates have higher customer satisfaction (H13)
Table 12: Overview of hypotheses concerning store characteristics
4.3.4. Hypothesis Development: ASR Characteristics
The last group of hypotheses test one of the main questions of this thesis (Q2): can
retailers achieve a better replenishment performance by using higher ASR systems?
From the theoretical research of ASR-related topics64 it is known that ASR systems
should be able to reduce OOSs (cf. Achabal, McIntyre et al. 2000), decrease
inventory level (cf. Ellinger, Taylor et al. 1999), have lower inventory variance and
show robust results compared to manual systems (cf. Closs, Roath et al. 1998).
Therefore, these performance measures have been chosen to test the capabilities of
higher ASR systems.
OOS Performance and ASR Level
Fisher, Raman et al. (2000) point out that many retailers still use very basic methods
for their ordering. According to the authors, rules of thumb and gut feelings are often
used when determining the quantities to be ordered. They see a great opportunity in
mixing "art and science" by using the vast possibilities of new technologies and data
availability to improve retailers' replenishment systems. Such technologies are the
ASR systems. It would be a major relief for retailers to have more reliable
replenishment system, as 72% of all OOSs are caused by faulty store ordering and
64
See research on ARPs in section 3.2.

82 4. Development of Models
replenishment practices (Gruen, Corsten et al. 2002). The reports from practitioners
(e.g. Beringe 2002) and the literature (e.g. Mau 2000) of the reduction of OOSs by
ASR systems are very courageous, yet there are no tests available in academia that
prove these statements. Therefore, this thesis aims to close this gap by showing that
such systems do indeed have the potential of reducing OOSs caused by
replenishment faults. As data for ASR2 systems is available, it is hypothesised:
H14: If the ASR level is chosen and parameterised correctly for a certain product
category, ASR2 products have less OOS incidents than ASR0 products.
Inventory Performance of ASR Systems
While for the OOS performance the situation is clear–the fewer OOS incidents in a
store the better–it is slightly more difficult to assess inventory performance. There are
various definitions of what a good performing replenishment system should optimize
regarding the stock level over time. Two possible perspectives on how to measure
inventory performance used in this thesis are:
� Cost side: to reduce inventory costs, there should be as low stock in the stores
as possible, therefore, the aim is to minimize the absolute inventory mean.
� Marketing side: there should be little variance between the stock levels each
day, as the customer expects full shelves at any time. Consequently, the
ordered quantity should be equal to the demand. The result of such a strategy
is a constant inventory level. Effective replenishment systems should minimize
inventory variance.65
Depending on the characteristics of the retailer, higher ASR systems should improve
inventory performance, as long as the adequate level of ASR is not reached.
The MYFOOD data includes data from three different automatic systems, which can
be compared to ASR0 systems. While ASR2 and ASR3 products should benefit from
the automation, an ASR2* automation is rather crude. ASR2* systems use the same
reorder parameter for many products. As products might exhibit different sales
patterns, the replenishment will probably be suboptimal. Overall, it is hypothesised:
H15a: ASR3 products will have a better inventory performance than ASR0
products.66
65
Whether the shelves will be constantly filled or not, will also strongly depend on store operations, as employees
have to refill the shelves from the backroom. However, a replenishment system that ensures that at any time
the same quantity of goods is in the store is the basis for a good refilling of the shelves. 66
The underlying assumption is that the ASR level was chosen and parameterised correctly for the product
category that is examined in the sample.

4. Development of Models 83
H15b: ASR2 products will have a better inventory performance than ASR0
products.
H15c: ASR2* systems will not perform better than manual systems.
The Figures 14–16 show an overview of the hypotheses.
OOSOOS
Product characteristics
Sales variance
Speed of turnover
Price
CU/TU
Package size
Shelf life
H1–6
Dataset1
Inventory
Performance
Inventory
Performance
Figure 14: Overview of hypotheses, product characteristics67
OOSOOS
Store characteristics
Shrinkage
SKU density
Personnel / m2
Store manager experience
Backroom size
H7–13
Dataset1
Figure 15: Overview of hypotheses, store characteristics
67
It is worth noting that these three figures are not meant to be a model, even if they have some visual similarities
to structural equation models. These figures are an illustration of the three different groups of hypotheses that
will be tested in chapter 5. On the left side, there are the independent variables, on the right side the dependent
ones. The tests of the hypotheses are carried out independently of each other. Furthermore, they are based
partly on different data bases.

84 4. Development of Models
OOSOOS
Inventory
Performance
Inventory
Performance
ASR characteristics
ASR system level
H15
Dataset2
H14
Dataset1
Figure 16: Overview of hypotheses, ASR characteristics

5. Quantitative Analysis 85
5. Quantitative Analysis
To be able to test the hypotheses formulated in the previous chapter, two different
data sets of the company MYFOOD, a major central European grocery retailer, are
analysed.68 One part of the data stems from a physical OOS audit project that the
KLOG conducted together with this retailer in summer and autumn 2004. In addition,
historical sales and POS data was extracted from the retailer's ERP system to
complement the findings. The quantitative analysis made on this dataset consists of
three parts, analogous to the three groups of hypotheses. First, correlations between
OOS rate and product characteristics are explored. Second, the influence of store
characteristics on the OOS rate is examined. Finally, overall replenishment
performance is tested. Table 13 gives an overview of the datasets that are used for
the hypothesis testing and which will be presented in this chapter.
Hypothesis Data Set Question Answered
H1–H6 Dataset1 Which product characteristics influence the OOS rate and
inventory level? Is there a difference between manual and
automatic systems?
H7–H13 Dataset1 Which store characteristics influence the OOS rate? Is there
a difference between manual and automatic systems?
H14–H15 Dataset1
and 2
Do ASR2 and ASR3 systems perform better than ASR0
systems?
Table 13: Overview of the utilization of the two datasets for hypothesis testing
5.1. Sample and Methodology
5.1.1. Dataset1: Testing of Out-of-Stock Hypotheses
Researchers who want to empirically test hypotheses concerning OOS incidents
require first of all a reliable data sample. To obtain the availability rate of products on
the shelves is, however, a difficult task, as today's IT systems only store the
quantities in the store, without making a difference between the backroom and the
sales area. To overcome this problem, an on-shelf availability project was launched
in summer 2004 together with the European retailer MYFOOD. In the context of this
project, 100 products were chosen across seven different categories and their
on-shelf availability was audited manually. The choice of the products ensured that
there was at least one article per each of the seven most important categories of the
68
For more information about the retailer MYFOOD, refer to chapter 6.

86 5. Quantitative Analysis
retailer.69 The top-selling products were selected in each category (e.g. bananas in
the category green grocery), as their availability has a major impact on the retailer's
financial results and customer satisfaction. In the sample are also products that are
very important for customers as they are difficult to substitute (e.g. yeast in the
category bakery products). In addition, care was taken to have all replenishment
channels represented in the sample. This means that products were chosen that are
distributed through regional and national DCs as well as products that are supplied
directly from the manufacturers. Finally, products in promotion were taken to check
for this influence as well. The final product sampling was determined by logistics and
marketing directors of MYFOOD together with KLOG project members.
The next step was to select the stores to be audited. Ten stores in a certain region of
MYFOOD's home market were chosen taking care to represent three parameters
that, according to the practitioners in the project, have most influence on current store
performance: store size (large vs. small), location (rural vs. urban location) and
historical performance (stores that had in the last years above and below average
performance). The judgement of the stores' historical performance was carried out by
marketing and logistics directors of MYFOOD, who took into account aspects such as
financial performance, sales growth, happiness of customers, etc.
Five students were sent during a period of two weeks in autumn 2004 to the stores to
count the OOS incidents. Their task was to check twice a day the availability of the
products, once in the morning and once in the evening. Therefore, this project
resulted in an OOS data base of 100[products] * 12[days] * 2[measures per day] *
10[stores] = 24,000 data points. Furthermore, for 15 selected products, inventory
levels were manually counted to check the accuracy of inventory records. At the end
of each day, the students handed a list with all OOS incidents to the store managers.
The managers' task was to check the underlying reasons for the missing products
from a provided checklist.70 Store managers chose from this list the reasons for the
OOS incidents for each SKU. The statements made by the store managers were sent
to headquarters and were checked for plausibility by logistics and marketing
representatives. The employees in the stores, as well as the store managers, were
69
The seven most important categories identified by MYFOOD managers are: packaged food (e.g. coffee), green
grocery (e.g. tomatoes), non-food (e.g. toothpaste), dairy products (e.g. Parmesan cheese), meat and fish (e.g.
minced meat), bakery products (e.g. white bread), frozen (e.g. French fries). The products in each of these
categories are all distributed and ordered through the same logistics system. 70
This checklist was analogous to the 13-items list ECR Europe has published (see Roland Berger 2003b).The
ECR-list had to be enhanced by one OOS root cause: "Problems with the replacing of an SKU." This means
that for some discharged SKUs the new replacing product was not yet available for ordering, therefore resulting
in stock-outs.

5. Quantitative Analysis 87
informed that students would be in the stores during two weeks making a physical
audit. But they were not informed what exactly was being measured. In personal
face-to-face meetings, store managers were informed that the aim of the project was
to measure the performance of the logistics system, not to check the performance of
store staff. The managers were requested not to let the daily business be in any way
influenced by the physical audit. This information strategy lead to the desired result,
as the OOS rate for the first week, compared to the OOS rate in the second week,
differed only by 0.1 percentage points.71 There were several cases where products
were OOS for several days in a row, although the store manager could have
intervened at any time. The results of other similar OOS audits undertaken before by
other researchers differ radically from these results. Stölzle and Placzek (2004) had
in their study a reduction of the OOS rate of 26% between the first, anonymous week
and the second week, where the employees were informed. To calculate the weekly
OOS rate of each product, the daily measures per product are converted into a
percentage value, the same method as used by Gruen, Corsten et al. (2002). For
instance, if an article was found to be absent from the shelves three times in the first
week, the OOS percentage is 25%.72
For the final analysis, some products had to be discarded from the 100 original
products available in Dataset1. These were products that were during any of the two
weeks on promotion or out-listed. The reason for this is that promotional articles are
not ordered regularly through the systems, instead the central office sets a fixed
starting amount for each store (push-replenishment). As this procedure is executed
manually, it would be not possible to compare the results of the ordering systems
with each other, as the promotional articles change ASR system during the
promotion. One article was OOS at all times in the store, as it was out-listed and the
new product was not available for order. Overall, the final sample consists of 84
products in 10 stores, as can be seen in Figure 17. The unit of analysis is in most of
the following each SKU in each store. Therefore, the sample population consists of
n=840 units.
71
This statement is only valid for non-promotional articles. The OOS rates of products in promotion differ radically
from one week to the other. 72
3 divided by 12, as during six days two daily measures were conducted.

88 5. Quantitative Analysis
Packaged
food
27
Green grocery
16Non food
16
Frozen
3Bread
3
Meat and fish
7
Dairy products
12
Figure 17: Distribution of the 84 products in Dataset1
During the OOS project additional information on each SKU was acquired: product
price, product size, shelf life and the CU/TU ratio. Another source of information was
MYFOOD's ERP system, which provided for each product the delivered quantity and
the daily sales. This data was used to calculate inventory performance (inventory
level and its variance), the mean sales variance and the speed of turnover of each
product.73
As the hypotheses H7–13 relate to the influence of store characteristics on the
performance, some additional store related variables were collected as well. These
are the yearly shrinkage rate (in percent of the turnover), the SKU density (number of
SKUs per m2 sales area), the personnel density (number of employees per 100 m2
sales area), the years the store manager has been working in the particular store,
and the size of the backroom in proportion to the sales area.
The products in the sample are classified according to the replenishment process.
The methods used are manually (ASR0: 31 products) and automatically (ASR2: 53
products). The latter group has to be split into two subgroups. For some ASR2
products, the store staff can only change the ordering parameters based on a
discrete index scale from 1 to 10. This means that store managers can only decide if
they want low replenishment parameters and stock levels ("1") or very high ones
("10") without specifying the exact quantity. Besides, the store manager can only do
this on a group level. This means, for example, that store mangers have to change
the replenishment parameters of all batteries, not only of one special battery type. As
one will see, this procedure changes completely the performance of the products.
Consequently, the term ASR2* level is applied to make a differentiation to the usual
ASR2 systems discussed in this dissertation.

5. Quantitative Analysis 89
Table 14 summarizes the available store, product and ASR variables in use.
Variable Operationalization Variable Name
Product Variables
Sales variance Coefficient of variance of the daily sales Sales_coefvar
Speed of turnover
(=sales per day)
Mean sales of an SKU per day: low, medium
and high category
Speed_of_ turnover
Price Price in local currency (for all stores the same) Price
CU/TU (case pack size) Relative CU/TU ratio: number of consumer units
per trading unit divided by mean sales
CU_TU_relative
Product size Size of the product: small products (up to the
volume of a closed fist) medium size products
(up to the size of a one litre milk pack) and big
products (for all stores the same)
Package_size
Shelf life Shelf life in days Shelf_life
Shelf life2 Shelf life squared Shelf_life_squared
Product sales Daily sales per SKU and store Product_sales
Product deliveries Daily delivered quantity to the stores per SKU Product_deliveries
Store Variables
Store identification Number (1–10) to identify the stores Store_ID
Store size Size category of the store (as defined by the
retailer): small, medium, large
Store_size
Store location Rural or urban location Store_location
Shrinkage rate Yearly shrinkage in % of turnover Shrinkage
SKU density Amount of SKUs in a store divided by sales area SKU_density
Personnel density Number of employees in a store divided by
sales area
Personnel_density
Store manager experience Number of years the store manager has been
working in the store
Store_manager
Backroom size Ratio backroom size to sales room Backroom_size
ASR Variable
Type of ASR system ASR0: manual
ASR2, ASR3: automatic
ASR2*: automatic, but crude parameterised
ASR_level
73
In the appendix, the method for the calculation of inventory levels from the ERP-data is presented in detail.

90 5. Quantitative Analysis
Performance Variables
Inventory level Inventory range of coverage74
Mean of the stock level divided by average daily
sales
Inv_range_of_coverage
Inventory variance Inventory coefficient of variance Inventory_coefvar
OOS All out-of-stocks OOS
Order-related OOS Only OOS incidents are considered, where the
underlying reason is an ordering fault.75
Weekly
mean
OOS_only_order
Table 14: Overview of variables used in the analysis76
The descriptive statistics of the product characteristics by ASR group can be seen in
Table 15. Although the manual group has much higher selling quantities, the sales
coefficient of variance is very similar for all three groups. The average CU/TU ratio is
higher for the ASR2 group than for the ASR0 group, meaning that the latter products
have more flexibility when ordering. A clear difference in shelf life exists between the
groups; the manual products tend to have the shortest shelf life.
74
Instead of using absolute inventory levels, in the analysis the inventory range of coverage is computed. The
inventory range of coverage is the absolute inventory level divided by the mean sales. This relative measure
allows the comparison of products with different sales behaviour. As an example: if a product has a mean daily
inventory level of 100, is this a lot or not? It depends; if the store sells 50 units per day, than the inventory is
rather low as the amount is sufficient to meet demand for two days (100 units divided by 50 units per day
equals 2 days of inventory). If the product is sold on average four times a day, than the store has a substantial
amount of inventory. The inventory range of coverage is in this case 25 days (100/4). 75
The possible OOS causes that are directly related to replenishing behaviour are: order was created too late, the
last order quantity was not sufficient, forecasts were not accurate, during the creation of the order an error
occurred, fault with transmission to the DC, other order-related faults. In the case of MYFOOD, 60% of all OOS
incidents are order-related. In the following, the wording "OOS (order-related)" is used to point out that only
these kind of OOS incidents are meant. 76
Some of these variables, like price, are originally metric. To make it possible to use them in ANOVAs, they are
banded before with the help of 33.33% quantiles. The result is three equal size groups that are called "low,"
"med" (medium) and "high." Whenever a confusion of the metric and the ordinal variable is possible, the suffix
"(banded)" is used.

5. Quantitative Analysis 91
ASR Group
N Minimum Maximum Mean Std.
Deviation
Sales per day [units] 482 .25 299.75 41.16 57.82
Sales coefficient of
variance 481 .04 2.83 .53 .26
Price (local currency) 490 .0 27.5 3.94 4.71
Product size (category) 490 1 3 1.84 .74
CU/TU relative [days] 482 .03 40.00 1.61 3.10
ASR0
Shelf life [days] 490 1 700 48.51 127.58
Sales per day [units] 295 .50 161.92 17.72 23.82
Sales coefficient of
variance 294 .00 2.50 .57 .27
Price (local currency) 310 .5 23.0 3.41 4.18
Product size (category) 310 1 3 1.77 .79
CU/TU relative [days] 295 .01 20.00 2.83 3.52
ASR2
Shelf life [days] 310 60 700 460.00 259.34
Sales per day [units] 39 1.00 26.67 6.82 6.40
Sales coefficient of
variance 39 .28 1.12 .53 .18
Price (local currency) 40 2.1 4.9 3.09 1.09
Product size (category) 40 1 1 1.00 .000
CU/TU relative [days] 39 .94 17.50 4.27 3.90
ASR2*
Shelf life [days] 40 700 700 700.00 .000
Table 15: Product characteristics of Dataset1 by replenishment system
In the two week period there was in average a 3.0% rate of order-related OOS. A first
evidence of the performance differences between ASR systems can be obtained by
regarding the OOS rate separated by replenishment group, as depicted on Table 16.
The products ordered manually had an OOS rate of 4.7% and a standard deviation of
11.7%. This contrasts to the much lower values of the ASR2 and ASR2* groups.

92 5. Quantitative Analysis
N Minimum Maximum Mean Std. Deviation
OOS (order-related) 840 0.0% 91.7% 3.0% 9.4%
By ordering system
ASR0 310 0.0% 91.7% 4.7% 11.7%
ASR2 490 0.0% 29.2% 0.6% 3.1%
ASR2* 40 0.0% 20.8% 1.3% 4.0%
Table 16: OOS rates (order-related)of the sample
This finding is consistent in almost all stores. As depicted on Figure 18 in all stores
but in store 10, the ASR2 systems perform better than the ASR0 systems. Store 10
has overall very low OOS values, therefore, the absolute OOS rate difference
between the ASR systems is minimal. Another finding depicted in Figure 18 is that
the good performance of the ASR2 systems is not repeated with in the case of
ASR2* products. Theses products have in all cases higher OOS rates than the ASR2
ordered products; for two stores, the ASR2* products perform even worse than the
manual ordered products.
0%
2%
4%
6%
8%
10%
12%
14%
1 2 3 4 5 6 7 8 9 10
Store ID
OOS (only order)
ASR0
ASR2
ASR2*
Figure 18: Comparison of the replenishment systems by store77
As with the OOS performance, a first indication on the inventory performance
differences depending on the ASR system can be obtained by regarding the stock
levels by replenishment group, as depicted on Table 17. The products ordered
manually have larger inventory range of coverage and standard variation than the
ASR2 and ASR2* groups. This difference is the more striking as the manual products
77
The stores 1-3 are the smallest stores in the sample. Their assortment do not include ASR2* ordered products,
therefore there is no value for these products in the figure.

5. Quantitative Analysis 93
are mostly from fresh categories. These products should also have by far smaller
inventory levels compared to the canned goods to keep the products fresh.
ASR Group
N Minimum Maximum Mean Std. Deviation
ASR0 Inventory range of coverage
442 .00 45.01 10.89 9.07
ASR2 Inventory range of
coverage 287 .00 50.88 9.46 9.99
ASR2* Inventory range of
coverage 36 .33 45.09 10.73 8.44
Table 17: Inventory range of coverage of Dataset1
5.1.2. Dataset2: Pretest/Posttest Analysis
As valuable as Dataset1 is, there is a small deficit in its analysis, namely that a true
pretest/posttest comparison is not possible. When assessing the performance of the
ASR systems, one is comparing different product categories with each other. As seen
before, the mean characteristics of the products (e.g. shelf life) are slightly different
between the ASR groups. One could argue that these differences are responsible for
the findings seen before, namely that higher ASR levels tend to perform better. To be
able to make final conclusions, it is necessary to have a true pretest/posttest
methodology as described by Sheeber, Sorensen et al. (1996) to underline the
findings. This means comparing the performance of the same products in the same
stores before and after the introduction of a new ordering system and having a
control group where the replenishment system is not changed. This method has the
highest control possibility for biasing influences. The goal of this comparison is to find
out whether there is a significant benefit in implementing automatic systems or not.
Therefore, a second dataset was extracted from the EPR system. As no OOS data is
available from the ERP system, the dependent variables in these tests are inventory
level and variance.
For the pretest/posttest, data from the same 10 stores as in the OOS-audit were
chosen. A period of 180 working days was defined, 15 weeks before and 15 weeks
after the implementation of the new ASR system. This comparison was only possible
for categories that experienced a change in the replenishment system in the last
three years, namely dairy, beauty/household and non-food products. Only products
that were included in the OOS study were chosen for this study, to profit from the
comprehensive product information already collected in this first study. In order to
increase the validity of the comparison it is important to reduce the effects of

94 5. Quantitative Analysis
non-controlled variables. One of these variables is seasonality. Therefore, when
choosing the periods to compare, the same weeks in the year were taken to minimize
the effect of holidays and seasonality. Otherwise, comparing the stock levels in
summer with stock levels in winter could bias the result. For example, dairy products
were automated in November 2004. Consequently, the weeks chosen for the test
were the first 15 weeks of 2004 and 2005, respectively. Both data sets contain thus
the weeks after Christmas and the Easter holidays. Another aspect taken into
account is that there is normally a time period after the introduction of new ASR
systems with strong irregularities in performance, as staff get used to the system.
ASR systems need some time until performance stabilises. Therefore, the time
period was chosen in such a way that there was at least a two months gap between
ASR introduction and the performance measurement. Table 18 summarizes the
periods chosen.
Category Number of Products
Data Period "Before"
Change of ASR System
Data Period "After"
Dairy products 5 Week 1–15, 2004 November 2004 (ASR0�ASR3)
Week 1–15, 2005
Control1
6 Week 1–15, 2004 None (ASR0)
Week 1–15, 2005
Beauty and household
12 Week 30–44, 2003 May 2004 (ASR0�ASR2)
Week 30–44, 2004
Non-food 4 Week 30–44, 2003 May 2004 (ASR0�ASR2*)
Week 30–44, 2004
Control2
14 Week 30–44, 2003 None (ASR0)
Week 30–44, 2004
Table 18: Dataset for the pretest/posttest
For each product the data from the inventory systems was extracted in analogy to
Dataset1 supplying in this way per day and store the delivered quantities and the
sales. This procedure results in 41[products] * 10[stores] * 180[days] * 2[measures] =
147,600 data points. In addition, information about whether and when a product was
in promotion was provided. There was no logistical change for any of the groups
during the period under examination; an unbiased comparison of the replenishment
systems was thus possible.
Comparison 1: Dairy Products (ASR0����ASR3)
In November 2004, a new ASR3 system was introduced for dairy products. Based on
the sales of the preceding four weeks, the new system creates a forecast for the
following days and dynamically calculates and places the new order. From the 100
products in Dataset1, the dairy products where chosen for further analysis as they

5. Quantitative Analysis 95
experienced a change from ASR0 to ASR3. Only products without promotional
activity were included in the analysis, resulting in a sample of five products. The
choice of non-promotional SKUs is of most importance, as during promotions the
inventory levels sometimes increased by a factor of 20. Having these products in the
analysis would distort the results enormously. Besides, promotions are still handled
manually. The products studied were yoghurts, cheese and eggs. As a control group
(Control1), six other randomly selected products were taken: packaged (e.g.
convenience food, frozen goods) and non-packaged food (vegetables, fruit). The
control group products were ordered in the same way during the entire period,
namely manually. As the data set consists of measures during 180 days in ten stores,
this results in 9,000 data points for the ASR3 and 10,800 data points for the ASR0
Control1 group. These figures can be considered large enough to make significant
comparisons. Descriptive statistics from these two categories can be seen in Table
19.
N78 Minimum Maximum Mean Std. Deviation
ASR0 Control1
ASR3 Dairy
ASR0 Control1
ASR3 Dairy
ASR0 Control1
ASR3 Dairy
ASR0 Control
1
ASR3 Dairy
ASR0 Control
1
ASR3 Dairy
Sales coefficient of variance 120 100 .27 .24 2.35 1.02 .82 .54 .38 .15
Price 120 100 1.00 .60 5.60 3.87 3.28 2.21 1.84 1.37
Package size [category]
120 100 1.00 1.00 3.00 2.00 2.33 1.20 .75 .40
Shelf life [days] 120 100 2.00 10.00 350.00 12.00 63.67 11.60 128.62 .80
Speed of turnover [units sold per day] 120 100 1.14 1.80 317.44 349.60 41.55 53.80 66.38 80.78
Table 19: Descriptive statistics of the dairy products (ASR3) and Control1 group (ASR0)
When the dairy products data is split by stores the result is that on average, before
the introduction of the ASR3 system, in four out of ten stores the dairy products had a
bigger inventory range of coverage than the control group. After the change, this was
still the case in only one store.
Comparison 2: Beauty and Household Products (ASR0 ���� ASR2)
Typical products in this category are beauty and hygiene articles such as
handkerchiefs, toothpaste, nappies and toilet paper, as well as household articles
such as washing powder. A change in the replenishment system for these 12
78
The unit of analysis is again the SKUs per store and time period. The 90 days periods for each product are
condensed into one mean value. Therefore, the number of n=120 for the ASR0 group results from the
computation: 6 products * 10 stores * 2 time periods (before/after) =120.

96 5. Quantitative Analysis
products was made in May 2004, changing from manual ordering (ASR0) to a
minimun-maximun system (ASR2), in which a fixed order-up-to quantity exists for
every product/store combination. These replenishment parameters are normally
stable during the course of the year (no seasonality is taken into account) but can be
changed by store managers at any time without involving the retail central office. The
control group (Control2) consists of 14 randomly chosen ASR0 products including
fruit and vegetables, convenience food, meat and fruit juice.
Analogous to the analysis of the ASR3 group in the last section, promotional activities
are a major problem when analysing inventory performance. In contrast to dairy
products, promotions are in this category much more frequent. Virtually all products
were on promotion for at least a week during the period. Therefore, it was not
possible, as before, to reduce the analysis sample to products without any
promotional activity at all. Instead, the weeks with promotional activities were ignored
when calculating stock levels and variances.79 It was observed that the effect of a
promotion lasts sometimes a couple of days longer than the promotion itself. Stores
that had ordered manually too many SKUs still had above-average inventory some
days after the end of the promotion. Therefore, the week following the promotion was
taken out as well. The same procedure was applied to the control group, thus
eliminating the promotional effect for these products as well. With this procedure,
approximately 15% of the daily data is lost, but the gain in accuracy far outweighs
this loss. The same method of dealing with promotions is also applied to the ASR2*
group in the next section.
As depicted in Table 20, the product groups have exactly the same sales variance.
ASR2 products tend to be larger and have a lower rate of turnover than ASR0
products.
79
This is the same method as used by the ordering system of MYFOOD to compute forecasts for ASR3 articles:
dates with promotional activities are ignored.

5. Quantitative Analysis 97
N Minimum Maximum Mean Std. Deviation ASR0
Control2 ASR2 B&H
ASR0 Control2
ASR2 B&H
ASR0 Control2
ASR2 B&H
ASR0 Control2
ASR2 B&H
ASR0 Control
2
ASR2 B&H
Sales coefficient of variance 253 243 .16 .00 1.69 2.21 .63 .63 .26 .32
Package size [category]
266 243 1 2 3.00 3.00 1.93 2.46 .46 .50
Price 266 243 1 1 2.00 2.00 1.22 1.23 .41 .42
Shelf life [category] 266 243 1 2 2.00 2.00 1.50 2.00 .50 .00
Speed of turnover [units sold per day] 266 243 0.82 0.76 339.63 139.40 30.61 13.29 56.97 17.99
B&H: Beauty and household products
Table 20: Descriptive statistics of the beauty and household group (ASR2) and Control2 (ASR0)
Comparison 3: Non-Food Products (ASR0 ���� ASR2*)
With just four articles, this is the smallest category studied. The products examined
were batteries, baking foil, glue and stickers. The replenishment system for this
category was automated at the same time (May 2004) as that for the beauty and
household articles category. After May 2004, the non-food products have been
ordered through an ASR2* system. As before, the main difference between the non-
food products and the control group (Control2) is the very low rate of turnover of the
ASR2* products (cf. Table 21).
N Minimum Maximum Mean Std. Deviation ASR0
Control2
ASR2* Non-food
ASR0 Control2
ASR2* Non-food
ASR0 Control2
ASR2* Non-food
ASR0 Control
2
ASR2* Non-food
ASR0 Control
2
ASR2* Non-food
Sales coefficient of variance 253 74 .16 .36 1.69 .95 .63 .59 .26 .13
Package size [Category]
266 74 1 1 3 2 1.93 1.51 .46 .50
Price 266 74 1 1 2 1 1.22 1.00 .41 .00
Shelf life [category] 266 74 1 2 2 2 1.50 2.00 .50 .00
Speed of turnover [units sold per day] 266 74 0.82 1.05 339.63 24.82 30.61 6.76 56.97 6.02
Table 21: Descriptive statistics of the non-food group (ASR2*) and Control2 (ASR0)
Methodology of Statistical Analysis
The datasets presented were utilized to test the three groups of hypotheses:
products, store and ASR characteristics influence.80 In the following, the
methodologies of the statistical analysis are presented.
80
See Figures 14–16.

98 5. Quantitative Analysis
First, the relationships between product characteristics and OOS rate/inventory
performance are examined. This analysis is conducted with the help of Dataset1, as
there the true OOS rates for each product are available. The OOS rate of a product is
the average rate of the two weeks physical audit. As this analysis aims to test the role
of the replenishment systems, examining all kinds of OOS incidents would lead to
distortions. A missing article on the shelf caused by a strike at the manufacturer
cannot be influenced by the retailer's ASR system. Yet, with the analysed dataset,
there is the unique opportunity to consider only OOS incidents caused by ordering
behaviour (OOS order-related). Therefore, other OOS root causes do not distort the
analysis of the hypothesis dealing with ASR performance. To establish statistical
relationships between the variables correlations, linear regressions and above all
ANOVAs are used.81 To prove that the effect of product variables on automatic
replenishment systems is not as strong as for ASR0 systems, the interaction variable
ASR x Product is considered. If this variable is significant, then the performance of
the ASR system depends on the characteristics of the product. Furthermore, post hoc
tests show whether there is a difference between the individual levels of product
characteristics. For example, post hoc analysis tests whether the OOS rate of low-
priced products that are ordered through ASR2 systems is different from the OOS
rate of medium- and high-priced products, respectively.
Second, with Dataset1 and the same statistical tools it is also possible to test the
influence of store characteristics on the OOS rate. In order to do this, a mean
weekly OOS was calculated for each of the 10 stores, resulting thus in a sample size
of n=20.82 The evidence from this rather small sample are intended to illustrate the
possible existing correlations rather than being a final statistical proof.
Third, the results of both these analyses are a necessary prerequisite for answering
research question Q2: the benefits of ASR systems. To prove that ASR2 products
perform better than ASR0, Dataset1 is examined with the help of ANOVAs. Yet, the
final proof of the performance of the ASR systems is given with the help of the
second dataset. As no OOS rates are available in Dataset2, the tests concentrate on
81
The significance level used in this thesis is 10%. As the ANOVA method is the primary method being used, the
most important requirements for this methodology are discussed in the appendix in section 8.1.2. 82
For this second analysis, the mean weekly OOS is calculated for the whole range of 100 products, therefore
also including the products in promotion. This procedure was chosen because the promotions are the same for
all stores and have the same duration. The performance of a store is therefore also measured by the
availability to handle promotional goods. For the same reason all the OOS causes are taken into consideration,
in contrast to the former hypothesis block, where only order-related OOS causes were considered. Therefore,
in this second analysis reasons like faulty replenishment of shelves from the backroom are also taken into
consideration.

5. Quantitative Analysis 99
the inventory levels and variance. With a controlled pretest/posttest methodology as
described by Sheeber, Sorensen et al. (1996) it is possible to prove that regardless of
the products chosen, higher ASR systems have significantly better results than
manually ordered products. The statistical method used are so-called linear mixed
models.83
5.2. Hypothesis Testing: Dataset1
5.2.1. Influence of Product Characteristics
In this section, two questions are covered. First, the influence of product
characteristics on OOS rates and inventory levels will be examined. If there are any
substantial correlations, retailers would have an instrument to know for which
products the danger of OOS is eminently high and which products tend to have high
inventory levels. Second, the interaction between product characteristics and ASR
system are tested. These tests make it possible to confirm whether the influence of
product characteristics on ASR performance is stronger for ASR0 than for ASR2
systems.84
Test of Hypothesis H1: Sales Coefficient of Variance
The variable sales coefficient of variance is banded into three categories (low,
medium and high)85 and an ANOVA conducted. The results are significant for all
variables but the interaction effect.
83
The basic model underlying the analysis of variance and multiple regression is the general linear model. One of
the extensions of this model is the linear mixed model, the main tool for testing the hypothesis in the
pretest/posttest methodology. The difference to the general linear model is that as the same subject is
measured several times the assumption of independence of the error terms is relaxed. The linear mixed model
allows the modelling of the values of a dependent scale variables (e.g. OOS) measured at multiple time periods
based on its relationships to category (e.g. package size) and scale (e.g. price) predictors and the time at which
they were measured (SPSS Inc. 2003). 84
For all tests in this section, the ASR2* products are omitted, as their sample size is very small (n=40) compared
to the other two groups (nASR0=490, nASR2=310). ANOVAs results would be strongly biased by this large group
size difference. 85
As stated before, the banding of the variable to create three groups is made by using three quantiles (33.33%
percentiles). The result of this is three groups with nearly the same number of units in each subgroup, thus
making the ANOVA analysis much more reliable.

100 5. Quantitative Analysis
Dependent variable: OOS (order-related)
Source Type III Sum of Squares
df Mean Square F Sig. Partial Eta Squared
Corrected model 3195.433 5 639.087 10.321 .000 .063
Intercept 4034.514 1 4034.514 65.157 .000 .078
ASR_level 2526.136 1 2526.136 40.797 .000 .050
Sales_coefvar 463.234 2 231.617 3.741 .024 .010
ASR_level x Sales_coefvar 185.062 2 92.531 1.494 .225 .004
Error 47616.619 769 61.920
Total 56753.472 775
Corrected total 50812.052 774
Table 22: ASR level and sales coefficient of variance ANOVA on OOS (order-related)
On the first look, Figure 19 shows a quadratic relationship between sales variance
and OOS. Yet, a Tamhane's T2 post hoc test shows that for the ASR0 products only
the difference between the medium and the high sales variance group is significant
(p=.071). This means that the ANOVA cannot confirm a significant difference
between the low and medium ASR0 group. For this, hypothesis H1a can only be
partly confirmed, i.e. higher sales variance will lead to higher OOS rates for ASR0
products.
low med high
Sales coefficient of variance (Banded)
0.00%
1.00%
2.00%
3.00%
4.00%
5.00%
6.00%
Estimated Marginal Means
ASR Group
ASR0
ASR2
Sales Coefficient of Variance (Banded)
Figure 19: Estimated OOS (order-related) rate by sales coefficient of variance
The interaction variable ASR_level x Sales_coefvar is not significant (p>.225). This
means, that the forms of the two ASR lines, as depicted in Figure 19, do not
significantly differ from each other. Put in another words, the missing significance of

5. Quantitative Analysis 101
the interaction variable means that one cannot reject the hypothesis that these two
lines are parallel. Yet, a post hoc analysis of the ASR2 group shows that the
individual variance levels are not statistically different from each other (all p>.16).
Therefore, H1b is supported, namely that sales variance has a lesser impact on
ASR2 products than on the manually ordered ones
Overall, given that, in the opinion of experts, this is the most important parameter
influencing replenishment systems, it is surprising that the results above are not
stronger. The model estimates that the ASR0 low-variance group has a 4% and 6%
OOS rate for the low and high-variance group, respectively. This difference of only
two percentage points is rather low. A possible explanation is that replenishment
systems cope quite well with a certain demand variance. Yet there will be a certain
point at which this variance becomes so strong that performance will start to decline.
This would explain that there is no significant difference between the low and medium
variance group for the ASR0 system. It is worth noting that the mean sales coefficient
of variance in this dataset is slightly smaller for the ASR0 group than for the ASR2
group (53% compared to 57%). This means that although the automatic systems
have to deal with slightly higher variance, they perform better than their manual
counterparts.
For the average inventory level as the dependent variable, the results are clearer.
The products of the ASR0 group that have a higher sales variance tend to have
higher stocks (all post hoc tests are p<.002), supporting H1c.
Dependent variable: inventory range of coverage
Source Type III Sum of Squares
df Mean Square F Sig. Partial Eta Squared
Corrected model 40506.130 5 8101.226 16.193 .000 .096
Intercept 159995.245 1 159995.245 319.795 .000 .295
ASR_level 8865.787 1 8865.787 17.721 .000 .023
Sales_coefvar 22270.375 2 11135.188 22.257 .000 .055
ASR_level x Sales_coefvar 4483.293 2 2241.647 4.481 .012 .012
Error 383233.775 766 500.305
Total 603923.142 772
Corrected total 423739.904 771
Table 23: ASR level and sales coefficient of variance ANOVA on inventory range of coverage
The interaction variable is significant (p=.012) and, as can be seen in Figure 20, the
ASR2 replenished products do not react as strongly on the increase of sales variance
(H1d). The only post hoc test that is significant for the ASR2 group is the one

102 5. Quantitative Analysis
between the low and high variance group (p=.010), while for the ASR0 group all post
hoc tests show a significant difference between the variance levels (p<.022).
low med high
Sales coefficient of variance (Banded)
5.00
10.00
15.00
20.00
25.00
30.00
Estimated Marginal Means
ASR Group
ASR0
ASR2
Sales Coefficient of Variance (Banded)
Figure 20: Estimated inventory range of coverage by sales coefficient of variance
Test of Hypothesis H2: Speed of Turnover
As expected in hypothesis H2a, the best curve that fits the scatter plot of speed of
turnover and OOS is a quadratic one. Products with low speed of turnover and with
very high speed of turnover have the highest OOS rates. Yet, the explained variance
(R2) is, with 1%, rather low.
When the average sales volume per product and day is regarded, the ASR0 group
has a higher mean volume than the ASR2 products (41.2 units compared to 17.7
units). This could bias an ANOVA. Therefore, to neutralise the effect of the unequal
distribution of speed of turnover, this metric variable is made into a category variable.
An ANOVA shows that all the effects are significant (p<.001).

5. Quantitative Analysis 103
Dependent variable: OOS (order-related)
Source Type III Sum of Squares
df Mean Square F Sig. Partial Eta Squared
Corrected model 5280.535 5 1056.107 15.450 .000 .091
Intercept 4541.636 1 4541.636 66.439 .000 .079
Speed_of_turnover 1245.637 2 622.818 9.111 .000 .023
ASR_level 2868.753 1 2868.753 41.966 .000 .052
Speed_of_turnover x ASR_level 900.493 2 450.247 6.587 .001 .017
Error 52704.280 771 68.358
Total 64548.611 777
Corrected total 57984.815 776
Table 24: ASR level and speed of turnover ANOVA on OOS (order-related)
Post hoc tests of the ASR0 group show that the products with the highest speed of
turnover (=high sales per day) have significantly lower OOS rates than the slow
turning products (8.0% compared to 2.4%; p<.001). The ASR2 products only show a
difference between the medium and high group (post hoc tests: p=.08), but not
between the medium and low group (p>.99). As depicted in Figure 21, the absolute
influence of the speed of turnover on the ASR2 products is very small, therefore
confirming hypothesis H2b.
low med high
Speed of turnover (Banded)
0.00%
2.00%
4.00%
6.00%
8.00%
Estimated Marginal Means
ASR Group
ASR0
ASR2
Speed of Turnover (Banded)
Figure 21: Estimated OOS (order-related) rate by speed of turnover
The testing of hypothesis H2c confirms that the higher the speed of turnover, the
lower the stock levels are. The differences are significant for the ASR0 group (all post
hoc tests: p<.003). For the ASR2 products, there is no significant difference between
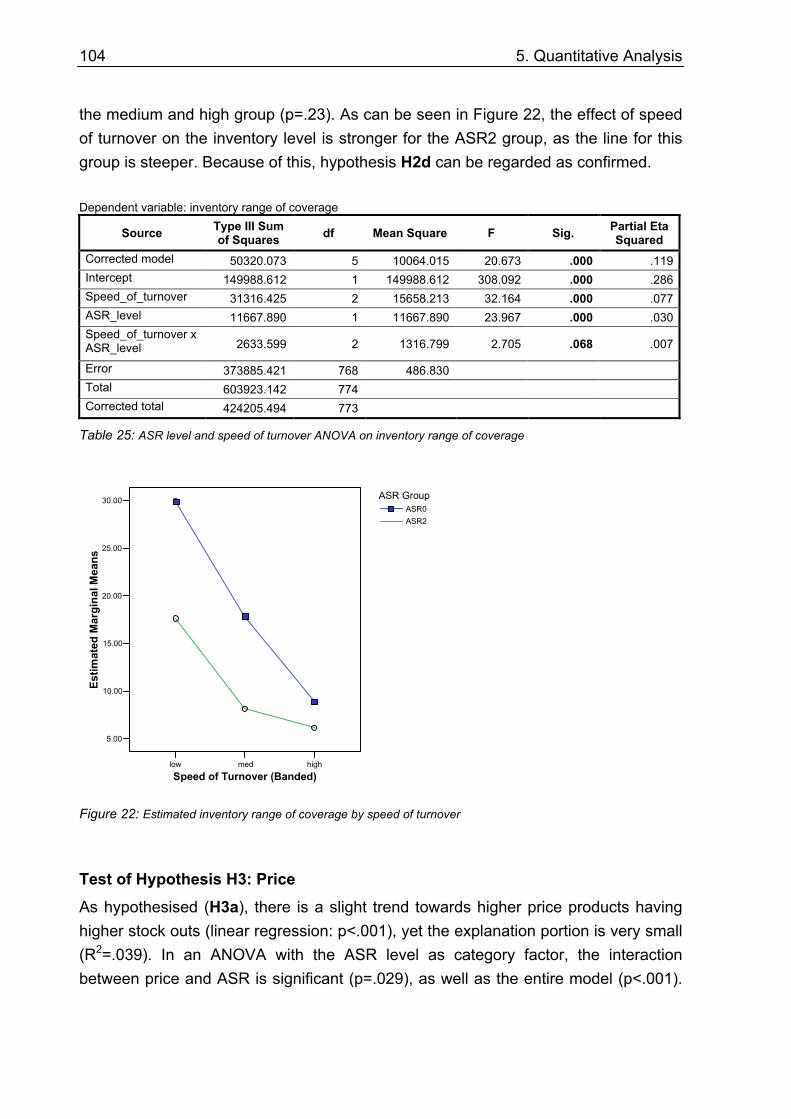
104 5. Quantitative Analysis
the medium and high group (p=.23). As can be seen in Figure 22, the effect of speed
of turnover on the inventory level is stronger for the ASR2 group, as the line for this
group is steeper. Because of this, hypothesis H2d can be regarded as confirmed.
Dependent variable: inventory range of coverage
Source Type III Sum of Squares
df Mean Square F Sig. Partial Eta Squared
Corrected model 50320.073 5 10064.015 20.673 .000 .119
Intercept 149988.612 1 149988.612 308.092 .000 .286
Speed_of_turnover 31316.425 2 15658.213 32.164 .000 .077
ASR_level 11667.890 1 11667.890 23.967 .000 .030
Speed_of_turnover x ASR_level 2633.599 2 1316.799 2.705 .068 .007
Error 373885.421 768 486.830
Total 603923.142 774
Corrected total 424205.494 773
Table 25: ASR level and speed of turnover ANOVA on inventory range of coverage
low med high
Speed of turnover (Banded)
5.00
10.00
15.00
20.00
25.00
30.00
Estimated Marginal Means
ASR Group
ASR0
ASR2
Speed of Turnover (Banded)
Figure 22: Estimated inventory range of coverage by speed of turnover
Test of Hypothesis H3: Price
As hypothesised (H3a), there is a slight trend towards higher price products having
higher stock outs (linear regression: p<.001), yet the explanation portion is very small
(R2=.039). In an ANOVA with the ASR level as category factor, the interaction
between price and ASR is significant (p=.029), as well as the entire model (p<.001).

5. Quantitative Analysis 105
A post hoc analysis shows that only for the ASR0 group is there a significant
difference between the high price subgroup and the other subgroups (p<.02).
Dependent variable: OOS (order-related)
Source Type III Sum of Squares
Df Mean Square F Sig. Partial Eta Squared
Corrected model 4931.502 5 986.300 11.537 .000 .068
Intercept 5169.567 1 5169.567 60.469 .000 .071
ASR_level 3024.956 1 3024.956 35.383 .000 .043
Price_category 649.854 2 324.927 3.801 .023 .009
ASR_level x Price_category
607.124 2 303.562 3.551 .029 .009
Error 67879.609 794 85.491
Total 80416.667 800
Corrected total 72811.111 799
Table 26: ASR level and price ANOVA on OOS (order-related)
Looking at the estimated means by this model one sees that the manual system
reacts much more strongly to price level than the ASR2 system. The latter has no
significant differences between any of the price groups (post hoc: all p>.46). The
automatic system is not influenced by the price when ordering, in contrast to human
beings (H3b).
low med high
Price (Banded)
0.00%
2.00%
4.00%
6.00%
8.00%
Estimated Marginal Means
ASR Group
ASR0
ASR2
Price (Banded)
Figure 23: Estimated OOS (order-related) rate by price
An ANOVA with inventory range of coverage as the dependent variable shows in a
post hoc test clearly that the price levels differ from each other (p<.001). Again,
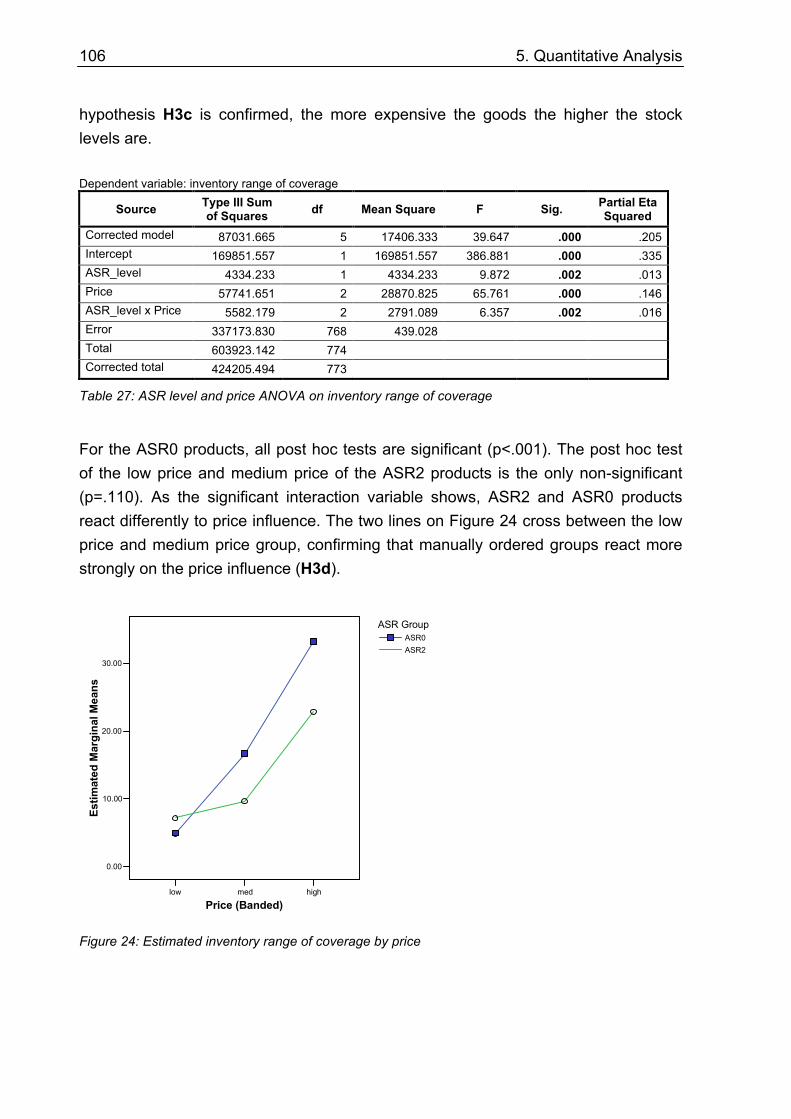
106 5. Quantitative Analysis
hypothesis H3c is confirmed, the more expensive the goods the higher the stock
levels are.
Dependent variable: inventory range of coverage
Source Type III Sum of Squares
df Mean Square F Sig. Partial Eta Squared
Corrected model 87031.665 5 17406.333 39.647 .000 .205
Intercept 169851.557 1 169851.557 386.881 .000 .335
ASR_level 4334.233 1 4334.233 9.872 .002 .013
Price 57741.651 2 28870.825 65.761 .000 .146
ASR_level x Price 5582.179 2 2791.089 6.357 .002 .016
Error 337173.830 768 439.028
Total 603923.142 774
Corrected total 424205.494 773
Table 27: ASR level and price ANOVA on inventory range of coverage
For the ASR0 products, all post hoc tests are significant (p<.001). The post hoc test
of the low price and medium price of the ASR2 products is the only non-significant
(p=.110). As the significant interaction variable shows, ASR2 and ASR0 products
react differently to price influence. The two lines on Figure 24 cross between the low
price and medium price group, confirming that manually ordered groups react more
strongly on the price influence (H3d).
low med high
Price (Banded)
0.00
10.00
20.00
30.00
Estimated Marginal Means
ASR Group
ASR0
ASR2
Figure 24: Estimated inventory range of coverage by price

5. Quantitative Analysis 107
Test of Hypothesis H4: Case pack size (CU/TU)
As stated before, the analyses of the case pack are conducted with the quotient case
pack size divided by mean sales (CU_TU_relative). The result is that all the main
effects as well as the interaction effect are significant (all p<.001)
Dependent variable: OOS (order-related)
Source Type III Sum of Squares
df Mean Square F Sig. Partial Eta Squared
Corrected model 5412.554 5 1082.511 15.876 .000 .093
Intercept 4629.639 1 4629.639 67.896 .000 .081
ASR_level 2873.172 1 2873.172 42.137 .000 .052
CU_TU_relative 1197.892 2 598.946 8.784 .000 .022
ASR_level x CU_TU_relative 1136.784 2 568.392 8.336 .000 .021
Error 52572.261 771 68.187
Total 64548.611 777
Corrected total 57984.815 776
Table 28: ASR level and CU/TU ANOVA on OOS (order-related)
As Figure 25 depicts, the OOS rate of manual order products is strongly influenced
by the relative case pack size. The bigger the ASR0 case packs, the greater the OOS
rate, as hypothesised in H4a. Post hoc tests show a significant difference between
the low and high group (p<.001) and the medium and high group (p=.01). In contrast,
the automatically ordered products do not show a difference between any of the
groups (all p>.59), confirming H4b.
low med high
CU/TU relative (Banded)
0.00%
2.00%
4.00%
6.00%
8.00%
10.00%
Estimated Marginal Means
ASR Group
ASR0
ASR2
CU/TU Relative (Banded)
Figure 25: Estimated OOS (order-related) rate by CU/TU group

108 5. Quantitative Analysis
As expected in H4c and in H4d, bigger case packs lead indeed to higher inventories
(p<.001). For both manually and automatically ordered products, the SKUs with the
highest CU/TU value have at the same time the highest inventory levels. The
interaction effect is not significant (p=.13); all the post hoc tests for the ASR0 and
ASR2 products show significant differences between the case pack size (all p<.02).
This means that both replenishment systems are equally influenced by the case pack
variable.
Dependent variable: inventory range of coverage
Source Type III Sum of Squares
df Mean Square F Sig. Partial Eta Squared
Corrected model 37077.842 5 7415.568 14.711 .000 .087
Intercept 137012.570 1 137012.570 271.811 .000 .261
ASR_level 12754.988 1 12754.988 25.304 .000 .032
CU_TU_relative 22483.296 2 11241.648 22.302 .000 .055
ASR_level x CU_TU_relative 2061.403 2 1030.702 2.045 .130 .005
Error 387127.652 768 504.072
Total 603923.142 774
Corrected total 424205.494 773
Table 29: ASR level and CU/TU on inventory range of coverage
low med high
CU/TU relative (Banded)
5.00
10.00
15.00
20.00
25.00
30.00
Estimated Marginal Means
ASR Group
ASR0
ASR2
CU/TU Relative (Banded)
Figure 26: Estimated Inventory range of coverage by case pack

5. Quantitative Analysis 109
Test of Hypothesis H5: Product Size
An ANOVA analysis shows that product size has a significant (p=.001) influence on
the OOS rate. All other effects are significant as well.
Dependent variable: OOS (order-related)
Source Type III Sum of Squares
df Mean Square F Sig. Partial Eta Squared
Corrected model 6496.079 5 1299.216 15.556 .000 .089
Intercept 4666.274 1 4666.274 55.870 .000 .066
ASR_level 2812.039 1 2812.039 33.669 .000 .041
Product_size 1098.617 2 549.308 6.577 .001 .016
ASR_level x Package_size 1453.912 2 726.956 8.704 .000 .021
Error 66315.033 794 83.520
Total 80416.667 800
Corrected total 72811.111 799
Table 30: ASR level and product size ANOVA on OOS (order-related)
For the ASR0 products, the differences between the small–medium (p<.001) and
small–large products (p=.002) are significant. Larger products have indeed more
OOS incidents as hypothesised (H5a). For the ASR2 systems, on the other hand,
there is no significant effect of product size on OOS (all p>.37), as predicted in H5b.
small medium large
Product Size
0.00%
2.00%
4.00%
6.00%
8.00%
Estimated Marginal Means
ASR Group
ASR0
ASR2
Product Size (Banded)
Figure 27: Estimated OOS (order-related) rate by product size
The ANOVA on the inventory range of coverage shows that all factors are significant
(p<.04). Yet, as can be seen in Figure 28, the direction of the effect is not clear.

110 5. Quantitative Analysis
Dependent variable: inventory range of coverage
Source Type III Sum of
Squares df Mean Square F Sig.
Partial Eta Squared
Corrected model 25963.724 5 5192.745 10.014 .000 .061
Intercept 147353.369 1 147353.369 284.168 .000 .270
ASR_level 2263.971 1 2263.971 4.366 .037 .006
Product_size 10526.892 2 5263.446 10.150 .000 .026
ASR_level * Product_size
6644.695 2 3322.348 6.407 .002 .016
Error 398241.770 768 518.544
Total 603923.142 774
Corrected total 424205.494 773
Table 31: ASR level and product size ANOVA on inventory range of coverage
Post hoc analyses demonstrate for the ASR0 group significant differences between
the small–medium size group (p<.001) and medium–large group (p=.005). The result
of this ANOVA is that medium-size products have the highest inventory levels,
contrary to hypothesis (H5c). For ASR2 products, the largest products have the
highest inventory on stock (small–large post hoc test: p=.009). The interaction effect
is significant, however, as both groups are strongly influenced by the product's size,
hypothesis H5d cannot be supported.
small med big
Product size (banded)
10.00
15.00
20.00
25.00
Estimated Marginal Means
ASR Group
ASR0
ASR2
Product Size (Banded)
Figure 28: Estimated inventory range of coverage by product size
Test of Hypothesis H6: Shelf Life
To test hypothesis H6a, a simple quadratic regression was made separately for every
store. The result is that for all stores but one a quadratic function fits the data better

5. Quantitative Analysis 111
than a linear one. As expected, products with a low or very long shelf life have a
tendency to have higher OOS than products with a medium time shelf life (R2 in
mean 7.9%).
The ASR2 group contains only products with a shelf life longer than 60 days, while
85% of the ASR0 products have a shelf life shorter than 12 days. Therefore, the
results of the ANOVA have to be taken with caution. Figure 29 shows the estimated
results of an ANOVA analysis. For ASR0 products, there is a clear difference
between the low and medium group (post hoc test: p<.001), while the ASR2 group is
not influenced by shelf life (p>.79).
low med high
Shelf life (Banded)
0.00%
1.00%
2.00%
3.00%
4.00%
5.00%
6.00%
7.00%
Estimated Marginal Means
ASR Group
ASR0
ASR2
Shelf Life (Banded)
Figure 29: Estimated OOS (order-related) rate by shelf life
Next, two independent regressions were made, splitting the group by ASR classes
and making a regression analysis on Shelf_life and Shelf_life_square. The result is
that for the ASR0 group the shorter the shelf life, the more OOS it had (p=.046). The
quadratic variable is not significant (R2=11%). For the ASR2 group there was no
significant correlation at all. Also the insertion of the variable as a covariate to an
ANOVA does not give significant results. Overall, one can confirm that shelf life has
an effect on OOS for the manual systems, but not for the ASR2 systems. As the
distribution of shelf life is not even, hypothesis H6b can only be partially supported.

112 5. Quantitative Analysis
Dependent variable: OOS (order-related)
ASR Group
Unstandardized Coefficients
Standardized Coefficients
T Sig.
B Std. Error Beta
(Constant) 5.312 .586 9.059 .000
Shelf life -.024 .012 -.263 -1.966 .050
ASR0
Shelf_life_ square
2.819E-05 .000 .179 1.340 .181
(Constant) .541 .735 .737 .462
Shelf life -8.355E-05 .005 .007 -.017 .987
ASR2
Shelf_life_ square
2.697E-07 .000 .019 .046 .963
Table 32: Regression of shelf life and shelf life squared on OOS
Figure 30 shows that, basically, the same results as before apply to the test of the
inventory levels. The ASR0 products show a significant difference between the low
and medium shelf life group (p=.033). This means that hypothesis H6c cannot be
supported, as products with short shelf life have higher inventory levels than the other
products. For the ASR2 products, on the other hand, the variable shelf life is
significant neither in an ANOVA nor in a regression (p>.79 and p>.94, respectively).
This could be evidence of the smaller effect of shelf life on ASR2 systems, yet due to
the known restrictions of these tests, H6d is only partially supported.
low med high
Shelf life (Banded)
10.00
12.50
15.00
17.50
20.00
22.50
25.00
Estimated Marginal Means
ASR Group
ASR0
ASR2
Shelf Life (Banded)
Figure 30: Estimated inventory range of coverage by shelf life

5. Quantitative Analysis 113
5.2.2. Influence of Store Characteristics
In the last section, the influence of product characteristics on OOS rate and inventory
performance was shown. Yet, this alone cannot explain the results from other studies
showing that there is a high variance between the stores. Therefore, the correlation
between store characteristics and the OOS quote is examined in the following by
conducting analyses on Dataset1. A correlation matrix of the store characteristics can
be seen in Table 33.
OOS per Week
Yearly Shrink-age in %
SKU Density
# Personnel per 100m
2
Store Manager- Years in Store
Ratio Sales-room to Backroom
Customer Satisfaction Index
Pearson correlation
1 .654(**) .167 .018 -.322 .706(**) -.581(**) OOS per week Sig. (2-tailed) .002 .483 .940 .166 .001 .007
Pearson correlation
.654(**) 1 .351 -.334 -.597(**) .318 -.437 Yearly shrinkage in % Sig. (2-tailed) .002 .129 .150 .005 .172 .054
Pearson correlation
.167 .351 1 .010 -.353 .132 -.292 SKU density
Sig. (2-tailed) .483 .129 .966 .127 .579 .212
Pearson correlation
.018 -.334 .010 1 .212 .006 -.547(*) # Personnel per 100 m
2
Sig. (2-tailed) .940 .150 .966 .369 .980 .012
Pearson correlation
-.322 -.597(**) -.353 .212 1 -.326 .598(**) Store manager– years in store
Sig. (2-tailed) .166 .005 .127 .369 .161 .005
Pearson correlation
.706(**) .318 .132 .006 -.326 1 -.478(*) Ratio salesroom to backroom
Sig. (2-tailed) .001 .172 .579 .980 .161 .033
Pearson correlation
-.581(**) -.437 -.292 -.547(*) .598(**) -.478(*) 1 Customer satisfaction index
Sig. (2-tailed) .007 .054 .212 .012 .005 .033
** Correlation is significant at the 0.01 level (2-tailed). * Correlation is significant at the 0.05 level (2-tailed).
Table 33: Correlation between OOS per week and store characteristics (Dataset1)
Test of Hypotheses 7a,b: OOS Rate/Inventory Performance per Store
As hypothesised before, there is indeed a strong correlation of the store variable on
the OOS rate (H7a), meaning that the OOS (order-related) rate differs significantly
from store to store. An ANOVA with the store as a factor is highly significant (p<.001).
In all stores but one, the mean OOS rate of ASR2 products is smaller than those of
the ASR0 products. The interaction effect can be interpreted on how well the ASR2
systems perform compared to ASR0 in each store. As it differs significantly (p=.005),
one can assume that the store indeed has an influence on the ASR system. The
biggest absolute difference exists for store number 1. This store profits most from the
ASR2 implementation.

114 5. Quantitative Analysis
Dependent variable: OOS (order-related)86
Source Type III Sum of Squares
df Mean Square F Sig. Partial Eta Squared
Corrected model 9249.192 19 486.800 5.974 .000 .127
Intercept 5226.104 1 5226.104 64.132 .000 .076
Store_ID 2816.143 9 312.905 3.840 .000 .042
ASR_level 3176.885 1 3176.885 38.985 .000 .048
StoreID x ASR_level 1928.730 9 214.303 2.630 .005 .029
Error 63561.919 780 81.490
Total 80416.667 800
Corrected total 72811.111 799
Table 34: ASR level and Store ANOVA on OOS (order-related)
1 2 3 4 5 6 7 8 9 10
Store ID
0.00%
2.00%
4.00%
6.00%
8.00%
10.00%
12.00%
14.00%
Estimated Marginal Means
ASR Group
ASR0
ASR2
Figure 31: Estimated OOS (order-related) rate by store
The results for the inventory ranges of coverage of each store are not that clear. An
ANOVA is neither significant for the factor Store_ID nor the interaction
Store_ID x ASR_level. Only the ASR_level variable is significant. In all but two stores
the ASR2 products have lower stocks than the products ordered manually. The range
of the inventory is estimated from 8.2 to 12.2 days.
86
One obtains similar results when making the ANOVA on all OOS reasons. Yet in this case, the interaction
variable ASRxStore_ID is no longer significant.
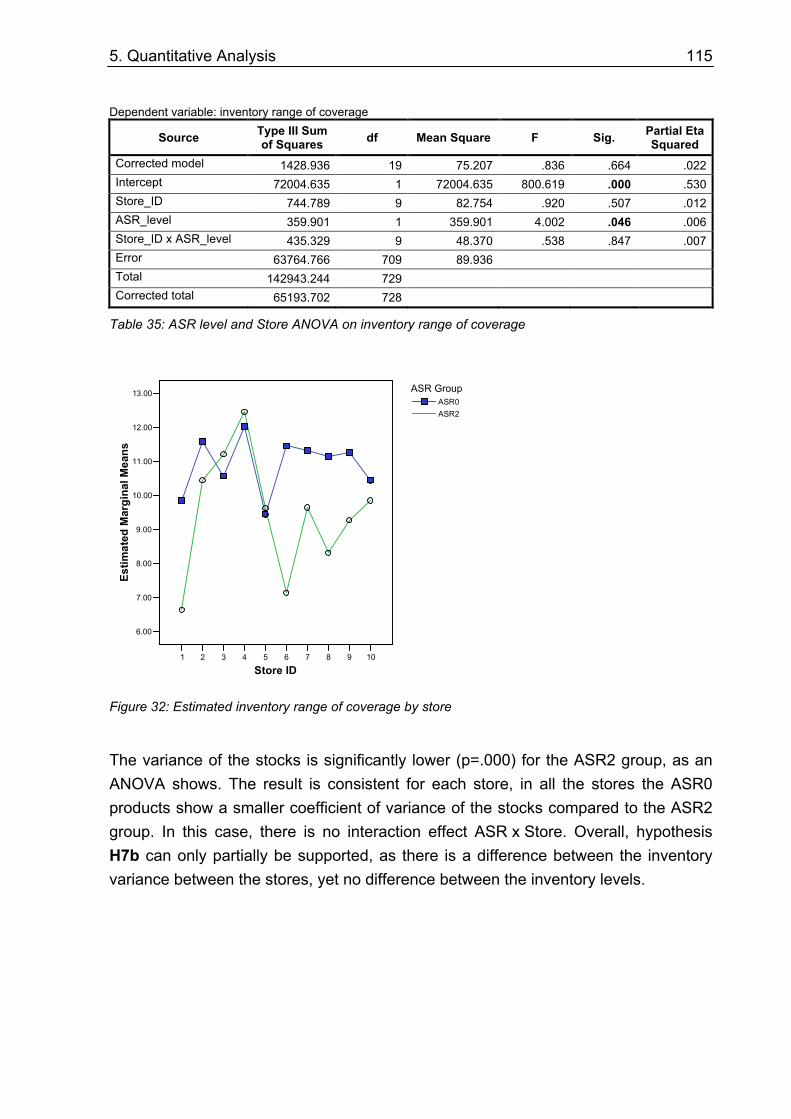
5. Quantitative Analysis 115
Dependent variable: inventory range of coverage
Source Type III Sum of Squares
df Mean Square F Sig. Partial Eta Squared
Corrected model 1428.936 19 75.207 .836 .664 .022
Intercept 72004.635 1 72004.635 800.619 .000 .530
Store_ID 744.789 9 82.754 .920 .507 .012
ASR_level 359.901 1 359.901 4.002 .046 .006
Store_ID x ASR_level 435.329 9 48.370 .538 .847 .007
Error 63764.766 709 89.936
Total 142943.244 729
Corrected total 65193.702 728
Table 35: ASR level and Store ANOVA on inventory range of coverage
1 2 3 4 5 6 7 8 9 10
Store ID
6.00
7.00
8.00
9.00
10.00
11.00
12.00
13.00
Estimated Marginal Means
ASR Group
ASR0
ASR2
Figure 32: Estimated inventory range of coverage by store
The variance of the stocks is significantly lower (p=.000) for the ASR2 group, as an
ANOVA shows. The result is consistent for each store, in all the stores the ASR0
products show a smaller coefficient of variance of the stocks compared to the ASR2
group. In this case, there is no interaction effect ASR x Store. Overall, hypothesis
H7b can only partially be supported, as there is a difference between the inventory
variance between the stores, yet no difference between the inventory levels.

116 5. Quantitative Analysis
Dependent variable: inventory coefficient of variance
Source Type III Sum of Squares
df Mean Square F Sig. Partial Eta Squared
Corrected model 1.949 19 .103 2.476 .000 .059
Intercept 375.430 1 375.430 9062.248 .000 .923
ASR_level .788 1 .788 19.014 .000 .025
Store_ID 1.079 9 .120 2.894 .002 .033
ASR_level x Store_ID .243 9 .027 .651 .754 .008
Error 31.154 752 .041
Total 422.729 772
Corrected total 33.102 771
Table 36: ASR level and store ANOVA on inventory coefficient of variance
1 2 3 4 5 6 7 8 9 10
Store ID
0.65
0.70
0.75
0.80
0.85
0.90
Estimated Marginal Means
ASR Group
ASR0
ASR2
Figure 33: Estimated inventory coefficient of variance by store
Test of Hypothesis 8: OOS and Shrinkage
To test this hypothesis and the following, a simple linear regression is made. As on
Figure 34 depicted, the line fits rather well the data (p=.002) and explains 43% of the
variance. The higher the OOS rate in a store, the higher the shrinkage. There are
indeed some stores that manage to increase the availability without increasing
shrinkage, H8 is thus confirmed. A repeated measure ANOVA for all points shows
that the high shrinkage group has higher OOS rates (p=.08).

5. Quantitative Analysis 117
1.00 2.00 3.00 4.00 5.00 6.00 7.00
Yearly Shrinkage in %
0.000
0.020
0.040
0.060
0.080
0.100
0.120OOS per Week
R Sq Linear = 0.428
Figure 34: Relationship between shrinkage and OOS
Test of Hypothesis 9: OOS and SKU Density
There is a correlation between the store size and the weekly OOS rate, resulting in
larger stores having smaller OOS rates. This correlation is at the first glance counter
intuitive, as larger stores should be more difficult to handle. The explained variance is
with 19.5% rather small. The examining of the variable SKU density reveals another
picture. In Figure 35 the positive trend between SKU density and OOS rate is much
more visible. Yet, a repeated measure ANOVA for all points shows no significant
results.
A possible reason for this non-significance is that a single store has more than twice
the SKU density than the mean of the other stores, and nevertheless the lowest OOS
rates. When this exceptional store is not regarded, the explained variance of a simple
regression sky rockets to 49%. A repeated measure ANOVA without this outlier
shows that the high SKU density group has significantly more OOS incidents than the
other group (p<.011). The OOS difference is estimated to be 3.9 percentage points.
Overall, the hypothesis H9 can be regarded as partially supported.

118 5. Quantitative Analysis
5.00 7.50 10.00 12.50 15.00 17.50
SKU Density
0.000
0.020
0.040
0.060
0.080
0.100
0.120
OOS per Week
Figure 35: Relationship of OOS and SKU density
Test of Hypothesis 10: OOS and Personnel Density
To be able to compare the number of personnel between stores, the ratio employees
per 100m2 is calculated. A linear regression is not significant, as stores with very few
and many employees tend to have higher OOS rates. Consequently, a quadratic line
fits the data rather well (R2=0.39) and underlines the hypothesis H10. Yet, a repeated
measure ANOVA with the variable personnel (split in 3 categories) does not give a
significant difference between the three groups.
2.00 3.00 4.00 5.00 6.00 7.00
# Personnel per 100m2
0.000
0.020
0.040
0.060
0.080
0.100
0.120
OOS per Week
R Sq Quadratic =0.391
Figure 36: Relationship of OOS and number of personnel per m2

5. Quantitative Analysis 119
Test of Hypothesis 11: OOS and Store Manager
The relation between these variables is not as high as with the other store
characteristics variables. A linear regression explains only 10.4% of the variance.
Higher R2 values can be obtained by a logarithmical transforming of the years scale,
taking so into consideration the effect of diminishing returns. A repeated ANOVA with
three groups according to the years of experience is significant (p=.053). Again, the
Tamhane's T2 post hoc analysis show only a significant difference between the group
with the least years in the store to the medium group, confirming the theory of
diminishing returns. Overall, the hypothesis H12 can be supported, yet the effect is
not as clear as with the other store variables.
0.0 2.5 5.0 7.5 10.0 12.5
Store Manager- Years in Store
0.000
0.020
0.040
0.060
0.080
0.100
0.120
OOS per Week
R Sq Linear = 0.104
Figure 37: Relationship of OOS and number years of the store manager working in the store
Test of Hypothesis 12: OOS and Backroom Size
The hypothesis H12 can be fully supported, the larger the backroom in comparison to
the sales room, the higher the OOS rate. A simple regression model explains 49.8%
of the OOS variance, a repeated measure ANOVA analysis is significant (p=.028).
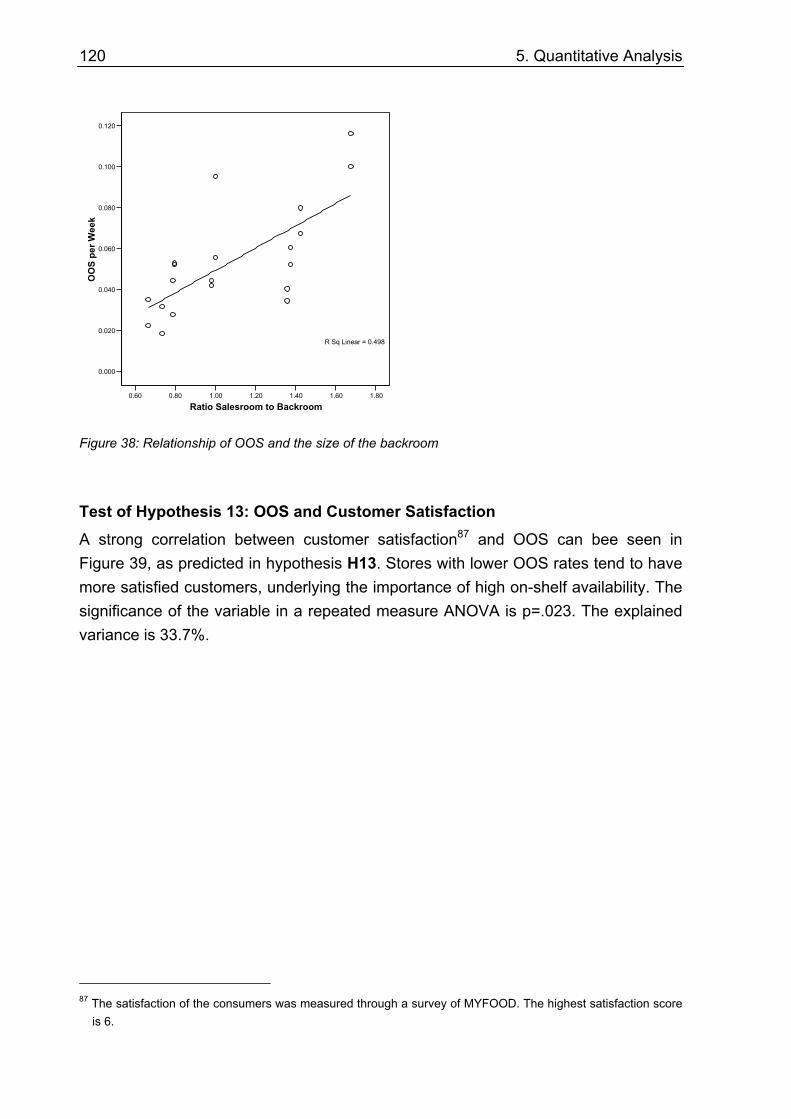
120 5. Quantitative Analysis
0.60 0.80 1.00 1.20 1.40 1.60 1.80
Ratio Salesroom to Backroom
0.000
0.020
0.040
0.060
0.080
0.100
0.120
OOS per Week
R Sq Linear = 0.498
Figure 38: Relationship of OOS and the size of the backroom
Test of Hypothesis 13: OOS and Customer Satisfaction
A strong correlation between customer satisfaction87 and OOS can bee seen in
Figure 39, as predicted in hypothesis H13. Stores with lower OOS rates tend to have
more satisfied customers, underlying the importance of high on-shelf availability. The
significance of the variable in a repeated measure ANOVA is p=.023. The explained
variance is 33.7%.
87
The satisfaction of the consumers was measured through a survey of MYFOOD. The highest satisfaction score
is 6.
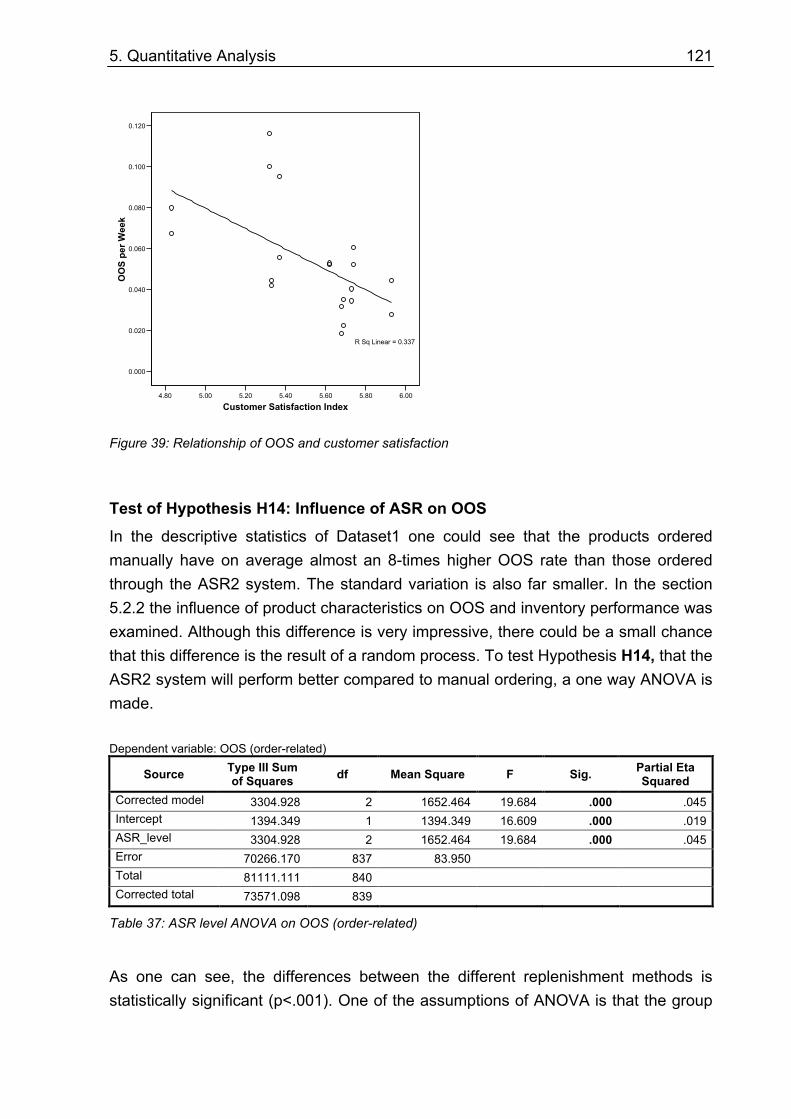
5. Quantitative Analysis 121
4.80 5.00 5.20 5.40 5.60 5.80 6.00
Customer Satisfaction Index
0.000
0.020
0.040
0.060
0.080
0.100
0.120OOS per Week
R Sq Linear = 0.337
Figure 39: Relationship of OOS and customer satisfaction
Test of Hypothesis H14: Influence of ASR on OOS
In the descriptive statistics of Dataset1 one could see that the products ordered
manually have on average almost an 8-times higher OOS rate than those ordered
through the ASR2 system. The standard variation is also far smaller. In the section
5.2.2 the influence of product characteristics on OOS and inventory performance was
examined. Although this difference is very impressive, there could be a small chance
that this difference is the result of a random process. To test Hypothesis H14, that the
ASR2 system will perform better compared to manual ordering, a one way ANOVA is
made.
Dependent variable: OOS (order-related)
Source Type III Sum of Squares
df Mean Square F Sig. Partial Eta Squared
Corrected model 3304.928 2 1652.464 19.684 .000 .045
Intercept 1394.349 1 1394.349 16.609 .000 .019
ASR_level 3304.928 2 1652.464 19.684 .000 .045
Error 70266.170 837 83.950
Total 81111.111 840
Corrected total 73571.098 839
Table 37: ASR level ANOVA on OOS (order-related)
As one can see, the differences between the different replenishment methods is
statistically significant (p<.001). One of the assumptions of ANOVA is that the group

122 5. Quantitative Analysis
variances should be equal. Yet the Levene's test of equality of error variances rejects
this assumption (p<.001). The ASR0 group has a higher variation (11.6%) than the
ASR2 group (3.13%). Nevertheless, as the ANOVA method is robust to this violation
Lindman (1992) does not recommend ignoring the F-test carried out above. Instead,
a Tanhame's T2 post hoc test is conducted, with the assumption that the variances
are not equal. The result is that the difference of 4.09% between ASR2 and ASR0 is
still significant (p<.001). The difference in the OOS rates between ASR2* and ASR0
is not significant (p=.678). Both a Welch and a Brown-Forsythe test, show a
significant difference between the ASR0 and ASR2 group (p<.001).
An ANOVA with ASR_level as the independent variable on inventory level shows that
there is indeed a significant difference between the ASR groups (p<.045). The ASR2
group has an estimated mean inventory range coverage of 9.5 days which is
significantly lower than the 10.9 days of the ASR0 group. The coefficient of variance
of the inventory, however, is smaller for the manual group: 69% compared with 75%
of the ASR2 group (ANOVA: p=.024).
Dependent variable: inventory range of coverage
Source Type III Sum of Squares
df Mean Square F Sig. Partial Eta Squared
Corrected model 359.102 1 359.102 4.027 .045 .006
Intercept 72055.366 1 72055.366 807.968 .000 .526
ASR_level 359.102 1 359.102 4.027 .045 .006
Error 64834.601 727 89.181
Total 142943.244 729
Corrected total 65193.702 728
Table 38: ASR level ANOVA on inventory range of coverage
Therefore, the hypothesis H14 can be supported: the ASR2 ordered products have
on average lower OOS rates than ASR0 products. In addition, there exists strong
evidence that the same holds true for inventory performance. The final proof of this is
checked in the next section.
5.3. Dataset2: Pretest/Posttest
In this section, a comparison of ASR inventory performance is undertaken by
analysing Dataset2. For this, linear mixed models are employed in a pretest/posttest
methodology. Data from a period after the introduction of higher ASR systems is
compared to data from one year before, when the ordering was still done manually.

5. Quantitative Analysis 123
5.3.1. Dairy products: ASR3 performance (H15a)
Inventory Performance: Mean Inventory Levels
In order to compare the performance of the inventory between the categories, the
mean inventory range (i.e. the mean of the daily inventory divided by the sales mean)
is used as before. A first glance at the mean inventory range of coverage reveals that
comparing 2003 to 2004, the mean stock level of the ASR0 control group (Control1)
increased by 11.8% (from 2.8 days to 3.2 days) while for the ASR3 products the
inventory was reduced by 6.4% (from 2.6 to 2.5 days, see Figure 40).
2.85
3.18
2.652.48
0.0
0.5
1.0
1.5
2.0
2.5
3.0
3.5
2004 2005
Year
Inventory range of coverage
ASR0
ASR3
Figure 40: Mean inventory range of coverage in days of dairy products and Control1
When this reduction is spilt by store, one can see that six out of 10 stores had a
higher reduction for the ASR3 group (in percentage points) than for the control group.
For two stores that development of both groups was similar, and only for two stores
the ASR3 group developed considerably worse than the control group.

124 5. Quantitative Analysis
Store ID ASR Group Inventory Mean (days)
Inventory Mean (days)
Reduction in %
2004 2005
Performance of ASR3 Group Compared to Control Group
(percentage points)
1 ASR0 Control1 3.88 4.81 -24.01%
ASR3 Dairy 4.31 3.39 21.34% 45.3%
2 ASR0 Control1 2.41 2.43 -0.51%
ASR3 Dairy 2.71 2.12 21.80% 22.3%
3 ASR0 Control1 3.95 4.23 -7.13%
ASR3 Dairy 1.96 1.77 9.66% 16.8%
4 ASR0 Control1 2.96 2.48 16.26%
ASR3 Dairy 2.46 2.51 -2.02% -18.3%
5 ASR0 Control1 2.97 4.40 -48.52%
ASR3 Dairy 3.38 3.57 -5.46% 43.1%
6 ASR0 Control1 2.57 3.03 -17.63%
ASR3 Dairy 2.06 2.47 -19.94% -2.3%
7 ASR0 Control1 3.06 2.84 7.39%
ASR3 Dairy 2.80 2.67 4.55% -2.8%
8 ASR0 Control1 2.50 2.42 3.28%
ASR3 Dairy 1.52 2.08 -36.98% -40.3%
9 ASR0 Control1 2.17 2.32 -6.70%
ASR3 Dairy 3.50 2.09 40.29% 47.0%
10 ASR0 Control1 2.00 2.88 -44.41%
ASR3 Dairy 1.76 1.80 -2.22% 42.2%
Table 39: Performance of ASR3 group compared to the Control1 (ASR0)
To be able to statistically asses the effect of ASR3 introduction on inventory
performance, a linear mixed model analysis is made. The repeated factor is each
product in each store, as it is measured twice: before and after the introduction of the
new system. The result of such an analysis is that the introduction of the ASR3
systems did indeed have a significantly different impact for the dairy products
compared to the control group (p=.038). While both groups start 2004 at a similar
level (between 2.6 and 2.8 days inventory range of coverage), the ASR3 group has
the next year only in mean 2.45 days of inventory, while the control group has
increased its stock to 3.18 days. This confirms the first part of hypothesis H15a.
Dependent variable: inventory range of coverage
Source Numerator df Denominator
df F Sig.
Intercept 1 108 345.739 .000
Date 1 108 .287 .593
ASR_level 1 108 2.450 .120
Date x ASR_level 1 108 4.413 .038
Table 40: Repeated ANOVA on inventory range of coverage, ASR3 group

5. Quantitative Analysis 125
Adding the factors Store and Store x ASR_level to the model results in a slightly
better model fit. The Schwarz's Bayesian Criterion (BIC) is now 757.9 compared to a
BIC of 802.7 in the former model. The store factor is significant on a 10% level
(p=.073), the interaction between the store and the ASR group is not. The basic
result of this model is the same, the ASR3 group improves its mean stock level while
the control group worsens (p=.038). Higher degrees of interaction
(Store x ASR_Group x Date) are not significant.
Inventory Performance: Coefficient of Variance
A linear mixed model with the coefficient of variance of the stock as the dependent
variable supports the theory of the good performance of the ASR3 systems. In
analogy to the section before, the Date x ASR group interaction is significant
(p=.025). Again the ASR3 ordered products reduce their inventory coefficient of
variance (from 132% to 122%), while the control group worsens (from 160% to
191%), this confirming the second part of hypothesis H15a. This model results in a
BIC value of 573.0.
Dependent variable: Inventory coefficient of variance
Source Numerator df Denominator
df F Sig.
Intercept 1 108 330.969 .000
Date 1 108 1.252 .266
ASR_Group 1 108 8.522 .004
Date x ASR_Group 1 108 5.200 .025
Table 41: Repeated ANOVA on the coefficient of variance of the stock level, ASR3 group
1.60
1.91
1.321.22
0.0
0.5
1.0
1.5
2.0
2.5
2004 2005
Year
Inventory coefficient of variance
ASR0
ASR3
Figure 41: Means of the repeated ANOVA on the coefficient of variance of the stock level, ASR3 group
and Control1

126 5. Quantitative Analysis
5.3.2. Non-food Products: ASR2 and ASR2* Performance (H15b, c)
Inventory Performance: Mean Inventory Levels
The mean inventory range of coverage by year and ASR system can be seen in
Figure 42. Just by looking at this graph one can see that the ASR2 group showed a
very marked improvement, reducing their mean inventory range of coverage by 4.1
days. The ASR0 group (Control2) reduced their stock as well, but only by 0.9 days.
Contrary to this trend, the ASR2* inventory levels increased on average by 1.1 days
after the introduction of automatic ordering.
7.016.09
9.83
5.745.52
6.63
0
2
4
6
8
10
12
2003 2004
Year
Inventory range of coverage
ASR0
ASR2
ASR2*
Figure 42: Mean inventory range of coverage in days of non-food products and Control2
Two separated linear mixed models analyses were made to compare the ASR2 and
the ASR2* products with the control group. The interaction between the variable Date
and the ASR2 group is significant (p=.005), confirming H15b.
Dependent variable: inv_range_of_coverage
Source Numerator df Denominator
df F Sig.
Intercept 1 289.421 166.127 .000
Date 1 226.741 22.540 .000
ASR_level 1 289.421 .846 .358
Date x ASR_level 1 226.741 7.981 .005
Table 42: Repeated ANOVA on mean inventory range of coverage, ASR2 group
The estimated inventory means show that Control2 products reduced its stock from
6.8 days in 2003 to 6.0 in 2004 (-12%). But the reduction of the control group from
9.0 days to 5.9 days (-34%) is much more dramatic.

5. Quantitative Analysis 127
6.84
6.05
9.01
5.86
0
1
2
3
4
5
6
7
8
9
10
2003 2004
Year
Inventory range of coverage
ASR0
ASR2
Figure 43: Estimated means of the repeated ANOVA on the inventory range of coverage, ASR2 group
For the ASR2*, another picture results from the analysis. Here again, there is a
significant interaction between the Date and the replenishment type (p=.011). Yet the
difference is that while the control group managed to reduce its stocks, the ASR2*
showed an increase. The automatic replenishment system did not work as expected
on these products, confirming H15c.
6.85
6.03
5.41
6.63
0
1
2
3
4
5
6
7
8
2003 2004
Year
Inventory range of coverage
ASR0
ASR2*
Figure 44: Estimated means of the repeated ANOVA on the inventory range of coverage, ASR2*
group
Inventory Performance: Coefficient of Variance
The second performance indicator of stock is the coefficient of variance. As depicted
in Figure 45, the ASR2 group reduced its variance from 65% to 57%, while the
control group experienced and increase from 47% to 59%. In this case, the ASR2*
group also managed to reduce the coefficient of variance by 5.6 percentage points.

128 5. Quantitative Analysis
0.47
0.59 0.570.560.51
0.65
0.0
0.1
0.2
0.3
0.4
0.5
0.6
0.7
2003 2004
Year
Inventory range of coverage
ASR0
ASR2
ASR2*
Figure 45: Mean inventory coefficient of variance in days of ASR2, ASR2* group and Control2
Although the better performance of the ASR2 group seems clear, a linear mixed
model fails to prove a significance for the ASR x Date variable (p=.335). Because of
this, hypothesis H15b can only be partially supported. The same holds true for the
difference between ASR2* and the control group: the differences depicted between
the means could have happened by pure chance.
5.4. Quantitative Research–Conclusions
The quantitative analysis carried out provided answers to two research questions. On
the one hand, the influences of store and product characteristics on replenishment
performance could be identified (research question Q3). On the other hand, the
statistical analysis clearly showed that MYFOOD's replenishment performance has
benefited from the implementation of ASR2 and ASR3 systems (research question
Q2). In the following, a summary of the results is given.
The hypothesised direction of influences of product characteristics on the
performance of manual replenishment systems could be shown for most of the
product characteristics. The analysis demonstrates that products with higher prices,
larger case packs and with larger volume size will tend to be more often OOS when
ordered manually. The influence of sales variance, shelf life and speed of turnover
could be only partially proven. Furthermore, it was confirmed that products that have
higher sales variances, that are slow movers, that are expensive or that have large
case packs will tend to have higher inventory levels in the store. A major result of
these tests was to show the different reactions of automatic and manual systems on

5. Quantitative Analysis 129
different product characteristics. The data reveals for the ASR2 products a much
weaker influence of the product characteristics on the OOS and inventory
performance. None of the product variables had an influence on the OOS rate. The
inventory levels of ASR2 ordered products are only influenced by the case pack and
product size. This is a strong argument in favour of the use of automatic systems, as
their performance is much more robust.
Dependent Variables
Independent Variables
Out-of-Stock Inventory Level
+ (H1a, ASR0) part. sup. + (H1c, ASR0) sup. Sales variance
0 (H1b, ASR2) sup. 0 (H1d, ASR2) sup.
+ - + (H2a, ASR0) part. sup. - (H2c, ASR0) sup. Speed of turnover
0 (H2b, ASR2) sup. 0 (H2d, ASR2) sup.
+ (H3a, ASR0) sup. + (H3c ASR0) sup. Price
0 (H3b, ASR2) sup. 0 (H3d, ASR2) sup.
+ (H4a, ASR0) sup. + (H4c, ASR0) sup. CU/TU
0 (H4b, ASR2) sup. + (H4d, ASR2) sup.
+ (H5a, ASR0) sup. - (H5c ASR0) not sup. Product size
0 (H5b, ASR2) sup. 0 (H5d, ASR2) not sup.
+ - + (H6a, ASR0) part. sup. + (H6c, ASR0) not sup. Shelf life
0 (H6b, ASR2) part. sup. 0 (H6d, ASR2) part. sup.
"+" Positive effect; "-" Negative effect; "0" Smaller effect of ASR2 system compared to manual
system; "+ - +" quadratic relationship; sup.: supported; part. sup.: partially supported
Table 43: Results overview: product characteristics hypotheses
Five out of eight hypotheses concerning store characteristics could be fully
supported, three only partially. There is a marked difference in OOS performance
between the individual MYFOOD stores, despite their equal logistical context. Some
stores manage to have low OOS rates and at the same time low shrinkage rates.
Small backrooms might be one of the success factors for this performance, as
stressed by supporters of the lean management theory. Another success factor is
surely the store manager. To achieve good results experienced managers are
necessary that have been working in the store for a certain time. There exists strong
evidence for the fact that the right number of staff and the right number of SKUs per
m2 are also important for replenishment performance, although their influence in the
present data could not be fully proven.

130 5. Quantitative Analysis
(H7a) OOS rate differs from store to store Supported
(H7b) Inventory performance differs from store to store Partially supported
(H8) Reduction of OOS and shrinkage is at the same time possible Supported
(H9) The more SKU per m2 the more OOS Partially supported
(H10) Too many and too few staff increases OOS rate Partially supported
(H11) More experienced store managers have fewer OOSs Supported
(H12) Larger backrooms lead to more OOSs Supported
(H13) Stores with low OOS rates have higher customer satisfaction Supported
Table 44: Results: store characteristics hypotheses
Finally, the statistical analysis showed the expected results for the performance of
automatic systems. Products that are ordered through ASR3 systems show
significantly better inventory performance than ASR0 products; the automation
reduced the stocks of the ASR2 products by 6.4% while the control group increased
by 11.8%. The same holds true for ASR2 systems, after automation these products
had a 3.1 days lower inventory range of coverage, i.e. inventory could be reduced by
42% while the control group only reduced its inventory by 13%. The average ASR0
product has, with a 4.7% OOS rate, an almost 8-times higher OOS rate than ASR2
products. Yet, in this second case the improvement in inventory variance is not
significant. Last but not least, the quantitative analysis showed that a crude
automation will not lead to the desired results. The badly parameterised ASR2*
systems have a worse replenishment performance than manual systems.
(H14) ASR2 systems have lower OOS rates than ASR0 systems Supported
(H15a) Products changed from ASR0 to ASR3 systems improve their
inventory performance
Supported
(H15b) Products changed from ASR0 to ASR2 reduce inventory stocks,
however not inventory variance
Partially supported
(H15c) Products changed from ASR0 to ASR2* systems do not improve
their inventory performance
Supported
Table 45: Results: ASR hypotheses
A summary of the results of the hypotheses can be seen in Table 46.

5. Quantitative Analysis 131
Findings Method/
Significance Hypothesis Supported?
Product Characteristics
H1a ASR0: Products with high sales variance have more OOS incidents than products
with medium sales variance
ANOVA: p<.001
Part. supported
H1b ASR2: No influence of sales variance on OOS rate ANOVA post hoc Supported
H1c ASR0: Products with higher sales variance have higher inventory levels ANOVA: p<.002 Supported
H1d ASR2: Smaller influence of sales variance on inventory level ANOVA post hoc Supported
H2a ASR0: Slow-moving products have more OOS incidents ANOVA: p<.001 Part. supported
H2b ASR2: Smaller influence of speed of turnover on OOS rate ANOVA post hoc Supported
H2c ASR0: Slow turning units tend to have higher stock levels than fast movers ANOVA: p<.003 Supported
H2d ASR2: Smaller influence of speed of turnover variance on inventory level ANOVA post hoc Supported
H3a ASR0: Expensive products have more OOS incidents ANOVA: p<.02 Supported
H3b ASR2: No influence of price on OOS rate ANOVA post hoc Supported
H3c ASR0: Expensive products have higher inventory levels ANOVA: p<.001 Supported
H3d ASR2: Smaller influence of price on inventory level ANOVA post hoc Supported
H4a ASR0: Products with large CU/TU ratio have higher OOS rates ANOVA: p<.001 Supported
H4b ASR2: No influence of CU/TU ratio on OOS rate ANOVA post hoc Supported
H4c ASR0: Products with high CU/TU ratio have higher inventory levels ANOVA: p<.001 Supported
H4d ASR2: Same influence of CU/TU on inventory rate as ASR0 products ANOVA post hoc Supported
H5a ASR0: Large products have more OOS incidents ANOVA: p<.002 Supported
H5b ASR2: Product size has no influence on OOS ANOVA post hoc Supported
H5c ASR0: Medium-sized products have the lowest inventory level ANOVA: p<.005 Not supported
H5d ASR2: Large products have higher inventory levels ANOVA post hoc Not supported
H6a ASR0: Very short and very long shelf life leads to more OOS incidents Regression Part. supported
H6b ASR2: Smaller influence of shelf life on OOS, but data missing ANOVA post hoc Part. supported
H6c ASR0: Short shelf life products have higher stocks than medium shelf life products ANOVA: p=.033 Not supported
H6d ASR2: No difference between medium and high shelf life products, but data
missing
ANOVA post hoc Part. supported
Store Characteristics
H7a The OOS level and inventory performance varies strongly from store to store ANOVA: p<.001 Supported
H7b The inventory levels vary strongly from store to store, the inventory variance not ANOVA Part. supported
H8 Stores with high OOS rate have high shrinkage as well Rep ANOVA: p=.08 Supported
H9 Stores with high SKU density have higher OOS rates Regression Part. supported
H10 Stores with too little or too many employees per m2 have more OOS incidents Regression Part supported
H11 Stores with new store managers tend to have more OOS incidents Rep ANOVA: p=.053 Supported
H12 Stores with large backrooms tend to have more OOS incidents Rep ANOVA: p=.028 Supported
H13 Stores with low OOS rates tend to have more content customers Rep ANOVA: p=.023 Supported
ASR Characteristics
H14 ASR2 systems have lower OOS rates than ASR0 systems ANOVA: p<.001 Supported
H15a Products changed from ASR0 to ASR3 systems improve their inventory
performance
Rep ANOVA p<.05 Supported
H15b Products changed from ASR0 to ASR2 reduce inventory stocks, however not
inventory variance
Rep ANOVA p=.005 Part. supported
H15c Products changed from ASR0 to ASR2* systems worsen their inventory
performance
Rep ANOVA p=.011 Supported
Rep ANOVA: ANOVA with repeated measures; Part. supported: Hypothesis is partially supported
Table 46: Overview of the results of the hypotheses tested

132 6. Field Research and Managerial Implications
6. Field Research and Managerial Implications
As seen in the quantitative analysis, higher ASR systems can significantly improve
retailers' inventory performance, reduce OOS incidents, and show more constant
results. Yet it was also found that badly or crudely parameterised systems will not
deliver the desired results. As stated by the contingency theory, the context of the
company is decisive in determining the success of an automatic replenishment
system. Therefore, in order to be able to give recommendations to practitioners it is
necessary to examine in detail how retailers successfully introduced ASR systems
and in which fields they can still improve their operations. In this chapter, the case
studies of four retailers are depicted. For each company, a description of their
replenishment processes, the organizational changes and personnel issues linked to
the ASR introduction are highlighted as well as the outcome of ASR system's
introduction.
Next, recommendations for management are derived from these findings. First,
advice is given to retailers on which ASR systems they should implement, depending
on product characteristics (research question Q4). Second, a cost-benefit analysis
assesses the effect of automation. Third, practitioners learn the necessary
organizational and technical prerequisites for each ASR level; the answer to research
question Q5.
6.1. Research Sample
6.1.1. Company Selection
As Eisenhardt (1989) states, the selection of cases is a most important aspect when
carrying out field research. Given the limited number of cases which can usually be
studied, she does not promote a random selection (statistical sampling). Instead,
Eisenhardt recommends the use of cases with polar types, filling each of the
categories that are relevant for the research.88 The cases are selected to highlight
theoretical issues and to refute or challenge the theory being tested (Bansal and Roth
2000). The main companies chosen for this research project are presented in Table
47.
88
This process is called theoretical sampling by Denzin (1989).

6. Field Research and Managerial Implications 133
Retailer name and type
ASR Systems in use Experience with
system89
A: MYFOOD
Grocery retailer
ASR0: fruit and vegetables
ASR2: packaged food and non-food
ASR3: dairy products
Several years
2 years
3/4 of a year
B: GROCO
Grocery retailer
ASR0: most of items
ASR4: goal 80% of goods
Several years
Pilots
C: NORTHY
Grocery retailer
ASR2: non-food
ASR3: most packaged goods
ASR3: fruit and vegetables
Several years
3 years
3/4 of a year
D: DRUCKS
Over-the-counter chemist retailer
ASR4: most products Several years
Table 47: Selected companies for the field research
The choice of these four retailers is illustrated in the following. The first retailer
chosen was MYFOOD. The quantitative analysis in the former chapter is based on
data from this grocery retailer. The richest insights into the replenishment systems
comes from this case study. The next retailer chosen was GROCO. This retailer is
piloting ASR4 systems. These systems are rarely found in European grocery
retailing; for this reason the studying of GROCO provided a most interesting case
study. The third grocery retailer, NORTHY, is known as one of the most innovative
retailers in northern Europe. No other grocery retailer known by the author has
acquired more experience with ASR3 systems in the last few years. The company
has already adapted its logistics, operational processes and organization to best
support the automatic systems. The last case study examines the over-the-counter
chemist retailer DRUCKS. Although it is not a grocery retailer, it is the company with
the most experience with ASR4 systems known to the author. DRUCKS has a very
broad product range, selling not only pharmaceuticals, beauty and health articles but
also packaged food and near-food products (2003: 11,000 SKUs). Furthermore, the
distribution channels and delivery frequencies to DRUCKS's stores are very similar to
the other three cases. For these reasons the company is increasingly comparable to
a regular grocery retailer. The only differences one can find between DRUCKS and
other grocery retailers is the absence of very large stores (>1500 m2) and the
absence of fresh goods such as green grocery. The similarities support the trend
89
As of August 2005.

134 6. Field Research and Managerial Implications
found by Eichen and Eichen (2004) that the assortments of chemists and grocery
retailers are increasingly overlapping.
To sum it up, these companies were chosen because they represent the most
advanced ASR levels one can find at this point in time in retail, namely ASR3 and
ASR4. At the same time, the chosen retailers are still also ordering some products
through lower-sophistication levels, making thus valuable comparisons possible.
6.1.2. Market Characteristics
The four retailers come from two European regions: the Nordic countries and central
continental Europe. In terms of market share, they are among the top three in their
respective core markets. The four companies are under the influence of the same
market developments that can be observed in many western European countries.
First, the markets the sample companies are in are oligopolies; a consequence of
several consolidations of smaller retailers in the last few years. Second, as stated
before, a trend observed is the increasing overlap of the assortments between the
classic grocery retailers and chemists. The result is fiercer competition between both
retail types. The third trend observed is the power situation between the suppliers
and retailers. According to Eichen and Eichen (2004), manufacturers tend to dictate
prices and quantities, their power resulting from their branded products and category
share. However, retailers are becoming more powerful through their increasing
market share.90 The big players in the market in particular are profiting from the
consolidations that are taking place (Aalto-Setälä 2001).
6.1.3. Supply Chain Structure
The retailers MYFOOD and GROCO have both basically the same supply chain
structure. They distribute slow movers and special goods (such as frozen products,
wine) through central warehouses and regional distribution centres. Direct store
delivery (DSD) quantities are negligible.
This is different at NORTHY. DSD is used by NORTHY for many categories such as
brewery products (e.g. beer and soft drinks), fresh bread, dairy products and ice
creams. Measured in turnover, DSD accounts for about 30% of NORTHY's
distribution volume. The remaining products are transported through a main
90
This power shift opinion is shared by many researchers and practitioners, even if its quantitative verification is
somewhat difficult. See Ailawadi, Borin, et al. (1995).
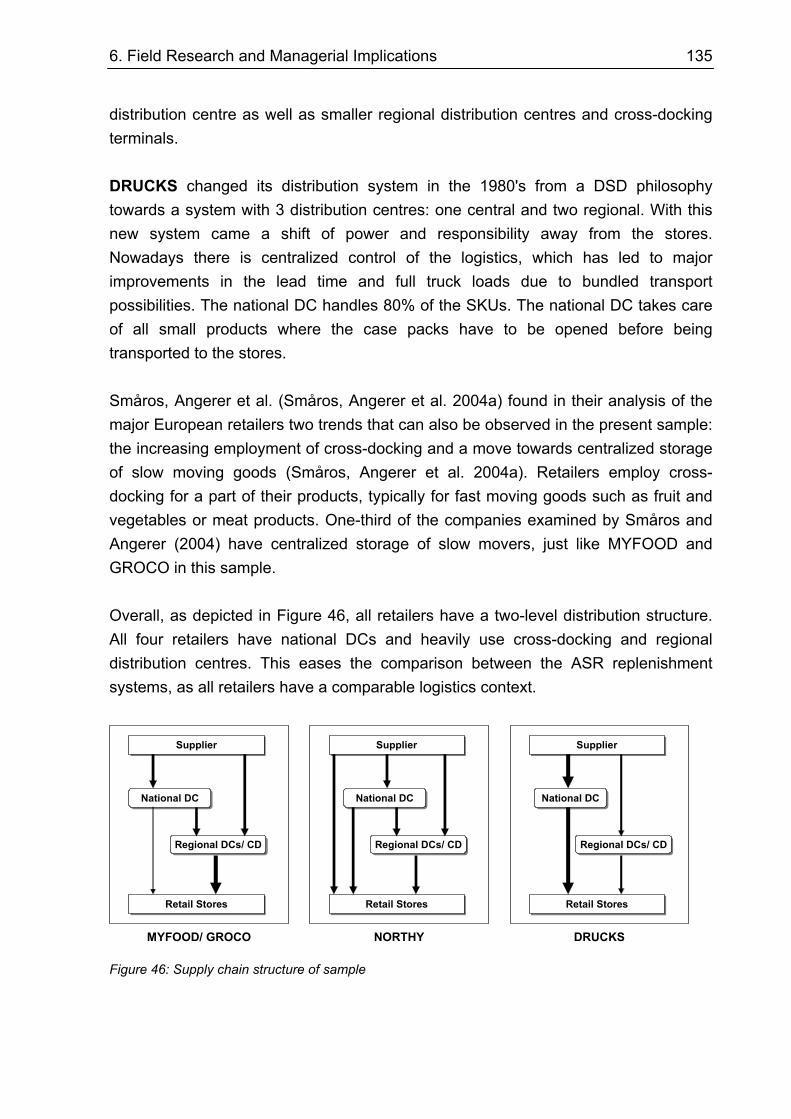
6. Field Research and Managerial Implications 135
distribution centre as well as smaller regional distribution centres and cross-docking
terminals.
DRUCKS changed its distribution system in the 1980's from a DSD philosophy
towards a system with 3 distribution centres: one central and two regional. With this
new system came a shift of power and responsibility away from the stores.
Nowadays there is centralized control of the logistics, which has led to major
improvements in the lead time and full truck loads due to bundled transport
possibilities. The national DC handles 80% of the SKUs. The national DC takes care
of all small products where the case packs have to be opened before being
transported to the stores.
Småros, Angerer et al. (Småros, Angerer et al. 2004a) found in their analysis of the
major European retailers two trends that can also be observed in the present sample:
the increasing employment of cross-docking and a move towards centralized storage
of slow moving goods (Småros, Angerer et al. 2004a). Retailers employ cross-
docking for a part of their products, typically for fast moving goods such as fruit and
vegetables or meat products. One-third of the companies examined by Småros and
Angerer (2004) have centralized storage of slow movers, just like MYFOOD and
GROCO in this sample.
Overall, as depicted in Figure 46, all retailers have a two-level distribution structure.
All four retailers have national DCs and heavily use cross-docking and regional
distribution centres. This eases the comparison between the ASR replenishment
systems, as all retailers have a comparable logistics context.
SupplierSupplier
Retail StoresRetail Stores
National DCNational DC
Regional DCs/ CDRegional DCs/ CD
SupplierSupplier
Retail StoresRetail Stores
National DCNational DC
Regional DCs/ CDRegional DCs/ CD
SupplierSupplier
Retail StoresRetail Stores
National DCNational DC
MYFOOD/ GROCO NORTHY DRUCKS
Regional DCs/ CDRegional DCs/ CD
Figure 46: Supply chain structure of sample

136 6. Field Research and Managerial Implications
6.1.4. Chains and Store Formats
Along with supermarkets, GROCO's business also includes a variety of non-food
stores such as chemists and non-food specialities. The non-food sector accounts for
a major part of its turnover. In this thesis, only the classic grocery stores are studied
that have a size between 200 and 8,000 m2 and that carry on average 10,000 SKUs.
The retailer MYFOOD has a similar format channel concept ranging from small stores
with 200 m2 up to hypermarkets with up to 9,000 m2. The MYFOOD group also owns
some non-food chains. The total assortment has a size of over 300,000 SKUs.
NORTHY has three different retail chains. The first type of stores consists of small
neighbourhood shops. The stores are between 150 and 300 m2 in size and have
assortments of about 2,000 products. The next group consists of supermarkets that
are typically relatively small, although they come in a wide range of sizes, from 400 to
1500 m2. The stores carry between 3,000 and 5,000 SKUs. The third type of stores
consists of hypermarkets located in cities with slightly trendier products than the other
supermarkets. Their size is between 4,000 and 10,000 m2 and have assortments of
about 18,000–25,000 products.
DRUCKS has several hundred store outlets in its home market in central Europe. A
typical store has about 500 m2 and carries 10,000 SKUs. The biggest stores have
around 1000 m2. In the last few years, an expansion away from its home market
towards other European countries can be observed.
6.1.5. Delivery Frequency and Order-to-Deliver Lead Times
MYFOOD and GROCO have a very frequent delivery to their stores. Both stores
have daily delivery for most of their products, i.e. six times per week. Smaller stores
on rural areas are have slightly less frequent deliveries, that is, between three and
five times a week. For some very fresh products such as bread, MYFOOD even has
several deliveries per day. The order-to-deliver time, depending on the product
category, is typically around 1–2 days.
NORTHY delivers non-foods, packaged goods, fresh goods and green grocery on
average 5 times a week. Frozen goods are brought to the stores 2 or 3 times a week
on average; larger stores receive replenishment 5 times per week.
DRUCKS has a delivery frequency of between 6 times per week to only once a week.
The replenishment frequency depends mainly on the store turnover and in second

6. Field Research and Managerial Implications 137
place on the store size. If two stores have the same turnover but one is much smaller
than the other, then the smaller store will have a more frequent replenishment
because the storage space is smaller. The entire assortment can be ordered at any
of the defined delivery days.
Delivery
Frequency
Delivery
Frequency
� 6 times a week� Rural stores:3- 5
times� Bread: twice a
day
� 6 times a week� Rural stores:3- 5
times� Bread: twice a
day
� 6 times a week� Rural areas and
small stores: 3- 5 times
� 6 times a week� Rural areas and
small stores: 3- 5 times
� Large stores: 5 times a week
� Frozen goods: 2- 5 times a week
� Large stores: 5 times a week
� Frozen goods: 2- 5 times a week
� Large stores: 6 times a week
� Very small stores: Once a week
� Large stores: 6 times a week
� Very small stores: Once a week
MYFOODMYFOOD GROCOGROCO NORTHYNORTHY DRUCKSDRUCKS
Figure 47: Delivery frequency of sample
Overall, one can see that all retailers have a very frequent delivery frequency. In
addition, all the stores experience a high delivery service quality from their
distribution centres. For the bulk of products there are typically daily deliveries,
combined with a very fast response time. The order-to-delivery lead times between
distribution centres and stores are usually between 24 and 36 hours. This result is
analogous to the findings in the study by Småros, Angerer et al. (2004a). In this
European study the average delivery lead time of fresh goods to the stores is 24
hours, with a range of 14 to 32 hours. For other goods, the median value is about 34
hours, with a range of about 15 to 48 hours. The companies studied have an order-
to-delivery lead time from manufacturers to retailers' distribution centres of typically
less than 48 hours. Many fresh and green grocery products can be even replenished
within 24 hours. Therefore, the authors conclude that the supply chain of typical
European groceries has improved significantly over the last few years and has now
reached a very high level, when compared, for example, to American retailers (c.f.
Roland Berger 2003a). The four companies in this field research are no exception to
these European trends.
6.2. Replenishment Processes
This section takes a closer look at the four modules a replenishment system consists
of: inventory visibility, forecasting, replenishment logic and ordering restrictions.91
91
For more details on these modules see section 4.1 with the descriptive model.

138 6. Field Research and Managerial Implications
6.2.1. Inventory Visibility
The importance of having extremely accurate inventory records
increases with the automation level in use. As the companies in this
thesis' sample order products with the help high ASR levels, the need for
high accuracy grows accordingly. In the following, the different processes that have
an influence on inventory visibility are described. To compute the stores' inventory
levels, the input and output product streams have to be considered. The basic idea
behind an inventory holding system is relatively simple. The inventory in the store
equals the initial stocks plus the amount delivered by suppliers minus the cash-out,
returns (e.g. wrongly delivered goods) and write offs (e.g. spoilage of fresh goods). It
is clear that it is not possible with such a system to know how many products are on
the shelf and how many in the backroom, as shelf replenishment is not monitored
separately. However, it makes a great difference for shoppers whether the products
are on the shelf or in the backroom. Figure 48 depicts the elements that have an
influence on inventory.
Backroom
inventory
Backroom
inventoryShelf
inventory
Shelf
inventory
Replenishmentfrom the
DC/supplier
Cash out/write off
Shelf replenishment
Shrinkage
Returns
Store Inventory
Figure 48: Inventory storage places and product flow processes
Inventory record books can be either administered on paper or electronically. The
four companies in the sample have for most of their products ASR2–4 systems,
therefore the use of electronic inventory management systems is mandatory. The
method for transferring information into the system is the barcode at trading unit and
SKU level. For instance, a single toothpaste SKU arrives at MYFOOD stores in case
packs of 24; each toothpaste tube and each case pack has a barcode on it. As stated
by a NORTHY logistics manager, such barcodes are "the backbone of any automatic
replenishment system."
Non-food products are an enormous challenge regarding one-to-one SKU
identification, as they tend have a huge variety. An example are apparel products; the

6. Field Research and Managerial Implications 139
same T-shirt cut can have several colours and sizes. But also in the food sector there
are some products that are difficult to track. The GROCO ASR project leaders
reported that they had considered having products from the served cheese counter
also in the inventory recording system. This idea was abandoned rather quickly as
the only way of having an exact inventory record was to weigh each product in the
evening. As the larger cheese counters might carry more than a hundred different
products, the weighing of every SKU would have been very time consuming and thus
very expensive. Consequently, GROCO still orders these products manually.92
For an automatic system to work properly, one-to-one identification is necessary.
This means that every SKU needs its own barcode number. The technology is not
the problem, there are in theory enough digits available for every SKU. Yet several of
the small suppliers often do not comply with EAN-standards93, thus making individual
identification very difficult. In all four cases, the electronic inventory record system is
an integrated part of the ERP system of the company. Therefore, in the following no
difference will be made between the inventory record system and the ERP–they are
regarded as a single entity. To transfer the inventory level-information to the system,
the goods are scanned at different points in the supply chain; every transaction in the
supply chain is registered. Ideally, this scanning should happen after leaving and
before entering any of the storage places along the SC. However, there are in
practice several deviations from this procedure. For example, there is no retailer
known to the author that tracks the movement from the backroom to the store
shelves.94 In the following, the two main flow processes in the store are considered,
the replenishment from the supplier and the check-out.
Store Replenishment
The input stream of a store consists of the goods that are delivered from a supplier.
Here lies the first possible source of inaccuracy, as a GROCO distribution centre
director points out:
"In our system the sales automatically initiate the replenishment process. If any
picking errors are made at the distribution centre, then this has a dramatic
influence on inventory records, distorting the entire replenishment system."
92
Most Spanish retailers have found another solution for this problem: they abandoned any served counters,
fresh products such as meat, cheese, etc. are nowadays only offered in pre-packed portions. 93
EAN: European Article Numbering. 94
The Metro shop of the future is piloting RFID labels and smart shelves that promise to track the inventory on the
shelf.

140 6. Field Research and Managerial Implications
Companies such as MYFOOD and GROCO have stopped internal checks on
deliveries from the DCs to the stores at the store gates. These retailers trust in the
quality of their own pickers and scanners and feel that the increase in accuracy is not
worth the cost of the physical audits. Consequently, an error that happens during
picking at the DC can no longer be detected at store level. Deliveries that arrive
directly from the supplier are still normally checked, as any delivery difference is
reclaimed and refunded. Some consultants (e.g. Arthur Andersen LLP 1997) highlight
the possibility of skipping checks for suppliers with good track records, as the
operations costs are higher than the refunds.
A logistics director from MYFOOD stressed the importance of having synchronized
the DC's deliveries to the processes at store level. In his opinion, it is not sufficient to
deliver the required quantities at the right day at the store. The exact hour and timing
of the deliveries is just as important. If all the deliveries from the different suppliers
arrive at the same time at the store, chaos would ensue. Store staff are not able to
cope with such high delivery quantities at one time. Therefore, MYFOOD, just like
many other retailers, has defined exact delivery windows for all the transports to the
store.
Check-out
MYFOOD has identified the importance of high POS data accuracy for ASR
performance. To improve the personnel's awareness of accurate scanning, the store
employees are trained intensively. A former problem was that there existed a generic
scanning number that was used at the check-out every time a product could not be
scanned. This source of inaccuracy was abolished, as it was used too frequently by
staff. To be able to introduce new ASR systems, it was necessary for MYFOOD to
install new tills. The problem was not missing functionality in the old machines but
rather that the stores did not have the same standardized systems, making a
centralized system connecting all tills impossible. The average scanning accuracy is
currently 99.4%.
GROCO's plan to improve check-out accuracy relies on a new function of their tills.
By examining individual scanning processes the retailer found out that in some stores
the repeated scanning button was unusually frequently used. The problem was that
some cashiers thought they could save the time of the shoppers by scanning fast, but
wrong. Instead of scanning five different yoghurts flavoured separately, only one
yoghurt was scanned and then the "repeat" key was pressed five times. The result
was that all these products had a wrong inventory record. To inhibit this behaviour in

6. Field Research and Managerial Implications 141
the future, GROCO's new check-out system allows configuring the tills individually for
each store and cashier so that this key can be blocked.
NORTHY, on the other hand, already had modern equipment at the time of the ASR
introduction. The challenge was in this case not the usage of a new technology but
moreover to educate the people on the importance of using the tills right. As
NORTHY receives many direct deliveries from smaller companies it frequently faces
the problem of suppliers using the wrong barcodes. Consequently, suppliers had to
be instructed on the role of exact and reliable barcodes for the functioning of the
entire system.
At DRUCKS, modern check-out systems and PCs at store level were already in use.
In theory, no process had to be changed. Nevertheless, as the accuracy of the
inventory records had to increase after the introduction of the ASR4 system, a special
emphasis was placed on check-out accuracy.
Shelf Inventory Visibility
As stated before, the most important storage space for goods, the shelf, is at the
same time the most difficult place to control the inventory levels, at least for stores
with a backroom. The quantitative results in the former chapter showed the
counter-productive effect that excess backroom space can have (see Figure 38).
Some retailers have abolished these backrooms, for example Manor in Switzerland
or Globus in Germany. For these retailers, the inventory on the shelf equals the total
inventory in the store. The four retailers in the sample still use backrooms, just like
most European grocery retailers. A precondition to measure the availability rate in a
store is to know the quantity of goods on the shelf. From the research by Småros,
Angerer et al. (2004a) it is known that most retailers do not have systems or
processes to measure whether there is at least one SKU left on the shelf. Of the 12
major European retailers in the sample, only six companies have a process for
regular shelf availability checks; four companies check availability on a daily level,
two regularly but less frequently. In addition, three companies have commissioned
one-time studies to examine their availability in selected product categories. Three
out of 12 companies do not measure on-shelf availability at all. However, on-shelf
availability and approaches for measuring it are considered extremely important
development areas by the majority of the interviewees. The four retailers in this thesis
sample have had physical audits of OOS in pilots, yet no regular control has been
implemented. Nevertheless, all four companies expressed the need for a tool that is
able to measure OOS situations automatically from the ERP systems.

142 6. Field Research and Managerial Implications
Processes to Increase Inventory Records Accuracy
There exist many factors that can make inventory records inaccurate. Among others
there are shrinkage, returns to the suppliers that are not recorded, and wrong
scanning at the check-out. The four companies in the sample check overall inventory
accuracy only during annual stock takes, as demanded by commercial law.
Consequently, it is not surprising that the interviewees had only a rough guess of
their inventory accuracy; in their opinion it lies between 97–99%. This figure is much
better than that reported in the study by Raman, DeHoratius et al. (2001b). And
indeed, a physical audit of inventory records accuracy of MYFOOD revealed a high
inaccuracy in the results. For many products, the quantities shown in the system
were different from the real physical inventory. An example of a product (baking
powder) that was manually counted during 14 days is depicted in Figure 49. As one
can see, the real inventory deviates constantly by 13 SKUs.
Inventoryrange of coverage in days
Units in store
Inventoryrange of coverage in days
Units in store
0
5
10
15
20
25
30
35
40
1 2 3 4 5 6 7 8 9 10 11 12
Inventory according to the system Real inventory in store
10
0
5
Figure 49: Comparison of inventory records and real inventory in one store
Even by counting manually the products in the store, an exact measure of inventory
accuracy is rather difficult for two reasons. First, problems occur for inventory levels
that are not updated in real time. In the case of MYFOOD, the inventories are only
calculated once a day, when the regional sales system (i.e. how many items were
sold at the store?) communicates with the nationwide logistics system (i.e. how many
items were delivered to the store?). Only during this small time window, in the early
morning before the stores are replenished, the physical inventory in the store can be
compared with the records in the IT system. The second major problem is simply the
amount of goods in a store. For instance, MYFOOD has in an average sized store
around 200 packages of a nut cookies SKU. When there are that many products of a
single SKU on the shelf, the manual counting of the products is not only
time-consuming, but also error-prone. Already Millet (1994) reports on how in some
cases manual counting can actually worsen the accuracy of the inventory records.
6. Field Research and Managerial Implications 143
Therefore, several retailers such as DRUCKS have introduced a counting process
that is exception-based: whenever an inventory record is zero or even negative,
employees receive an alert and make a counting check. A drawback of this
procedure is that some inventory inaccuracies will remain undetected. For example, if
the records show positive stock levels even though there are no goods in the store,
no alert will be given. As the ASR believes that there is still inventory left it will place
no new order. As no items can be sold, the quantity in the inventory system will never
decrease until by chance someone detects this error. A possible solution for this
dilemma is an intelligent alert system that also takes into consideration sales data (cf.
Corsten and Gruen 2004). The system compares the sales of historical articles with
previous data. If an article is not sold for a certain period at all, the employees receive
an alert.
GROCO's plan to increase inventory accuracy is called "evening-walks." At the end
of each day, employees are supposed to walk along the aisles and check for
"0–1–2–3 products." This means that the store staff look for products that have three
or fewer items left on the shelf. With this method out-of-stocks can be detected as
well as products which are in danger of becoming OOS in near future. For the
products with such a low inventory level the employees compare the quantity on the
shelves with the books and check, whether any orders have been placed. The idea
behind this procedure is that it is unproblematic to check the inventory records for
products that are almost sold out, as there are very few items to be counted. Another
advantage of this system is that in the long run, all SKUs are checked. Another
advantage of this procedure is that SKUs with a high risk of becoming OOS will also
be checked as well more frequently, as they often have near zero stock levels. Not
only are products with very low inventory levels checked, but the employees are also
asked to pay attention to products with unusually large stocks.
NORTHY has introduced a similar method, but not as structured as GROCO. The
store employees are required to check "unusual" amounts of SKUs, without
specifying what this means. This checking is not undertaken on a regular basis;
employees are asked to always keep an eye open for such anomalies.
DRUCKS's store managers are free to decide whether an inventory record accuracy
process is necessary. Central office produces a handbook which contains
recommendations on how to increase inventory accuracy. The processes described
in this operations-handbook are just suggestions and not at all compulsory. For
example, it is recommended to manually count the products that have an unusually
low sales ratio compared to the inventory records. The employees are responsible for

144 6. Field Research and Managerial Implications
finding such anomalies independently, as there are no alerts provided automatically
by the IT systems. As described above, the only exceptions are products with a zero
or negative inventory; these products are specially marked by the IT systems.
Inventory accuracy plays an important role for DRUCKS, as without any exception all
SKUs have electronic inventory records. DRUCKS demands from every one of its
suppliers an electronic dispatch advice; this is something many retailers are still
fighting for, among them NORTHY.
All the retailers interviewed stated that with the introduction of higher ASR systems
training sessions were organized to increase the awareness of check-out personnel.
The problem is to find the right balance between accurate checking and customer
service. Many customers do not understand why it is necessary to scan every article
even though they have the same price. Therefore, cashiers are also instructed on
how to behave when facing complaints from customers. The high turnover of
cashiers and the large number of part-time employees makes it difficult and costly to
train every one appropriately.
To check and correct inventory records, all the four retailers have mobile PDAs in
use. This allows employees to check directly on the shelf or in the backroom the
accuracy of the inventory records, at least roughly if there is no real time updating of
the inventory records. Store employees are also allowed to change the records. On
the one hand, this is in the opinion of most interviewees the best method for
increasing the quality of the inventory records. On the other hand, some interviewees
see the danger that this ability might be misused to influence the automatic
replenishment system. One MYFOOD logistician reported a case where the
correction of the inventory records was misused to influence the automatic ordering.
By making the system believe that there were too few articles in the store, the
employee steered indirectly the delivery quantities. By now, MYFOOD has restricted
the ability of staff to change records. For its new ASR4 ordered products GROCO
has plans to introduce a central control mechanism to prevent misuse of this feature.
Employees will still be allowed to change the inventories. But this information is
reported to headquarters, where central planners watch for anomalies.
Incentives Related to Inventory Accuracy
The wages of MYFOOD's store managers consist of a basic salary and some
additional bonuses. One of the bonuses depends on inventory accuracy. The
problem with this incentive is that inventory accuracy is only checked manually once
or twice a year due to the high level of effort required. OOS rates and inventory levels
are not part of the incentive system.

6. Field Research and Managerial Implications 145
GROCO also offers a salary incentive for the accuracy of inventory records at store
level. The maximal difference must be no higher than 0.3%. Yet, this incentive
system takes into account exceptions for special products with high shrinkage rates
such as razor blades or condoms. In a three-month test, GROCO found that only
32% of the razor blades that were delivered to the stores were sold regularly through
the check-out. The rest (68%) were stolen. Razor blades are therefore nowadays
only sold at the checkout. The biggest change concerning incentives came with the
introduction of the new ERP system. This new technology increased inventory
visibility and makes it now possible to check whether a store shows unusually high
inventory levels. In such a case, the central office would warn the store manager. At
DC level, there are monetary incentives for the accuracy of picking. According to a
GROCO logistics director, the new incentive scheme has shown excellent results.
NORTHY has adopted another approach. For this retailer it is of the utmost interest
to have a standardized assortment on its stores across the country. Consequently, it
has introduced negative incentives (i.e. punishments) for stores that do not stick to
the standardized planograms.
Finally, DRUCKS has decided not to implement any incentive system for their store
managers. The logistics director of DRUCKS stated that employees already have a
great interest in high inventory accuracy, as the stores' replenishment performance is
dependent on accurate values. This manager stated:
"Accurate records are like the foundations of a building. If the foundations are
skewed, the entire building will be skewed as well."
In his opinion, the low inaccuracy level of well below 3% (measured in the annual
stocktake) shows that no incentive system is required.
Inventory Records Accuracy and Performance
In spite of all the difficulties mentioned in this section about record accuracy, all
companies in the sample report very good results from their ASR implementation for
most of their goods. There are two possible explanations for this. On the one hand,
the ASR systems in use could be robust against inventory accuracy. The safety
stocks could have been set very generously, making the systems robust. This is an
open question that has to be solved in further research. Another explanation could be
that if at any time inaccuracy reaches a high level, the processes implemented to
detect this such as the "0–1–2–3 walk" seem to work pretty well. An exception is
NORTHY, as this retailer is rather unhappy with the performance of its ASR3 system

146 6. Field Research and Managerial Implications
with perishable goods (products with a shelf life shorter than 10 days). Further
research is required to determine if poor inventory accuracy is the underlying problem
for this.
6.2.2. Forecasts and Replenishment Logic
At MYFOOD, an ASR3 system with integrated forecasts has been
implemented for dairy products. The forecasts on store level are rather
simple, on every weekday a forecast for the next day is calculated taking into
consideration the sales of the last four same weekdays (e.g. on a Monday the last
four Tuesdays are taken into account). Any days with special events (such as
Christmas) or with promotions are skipped. If the current inventory plus the goods on
the way are lower than the estimated required quantity for the next day, an order is
placed. To be on the safe side, the quantity necessary for the second day after the
current day is also ordered (e.g. on a Monday an order is placed to have enough for
the Tuesday and the Wednesday). For packaged products and non-food SKUs, a
simple ASR2 system is in use. This means concretely that there are minimum and
maximum levels for each product's inventory that are not to be under or over scored.
These parameters are constant throughout the year. The shop is responsible for the
setting and updating of the ASR2 system parameters. An exception is non-food
articles. As there are so many SKUs in this category, it would be too time-consuming
for each store to set the parameters on item level. Therefore, the store has a
restriction on changing these parameters. Employees can only change the quantity
based on a discrete scale ranging from 1–10. Furthermore, they can only do this on a
group level, meaning, e.g., that they have to change the replenishment parameters
for all coffee machines, not only of one special SKU.95
An logistics manager interviewed expressed the opinion that it would make no sense
to have a forecasting system for packaged and non-food goods, as there is a daily
delivery service to the stores. The parameters for non-food and packaged food are
set in such a way that the stores have an inventory range of coverage of
approximately three days. This rule is not applicable to slow-moving articles as they
tend to have much longer inventory ranges of coverage. The exact inventory level
depends on the size of the trading unit and the shelf space. MYFOOD tries to set the
parameters in such a way that an entire case pack can be put directly on the shelf to
avoid inventory in the backroom. Still, there are situations where this procedure does
not work due to the formula that is used for the replenishment. The parameters used
95
This system was called ASR2* in chapter 5, where the performance of such systems was examined.
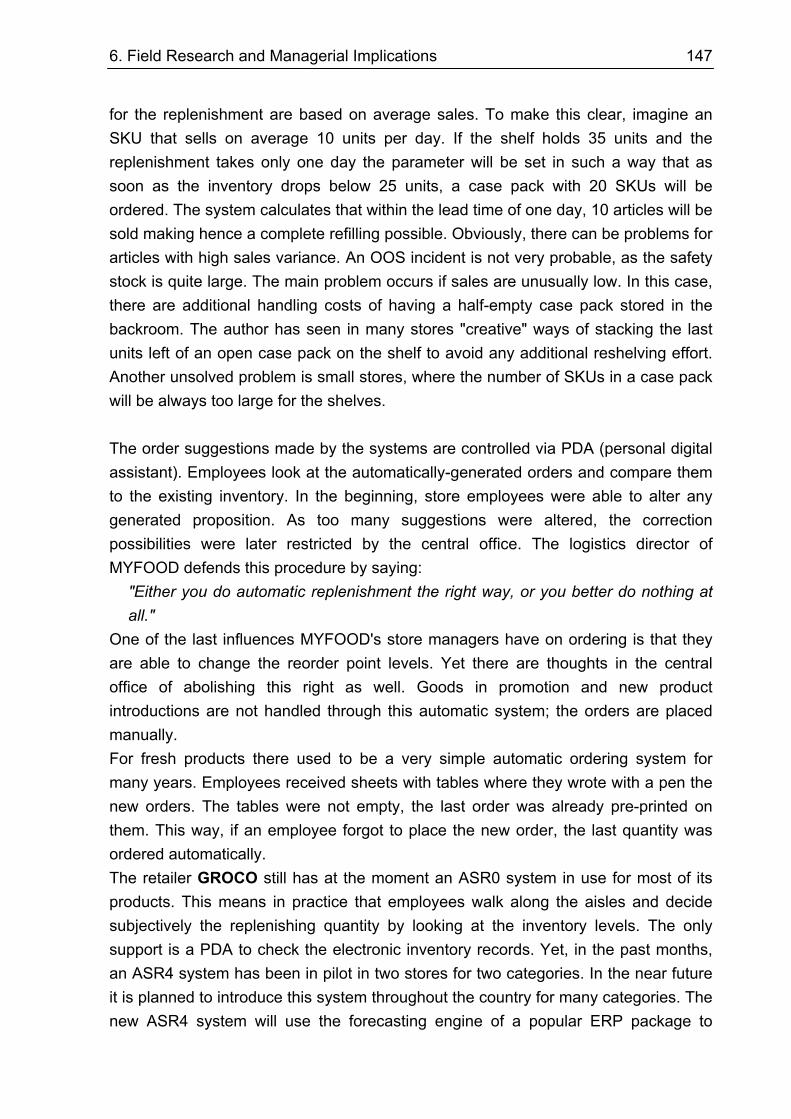
6. Field Research and Managerial Implications 147
for the replenishment are based on average sales. To make this clear, imagine an
SKU that sells on average 10 units per day. If the shelf holds 35 units and the
replenishment takes only one day the parameter will be set in such a way that as
soon as the inventory drops below 25 units, a case pack with 20 SKUs will be
ordered. The system calculates that within the lead time of one day, 10 articles will be
sold making hence a complete refilling possible. Obviously, there can be problems for
articles with high sales variance. An OOS incident is not very probable, as the safety
stock is quite large. The main problem occurs if sales are unusually low. In this case,
there are additional handling costs of having a half-empty case pack stored in the
backroom. The author has seen in many stores "creative" ways of stacking the last
units left of an open case pack on the shelf to avoid any additional reshelving effort.
Another unsolved problem is small stores, where the number of SKUs in a case pack
will be always too large for the shelves.
The order suggestions made by the systems are controlled via PDA (personal digital
assistant). Employees look at the automatically-generated orders and compare them
to the existing inventory. In the beginning, store employees were able to alter any
generated proposition. As too many suggestions were altered, the correction
possibilities were later restricted by the central office. The logistics director of
MYFOOD defends this procedure by saying:
"Either you do automatic replenishment the right way, or you better do nothing at
all."
One of the last influences MYFOOD's store managers have on ordering is that they
are able to change the reorder point levels. Yet there are thoughts in the central
office of abolishing this right as well. Goods in promotion and new product
introductions are not handled through this automatic system; the orders are placed
manually.
For fresh products there used to be a very simple automatic ordering system for
many years. Employees received sheets with tables where they wrote with a pen the
new orders. The tables were not empty, the last order was already pre-printed on
them. This way, if an employee forgot to place the new order, the last quantity was
ordered automatically.
The retailer GROCO still has at the moment an ASR0 system in use for most of its
products. This means in practice that employees walk along the aisles and decide
subjectively the replenishing quantity by looking at the inventory levels. The only
support is a PDA to check the electronic inventory records. Yet, in the past months,
an ASR4 system has been in pilot in two stores for two categories. In the near future
it is planned to introduce this system throughout the country for many categories. The
new ASR4 system will use the forecasting engine of a popular ERP package to

148 6. Field Research and Managerial Implications
compute the forecasts. For each article in each individual store, a separate forecast
is calculated based on the sales data of the last 2 years. Any promotions in that time
are ignored in order to avoid biasing the result. For the employees at the stores, as
well as for the employees in the central office, the forecast is a "black box" as they do
not know the exact algorithms behind it. The retailer's central office feeds the system
with so-called events to make the forecast more precise. The variables that are used
at the moment to improve the causal forecasts are calendar events, opening times,
holidays, regional festivals and actions of the competition. The interviewed ASR
project member said that he is thinking of implementing weather data and
substitution-products in the future as well. Every day, the forecast is calculated for
each day of the following four weeks. For new products without sales history,
comparable products are taken as the basis of the calculation. The results of the
forecasting are two groups of order suggestions. In the one group there are the SKUs
where the software has a high confidence on the results. In the second group, the
software has some doubts about its own calculations and requests the manager to
check the results for plausibility. Approximately 5% of all computed orders are
classified as insecure. The system classifies products into the insecure cluster if the
inventory levels are negative, the order size calculated has an unusual size, or if it is
an article that is required to be counted in the formerly described "evening walks."
The software has up to 650 predefined reasons that can raise an alert. This is a
theoretical number, only a small proportion of them are practically implemented. The
store manager sees only about 5–10 exceptions, the central headquarters slightly
more. For example, if an article does not sell at all in a day, this is reported directly to
the replenishment group in the central office. The planners there have to decide if
any action is required and thus whether the store manager has to be informed.
Independently from this alert system, the store manager still has complete rights to
change any order suggested by the ASR system.
NORTHY's ASR3 system has a very simple forecasting algorithm. It uses exponential
smoothing to create the forecast for the next weekday. The exponential parameter is
the same for all products and with a value of 0.2 rather low. Such a low value means
that more weight is put on the sales history than on recent sales. Therefore, unusual
sales influence the forecast only slightly. NORTHY has experimented with several
other values and found this one to be the most appropriate. The retailer's actual
forecasting method does not take seasonality effects, promotions or holidays into
account. It is hence one-dimensional in the classification terms of section 4.1.4. The
parameters are fixed for the whole year. Nevertheless, sometimes the central
planners change the parameters for entire product groups when they expect high
demand changes. The overall accuracy of the forecasting is rather low, but as stated

6. Field Research and Managerial Implications 149
by a logistics manager, a better forecast is not necessary for their company. The
interviewee shares the opinion of MYFOOD managers: when the replenishment
supply chain is fast and responsive then high forecast accuracy is not necessary. A
view that is shared by many retailers and researchers (cf. Alicke 2003; Småros,
Angerer et al. 2004b). Some of the articles are ordered through ASR2 systems and
thus no forecasts at all are required. Six parameters are necessary to make the
ASR3 system work: sales data, lead time, safety parameters, shelf space, minimum
shelf space and CU/TU ratio.96 The sales data is collected for each store, product
and day. Based on these numbers, the inventory position is calculated and together
with the lead time the schedule for the next order is determined. The system requires
manual information about how big the safety stocks should be. For each SKU there
exists one safety stock parameter (in days) that is the same across all stores. Yet,
sometimes the safety parameters are determined at category level. The next required
parameter for the logic is shelf space. Shelf space is not determined for each store,
moreover there exist six predefined assortment types depending on store size. For
each one of these assortment types the shelf space is strictly defined as well as a
minimum shelf filling parameter. The last parameter is a percentage value of the total
shelf space and defines a minimum shelf stock amount that should never be reached;
otherwise, the shelf would look too empty and thus would deter sales. Finally, the
CU/TU ratio plays an important role; this parameter is mostly set by the supplier. It is
worth noticing that if any of these parameters changes by more than 30% (e.g. when
the case pack becomes bigger or an SKU sells less than 70% of the average
quantity) an alert appears and the order has to be checked manually. For special
occasions with increased demand (e.g. Christmas or sports events), employees are
requested to place additional manual orders.
DRUCKS's ASR4 systems use a forecasting engine that was programmed by the
same company as the one from GROCO. As described before, the forecast is made
for each product in each store on the basis of the sales of the last two years.
DRUCKS has an every-day-low-price policy, therefore promotions do not have to be
omitted from this database. Overall, there are about 50 parameters and event types
that can be implemented in theory to improve the forecast. Replenishment is
calculated taking into account a minimum level at each store (for aesthetic reasons),
a desired availability level, seasonal effects, public holidays, new stores opened by
the competition and price changes. There are six different classes of forecasting
algorithms, while the slow moving products receive a very basic forecast, the fast
moving products receive the most attention and have forecasts where the entire
96
See also section 4.1 for a description of the elements of an ASR system.

150 6. Field Research and Managerial Implications
bandwidth of events is taken into account. The classification of an SKU to a certain
forecast type is fixed for all the stores, even if in a store a product is sold more often
than in another one. The forecast for a single product requires only milliseconds and
is created by a PC in the store. This way, the forecast for all the 10,000 SKU's in a
typical outlet is finished within a few minutes. Overall, the forecasting quality of the
system is described by the DRUCKS logistics director as fantastic, yet there are no
KPIs in place assessing its quality. The interviewees could not name any regular
product where a manual forecast would be better than the ones calculated by PC.
Only for articles that are listed for the very first time, a manual ordering and
forecasting is made until the system has enough data to make a reliable forecast. As
with GROCO, the system automatically detects products where the forecast is
insecure and asks the personnel for a manual counter-check. The system displays
the reason for the alert, such as a zero stock level. About 5–10% of all articles are
counter-checked every day. The final replenishment decision is still in the
responsibility of the store manager. He or she can change any order at any time. It is
thus possible to fill an article with zeros to delist a product without the approval of the
central office.
Småros, Angerer et al. (2004a) found in their research that the majority of the
observed European grocery retailers have sophisticated forecasting capabilities only
at central warehouse level. At this level, forecasts are made from the aggregated
stores demand in order to place the orders to the supplier. Yet, the trend found in the
four retailers examined in this thesis is that more and more complex forecasts are
also made at store level. Retailers decide from category to category whether it is
worth investing in better forecasts or not. It is not always clear whether the decision
that lead to the choice of a certain ASR level was based purely on objective
reasoning. For some categories the choice is obvious. For example, for very fresh
products (e.g. bakery products) no forecasts are computed as there are not even
electronic inventory records available. For other categories the "importance" of the
product for the success of the retailer is the driver behind the choice of a higher ASR
category. MYFOOD, for example, has introduced ASR3 systems for dairy products
and in the future will do so also for green grocery, as this category is in their opinion
crucial to customer satisfaction. The GROCO ASR project leader estimates that it
makes economic sense for a typical retailer to have around 80% of all products
replenished with complex ASR4 systems, while 20% of the goods are better served
with manual replenishment. In section 6.5.1 a systematic look at the appropriateness
of a product category for a certain ASR level is made.

6. Field Research and Managerial Implications 151
6.2.3. Order Restrictions
The most common restriction taken into account is the case pack size
restriction (CU/TU ratio). In all the observed companies the system
orders only multiples of the TU size. A second restriction has been
implemented by MYFOOD and takes into consideration the shelf size. As described
before, the ASR system is parameterised to place the order in such way that the case
pack units fit completely into the shelf. The aim of this restriction is to reduce the
number of items stored in the backroom. No other restrictions were observed.
NORTHY, for example, does not have a minimum order quantity, ensuring that
minimal orders are not placed with its suppliers. In the past, this has led to goods
being delivered in near-empty trucks, making deliveries very costly. But this is an
exceptional case; there are no plans to implement additional restrictions as it would
be too costly compared to the potential benefits. In addition, NORTHY has set aside
the idea of having maximum order caps, as all stores have a backroom in which to
store excess deliveries. Neither GROCO nor DRUCKS see the necessity of
introducing any additional restrictions at store level. An optimization of the logistics,
e.g. by introducing order caps to ensure full truck loads, is not an option at the
moment.
6.3. Organizational Changes and Personnel Issues
The implementation of ASR systems is often a small part of major ERP system
introduction. The change of ERP systems has been in turn seen as an opportunity to
centralize and homogenize IT systems. In some cases, the entire logistics system
had to be changed. The first part of this section describes how the retailers in the
sample changed their organization. As one will see in the following, the organization
in the four cases has become more centralized. In addition, there are insights as to
how the ramp up phase of the new systems was realized. In the second part changes
in the processes that influence the way employees work are illustrated. The retailers
approach differently the question of how great an influence employees should have
on automatically generated orders.
6.3.1. Structural Changes and Setup
MYFOOD and GROCO were some years ago very decentralized companies. Their
regional organization units had extensive decision freedoms. The main problem with
this organization structure was that several IT systems existed without compatibility
among them. It was therefore not possible to interchange information and cooperate
with other sub-organizations. The result was the loss of economies of scale and
scope. MYFOOD hence decided to start a centralization programme. As the basic

152 6. Field Research and Managerial Implications
independence of the subdivisions should remain, the programme was limited in
scope. Nevertheless, a fundamental change took place in both logistics and
marketing. The first step was to introduce centralized logistics for slow moving goods.
In order to do so, a new central DC was built and a central logistics services group
was created that works as a separate profit centre. Delivery frequency for some of
the small stores was reduced, as automatic systems need fewer deliveries to achieve
the same service level compared to manual ordering. Next, the logistics as well as
the IT infrastructure were adapted. In order to maintain good service for its
customers–the regional units–the central unit had to harmonise the regional IT
infrastructures. Another goal of the new central unit was to maintain the master data
of all SKUs up to date. Within this major project that changed IT and distribution
strategy, the implementation of an advanced replenishment system at DC level was
also realized. As a second step, MYFOOD began to introduce advanced ASR
systems at store level as well. This top-down procedure is in contrast to the strategy
of GROCO, which is implementing its ASR systems at store level before changing
and centralizing its national distribution systems. For the manager in charge
interviewed at MYFOOD, this is the logical way to introduce an ASR system, but
because of the strong influence of the individual regional sub-divisions, it was not
possible for MYFOOD work in this way.
GROCO will have an even more radical change to its structure. The interviewed ASR
project members stressed that the introduction of the new IT systems together with
centralization will have an effect on almost everyone in the company. Eighty per cent
of employees will experience a substantial change in the way they work and, for this
reason, they will require training. In regard to the ASR system itself, a new
organization has been created. There will be ASR-dedicated planners in charge at
national level as well as regional planners. The exact distribution of tasks between
the two organization types still has to be decided. The ASR-planners will be
responsible for the setting and updating the parameters in the stores. They also will
check the computer-generated orders made by store employees and will decide
whether they are appropriate. Further, they will decide which products can be
ordered automatically and which not. They will be responsible for most of the
exceptions alerts created by the systems.
For NORTHY's ASR2 and ASR3 systems, the organizational change was not so
significant. In the stores no change in the number of employees was required. And at
head office, there was only a shift of responsibilities between existing positions, no
new function had to be created or personnel lost. The initial setup of the millions of
parameters was a rather simple project, as most of the values could be taken from

6. Field Research and Managerial Implications 153
the existing systems, minimizing manual input. NORTHY had previously been
organized on strict centralized lines; most of the information was available at the
central office. Unlike MYFOOD and GROCO, the planograms were strictly followed
by the stores. Before the nationwide implementation of ASR3, different parameters
were tested in a number of stores. Also, comparable to the case of MYFOOD, the
product categories were automated one by one.
The DRUCKS case was similar, in that the implementation of ASR systems required
only minor changes because a central organizational structure was already in place.
The logistics did not experience any change, and the distribution channels and
replenishment frequency remained the same. Neither was it necessary to make any
changes to the existing technology. The same handhelds that were used before at
the shelf to place orders are now used to check inventory levels. The same holds true
for the tills and the utilized barcodes. The only process that was adapted was the one
regarding inventory records accuracy. A new KPI was introduced to check the
number of automatically generated orders that are accepted by the store managers:
the value is around 95%. The very first time the ASR system was tested, a pilot store
was chosen and a single category was automated. Then, each category was
implemented one after the other until all the goods (around 10,000 SKUs) were
ordered via the new system. Now, a new store gets a standard parameter set. This
parameter set is copied from a store with a similar size and sales volume. The effort
for this setup is very low, after 2–3 hours the parameters for the new store are
implemented. For every new store a set of performance goals is elaborated. In the
following months, store turnover and other KPIs are compared to the planned figures;
if there is a strong misfit the replenishment parameters are adapted.
6.3.2. Personnel and Change Management
Maybe the most radical change resulting from the implementation of higher ASR
systems is the change in organization and the role of employees. The change in
human agency is most visible in the standard manual ordering process. The main
intellectual task of an employee whose store orders manually is to take into account
many information sources at the same time. When determining the new
replenishment quantity at the shelves, employees have to take into consideration the
inventory levels in the backroom, how many goods are on the way to the shop, and
they have to estimate the demand for the next days. Furthermore, before creating the
final order the store staff has to take into account the lead time and other restrictions
such as shelf space or minimum order quantities. This task requires a lot of
experience so that only employees working for a long time for a certain retailer

154 6. Field Research and Managerial Implications
achieve good replenishment results.97 With the new ASR systems, all this information
is stored in a computer, and the main task is now to keep the records accurate.
Therefore, day-to-day operations change radically, and new intellectual challenges
arise.
For an IT director at MYFOOD, the change from an ASR0 system to an ASR3 system
for fresh food products meant a radical change in the philosophy of the store staff:
"We have changed our philosophy from an 'order culture' to an 'inventory
management culture'. In seminars we tell our store staff how important it now is to
keep the inventory records accurate. We tell them 20 times a day until they cannot
hear it any more."
The new ASR system relieves employees of the ordering procedure. During training,
people are told to invest this freed-up time and energy in updating the inventory
records. For ASR2 systems, there is still the intellectual task of determining the right
replenishment parameters. The right setting of the order point decides whether it is
possible to place the complete TU on the shelf and has thus a major influence on the
effort required for reshelving. Another task that still requires intellectual effort is the
case of exceptional demand and upcoming holidays. MYFOOD's employees are able
to alter the suggestions for these cases, meaning that skilled labour is still required.
The same holds true for promotions and new product introductions.
The first main change for the employees connected with the installation of ASR
systems was the introduction of computers and PDAs. A couple of years ago, all the
orders were made on pieces of paper. Nowadays the use of computers is compulsory
for every employee, as the inventory records have to be updated electronically, the
automatic orders checked, and exceptional orders have to be placed. Consequently,
MYFOOD's employees first receive basic training on the use of computers. They
learn how to use a mouse and the basic functions of the operating system
(Windows). The next step is to get acquainted with the ERP programme as this
software is used for all the orders. This first steps are often the hardest, as many
employees have been working for many years without using any IT at all. According
to one IT manager, one of the goals of personnel training is to promote personal
responsibility. Consequently, voluntary e-learning programmes were offered to
employees. As an additional incentive, the employees receive a voucher worth 500
euro for an adult education centre where additional computer courses can be taken.
97
See the analysis of the influence of the time a store manager has been in a store on the OOS rate on Figure
37.

6. Field Research and Managerial Implications 155
The company does not control what courses the vouchers are spent on as this would
not be part of its company philosophy, and employees could spend the vouchers on
language courses instead. The interviewed MYFOOD ASR expert estimates that
about five years are required for the introduction of such systems into all stores. The
employees need around 2–3 years until their mind-set has completely adapted to the
new philosophy.
The ASR project leader at GROCO stresses the importance of the human factor for
the success of an ASR project:
"80% of our [ASR4] project concerns the human factor."
As for the previous retailer, the human factor is considered to be one of the main
reasons for the length of such projects. According to the responsible ASR manager, it
takes up to 5 years until such a system can be used nationwide. The store staff
needs a significant part of this time to get used to new system. It was stressed by the
interviewees that the role of store employees as entrepreneurs should remain in the
new system. Therefore, store managers will be allowed to override orders made by
the ASR4 system. Yet, new KPIs will be introduced to check the amount of altered
suggestions. Another education activity will be targeted at the employees in the new
central replenishment organization. They require special training, as these jobs are
created from the scratch. Finally, the interviewed managers also stressed the
importance of superior management support, as such a fundamental change creates
much uproar in the organization.
The managers interviewed at NORTHY's confirmed the dramatic changes in the role
of store staff described before. Almost every process they were used to changed due
to the implementation of the ASR systems. The loss of the right to order and the
focus on inventory records accuracy brought the biggest changes. With this retailer,
store employees face the strongest limitation of the influence on the automatic
generated order in the sample. It is not possible for NORTHY's store employees to
cancel an order. The suggestion cannot be reduced, but it is possible to order
additional quantities. These strong limitations were partially the consequence of
misuse of the systems. There were cases where the staff tried to influence the
system indirectly. For example, inventory level records on the computer were
changed to show incredibly high levels to make the system stop deliveries of
undesired products. However, this problem was an exception; one year after the
introduction of ASR systems the new processes and rules became standard. This
can be partly attributed to the comprehensive educational courses the store
managers received. They were afterwards responsible for teaching their employees
the new processes. At head office, less than six logisticians are responsible for the

156 6. Field Research and Managerial Implications
ASR systems in all stores. Such a small number of planners is only possible because
the product managers are in charge of updating the parameters of the ASR systems
in each store. This way, the central planners can concentrate on exceptions.
The DRUCKS interviewee confirmed the radical change for the staff, as suddenly
inventory management became the major task. But the introduction was not as
problematic as with the other retailers because DRUCKS' personnel already had
experience with computers in the stores. Neither the check-out process nor goods
reception had to be adapted. The ordering procedure is basically the same, as the
same PDAs still are used to confirm the order suggestions made by the ASR system.
The regional managers were convinced of the automatic replenishment by showing
them the successful results of the store pilots. The main argument in favour of ASR
systems was that the time savings realized by the store personnel could be used to
increase service to the customer. One of the major strategies of DRUCKS was the
communication strategy. The words "automatic ordering" were never used, instead
the management spoke of "PC-supported ordering." The word "automatic" was
avoided to never give the employees the feeling that their work could be replaced by
a computer.
Overall, all the interviewees agree on the importance of dispelling the main concerns
of employees. The first concern is that the ASR system will result in logistical chaos.
This fear can be overcome by having successful pilots. Second, many employees
expressed the fear that jobs could be cut due to the automation. The four companies
stress that nobody lost his job due to the automation. This is not always the case, as
the example of the retailer Globus in Germany shows. After an ASR introduction at
DC level this retailer made several employees occupied full time with ordering tasks
redundant (Shalla 2005). And third, employees face with automation the loss of a
fundamental part of their current work. Being relieved of the ordering task is not
always seen as something positive, as one logistics director points up:
"It is more fun to buy then to sell."98
The satisfaction of employees can dramatically suffer with the introduction of ASR
systems. One controversial topic is what intervention rights the personnel should
have as regards the IT-calculated replenishment orders. DRUCKS and GROCO
stress the importance of still having entrepreneurs in the stores making their own
decisions, and so store managers are able to ignore the computer-generated
98
Source: Dr. Michael Krings, director Logistics Douglas GmbH, 24.6.2005.
6. Field Research and Managerial Implications 157
suggestions completely. This is the opposite of MYFOOD's and NORTHY's policy in
that both retailers have limited the influence of their store employees.
6.4. ASR Performance
One of the most interesting questions for practitioners is the question about the
performance of the systems. As seen in the quantitative analysis, it is at the same
time one of the most difficult questions to answer. The introduction of ASR systems
often goes hand-in-hand with a change of the distribution channels or the introduction
of a new ERP system. Consequently, very few retailers are able to quantify the
overall effect. In this section, first a hypothesis derived from the contingency theory
concerning performance measurement is verified. Later, the benefits of ASR
implementations on stock levels, OOS incidents and other effects for the four retailers
will be depicted.
6.4.1. Performance Measurement
One of the assumptions made in the contingency theory section 3.4.2 was that the
more sophisticated the system, the more performance measure variables would be in
use by the company. This statement can only be partly supported. In favour of this
theory is the fact that with new ASR systems new KPIs were introduced. An example
is the rate of computer-generated orders that were accepted by store employees.
Another example is GROCO: this retailer now checks the inventory levels of its stores
through a new KPI, something that was not possible before ASR introduction. On the
other hand, the two retailers with the most advanced systems (DRUCKS and
GROCO) do not measure any special logistics KPIs such as the MAPE or the
inventory accuracy that are not in use by the other two companies. Therefore, it is
difficult to support or decline this hypothesis.
6.4.2. Inventory Level Performance
When asked about inventory levels at the distribution centres, the interviewees in the
sample were quite content with their stock levels. The retailers are still trying to
reduce their inventory levels, but they do not expect any radical improvement in the
near future. The picture changes radically when the interviewees are asked about
inventory quantities in the stores. The interviewed retailers stated that a high
proportion of the goods in the supply chain they control used to be located at the
stores. These findings concur with the situation described in the study by Småros,

158 6. Field Research and Managerial Implications
Angerer et al. (2004a). Their average inventory levels of 12 major European grocery
retailers are depicted in Table 48.
Distribution centre Store Inventory
Fresh Other Overall (incl. fresh and other goods)
Median 2 days 13 days 12 days
Minimum 0 days* 7 days 4 days
Maximum 10 days 20 days 16 days
*These goods are cross-docked
Table 48: Inventory range of coverage of European grocery retailers in days99
The retailer NORTHY is very satisfied with the development of its inventory levels
after the ASR introduction. As a logistics manager said, the inventory level could be
"considerably" reduced. The same statement comes from the retailers MYFOOD and
GROCO. Concrete numbers could not be delivered by the interviewees. Yet, in
GROCO's pilot the stock reductions were in part so strong that the central planners
had to intervene and artificially raise the parameters. Too low stock levels are, from
an aesthetic point of view, not desirable. One of the categories profiting most from
the ASR systems are very fresh products, as the mean remaining shelf life of these
products could be increased. Only DRUCKS is able to report a concrete figure. With
an ASR4 introduction, this retailer has reduced its store stocks by about 10–20%.
The quantitative analysis of this thesis shows, that a reduction of this magnitude is
also possible for grocery retailers.
6.4.3. OOS Reduction and Overall Performance
MYFOOD is very pleased with the results from the ASR2 and ASR3 system
implementations. The logistics managers report a reduction in OOS incidents, without
been able to quantify it. Another benefit is that the time necessary for the daily orders
could be reduced dramatically. A positive side-effect of the pull system is that the
orders from the stores to the DCs are now more stable and thus more predictable.
One of the highest financial impacts might have a last effect: the delivery frequency
of some small stores could be reduced to three times a week. All these positive
results have encouraged MYFOOD to introduce higher ASR systems for almost all
categories across the country.
99
Source: Småros, Angerer et al. (2004a).

6. Field Research and Managerial Implications 159
The results of GROCO's ASR4 pilot are rated very positive by the ASR project
members. The first benefit is again the time savings from the lost ordering procedure.
The savings depend very strongly on the size of the store, for larger stores up to four
working hours are saved, while the smallest stores only experience a reduction of
half an hour. As in the previous case, the overall distribution system profited, as the
DCs experience nowadays less variance in the stores' orders. Overall, GROCO is
very pleased with the new ERP system, as the IT creates a transparency that is a
requisite for any further improvement of the supply chain. For example, it is now for
the first time possible to calculate the impact of a reduction of stores replenishment
frequencies, as the ERP systems have created a new visibility level. This would in
turn lead to greater cost savings. Another positive effect is described by one logistics
manager:
"After the introduction of the ASR and ERP system, our eyes were opened. For
example, it was thought before the introduction that the shrinkage values in the
distribution centres were minimal. Now, every little transaction is recorded
minutely. This has created a new awareness about what logistics really costs. It is
just amazing, how much information can be drawn out of these systems."
The retailer NORTHY is very satisfied with the performance of its systems, as in
addition to a reduction in inventory levels, the OOS rate could be dropped as well.
Furthermore, the time spent by store employees in placing orders was dramatically
reduced. The new spare time is used for a better control of inventory records and to
provide greater service to the customers. In addition, the part-time contract with some
employees has been reduced. Yet, an interviewed logistics manager stressed that
after the implementation nobody was forced to quit the job. Another side benefit was
that with the new system NORTHY's stores tend to stick more to the planograms and
assortment decisions made by central office. The new IT systems improved the
control of the stores due to increased inventory visibility. Consequently, new KPIs
and mechanisms to control and measure the flow of products are in pilot, for
example, a system that detects OOS incidents by analysing sales data. This system
produces at the moment very crude estimations and is not currently working for
slow-movers. More side benefits are expected from new electronically available
information that is obtainable now for the first time. Based on this data, the next
project will be to improve the amount of shelf space allocated to each SKU. As
product managers are now responsible for the parameters and hence in closer
contact with each store, they are now able to determine the shelf space based on
facts. As successful as the implementation of ASR ordering was for packaged goods,
the results from the automation of perishable goods are still not satisfactory. The
employees are rather unhappy with the system, and this is most probably not going

160 6. Field Research and Managerial Implications
to change in the near future. Therefore, the management is thinking about returning
to the old manual system. A possible reason for this underperformance might be the
direct deliveries to the stores. Fruit and vegetables are delivered mostly by small
suppliers, and this group is known to have major problems fulfilling EAN barcodes
standards.
For DRUCKS, the reduction of costs was in the opinion of the interviewee only a
secondary reason for the introduction of the new ASR system. The main goal was to
increase availability in the stores and to increase service to customers. The OOS rate
was reduced by 70–80% and is now between 1 and 1.5%. An average store had to
spend between 3 and 5 hours to make an order of the complete assortment.
Sometimes to reduce complexity, on certain days only part of the assortment was
ordered to save time. The consequences were higher than necessary inventory
levels. Today, only between 15 and 30 minutes is necessary for the ordering of the
entire assortment. The time saved can now be used to increase inventory accuracy
or, more importantly, to deliver better service to the customers. With the newer
systems it is possible to have more SKUs per store, increasing thus the productivity
of each sales m2. Also, logistics has profited, as the orders to the DS have become
predictable.
6.5. Lessons Learned and Recommendations for Management
There can be no doubt that the automation of store replenishment is on the agenda
of today's retailers. Four of the five biggest grocery retailers in Switzerland have
implemented or at least piloted ASR systems. In a survey conducted in 2004 with
more than 30 Swiss, German and Austrian retailers, around two thirds already had or
were at least thinking about implementing higher ASR systems.100 The main reason
why retailers had not yet started with the implementation was that a certain level of
technology is necessary before the automation can start. For example, it does not
make sense to have sophisticated ordering algorithms if the retailer has not even
introduced a barcode system. In the following, the results from the quantitative and
the qualitative analysis are merged. First, the adequate ASR level depending on the
product and retailer's context is determined. Next, methods for successful ASR
introduction are presented. The technical and organizational requirements are also
discussed as best-practice store operations. This section ends with a cost-benefit
analysis.
100
These short telephone interviews were conducted in summer 2004 by the author and involved retailers in the
sectors electronics, apparel, grocery, jewellery and drugs.

6. Field Research and Managerial Implications 161
6.5.1. The Adequate Automation Level: Recommendations
This thesis does not claim that every retailer should have the highest level of
automation that exists. One of the aims of the thesis is to create a guide aiding
retailers to decide for each product category the level of automation best suited to
them (question Q4). The combination of the information gathered from the interviews
and the quantitative analysis is shown in Figure 50. With such a decision tree, each
retailer is able to find the adequate ASR system for each product category. As stated
before, a company might opt to choose the best suited ASR level for each product
category so that it may ultimately decide to run different systems in parallel, as seen
with the examined retailers.
Which System to Choose for a Product Category?Which System to Choose for a Product Category?
Is electronic
inventory possible?
Is electronic
inventory possible?
Manualordering
Manualordering
Electronic inventory-based ordering
Electronic inventory-based ordering
Simpleordering heuristics
Simpleordering heuristics
Time series-basedforecasts
Time series-basedforecasts
Causal model-based forecasts
Causal model-based forecasts
Can
causal influences be
quantified?
Can
causal influences be
quantified?
Is quantitative
forecast better than
qualitative?
Is quantitative
forecast better than
qualitative?
Stable demand,
low value?
Stable demand,
low value?
yes
no
yes
no
no
ASR1ASR0 ASR2 ASR3 ASR4
yes
no
yes
Ultra fresh (bakery, cheese counter)
Fashion;Slow moving, high value items(jewellery)
Low value items(clothes pegs)
Non-food(shoe-cream)Dairy products(milk)
DrinksBarbecueFlowers
Figure 50: Decision tree for practitioners
In the following, the logic behind this decision tree is explained. The first node on the
ASR level decision tree tests the basic possibility of having electronic inventory
records for the product. Electronic inventory management is the basis of any
automatic replenishment system, and so at this point SKUs that have to be ordered
manually (ASR0) are separated from the others. For some products, electronic

162 6. Field Research and Managerial Implications
inventory management is not possible or economically feasible. The case of
GROCO's served cheese counter discussed previously is an example of such
problematic SKUs, and this retailer has decided to keep this part of the product
assortment in the manual ordering scheme.
The second node in the tree separates the products for which a forecast is sensible
from those where it is not possible to make any forecast or where it does not make
economic sense. An example for products where forecasts are nearly impossible is
apparel products with a strong fashion influence. These products tend to have such
unpredictable sales behaviour that any system would have difficulties predicting their
sales from historical data. As every season new products appear or are trendy, there
it is often no comparable data because the products are too different from each other.
Other products where forecasts are not possible are unique SKUs that are only
ordered once (e.g. in the case of promotions or special events). For the products
where forecasting is not recommendable, retailers can choose between a semi-
manual (ASR1) and an automatic replenishment system with simple heuristics
(ASR2). There are three reasons for choosing the manual method instead of the
heuristics found in practice. First, some companies have very expensive products
and a small assortment. An example for such retailers is a jeweller. The speed of
turnover of such luxury goods is limited, hence manual ordering is not too complex. A
second reason for retailers not to chose an ASR2 system is when their products have
very high demand volatility or short cycle life, such as fashion articles. In the opinion
of one interviewee, simple systems such as the minimum-maximum algorithms work
fine until volatility reaches a certain point. The third argument for ASR1 systems is
that for products where the quality strongly depends on the season or on the supplier,
it is desirable to have the full control over ordering. In the field study, several retailers
still ordered fruits such as strawberries manually. A human planner was still
responsible for these products, and it was his or her task to decide when to order
which quantity from which supplier.101 Although these products are ordered
practically manually like ASR0 products, it still makes sense in many cases to have
stock levels stored electronically. A high inventory visibility is reached with such
electronic inventory records; these systems allow all direct and indirect benefits
described in the previous chapter.
101
These statements only hold true for products that are delivered directly to the store. In a central distribution
system it is possible to have part automation. The store orders automatically at the central office (ASR2 and
higher) in the stores, there a manual planner determines the supplier and quantity to be ordered.

6. Field Research and Managerial Implications 163
The second group of products for which forecasts do not make economic sense can
be automated by having simple ordering algorithms (ASR2). As one could see in the
quantitative part of this thesis, many of the products on the ASR2 level had good
performance compared to the manual products, although the underlying logic was
rather simple. When the parameters are set well and stock level is not the
predominant issue, these systems deliver reasonable performance with a low
replenishment system effort. Products in these categories are all products that have a
low economical importance for the retailer (such as some non-food household
articles for a grocery retailer). Non-expensive articles with a long shelf life where a
reduction of the stock level is not mandatory (such as clothes pegs) can profit from
this level. Such simple rules can be beneficial also for products with very predictable
sales behaviour.102 As the ordering logic is very basic at this level, retailers with
low-performance IT systems might choose this level.
Consequently, the last two ASR levels only make sense for products where there is a
benefit from increased effort put into forecasting. The difference between ASR3 and
ASR4 is the sophistication of the forecasts. ASR4 systems seek to increase the
quality of forecasts using causal models. If the causal variables cannot be quantified
or are ambiguous, the ASR3 level might be the better option. For products where the
inclusion of simple casual variables (such as price) into the forecast is relatively easy
or for products that are very important for the retailer (due to marketing or financial
reasons) the effort made to improve forecasting might pay of. An interviewee from
GROCO recognized that on hot days the availability of drinks suffered. Because at
the same time, the sight of empty shelves had a negative impact on customers, the
company regarded the improvement of availability as paramount. As water crates are
very bulky, increasing the stock was not a feasible solution. Therefore, the inclusion
of the weather in the system's forecasts is a possibility that was taken into account.
This decision tree was based on empirical research carried out with dozens of
retailers. The problem again is that the decisions made in the nodes are based on
cost-benefit decisions. The case of DRUCKS showed, for example, that forecasts are
not very expensive in terms of required IT-power. Consequently, DRUCKS makes a
forecast for all its products. As it would be too time-costly to optimize every forecast,
a system was chosen that dynamically optimizes its own parameters. Other retailers,
for example MYFOOD, have for the majority of its automated products an ASR2
102
As can be seen in Figure 19, the ASR2 system at MYFOOD worked quite well for products with a demand
volatility up to a sales coefficient of variance of 250%. For products with a higher demand volatility, ASR2
systems might not work efficiently anymore.

164 6. Field Research and Managerial Implications
system, although, according to the decision tree, ASR3 would also be adequate. To
assess a change of these products towards the new system really is economically
sensible a cost-benefit comparison between both systems would be necessary taking
into account the context of the retailer.
Overall the recommendation for retailers from the empirical analyses is that only for a
few products are completely manual systems recommendable. If there are no
restrictions regarding IT systems, the costs for automatic systems or other contextual
restrictions, the overall recommendation is to implement higher ASR level systems.
Automatic systems have the great advantage of levelling the influences of products
on replenishment performance, as shown in the quantitative analysis. For the
manually ordered products, the OOS rate was influenced by all the product
characteristics measured, namely sales variance, speed of turnover, the price,
CU/TU, product size and shelf life. On the other hand, ASR2 and ASR3 systems
showed much more stable behaviour, their OOS rate was in most cases not
influenced by product characteristics. Another result that was unambiguous is the
importance of the right setting of replenishment parameters. The moderate results of
MYFOOD's ASR2* systems show that wrongly or crudely parameterised systems will
not give the results expected.
The quantitative analysis showed another effect of higher ASR systems: performance
differences between stores are reduced. There is the danger that excellent stores will
worsen their performance by such automatic systems, as even the best IT system is
not able to outperform a good store manager who has many years experience in the
business and who knows exactly, how his or her customers behave.103 But in the final
analysis it can be seen that automatic systems tend to improve the average
performance of stores making them thus an attractive option for retailers.
6.5.2. ASR Introduction
The introduction of ASR systems was for all four retailers in the field study an internal
company decision and was mostly realized without the help of suppliers. The only
necessity for suppliers is to have a certain technology standard (e.g. EAN barcodes,
electronic dispatch advice) and a reliable service, as automatic ordering systems are
more sensitive to delivery errors than manual systems. In half of the cases, the ASR
systems were introduced together with new ERP systems and with major changes in
103
This is the opinion expressed by most practitioners interviewed. Yet there is no firm evidence for this
statement.

6. Field Research and Managerial Implications 165
distribution logistics. In the other two cases, implementation was nevertheless a huge
challenge as well because millions of parameters had to be set correctly. The setting
of the parameters is, where possible, automated. One method would be to copy
parameters for a new store from an existing comparable store. After the ASR system
has run for a certain time, the fine tuning of the parameters begins. Another major
effect that has to be considered is the impact of new ASR systems on personnel, as
a fundamental duty of the store employees is cut. In three out of four cases,
comprehensive training was organized to teach the right usage of the new systems.
MYFOOD, GROCO and NORTHY created new organizational units as a
consequence of the introduction of ASR. All retailers began by testing the systems
with a small pilot. First, a single store with pilot product categories is observed during
a certain time. The starting categories contain non-critical goods such as products
with a stable demand, long shelf life or slow speed of turnover. Then, these
categories are introduced nationwide. More complex categories are then automated
on a rolling basis until the desired level of automation is reached. The retailers in this
study have achieved good results with this procedure, and it is recommended to any
retailer introducing ASR systems.
6.5.3. Technical and Organizational Requirements
In this section, the technical and organizational requirements are discussed by
automation level (research question Q5).
Companies have the opportunity to implement ASR1 systems as soon as an
IT-based inventory management system is available. The IT needs the capability of
handling enormous amounts of data, as daily stock levels of all SKUs in each store
have to be stored. New inventory systems also require a change in retailer processes
and equipment. Because consumption has to be measured in order to update
inventory levels, sales have to be tracked. For major grocery retailers it is not feasible
to make an inventory check every evening to track all the transactions made during
the day, in the same way as a number of small bakeries that were observed. In order
to do that, identification systems have to be implemented that store electronically
every sale at the cash desk. The most popular identification technology method used
nowadays is the barcode. In future it might be RFID tags. To be able to calculate the
inventory level in the store, it is obviously also necessary to track deliveries to the
stores. This can either be carried out at the gate of the store, or at the gate of the
supplier.

166 6. Field Research and Managerial Implications
As inventory visibility plays such an important role for automatic systems, procedures
need to be put in place to ensure a high level of accuracy. Products that are not sold
through the regular channel, e.g. because of shrinkage or spoilage, have to be
somehow taken into account. This can be done with manual inventory checks where
the items are counted and the real numbers reconciled with those in the system.
In the field study, the described procedure seems to work rather well for packaged
products. But there are certain products that are much harder to control, e.g. fresh
products such as meat or cheese without packaging. For retailers selling such
products, it is perhaps not advisable to use ASR1 as tracking of the goods is too
time-consuming or too inaccurate.
As noted earlier, updating to ASR2 systems is straightforward from a technical
perspective. The simple heuristics do not require much IT-performance. The
challenge in these systems lies in setting the parameters. A grocery retailer with 1000
stores and about 10,000 SKUs has to set in theory 10 million parameters.
Furthermore, these parameters have to be checked and adapted on a regular basis,
as demand in an individual store might change. In practice, companies automate this
step by letting the computer decide on the parameters based on the past sales and
restrictions such as lead time. For products without data history, the data from similar
products is analysed. After some weeks of experience with the new system, OOS
incidents and high inventory cases are manually examined, to see if the parameters
have to be adjusted.
ASR3 systems require a forecasting engine that continuously estimates future
demand. To take again the example of the retailer before, it is now necessary to
make a forecast for each product, meaning the calculation of 10 million forecasts.
And in contrast to ASR2, this is not executed once but depending on the
replenishment frequency up to daily! Obviously, this is a challenge for any central IT
system. The example of DRUCKS showed that decentralizing– a PC in each store–
masters this task without any problem. The forecasts are based on past data–the
longer the history of the data, the higher the chance that regular variations (such as
seasonal effects) and trends can be predicted correctly. On the other hand, an
increase in the data requires an increase of storage capacity and computing power
for the forecasts. The cost of forecasts is very difficult to quantify, therefore in Figure
51 only a schematic cost-benefit sketch is depicted.

6. Field Research and Managerial Implications 167
Decreasing
forecast errors
Increasing
costs Models thatnaively projectpast patterns
Models thatseek underlyingcauses
Should try to operate in thisregion
E (cost of operating aprocedure)
E (total cost)
E (cost of resultingforecast errors)
Figure 51: Cost of forecasting versus cost of inaccuracy104
The forecast method used in ASR4 systems–causal models–is the main
characteristic of this type of system. For causal models to work, it is not sufficient to
see the past history of sales. Events have to be introduced into the equation as well.
Basically, every event that has an influence on the demand can be included.
Examples are the weather, price changes and promotions (by the retailer and by its
competition), political events, holidays, among others. The challenge here is to
choose the right parameters. Every added event is an opportunity to improve the
quality of the forecast, but at the same time it inflicts higher costs. Most of these
events cannot be easily automated, such as the information about future actions of
the competition. There are few retailers with experience of this kind of system so that
it remains to be seen if the additional cost of implementing the events is justified by
increased forecast accuracy.
To be able to interact at Level 5, companies obviously need to have information
about each of the nodes of the network. Take, for example, a system designed to
optimize simultaneously the replenishment of the store, the DC of the retailer and the
DC of the supplier. ASR1–4 systems that want to develop to ASR5 need information
regarding inventory levels at each site. ASR2–4 systems require in addition
information on restrictions. ASR3 and 4 systems need the ingoing and outgoing data
104
Source: Silver, Pyke et al. (1998, p. 77).

168 6. Field Research and Managerial Implications
of each of the nodes. And for ASR4 systems to become ASR5, the events that might
influence each of the nodes have to be implemented as well.
A final question that will arise at any level of replenishment automation is the right
choice of organization structure and power distribution. Obviously, this question is so
fundamental that it can not be decided only as a consequence of an implemented
ASR system. The examples in the field research showed that it is more easy to
introduce ASR systems in organizations where the decision-making power is
centralized. For higher systems, the power shifts even more towards central office.
For ASR3 and ASR4 systems it is recommended that central planners are introduced
to take care of the parameters in the forecasting engines and to intervene in
exceptional cases. Yet, even with the most sophisticated systems, retailers might
choose to let store employees have the final word on the replenishment system and
give them full rights to alter the computer-generated orders.
The results of this section are summarized in Table 49.
Level Technical Requirements and
Recommendations Recommendations on Operations
and Organization
ASR1
- Electronic inventory management system - SKU identification system (e.g. barcode) - Electronic checkout - Data storage capacity: few days–weeks
- Inventory records checks - Checkout processes - Goods entry processes
ASR2
- Setting of replenishment parameters - Electronic order transmissions (e.g. EDI
connection) - Electronic dispatch advice - PDAs
- Accuracy in checkout processes - Spoilage and returns control - Regular check of parameters and inventory
performance - Check of unusual sales or high inventories
ASR3
- Forecast engine (based on historic data) - Self-optimizing forecasting engine - Data storage capacity: some weeks–2 years
- Planners in central office - New products: comparison with similar products - Event system: check of unusual forecasts - Correction for promotions and special events
ASR4
- Technical implementation of events (such as weather)
- Event and historic data-based forecast engine - High central computing power or PCs in each store
- Past and future event data maintenance
ASR5 - Central IT system for coordination - Electronic connection to all nodes - Highest computing and data storage capacity
- One organization unit responsible for entire supply chain
Table 49: Technical requirements and recommendations on operations and organization structure

6. Field Research and Managerial Implications 169
6.5.4. Store Operations: Recommended Action
Independent of the final ASR level chosen, this section lays out the lessons learned
from the case studies in four fields, implications of the quantitative analysis are
discussed. The aim is to increase the performance of automatic systems with the
right practices in different areas of store operations (see Figure 52).
Store Operations RecommendationsStore Operations Recommendations
Inventory Accuracy
� Training of processes� Regular physical audits� Random checks� Incentive programme
Inventory Accuracy
� Training of processes� Regular physical audits� Random checks� Incentive programme
OOS Measurement
� Initial physical audit� Regular combination of
physical and electronic checks
OOS Measurement
� Initial physical audit� Regular combination of
physical and electronic checks
Promotions
� Combination of qualitative and quantitative planning techniques
� Involvement of supplier and store managers
Promotions
� Combination of qualitative and quantitative planning techniques
� Involvement of supplier and store managers
Awareness and Training
� OOS impact on business� Customer reaction� Reshelving
Awareness and Training
� OOS impact on business� Customer reaction� Reshelving
Figure 52: Overview of store operations recommendations
Several of the practitioners interviewed mentioned that employees have no
awareness of the problem of OOS incidents. Consequently, this should be the first
action taken. A physical audit of stock availability in the stores could help to create
this awareness. Such an audit may show that causes for OOSs are poor inventory
records accuracy and the way promotions are handled. Recommendations on these
four topics are presented in the following.
Awareness and Training
Knowing that a certain problem exists is the first
step towards solving it. If employee awareness of
the OOS problem improves, then there is a good chance of an increase of product
availability. In one of their projects, Stölzle and Placzek (2004) measured the OOS
rate of a German retailer over two weeks. In the first week the auditing was
conducted without the employees being informed about the project, in contrast to the
second week. The result was that in the second week the OOS rate dropped by 26%.
Only by knowing that the OOS rate is being measured, the employees managed to
increase availability dramatically. Another example of the importance of having the
employees informed about the availability results from MYFOOD's OOS-project. One
of the most notable results is that regarding the top 10 articles, i.e. the articles that
are most sold in the stores. Two of them have an extraordinarily high OOS rate (12%
and 22% respectively). Managers have to ensure that the most important goods in
the stores in terms of turnover are paid the most attention by the personnel.
Store Operations Recommendations

170 6. Field Research and Managerial Implications
Consequently, employees should be informed about which products are most critical
for business and for the satisfaction of customers. Second, it is necessary to inform
employees about the reactions of customers confronted with an OOS. Several
retailers interviewed expressed that they were not concerned about gaps in the
shelves, because, in an OOS situation customers would simply substitute the
product. However, this is only true for some categories and only to a certain extant.
By calculating the lost business due to such OOS incidents, the magnitude of the
problem becomes clear, as made by Gruen, Corsten et al. (2002). And third, as 25%
of all OOS incidents stem from reshelving practices, existing practices should be
reviewed in detail. Several retailers have introduced handbooks with well-defined
reshelving procedures. One English retailer has printed a bright star on the shelf floor
that becomes visible as soon the product is out of stock. As ASR systems are able to
relieve store employees, some of the spare time could be dedicated to accurate
reshelving. As was shown in the quantitative analysis, a reduction of the backroom
can be beneficial for the availability rate and should be considered by each retailer.
OOS Measurement
As was depicted in the last section, a physical
audit of the products' shelf availability is a good
way of creating awareness and gives a one-time picture of the OOS situation in a
store. But retailers are seeking a controlling to ol with which they can check
availability on a regular basis without the cost of manual audits. Therefore, the logical
next step after having introduced sophisticated systems to control and automate
replenishment is to have a controlling instrument for availability. During the KLOG
project undertaken for the MYFOOD, it was clearly showed how complicated this task
is. Even when high accuracy is guaranteed, there will be always OOS situations that
remain undetected. When availability suffers because shelf replenishment from the
backroom has not been executed in time, it is not possible to detect this problem by
just looking at the stock levels data. As the example in Figure 53 shows, the product
in this example was at all times available in the store. But, because the
replenishment from the backroom to the shelf did not work as expected, this SKU had
a shelf OOS rate of 21% during the two weeks of the study.
Store Operations Recommendations

6. Field Research and Managerial Implications 171
0
20
40
60
80
100
120
1 2 3 4 5 6 7 8 9 10 11 12
Inventory in store Shelf inventory
Figure 53: Comparison of inventory on shelf and total store inventory for a glue stick
Another possibility for calculating indirectly the availability rate is by analysing the
product sales data. In case of the sales of a product being unusually low for a day, an
availability problem might be the underlying cause. Obviously, this method is only
reliable for products with higher speeds of turnover.105 As the research on these
systems is in its infancy, it might be recommendable to have a combination of
physical and electronic audits to determine the OOS rate. A south-European Retailer
has introduced a threefold way of looking at OOSs, as described by Småros, Angerer
et al. (2004a):
1. One hour before the store is replenished, the store employees walk the store and
count the items that are OOS (i.e., they count the percentage of items available
before the store gets replenished). This metric is fairly conservative in that it
measures availability when the likelihood of stock-outs is relatively high. The metric
only measures the number of items OOS, without taking into account their selling
rates.
2. A second tool is used to estimate unfulfilled demand. This metric takes into
consideration the speed of turnover of products. In other words, the company not
only measures the percentage of items not available in the store but also estimates
the total sales that it might lose in the event that customers are not willing to
substitute. One issue faced when using this tool is the difficulty in estimating the
potential demand for items that are OOS. The tool basically provides statistical
estimates of how many items the product could have sold had it been available. It
also corrects for situations, such as wrong inventory records or defective items,
where the system thinks a few units are left on the shelf but either no unit is actually
105
According to ECR France (2002) about three or more sales per day are necessary for such methods.

172 6. Field Research and Managerial Implications
there or just one unit that customers are not willing to take (as it is damaged) is
available.
3. Finally, the company takes into account the attractiveness of the shelf. In order for
the shelf to be attractive to the customer, it has to be filled to a given percentage of
its capacity at least. The key concept behind this metric is that inventory on the shelf
is not only necessary for meeting demand but also necessary to draw the consumers'
attention and create demand. The company does not only want to measure the ability
of the inventory position to fulfil demand but also its ability to create demand. The
company thus also measures the percentage of items with inventory positions below
a specified percentage of shelf capacity.
By combining the information of the manual and electronic methods, the company's
supply chain managers receive a very good sense of how the consumers experience
the quality of store operations.
Inventory Records Accuracy
The importance of inventory records accuracy
was shown in the chapter about field research.
For every automatic system high accuracy is beneficial. Yet for the higher ASR levels
it becomes even more important as the order is often placed without a second check
through human beings and the safety stocks are calculated more tightly. For this
reason, employees need to be made aware of the importance of accuracy when
working with ASR systems. Processes such as the check-out and the recording of
spoilage, returns and stolen goods have to be defined and trained intensively. To
control the results of these methods on records accuracy, the usual biannual
counting of the goods is not sufficient. A continuous manual audit process is
necessary that checks the accuracy of the records. This is feasible because store
employees should have more free time due to the automation of the ordering. But
without a defined procedure the retailer will not benefit from this spare time. One
solution seen in field research, the "0–1–2–3 walks," is a good example of such a
defined process (see section 6.2.1). This process has many of the characteristics a
good inventory auditing system should have: it is accurate (as counting errors with so
few units are not probable), it is easy to understand (guarantees acceptance by
personnel), it automatically concentrates on products with possible inventory
inaccuracies (as that might be the reason why the inventory level is so low), and in
the long run all products are checked at least once (as one can expect that all
products will have a low inventory at some point). From time to time, random samples
Store Operations Recommendations

6. Field Research and Managerial Implications 173
of products should be taken to check whether the inventory accuracy process works
as expected. Several of the examined retailers run an incentive programme to
promote inventory records accuracy. With a regular auditing mechanism in place, the
positive effect of this incentive system should increase. Nevertheless, one should be
aware that checking inventory accuracy too much might have some drawbacks as
well. Employees should not forget other tasks that are also important, such as the
tidiness of the sales area or customer service. To illustrate this, take the example of a
grocery retailer in the UK. This company had to stop an accuracy campaign it had
started a short time before; employees were requested to stop checking daily for
inventory accuracy. The problem was that the hundreds of corrections made in the
retailer's IT system created a commotion that distorted and confused the system,
worsening the replenishment process instead of improving it.
Promotions
An important lesson learned from the quantitative
analysis was the role of promotions on OOS, as
promotions dramatically change the inventory and sales level, thus increasing the
chance for OOS situations. How much attention promotion-related OOSs receive
depends very strongly on the policy of the retailer. Some retailers willingly take into
account that special goods in promotions run OOS after a certain time. Other
retailers, however, have a more consumer-oriented approach and want to offer the
product during the entire promotion period. It is obvious that for retailers with such an
approach it becomes most important to calculate the right quantity of SKUs in
promotions. In the case of MYFOOD, promotions are planned completely manually.
As the results are not entirely convincing and vary sharply from store to store,
managers should consider a mixed approach, where the technology supports the
employees in their planning decisions. A best-practice example is reported from a
European grocery retailer (Småros, Angerer et al. 2004a). This example is meant to
encourage retailers that are still handling promotions manually, to consider the usage
of ASR systems as well:
Before the promotion starts this best practice retailer uses a quite sophisticated
demand-forecasting tool to predict the number of customers that will enter the store
and the rise in sales per customer. The forecasts take into account variables such as
the promotion characteristics, the price cut and the weather, among others. This
initial forecast assumes that all stores are going to enjoy the same promotional lift.
However, it is well-known that the effectiveness of the promotion depends on many
store-specific variables, such as where the product is placed in the store, the number
Store Operations Recommendations

174 6. Field Research and Managerial Implications
of facings it has been allocated, etc., and that these variables can seldom be fully
controlled by the central organization. What the company does is to look at the first
few days of sales at each store and then update the initial estimates literally in real
time. Since this retailer benefits from a quick supply chain (both lead times from
distribution centre to store and from supplier to distribution centre are quite short), the
company can adjust its replenishment plans promptly.
The algorithm used behaves in a way like a human planner. At the beginning of the
promotion, the ASR overstocks the stores. It knows that even if the products do not
sell as expected, it is likely to be able to sell them by the end of the promotion.
Towards the end of the promotion, by contrast, the system is more conservative,
since it acknowledges the increased risk of being stuck with the product when the
promotion is over.
6.5.5. Cost-Benefit Analyses
The four retailers studied into detail have drawn a positive conclusion of their ASR
implementation. For the interviewees the advantages of higher ASR systems exceed
the possible drawbacks. The reported benefits are:
� higher availability on the shelves,
� higher turnover,
� time savings due to automatic ordering,
� lower stock levels in the stores,
� smaller stores require lower delivery frequency,
� more stable demand at the distribution centres, and
� inventory and cost transparency along the retailer's supply chain.
These benefits correspond to the ones reported in theoretical and practical sources
dealing with systems that improved forecasting accuracy. For example, Gudehus
(2002) and Duffy (2004) report improvement in operations such as decreasing
inventory levels, increasing service rates, fewer OOS, more on-time deliveries,
shorter order-to-deliver cycle times and more accurate KPIs for the management,
among others (see also Table 4).
The main initial impact of an ASR introduction is the investment necessary in new IT
systems. In all cases, the new replenishment systems were received with scepticism
on the part of employees. The interviewees stressed several times the importance of
taking serious the wishes and concerns of the workforce. Otherwise, the
implementation is likely to fail. Interestingly, in all four cases, after a couple of months
the uproar settled down and employees got used to the system.

6. Field Research and Managerial Implications 175
But introducing ASR was not a success for all products. While DRUCKS, GROCO
and MYFOOD report fantastic results, NORTHY is not happy with the performance of
green grocery products ordered through their ASR3 system, even several after
months after introduction. A return to the old system is being considered. The
question is whether these sorts of products are not amenable to automation or
whether the chosen ASR3 system was not adequately parameterised. The fact that
other retailers have had good results with their systems for this kind of product
speaks in favour of the latter cause. NORTHY has some problems with the barcodes
and dispatch advices for these products, as they come mainly from small suppliers
and this is a possible reason for the suboptimal results. As seen with NORTHY's
case and the ASR2* systems at MYFOOD, there are many pitfalls in the
implementation of such systems; detailed planning is necessary to ensure the
success of the change.
A major point of criticism among opponents of ASR systems is that the most
sophisticated system will never cope with the best, long experienced store personnel.
And they might be right, as all the implicit information earned by good store
managers during a long life can never be adequately replaced by a computer system.
Unfortunately, the ordering skills of store staff vary a great deal. Therefore, with the
introduction of ASR systems, retailers aim to achieve constant ordering performance
at a reasonably high level that will be better than the average manual ordering
performance.
The decision as to which level to choose for each product should be based on a cost-
benefit analysis. In theory, the calculation of such an analysis is simple. On the one
hand, there are the benefits of having an automatic system as described in the last
section. This line can be interpreted as a negative cost line, as the costs, for example
OOS costs, are reduced (line CE in Figure 54). On the other hand, the more complex
the replenishment system, the higher the costs for the replenishment will be (CR
line). The optimum would be the point where the total cost line (TC) has its minimum.

176 6. Field Research and Managerial Implications
Automation
level
Increasing
costs
CR: cost of replenishmentsystem
TC: Total costs
CE: cost of errorsof replenishmentsystem
minimun
ASR0 ASR1 ASR2 ASR3 ASR4
Figure 54: Costs in relation to replenishment level106
It is very difficult to transfer these rather theoretical thoughts to a real life cost
analysis. The benefits and costs connected to such an implementation are
summarized in Table 50.
Possible Benefits Possible Costs
� Fewer OOS incidents
� Higher product turnover in stores
� Fresher goods
� Less frequent store deliveries
� Lower inventory costs at store level
� Less personnel costs for order
setting
� Demand in DC easier to schedule
� Better service to the customers
� Inventory visibility
� IT investments
� IT running costs
� Personnel education
� Small, frequent deliveries towards
stores
� Product handling costs in store
� Additional personnel at headquarters
Table 50: Overview of possible benefits and costs following an ASR system introduction
The first difficulty is to quantify the benefits. As Fisher, Raman et al. (2000) state,
most retailers are not able to quantify the value of e.g. reduced OOS incidents and
markdowns. A rough estimate of the benefits of reducing OOSs is given by Gruen,
Corsten et al. (Gruen, Corsten et al.). In their estimation, for each percentage point
106 Source: adapted from Silver, Pyke et al. (1998, p. 77).

6. Field Research and Managerial Implications 177
OOS reduction, an increase in turnover of 0.5 percentage points is to be expected.
Some companies have in lavish calculations evaluated the benefits of the reduction
of delivery frequency. Nestlé Germany, for instance, has found out that a change
from delivering every 24 hours to every 48 hours means a reduction in the costs by
the factor 5–6 (Weder 2005). Therefore, MYFOOD's initiative to reduce the
replenishing frequency has a major benefit potential. Other indirect benefits, such as
the new reached level of inventory visibility across retailer's storing places are much
more difficult to quantify.
As difficult to calculate are the cost side of such projects. The technology costs will
strongly depend on the technology already available on site as well as on the
organizational structure. It is hence impossible to make a general quantification of
costs. A centralized retailer changing from an ASR0 system to an automatic level
which needs to first implement barcodes and scanners may find here the biggest cost
block, making the change very expensive. As this retailer is already a centralized
organized, adapting the organization might not be necessary. On the other hand, a
decentralized retailer that already has a working ERP system might with just a
software upgrade change from an ASR2 system to an ASR4 system at negligible IT
costs. But this retailer might face strong opposition from the independent stores,
making it very costly to adapt the organization and train the personnel. The effect of
ASR on store delivery frequency and handling costs is not quite clear. As seen
before, MYFOOD sees the possibility to reduce deliveries to its stores. GROCO
logisticians reported frequent, low quantity orders created by an old ASR2 system.
This not only increases the transport cost, but at the same time store reshelving
costs. Obviously, it will depend on the parameterisation of the ASR systems whether
ASR will reduce or increase the logistics costs.
As stated before, many retailers combine the introduction of higher ASR systems with
an introduction of or change in ERP systems. This makes a final assessment of the
true benefits and costs very difficult. Instead of making a very imprecise estimate, in
the following the results from a comprehensive cost-benefit study of MYFOOD is
presented. This company changed its ASR system, its ERP system and its
distribution network all at the same time. Although this makes it difficult to attribute
real benefits to any single change, this case is a good example of how fast the
restructuring of replenishment systems can be amortised.
When ASR2 systems were introduced, MYFOOD lived simultaneously through a very
radical change of its organization. Its entire distribution strategy was changed,
namely from a decentral to a more central logistics system. Plans for the change of

178 6. Field Research and Managerial Implications
the distribution system covered a 10-year time period. After five years, MYFOOD
drew its first cost-benefit conclusion. The goal of this analysis was to quantify the
benefits of the change from a decentral, manual system to a central system with
automatic replenishment. This task was described by one interviewee as
"back-breaking work," as a homogeneous definition on how to value costs and
benefits was necessary through the entire organization. The biggest benefit was an
increase in turnover (due to better, centralized category management) followed by a
reduction in purchasing costs and in stock. The increase in turnover adjusted by price
inflation, sales area increase and marketing was calculated at 0.7%. This increase
includes the effect of higher availability, fresher goods and a more attractive
assortment due to central category planners. The biggest benefit was seen for
seasonal, non-food products. The costs were split into three parts: IT, marketing and
logistics. Surprisingly, the IT costs in the long run did not increase. During the
implementation phase, there were indeed increased costs due to investments in
equipment and personnel education. But after 2–3 years, the annual IT costs were
again on the level of the former, decentral system. In logistics, a similar situation
happened. During the ramp-up phase of the system, inventory levels did increase
significantly, the central warehouse was loaded nearly to maximum capacity, and the
distribution running costs were very high. This was partly a consequence of a security
plan to ensure complete availability during the whole period. Yet after a very short
time, inventory stocks could be reduced. Two years after the introduction, stocks
were lower than before the change, although the turnover had increased.
Overall, this special retailer is more than happy with the restructuring and
implementation of the new logistics concept. As early as two years after the
introduction of the central system, the accumulated benefits were higher than the
costs. The yearly benefit for the retailer is a nine-digit euro number. Regarded from
the viewpoint of the customers, the benefits are, according to the interviewee, a
better assortment that is homogenized across the stores, a higher availability, and
better service due to the free time of the personnel. The cost reduction for the firm
will finally result in lower prices for the customers.
The conclusion of this section is that in a cost-benefit analysis it is very hard to isolate
the benefits from implementing a higher ASR, as only in a few cases the automation
of the replenishment was realized independently from the introduction of a new ERP
system or a change in logistics. Nevertheless, the quantitative and qualitative
examinations conducted in this thesis show what kinds of benefits one can expect.
The example of MYFOOD demonstrated how major investments in IT and logistics
have paid off after only two years. Retailers have to quantify as far as possible the

6. Field Research and Managerial Implications 179
benefits and costs presented in this section before the final judgement on the
financial benefit of an ASR introduction can be pronounced.

180 7. Conclusion
7. Conclusion
In this final chapter, the contributions for theoretical research and practitioners are
summarized, before further research fields are depicted.
7.1. Theoretical Contributions
This thesis has some theoretical implications that are described in the following along
the four theoretical perspectives used in this thesis (see Figure 55).
Inventory managementresearch
Inventory managementresearch
Theoretical foundation forASR research
Theoretical foundation forASR research
Inventory managementresearch
Inventory managementresearch
Theoretical foundation forASR research
Theoretical foundation forASR research
Business informationsystems research
Business informationsystems research
ASR and human agency
ASR and human agency
Business informationsystems research
Business informationsystems research
ASR and human agency
ASR and human agency
Contingency theoryContingency theory
Explanatory modelExplanatory model
Contingency theoryContingency theory
Explanatory modelExplanatory model
Logistics & operations management
Logistics & operations management
ASR benefitsStore processes
ASR benefitsStore processes
Logistics & operations management
Logistics & operations management
ASR benefitsStore processes
ASR benefitsStore processes
Figure 55: Theoretical contribution of thesis
The traditional inventory management research has concentrated on the
development of mathematical models of replenishment systems (e.g. Galliher, Morse
et al. 1959; Bassok 1999). This research stream is criticized by Wagner (2002) as too
theoretical and too far away from the challenges of real life. The main contribution of
this thesis is that a topic was chosen that is, on the one hand relevant for the
challenges retailers experience every day and, on the other hand, a field that has not
been in the focus of inventory research up to now. The novelty of this research field
demanded first of all the creation of a descriptive model. In chapter 4 such a model
was developed based on the traditional inventory holding models as described by
Silver, Pyke et al. (1998) and Gudehus (2002). The descriptive model was the basis
for the creation of the six-step classification system that is valuable for understanding
the main differences between manual and automatic systems (see Figure 13). The
classification of ASR systems facilitates the creation of hypotheses concerning
replenishment performance by each different system. A quantitative analysis proved
the significant performance differences between ASR levels. Consequently, the
enhancement of the existing inventory management research stream by the creation
of such an ASR classification system is appropriate. Another contribution of this
thesis concerns the theoretical sources that examine out-of-stocks in retail. Most of
OOS research has concentrated, on the one hand, on the extent of the OOS rate
and, on the other hand, on the consumer reaction. In contrast, this thesis has taken a
third aspect into focus, namely the influence of product and store characteristics on

7. Conclusion 181
the OOS rate. Again, the quantitative analysis showed that there are indeed several
significant relationships between these characteristics and inventory performance
that have not yet been studied in detail.
A special field of logistics and operations management research examines the
performance of automatic replenishment programmes. As predicted by Ellinger,
Taylor et al. (1999) and Götz (1999), the automatic replenishment systems reduced
OOS incidents as well as inventory holdings. For the first time in an academic
analysis, the size of this reduction was quantified in practice. Another most
noteworthy outcome is that the influence of product characteristics on replenishment
performance can be significantly reduced when ordering is automated. Sales
variance, speed of turnover, price, case pack size and product size are significant
influences on the OOS rate in the case of manual systems, but not for the automatic
systems. Similar results are obtained regarding the influencing factors of inventory
levels. A second contribution of this thesis regards store operations. A novelty is the
description of store operations in the context of ASR systems, something that very
few researchers have examined up to now.107
This thesis confirms some of the implications for business and human agency as
stated by theoretical business information sources. For example, several papers
predict the change of human working patterns due to the introduction of new
IT-based replenishment systems. The employees in the retailers studied clearly had
to radically change their working behaviour. The innovation in this thesis is to transfer
the statements about ERP systems to the context of ASR systems. As all ASR
systems examined in the sample are an integral part of superordinated ERP systems,
this procedure can be considered appropriate. The result is, as expected by
researchers such as Kallinikos (2004) that human agency is indeed deeply influenced
by new ASR systems. The way orders are executed within the retailers examined is
much more structured and transparent than it used to be before the introduction of
higher ASR systems. Personal communication and typical human behaviour such as
improvisation is strongly limited by the new systems. As recommended by Hong and
Kim (2002), the aspect of organizational change in the context of ASR
implementation was examined. The disruptive organizational change predicted by
Soh, Kien et al. (2000) could be partially seen for some of the retailers, where new
central organizational structures were created and a decision power shift occurred
from the stores to the central office.
107
One of the few exceptions is the work of Broekmeulen, van Donselaar et al. (2004b; 2005).
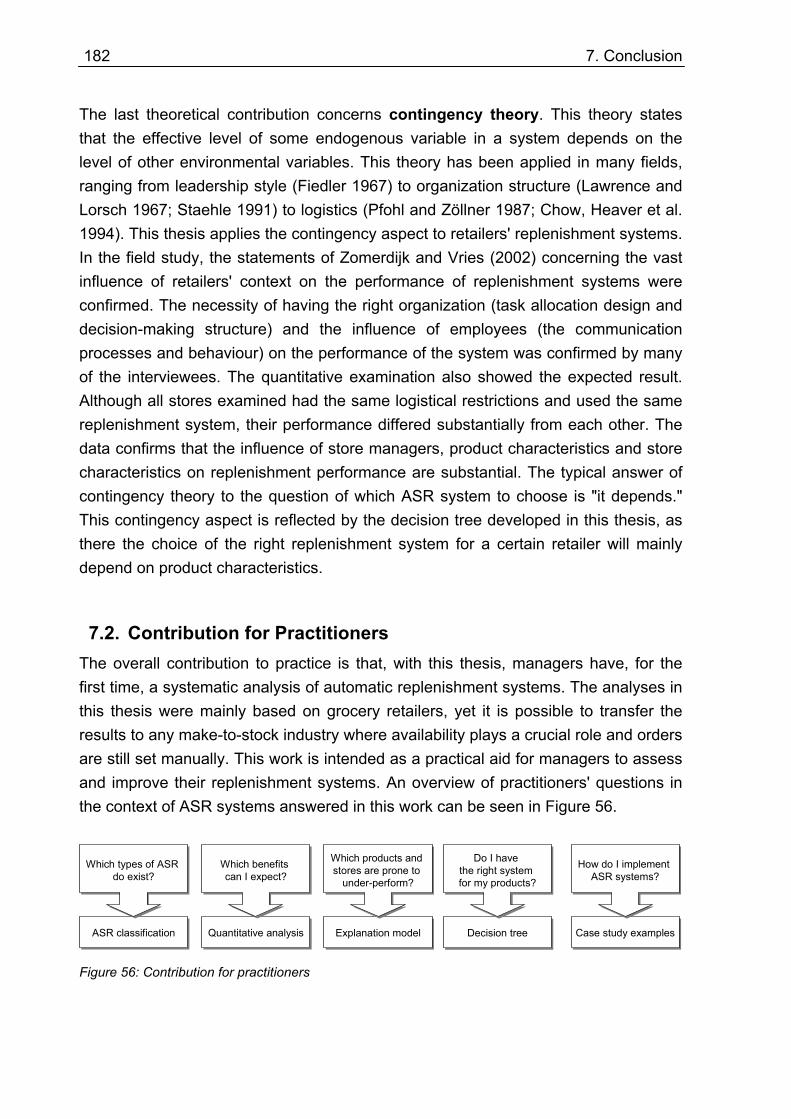
182 7. Conclusion
The last theoretical contribution concerns contingency theory. This theory states
that the effective level of some endogenous variable in a system depends on the
level of other environmental variables. This theory has been applied in many fields,
ranging from leadership style (Fiedler 1967) to organization structure (Lawrence and
Lorsch 1967; Staehle 1991) to logistics (Pfohl and Zöllner 1987; Chow, Heaver et al.
1994). This thesis applies the contingency aspect to retailers' replenishment systems.
In the field study, the statements of Zomerdijk and Vries (2002) concerning the vast
influence of retailers' context on the performance of replenishment systems were
confirmed. The necessity of having the right organization (task allocation design and
decision-making structure) and the influence of employees (the communication
processes and behaviour) on the performance of the system was confirmed by many
of the interviewees. The quantitative examination also showed the expected result.
Although all stores examined had the same logistical restrictions and used the same
replenishment system, their performance differed substantially from each other. The
data confirms that the influence of store managers, product characteristics and store
characteristics on replenishment performance are substantial. The typical answer of
contingency theory to the question of which ASR system to choose is "it depends."
This contingency aspect is reflected by the decision tree developed in this thesis, as
there the choice of the right replenishment system for a certain retailer will mainly
depend on product characteristics.
7.2. Contribution for Practitioners
The overall contribution to practice is that, with this thesis, managers have, for the
first time, a systematic analysis of automatic replenishment systems. The analyses in
this thesis were mainly based on grocery retailers, yet it is possible to transfer the
results to any make-to-stock industry where availability plays a crucial role and orders
are still set manually. This work is intended as a practical aid for managers to assess
and improve their replenishment systems. An overview of practitioners' questions in
the context of ASR systems answered in this work can be seen in Figure 56.
ASR classificationASR classification
Which types of ASR do exist?
Which types of ASR do exist?
Decision treeDecision tree
Do I have the right system for my products?
Do I have the right system for my products?
Quantitative analysisQuantitative analysis
Which benefits can I expect?
Which benefits can I expect?
Explanation modelExplanation model
Which products and stores are prone to
under-perform?
Which products and stores are prone to
under-perform?
Case study examplesCase study examples
How do I implement ASR systems?
How do I implement ASR systems?
Figure 56: Contribution for practitioners

7. Conclusion 183
First of all, with the help of the developed classification system, retailers are able to
gain an overview of the existing automatic systems. There are six different ASR
system types, the main difference between them being the ordering logic. While basic
systems calculate the order based on simple algorithms (e.g. minimum-maximum
logic), the most sophisticated ones use causal forecasting techniques.
Practitioners need to know the possible benefits of ASR systems. The analysis of a
grocery retailers' data showed the various advantages of automatic systems. The
retailer examined managed to reduce its inventory levels by 33% for non-food
products and by 16% for dairy products compared to a random control group. In
addition, the inventory levels of the dairy products were more stable when the
products were ordered automatically by ASR3 systems. A major benefit is also the
reduction of the number of OOS incidents. Products that were ordered manually had
on average an almost 8-times higher OOS rate than products ordered by ASR2
systems. An additional benefit is that automatic systems show robust results. While
the performance of manual replenishment is strongly influenced by product
characteristics such as price, speed of turnover, etc., automatic systems exhibit much
more consistent results. The time savings for each store are estimated between 0.5
and 5 man-hours, depending on the size of the store. Finally, the examined retailers
report secondary benefits of ASR implementation such as the possibility to reduce
logistics costs, for instance, by lowering store replenishment frequency.
Nevertheless, the success of ASR systems will depend on many factors, as the
explanatory model has shown. Understanding the influence of store and product
characteristics on inventory performance can enable retailers to identify products and
stores where the replenishment performance is probably not as desired. For
instance, it was demonstrated that stores having the biggest backrooms tend to have
at the same time the highest OOS rates. With this knowledge, necessary
counteractions can be initiated.
Practitioners want to know whether they have chosen the adequate system for their
products. For this reason, the fourth contribution of this thesis is the development of a
decision tree that helps managers to identify the right ASR level for each product
category. There are still many products where manual ordering (ASR0) is
appropriate. For instance, for very fresh products such as bread rolls, electronic
inventory records are not feasible. For other products that show very irregular
demand (e.g. fashion goods) or that are very expensive (e.g. jewellery)
semi-automation might not be economically sensible (ASR1). However, for most
articles of a typical grocery retailer automation should be strongly consideration.
184 7. Conclusion
Products with a stable demand or low value can achieve good results with simple
ASR2 systems. All other products might benefit most from automation based on a
forecasting engine, taking into consideration that computing power is nowadays not
the decisive constraint.
Retailers that have decided to change their replenishment system should be aware of
the wider consequences of their actions. The implications for the companies go far
beyond a mere improvement of the replenishment system. Retailers' technology,
organizational structure and processes have to be adapted to successfully introduce
ASR systems. Depending on the ASR level, different technical systems have to be
introduced, such as an electronic inventory records system, electronic data
interchange, forecasting engines, etc. However, retailers have seen the ASR
introduction as an opportunity to harmonise their entire IT and other technologies in
use, e.g. by introducing ERP systems or by installing the same type of tills in all
stores. Another change concerns the organization of some retailers, where a shift in
the decision-making power from the stores to the headquarters occurred. New central
planning functions have been created that control the flow of stores replenishment
and take care of the ASR parameters. Furthermore, ASR systems have dramatically
changed the working behaviour of many employees. Not every employee welcomes
the automation as a relief from the burden of placing orders, as this task is regarded
by many as an essential part of their work. Successful retailers have created an
acceptance among employees by showing them the benefits of the new systems.
IT-courses have dispelled the fear of many store employees concerning the new
technique. Other courses were used to show employees the new processes required
to support ASR effectiveness. One example of such new processes are the ones that
aim at increasing inventory records accuracy. As ASR systems are highly dependent
on records accuracy, definition and training of processes such as physical counts, the
check-out, the handling of shrinkage, among others, is crucial.
Overall, the implementation of ASR systems is a great opportunity for practitioners.
However, this thesis not only highlighted the benefits but also the risks of automating
replenishment. Practitioners have to be careful, because the introduction of wrongly
parameterised ASR systems will be counterproductive. At the end of the day,
managers' final question will be: Is introducing ASR worth all the effort? This is a
difficult question, and the answer needs to be decided by every practitioner in each
individual context. The change from a push to a pull system requires a significant
effort. The case study of MYFOOD has shown that only two years after the
introduction of the new ASR2 system the investment had been fully amortised.
Depending on the retailer's starting point, this period could be even shorter. The four

7. Conclusion 185
case studies of retailers which strongly benefit from ASR systems can be a major
help for any practitioner planning to automate store replenishment.
7.3. Further Research Fields
Considering the novelty of this research field, the present thesis can only be the
beginning of research projects on this topic. Six research fields have been identified
that could be examined in future research to gain more detailed insights into the ASR
topic.
Further Research Fields
� Quantitative analysis with larger empirical basis (several retailers)
� Research on non-grocery retailers
� Research on ASR4 systems
� ASR5: multi-tier systems
� ASR influence on human agency
� Overall replenishment cost function
Table 51: Overview of further research opportunities
First of all, the quantitative examination in this thesis concentrates on a single
grocery retailer. It could be proven that the introduction of the replenishment systems
was indeed beneficial for this retailer, as long as the replenishment logic was set
correctly. The next logical step would be to have another empirical examination with
several retailers to prove that this was not just an exception but that indeed all
retailers can benefit from this approach. However, such a detailed examination as
was made for this thesis may not be possible when looking at several retailers at
once. Moreover, this approach would examine a broad sample of retailers, e.g. with
the help of surveys, to create a statistical proof of the benefits of ASR systems.
Second, the present research focused on grocery retailers and chemists. Yet from
several interviews it is known that this topic is also relevant for other types of retailer.
Further research could hence concentrate on the transfer of the present results to
other types of products. Further studies are required in particular for articles with a
high fashion influence and with long lead times (such as in the apparel industry).
Third, in this thesis only the change from manual to ASR2 and ASR3 systems could
be statistically tested. A most interesting question for retailers is whether an upgrade
in ASR system is worth the effort. This knowledge is necessary to make a

186 7. Conclusion
cost-benefit analysis. Statistical examinations of retailers that have made the jump
from ASR2 or ASR3 to an ASR4 system would be particularly useful to practitioners.
A fourth possibility for further research is the examination of ASR systems from an
ECR perspective. The main idea of ECR is collaboration along the supply chain in
order to obtain better results. The question of the contribution of suppliers to the
success of ASR systems is still to be answered, as most of the retailers examined in
this thesis carried the implementation on their own. The models developed in this
work only regard the last tiers of the supply chain. The final aim of such collaborative
supply chains would be the hypothesised ASR5 system. The development of
systems that optimize replenishment along the entire supply chain would be one of
the biggest challenges in this field for future research.
The next topic which could only be examined on the surface is the influence of ASR
introduction for human agency. One possible approach would be a social-
psychological one. It would be interesting to see how the satisfaction of the individual
store employee changes after the introduction of ASR systems and how long it takes
to return to its former level. Another focus would be research on the ordering
behaviour of store employees confronted with ASR systems, as conducted by
Broekmeulen, van Donselaar (2005), and on the optimal degree of influence store
personnel should have on the automatically generated orders.
Finally, a topic that also requires further research is the one of the multiple tradeoffs a
retailer is facing when dealing with the setting of the replenishment system. It was a
remarkable result to prove that ASR systems are able to reduce OOS rate and
inventory level at the same time. Yet, it is not clear what exactly the relationship is
between the two. At some point, the store manager will have to decide on a tradeoff:
further reducing inventory will raise the OOS level and vice versa. Besides, there are
many other parameters that have influence on the total replenishment costs and the
handling workload in the store, such as shelf space, case order size and data quality.
The role of inventory records inaccuracy has to be examined in detail, as the retailer
MYFOOD in this thesis had good performance results despite major inventory
records inaccuracies. Consequently, further research should take a closer look at
creating an overall cost function, where all the possible costs of store replenishment
are taken into account alongside their influence on performance. This thesis provided
a small contribution for the realization of this ambitious task.

8. Appendix and References 187
8. Appendix and References
8.1. Statistical Appendix
8.1.1. Calculation of the Inventory Level
The difficulty with the data extracted from MYFOOD's ERP system was that the
system does not record any absolute values of the stock level. This means that it is
not possible to determine ex post the quantity of goods there were for a certain
product on a specific day. In addition, MYFOOD interviewees stressed the inaccuracy
of the inventory records. This statement is supported by physical audits (see Figure
49) and by other researchers (e.g. Broekmeulen, van Donselaar et al. 2005). The
only available data was relative, i.e. showing how many units were delivered and how
many units left the store on a certain day. With this data it is possible to determine
the stock level curve, but without knowing at which height on the y-axis the curve is
(see Figure 57) .
19.0
7.2
004
02.0
8.2
004
16.0
8.2
004
30.0
8.2
004
13.0
9.2
004
27.0
9.2
004
11.1
0.2
004
25.1
0.2
004
Calculated Inventorywithout zero line
supposed zero stock-point
Figure 57: Relative inventory level curve without zero line
Nevertheless, additional information makes it possible to determine the zero line. It is
evident that the inventory levels in the store can never be negative. Consequently,
the relative stock curve can be set in such a way that its minimum equals zero. This
method seems adequate for several reasons. First, the only problem with this method
would be with products that are never OOS. Nevertheless, the chances of this

188 8. Appendix and References
happening is very rare, because in the sample a data period of 90 days is covered.108
The chances of a product of being always in stock taken an OOS rate of 5% equals
0.9590= 0.1%. Second, even if the product was never OOS, the minimum value is
likely to be close to zero, thus still delivering a good approximation. For 15 of the 100
articles in the sample, the actual inventory levels were measured in the store during
two weeks. Comparing both lines, as can be seen in Figure 58, show the accuracy of
this method.109 Third, the variance of the stock is independent of the height of the
level, therefore this KPI is not affected by this procedure.
0
10
20
30
40
50
19.0
7.2
004
02.0
8.2
004
16.0
8.2
004
30.0
8.2
004
13.0
9.2
004
27.0
9.2
004
11.1
0.2
004
25.1
0.2
004
Calculated inventoryafter correction
Manual countedinventory
Figure 58: Absolute inventory level curve after the correction
This method is not 100% correct. Especially for products with very low OOS rates,
the inventory levels might be underestimated. However, greater accuracy is not
necessary, as the main goal of this thesis was to compare different ASR methods
with each other. As the possible inaccuracy of this method impacts equally both
manually- and automatically-ordered goods, the comparison is still valid.
108
Therefore the analyses on inventory levels done with the two-weeks data (Dataset1) have to be viewed with
caution. Yet, in those analyses it was not important to show the absolute level of the inventory, but more how
the impact of an external variable (e.g. price) influenced the inventory level. For this purpose, this method is
appropriate. 109
The still existing difference between both lines can be explained by the fact that the inventories were counted
during the day. Sales happening after the count make the manual line stand above the calculated line. Another
possible explanation for the small gap could be that the minimum value on August 14th
was not zero but a little
higher (around 2 units).

8. Appendix and References 189
8.1.2. ANOVA Considerations and Prerequisites
The main task of ANOVAS is to prove the existence of a correlation between the
variables, e.g. that for one group the OOS rate is higher than for another.
Consequently, one has to be cautious about interpreting the size of this correlation
(Backhaus, Erichson et al. 2003). The ANOVAs only prove that one group is
statistically different from another, yet the direction, i.e. if the one group is higher or
lower than the other, has to be seen from the context. Normally this is not a problem,
as the descriptive statistics clearly show which group had the higher value.
In the following, the data conditions that have to be fulfilled for an ANOVA to be
applied are discussed (cf. Backhaus, Erichson et al. 2003, pp. 150–152). First, the
dependent variable has to be a metric scaled variable. In this thesis either the OOS
rate or some stock-level-related variables are tested, this is fulfilled with the present
data.110 Second, ANOVA designs normally demand that the sample taken is
representative for the entire basic population. This can be assured, e.g. through a
random sample. In this study the products and stores were not randomly chosen. Yet
in the choosing process–as described in the section 5.1–it was taken care that
representatives of each product category or store type that are relevant for the
analysis of the performance were present. Therefore, no distortion of the analysis is
expected. Third, the values in the population should have a normal distribution (Rao
1998) and fourth, the population variances have to be equal. But the last two
restrictions are often relaxed in practice and nevertheless the results are significant
ANOVAs (Backhaus, Erichson et al. 2003). In the analysis of this thesis, to compare
the effects with each other, a Tamhane's T2 post hoc analysis is made where the
assumption of equal variance is not required.
110
To be precise, most of the data presented in this case is censored, as e.g. the OOS rate cannot be lower than
0% or higher than 100%. Yet, as long as the data is not very close to these limits, one does not expect
significant impacts on the results. In the marketing literature, this procedure is most common (cf. Katsikea and
Skarmeas 2003).

190 8. Appendix and References

8. Appendix and References 191
8.2. References
Aalto-Setälä, V. (2001). "The effect of concentration and market power on food
prices: evidence from Finland." Journal of Retailing 78(3): 207-216.
Accenture (2000). Science retailing: bringing science to the art of retail. White Paper.
Achabal, D. D., S. H. McIntyre, et al. (2000). "A decision support system for vendor
managed inventory." Journal of Retailing 76(4): 430–454.
Ailawadi, K. L., N. Borin, et al. (1995). "Market power and performance: a cross-
industry analysis of manufacturers and retailers." Journal of Retailing 71(3):
211-248.
Akkermans, H. A., P. Bogerd, et al. (1999). The impact of ERP on supply chain
management. Fontainebleau, INSEAD.
Alicke, K. (2003). Planung und Betrieb von Logistiknetzwerken. Berlin, Springer.
Andersen Consulting (1996). Where to look for incremental sales gain. The retail
problem of out-of-stock. Atlanta, The Coca-Cola Research Council.
Anderson, B. V. (2004). Best practices–integrated retail replenishment. The Post. 20.
Angerer, A. (2004). "Out of Stock: Ausmaß, Ursachen und Lösungen." Logistik Inside
7(2): 16.
Angerer, A. and D. Corsten (2004). Zum Nutzen der Kunden. Logistik als Motor des
Einzelhandels. Frankfurter Allgemeine Zeitung. Frankfurt.
Anon. (2004). "Organize for efficiency." Supervision 65(10): 25–26.
Anupindi, R. B., Yehuda (1999). "Centralization of stocks: retailers vs. manufacturer."
Management Science 45(2): 178-191.
Arnold, D., H. Isermann, et al. (2004). Handbuch Logistik. Berlin, Springer.
Arthur Andersen LLP (1997). Small store survival: success strategies for retailers.
New York, John Wiley & Sons.
Backhaus, K., B. Erichson, et al. (2003). Multivariate Analysemethoden. Berlin,
Springer.
Balachander, S. and P. H. Farquhar (1994). "Gaining more by stocking less: a
competitive analysis of product availability." Marketing Science 13(1): 3–22.
Bancroft, N. H., H. Seip, et al. (1996). Implementing SAP R/3. Greenwich, Manning.
Bansal, P. and K. Roth (2000). "Why companies go green: a model of ecological
responsiveness." Academy of Management Journal 43(4): 717–736.

192 8. Appendix and References
Bassok, Y. A., Ravi (1999). "Single-period multiproduct inventory models with
substitution." Operations Research 47(4): 632-642.
Baumard, P. and J. Ibert (2001). What approach with which data? In Doing
management research. R.-A. Thiétart. London, SAGE.
Baumgarten, H. and J. Thoms (2002). Trends und Strategien in der Logistik – Supply
Chains im Wandel. Berlin, Technische Universität Berlin.
Baumgarten, H. and S. Wolf (1993). Perspektiven der Logistik: Trend-Analysen und
Unternehmensstrategien. Berlin.
Bearing Point (2003). "Inventory Management 2003: Communication and technology
bear renewed promise." Chain Store Age(Section 2).
Bell, R., R. Davies, et al. (1997). "The changing structure of food retailing in Europe:
the implications for strategy." Long Range Planning 30(6): 853–861.
Bergeron, F., L. Raymond, et al. (1998). The contribution of information technology to
the performance of SMEs: alignment of critical dimensions. Proceedings of the
6th European conference on information systems, Aix-en-Provence.
Bergeron, F., L. Raymond, et al. (2001). "Fit in strategic information technology
management research: an empirical comparison of perspectives." Omega
29(2): 125–142.
Beringe, A. v. (2002). The integrated supply and demand chain. Speech at Sapphire,
Lisbon.
Bernard, P. (1999). Integrated inventory management. New York, John Wiley &
Sons.
Bobitt, H. R. and J. D. Ford (1980). "Decision-maker-choice as a determinant of
organizational structure." Academy of Management Review 5(1): 13–23.
Broekmeulen, R., K. van Donselaar, et al. (2005). An empirical study of ordering
behavior of retail stores. Working paper of the School of Technology
Management, Eindhoven.
Broekmeulen, R., K. van Donselaar, et al. (2004a). Automated Store Ordering: an
enabler for new inventory replenishment strategies in supermarkets. Report of
the Faculteit Technologie Management, Eindhoven.
Broekmeulen, R., K. van Donselaar, et al. (2004b). Excess shelf space in retail
stores: an analytical model and empirical assessment. Beta working paper
series, Eindhoven.

8. Appendix and References 193
Brynjolfsson, E. and L. M. Hitt (1995). "Computers as a factor of production: the role
of differences among firms." Economics of Innovation and New Technology
3(3-4): 183–199.
Brynjolfsson, E. and L. M. Hitt (1998). "Beyond the productivity paradox."
Communications of the ACM 41(8): 49–55.
Cachon, G. (2001). "Managing a retailer's shelf space, inventory and transportation."
Manufacturing & Service Operations Management 3(3): 211–219.
Cachon, G. and M. Fisher (2000). "Supply chain inventory management and the
value of shared information." Management Science 46(8): 1032–1048.
Cadeaux, J. M. (1994). "Flexibility and performance of branch store stock plans for a
manufacturer's product line." Journal of Business Research 29(3): 207–218.
Campbell, D. T. and D. W. Fiske (1959). "Convergent and discriminant validation by
the multitrait-multimethod matrix." Psychological Bulletin 56: 81-105.
Carter, M. W. and C. C. Price (2001). Operations research: a practical introduction.
Boca Raton, CRC Press.
Chagué, V. (1996). "Gérer la technologie dans les PME." Direction Gestion
Enterprises 1996(157): 13–21.
Chan, Y. and S. Huff (1993). Investigating information systems strategic alignment.
Proceedings of the 14th international conference on information systems,
Orlando.
Chang, Y. S. (1967). "Reorder point models with non-decreasing stock-out costs."
Journal of Industrial Engineering 18(6): 365–374.
Chase, C. (1995). "The realities of business forecasting." Journal of Business
Forecasting 14(1): 2 and 26.
Chen, F., Z. Drezner, et al. (2000). "Quantifying the bullwhip effect in a supply chain:
the impact of forecasting, lead time and information." Management Science
46(3): 436–443.
Chircu, A. M. and R. J. Kauffman (2000). "Limits to value in electronic commerce-
related IT investments." Journal of Management Information Services 17(2):
59–80.
Chow, G., T. D. Heaver, et al. (1994). "Logistics performance: definition and
measurement." International Journal of Physical Distribution & Logistics
Management 24(1): 17–28.

194 8. Appendix and References
Chow, G. and L. E. Henriksson (1993). A critique of survey research in logistics.
Working paper 93, Faculty of Commerce and Business Administration,
University of British Columbia.
Christopher, M. (1998). Logistics and supply chain management. London, Pitman
Publishing.
Ciborra, C. U. (2000). From control to drift. Oxford, Oxford University Press.
Closs, D. J., A. S. Roath, et al. (1998). "An empirical comparison of anticipatory and
response-based supply chain strategies." International Journal of Logistics
Management 9(2): 21–34.
Coca-Cola Retailing Research Council (1994). "Measured marketing: a tool to shape
food store strategy."
Connell, J. (2001). "Influence of firm size on organizational culture and employee
morale." Journal of Management Research 1(4): 220–232.
Corsten, D. (2002). Efficient Consumer Response adoption: theory, model and
empirical results. Habilitation, University of St. Gallen.
Corsten, D. and T. Gruen (2004). "Stock-outs cause walkouts." Harvard Business
Review 82(5): 26–27.
Corstjens, M. and P. Doyle (1981). "A model for optimizing retail space allocations."
Management Science 27(7): 822–833.
Cottrill, K. (1997). "Reforging the supply chain." The Journal of Business Strategy
18(6): 35–39.
Coughlan, P. and D. Coghlan (2002). "Action research for operations management."
International Journal of Operations & Production Management 22(2): 220–240.
Cox, K. K. (1970). "The effect of shelf space upon sales of branded products."
Journal of Marketing Research 7(February): 55–58.
Curhan, R. (1972). "The relationship between shelf space and unit sales." Journal of
Marketing Research 9(November): 406–412.
Dagnoli, J. (1987). "Impulse governs shoppers." Advertising Age(11): 93.
Dalrymple, D. J. (1964). "Controlling retail inventories." Journal of Retailing 40(1): 9–
16.
Daugherty, P. J., M. B. Myers, et al. (1999). "Automatic replenishment programs: an
empirical examination." Journal of Business Logistics 20(2): 63–72.
Davenport, T. (2004). "Decision evolution; Automated systems are helping
businesses make decisions more productively and consistently." CIO 18(1): 1.
8. Appendix and References 195
Davis, T. (1993). "Effective supply chain management." Sloan Management Review
4(34): 35–47.
DeHoratius, N. and A. Raman (2002). Inventory record inaccuracy: an empirical
analysis. Working paper, Harvard Business School.
DeHoratius, N. and A. Raman (2005). "Retail performance improvement through
appropriate store manager incentive design: an empirical analysis."
Unpublished paper, University of Chicago.
Densley, B. (1999). The magnificent seven: getting the biggest bang from the ERP
buck. In Proceedings of the first international workshop EMRPS99. J. Eder, N.
Maiden and M. Missikoff. Rome, Istituto de Analisi dei Sistemi ed Informatica:
59–65.
Denzin, N. K. (1978). The research act. A theoretical introduction to sociological
methods. New York, McGraw-Hill Company.
Denzin, N. K. (1989). The research act: A theoretical introduction to sociological
methods. Englewoods Cliffs, NJ, Prentice Hall.
Dewan, S. and C. Min (1997). "The substitution of IT for other factors of production: a
firm-level analysis." Management Science 43(12): 1660–1675.
Dey, I. (1993). Qualitative data analysis: an user-friendly guide for social scientists.
London, Routledge.
Drazin, R. and A. H. van de Ven (1985). "Alternative forms of fit in contingency
theory." Administrative Science Quarterly 30(4): 514–539.
Dreyfus, H. and S. Dreyfus (1986). Mind over machine. New York, Free Press.
Drèze, X., S. J. Hoch, et al. (1994). "Shelf management and space elasticity." Journal
of Retailing 70(4): 301–326.
Dubelaar, C., G. Chow, et al. (2001). "Relationships between inventory, sales and
service in a retail chain store operation." International Journal of Physical
Distribution & Logistics Management. 31(2): 96-108.
Duffy, M. (2004). "How Gillette cleaned up its supply chain." Supply Chain
Management Review 8(3): 20–27.
ECR Europe (2000). Day-to-day category management. Facilitated by Andersen
Consulting, Brussels.
ECR France (2002). Optimal shelves availability. Presentation by the ECR group
Taux de service en linéaire. Glasgow.

196 8. Appendix and References
Eichen, B. F. and S. F. Eichen (2004). dm-drogerie markt: Vendor Managed
Inventory. In Supply Chain Management erfolgreich umsetzen. Grundlagen,
Realisierung und Fallstudien. D. Corsten and C. Gabriel. Berlin, Springer:
175–195.
Eisenhardt, K. M. (1989). "Building theories from case study research." Academy of
Management Review 14(4): 532–550.
Ellinger, A. E., J. C. Taylor, et al. (1999). "Automatic replenishment programs and
level of involvement: performance implications." International Journal of
Logistics Management 10(1): 25–36.
Emmelhainz, M. A., J. R. Stock, et al. (1991). "Consumer responses to retail stock-
outs." Journal of Retailing 67(2): 138–147.
European Logistics Association and A.T. Kearney (1999). Insight to impact: results of
the fourth quinquennial European logistics study. Brussels.
Fafchamps, M., J. W. Gunning, et al. (2000). "Inventories, liquidity and contractual
risk in African manufacturing." The Economic Journal 110(466): 861–893.
Fahrni, F. (1998). TQM in einem technischen Konzern: Unternehmenskultur im
Wandel. In Qualitätsmanagement an der Schwelle zum 21. Jahrhundert. R.
Boutellier and W. Masing. München, Hanser.
Fairris, D. (2004). "Towards a theory of work intensity." Eastern Economic Journal
30(4): 587–602.
Falck, M. (2005). "Automated store-ordering dream can come true." Supply Chain
Technology Software(July/August): 10–12.
Feitzinger, E. and H. L. Lee (1997). "Mass customization art." Harvard Business
Review 75(1): 116–121.
Fiedler, F. E. (1967). A theory of leadership effectiveness. New York, McGraw Hill.
Fiorito, S. S., E. G. May, et al. (1995). "Quick response in retailing: components and
implementation." International Journal of Retail & Distribution Management
23(5): 12–21.
Fischhoff, B. (1994). "What forecasts (seem to) mean." International Journal of
Forecasting 10(3): 387–404.
Fisher, M. (2004). "To me it's a factory. To you it's a store." ECR Journal.
International Commerce Review 4(2): 8–18.
Fisher, M. L., J. H. Hammond, et al. (1994). "Making supply meet demand in an
uncertain world." Harvard Business Review 72(3): 83–93.

8. Appendix and References 197
Fisher, M. L., A. Raman, et al. (2000). "Rocket science retailing is almost here–are
you ready?" Harvard Business Review 78(4): 115–124.
Fleck, J. (1994). "Learning by trying: the implementation of configurational
technology." Research Policy 23(6): 632–652.
Fleisch, E. and C. Tellkamp (2004). "Inventory inaccuracy and supply chain
performance: a simulation study of a retail supply chain." International Journal
of Production Economics 95(3): 373–385.
Friedli, T., S. Billinger, et al. (2005). "Combining action research, grounded theory
and case study research with long term projects." Unpublished paper,
University of St.Gallen.
Galliher, H. P., P. M. Morse, et al. (1959). "Dynamics of two classes of continuous-
review inventory." Operations Research 7(3): 362–384.
Gassmann, O. (1999). "Praxisnähe mit Fallstudienforschung."
Wissenschaftsmanagement 6(3): 11–16.
Gausemeier, J. and G. Gehnen (1998). "Intelligent material flow by decentralized
control networks." Journal of Intelligent Manufacturing 9(2): 141–146.
Glaser, B. and A. Strauss (1967). "The discovery of grounded theory: strategies of
qualitative research." 3(2): 269–270.
Götz, N. D. (1999). Automatische Dispositionssysteme für den Handel. Köln, Josef
Eul.
Grocery Manufacturers of America and Roland Berger (2002). "Full-shelf satisfaction.
Reducing out-of-stocks in the grocery channel. An in-depth look at DSD
categories."
Gronau, N. (2004). Enterprise resource planning und supply chain management.
München, Oldenbourg Wissenschaftsverlag.
Groote, X. d. (1994). Inventory theory: a road map. Unpublished INSEAD teaching
note.
Gruen, T., D. Corsten, et al. (2002). Retail out-of-stock. Research Report, Grocery
Manufacturers of America.
Gudehus, T. (2001). "Optimaler Nachschub in Versorgungsnetzen." Logistik
Management 3(2/3).
Gudehus, T. (2002). Dynamische Disposition. Berlin, Springer.
Gudehus, T. (2004). Logistik – Grundlagen, Strategien, Anwendungen. Heidelberg,
Springer Verlag.
198 8. Appendix and References
Guptill, A. and J. L. J.L. Wilkens (2002). "Buying into the food system: trends in food
retailing in the US and implications for local foods." Agriculture and Human
Values 19(1): 39–51.
Gurbaxani, V. and S. Whang (1991). "The impact of information systems on
organizations and markets." Communications of the ACM 34(1): 59–73.
Hanke, J. E., D. W. Wichern, et al. (2005). Business forecasting. Upper Saddle River,
Prentice Hall.
Hines, P., M. Holweg, et al. (2000). "Waves, beaches, breakwaters and rip currents–
a three-dimensional view of supply chain dynamics." International Journal of
Physical Distribution & Logistics Management 30(10): 827–846.
Hollinger, R. C. and J. L. Davis (2002). National retail security survey 2001.
University of Florida, Department of Sociology and the Center for Studies in
Criminology and Law.
Hong, K. K. and Y. G. Kim (2002). "The critical success factors for ERP
implementation: an organizational fit perspective." Information & Management
40(1): 25–40.
Hopp, A. and G. Arminger (2005). Kundenorientiertes Demand Chain Management
bei Metro: Nutzung von Verkaufsdaten zur Steuerung der Hersteller.
Presentation at the seminar Innovatives Replenishment in der Konsumgüter-
Distribution, Horn.
Horst, F. (2005). "Weniger Verluste in 2004." Retail Technology Journal(3).
Hoyer, W. D. (1984). "An examination of consumer decision making for a common
repeat purchase product." Journal of Consumer Research 11(3): 822–831.
Huber, G. P. (1984). "The nature and design of the post-industrial organization."
Management Science 30(8): 928–951.
Hui, C., S. Lam, et al. (2001). "Can good citizens lead the way in providing quality
service? A field quasi experiment." Academy of Management Journal 44(5):
988–995.
Inderfurth, K. and S. Minner (1998). "Safety stocks in multi-stage inventory systems
under different service measures." European Journal of Operations Research
106(1): 57–73.
Jain, C. L. (2003). "Forecasting errors in the consumers products industry." The
Journal of Business Forecasting Methods & Systems 22(2): 2–4.

8. Appendix and References 199
Jick, T. D. (1979). "Mixing qualitative and quantitative methods: triangulation in
action." Administrative Science Quarterly 24(4): 602-611.
Johansson, U. (2002). "Information technology in supplier-retailer relationships."
Working paper, Institute of economic research, Lund University.
Kahn, K. B. and J. T. Mentzer (1996). "Logistics and interdepartmental integration."
International Journal of Physical Distribution & Logistics Management 26(8):
6–14.
Kallinikos, J. (2004). "Deconstructing information packages. Organizational and
behavioural implications of ERP systems." Information Technology & People
17(1): 8–30.
Karrer, M., T. Placzek, et al. (2004). "Einsatz strategieorientierter
Steuerungsinstrumente in der Logistik. Die Logistik-BSC am Beispiel großer
Handelsunternehmen." Controlling 16(8-9): 503–510.
Katsikea, E. S. and D. A. Skarmeas (2003). "Organisational and managerial drivers
of effective export sales organisations. An empirical investigation." European
Journal of Marketing 37(11/12): 1723–1745.
Keh, H. T. and S. Y. Park (1997). "To market, to market: the changing face of grocery
retailing." Long Range Planning 30(6): 836–846.
Ketokivi, M. A. and R. G. Schroeder (2004). "Strategic, structural contingency and
institutional explanations in the adoption of innovative manufacturing
practices." Journal of Operations Management 22(1): 63–89.
Ketzenberg, M., R. Metters, et al. (2000). "Inventory police for dense retail outlets."
Journal of Operations Management 18(3): 303–316.
Kieser, A. (2002). Organisationstheorien. Stuttgart, W. Kohlhammer.
Klaus, P. (2003). Die wahren Kosten der Logistik. URL: http://www.logistik-
inside.de/sixcms/list.php?page=pg_archiv_heftuebersicht&skip=20, accessed
01.09.2005.
Kling, R. (1996). Computerization and controversy. San Diego, Academic Press.
Körber, H. J. (2003). Die Zukunft des Handels. Presentation at the 20th BVL
Congress, Berlin.
Kotler, P. and F. Biemel (1999). Marketing-Management. Analyse, Planung,
Umsetzung und Steuerung. Stuttgart, Schäffer-Poeschel.
Kotzan, J. A. and R. U. Evanson (1969). "Responsiveness of drug store sales to shelf
space allocations." Journal of Marketing Research 6(November): 465–469.

200 8. Appendix and References
Kowalski, M. (1992). Qualität in der Logistik. Wiesbaden.
Krafcik, J. (1988). "Triumph of the lean production system." Sloan Management
Review 30(1): 41–52.
Krane, S. D. (1994). "The distinction between inventory holding and stockout costs:
implications for target inventories, asymmetric adjustment and the effect of
aggregation on production smoothing." International Economic Review 35(1):
117–136.
Kromrey, H. (2002). Empirische Sozialforschung – Modelle und Methoden der
Datenerhebung und Auswertung. Wiesbaden, Opladen: Leske und Budrich.
Krueckenberg, H. F. (1969). The significance of consumer response to display space
reallocation. Proceedings of the Fall Conference, American Marketing
Association.
Krumbholz, M., J. Galliers, et al. (2000). "Implementing enterprise resource planning
packages in different corporate and national cultures." Journal of Information
Technology 15(4): 267–280.
Kuk, G. (2004). "Effectiveness of vendor-managed inventory in the electronics
industry: determinants and outcomes." Information & Management 41(5): 645–
654.
Kumar, V., B. Maheshwari, et al. (2001). "An investigation of critical management
issues in ERP implementation: empirical evidence from Canadian
organizations." Technovation 23(10): 793–807.
Kurt Salmon Associates (1993). Efficient Consumer Response–enhancing consumer
value in the grocery industry. Washington.
Lamnek, S. (1993). Qualitative Sozialforschung. Weinheim, Beltz PsychologieVerlags
Union.
Lawrence, P. R. and J. W. Lorsch (1967). Organization and environment. Cambridge,
Homewood.
Lederer, A. L. and A. L. Mendelow (1990). "The impact of the environment on the
management of information systems." Information Systems Research 1(2):
205–222.
Lee, H. L. (2001). Ultimate enterprise value creation using demand based
management. Stanford Global Supply Chain Management Forum.
Lee, H. L. and C. Billington (1992). "Managing supply chain inventory: pitfalls and
opportunities." Sloan Management Review 33(3): 65–73.

8. Appendix and References 201
Lee, H. L. and C. Billington (1993). "Material management in decentralized supply
chains." Operations Research 41(5): 835–847.
Lee, H. L., V. Padmanabhan, et al. (1997a). "The bullwhip effect in supply chains."
Sloan Management Review 38(3): 93–102.
Lee, H. L., V. Padmanabhan, et al. (1997b). "Information distortion in a supply chain:
the bullwhip effect." Management Science 43(4): 546–558.
Leidner, D. and S. Jarvenpaa (1995). "The use of information technology to enhance
management school education: a theoretical view." MIS Quarterly 19(3): 265–
291.
Lindman, R. H. (1992). Analysis of variance in experimental design. New York,
Springer.
Malone, T. (1997). "Is empowerment just a fad?" Sloan Management Review 38(2):
45–53.
March, J. G. and J. P. Olsen (1989). Rediscovering institutions. London, Free Press.
Markus, L. M., S. Axline, et al. (2000). "Learning from adopter's experiences with
ERP: Problems encountered and success achieved." Journal of Information
Technology 15(4): 245–265.
Markus, M. L. and T. Cornelius (2000). The enterprise systems experience–from
adoption to success. In Framing the domains of IT research: glimpsing the
future through the past. R. W. Zmud. Cincinnati, Pinnaflex Educational
Resources.
Marshall, C. and G. B. Rossmann (1995). Designing qualitative research. Newbury
Park, SAGE.
Mau, M. (2000). Supply Chain Management. Realisierung von
Wertschöpfungspotentialen durch ECR-Kooperation zwischen
mittelständischer Industrie und Handel im Lebensmittelsektor. Frankfurt
(Main), Fachverlag Moderner Wirtschaft.
McGrath, J. (1982). Dilemmatics: the study of research choices and dilemmas. In
Judgement calls in research. J. E. McGrath, J. Martin and R. A. Kulka.
Newbury Park, Sage: 69–102.
Mentzer, J. T. and K. B. Kahn (1995). "Forecasting technique familiarity, satisfaction,
usage, application." Journal of Forecasting 16(1): 465–476.
Merkel, H. (2003). "Standard-Warenwirtschaftssysteme für den mittelständischen
Einzelhandel." Lebensmittelzeitung 55(25): 95-100.

202 8. Appendix and References
Metaxiotis, K. S., J. E. Psarras, et al. (2003). "Production scheduling in ERP systems.
An AI-based approach to face the gap." Business Process Management
Journal 9(2): 221–247.
Millet, I. (1994). "A novena to Saint Anthony, or how to find inventory by not looking."
Interfaces 24(4): 69–75.
Moon, M. A., J. T. Mentzer, et al. (1998). "Seven keys to better forecasting." Business
Horizons 41(5): 44–53.
Mumford, L. (1934). Technics and civilization. London, Harvest/HBJ.
Myers, M. B., P. J. Daugherty, et al. (2000). "The effectiveness of automatic inventory
replenishment in supply chain operations: antecedents and outcomes."
Journal of Retailing 76(4): 455-481.
Noble, D. (1984). Forces of production: a social history of industrial automation. New
York, Alfred A. Knopf.
O'Leary, D. E. (2000). Enterprise Resource Planning systems: systems, life cycle,
electronic commerce and risk. Cambridge, University Press.
Perrow, C. (1967). "A framework of comparative analysis of organizations." American
Sociological Review 32(2): 194–208.
Petrak, L. (2005). "Dating Game." National Provisioner 219(6): 78–52.
Pfeffer, J. and H. Leblebici (1971). "Information technology and organizational
structure." Pacific Sociological Review 20(2): 241–261.
Pfohl, H. C. (2004). Logistiksysteme. Berlin, Springer.
Pfohl, H.-C. and W. Zöllner (1987). "Organization for logistics: the contingency
approach." International Journal of Physical Distribution & Materials
Management 17(1): 3–16.
Progressive Grocer (1968). "The out-of-stock study." 1–16.
Ptak, C. A. and E. Schragenheim (2000). ERP: tools, techniques and applications for
integrating the supply chain. London, St. Lucie Press/APICS.
Punch, K. F. (1998). Introduction to social research–quantitative and qualitative
approaches. London, SAGE Publications.
Raman, A. (2000). "Retail-data quality: evidence, causes, costs and fixes."
Technology in Society 22(1): 97–109.
Raman, A., DeHoratius, et al. (2001a). "The missing link in retail operations."
California Management Review 43(3): 136–152.

8. Appendix and References 203
Raman, A., N. DeHoratius, et al. (2001b). "The Achilles' heel of supply chain
management." Harvard Business Review 79(5): 25-28.
Rao, P. V. (1998). Statistical research methods in the life sciences. Pacific Grove,
Brooks/Cole Publishing Company.
Ritzman, L. P. and B. E. King (1993). "The relative significance of forecast errors in
multistage manufacturing." Journal of Operations Management 11(1): 51–63.
Roland Berger (2003a). 2003 GMA Logistics Study. GMA publication.
Roland Berger (2003b). ECR–Optimal shelf availability. ECR Europe publication.
Sabath, R. E., C. W. Autry, et al. (2001). "Automatic replenishment programs: the
impact of organizational structure." Journal of Business Logistics 22(1): 91-
105.
Sabherwal, R. and L. Vijayasarathy (1994). "An empirical investigation of the
antecedents of telecommunication-based interorganizational systems."
European Journal of Information Systems 3(4): 268–284.
Sackett, P. R. and J. R. Larson (1990). Research strategies and tactics in industrial
and organizational psychology. In Handbook of industrial and organizational
psychology. M. D. Dunnette and L. M. Houghs. Palo Alto, Consulting
Psychology Press.
Sarpola, S. (2003). Enterprise Resource Planning (ERP) software selection and
success of acquisition process in wholesale companies. Working paper,
Helsinki School of Economics.
Sawyer, S. and R. Southwick (2002). "Temporal issues in information and
communication technology enables organizational change: evidence from an
enterprise systems implementation." Information Society 18(4): 263–280.
Scandura, T. A. and E. A. Williams (2000). "Research methodology in management:
current practices, trends and implications for future research." Academy of
Management Journal 43(6): 1248–1264.
Schneckenburger, T. (2000). Prognosen und Segmentierung in der Supply Chain.
Ein Vorgehensmodell zur Reduktion der Unsicherheit. Dissertation, University
of St.Gallen.
Schonberger, R. I. (1982). Japanese Manufacturing Techniques. New York, The Free
Press.

204 8. Appendix and References
Schoonhoven, C. B. (1981). "Problems with contingency theory: testing assumptions
hidden within the language of contingency 'theory'." Administrative Science
Quarterly 26(3): 672–693.
Schumpeter, J. A. (1935). Theorie der wirtschaftlichen Entwicklung: eine
Untersuchung über Unternehmergewinn, Kapital, Kredit, Zins und den
Konjunkturzyklus. München, Duncker & Humblot.
Shalla, G. (2005). Supply Chain- und Beschaffungsmanagement im Handel am
Beispiel der Globus-Gruppe (WND). Presentation at the University of
St.Gallen.
Sheeber, L., E. Sorensen, et al. (1996). "Data analytic techniques for treatment
outcome studies with pretest/posttest measurements: an extensive primer."
Journal of Psychiatric Research 30(3): 185–199.
Sheer, A. W. and F. Habermann (2000). "Enterprise Resource Planning: Making ERP
a success." Communications of the ACM 43(4): 57–61.
Silver, E., D. Pyke, et al. (1998). Inventory management and production planning and
scheduling. New York, John Wiley & Sons.
Sloot, L., P. C. Verhoef, et al. (2002). The impact of brand and category
characteristics on consumer stock-out reactions. Report, Erasmus Research
Institute of Management.
Småros, J., A. Angerer, et al. (2004a). Logistics processes of European grocery
retailers. Unpublished research project report.
Småros, J., A. Angerer, et al. (2004b). Retailer views on forecasting collaboration.
Logistics Research Network (LRN), Dublin.
Smith, H. W. (1975). Strategies of social research: the methodological imagination.
Englewood Cliffs, Prentice-Hall.
Soh, K., S. S. Kien, et al. (2000). "Cultural fits and misfits: is ERP an universal
solution?" Communications of the ACM 43(4): 47–51.
SPSS Inc. (2003). SPSS Advance Models 12.0, SPSS Handbook.
Staehle, W. H. (1991). Management. München, Franz Vahlen.
Stank, T. P., P. J. Daugherty, et al. (1999). "Collaborative planning: supporting
automatic replenishment programs." Supply Chain Management 4(2): 77–85.
Sterns, K. M., L. S. Unger, et al. (1981). Intervening variables between
satisfaction/dissatisfaction and retail re-patronage intention. In An assessment

8. Appendix and References 205
of marketing thought and practice: 1982 Educators' Conference Proceedings.
B. J. Walker. Chicago, American Marketing Association: 179–182.
Stölzle, W. (2004). "Supply Chain Controlling und Performance Management –
Konzeptionelle Herausforderungen für das Supply Chain Management."
Logistik Management 4(3): 10–21.
Stölzle, W., K. F. Heusler, et al. (2001). "Die Integration der Balanced Scorecard in
das Supply Chain Management- Konzept (BSCM)." Logistik Management 3(2–
3): 73–85.
Stölzle, W., K. F. Heusler, et al. (2004). Erfolgsfaktor Bestandsmanagement. Konzept
– Anwendung – Perspektiven. Zürich, Versus.
Stölzle, W. and T. Placzek (2004). Umsetzung von Optimal Shelf Availability –
Messkonzepte und Standardisierungspotenziale. Presentation at the BVL
congress.
Stratopoulos, T. and B. Dehning (2000). "Does successful investment in information
technology solve the productivity paradox?" Information & Management 38(2):
103–117.
Taylor, J. C. and S. E. Fawcett (2001). "Retail on shelf performance of advertised
items: an assessment of supply chain effectiveness at the point of purchase."
Journal of Business Logistics 22(1): 73–89.
Tellkamp, C., A. Angerer, et al. (2004). "Improving data quality and supply chain
performance with RFID: evidence from the retail industry." IT Cutter 17(9): 19–
24.
Tidd, J. (1993). "Technological innovation, organizational linkages and strategic
degree of freedom." Technology Analysis & Strategic Management 5(3): 273–
284.
Toporowski, W. and B. Herrmann (2003). "Neue Entwicklungen in der Logistik –
Konzepte der Praxis und Beiträge der Wissenschaft." Handel im Fokus, EHI
Newsletter(II).
Ulrich, H. (1981). Die Betriebswirtschaftslehre als anwendungsorientierte
Sozialwissenschaft. In Die Führung des Betriebes. M. N. Geist, R. Köhler and
C. Sandig. Stuttgart, Poeschel: 1–26.
Ulrich, H. (2001). Systemorientiertes Management – Das Werk von Hans Ulrich.
Bern, Paul Haupt.

206 8. Appendix and References
van Donselaar, K., T. van Woensel, et al. (2004). Improvement opportunities in retail
logistics. In Consumer driven electronic transformation: applying new
technologies to enthuse consumers. G. I. Doukidis and A. P. Vrechopolous.
Berlin, Springer.
Vessey, I. (1991). "Cognitive fit: a theory based analysis of the graphs versus tables
literature." Decision Science 22(2): 219–240.
Vessey, I. and D. Galleta (1991). "Cognitive fit: an empirical study of information
acquisition." Information Systems Research 2(1): 63–84.
Vollmann, T. E., W. L. Berry, et al. (1992). Manufacturing planning and control
systems. Homewood, Irwin.
Vossen, M. (2000). Warenwirtschaft. Meilenweit vom Ziel entfernt. Der Handel. 05:
36.
Wacker, J. G. and R. R. Lummus (2002). "Sales forecasting for strategic resource
planning." International Journal of Operations & Production Management
22(9/10): 1014–1031.
Wagner, H. M. (2002). "And then there were none." Operations Research 50(1): 217–
226.
Watson, E. E. and H. Schneider (1999). "Using ERP in education." Communications
of the AIS 1(9): 1-48.
Webb, E. J., D. T. Campbell, et al. (1966). Unobtrusive measures: nonreactive
research in the social sciences. Chicago, Rand McNally.
Weder, M. (2005). Die Logistik der Nestlé Deutschland. Effiziente Replenishment-
Strategien zur Erfüllung der Kunden- und Produktanforderungen. Speech at
the conference "Innovatives Replenishment in der Konsumgüter-Distribution",
Bad Horn.
Wegener, D. (2002). On-shelf-availability. Extent, causes and consequences.
Unpublished diploma thesis, University of St.Gallen.
Womack, J. P. and D. T. Jones (1996). Lean thinking. New York, Simon and
Schuster.
Woods, J. (2002). "SCM5 will drive the next wave of supply chain advantage."
Gartner research note.
Yin, R. K. (1988). Case study research: design and methods. London, Newbury Park.
Zinn, W. and P. C. Liu (2001). "Consumer response to retail stockouts." Journal of
Business Logistics 22(1): 49–71.

8. Appendix and References 207
Zinn, W., J. T. Mentzer, et al. (2002). "Customer-based measures of inventory
availability." Journal of Business Logistics 23(2): 19–44.
Zomerdijk, L. G. and J. d. Vries (2002). "An organizational perspective on inventory
control: theory and a case study." International Journal of Production
Economics 81/82(3): 173–183.
Zuboff, S. (1988). In the year of the smart machine: the future of work and power.
New York, Basic Books.

208 8. Appendix and References
8.3. List of Interviews111
Company Name Position Date Place
Athleticum Sportmarkets
Markus Scheffler Director logistics 23.06.2003 Hünenberg
Athleticum Sportmarkets
Rolf Engler Vice-store manager 01.07.2003 St.Gallen
Athleticum Sportmarkets
Urs Wettstein Product manager 08.07.2003 Hünenberg
BonAppetitGroup Dr. Christian Kubik Director supplier relationship management.
15.09.2003 Winterthur
Camion Tranport Wil
Hanspeter Imbach Director logistics 13.12.2002 Wil
COOP Martin Badertscher Store manager 26.08.2003 Oberriet
COOP Hanspeter Dörig Director category management
12.09.2003 Gossau
COOP Stefan Gächter Director DC-Gossau 17.02.2004 Gossau
17.06.2004 St.Gallen
Denner Arthur Mathys Director logistics 27.02.2004 Zurich
Denner Arthur Mathys Director logistics 04.08.2004 Zurich
Denner Daniel Bucher Store manager 07.08.2004 Walenstadt
Gebrüder Weiss Wolfgang Brunner Information systems 12.12.2002 Altenrhein
Gebrüder Weiss Jürgen Glassner Head of purchasing, central Switzerland
12.12.2002 Altenrhein
Interdiscount Hansjörg Kohli Director item management
26.09.2003 Jegenstdorf
Interdiscount Urs Wilhelm Director communications/PR
26.09.2003 Jegenstdorf
Interdiscount Markus Fitzi Store manager 04.10.2003 St.Gallen
Intersport Germany
Klaus Bader Director logistics 07.07.2003 Heilbronn
Intersport International
Raider Magnus Director logistics 14.07.2003 Ostermundigen
Intersport Magdon Friedrich Magdon Director/store manager 09.07.2003 Kempten
Intersport SFS Ernst Enz Director/store manager 01.07.2003 Widnau
Kaisers Tengelmann
H. Warzecha Logistics manager 04.12.2003 München
Kaisers Tengelmann
H. Ushold Logistics manager 04.12.2003 München
Kaisers Tengelmann
H. Türkyilmaz Store manager 04.12.2003 München
M-Electronics Oliver Muggli Store manager 25.09.2003 St.Gallen
111
Some of the interviews with representatives from GROCO, MYFOOD, NORTHY and DRUCKS are omitted for
confidentiality reasons.

8. Appendix and References 209
Metro Group H. Orbach Logistics manager 11.03.2004 Düsseldorf
Metro Group/Extra H. Rapp Store manager 04.11.2003 Tuttlingen
Migros René Meyer Director logistics 05.09.2003 Zurich
Migros Roland Studer Project-leader logistics 22.09.2003
02.07.2004 Zurich
Migros Guido Federspiel Director logistics (Supply)
18.03.2004 Zurich
Migros Robert Vuilleumier Supply manager hardware
22.09.2004 Zurich
PKZ group Friedhelm Lange Director logistics 28.07.2003 Urdorf
PKZ group Irène Manser Store manager 12.08.2003 St.Gallen
PKZ group Moreno Papes Director purchasing 20.08.2003 Urdorf
PKZ group Konrad Niederhäusern
Store manager 02.09.2003 Zurich
SAF AG Prof. Gerhard Arminger
Scientific advisor 26.02.2004 Tägerwilen
SAP AG Alexander Kunkel Consultant 09.03.2004 Suhr
18.03.2004 Regensdorf
Schild Thomas Herbert Head of purchasing/ material planning
29.08.2003 Luzern
Spar Schweiz Egon Baumgärtner Director logistics 11.09.2003 St.Gallen
Spar Schweiz Kurt Walser Store manager 15.09.2003 St.Gallen
Spar Schweiz Wolfgang Mähr Regional director IT 16.02.2004 Gossau
Valora Group Willy Schmid Director sourcing Switzerland
17.09.2003 Muttenz
Vögele Schweiz Bernhard Westphal Head of material planning
25.07.2003 Pfäffikon
Vögele Schweiz Stefan Widmer Store manager 18.08.2003 St.Gallen
Volg AG Vogler DC director 03.03.2004 Oberwinterthur
Volg AG S. Näf DC vice-director 05.03.2004 Oberwinterthur

210 8. Appendix and References
8.4. Curriculum Vitae
Name Alfred Angerer
Born 19th September, 1974 in Puebla (Mexico)
Education
Oct. 2002 − Dec. 2005 University of St.Gallen (Switzerland)
Doctoral student
Oct. 1995 − Aug. 2001 Karlsruhe University of Technology (Germany)
“Diplom Wirtschaftsingenieurwesen“ (Master in Industrial
Engineering and Business Science)
Oct. 1999 − June 2000 University of Edinburgh (Scotland)
Honour courses in Department of Economics
Sept. 1986 − June 1995 Bodensee Gymnasium, Lindau (Germany)
„Abitur“ (equivalent to A-levels)
Employment
Since Jan. 2006 McKinsey & Company, Munich (Germany)
Supply Chain Management consultant
Oct. 2002 − Dec. 2005 University of St.Gallen (Switzerland)
Research associate
Jan. 2002 – Aug. 2002 Nestlé Germany, Biessenhofen (Germany)
Supply Chain Management trainee
July 2000 – Sept. 2000 Lycos Europe-Bertelsmann, Guetersloh (Germany)
Internship in the Business Development department
Oct. 1996 – Dec. 1999 WebDesign Angerer & Dolling GbR mbH, Karlsruhe
(Germany)
Independent management of an own internet company
May 1999 – June 1999 Broadgate Technology Services, Madras (India)
Internship at software and internet-service provider
July 1997 – Sept. 1997 Siemens AG, Karlsruhe (Germany)
Internship in the department "Sales of Communication
Systems and Networks"