the impact of australia’s fringe benefits tax for cars on ... · the impact of australia’s...
TRANSCRIPT
191
The impact of Australia’s Fringe Benefits Tax for cars on petrol consumption and greenhouse emissions
Diane Kraal*, P.W.Senarath Yapa† and Dianne Harvey#
Petrol consumption has become one of the most important sustainability issues for Australia. The central contention in this article is whether Australia’s current Fringe Benefits Tax (FBT) regime is promoting unnecessary mileage (and use of petrol) in salary packaged vehicles to obtain tax concessions under the FBT “statutory formula method” for cars. This article draws together the results of FBT survey data collected via a questionnaire and from respondents’ websites, which has been analysed by the authors. The evidence assembled generally supports the central contention. We have also reviewed and included commentary on similar studies that support our key claim. The findings are important because the questionnaire responses represent a significant sample. The outcomes of our research provide further support for a call to amend the current FBT legislation and therefore foster more environmentally sustainable car salary packaging polices for Australian business.
* DianeKraal,HonoraryResearchFellow,SchoolofBusiness,LaTrobeUniversity,Australia.
† P.W.SenarathYapa,AssociateProfessorinAccounting,SchoolofAccountingandLaw,RMITUniversity,Australia.
# Dianne Harvey, Senior Lecturer in Accounting, School of Business, La Trobe University,Australia.
Thispaperwasacceptedforpublication20May2008.

192 (2008) 23 AUSTRALIAN TAX FORUM
1. Introduction
Petrolconsumptionhasbecomeasustainabilityissueinrecentyearsbothintermsofitbeingacostlyresourceanditsnegativeeffectongreenhousegasemissionsintotheenvironment.InthisarticleitiscontendedthatthecurrentFringeBenefitsTax(FBT)provisionsforcarsisencouragingemployeestodriveunnecessarymileagein“salarypackaged”vehiclestoobtaintaxconcessionsundertheFBT“statutoryformulamethod”.
TogatherdatatotestthecentralcontentionanonlinequestionnairewasdesignedrequestinggeneralinformationabouttherespondentorganisationinthecontextofFBT,includingqueriesabouttheapplicationoftheFBT“StatutoryFormulaMethod”;therespondentorganisation’senvironmentalconcerns;andarequestforopinionsonthecurrentFBTlegislationoncars.InSeptember2006andagaininFebruary2007ourquestionnairewassentto37Australianuniversities,over100VictorianCityandShireCouncils,andfourVictorianGovernmentdepartments.Surveyorganisationshadthecommonattributeofnothavingsignificantnumbersofexecutivesalesstaff.Thecarspackagedbytherespondentorganisationsareforstaff,whopredominantlyworkintheconfinesofanoffice.Fromtheseorganisationswereceivedatotalof25responsesacrossmetropolitanandregionalAustralia,whichprovided informationon employee driving habits and vehicle data on 2,766 taxpayer/ratepayer fundedcars. The response therefore represents asignificant sample. Asecond set of dataconcerningenvironmentalinformationwasdrawnfromrespondents’websites.
Our analysis provides support for acall to reform of one section of the FBTlegislationandthereforefostermoreenvironmentallysustainablecar“salarypackaging”policesforAustraliangovernmentdepartmentsandbusiness.Ourrecommendation,intermsofaneasymethodtofacilitatethecurbingofexcessivegreenhousegas(CO2)emissionsandfosteringpetrolsavings, isthattheuseofthelogbookbeextended.Itisthemostaccuratemethodforthosegenuinelyclaimingtohavedrivenbusinesskilometres. However, as this method is perceived as cumbersome by business,alternativelyitisrecommendedthatuseofFBT“statutoryrates”forcarsbereformedbyremovingthetaxconcessionatthe15,000kilometrebandandusingthe26percentrate,orusingjustonestatutoryrate,possiblythe20percentrate.
Ourpaperisorganisedasfollows.SectiontwoprovidesthebackgroundtoFBTlegislation. Section three explains the methodology used in this study followed byaliterature review inSection four.SectionsfiveandsixdetailourFBTsurveyandenvironmental survey results and analysis. Section seven summarises the overallresearchfindings.Thefinalsectionpresentsourconclusionandrecommendations.
193The ImpacT of ausTralIa’s frInge BenefITs Tax for cars on peTrol consumpTIon and greenhouse emIssIons
2. BackgroundtoFBTlegislation
The Fringe Benefits Tax Assessment Act was introduced into the Federal taxationsystemin1986.Itwasdesignedtoovercomeproblemswithemployeesvaluingtheiremployerprovidednon-cashbenefitsunders26(e)oftheIncomeTaxAssessmentAct(1936).Undertheoldsectionemployeesfrequentlyvaluedtheirnon-cashbenefitsattoolowavalueandtheresultfortheGovernmentwastaxrevenueleakage.TheFBTlegislationshiftedtheonusofcalculatingandpayingthetaxtotheemployer.Since1986,thereformofFBThasbeenthesubjectofconsiderabledebate,withparticularattention given to its complex compliance requirements including administration,uncertaintyanderrors,inequalitiesandeconomicinefficiencies.1
FBT and cars
Themostpopularformofnon-cashbenefittoemployeesisthecar.2TheFBTlegislationprovidesforthecalculationofafigure(taxablevalue)towhichtheFBTtaxrateof46.5percentisapplied.Therearetwomethodstoderivetaxablevalue;firstlytheuseofalogbook(calledoperatingcost)andsecondly,theuseofpre-set(statutory)rates.Thestatutoryformulamethodisthemostpopularandwasadoptedforitssimplicity.3Theunderlyingassumption for thismethod is that if ahighnumberofkilometresaredriven,thenthecarusageismorelikelytobeforbusinesspurposes.ItwasalsodesignedasanindirectmethodofprovidingsupporttotheailingAustralianmotorvehicleindustryforitwasdevelopedoutofapolicycalledthe“ButtonPlan”namedafterthethenFederalMinisterforIndustryandCommerce,JohnButton.4In1986Australianbuiltcarswereapproximately85percentofthedomesticsales.However,by2004thefiguredroppedtoaround29percentandisoneofourkeyreasonsforconsideringtheFBT“statutoryformulamethod”asanachronistic.5
Some calculations
TableI.belowshowsthatforacarworth$30,000,thetaxsavingsfordrivingfurtherareconsiderable.Forinstanceitshowsthatifacarisdriven15,000perannum,thenataxdiscountof6percentisobtained.
1 Warren,N.,2006,Fringe Benefit Tax Design: decision time,InstituteofCharteredAccountantsinAustralia,Sydney,p8.
2 The most recent comprehensive set of Australian Taxation Office data Taxation Statistics 2005‑2006showsthatinthe2007FBTyearcarswerethemostpopularformoffringebenefitas52,570vehicleswereprovided.comparedto18,620‘expensebenefits,thenextmostcommonbenefit.Seehttp://www.ato.gov.au/corporate/content.asp?doc=/content/00117625.htm.
3 TheFBTlegislationonthestatutoryformulamethodforcarsisatsection9;theoperatingcostmethodisats10.
4 The Button Plan was implemented between 1984 and 1992. The aim was to promote andsupportthedomesticcarindustry.Formoredetailsee:www.aph.gov.au/library/pubs/CIB/1996-97/97cib22.htm.
5 TheButtonPlan isacknowledgedfor itspurposeofassisting thecar industry throughfringebenefitstaxrevenue,seeWarren,N.,2006,Fringe Benefit Tax Design: decision time,p19.

194 (2008) 23 AUSTRALIAN TAX FORUM
TableI.FBTliabilityusingstatutoryformulamethodona$30,000car�
Distance Statutory FBT
Rate Payable
Up to 14,999 km 26% $7,489
15,000 km to 24,999 km 20% $5,760
25,000 km to 39,999 km 11% $3,168
40,000+ km 7% $2,016
Accordingtooursurvey,22outof25respondentsinternallymanagetheirpackagedcars for which they have awritten policy and report acceptable compliance levels.Significantly,15outof25respondentsroutinelyrequestemployeestocheckodometerreadingsneartheendoftheFBTyearandtoincreasekilometresifthenextconcessionaltaxlevelcanbereasonablyattained.Itshouldbenotedthatalthoughmanyexecutivesreceiveafullymaintainedcarasaperquisiteofoffice,manynon-executivestaffarealsoabletoaccesssalarypackagingforacarandagreetoundertaketopaytheFBTbecauseforsome,arbitragecalculationsshowataxsaving.
TableIIbelowprovidesasnapshotofsavingsforemployeeswhochoosetopaywithafter-taxmonies(iethe“contributionmethod”).Atthe15,000kilometrebandataxsaving(basedonarbitrage)canbeobtained.Theincentiveforemployeestodriveforadiscountisconsiderable.Thequestionmightbeaskedabouttheincentivetotheemployertoasktheiremployeestodrivefurther,giventhatsalaryandtaxablefringebenefitshavethesameon-costs.CertainlyforanorganisationthatpaystheFBTfortheirexecutivestaff,TableiiclearlyshowstheFBTsavingforhighermileage.
For non-executive staff, who pay the FBT (or contribution) themselves, manyroutinelycomplaintotheirpayofficeifnoindicationisgivenofwhethertheyhave“their kilometres up” toward the end of the FBT year. Our example is anecdotal;however itcould interestingasthesubjectofafocusgroupifourresearchweretobeextended.
Table2.FBTandPAYGcostsavingat15,000kilometresperannum
StatutoryMethod ContributionMethod
Stat. Rate FBT cost @46.5%
Saving PAYG cost @31.5%
Saving
14,999kms 26% 7,488 2,457
15,000-24,999kms 20% 5,760 1,728 1,890 567
6 ThestatutoryformulaforcalculatingFBTliabilityis:ValueofcarxStatutoryFractionxGross-upratexDaysHeld/DaysinFBTyearxFBTrate.Fora$30,000carwith13,000kmsperannumandheldfor365days,thecalculationis:$30,000x26%x2.0647x365/365x46.5%=$7,489.

195The ImpacT of ausTralIa’s frInge BenefITs Tax for cars on peTrol consumpTIon and greenhouse emIssIons
TableIIIbelowshowsthegreenhousegasemissioncost thatcomeswithincreasedmileage. If an average car (with fuel economy of 11 litres/100kms) travels 15,000kilometres per year, it emits 4.4 tonnes of carbon dioxide.7 If mileage is reduced,bysay3,700kilometres/pa, then therecouldbeareductionof1 tonneofC02andpetrolsavingsof$525(407litresx$1.29).
TableIII.Estimatedannualgreenhouseemissionsforanaveragecar.
Petrol
Kms Litres CarbonDioxide(CO2)
15,000 1650 4.4 tonnes
3,700 407 1 tonne
3. Methodology
ThecompleteFBTquestionnairecanbeseenatAppendix1.Themainanalysiswasdividedbetweentwosetsofquestionnairedata,firstlyresponsesabouttheapplicationoftheFBT“StatutoryFormulaMethod”andsecondly,therespondentorganisations’environmental concerns. For the first part on the FBT statutory formula method,responseswerecollated(suchasnumberofcarsperlocation)andgraphedfortrends.Thequestionnairehadarangeofquestionsaboutpercentageofcarsperpricecategoryandmileagedriven.Tablesweresetupinanexcelspreadsheettoderivetheaveragenumberofcarsperpricecategoryandmileagedriven.Thesewerealsographedforcommentaryontrendsandtoprovideaprofileonthedifferentrespondents’carsalarypackagesaroundAustralia.
Inthesecondpartofthequestionnaire,respondentswereinvitedtoprovidedetailsoftheirenvironmentalconcerns(greenhouseemissions,environmentalpoliciesandreportsetc).Manyrespondentsindicatedtheavailabilityofenvironmentalinformationontheirorganisationalinternetwebsites.Onvisitingthesesiteswefoundthattheywereinvaluableforadditionalinformationrelevanttoourinvestigation.
Thespecialcasestudyon“CarKilometres”wasundertakenasadirectmeansoftesting the central contention. Six respondents offered further data (outside of thequestionnaire)oncarmileagesfortheirsalarypackagedcars.Thedataweregraphedtodetermine thepercentageofcarwithmileagesator justover15000,25000and40000kilometres,thepointsatwhichanFBTconcessionapplies.
7 For a calculator to determine tonnes of greenhouse per kilometres driven, see http://www.greenfleet.com.au/ssl/treetotaller/treetotaller.htm.

196 (2008) 23 AUSTRALIAN TAX FORUM
Thesecondsetofdatafromthewebwasanalysedusingcontentanalysis,whichhasbeenbroadlyusedinstudiesontheareasofsocialandenvironmentalaccountingresearch (eg Abbott & Monsen, 1979;8 Ernst and Ernst, 1978;9 Ingram & Frazier,1980;10 Guthrie & Mathews, 1985;11 Guthrie & Parker, 1990;12 Hackston & Milne,1996;13Tilt,2001,14Yapaetal.,200515).Thetypeofcontentanalysisusedinthisstudyinvolvedcategorisingtheenvironmentalinformationbasedonourresearchquestionfoundontheweb.Thematerials/datawerethenmeasuredusingnumberofsentencescontainedinthereports.Consequently,aseriesofcategoriesofenvironmentalissuesweredevelopedandgraphed.16
4. Literaturereview
MuchhasbeenwrittenonproblemsassociatedwithFBTincludingthemanner inwhichthistaxisimplemented,timingissuesassociatedwithcollectionofthetaxandparticularly the negative environmental affects arising from the statutory formulamethodforcars.
Submissions for review of FBT have been regularly made ever since it wasintroducedin1987.TheTaxationLawsAmendment(FringeBenefitsTaxMeasures)Act 1992 introduced the first major change in the scheme of calculation of FBTpayable.Subsequently, thereweresubstantialreforms in1994and1995containingrecommendations concerning the redesign of FBT. In addition to fringe benefitgrossing up introduced in April 1994 and FBT made deductible, the 1995 budget
8 Abbott,W.F.,Monsen,R.J.“Onthemeasurementofcorporatesocialresponsibility:selfreporteddisclosuresasamethodofmeasuringcorporatesocialinvolvement,”Academy of Management Journal,22(3)1979,501-15.
9 Ernst & Ernst, Social Responsibility Disclosure, 1978 Survey, (Cleveland, Ohio: Ernst andErnst,1978).
10 Ingram,R.W.,Frazier,K.B.,“EnvironmentalPerformanceandcorporatedisclosure,”Journal of Accounting Research,18,(2)1980,614-621.
11 Guthrie,J.,Mathews,M.R.,“CorporatesocialaccountinginAustralasia,”Research in Corporate Social Performance and Policy,7,1985,251-77.
12 Guthrie, J., Parker, L.D., “Corporate social disclosure practice: a comparative internationalanalysis,”Advances in Public Interest Accounting,3,1990,159-75.
13 Hackston, D., Milne, M.J., “Some determinants of social and environmental disclosures inNewZealandcompanies,”Accounting, Auditing & Accountability Journal,9(1),1996,77-108.
14 Tilt, C.A., “The content and disclosure of Australian corporate environmental policies,”Accounting,Auditing&AccountabilityJournal,14(2),2001,190-211.
15 Yapa. P.W.S, D. Harvey & G. Ellis (2005), Disclosure of Environmental Policies in AnnualReports,Journal of Asia Pacific Business,TheHaworthPressInc,NY,Vol.6.Issue1,pp75-90.
16 These categories are based on ‘Company Environmental Reporting’ which was producedby SustainAbility and published by the United Nations (there are 88 categories). However,wefoundthefollowingcategoriesasimportant:environmentalpolicy,legalcompliance,wastes,spills,noise, environmentalmanagement systems, riskmanagement, environmentalauditing,goalsandtargets,airemissions,environmentalspending,environmentalcostaccounting,landcontaminationandremediation.

197The ImpacT of ausTralIa’s frInge BenefITs Tax for cars on peTrol consumpTIon and greenhouse emIssIons
introduced two changes which directly impinge upon the calculation of fringebenefits.ThefirstwastheMedicarelevyincreaseto1.5percentwithaconsequentialflowontoincreasetheFBTrateto48.5percent.Thenewrateappliedinfullfrom1996/97 fringe benefit year, with aproportionally increased rate of 48.475percentfor the 1995/96 fringe benefits year. The second change which affected the cost ofprovidingfringebenefitsrelatestothechangeintherateofcompanytax(increasefrom 33percent to 36percent). While this did not directly impact on the FBTpayable, ithadanindirecteffectonthetaxcosttoacorporateemployerprovidingthefringebenefit,asthecompanytaxratewoulddeterminethevaluetotheemployerin terms of income tax saving from the deduction for FBT paid.17 In 1999, theRalphReviewofBusinessTaxationrecommendedmajorstructuralreformstoFBT.These recommendations included the transfer of tax liability for fringe benefits toemployees[stillbeingdebated];nondeductibilityofbusinessentertainmentexpenses;onpremises car parking and valuation of car benefit were presented as pivotal toreformFBT.18SincethentherehavebeennumerousrecommendationsinthisareabyCPAAustralia,TheInstituteofCharteredAccountants,theLawCouncilofAustralia,tonameafew.19
Warren’s2006studyconsideredthetraditionalcriteriaforgoodtaxpolicy,includingrevenueneutrality,equity,efficiencyandsimplicityasrelevantindeterminingwhetherinfactthereisaneedforreformintheareaofFBT.Warrenmadecallsforreformonissuesincludingtaxingfringebenefitsinthehandsoftheemployee;andvaluingallbenefitsatcost,ratherthanconcessionally–suchasmotorvehicles.Warrenmakesthepointthat“thehesitancyofthegovernmentinrecentyearstoentertainalternativeapproachestotaxingfringebenefitshasbeen…influencedinpartbythebudgetarycost of such reforms and the already concessionary treatment of some fringebenefits”.20It isnow2008andstill thegovernmentofthedayhasmadenogesturetowardreform.LittledidWarrenrealise(oranyoneelse)in2006abouttheproblemofrisinggreenhousegases.In2008budgetarycostofFBTchangeisnowrelegatedtoaminorissue;andoutdated,FBTlegislationpromotingnegativetaxpayerbehaviourattheexpenseoftheenvironmentisnowamajorissue.
The second category of literature concerns two public enquiries into resourcesustainability and reinforces research such as ours, on how tax policy must takeaccountofenvironmentalissues.InFebruary2007aFederalSenateinquirypublishedareportintoAustralia’sfutureoilsuppliesentitledAustralia’sFutureOilSupplyandAlternativeTransportFuels.21
17 Fisher,R.(1995)ThechangingfaceofFBT,The CCH Journal of Australian Taxation,Vol.7,Issue,4August/September.
18 FBT recommendations of the Ralph Review of Business Taxation: a Tax System Redesigned(1999),s5.
19 Warren,N.,2006,Fringe Benefit Tax Design: decision time,p8.20 Ibid.p.8.21 Australia’s Future Oil Supply and Alternative Transport Fuels(StandingCommitteeonRuraland
RegionalAffairsandTransport,Canberra:2007.)
198 (2008) 23 AUSTRALIAN TAX FORUM
TheCommitteerecommended“thatthegovernmentreviewthe[FBT]statutoryformula…”Itstatedthat“concessionarytreatmentofFBTencouragescaruse”andalso“encouragescaruseforpeakhourcommuting.”22(ThechairoftheCommitteewasBillHeffernan,SenatorforNewSouthWales.)TheotherrecentenvironmentalFederalinquiryresultedinthe2005reportSustainabilityCities,whichrecommendedthatthe“AustralianGovernmentreviewthecurrentFBTconcessionsforcarusewithaviewtoremovingincentivesforgreatercaruse...”23
The next available literature focuses on the environmental impact of highgreenhousegasemissionproductsincludingfuelandtheneedtomanagetheimpactof gases and other pollutants during aperiod of global climate change.24 In 2007The Age newspaper presented an editorial by Kenneth Davidson on the effects ofextending freeways without providing any infrastructure for public transport tooutlyingsuburbanareasofVictoria.Withthecostoffuel increasingandincreasedcongestionincityareas,Davidsonemphasisedtheneedtoreducecaruseratherthanencourageitwithgreaterfreewayaccess.Healsorecommendedthe“eliminationoftheFringeBenefitsTaxformotorvehiclesthatsubsidises40percentofpeak-hourcartravel”.25InthesameyearareportbyWilliamBirnbauerinTheAgedescribedtheLondonexperiencewheremotoristspayasurchargetotravelinthecityduringpeakperiods.Heclaimedthesurchargetogetherwithpenaltiesforbreakingthislawhasleadtoareductionincongestionand“reducedemissionsby13-15percent”.26
AnotherAgearticlein2006byBrianBuckley,apublicaffairsconsultant,concernedthe manner in which FBT distorts the fuel market with tax breaks, subsidies andtaxpayer-funded incentives. He claimed that FBT and the concessions it affordsunderthestatutoryformulamethodare“encouragingcongestion,fueluseandroadwear”.27HefurtherdescribedthesituationwherecarholderssubjecttotherulesofFBTlendtheircarstoneighboursandfriends“togetthekilosup”.28A2007articleinTheAgebyKennethDavidsontargetedFBTclaimingthatit“exacerbatesgreenhousegasemissions”.29Thisarticlealsoreferredtoourresearchandourresultswithinthispaper.ItisinthiscategoryoftheunintendedenvironmentaleffectsofFBTthatweseeourresearchasmakingacontribution.
22 Ibid.p.160.Seeparas8.89and8.91.23 Sustainable Cities(HouseofRepresentatives’StandingCommitteeonEnvironmentandHeritage,
Canberra:2005).Seep77,para5.79.24 See for example “Submission to the Emissions Trading Task Group” , Business Council of
Australia,March2007.25 Davidson.K,“OurPetrolProblemsareaboutPeakOil,notSnakeOil,”The Age,June14,2007.26 Birnbauer,W,“Congestion:therecouldbeapricetopay,”The Age,February11,2007.27 Buckley, B, “Federal and State Governments responsible for huge distortions in Transport
market,”The Age,September29,2006.28 Ibid.29 Davidson,K,Fringe Benefit that exacerbates greenhouse gas emissions is a march of folly”,TheAge,
October15,2007.

199The ImpacT of ausTralIa’s frInge BenefITs Tax for cars on peTrol consumpTIon and greenhouse emIssIons
Duringthecourseofourresearch,wehavewrittentovariousmembersofFederalParliamentinAustraliaseekingtheirviewsonthepossibilityofreformintheareaofFBTforcarsinthecontextofsustainability.OurinitialcommunicationwasinresponsetoaninvitationfromthethenTreasurer,PeterCostello,tobusinessgroupsandthegeneral community for contributions to priorities for the 2007/08 Federal Budget.WeofferedacontributionintheareaofFBTcarstatutoryformulamethodtaxationreform. The Hon. Peter Dutton MP (former Minister for Revenue and AssistantTreasurer) responded. However, his letter did not address the need to review FBTlegislationtofostermoreenvironmentallysustainablecarsalarypackagingpoliciesforbusinessbutrathertheresponsewasnegativetoourrequestforreformstating“itisunreasonable toassume,other thanat themargin, thatemployeeswill travelextrakilometresinordertoreachalowerstatutorypercentage…asthecostofoperatingthevehicleandthetimerequiredbytheindividualtodrivetheextrakilometresmaynotmakeadditional travel toreachalowerstatutorypercentageworthwhile.”30DuttonfollowedonwithanotherletterinAugust2007thatoutlinedthewaysinwhichthe(then)governmentwasinvestigatingalternativefuelsandothermeansofsustainabletransport.31Inourview,theformerHowardGovernmentinadequatelyaddressedtheon-goingissueofsustainability,greenhousegasemissionsandthemannerinwhichthecurrentFBTlegislationexacerbatestheseproblems.
OursamelettertoDuttonwasalsosenttotheKevinRudd,thethenLeaderoftheOppositionandPeterGarrett,thethenLabourmemberforKingsfordSmithandShadowMinisterforClimateChange,Environment,HeritageandtheArts.Wearecurrently awaiting areply from these politicians.32 The next section analyses thedetailedFBTsurveyresults.
30 LettertoDianeKraalfromtheHon.PeterDutton,MinisterforRevenueandAssistantTreasurer,10May,2007.
31 LettertoDianeKraalfromtheHon.PeterDutton,MinisterforRevenueandAssistantTreasurer,13August2007.
32 DianeKraallettertoPeterGarrett,MP,LabourMemberforKingsfordSmith,ShadowMinisterforClimateChange,Environment,HeritageandtheArts.,4September2007;DianeKraallettertoKevinRudd,MP,LeaderoftheOpposition,31July2007.
200 (2008) 23 AUSTRALIAN TAX FORUM
5. DetailedFBTsurveyresultsandanalysis
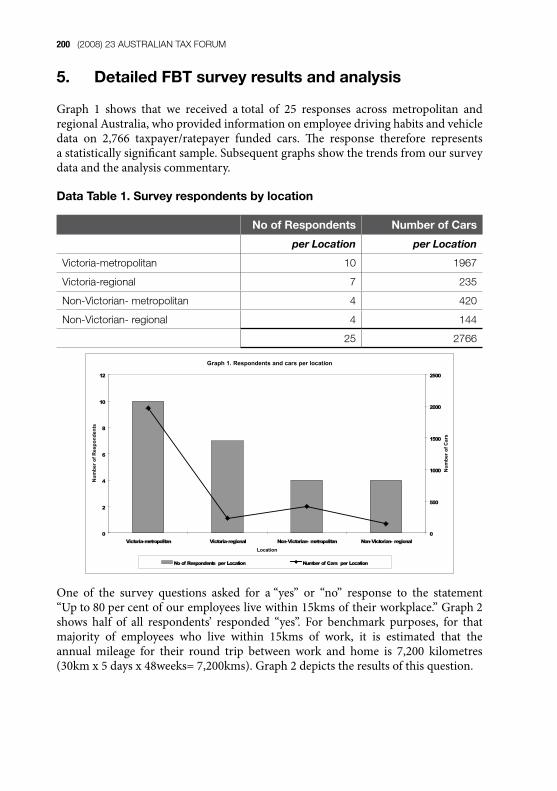
Graph 1 shows that we received atotal of 25 responses across metropolitan andregionalAustralia,whoprovidedinformationonemployeedrivinghabitsandvehicledata on 2,766 taxpayer/ratepayer funded cars. The response therefore representsastatisticallysignificantsample.Subsequentgraphsshowthetrendsfromoursurveydataandtheanalysiscommentary.
DataTable1.Surveyrespondentsbylocation
NoofRespondents NumberofCars
per Location per Location
Victoria-metropolitan 10 1967
Victoria-regional 7 235
Non-Victorian- metropolitan 4 420
Non-Victorian- regional 4 144
25 2766
Graph 1. Respondents and cars per location
0
2
4
6
8
10
12
Victoria-metropolitan Victoria-regional Non-Victorian- metropolitan Non-Victorian- regionalLocation
Num
ber o
f Res
pond
ents
0
500
1000
1500
2000
2500
Num
ber o
f Car
s
No of Respondents per Location Number of Cars per Location
One of the survey questions asked for a“yes” or “no” response to the statement“Upto80percentofouremployeeslivewithin15kmsoftheirworkplace.”Graph2shows half of all respondents’ responded “yes”. For benchmark purposes, for thatmajority of employees who live within 15kms of work, it is estimated that theannual mileage for their round trip between work and home is 7,200 kilometres(30kmx5daysx48weeks=7,200kms).Graph2depictstheresultsofthisquestion.

201The ImpacT of ausTralIa’s frInge BenefITs Tax for cars on peTrol consumpTIon and greenhouse emIssIons
DataTable2.Employees’residentialdistancefromwork
LocationofRespondent Doupto80%ofemployeeslivewithin15kmsofworkplace?
Yes No
Victoria-metropolitan 5 4
Victoria-regional 0 6
non-Victorian – metropolitan 2 1
non-Victorian – regional 4 0
11 11
Graph3showsthatrespondentemployersinmetropolitanareashavethelargestnumberof packaged cars. This data is supported by the generally accepted fact that salarypackagesofferedinmetropolitanareasaremorelucrative.Theironyisthatmetropolitanlocationshavesuperiorpublictransport,sodespitethebetterinfrastructure,packagedcarscanbeseenasanimportantbenefittourbanemployees.
0
1
2
3
4
5
6
7
8
9
Num
ber p
er R
espo
nden
t Cat
egor
y
Victoria-metropolitan Victoria-regional Non-Victorian- metropolitan Non-Victorian- regional
Location of Respondent
Graph 2. Employees' residential distance from work?
>15km
<15 km

202 (2008) 23 AUSTRALIAN TAX FORUM
DataTable3.Averagenumberofsalarypackagedcarsperlocation
LocationofRespondent AverageNumberofCarsperLocation
Victoria-metropolitan 197
Victoria-regional 34
Non-Victorian- metropolitan 105
Non-Victorian- regional 36
A special Case Study for six respondents’ salary-packaged cars was undertaken.Thedatarepresentedmileagefrom1,250carsfromacrossAustralia,bothmetropolitanandregionalareas.
Graph 3.1 shows the annual travel for each car plotted against number of carsin order of increasing distance (kilometres). Ordinarily one would expect that thedata would be represented by asmooth upward curve. However, the data showsaflatteningoutatthreedistinctmileagepoints.Thedataplottedclearlyshowsthat20percentofthecardrivershaveaimedtoreachthenecessarykilometrestotheFBTcarconcessionpointsof15,000km,25,000kmand40,000km–andwithnoregardforpetrolcostorCO2emissions.FinalmileagereadingsattheendofeachFBTyeararetakenfromsignedDeclarationsbythedrivers,or fromthe lastavailablepetrolvoucher,andarethusquitereliable.Clearlythetaxsystemisprovidingtheincentiveforthisaberrantbehaviour.
Graph 3. Averagenumber of salary-
packaged cars per location
Victoria-metropolitan
Victoria-regional
Non-Victorian-metropolitan
Non-Victorian- regional

203The ImpacT of ausTralIa’s frInge BenefITs Tax for cars on peTrol consumpTIon and greenhouse emIssIons
HowGraph3.1wasconstructed
Welistedallvehicles’mileagefromlowesttohighestandgraphedthedata.Toestimatethe number of drivers increasing their travel to get to the 15,000km, 25,000km and40,000kmpoints,trend-lineanalyseswereundertakenofthecurvebeforeandaftereachpointwhereFBTconcessionsavailable.Thesetrend-lineswereextrapolatedupwardsanddownwardsto15,000km,25,000kmand40,000km.Forexample,atthe25,000kmmark atrendline between 21,000km and 27,999 was calculated using the MicrosoftExcelregressionalgorithm.Thislinewasextrapolatedtothe25,000kmmark.
TheresultsofthetrendlineanalysisaresummarisedonTable3.1below.
Table3.1.Numberandpercentageofcasestudycarsdrivenunnecessarykilometres
FBTConcessionPoints NumberofVehicles PercentagethatDrivetogetTaxConcessions
15,000 kilometres 86 6.9%
25,000 kilometres 134 10.7%
40,000 kilometres 17 1.4%
Total 1250 19.0%
Graphs4 to10 that followprovideaprofileof respondents’ salarypackagecars intermsofpricerangeandkilometresdriven.
CASE STUDY- CAR KILOMETRES -
0
10,000
20,000
30,000
40,000
50,000
60,000
0 100 200 300 400 500 600 700 800 900 1000 1100 1200 1300NUMBER OFCARS
KM
STR
AVE
LLED
FBT Tax Concession
6.9% %4.1%7.01
Total cars with unnecessary mileage: 19.0%
15,000 km
40,000 km
25,000 km
Graph 3.1

204 (2008) 23 AUSTRALIAN TAX FORUM
Graph4showsthatforMelbournemetropolitanemployeesthemostdominantpricedcaristhe$29,000to$36,000range.Thisislikelytobeastandardsixcylindercar. For all other locations acar priced less than $29,000 is preferred. The mainaberrationtothistrendisthenon-Victorianmetropolitanemployee,whopackagesacar in the $38,000 to $38,500 range. The car is likely to be ahigher powered,four-wheeldrive.
DataTable4.Averageno.Ofcarsperpricerange
LocationofRespondent <29K $29K-3�K
$3�-$37.5K
$37.5-$38K
$38K-$38.5K
$38.5K+
melbourne – metropolitan 56 72 24 18 18 33
melbourne – regional 31 5 3 1 0 3
non-Victorian –metropolitan 34 19 10 24 31 16
non-Victorian – regional 20 12 3 0 1 2
Graph 5 shows that in the <$29,000 price range most salary packaged cars weredrivenmorethan15,000kilometresperannum,AtypicalcarmightbeaFordFocusGhiawith fuel economyof9 litres/100kms. InGraph4 (previouslydiscussed)allrespondentswiththeexceptionofmetropolitanMelbournefavourthecheaplypriced<$29,000car.Graph5showstheirtravelofthedominantgroupswasspreadbetween15,000<40,000kilometresperannum.
Graph 4.Average number of cars per price range
0
10
20
30
40
50
60
70
80
<29K $29K-36K $36-$37.5K $37.5-$38K $38K-$38.5K $38K+Price Range
Num
bero
fCar
s
Melbourne - Metropolitan Melbourne - Regional Non-Victorian -Metropolitan Non-Victorian - Regional

205The ImpacT of ausTralIa’s frInge BenefITs Tax for cars on peTrol consumpTIon and greenhouse emIssIons
DataTable5.Averageno.Ofcarspriced<$29,000&‘000kilometrestravelled
LocationofRespondent <15kms 15<25kms 25<40kms >40kms
melbourne – metropolitan 16 15 14 11
melbourne – regional 2 9 4 16
Non-Victorian -Metropolitan 3 11 19 2
non-Victorian – regional 4 9 1 6
Graph 5. Average number of cars priced < $29K & kms travelled
0
2
4
6
8
10
12
14
16
18
20
<15kms 15<25kms 25<40kms >40kms'000 of kms
Ave
rage
num
bero
fcar
s
Melbourne - Metropolitan Melbourne - Regional Non-Victorian -Metropolitan Non-Victorian - Regional
Graph 6 shows that for cars in this price range Victorian metropolitan employeespredominantly travelled 15 to 25,000 kilometres per annum. Atypical car mightbeaFordFalconXTwithfueleconomyof10.7litres/100kms.PreviouslyGraph4showedthatthispricerangeisthemostfavouredforthiscohortofemployees.Inthisprice range, non-Victorian metropolitan and regional employees mostly travelledbetween25to40,000kilometresperannum.
DataTable�.Averagenumberofcarspriced$2�001-$3�K&‘000kilometrestravelled
LocationofRespondent <15kms 15–25kms 25–40kms >40kms
melbourne – metropolitan 10 23 18 21
melbourne – regional 0 0 3 2
Non-Victorian -Metropolitan 1 5 12 1
non-Victorian – regional 1 2 8 0

206 (2008) 23 AUSTRALIAN TAX FORUM
Graph 6. Average number of cars priced $26-$36K & kms driven
0
5
10
15
20
25
<15kms 15<25kms 25<40kms >40kms'000 of kms
Num
bero
fCar
s
Melbourne - Metropolitan Melbourne - Regional Non-Victorian -Metropolitan Non-Victorian - Regional
Withinthissample,anychangestoFBTstatutoryfractionwouldhaveaconsiderableeffectonthecostofcartravelforVictorianmetropolitanemployees.ThecurrentFBTstatutoryfractionsareshowninDataTable6.1:
DataTable�.1
Kilometres StatutoryFraction
<15kms 0.26
15-25kms 0.20
25-40kms 0.11
>40kms 0.07
AnFBTtaxconcessionof6percentisgiventoemployeeswhotravel15,000kilometresbutlessthen25,000kilometresperannum.AnexampleoftheFBTcostsavingsona$34,000carwithtwodiffering“statutoryfractions”is:
$34,000 car x 0.26 statutory fraction x 2.0647 gross -up x 46.5% tax = 8,488
$34,000 car x 0.20 statutory fraction x 2.0647 gross -up x 46.5% tax = 6,528
fBT savings for higher mileage 1,960
Simplyput,thesampledVictorianmetropolitanemployerssave$1,960percarintaxbyallowingextrakilometresoftravel.ItisrecommendedthatuseofFBT“statutoryrates”forcarsbereformedbyremovingthetaxconcessionatthe15,000kilometreband and using the 26percent rate, or using just one statutory rate, possibly the20percentrate.
207The ImpacT of ausTralIa’s frInge BenefITs Tax for cars on peTrol consumpTIon and greenhouse emIssIons
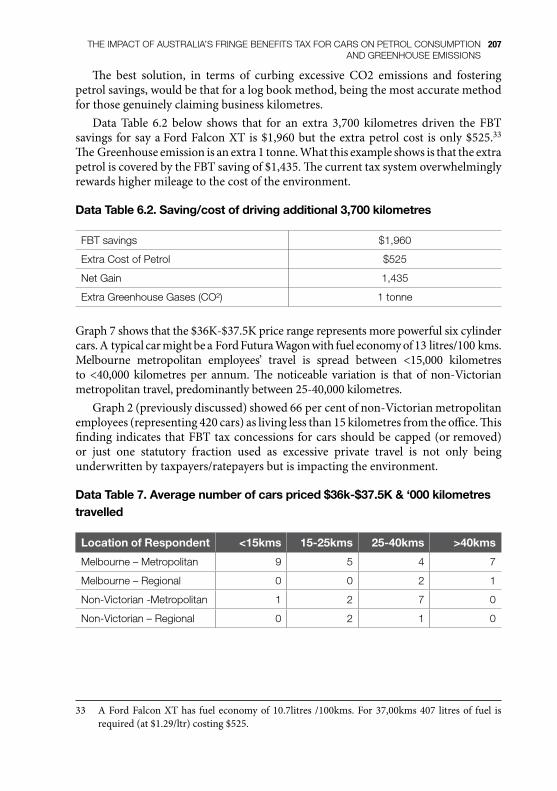
The best solution, in terms of curbing excessive CO2 emissions and fosteringpetrolsavings,wouldbethatforalogbookmethod,beingthemostaccuratemethodforthosegenuinelyclaimingbusinesskilometres.
Data Table 6.2 below shows that for an extra 3,700 kilometres driven the FBTsavings forsayaFordFalconXTis$1,960but theextrapetrolcost isonly$525.33TheGreenhouseemissionisanextra1tonne.WhatthisexampleshowsisthattheextrapetroliscoveredbytheFBTsavingof$1,435.Thecurrenttaxsystemoverwhelminglyrewardshighermileagetothecostoftheenvironment.
DataTable�.2.Saving/costofdrivingadditional3,700kilometres
fBT savings $1,960
Extra Cost of Petrol $525
net gain 1,435
extra greenhouse gases (co²) 1 tonne
Graph7showsthatthe$36K-$37.5Kpricerangerepresentsmorepowerfulsixcylindercars.AtypicalcarmightbeaFordFuturaWagonwithfueleconomyof13litres/100kms.Melbourne metropolitan employees’ travel is spread between <15,000 kilometresto <40,000 kilometres per annum. The noticeable variation is that of non-Victorianmetropolitantravel,predominantlybetween25-40,000kilometres.
Graph2(previouslydiscussed)showed66percentofnon-Victorianmetropolitanemployees(representing420cars)aslivinglessthan15kilometresfromtheoffice.Thisfinding indicates thatFBTtaxconcessions forcarsshouldbecapped(orremoved)or just one statutory fraction used as excessive private travel is not only beingunderwrittenbytaxpayers/ratepayersbutisimpactingtheenvironment.
DataTable7.Averagenumberofcarspriced$3�k-$37.5K&‘000kilometrestravelled
LocationofRespondent <15kms 15-25kms 25-40kms >40kms
melbourne – metropolitan 9 5 4 7
melbourne – regional 0 0 2 1
Non-Victorian -Metropolitan 1 2 7 0
non-Victorian – regional 0 2 1 0
33 AFordFalconXThas fueleconomyof10.7litres /100kms.For37,00kms407 litresof fuel isrequired(at$1.29/ltr)costing$525.

208 (2008) 23 AUSTRALIAN TAX FORUM
Graph 7. Average number of cars priced $36-37.5K & kms travelled
0
1
2
3
4
5
6
7
8
9
10
<15kms 15<25kms 25<40kms >40kms'000 of kms
Num
bero
fcar
s
Melbourne - Metropolitan Melbourne - Regional Non-Victorian -Metropolitan Non-Victorian - Regional
Graph 8 shows that for the $37.5K -$38K price bracket of cars, similar trends areobserved as in Graph 7. Atypical car might be aMitsubishi Pajero RV6 with fueleconomyof14.5litres/100kms.
DataTable8.Averagenumberofcarspriced$37.5-$38K&‘000kilometrestravelled
LocationofRespondent <15kms 15-25kms 25-40kms >40kms
melbourne – metropolitan 10 2 6 0
melbourne – regional 0 0 1 1
Non-Victorian -Metropolitan 0 6 18 0
non-Victorian – regional 0 0 0 0
Graph 8. Average number of cars priced $37.5-$38 & kms travelled
0
2
4
6
8
10
12
14
16
18
20
<15kms 15<25kms 25<40kms >40kms'000 of kms
Num
bero
fcar
s
Melbourne - Metropolitan Melbourne - Regional Non-Victorian -Metropolitan Non-Victorian - Regional

209The ImpacT of ausTralIa’s frInge BenefITs Tax for cars on peTrol consumpTIon and greenhouse emIssIons
Graph9showsthatthehigherprice-bracketcarisdominatedby(statistically)wellpaidmetropolitanemployees,whotravelbetween25-40,000kilometres.Itisalsothemostpopularprice range fornon-Victorianmetropolitanemployees.Atypical carmightbeaMazda6HatchDSLwith fueleconomyof9.5 litres/100kms.Morethanhalf this cohortof respondents lives less than15kilometres from theirworkplace.Aspreviouslymentioned,aroundtripbetweenworkandhomeis7,200kilometresannually(30kmx5daysx48weeks).Thequestioniswhethertheseratepayer/taxpayer-fundedemployeesareactuallydrivingtheextrakilometresforworkpurposes.
Both employers and employees can purchase carbon off-sets for their carbonemissions through schemes such as tree planting. However these types of off-setschemesonlygopartofthewayinaddressinggreenhouseemissions.
DataTable9.Averagenumberofcarspriced$38-38.5K&‘000kilometrestravelled
LocationofRespondent <15kms 15-25kms 25-40kms >40kms
melbourne – metropolitan 0 0 12 6
melbourne – regional 0 0 0 0
Non-Victorian -Metropolitan 1 3 26 1
non-Victorian – regional 0 0 1 0
Graph10shows that for thoseemployeeswithvehiclescostingmore than$38,500Melbournemetropolitanemployeesannuallytravelbetween15<25,000kilometresandnon-Victorianmetropolitanemployeestravel25<40,000kilometres.AtypicalcarmightbeaJeepCherokeeSportwithhighwayfueleconomyof11.8litres/100kms.
Graph 9. Average number of cars priced $38K-38.5K & kms travelled
0
5
10
15
20
25
30
<15kms 15<25kms 25<40kms >40kms'000 of kms
Ave
rage
num
bero
fcar
s
Melbourne - Metropolitan Melbourne - Regional Non-Victorian -Metropolitan Non-Victorian - Regional

210 (2008) 23 AUSTRALIAN TAX FORUM
DataTable10.Averagenumberofcarspriced>$38.5K&‘000kilometrestravelled
Location of Respondent <15kms 15-25kms 25-40kms >40kms
melbourne – metropolitan 3 14 6 10
melbourne – regional 0 0 2 1
Non-Victorian -Metropolitan 1 3 13 0
non-Victorian – regional 0 1 1 0
Graph 10. Average number of cars priced >$38.5K & kms travelled
0
2
4
6
8
10
12
14
16
<15kms 15<25kms 25<40kms >40kms'000 of kms
Ave
rage
num
bero
fcar
s
Melbourne - Metropolitan Melbourne - Regional Non-Victorian -Metropolitan Non-Victorian - Regional
Metropolitanemployeesaredominantinthispricerangeofpowerful,petrolinefficientcars.ThecurrentFBTstatutoryfractionsareshowninDataTable10.1:
DataTable10.1
Kilometres StatutoryFraction
<15kms 0.26
15<25kms 0.20
25<40kms 0.11
>40kms 0.07
An FBT tax concession of 9percent is given to employees who travel more than25,000kilometresbutlessthen40,000kilometresperannum.AnexampleoftheFBTcostsavingsfora$45,000carwithtwodiffering“statutoryfractions”is:
$45,000 car x 0.20 statutory fraction x 2.0647 gross -up x 46.5% ta = 8,641
$45,000 car x 0.11 statutory fraction x 2.0647 gross -up x 46.5% tax = 4,752
fBT savings for higher mileage 3,888
211The ImpacT of ausTralIa’s frInge BenefITs Tax for cars on peTrol consumpTIon and greenhouse emIssIons
Inthissampleitcanbeseenthatmetropolitanemployerssavealmost$4,000percarintaxbyallowingextrakilometresoftravel.
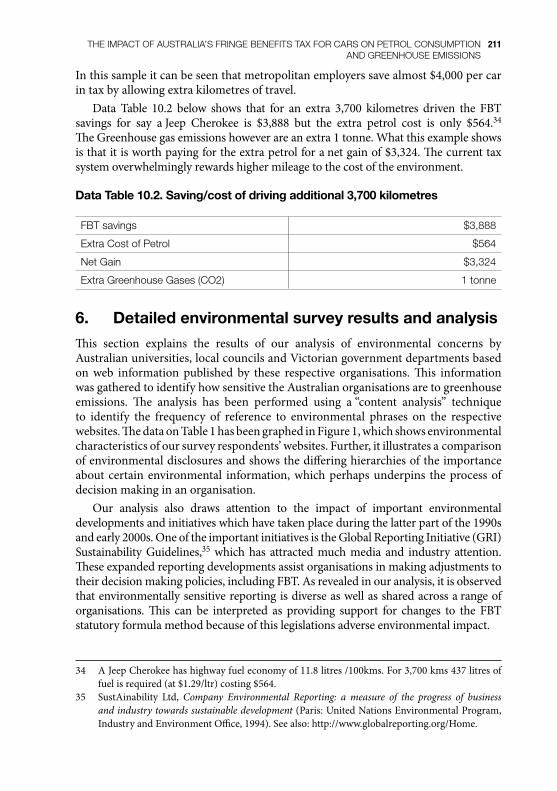
Data Table 10.2 below shows that for an extra 3,700 kilometres driven the FBTsavings for say aJeep Cherokee is $3,888 but the extra petrol cost is only $564.34TheGreenhousegasemissionshoweverareanextra1tonne.Whatthisexampleshowsisthatitisworthpayingfortheextrapetrolforanetgainof$3,324.Thecurrenttaxsystemoverwhelminglyrewardshighermileagetothecostoftheenvironment.
DataTable10.2.Saving/costofdrivingadditional3,700kilometres
fBT savings $3,888
Extra Cost of Petrol $564
net gain $3,324
extra greenhouse gases (co2) 1 tonne
�. Detailedenvironmentalsurveyresultsandanalysis
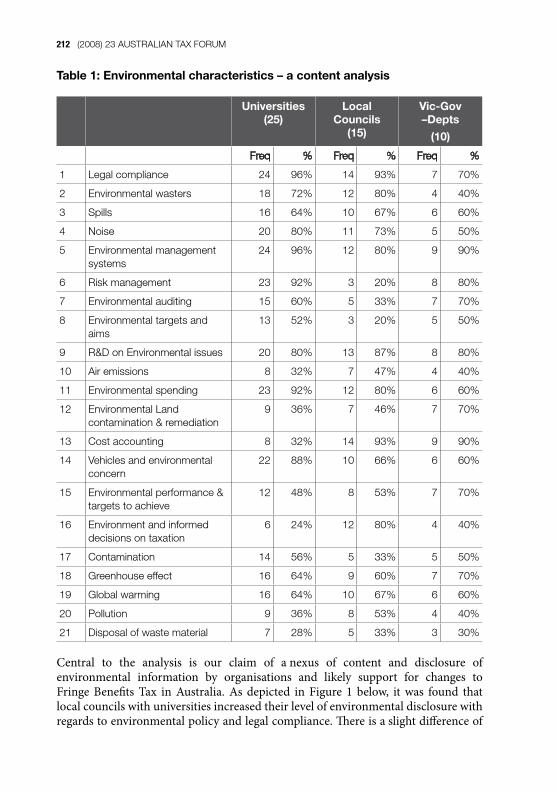
This section explains the results of our analysis of environmental concerns byAustralianuniversities,localcouncilsandVictoriangovernmentdepartmentsbasedon web information published by these respective organisations. This informationwasgatheredtoidentifyhowsensitivetheAustralianorganisationsaretogreenhouseemissions. The analysis has been performed using a“content analysis” techniqueto identify the frequency of reference to environmental phrases on the respectivewebsites.ThedataonTable1hasbeengraphedinFigure1,whichshowsenvironmentalcharacteristicsofoursurveyrespondents’websites.Further,itillustratesacomparisonofenvironmentaldisclosuresandshowsthedifferinghierarchiesoftheimportanceaboutcertainenvironmental information,whichperhapsunderpins theprocessofdecisionmakinginanorganisation.
Our analysis also draws attention to the impact of important environmentaldevelopmentsandinitiativeswhichhavetakenplaceduringthelatterpartofthe1990sandearly2000s.OneoftheimportantinitiativesistheGlobalReportingInitiative(GRI)Sustainability Guidelines,35 which has attracted much media and industry attention.Theseexpandedreportingdevelopmentsassistorganisationsinmakingadjustmentstotheirdecisionmakingpolicies,includingFBT.Asrevealedinouranalysis,itisobservedthatenvironmentallysensitivereportingisdiverseaswellassharedacrossarangeoforganisations. This can be interpreted as providing support for changes to the FBTstatutoryformulamethodbecauseofthislegislationsadverseenvironmentalimpact.
34 AJeepCherokeehashighwayfueleconomyof11.8litres/100kms.For3,700kms437litresoffuelisrequired(at$1.29/ltr)costing$564.
35 SustAinability Ltd, Company Environmental Reporting: a measure of the progress of business and industry towards sustainable development(Paris:UnitedNationsEnvironmentalProgram,IndustryandEnvironmentOffice,1994).Seealso:http://www.globalreporting.org/Home.
212 (2008) 23 AUSTRALIAN TAX FORUM
Table1:Environmentalcharacteristics–acontentanalysis
Universities(25)
LocalCouncils
(15)
Vic-Gov–Depts
(10)
Freq % Freq % Freq %
1 Legal compliance 24 96% 14 93% 7 70%
2 environmental wasters 18 72% 12 80% 4 40%
3 Spills 16 64% 10 67% 6 60%
4 Noise 20 80% 11 73% 5 50%
5 environmental management systems
24 96% 12 80% 9 90%
6 Risk management 23 92% 3 20% 8 80%
7 environmental auditing 15 60% 5 33% 7 70%
8 environmental targets and aims
13 52% 3 20% 5 50%
9 r&d on environmental issues 20 80% 13 87% 8 80%
10 Air emissions 8 32% 7 47% 4 40%
11 environmental spending 23 92% 12 80% 6 60%
12 environmental land contamination & remediation
9 36% 7 46% 7 70%
13 Cost accounting 8 32% 14 93% 9 90%
14 Vehicles and environmental concern
22 88% 10 66% 6 60%
15 environmental performance & targets to achieve
12 48% 8 53% 7 70%
16 environment and informed decisions on taxation
6 24% 12 80% 4 40%
17 Contamination 14 56% 5 33% 5 50%
18 greenhouse effect 16 64% 9 60% 7 70%
19 global warming 16 64% 10 67% 6 60%
20 Pollution 9 36% 8 53% 4 40%
21 disposal of waste material 7 28% 5 33% 3 30%
Central to the analysis is our claim of anexus of content and disclosure ofenvironmental information by organisations and likely support for changes toFringe Benefits Tax in Australia. As depicted in Figure 1 below, it was found thatlocalcouncilswithuniversitiesincreasedtheirlevelofenvironmentaldisclosurewithregardstoenvironmentalpolicyandlegalcompliance.Thereisaslightdifferenceof

213The ImpacT of ausTralIa’s frInge BenefITs Tax for cars on peTrol consumpTIon and greenhouse emIssIons
frequencyoflegalcomplianceassociatedsentencesonenvironmentalissuesbetweenuniversities,localcouncilsandVictoriangovernmentdepartments.ThefrequencyofenvironmentalstatementsbyAustralianuniversitiesandlocalcouncilswithregardtolegalcompliancediffersintermsoftheirmagnitude.Thefrequencyofsentenceson environmental management systems is 24 for universities (96percent), 14 forlocalcouncils (93percent)and7 forVictorianGovernmentDepartments (VGDs)(70percent). It seems that VGDs have taken this matter less seriously than othercategoriesoforganisations.Thefrequencyofsentencesonvehicleandenvironmentalconcernis22foruniversities(88percent),10forlocalcouncils(LCs)(66percent)and6forVGDs(60percent).ItsuggeststhatuniversitiesaremoreinterestedinthisareaofenvironmentalconcernthanVGDsandLCs.
Figure1.Environmentalcharacteristics–acontentanalysis
7. Summaryoffindings
Thefirstpartofourinquirywasasurvey,whichissummarisedbelow:i. Atotalof25responsesacrossmetropolitanandregionalAustralia
providedinformationonemployeedrivinghabitsandvehicledataon2,766taxpayer/ratepayerfundedsalary-packagedcars.Theresponsethereforerepresentsasignificantsample.
ii. Oneofthesurveyquestionsaskedfora“yes”or“no”responsetothestatement“Upto80percentofouremployeeslivewithin15kmsoftheirworkplace”towhichhalfofallrespondents’responded“yes”.
Environmental Characteristics - A content analysis
0%
20%
40%
60%
80%
100%
120%
Leg
al com
plianc
e
Envir
onem
tal w
asters
Spills
Noise
Envir
onmen
tal m
anag
emen
t sys
tems
Risk m
anag
emen
t
Envir
onmen
tal a
uditing
Envir
onmen
tal targe
ts and
aim
s
R&D on En
viron
men
tal iss
ues
Air e
miss
ions
Envir
onmen
tal s
pend
ing
Envir
onmen
tal L
and co
ntam
ination & re
med
iatio
n
Cost a
ccou
nting
Vehicles
and
env
ironm
ental c
once
rn
Envir
onmen
tal p
erform
ance
& ta
rgets t
o ac
hiev
e
Envir
onmen
t and
inform
ed dec
ision
s on taxa
tion
Contamination
Green
hous
e effect
Globa
l warming
Pollu
tion
Dispos
al of w
aste m
aterial
Universities (25) % Local Councils (15) % Vic-Gov -Depts %

214 (2008) 23 AUSTRALIAN TAX FORUM
Thisresponserateindicateslowprivateusage,butdoesnotcorrelatewithothersurveydata,whichshowsthatineverypricerangecarsarepredominantlydrivenover15,000kilometresperannum.Giventhatthemajorityofsurveyemployeeslivewithin15kmsofwork,forbenchmarkpurposesitisestimatedthattheannualmileagefortheirroundtripbetweenworkandhomeis7,200kilometres(30kmx5dayweek)x48weeks=7,200kms).Ifitisacceptedthatsalarypackaginginthissurveyisaperquisitegenerallyofferedtodesk-boundemployees,thenthegapbetweenthebenchmarkprivatemileageof7,200kilometresandpercentageofemployeeswhoaredeclaringover15,000kilometresperannumshouldbeofconcerntopolicymakersforreasonsofC02emissionsandtaxequity.
iii. Aspecialcasestudyforsixrespondents’salary-packagedcarswasundertaken.Thedatarepresented1,250carsfromacrossAustralia,bothmetropolitanandregionalareas.Theannualtravelforeachcarwasgraphedagainstnumberofcarsinorderofincreasingdistance(kilometres).Thedatagraphedclearlysuggeststhat20percentofthecasestudycardrivershavetravelledthekilometresnecessarytoreachtheFBTconcessionaltaxpointsof15,000km,25,000kmand40,000km,despiteincreasedpetrolcostsandCO2emissions.
iv. Respondentorganisations’employersinmetropolitanareashavethelargestnumberofpackagedcars.
v. ForMelbournemetropolitanemployeesthemostdominantpricedcarisinthe$29,000to$36,000rangeandmostcarstravellessthan15,000kilometresperannum.Themainaberrationtothistrendisthenon-Victorianmetropolitanemployer,whomainlypackagescarsinthe$38,000to$38,500rangewithmileagebetween25<40,000kilometresperannum.Forregionalemployeesacarpricedlessthan$29,000ispreferredbutamileagetrendisnotapparentforitisrandomlyspreadbetween15,000<40,000kilometresperannum.
vi. Thecurrenttaxsystemoverwhelminglyrewardshighermileageattheexpenseoftheenvironment.Itisgenerallyacceptedthatifanaveragecar’smileageisreduced,by3,700kilometresperannum,thenthereisareductionofonetonneofC02.Ouranalysisputsupthecommonscenarioofacarbeingdrivenanadditional3,700kilometrestogettothe“15,000kilometreband”forataxbreak.Inthisinstancetheextrapetrolcostis$525,buttheFBTsavingsis$1,960.
The second part of our research concerned a“content analysis” of our surveyrespondents’websites,whichissummarisedbelow:
vii. Itwasfoundthatenvironmentalpolicyandlegalcomplianceorganisationalconcernshasledtoheightenedlevelsofreportingonenvironmentalissues.Asindicatedinouranalysis,thefrequencyoflegalcompliancedisclosureis24foruniversities(96percent),14for

215The ImpacT of ausTralIa’s frInge BenefITs Tax for cars on peTrol consumpTIon and greenhouse emIssIons
localcouncils(LCs)(93percent)and7forVictoriangovernmentdepartments(VGDs)(70percent).ItmightbeconcludedthatiftherewereachangeinlegislationabouttheFBTcarstatutoryformulamethod(becauseofenvironmentalgains)thattherewouldbeareasonablelevelofcompliance.
viii. Motorvehicleissueswerethenextmainareaofenvironmentalconcern.Thefrequencyofdisclosureonvehicleimpactonenvironmentalis22foruniversities(88percent),10forlocalcouncils(66percent)and6forVGDs(60percent).ItsuggeststhatuniversitiesaremoreinterestedinthisareaofenvironmentalconcernthanVGDsandLCs,sofurthereducationisneededinthisarea.
ix. Environmentalspendingisanotherareaofinterestbytheorgansationsinvestigated.Thefrequencyofsentencesonenvironmentalspendingis23foruniversities(92percent),12forLCs(80percent)and6forVGDs(60percent).ItsuggeststhatuniversitiesaremoreinclinedtospendmoreonenvironmentalprotectionassociatedmattersthanVGDsandLCs.
x. Noisepollutionandassociatedissueshashasbeenassessedat20foruniversities(80percent),11forLCs(73percent)and5forVGDs(50percent).ItseemsthatVGDsarenotimpactedoroverlyconcernedwiththismatter.
8. Conclusionandrecommendations
Theincentiveforemployerstoencouragetheiremployeestodriveunnecessarymileagein“salarypackaged”vehicles toobtaintaxconcessionsundertheFBTcar“statutoryformula method” and the resultant wastage of petrol and unsustainable levels ofgreenhouseemissionsareunintendedconsequencesofthe20yearoldFBTlegislation.
Our analysis of FBT survey data provides support for acall to reform of onesectionoftheFBTlegislationtofostermoreenvironmentallysustainablecar“salarypackaging”policesforAustralianbusiness.Accordingtooursecondsurveysample,organisationshaveclearlydefinedenvironmentalpolicies.Oneof theobservationswas that some of the organisations report environmental issues on their websites,albeit thinly. Nonetheless, our “content analysis” can be interpreted businessesproviding support for changes to the FBT statutory formula method to combatadverseenvironmentalimpacts.
Thebestsolution,intermsofaneasymethodtofacilitatethecurbingofexcessivemotorvehiclegreenhousegasemissionsandfosteringpetrolsavings,isthattheuseof the log book be extended. It is the most accurate method for those genuinelyclaimingtohavedrivenbusinesskilometres.However,asthismethodisperceivedascumbersomebybusiness,alternativelyitisrecommendedthatuseofFBT“statutoryrates”forcarsbereformedbyremovingthetaxconcessionatthe15,000kilometreband and using the 26percent rate, or using just one statutory rate, possibly the20percentrate.

216 (2008) 23 AUSTRALIAN TAX FORUM
Areasaffectedbythischangewouldbeasfollows:
TheAustraliancarindustryishighlysubsidisedbyFBTrevenue.ItwouldbeamatterforGovernmentpolicytoeitherincreaseordecreasetheamountofsubsidy.
Businessesandtheirsalarypackagingemployeeswouldbeaffected,butbasedonourcasestudydata,onlytotheextentof20percentofvehicles.
Ifreformiscarriedout,AustraliaoverallwillbenefitintermsoftheloweringofCO2gases,adiminutioninthedemandforoil,reducingpeakhourcongestion,andwearandtearofroads.
Inconclusion,werequestthatFBTreforminrelationtocarsbeaFederalGovernmentpriority.
Onafinalnote,theimplicationsofouranalysisincludethepossibilitythatcompetitivestrategies(particularlyfortaxplanning)forsuccessfulsustainabilitybefurther developed. Clearly, additional investigation into the relationship betweencorporatereportingonenvironmentalconcernandthenegativeeffectofcertaintaxpoliciesappearswarranted.Inparticular,casestudieswouldbeusefulindeterminingwhether the tax policies (such as FBT) and negative environmental outcomesareinterrelated.
Acknowledgements
TheauthorswishtoacknowledgethefinancialsupportprovidedbyaResearchGrantin2006throughtheFacultyofLaw&Management,LaTrobeUniversity,Bundoora.Theauthorsalsoacknowledgethesupportofrespondentsfortheirtimeinansweringourquestionnaire,namelyCityandShireCouncilsintheStateofVictoria,asampleofVictorianGovernmentdepartmentsandasampleofAustralianuniversities.Withouttheirtimeanddiligenceinprovidinguswithinformationrelatedtotheirorganisation,ourresearchwouldnothavebeenpossible.Finally, theauthorsaregratefulforthecommentsfromvariousparticipantsattheAustralianTaxTeachers’ConferenceheldinHobart,January2008.Thefirstversionofthispaperreceivedthe“MostOriginalPaper”awardatthatconference.
•
•
•

217The ImpacT of ausTralIa’s frInge BenefITs Tax for cars on peTrol consumpTIon and greenhouse emIssIons
Appendix1.Questionnaire:FringeBenefitsTaxforCars
KingsburyDriveBundoora3086
QUESTIONNAIRE
Fringe Benefits Tax and Cars: fuel consumption and greenhouse emissions
Information sheet
The aim of this questionnaire is to determine whether the current Fringe BenefitsTax(FBT)legislationforcarsunderthe“statutoryformulamethod”isencouragingAustralianemployeestodriveunnecessarymileageintheirsalarypackagedvehiclestogaintaxconcessions.
This survey will ask questions in relation to your organisation’s salary packagedvehicles,FBTandenvironmentalpolicies.Youmightneedtohaveyourorganisation’s“packagedcars”databesideyoutoanswersomequestions.
The questionnaire information gathered will be analysed and might supportasubmissiontogovernmentforchangetotheFBTlegislationconcerningtaxliabilityon cars under the “statutory formula method”. Any suggested change would beequitableforbothregionalandmetropolitanemployees.
The data collected could also be used in an article for publication in an academicjournalorforpresentationatanacademicconference.
The questionnaire will take about 10 minutes to complete and participation iscompletelyvoluntary.
Thisquestionnaireison-lineandshouldyouwishtoparticipateyouwillcompleteitanonymously.Thereisnowayparticipantscanbeidentified.Yourparticipationinthisresearchwillbeimpliedfromcompletionandsubmissionoftheon-linequestionnaire.Your responses will be reported only in aggregate. Project documentation will bestored in secure, lockable locations at La Trobe University. Our computer files arepasswordprotected.
SomeofthebenefitsfromthisresearchmightincludegainingaclearerunderstandingonthecurrentFBTimplicationsinrelationtocars.WewouldconsiderurgingchangestotheFBTlegislationaimedatgeneratingresourcesavingstobusiness.Byreviewing,

218 (2008) 23 AUSTRALIAN TAX FORUM
questioningandgeneratingdebateonataxsystemthatgivesdriversadvantageoustax treatment the further they drive, this project will ideally bring about amoresustainableenvironmentforallAustralians.
Ifyouhaveanycomplaintsorqueriesthattheresearchershavenotbeenabletoanswerto your satisfaction, you may contact the Secretary , Ms Mrinali Clarke, FacultyHuman Ethics Committee, Faculty of Law and Management La Trobe University,Victoria,3086(Ph.0394791603,e-mail:[email protected].
Ifyouhaveanyquestionsatanytimeaboutthequestionnaireortheproceduresyoumaycontactoneofthefollowingresearchers:
MsDianneHarveyFacultyofLawandManagement,LaTrobeUniversity0354447352,[email protected]
DrPremYapaFacultyofLawandManagement,LaTrobeUniversity0394791642,[email protected]
DrDianeKraalFinanceDivision,LaTrobeUniversity0394792068,[email protected]
Thankyouinadvanceforyourtimeandsupport,youmayprintthisquestionnaireinadvanceorcommenceitnow.

219The ImpacT of ausTralIa’s frInge BenefITs Tax for cars on peTrol consumpTIon and greenhouse emIssIons
SECTION 1: GENERAL INFORMATION
Pleasetickboxes
1. Whatisthelocationofyourorganisation?[tickone]
Victoria(metropolitan)
Victoria(regional)
StateotherthanVictoria(metropolitan)
StateotherthanVictoria(regional)
2. Does your organisation provide salary-packaged cars that are internallymanaged?
Yes No
3. Howmanycarsdoesyourorganisation/“externalsalarypackageprovider”salarypackage?
[indicatethenumberofcars]………………
4. Does your organisation have an “in-house” policy on salary packagedvehicles?
Yes No
5. Does your organisation/”external salary package provider” use the FBTStatutoryMethodforcars?
Yes No
6. Ifyouusethe“FBTstatutorymethod”,whatisthenumberofcarsinthiscategory?
lessthan50
between50and200
between201and300
between301and500
Morethan501
Proceed to the next question if 10percent or more of your packaged cars haveFBT calculated under the Statutory Method. Otherwise, you have finished thisquestionnaire.
220 (2008) 23 AUSTRALIAN TAX FORUM
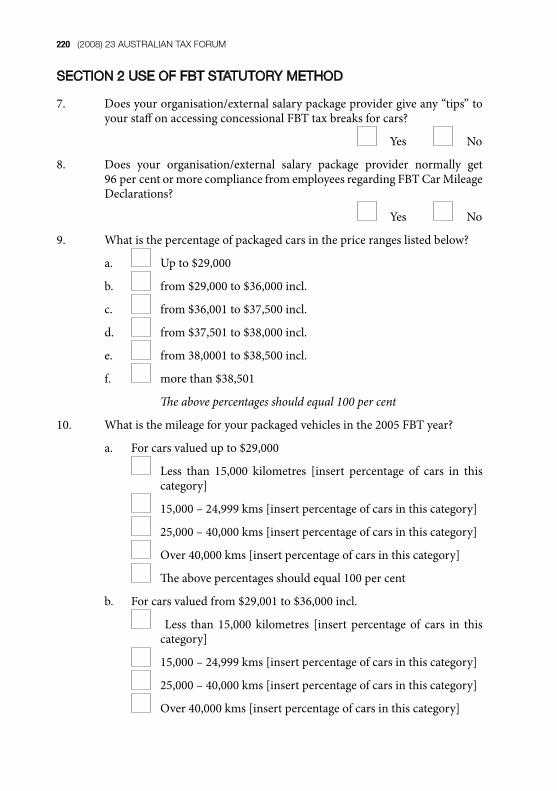
SECTION 2 USE OF FBT STATUTORY METHOD
7. Doesyourorganisation/externalsalarypackageprovidergiveany“tips”toyourstaffonaccessingconcessionalFBTtaxbreaksforcars?
Yes No
8. Does your organisation/external salary package provider normally get96percentormorecompliancefromemployeesregardingFBTCarMileageDeclarations?
Yes No
9. Whatisthepercentageofpackagedcarsinthepricerangeslistedbelow?
a. Upto$29,000
b. from$29,000to$36,000incl.
c. from$36,001to$37,500incl.
d. from$37,501to$38,000incl.
e. from38,0001to$38,500incl.
f. morethan$38,501
The above percentages should equal 100 per cent
10. Whatisthemileageforyourpackagedvehiclesinthe2005FBTyear?
a. Forcarsvaluedupto$29,000
Less than 15,000 kilometres [insert percentage of cars in thiscategory]
15,000–24,999kms[insertpercentageofcarsinthiscategory]
25,000–40,000kms[insertpercentageofcarsinthiscategory]
Over40,000kms[insertpercentageofcarsinthiscategory]
Theabovepercentagesshouldequal100percent
b. Forcarsvaluedfrom$29,001to$36,000incl.
Less than 15,000 kilometres [insert percentage of cars in thiscategory]
15,000–24,999kms[insertpercentageofcarsinthiscategory]
25,000–40,000kms[insertpercentageofcarsinthiscategory]
Over40,000kms[insertpercentageofcarsinthiscategory]

221The ImpacT of ausTralIa’s frInge BenefITs Tax for cars on peTrol consumpTIon and greenhouse emIssIons
The above percentages should equal 100 per cent
c. Forcarsvaluedfrom$36,001to$37,500incl.
Less than 15,000 kilometres [insert percentage of cars in thiscategory]
15,000–24,999kms[insertpercentageofcarsinthiscategory]
25,000–40,000kms[insertpercentageofcarsinthiscategory]
Over40,000kms[insertpercentageofcarsinthiscategory]
The above percentages should equal 100 per cent
d.Forcarsvaluedfrom$37,501to$38,000incl.
Less than 15,000 kilometres [insert percentage of cars in thiscategory]
15,000–24,999kms[insertpercentageofcarsinthiscategory]
25,000–40,000kms[insertpercentageofcarsinthiscategory]
Over40,000kms[insertpercentageofcarsinthiscategory]
The above percentages should equal 100 per cent
e. orcarsvaluedfrom$38,0001to$38,500incl.
Less than 15,000 kilometres [insert percentage of cars in thiscategory]
15,000–24,999kms[insertpercentageofcarsinthiscategory]
25,000–40,000kms[insertpercentageofcarsinthiscategory]
Over40,000kms[insertpercentageofcarsinthiscategory]
The above percentages should equal 100 per cent
f. Forcarsvaluedmorethan$38,501.
Less than 15,000 kilometres [insert percentage of cars in thiscategory]
15,000–24,999kms[insertpercentageofcarsinthiscategory]
25,000–40,000kms[insertpercentageofcarsinthiscategory]
Over40,000kms[insertpercentageofcarsinthiscategory]
The above percentages should equal 100 per cent
222 (2008) 23 AUSTRALIAN TAX FORUM
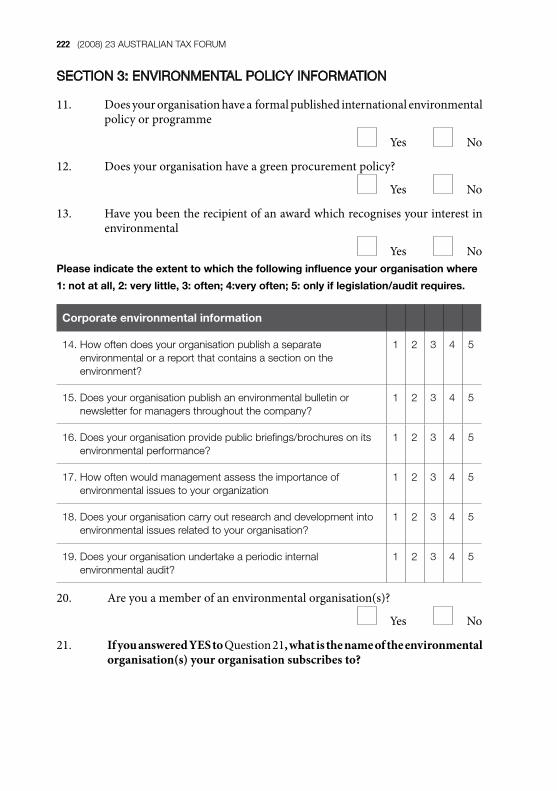
SECTION 3: ENVIRONMENTAL POLICY INFORMATION
11. Doesyourorganisationhaveaformalpublishedinternationalenvironmentalpolicyorprogramme
Yes No
12. Doesyourorganisationhaveagreenprocurementpolicy?
Yes No
13. Haveyoubeentherecipientofanawardwhichrecognisesyourinterestinenvironmental
Yes NoPleaseindicatetheextenttowhichthefollowinginfluenceyourorganisationwhere
1:notatall,2:verylittle,3:often;4:veryoften;5:onlyiflegislation/auditrequires.
Corporateenvironmentalinformation
14. how often does your organisation publish a separate environmental or a report that contains a section on the environment?
1 2 3 4 5
15. does your organisation publish an environmental bulletin or newsletter for managers throughout the company?
1 2 3 4 5
16. does your organisation provide public briefings/brochures on its environmental performance?
1 2 3 4 5
17. how often would management assess the importance of environmental issues to your organization
1 2 3 4 5
18. does your organisation carry out research and development into environmental issues related to your organisation?
1 2 3 4 5
19. Does your organisation undertake a periodic internal environmental audit?
1 2 3 4 5
20. Areyouamemberofanenvironmentalorganisation(s)?
Yes No
21. If you answered YES to Question21, what is the name of the environmental organisation(s) your organisation subscribes to?
223The ImpacT of ausTralIa’s frInge BenefITs Tax for cars on peTrol consumpTIon and greenhouse emIssIons
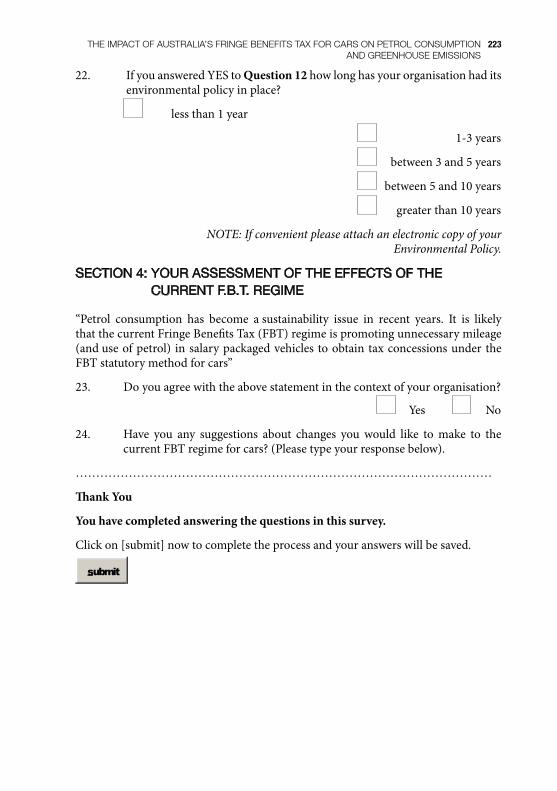
22. IfyouansweredYEStoQuestion 12howlonghasyourorganisationhaditsenvironmentalpolicyinplace?
lessthan1year
1-3years
between3and5years
between5and10years
greaterthan10years
NOTE: If convenient please attach an electronic copy of your Environmental Policy.
SECTION 4: YOUR ASSESSMENT OF THE EFFECTS OF THE CURRENT F.B.T. REGIME
“Petrol consumption has become asustainability issue in recent years. It is likelythatthecurrentFringeBenefitsTax(FBT)regimeispromotingunnecessarymileage(anduseofpetrol) insalarypackagedvehiclestoobtaintaxconcessionsundertheFBTstatutorymethodforcars”
23. Doyouagreewiththeabovestatementinthecontextofyourorganisation?
Yes No
24. Have you any suggestions about changes you would like to make to thecurrentFBTregimeforcars?(Pleasetypeyourresponsebelow).
…………………………………………………………………………………………
Thank You
You have completed answering the questions in this survey.
Clickon[submit]nowtocompletetheprocessandyouranswerswillbesaved.
submit