the impact and cost-effectiveness of alternative food for education
TRANSCRIPT

The Impact of Alternative Food for Education Programs on Learning Achievement and Cognitive Development
in Northern Uganda*
Sarah Adelman
University of Maryland, College Park
Harold Alderman The World Bank
Daniel O. Gilligan
International Food Policy Research Institute
Kim Lehrer University of British Columbia
DRAFT: February 29, 2008
Abstract: Food for education (FFE) programs, including free or subsidized on-site school feeding programs (SFP) and take-home rations conditional on school attendance (THR), are often used to improve school attendance, but the ultimate goal is to improve student learning. Improving the nutrition of malnourished students while they learn may also improve cognitive function. This paper presents evidence from a randomized prospective field experiment conducted in Northern Uganda from 2005-2007 on the impacts of alternative primary school FFE programs on learning and cognitive development. The evaluation compares outcomes between three randomly assigned groups: beneficiaries of World Food Programme’s SFP program, beneficiaries of an experimental THR program giving equivalent food transfers, and a control group. Learning achievement is measured by math and literacy test scores and by results of the national Primary Leaving Exam (PLE). Cognitive development is assessed using the Ravens Colored Progressive Matrices and two forms of the Digit Span test. The sample is drawn from Internally Displaced People’s (IDP) camps in Northern Uganda formed between 1997-2003 in response to the killings and abductions brought on by the ongoing Lord's Resistance Army insurgency. We present results of several alternative treatment effect estimators which provide conservative ‘intent to treat’ measures of program impact. Our preferred estimates for these data are those from a treatment group difference-in-differences model. Results show that neither program had significant average impact on the math and literacy test scores of 6-14 year olds. However, the THR program boosts math scores of 11-14 year olds by 16.7 points. Both the SFP and THR programs had large significant impacts on math scores of 11-14 year olds who had delayed school entry. On the literacy exam, SFP weakly increased test scores of 11-14 year olds by 6.4 points. For 6-10 year olds, literacy scores actually fell as a result of participating in the THR program. Access to the THR program also caused significant improvements in PLE scores. On cognitive development, both programs improve cognitive function in terms of ability to manipulate concepts. Girls in the THR program also demonstrated improvements in short term memory and (weakly) in reasoning and perceptive ability compared to girls in the control group. Moreover, the THR program had weakly larger impacts on reasoning ability measured by the Raven’s test than the SFP program. This difference was significant at the 5 percent level for boys in the sample. The paper explores the reasons for the relative difference in performance of the two programs. JEL Codes: O1, I21, I38 Keywords: school feeding, learning, cognitive development, evaluation * We gratefully acknowledge financial support for the data collection and analysis from the World Food Programme, the World Bank, and UNICEF. We also extend our gratitude to the staff of the World Food Programme offices in Uganda, particularly to Purnima Kashyap, for willingness to participate in this evaluation and for logistical support. We thank Professor Joseph Konde-Lule, Institute of Public Health, Makerere University, for collaboration in the data collection. All remaining errors are ours. Please direct correspondence to: Daniel O. Gilligan, IFPRI, 2033 K St., NW, Washington, DC 20006. Email: [email protected]; Phone: (202) 862-8146.

1. Introduction
Recent trends have seen renewed emphasis on basic education in developing countries.
In recognition of the importance of education to economic growth and poverty reduction
(Hanuschek and Woessmann, 2007; Glewwe, 2002; Schultz, 1988; Hanushek, 1986),
Universal Primary Education (UPE) was established as one of the Millennium
Development Goals. As a result, many developing countries have established UPE
programs and have eliminated primary school fees in order to foster full primary school
enrollment. Many governments have also established complementary social programs to
further encourage school participation, such as conditional cash transfer (CCT) programs
and food for education (FFE) programs. While CCT programs have gained in popularity,
FFE programs, including subsidized on-site school feeding programs (SFP) and take-
home rations conditional on school attendance (THR), continue to be widespread. World
Food Programme (WFP) reached 21.6 million children with FFE transfers in 2005 (WFP,
2004), and many governments operate publicly funded FFE programs. For example,
Brazil’s national school feeding program covers 36 million children age 0-14 (WFP,
2006).
Although a primary objective of FFE programs is to increase school participation,
the ultimate goal is to improve student learning. The effect of FFE programs on learning
achievement derives from increasing the child’s school attendance and improving the
efficiency with which they learn. The gains in learning efficiency are possible if the
meals provided by the FFE program are nutritious and well-timed. If children are
otherwise undernourished, the FFE food transfers, which are often fortified, can reduce
short-term hunger and help children concentrate and learn. In addition to improving
learning efficiency, a sustained program may also improve longer term cognitive
function.
There is currently limited rigorous evidence on the impact of FFE programs on
learning achievement or cognitive development (see Adelman, Gilligan and Lehrer, 2008,
for a review). Evidence of impacts of SFP programs on learning achievement is mixed.
Ahmed (2004) found a significant impact on mathematics scores but no impact on
English scores in Bangladesh, while Tan et al. (1999) found an impact on English scores
but not on mathematics scores in the Philippines. Empirical evidence on the effects of

school meals on cognitive function are mixed and depend on the tests used, the content of
the meals, and the initial nutritional status of the children (Whaley et al, 2003; Simeon
and Grantham-McGregor, 1989). These studies are clinical effectiveness trials conducted
in schools under controlled conditions, so their results may not be replicable in scaled up
programs. Results on impacts on cognitive function from field experiments of ongoing
school meals programs are not available. For THR programs, there is no evidence on the
impacts on either learning achievement or cognitive development.
This paper presents evidence from a randomized prospective field experiment
conducted in Northern Uganda from 2005-07 on the impacts of alternative primary
school FFE programs on learning and cognitive development. The evaluation compares
the impacts of World Food Program’s on-site SFP program to an experimental THR
program that provided equivalent food transfers as monthly take-home rations to each
child that maintained at least eighty percent attendance. Assignment to either of the two
interventions or to a control group was determined randomly at the community level.
The take-home rations program gave beneficiary households greater control over the food
transfers, though it was more difficult for children in the THR program to have access to
the food during the school day. THR programs could be preferred if the logistical
complexities of providing on-site school meals lead to disruptions of learning during the
school day. Although in the design of the experiment the size and composition of the
food provided under the SFP and THR programs was the same, in reality the two
programs faced different obstacles to implementation, so actual transfers received may
have differed.
We measure learning achievement by mathematics and literacy tests conducted in
lower primary and upper primary grades, both before the FFE programs began and after
18 months of implementation. We also assess the impact of the programs on Primary
Leaving Exams, the national exam that determines whether children leaving primary
school can be promoted to secondary school. Cognitive development was assessed
during the second survey round in 2007 using the Ravens Colored Progressive Matrices
and two forms of the Digit Span test. The Raven’s test assesses performance-type
abilities, such as the child’s ability to organize perceptual detail, to reason by analogy,
and to form comparisons. Whaley et al. (2003) indicate that a version of these
2

instruments have performed well in repeated surveys in Kenya. The Digit Span Forward
test is a test of auditory short term memory, while the Digit Span Backward test measures
memory and ability to manipulate concepts.
The sample for this study is drawn from Internally Displaced People’s (IDP)
camps in Northern Uganda, which formed from 1997-2003 in response to the killings and
abductions brought on by the ongoing Lord’s Resistance Army (LRA) insurgency. While
safety has improved dramatically in the camps, living conditions are poor. The study also
investigates the sensitivity of the findings to the severity of shocks endured by
respondents due to the conflict and resettlement.
This study provides rare evidence from a field experiment on a number of issues
about the effectiveness of FFE programs and about the economics of education.
Regarding FFE programs, we provide rigorous evidence about whether school meals
programs, which are relatively expensive to operate, improve learning achievement and
cognitive development. We also examine whether a change in program modality toward
supplying take-home rations would have larger impacts on learning and cognitive
development. This comparison has important implications for how best to design FFE
programs for the tens of millions of children that participate in them each year.
Glewwe and Kremer (2006) note that much is still unknown about how best to
improve learning outcomes in schools in developing countries, and they call for more
experimental evidence. The findings of this study contribute to filling some aspects of
that void. First, these results provide well-identified evidence on the effectiveness of
school subsidies at improving learning achievement, since the FFE transfers represent a
subsidy to school attendance. Second, the results help to explain the importance of the
complementary effects of food consumption and nutritional status on learning and
cognitive development. The food transfers from each program in the Northern Uganda
study provided more than 1000 kcals of food energy per school day, which represents a
substantial fraction of per capita food energy availability in the IDP camp setting in
Northern Uganda, where household diets were heavily dependent on limited food rations
from World Food Programme. This food was also fortified sufficiently to meet daily
requirements of iron and other key micronutrients that could affect learning and cognitive
outcomes. We measured iron status by hemocue both before and after the start of both
3

interventions and so can also infer the importance of the program-induced change in iron
status on learning and cognitive function. Third, we investigate the heterogeneity of
program impacts by age and gender of program beneficiaries. This heterogeneity may be
important because the impact of each program depends somewhat differently on demand
for child labor time and returns to education, which will vary by age and gender.
The remainder of the paper is organized as follows. Section 2 describes how SFP
and THR programs impact learning and cognitive development. Section 3 describes the
empirical strategy, outlining the details of how the randomization of the two programs
was performed in order to identify the main program effects. It also motivates the
identification strategies for interacted effects with deworming and conflict-related events.
Section 4 introduces the study setting in Northern Uganda, the details of the design and
operation of the alternative FFE programs, and the evaluation study data. Section 5
provides the main empirical results. Section 6 concludes.
2. How FFE Programs Impact Learning and Cognitive Development
Food for education programs lead to greater investment in education primarily by
subsidizing schooling costs. Moreover, the food provided in the program can help a child
learn more effectively, thereby increasing the returns to education in the future.
Adelman, Gilligan and Lehrer (2008) describe the mechanisms by which SFP and THR
programs impact various schooling outcomes, including learning achievement and
cognitive development. Below is a summary of the discussion.
The effect of in-school meals on learning achievement works through two
mechanisms: attendance and nutrition. The attendance channel is based on the theory
that SFP improves school attendance. This occurs because SFP subsidizes the cost of
school attendance. In-school meals can be effective at increasing school attendance rates
because children receive the meal only on days when they attend. Because the
opportunity cost of a child attending school can vary across school days, according to
seasonal demand for agricultural labor for example, the effectiveness of in-school meals
at changing school attendance rates depends on the value of the meal relative to the
difference between the cost and expected benefit of school attendance on a given day.
4

Furthermore, if households are credit constrained, it is possible that some households will
reduce their food expenditure as a result of the in-school meals program. This may make
more resources available for education or change a school age child's activities. The
child may then spend fewer hours working or performing household tasks. This may
allow them to attend school more often.
Moreover, school attendance may be affected through improved nutritional status.
Three aspects of nutrition may influence school attendance through in-school feeding.
The first is the short run impact of in-school feeding. In-school feeding alleviates a
child's short-term hunger during the school day, either by providing more nutrients to the
child, by providing the child with a meal when he/she would have not otherwise had one,
or by replacing a meal that would have been received after school with one during school
hours. A child who is not hungry during school hours is able to concentrate better and
learn more (Grantham-McGregor et al, 1998). Such a child may benefit more in terms of
learning from a day of school than a hungry child. In turn, this may impact households
schooling choices. Additionally, the child may prefer to attend school when he/she is not
hungry. The second nutrition-related influence of school feeding on school attendance is
through the longer run benefits of program-induced improvements in nutrition. Sustained
nutrition improvements through school feeding could improve a child's physiological
capacity for learning, which has a direct effect on the benefits of schooling and an
indirect effect by increasing the child's desire to attend school. Finally, in-school meals
may improve attendance through nutrition by reducing morbidity. In many developing
country settings, morbidity is a leading cause of missed school days. Improved nutrition,
especially adequate intake of micronutrients, can strengthen the immune system and
reduce the incidence and severity of infectious diseases among children (Scrimshaw and
San Giovanni, 1997). Therefore, if in-school meals improve children's nutritional status,
they may reduce morbidity and decrease the number of school days missed due to illness,
thus increasing attendance.
In-school feeding improves children's attendance, so they spend more hours in-
school and learning. This mechanism is dependent on the level of school quality,
including teacher/student ratios, the availability of schooling inputs, and teacher quality.
If school meals increase enrollment rates and attendance, as expected, classrooms may
5

become over-crowded and teaching quality may decrease. Similarly, if school feeding
represents a significant burden on the teachers' time, learning time may be reduced.
Thus, unless additional financial and human resources are available, school feeding
programs have the potential to worsen school compared to the pre-school feeding period.
The second channel through which SFP impacts learning achievement is through
improvements in nutrition. As with school participation, the effect of in-school feeding
on school performance may be enhanced through improved nutrition. This mechanism
operates through two channels. The short term impacts of providing children with a meal
during the school day may alleviate hunger and help them to concentrate and learn better,
thereby improving school performance. The second channel is through improvements in
cognitive functioning resulting from improvements in nutrition resulting from SFP.
These longer run impacts are conditional on in-school meals improving the
nutritional status of children and on nutritional status affecting the ability to learn.
Furthermore, the impact of in-school feeding on education will vary depending on the
initial nutritional status of the child. Pollitt (1995) discusses two biological mechanisms
through which breakfast can affect cognition. By extension, these same mechanisms are
present in an in-school meal setting, be it breakfast, snack, or lunch. The first is the
short-term metabolic and neurohormonal changes that are associated with the immediate
supply of energy and nutrients to the brain. Brain function is sensitive to these changes.
If an overnight fast is extended because a child does not eat breakfast, insulin and glucose
levels gradually decline and result in a stress response that interferes with different
aspects of cognitive function. If this occurs frequently, it is likely to have a cumulative
effect. This is the second biological mechanism discussed by Pollitt, which pertains to
the longer term impacts of the sustained contributions of breakfast to a person's health
status, which in turn affects cognitive development. To the extent that the in-school meal
is, at least in part, an addition to the child's usual nutritional intake, then this second
mechanism should also be present with in-school meals. It should then improve the
nutritional status of a child in the long run. In addition, when the school meal is nutrient
fortified, it may prevent or reduce nutritional deficiencies that affect cognition, such as
iron deficiency.
6

Many of the mechanisms through which in-school meals can affect learning
achievement and cognition also exist for take-home rations. This is particularly true for
impacts that derive primarily from the income effects of the transfer. However,
differences in education impacts between the two modalities arise for three reasons: (1)
differences in how households redistribute food among their members under the two
modalities, (2) constraints on the timing of meals under take-home rations, and (3)
differences in the type of food provided. To consider the first two effects, assume that
both programs would provide exactly the same quantity and composition of food to the
household over the course of a month.
The first effect represents a dilution of food transfers to the targeted child. With
take-home rations, the entire household is targeted by the food transfers, as opposed to
just the school-going child. When the rations are received at home rather than at school,
it easier for the household to redistribute the food to other household members. The
second effect arises because of differences in the likely timing of food consumption
under the two modalities. In-school meals benefit from timely provision of food to
students during school hours, which can increase concentration and the ability to learn.
These effects can only be replicated under a take-home rations program if children are
able to carry a meal of equivalent quantity and quality with them to school or are able to
consume a meal at home at the same time of day. The relative effectiveness of the two
modalities depends on the optimal time of day to provide food to maximize the learning
benefits. Also, it is harder to approximate the timing of in-school meals through take-
home rations, particularly with “wet” rations which must be consumed at the time they
are prepared. If the school meal is provided at breakfast, the benefits of this meal are
fairly easily replicated at home with breakfast before school under the take-home rations
program. This is true unless the child has to travel a great distance to school, and so must
eat breakfast at home under take-home rations well before he/she would receive the food
at a school breakfast. If a school meal of wet rations is provided as a mid-morning snack
or school lunch, achieving the same effects through take-home rations would require that
the child go home for the meal, disrupting the school day. Alternatively, if the learning
benefits of consuming breakfast outweigh those of lunch, and the school meal is sub-
7
optimally timed for later in the day, the meal could be better targeted at breakfast through
take-home rations.
The third effect arises if the composition of the take-home ration differs from that
of the in-school meals. In-school meals often include milk products or other nutrient-
dense foods while take-home rations primarily include cereals and oils, which may or
may not be fortified. If foods provided through the program are more nutritious than
foods eaten at home then the impact of the program on the quality of the child's diet is
dependent on the share of the child's daily consumption that comes from the program
food. In this case, in-school meals would likely provide a better quality diet for the child
than take-home rations. This difference in diet quality may lead to better educational
performance. However, these differences in impacts arise from the application of take-
home rations and in-school meals in practice, and do not derive directly from differences
in the two modalities of food delivery.
3. Empirical Strategy
3.1 The Identification Strategy
The evaluation uses an experimental, randomized, prospective design. A prospective
study collects data before the interventions begin and after a period of implementation.
This makes it possible to control for pre-program child and household characteristics and
to observe changes in outcome variables during the interventions. The experimental
design was achieved by randomly assigning the similarly eligible IDP camps, which
serve as the catchment area for primary schools in most cases, to the intervention or
“treatment” groups (SFP, THR or control).
The random assignment of IDP camps into treatment groups makes it possible to
place a causal interpretation on estimated impacts. The intuition is that if access to the
program is random within a group of similarly eligible IDP camps, beneficiary or
treatment status cannot be correlated with the outcomes. As a result, any observed
differences in average outcomes over time between the treatment groups and the control
group must be a result of the program. When access to the program is not random,
8

measures of program impact based on a comparison of mean outcomes between program
beneficiaries and a nonexperimental comparison group may be biased due to selection
effects.2 Selection effects are caused by characteristics of the IDP camps or households
that are correlated with the outcomes of interest and with the probability of receiving the
intervention. Typically there are two causes of selection effects: (i) targeting of the
program to communities based on factors affecting the outcome, and (ii) actions by the
community or the household that affect participation in the program, either through
lobbying the government or organization providing the treatment, or through the
household’s decision to participate.
Random assignment of IDP camps to the interventions eliminates potential bias
from program targeting or lobbying, but bias from sampling error or from household
selection effects may still exist. Sampling error arises when, by chance, there are
differences in mean preprogram outcomes or relevant household characteristics between
the treatment and control group after the randomization.3 In a large sample of IDP camps
sampling error would be small, but in moderate sized samples some sampling error may
exist. This can be checked by testing for equality of mean outcomes in the baseline
sample. Gilligan, Adelman and Lehrer (2006) present such tests on the 2005 baseline
survey data for various outcomes and household characteristics including household
demographics (household size, number of primary school age children (age 6-12),
number of all school age children (age 6-17), and share of children who are orphans),
education (number of grades repeated, enrollment, attendance, access to school supplies),
child anthropometry, morbidity and iron status. Most tests failed to reject equality of
means of these variables between the treatment groups, though small significant
differences were found for some measures of school attendance and anthropometry.
Additional tests for equality of mean achievement test scores in the baseline survey in
presented below.
2 Heckman and Smith (2005) and Heckman, Ichimura and Todd (1997) describe how randomizing program access eliminates selection bias and identifies causal impacts of the program. 3 This is equivalent to flipping a coin ten times and getting eight “heads.” The expectation is for an equal probability of heads and tails, but this is not always achieved in finite samples.
9

If the randomization is effective and sampling error is not a concern, the impact of
the program on outcome Y can be measured by the average difference in outcomes
between the treatment group T and the comparison group C after implementation,
(1) [ ]CTSD YYE 11 −=Δ ,
where the subscript 1 refers to the period after program implementation. This is
sometimes referred to as a “single difference” (SD) estimator of program impact, since it
compares only post-program outcomes. If the presence of sampling error leads to
differences in outcomes by treatment group before the program (period 0), unbiased
impacts can be calculated as using a treatment group “difference-in-differences” (DID)
impact estimate. This is calculated as the average “before-and-after” change in the
outcome for individuals in an intervention group minus the comparable average change in
the outcome for the control group (or alternative treatment group),
(2) ( ) ( )[ ]CCTTDID YYYYE 0101 −−−=Δ .
In the impact estimates constructed here, a child’s treatment status is determined by age
and by the treatment assignment of the IDP camp in which she resides. This measure of
program impact represents the effect of offering access to the program, rather than the
effect of participation in the program (Burtless, 1995). The effect of participation in a
program is harder to measure because program managers can control access to the
program (unless people are willing to migrate to gain access), but once the program is
available households control the decision to participate. In the evaluation literature,
measures of the impact of access to a program are referred to as ‘intent to treat’ impact
estimates, while measures of the impact of participation are referred to as the average
impact of the ‘treatment on the treated.’ Intent to treat measures of program impact are
typically lower than measures of the impact of the treatment on the treated because
impacts are reduced whenever a potential beneficiary decides not to participate.
In some cases, it is appropriate in impact analysis to control for other factors that
may affect program impact even in randomized experiments. One such case arises when
other exogenous or independent events, such as economic shocks, occur during the
10

program with different frequency or intensity across the treatment groups. Failure to
control for such events in the analysis would lead to misleading attribution of program
impact. A second case arises when there are systematic differences in household
preprogram characteristics that may affect program outcomes, even if there is no
difference in average preprogram outcomes themselves. In this case, controlling for the
effect of these preprogram characteristics in the analysis may be justified and can
improve the precision of the impact estimates. In these cases, impacts can be estimated
conditional on a vector of pretreatment characteristics or contemporaneous shocks, X,
(3) ( ) ( )[ ]XYYYYE CCTTXDID |0101| −−−=Δ .
3.2 Econometric Specification
Regression analysis was used to estimate the impact of the SFP and THR programs. This
is a convenient way to estimate differences in mean outcomes, to test for statistical
significance, and to control for other factors when necessary. Let represent access to
the SFP program and represent access to the THR program. The single difference
impact of the programs in (1) can be estimated as
1T
2T
(4) icic TTY εβββ +++= 22110 ,
where
icY is the outcome for the ith child in camp c
=1 if the child resides in a camp assigned to the SFP program, 0 otherwise 1T
=1 if the child resides in a camp assigned to the THR program, 0 otherwise 2T
icε is the unobserved child and camp specific error term.
If the randomization was effective, leading to no difference in mean outcomes before the
programs, estimating (4) on outcomes measured after the programs have been
11

implemented provides a well-identified estimate of the impact of the SFP program in 1β
and of the THR program in 2β .
If preprogram data on outcomes are available, and particularly if sampling error
results in differences in these outcomes before the programs, DID estimates in (2) can be
obtained by estimating
(5) ictict RTRTRTTY εββββββ ++++++= 2252142322110 ,
where
2R indicates the second survey round, conducted after program implementation
ictY is the outcome for the ith child in camp c in period t
ictε is the unobserved child-, camp-, and period-specific error term.
Here 4β is the DID estimate of the impact of the SFP program on the change in the
outcome before and after the program began and 5β is the DID estimate of the impact of
the THR program on the change in the outcome. Conditional impact estimates such as
those in (3) can be obtained by adding a term for X in equation (5).
4. Introduction to the Northern Uganda FFE Programs and Evaluation Study Data
4.1 The Northern Uganda Sample
The sample was drawn from IDP camps in Pader and Lira districts. Although WFP
operates school meal programs in villages in at least 13 other districts in Uganda with
more than 400,000 students receiving meals, the use of a prospective evaluation design
required conducting a baseline survey before the initiation of any program in sites
included in the study. WFP decided to conduct an expansion of school-based feeding
into Pader and Lira districts in early 2006, which created the opportunity to conduct the
evaluation. The programs were introduced only in IDP camps in these districts because
living conditions were generally worse inside the camps, though primary school
12

enrollment and attendance rates may not have been lower inside the camps than outside.
Also, WFP already had a presence in the camps because it provided them with general
food rations.
Primary schools in the IDP camps, called “learning centers” (LCs), are an
agglomeration of students and staff displaced from their home primary schools in their
villages of origin. In addition, if a local primary school existed in the area in which the
camp was formed, this “host” school is also embedded in the learning center with the
displaced schools. In some cases, the classes of the original schools are preserved within
the LCs, though it is more common for students from different displaced schools to be
intermingled in classes in an LC, in part due to teacher shortages. Consultations with
WFP district staff from Lira and Pader indicated that most IDP camps contained only one
LC at the primary school level and that in most cases nearly all students in the LC would
be residents of the camp. Based on this information, it was decided that camps would
serve as the clusters for the sample and that recently-collected camp census data could be
used to draw the household sample.
The IDP camps included in the sample are those that were targeted by WFP to
receive school feeding starting in 2006. The targeting criteria used included the level of
poverty and remoteness of the camp, as well as the intensity of conflict impacts in that
area.4 Using the target program size set by the WFP budget, camp learning centers were
randomly selected into the SFP, THR and control group, stratified by district, until the
program quota of 74,000 currently enrolled students was met. This led to the selection of
31 IDP camps for the study, 11 in the SFP group, and ten each in the THR and control
groups.
Table 1 presents the IDP camps in each treatment group by district with
enrollment data from the District Education Officer for the learning center(s) in that
camp.5 There are 11 IDP camps in the SFP group, and 10 each in the THR and control
groups. A striking feature of the LCs in these camps is that they are large. Average LC
enrollment is 4431 students. Within treatment groups, SFP and THR are smaller, with
4 Gilligan, Adelman and Lehrer (2006) describe these criteria, the sampling strategy, and the statistical power of the sample in greater detail. 5 In most cases, LCs have the same name as the camp in which they reside, though there are exceptions. Also, Aloi Camp contains two LCs, which were grouped for sampling.
13

14
average enrollment of 3718 and 3515, respectively. Control group mean enrollment is
larger primarily because the two largest LCs were selected into the control group by
chance. Like most enrollment figures in Uganda, these are probably overstated because,
after the introduction of the Universal Primary Education (UPE) program, the
government provided funding to schools based on enrollment via capitation grants. This
created an incentive for schools to overstate enrollment.

15
Table 1: IDP Camps by Treatment Group and Pre-Program Learning Center Enrollment
In-school feeding (SFP)
Take-home rations (THR)
Control
WFP Pre-Program Enrollment
Evaluation Pre-Program Enrollment
PADER1 Lira Palwo 7337 Kalongo 10522 Patongo 16553 Adilang 3506 Amyel 5779 Geregere 2847 Wol 2674 Corner Kilak 1387 Omiya Pacwa 2792 Puranga 8432 Arum 1274 Lagute 6039 Atanga 1657 Omot 3831 Pajule 4305 Subtotal 23606 22793 32536 46399 78935 LIRA2 Amugu 1656 Alebtong 5253 Apala 5766 Okwang 3135 Corner Adwari 2414 Aliwang 675 Abako 620 Abia 2577 Alanyi 3244 Barr 3892 Orit 277 Aloi 13334 Ogur 3710 Agweng 2220 Aromo 5384 Orum 4278 Subtotal 17291 12741 28403 30032 58435 PADER & LIRA 40897 35534 60939 76,431 137,370 N schools 11 10 10 Mean school enroll 3718 3553 6094
NOTES: 1Pader enrollment data are from 2004. 2Lira enrollment data are from May 2005.

Household samples were selected from each camp using data from a recent “revalidation”
of IDP camp resident lists conducted by WFP in Lira district and by World Vision on
behalf of WFP in Pader. Camp revalidations allow WFP to maintain current and accurate
records on residency in the camp, for the purpose of general food distribution. These
revalidation exercises were completed in June 2005, and provided the equivalent of a
camp census for each IDP camp.
4.2 Description of the Interventions
WFP’s School Feeding Program (SFP) provides a free fortified mid-morning snack and
lunch to all students enrolled in schools operating their program. The snack consists of a
porridge made from micronutrient fortified corn-soya-blend (CSB), sugar, and water.
The lunch consists mainly of hot posho (maize meal) and beans, sometimes substituted
with rice or complemented with vegetables and fruit from school gardens. The lunch also
includes vegetable oil and salt. The combined meals provide roughly 1049 kcals of
energy, 32.6 gm protein, and 24.9 gm fat at a cost of US$ 0.17 per child per school day.
The ration also meets two thirds of the child’s daily vitamin and mineral requirements,
including 99 percent of iron requirements.
In order to qualify for the SFP, schools are required to meet facility requirements
including the presence of cooking facilities, latrines, and a basic hand washing facility.
The government and WFP (through its food-for-assets program) work with schools to
provide sources of safe drinking water. The food-for-assets program sometimes provides
resources for building teacher housing in conjunction with the SFP. Families with
children in the SFP are required to contribute fuel wood and a fee of USH 200 (roughly
0.10 $US) per month toward the pay of the cooks. According to WFP, there is no limit to
the number of school age children from a household that can receive school-based
feeding.
The rations provided in the take-home rations (THR) program are equal in size
and composition to the food received by SFP beneficiaries. These rations are provided to
THR beneficiary households once per month. THR beneficiary households receive a
THR ration for each primary-school age child that is enrolled and attends school at least
85 percent of the time. Complementary infrastructure such as school kitchens and water
16

storage tanks are not provided or required in THR camps as they are in camps receiving
the SFP. However, access to these services is only available to SFP beneficiaries at
school. The distribution of the quality of sanitary, cooking and water facilities outside of
school should be similar in SFP and THR camps.
An important characteristic of the IDP camp setting for this study is that all camp
residents in Pader and Lira districts receive a general monthly food ration from WFP.
The size of these monthly rations is adjusted for household size, but not for the age
composition of household members.6 These general food rations are delivered separately
from the THR rations. In areas where other sources of food and income are available,
WFP provides a fraction of the full monthly ration. In Pader, residents of all camps
received a 75 percent ration in 2005. Most camps in Lira received a 50 percent ration in
2005, though some received a 25 percent ration. These rations were subsequently
reduced in 2006 as the security situation improved. The pattern of distribution of general
food rations by WFP suggests that access to alternative income and food sources is
significantly more limited in Pader than in Lira. The composition of the food rations is
similar to that of the school feeding ration: maize meal, beans, corn soya blend and oil.
One implication of the general food ration is that the food provided by the interventions
is an exact substitute for one of the primary food sources already available at home in the
form of a general food ration. This suggests that in SFP and THR camps, the FFE ration
increases the amount of food available to the household, but not the type.
As the security situation continued to improve in 2006, the government decided to
close all but one IDP in Lira. These camps were disbanded and families were encouraged
to return home. In Pader, many camps were broken up into smaller satellite camps in
2006 as a first stage toward ultimately disbanding these camps. At the time of the 2007
survey round, nearly all sample households in Lira and many in Pader had changed
location since the 2005 baseline survey round. From the original sample of 904
households, we estimate that 70 percent of households were in a different location in
2007. After a considerable effort at tracking households using contacts provided in the
baseline survey, baseline GPS locations, and assistance from local officials, we were able
6 A full ration for a household with five members, for example, is considered sufficient to meet all daily food needs for such a household with a typical composition, such as two adults and three children.
17

to find and interview 80 percent of the original sample households in the 2007 survey
round. We also added roughly 200 additional households to the sample in that round so
that the statistical power of the sample would not be too adversely affected.7 This
relocation of households lead to some disruption of the SFP and THR programs,
particularly in Lira. The programs were restarted in most Pader satellite camps after an
interruption of only a few weeks. In Lira, the programs began again in relocated schools
after an interruption of a couple of months on average.
4.3 The Achievement and Cognitive Development Tests
The achievement tests used were not taken from an international test but were developed
by Uganda’s Education Standards Agency (ESA), an arm of the Ministry of Education
that develops other standardized tests in Uganda. Tests were developed for both the
baseline and resurvey. Tests in both survey rounds had the same basic structure but the
questions differed. In both rounds, ESA staff consulted with teachers from the sample
districts to ensure the tests were relevant to concepts being taught. All achievement tests
were then field tested before being used in the study.
In each survey round, two separate groups of achievement tests were developed.
The first group, “lower primary”, was designed for grade 2 and included a math test and a
literacy test. The second, “upper primary”, was designed for grade 5 and also included a
math test and a literacy test. The lower primary tests were administered to children in the
sample enrolled in grades 2 and 3, as well as to children in the sample age 7-9 who were
not enrolled in school. The upper primary tests were administered to children enrolled in
grades 5 and 6 and to non-enrolled children age 10-12.
The baseline achievement test data collection was hampered by logistical
difficulties. Only 257 children age 6-14 took at least one of the math and literacy tests in
that year, though many more were eligible. Many of the difficulties arose because the
tests were conducted at the end of the period of household data collection, as the school
year was ending, so it was difficult to locate the children. Nonetheless, there should be
no systematic differences between the children who took the tests and those who should
have but did not. The difference occurred because of field work constraints and
7 Tests for the effect of attrition on impact estimates presented here will be included in a subsequent draft.
18
enumeration errors and not individual characteristics of the sample children. Also, any
factors affecting which children took the tests should be uncorrelated with treatment
status in the baseline.
The administration of the achievement tests in the resurvey was much more
successful. There were 608 children age 6-14 who took the tests during the 2007 survey
round. For those children who were not tested in that year, it is unlikely that there was
significant self-selection by the children or that the reasons for missing the tests are
correlated with treatment status. All of the achievement tests in a camp or village were
conducted on the one day of data collection for that location, with no opportunity for
second visits. Therefore, some children were missed if they were unavailable or if the
household was interviewed late in the day. All of the achievement tests were conducted
in the afternoons. There were 78 children who took the achievement tests in both survey
rounds.
Two standard cognitive development tests were administered to all children
between the ages of 6 and 13 during the resurvey. They were administered by Ugandan
enumerators with backgrounds in psychology. The cognitive development testing was a
one-on-one test administered orally in the local language. The first component is the
Raven's Colored Progressive Martrices which assesses reasoning in the visual modality
and intellectual efficiency—the ability to become more efficient by learning from
immediate experience with the problem (Mills et al., 1993). It is a test of inductive
reasoning with the problems becoming progressively more difficult. The test appears as a
series of pictures in which a pattern is displayed with a piece missing. Five pieces are
displayed at the bottom of the page with candidate patterns to replace the missing piece.
The test taker is asked to select the piece that completes the pattern. The test includes 36
such choices, which become increasingly difficult. The Raven's Colored Progressive
Matrices was constructed to measure "the ability to forge new insights, the ability to
discern meaning in confusion, the ability to perceive, and the ability to identify
relationships" (Raven et al. 2000a, p.1). The version of the test used has also been
standardized in a study recognized by the producers of the Raven’s test, which was
conducted among a similar population in Western Kenya (see Costenbader and Mbugua
Ngari, 2001).
19

The second component of the cognitive development testing was the Wechsler
Digit Span subtest of the Wechsler Adult Intelligence Scale-Revised. The digit span test
consists of two components; the digits repeated forward and digits repeated backward. It
is the most frequently used clinical measure of short-term auditory memory. The digit
span forward is a process involving attention and the holding of information while the
digit span backward is a more complex process that involves the additional process of
converting information into the reverse order. Different psychological processes are
involved in each task.
5. Results The investigation of the impact of the SFP and THR programs focuses first on obtaining
accurate estimates of the average impact of each program on primary-school-age children
age 6-14.8 For both learning achievement and cognitive development, we present
estimated average impacts using specifications that take the best advantage of the data.
We then conduct robustness checks to investigate whether the size and significance of
measured impacts changes due to changes in the specification. Results also include
differences in impact by age and gender.
5.1 Learning Achievement
5.1.1 Baseline Test Scores and Composition of the Sample by Test Level
Test score data from the baseline survey indicates that the random assignment of IDP
camps to treatment groups was reasonably successful. Table 2 shows there is no
significant difference in mean math or literacy test scores between treatment groups in
the baseline survey, with treatment group status defined by the program actually assigned
to the IDP camp at the beginning of the 2006 school year. The average score on the math
test was 42.8 and the average score on the literacy test was 23.4. However, there are
8 Although the recommended age for primary school in Uganda is 6-12, primary school participation rates remained very high among 13 and 14 year olds, but began to decline for 15 year olds in this sample from Northern Uganda. As a result, we consider age 6-14 as the relevant age range for learning outcomes of primary school students.
20

some differences in test scores by test instrument. Mean test scores in math were 5.1
points lower on the upper primary exam than on the lower primary exam, though this
difference is only weakly significant. On the literacy exam, mean scores were much
lower, by 17.1 points, on the upper primary exam than on the lower primary exam. This
substantial difference arose in part because the upper primary literacy exam was
conducted in English. In 2005, English was taught in Ugandan primary schools starting
in grade 2. The Ugandan Education Standards Agency, which constructed the tests, have
conducted similar exams at the upper primary level in English elsewhere in Uganda.
Although the tests administered in the baseline survey were piloted in an IDP camp in
Lira District, English language skills among students in upper primary grades (grades 5-
6) in the IDP camps were more limited than expected. Comparing test performance by
test instrument across treatment groups, the only difference is that control group children
who took the lower primary exam scored 7.8 points higher on average than children in
the school feeding group, though this difference is only weakly significant. These results
suggest that comparisons of average test scores between treatment groups during program
implementation using single differences estimates in 2007 should provide valid treatment
effect estimates, as long as the impact estimates are conditioned on the test instrument
taken. For math tests in lower primary, DID estimates between 2005-07 are preferred.
Also, because the share of children taking the lower primary or upper primary exams may
not be the same across treatment groups and survey rounds, we also test for differences in
performance across treatment groups by test instrument.
The first measures of program impact considered are the SD estimates from 2007.
Before presenting these estimates, we summarize mean test scores in 2007 by treatment
group and by test instrument. Table 3 shows that mean math test scores in 2007 were
higher for the SFP and THR groups than for the control group. Mean literacy scores
were slightly higher in the SFP group and slightly lower in the THR group than in the
control group. As in 2005, mean scores were lower for the upper primary test than for
the lower primary test, by 9.2 points in math and by 11.9 points in literacy. As a result,
the differences in mean test scores by treatment group in Table 3 do not represent
accurate measures of program impact because the share of children taking the upper
primary exam varies by treatment group. The lower panel in Table 3 presents the share
21

22
of children taking the upper primary exam by age group and by treatment group. In
math, the share of children taking the harder upper primary exam is smaller in the THR
group than in the SFP or control groups. In literacy, the control group has a much higher
share of children taking the upper primary exam, which would tend to depress average
test scores without controlling for test level. This pattern indicates the importance of
controlling for test level in the impact estimates. All subsequent impact estimates include
controls for test level. Only results of the lower primary exam are reported for 6-10 year
olds because so few children in this age group took the upper primary exam.

23
Table 2: Difference in Mean Achievement Test Scores Across Treatment Groups at Baseline, 2005
Math Literacy
Test Instrument
Test Instrument
N Sample
MeanLower
PrimaryUpper
PrimaryDiffer-
ence NSample
MeanLower
PrimaryUpper
PrimaryDiffer-
ence Full Sample 323 42.8 44.6 39.5 5.1* 318 23.4 28.6 11.5 17.1*** (1.97) (5.10) By Treatment Group School meals 134 41.1 42.2 40.8 131 21.2 26.3 10.1 Take-home rations 103 43.1 43.5 41.9 101 25.6 31.3 12.4 Control group 86 45.4 50.0 33.6 86 24.4 28.9 12.8 Difference SFP v. Control -4.38 -7.84* 7.20 -3.22 -2.57 -2.69 (1.00) (1.78) (1.24) (0.96) (0.55) (0.59) THR v. Control -2.39 -6.49 8.35 1.19 2.41 -0.38 (0.46) (1.28) (1.24) (0.26) (0.35) (0.07) SFP v. THR -1.99 -1.35 -1.16 -4.41 -4.98 -2.31 (0.46) (0.27) (0.20) (0.85) (0.63) (0.55)
Notes: Sample includes 6-14 year olds who took either test in 2005. Treatment groups are defined by actual IDP camp treatment status. Absolute value of t statistics in parenthesis, based on standard errors that are robust to clustering on baseline IDP camps. * Significant at the 10% level; ** Significant at the 5% level; *** Significant at the 1% level.

Table 3: Mean Achievement Test Scores by Treatment Group and Test Instrument, 2007
Math Literacy
N Mean N Mean Full Sample 426 36.7 449 14.6 By Test Instrument Lower Primary 270 40.1 297 18.6 Upper Primary 156 30.9 152 6.7 Difference 9.2*** 11.9*** (3.51) (5.10) By Treatment Group School meals 178 36.9 195 15.2 Take-home rations 143 38.1 149 13.9 Control group 105 34.7 105 14.5 Math Literacy Age (years) 6-14 6-10 11-14 6-14 6-10 11-14 Share taking upper primary test School meals 38.8 6.2 66.0 32.8 4.0 63.2 Take-home rations 32.2 8.0 58.8 30.9 6.6 56.2 Control group 39.0 10.7 71.4 40.0 5.9 72.2
Notes: Sample in upper panel includes 6-14 year olds who took either test in 2007. Treatment groups are defined by actual IDP camp treatment status. Absolute value of t statistics in parenthesis, based on standard errors that are robust to clustering on baseline IDP camps. * Significant at the 10% level; ** Significant at the 5% level; *** Significant at the 1% level.
5.1.2 Alternative Estimates of Average Program Impacts and Impacts by Age Cohorts
We now present the SD estimates of impacts of the SFP and THR programs on test scores.
Table 4 shows average impacts by age group (controlling for test level) and impacts by test
instrument for original survey respondents (nonreplacements) who were interviewed again in
2007. Neither SFP nor THR have an impact on average math or literacy test scores for 6-14 year
olds in 2007. There are also no impacts identified for either math or literacy on 6-10 year olds.
However, for 11-14 year olds, access to the SFP increases math test scores by 7.4 points and
access to the THR program increases math test scores by 10.4 points. As shown in the last row
of Table 4, impacts are not significantly different between SFP and THR. The magnitude of
24

these impacts was very similar by test level, though estimates by test level were less precise and
only the impacts of THR on upper primary exam takers were significant. These results are also
robust to including controls for the child’s age or to replacing the treatment indicator with the
original treatment assignment.
Table 4: FFE Impacts on Test Scores, Single Difference Estimates, 2007 Math
Literacy
Age 6-14 6-10 11-14 6-14 6-10 11-14 (1) (2) (3) (4) (5) (6) Average Impact
School meals 2.168 7.431** -0.166 1.991 (0.80) (2.41) (0.07) (0.91) Take-home rations 2.728 10.422** -1.696 2.595 (0.73) (2.52) (0.68) (1.30)
By Test Level
School meals * 0.409 -0.464 6.184 -1.616 -2.538 1.152 lower primary test (0.11) (0.12) (0.79) (0.45) (0.69) (0.22) Take-home rations* 0.958 0.980 10.250 -2.912 -3.189 3.867 lower primary test (0.20) (0.20) (1.29) (0.74) (0.81) (0.65) School meals * 4.922 8.003 2.223 2.508 upper primary test (1.11) (1.69) (0.81) (0.85) Take-home rations* 5.723 10.359** 0.242 1.657 upper primary test (1.44) (2.40) (0.17) (0.96)
Observations 426 262 214 449 290 222 H0: school meals =
take-home rations (p-value)
0.887 0.777 0.506 0.525 0.843 0.826
Notes: Treatment groups are defined by actual IDP camp treatment status. Absolute value of t statistics in parenthesis, based on standard errors that are robust to clustering on baseline IDP camps. Hypothesis test is for equality of average impacts for 6-14 and 11-14 year olds and for equality of impacts on lower primary tests for 6-10 year olds. * Significant at the 10% level; ** Significant at the 5% level; *** Significant at the 1% level.
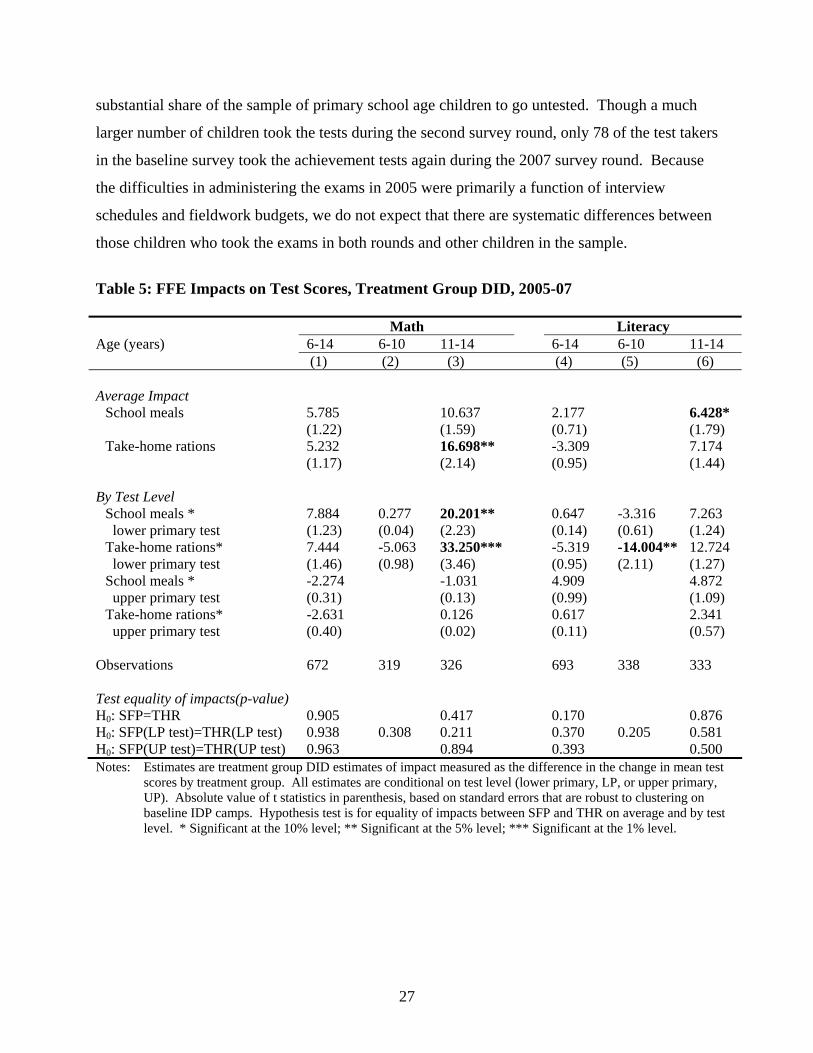
The treatment group DID estimator in equation (2) makes use of achievement test scores
from both survey rounds to determine whether either program had an impact on the change in
average test scores over time. This approach is more effective at removing sampling error bias
by eliminating the effects of any differences in mean test scores across treatment groups in the
baseline. Table 5 presents the DID impact estimates for each program on average and by lower
25

and upper primary test level. Average impacts on change in math test scores are not significant
for the full sample of 6-14 year olds, but access to take-home rations leads to a 16.7 point
increase in the change in average math scores for 11-14 year olds from 2005-07 relative to the
control group. Disaggregating by test level, this large effect is the result of a very large 33.2
point impact of THR on change in math test scores on the lower primary exam by 11-14 year
olds. Beneficiaries of the school feeding program in this age group who took the lower primary
test also had a significant jump, of 20.2 points, in math scores from 2005-07 relative to the
control group. No impact was observed for 11-14 year olds taking the upper primary math exam.
This pattern is consistent with results from Tables 2 and 4 showing that SFP and THR
beneficiaries had lower average math scores than the control group on the lower primary exam in
2005, but higher average scores on the same exam in 2007. On the upper primary exam, SFP
and THR beneficiaries had higher mean math scores in 2005 (though not significantly so) as well
as in 2007, leading to no significant difference in the change in scores from 2005-07 for children
in either program relative to the control group. Despite the larger impact of THR relative to the
SFP on average math scores and lower primary math scores for 11-14 year olds, the results of
hypothesis tests presented at the bottom of Table 5 show that there is no significant difference in
impacts between THR and SFP on changes in scores for any of the math exams.
On the literacy exam, neither program had an impact on the change in average scores for
primary school age children (age 6-14). However, beneficiaries of the SFP had a weakly
significant larger change in literacy test scores for 11-14 year olds. A surprising result is that 6-
10 year olds in camps receiving THR had a statistically significant 14 point decline in literacy
test scores relative to the control group. This effect is difficult to explain. It suggests that receipt
of take-home rations interrupted learning in some way, though the pathways of such an effect
remain unclear.
An alternative to these treatment group DID estimates is to estimate a child fixed effects
(FE) regression. This approach compares changes in scores on tests taken by the same children
in both survey rounds, while controlling for any unobserved, time-invariant child-specific
effects. Constructing child fixed effects estimates requires us to restrict the sample only to
children who took achievement tests in both 2005 and 2007. A shortcoming of this approach for
our data is that this leads to a fairly large restriction of the sample. As described in Section 4,
logistical difficulties in conducting the achievement tests during the baseline survey caused a
26
substantial share of the sample of primary school age children to go untested. Though a much
larger number of children took the tests during the second survey round, only 78 of the test takers
in the baseline survey took the achievement tests again during the 2007 survey round. Because
the difficulties in administering the exams in 2005 were primarily a function of interview
schedules and fieldwork budgets, we do not expect that there are systematic differences between
those children who took the exams in both rounds and other children in the sample.
Table 5: FFE Impacts on Test Scores, Treatment Group DID, 2005-07 Math Literacy Age (years) 6-14 6-10 11-14 6-14 6-10 11-14 (1) (2) (3) (4) (5) (6) Average Impact
School meals 5.785 10.637 2.177 6.428* (1.22) (1.59) (0.71) (1.79) Take-home rations 5.232 16.698** -3.309 7.174 (1.17) (2.14) (0.95) (1.44)
By Test Level
School meals * 7.884 0.277 20.201** 0.647 -3.316 7.263 lower primary test (1.23) (0.04) (2.23) (0.14) (0.61) (1.24) Take-home rations* 7.444 -5.063 33.250*** -5.319 -14.004** 12.724 lower primary test (1.46) (0.98) (3.46) (0.95) (2.11) (1.27) School meals * -2.274 -1.031 4.909 4.872 upper primary test (0.31) (0.13) (0.99) (1.09) Take-home rations* -2.631 0.126 0.617 2.341 upper primary test (0.40) (0.02) (0.11) (0.57)
Observations 672 319 326 693 338 333 Test equality of impacts(p-value) H0: SFP=THR 0.905 0.417 0.170 0.876 H0: SFP(LP test)=THR(LP test) 0.938 0.308 0.211 0.370 0.205 0.581 H0: SFP(UP test)=THR(UP test) 0.963 0.894 0.393 0.500 Notes: Estimates are treatment group DID estimates of impact measured as the difference in the change in mean test
scores by treatment group. All estimates are conditional on test level (lower primary, LP, or upper primary, UP). Absolute value of t statistics in parenthesis, based on standard errors that are robust to clustering on baseline IDP camps. Hypothesis test is for equality of impacts between SFP and THR on average and by test level. * Significant at the 10% level; ** Significant at the 5% level; *** Significant at the 1% level.
27
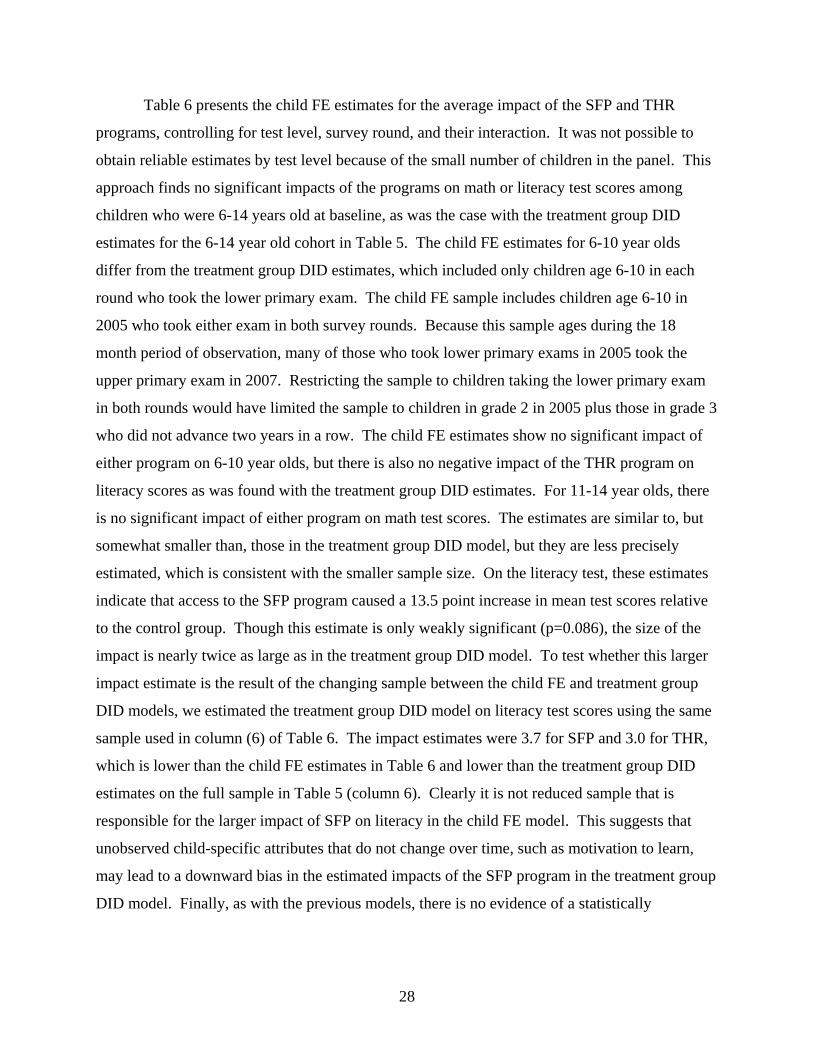
Table 6 presents the child FE estimates for the average impact of the SFP and THR
programs, controlling for test level, survey round, and their interaction. It was not possible to
obtain reliable estimates by test level because of the small number of children in the panel. This
approach finds no significant impacts of the programs on math or literacy test scores among
children who were 6-14 years old at baseline, as was the case with the treatment group DID
estimates for the 6-14 year old cohort in Table 5. The child FE estimates for 6-10 year olds
differ from the treatment group DID estimates, which included only children age 6-10 in each
round who took the lower primary exam. The child FE sample includes children age 6-10 in
2005 who took either exam in both survey rounds. Because this sample ages during the 18
month period of observation, many of those who took lower primary exams in 2005 took the
upper primary exam in 2007. Restricting the sample to children taking the lower primary exam
in both rounds would have limited the sample to children in grade 2 in 2005 plus those in grade 3
who did not advance two years in a row. The child FE estimates show no significant impact of
either program on 6-10 year olds, but there is also no negative impact of the THR program on
literacy scores as was found with the treatment group DID estimates. For 11-14 year olds, there
is no significant impact of either program on math test scores. The estimates are similar to, but
somewhat smaller than, those in the treatment group DID model, but they are less precisely
estimated, which is consistent with the smaller sample size. On the literacy test, these estimates
indicate that access to the SFP program caused a 13.5 point increase in mean test scores relative
to the control group. Though this estimate is only weakly significant (p=0.086), the size of the
impact is nearly twice as large as in the treatment group DID model. To test whether this larger
impact estimate is the result of the changing sample between the child FE and treatment group
DID models, we estimated the treatment group DID model on literacy test scores using the same
sample used in column (6) of Table 6. The impact estimates were 3.7 for SFP and 3.0 for THR,
which is lower than the child FE estimates in Table 6 and lower than the treatment group DID
estimates on the full sample in Table 5 (column 6). Clearly it is not reduced sample that is
responsible for the larger impact of SFP on literacy in the child FE model. This suggests that
unobserved child-specific attributes that do not change over time, such as motivation to learn,
may lead to a downward bias in the estimated impacts of the SFP program in the treatment group
DID model. Finally, as with the previous models, there is no evidence of a statistically
28

significant difference in impacts between SFP and THR modalities on math or literacy test scores
in the child FE model.
Table 6: FFE Impacts on Test Scores, DID with Child Fixed Effects, 2005-07 Math
Literacy
Age (years) 6-14 6-10 11-14 6-14 6-10 11-14 (1) (2) (3) (4) (5) (6) Average Impact
School meals -3.468 -6.411 7.763 7.347 2.343 13.471* (0.47) (0.64) (0.68) (1.23) (0.26) (1.78) Take-home rations 3.019 2.995 13.981 6.606 5.410 9.018 (0.37) (0.27) (1.15) (1.04) (0.54) (1.22)
Observations 138 82 56 146 84 62 Number of children 69 41 28 73 42 31 R-squared 0.44 0.53 0.37 0.50 0.39 0.74 H0: school meals = take-home rations (p-value)
0.385 0.376 0.567 0.904 0.743 0.548
Notes: Estimates are DID estimates controlling for child fixed effects. All estimates are conditional on test level, survey round, and the interaction of test level and survey round. Absolute value of t statistics in parenthesis, based on standard errors that are robust to clustering on baseline IDP camps. Hypothesis test is for equality of average impacts between SFP and THR. * Significant at the 10% level; ** Significant at the 5% level; *** Significant at the 1% level.
5.1.3 FFE Impacts on Test Scores by Gender
We consider whether impacts of the SFP and THR programs on test scores may differ by gender
of the beneficiary. Demand for child labor, returns to primary school education, and cultural
norms about work and child rearing in adulthood can all vary by gender. Each of these factors
affect households’ decisions about how much to invest in the primary education of boys and
girls. This suggests that FFE programs, which subsidize these human capital investments, may
have differential effects by gender. For example, the FFE subsidy may have larger impacts on
the gender that faces larger opportunity costs of schooling. If households adopt a common
gender-based specialization of tasks that has boys working more in agriculture and girls working
more at home, then, other things equal, opportunity costs of schooling will be higher for boys in
households with large farms and for girls in households with a higher number of younger
children. These effects may also differ by FFE modality. It is easier for parents to redistribute
29

food rations from the THR program to other household members than to redistribute food away
from SFP beneficiaries at other meals. This makes it easier for parents in THR beneficiary
households to target children by gender, so gender impacts may depend on the SFP or THR
modality.
Table 7 presents the average impact of access to the SFP and THR programs on girls’ and
boys’ test scores, conditional on test level and district of residence. Results show no significant
impact of SFP or THR on girls’ math scores. However, boys with access to the SFP or THR
programs have a larger increase in math scores, of 10-11 points, than boys in the control group,
though this effect is only weakly significant. The growth in boys’ literacy scores is not
significantly different than in the control group. For girls taking the literacy exams, there is a
weakly significant negative impact of access to the SFP or THR programs on test scores. Girls’
scores in the programs drop by 7-8 points on average relative to the control group. This result is
unexpected, in part because the effect is the same across both programs. We continue to
investigate the reasons for this result.
Table 7: FFE Impacts on Change in Test Scores by Gender, Treatment Group DID, 2005-07 Math Literacy (1) (2) Girls School meals -0.857 -7.367* (0.15) (1.75) Take-home rations 0.640 -7.796* (0.12) (1.87) Boys School meals 10.313* 5.943 (1.95) (1.60) Take-home rations 11.891* 1.880 (1.93) (0.43) Test equality of impacts (p-value) Girls: H0: SFP=THR 0.783 0.932 Boys: H0: SFP=THR 0.811 0.280 Notes: Estimates are treatment group DID estimates of impact measured as the difference
in the change in mean test scores between program beneficiaries and control group individuals of the same gender. Estimates are conditional on test level and district of residence. Absolute value of t statistics in parenthesis, based on standard errors that are robust to clustering on baseline IDP camps. Hypothesis test is for equality of average impacts between SFP and THR. * Significant at the 10% level; ** Significant at the 5% level; *** Significant at the 1% level.
30

5.1.4 Evidence of FFE Impacts on the Primary Leaving Exam
At the end of each school year Ugandan students in grade 7, the last year of primary school, take
the Primary Leaving Exam (PLE) conducted by the Uganda National Examinations Board
(UNEB). Uganda’s Ministry of Education and Sports (MOES), use the PLE to determine
whether primary school students can be promoted to secondary school. Children who perform
well on the PLE exam are also more likely to be admitted to a better quality secondary school, so
the stakes for this exam are considerable.
PLE exam results provide additional evidence on the impact of the SFP and THR
programs on student learning achievement. We have two sources of data on PLE results:
respondent recalls from the 2007 round of the household survey and data from the 2007 primary
school survey that accompanied the household survey on number of children passing the PLE at
each level. The household survey collected PLE scores on any child who was no longer enrolled
in primary school in April 2007 and who took the PLE exam since 2005. This sample includes
children who were in grades 6 and 7 during the 2005 baseline survey. The grade 7 students took
the exam in December 2005, before the start of the SFP and THR programs, so they were
effectively untreated at the time of their PLE exams. The grade 6 students from the baseline
survey took the exam in December 2006, at the end of the first year of the FFE programs. The
school level data provides the share of students in that primary school that passed the PLE in
2006.
The PLE consists of four exams: English, social studies, science and mathematics. Each
PLE exam is graded on a 9-point scale, grade 1 being the highest and 9 the lowest. The numeric
grades on the four exams are added to give the total “aggregate” score, ranging from 4-36, with 4
being the best score. The aggregate score is used to place the successful candidates into four
passing divisions. To facilitate interpretation of results, we inverted the scales for the division
and aggregate scores into increasing measures of test performance, so that an improvement in
test scores would be positive. Table 8 shows how division and aggregate scores are related and
presents the inverted scales used to estimate program impacts.
31

Table 8: Primary Leaving Exam Scores, Division and Aggregate Scores and Inverted Scales
Division Aggregate Inverted
Division Inverted Aggregate
1 4 – 12 4 28 – 36
2 13 – 24 3 16 – 27
3 25 – 32 2 8 – 15
4 33 – 35 1 5 – 7
Unsuccessful 36 Unsuccessful 4
We estimate the impact of the SFP and THR programs on both the inverted division score and
inverted aggregate score for children in the household survey.9 From the school survey, we
estimate the share of test takers that passed the PLE, which is equivalent to achieving division 3
or 4 in the inverted scale. The impact on divisions is estimated using an ordered probit model,
while the impact on the aggregate score is estimated by OLS. The impact on school level share
of children passing the PLE was estimated by OLS.
Table 9 presents the impact results for the PLE scores. Columns 1 and 2 present impacts
on the inverted division and aggregate scores, respectively, for individuals in the household
survey who took the PLE in 2005 or 2006. Only 42 children in the sample took the exam in
those years, 27 in 2005 and 15 in 2006. Columns 1 and 2 show that the THR program had a
significant impact on the PLE division and aggregate score for pupils who took the PLE at the
end of their first year in the programs, those completing primary school in 2006. The THR
program lead to an improvement in the division score of 0.80 (p-value: 0.03) and to an
improvement in the aggregate score of more than 5 points (p-value: 0.003), a fairly large increase
in scores. A test of equality of impacts of the SFP and THR programs on the aggregate score
rejects that the impacts were the same, but only at the 10% level (bottom of Table 9). There was
no significant effect of the SFP program on either the division or aggregate score. As expected,
the estimates show no effect of living in an IDP camp about to start the SFP or THR programs on
9 Respondent reports of division scores and aggregate scores did not exactly correspond to the relationships shown in Table 8. Because we could not reconcile which score was inaccurate, we estimate the impacts on the actual division score and aggregated score reported (using the inverted scale).
32

PLE scores in December 2005. Results from the school data for 62 primary schools in the
sample estimate that the THR program increased the PLE pass rate by 15 percentage points,
though this estimate is only weakly significant. The mean pass rate in the sample is 46.6%; in
the control group, the pass rate is 39.3%.
Table 9: FFE Impacts on the Primary Leaving Exam, 2006-07
Individual Level Data School Level
Data PLE
Division PLE Aggregate
Percentage Passed PLE
(1) (2) (3) School meals * 2005 -0.992 -4.004 (1.69) (1.49) Take-home rations * 2005 -0.671 -3.649 (1.28) (1.14) School meals * 2006 0.254 0.124 0.097 (0.59) (0.05) (1.32) Take-home rations* 2006 0.802** 5.067*** 0.150* (2.33) (3.32) (1.80) Class of 2006 -1.549*** -8.005***
(3.92) (3.27) Pader district -0.339 0.484 (0.81) (0.28)
Constant 20.511*** 0.393*** (7.16) (7.56) Observations 42 42 62 R2 0.184 0.055 H0: school meals = take-home rations (p-value)
0.266 0.087* 0.519
Notes: Inverted PLE Division scores range from 1 (worst) to 4 (best). Inverted PLE Aggregate scores range from 4 (worst) to 36 (best). Column (1) presents estimates from an ordered probit model. Models in columns (2) and (3) are estimated by OLS. Absolute value of t statistics in parenthesis, based on standard errors that are robust to clustering on baseline IDP camps in columns (2) and (3). Hypothesis test is for equality of average impacts between SFP and THR. *Significant at the 10% level; ** Significant at the 5% level; *** Significant at the 1% level.
33

5.2 Cognitive Development
Cognitive development tests were conducted on 1,056 individuals age 6-13 during the second
survey round in 2007. Table 10 presents summary statistics on the test scores for each test by
gender and by age cohorts (6-10 and 11-13). Scores on the Raven’s Colored Progressive
Matrices (hereafter “Raven’s”) ranged from 0-28 (out of 36) with a mean score of 10.7. The
mean score for girls of 10.3 was significantly lower than the mean for boys of 11.0 (p-
value=0.018). As expected, Raven’s scores increased with the child’s age. The older cohort of
11-13 year olds scored 3.6 points higher on average than the younger cohort of 6-10 year olds.
The Raven’s scores were substantially lower than documented for children in a Raven’s
validation study in the Nakuru Municipality of Western Kenya (Costenberger and Mbugua,
2001). Among 6-10 year olds in the Kenya study, boys obtained an average Raven’s score of
16.9, while girls obtained an average score of 15.0. In this sample from Northern Uganda, 6-10
year old boys scored 9.4 on average while girls that age scored 9.5. We speculate that this
substantial gap in cognitive scores is due in part to the effects of the protracted civil conflict in
Northern Uganda.
Scores on the Digit Span Forward (DSF) test ranged from 0-14 (out of 16) with a mean
score of 5.5. Respondents scored much lower on the Digit Span Backward (DSB) test, where
scores ranged from 0-9 (out of 16) with a mean score of 2.5. On the DSB test, 36 percent of
respondents scored 0, compared to just 2 percent of respondents on the DSF Test. Despite this
large number of zeros, the test appears to have discerned differences in cognitive ability. There
was no significant difference between girls and boys in test scores on the DSF and DSB. As
with the Raven’s test, children in the older age cohort scored significantly better on the DSF and
DSB than the younger children.
Estimated impacts of the SFP and THR programs on cognitive development tests varied
by test instrument. However, the results indicate that both programs had broad and significant
impacts on children’s ability to manipulate concepts, as shown in the DSB test. Also, access to
the THR program improved girls’ scores on all three tests of cognitive development, though only
weakly so for the Raven’s test. Table 11 presents impact estimates for each cognitive
development test, based on the sample average score as well as by gender and age groups. All
estimates control for age of the respondent. For the Raven’s test, which measures reasoning and
perception, neither the SFP nor THR programs have a significant impact on test scores for 6-13
34

year olds or for the younger (6-10) and older (11-13) age cohorts. However, girls age 6-13 who
received access to THR had weakly higher Raven’s scores by 1.1 test points. There were no
significant impacts on boys’ Raven’s scores, when compared to the control group. However,
average Raven’s test scores for boys in the THR program were 0.7 points higher than for boys
receiving SFP and this difference was statistically significant at the 5 percent level (last row of
Table 11). Indeed, THR beneficiaries had weakly higher Raven’s scores than SFP beneficiaries
for the entire sample.
On the DSF test, which tests short-term memory, there were no significant differences in
average test scores across the three treatment groups. However, girls receiving THR scored 0.5
points higher than girls in the control group, and this difference was significant. This effect was
driven by girls age 6-10 in particular. There was no impact of either program for boys on this
test. There were no significant differences in DSF test scores between SFP and THR
beneficiaries.
The SFP and THR programs had much greater impact on the DSB test, which measures
both short-term memory and ability to manipulate concepts. On this test, both the SFP and THR
programs caused significantly higher test scores for 6-13 year olds on average and for girls in
this age group. All 6-10 year olds and girls age 6-10 had weakly higher test scores in each
program (significantly for THR for all 6-10 year olds). Impact estimates for 11-13 year olds
were of similar size, but were not as precisely measured. Boys age 6-13 in the SFP program
scored weakly higher than boys in the control group. Boys age 6-13 in the THR program had
significantly higher DSB scores than boys in the control group. This effect was lead by boys age
6-10. Overall, these impacts are of moderate size, ranging from 0.29 point for boys in the SFP
program to 0.54 points for girls receiving THR. However, the breadth of the impacts, in both
programs and across the sample, is encouraging.
As a test of the specification of the model, we also estimated impacts on cognitive
development tests controlling for district of residence. Various factors could contribute to
differences in cognitive development between Pader and Lira districts, including exposure to the
civil conflict, nutritional status, and the quality of implementation of the FFE programs. In
general, controlling for district of residence strengthened the estimated impacts, primarily by
increasing the precision of the estimates. In most specifications, children in Pader district had
significantly higher scores on the Raven’s test and on the DSB test. This was somewhat
35

36
surprising because exposure to the conflict and many other indicators of living conditions were
worse in Pader than Lira. However, this pattern of district-based differences in cognitive scores
was not uniform, as scores on the DSF test were weakly lower in Pader than in Lira.
Nonetheless, cognitive development test scores were generally higher in Pader. Separate
estimates showed that achievement test scores were lower on average in Pader than in Lira.
This pattern suggests that primary schools in Pader provide a weaker education than those in Lira
district.
Results on the Digit Span tests suggest that access to the FFE programs did not have
much impact on short term memory (with the exception of girls in THR), but had extensive
impacts on children’s ability to manipulate concepts. This is important because this form of
manipulation of concepts represents a higher order brain function than short-term memory, and it
is one that may have payoffs in other areas of children’s lives. The Raven’s test did not discern a
similar effect of the programs when compared to the control group, though the THR
beneficiaries scored significantly better than SFP beneficiaries on this test.

37
Table 10: Cognitive Development Tests, Summary Statistics, 2007 Raven’s Colored
Progressive Matrices Digit Span Forward Digit Span Backward
Age (years) 6-13 6-10 11-13 6-13 6-10 11-13 6-13 6-10 11-13 (1) (2) (3) (4) (5) (6) (7) (8) (9) Full Sample
N 1,056 693 363 1,048 690 358 1,046 689 357 Mean 10.7 9.4 13.0 5.5 5.1 6.2 2.5 1.8 3.9 Std. dev. 5.1 4.8 4.9 1.8 1.7 1.7 2.2 2.1 1.9
Girls N 529 353 176 525 354 171 524 335 170 Mean 10.3 9.5 12.1 5.5 5.3 6.0 2.5 1.9 3.6 Std. dev. 5.0 4.8 4.9 1.8 1.7 1.7 2.2 2.1 2.0
Boys N 527 340 187 523 336 187 522 354 187 Mean 11.0 9.4 13.9 5.4 4.9 6.3 2.6 1.8 4.1 Std. dev. 5.2 4.8 4.7 1.8 1.7 1.7 2.3 2.0 1.8
Test equality of scores (p-value) H0: score(girls) = score(boys) 0.018** 0.256 0.166 H0: score(age 6-10) = 0.000*** 0.000*** 0.000***
score(age 11-13)
Notes: Absolute value of t statistics in parenthesis, based on standard errors that are robust to clustering on baseline IDP camps. Hypothesis tests are for equality of test scores between girls and boys and between age cohorts.
*Significant at the 10% level; ** Significant at the 5% level; *** Significant at the 1% level.

38
Table 11: FFE Impacts on Cognitive Development Tests, 2007
Raven’s Colored Progressive Matrices
Digit Span Forward Digit Span Backward
Age (years) 6-13 6-10 11-13 6-13 6-10 11-13 6-13 6-10 11-13 (1) (2) (3) (4) (5) (6) (7) (8) (9) Average Impact
School meals -0.011 -0.095 0.174 0.142 0.168 0.123 0.368** 0.404* 0.304 (0.02) (0.16) (0.21) (0.73) (0.85) (0.44) (2.32) (1.93) (1.53)
Take-home rations 0.746 0.731 0.793 0.264 0.244 0.314 0.454*** 0.467** 0.402 (1.64) (1.27) (1.01) (1.41) (1.47) (1.06) (2.87) (2.50) (1.50)
Girls School meals 0.402 0.502 0.433 0.297 0.424 0.119 0.448** 0.484* 0.442 (0.61) (0.70) (0.46) (1.27) (1.67) (0.30) (2.09) (1.94) (1.16) Take-home rations 1.098* 1.025 1.383 0.510** 0.595*** 0.366 0.537** 0.502* 0.647
(1.92) (1.56) (1.50) (2.33) (2.86) (0.93) (2.43) (1.85) (1.51)
Boys School meals -0.429 -0.704 0.057 -0.006 -0.091 0.161 0.290* 0.327 0.220 (0.79) (0.98) (0.07) (0.03) (0.38) (0.44) (1.81) (1.46) (0.89) Take-home rations 0.386 0.421 0.243 0.005 -0.161 0.257 0.371** 0.427** 0.190
(0.75) (0.56) (0.31) (0.02) (0.67) (0.64) (2.10) (2.18) (0.61)
Test equality of impacts (p-value) All: H0: SFP=THR 0.067* 0.293 0.626
Girls: H0: SFP=THR 0.287 0.205 0.685 Boys: H0: SFP=THR 0.034** 0.927 0.682 Notes: Estimates are single difference estimates of impact on cognitive measures in 2007. All estimates control for the child’s age. Absolute value of t
statistics in parenthesis, based on standard errors that are robust to clustering on baseline IDP camps. * Significant at the 10% level; ** Significant at the 5% level; *** Significant at the 1% level.

6. Implications and Conclusions
The results show that the SFP and THR programs had significant impacts on learning
achievement for children age 11-14 years old. Impacts were strongest on math test
scores, though access to school meals through the SFP had weakly significant impacts on
literacy test scores for this age group in both DID specifications. Neither program
showed significant positive impacts on test scores of children age 6-10 years old. It may
be that the tests instruments were too difficult to discern differences in learning
achievement for these children in the lower primary grades. Results from the cognitive
development tests show that both the SFP and THR programs increased ability to
manipulate concepts for all children age 6-13 years. These effects appear to be strongest
among 6-10 year olds, which indicates that this younger age cohort benefits from the
programs although this is not discerned in tests of learning achievement. Girls in the
THR program also demonstrated improvements in short term memory and (weakly) in
reasoning and perceptive ability compared to girls in the control group.
These results do not yet identify the pathways through which the improvements in
learning and cognitive development occur. These effects may arise because the programs
induce children to spend more time in school or because the programs improve
nutritional status. Two related papers will provide evidence on the impacts of the
programs on school participation and nutritional status. These results will be used to
investigate the relative importance of each pathway to the impacts identified here.
The evidence on the relative impact of the SFP and THR programs on learning
and cognitive development is not conclusive, though there is greater support for the THR
program having larger effects. Children with access to the THR program had weakly
higher scores on the PLE achievement tests and on the Raven’s test of cognitive
development than children in the SFP program. This advantage of the THR program on
the Raven’s test was statistically significant for boys in the sample. Meanwhile, none of
the estimates demonstrated a significantly larger impact of the SFP program than the
THR program on any outcome. This eliminates one of the potential advantages of on-site
school meals over take-home rations, that feeding children during the school day, while
they are learning, would improve their learning performance, and possibly their cognitive
39
development. The results presented here suggest that the timing of meals provided is not
nearly as important as the increased availability of nutritious food during the period when
children are in school. Households with children in the THR program were apparently
effectively able to smooth the child’s food consumption over school days so that impacts
on learning and cognitive ability were at least as strong as for children receiving the SFP.
A second implication of the relative effectiveness of the THR program is that
concerns about a weak intrahousehold ‘flypaper effect’ (Jacoby, 2002) in the THR
program were not borne out in these data. The results presented here suggest that the
flypaper effects for the beneficiary child are at least as strong when transfers are provided
to the household to manage, as a take-home ration, as when the child is provided the food
directly while at school. Although we have presented no direct evidence on the size of
the flypaper effect in either program, the substantial size of the SFP food transfer relative
to the child’s food energy requirements and cultural norms regarding sharing food at
meals among the Acholi and Luo people of Northern Uganda suggest that it would have
been difficult for households to redistribute a substantial portion of the SFP food transfer
away from the beneficiary child at other meals. The surprising result is that households
receiving THR appear to target the beneficiary child with the food ration at least as
effectively as households with children receiving SFP.
Ultimately, the measure of greatest relevance to policy makers and those
designing human capital intervention programs is the relative cost effectiveness of these
two programs. On-site school feeding programs are more expensive for schools to
operate and can sometimes be disruptive to learning given the time spent and commotion
caused by the provision of meals at school. However, WFP incurred greater costs of
running the THR program because of the cost of organizing distribution of the rations to
the households and the cost of monitoring school attendance, which is not required for
on-site school meals. Results on measures of the relative cost-effectiveness of the two
programs are forthcoming.
40

References Adelman, Sarah, Daniel O. Gilligan and Kim Lehrer. 2008. How Effective are Food for
Education Programs? A Critical Assessment of the Evidence from Developing Countries. Forthcoming. IFPRI Food Policy Review No. 8 (Washington, DC: International Food Policy Research Institute).
Ahmed, Akhter. U. 2004. Impact of Feeding Children in School: Evidence from Bangladesh. Mimeo. International Food Policy Research Institute, Washington, DC.
Burtless, G. 1995. The Case for Randomized Field Trials in Economic and Policy Research. Journal of Economic Perspectives 9(2): 63–84.
Costenbader, Virginia and Stephen Mbugua Ngari. 2001. A Kenya Standardization of the Raven’s Colored Progressive Matrices. School Psychology International 22(3): 258-268.
Gilligan, Daniel O., Sarah Adelman and Kim Lehrer. 2006. An Evaluation of Alternative School-Based Feeding Programs in Northern Uganda: Report on the Baseline Survey. Mimeo. International Food Policy Research Institute, Washington, DC.
Glewwe, Paul. 2002. Schools and Skills in Developing Countries: Education Policies and Socioeconomic Outcomes. Journal of Economic Literature, 40(2): 436-482.
Glewwe, Paul and Michael Kremer. 2006. Schools, Teachers, and Education Outcomes in Developing Countries. In Alan Hanuschek and Finis Welch, eds., Handbook on the Economics of Education. (New York: Elsevier Press, pp. 945-1014).
Hanushek, E.A. 1986. The Economics of Schooling. Journal of Economic Literature 24: 1141-1177.
Hanuschek, E.A. and Woessmann, L. 2007. The Role of School Improvement in Economic Development. Mimeo. CESifo Working Paper No. 1911.
Heckman, JJ and J. Smith. 1995. “Assessing the Case for Randomized Social Experiments” Journal of Economic Perspectives 9(2): 85-110.
Heckman, J.J., H. Ichimura, and P.E. Todd. 1997. “Matching as an Econometric Evaluation Estimator: Evidence from Evaluating a Job Training Program.” Review of Economic Studies 64:605-654.
Jacoby, Hanan G. 2002. “Is There an Intrahousehold ‘Flypaper Effect’? Evidence from a School Feeding Programme.” Economic Journal 112: 196-221.
Pollitt, Ernesto. 1995. Does breakfast make a difference in school? Journal of the American Dietetic Association 95(10): 1134-1139.
41

Schultz, T. Paul. 1988. Education Investments and Returns. Handbook of Development Economics Vol. I, (eds.) H. Chenery and T.N. Srinivasan, Amsterdam: North-Holland Publishing, Chapter 13: 543-630.
Simeon, D. and S. Grantham-McGregor. 1989. Effects of missing breakfast on the cognitive functions of school children with differing nutritional status. American Journal of Clinical Nutrition 49:646–53.
Tan, Jee-Peng, Julia Lane, and Gerard Lassibille. 1999. Student Outcomes in Philippine Elementary Schools: An Evaluation of Four Experiments. World Bank Economic Review 13(3):493-508.
Whaley, Shannon E., Marian Sigman, Charlotte Neumann, Nimrod Bwibo, Donald Guthrie, Robert E. Weiss, Susan Alber and Suzanne P. Murphy. 2003. The Impact of Dietary Intervention on the Cognitive Development of Kenyan School Children. American Society for Nutritional Sciences 133: 3965S-3971S.
World Food Programme. 2004. Global School Feeding Report, 2004. Rome.
World Food Programme. 2006. Reviewing the Evidence: Food for Education Experts Seminar. Rome.
42