the ibm platform computing cloud service: …comp7820/f16/notes/03-handouts/ho05...2 the ibm...
TRANSCRIPT

IBM Platform Computing
White Paper
May 2014
The IBM Platform Computing Cloud Service: Benchmarking performanceComparing IBM performance against competitive offerings to help organizations deploy workloads with confidence

2 The IBM Platform Computing Cloud Service: Benchmarking performance
Executive summaryHigh-performance computing (HPC), technical applications and analytics place heavy demands on cloud computing resources. To meet these demands, IBM cloud offerings include dedicated, bare-metal servers that provide the raw horsepower and security of a non-virtualized environment, as well as private hypervisor - based virtual machines for increased economy and optimized price-performance.
HPC users can tap this resource hosted on IBM® SoftLayer® through the IBM Platform Computing™ Cloud Service. The solution includes market-leading IBM Platform™ LSF® or IBM Platform Symphony workload management software deliv-ered as a service, and comes complete with a portal, reporting capabilities and the elasticity to expand or contract the service footprint over time to ref lect an organization’s changing needs.
With performance a key requirement for HPC workloads, IBM has tested its cloud offerings using a variety of standardized performance benchmarks and applications. This paper presents the results of those tests and shows how the results for the IBM Platform Computing Cloud Service on SoftLayer compare favorably with competitive offerings.
IntroductionCompanies in a variety of industries need to add pay-as- you- go computing capacity to economically service critical and short- term peak demands. Others simply have reached maximum capacity with their infrastructure but need to continue growing their capacity to scale their business. And for smaller organiza-tions, budget and in-house skills may be limited enough that “build your own” HPC isn’t viable.
The IBM Platform Computing Cloud Service addresses each of these needs. Users gain access to a ready-to- use cluster in the cloud for quickly and economically adding computing capacity. Integrated IBM Platform LSF and Platform Symphony software delivered as a service optimizes workload scheduling and
management, and makes it easy for users to submit work associ-ated with their projects based on business policies. Organizations can eliminate the skills barrier because experts are there to sup-port an automatically deployed compute service. Additionally, by dedicating resources to each client, IBM SoftLayer avoids “noisy neighbor” problems that exist in competing public cloud environments.
Along with these qualitative differences, decision makers consid-ering their options for cloud-based services also want to know how SoftLayer offerings compare to competitive products in terms of performance and efficiency. To help provide this infor-mation, IBM tested three available IBM SoftLayer offerings and two available Amazon-based offerings:
●● SoftLayer Physical Machine (PM) CloudLayer® (large)●● SoftLayer Physical Machine (PM) Dedicated (xlarge)●● SoftLayer Virtual Machine (VM)●● Amazon EC2 cc2.8xlarge●● Amazon EC2 c1.xlarge
Because IBM Platform Computing is frequently used to manage HPC workloads, IBM chose to compare performance against the most powerful Amazon offering. The Amazon literature recommends the EC2 cc2 instances for HPC workloads (aws.amazon.com/ec2/instance-types), and these were the instances used for testing.
However, HPC consumers who run applications that are unlicensed or written internally often require maximum price- performance for their applications. For this reason, offerings that maximize efficiency in SoftLayer and Amazon EC2 were also compared.

3IBM Platform Computing
Tests and methodologyIBM tested the offerings using a variety of synthetic benchmarks and applications well known in HPC circles, including:
●● Memory bandwidth – STREAM●● CPU performance – SuperPI●● Network bandwidth – NetPipe●● Network latency – NetPipe●● Input/output performance – IOzone●● Software compilation – GNU Compiler Collection (GCC)●● Life science – Burrows Wheeler Aligner (BWA)●● Electronic design automation (EDA) – IBM MESA●● Structural mechanics/computer -aided engineering (CAE) –
Dassault Abaqus ●● Computational f luid dynamics (CFD) – OpenFOAM
To ensure consistent measurement, most of the tests were performed 10 times and the results were averaged. Multiple instances of each offering were used to run network bandwidth and latency tests as well as application-level message passing interface (MPI) tests over the network infrastructure between instances. The operating system for all instances was the CentOS 6.4 x86_64 full installation with updates as of January 15, 2014.
High-level findingsTests showed that IBM SoftLayer delivers the best (or ties for the best) absolute performance in all test categories. It also demonstrated that for many of the application workloads tested, SoftLayer VM price-performance was more desirable than Amazon price-performance (see T able 1).
IBM SoftLayer Amazon EC2
PM xlarge PM large VM cc2.8xlarge c1.large
Physical Physical Virtual Virtual Virtual
Stream
SuperPI
NetPipe B/W
NetPipe Latency
IOZone
SW compilation
Life Science
EDA
IM - CFD
IM - Struct. Mech.
Best Performance Best Price- Performance
Table 1. Summary of test results.
4 The IBM Platform Computing Cloud Service: Benchmarking performance
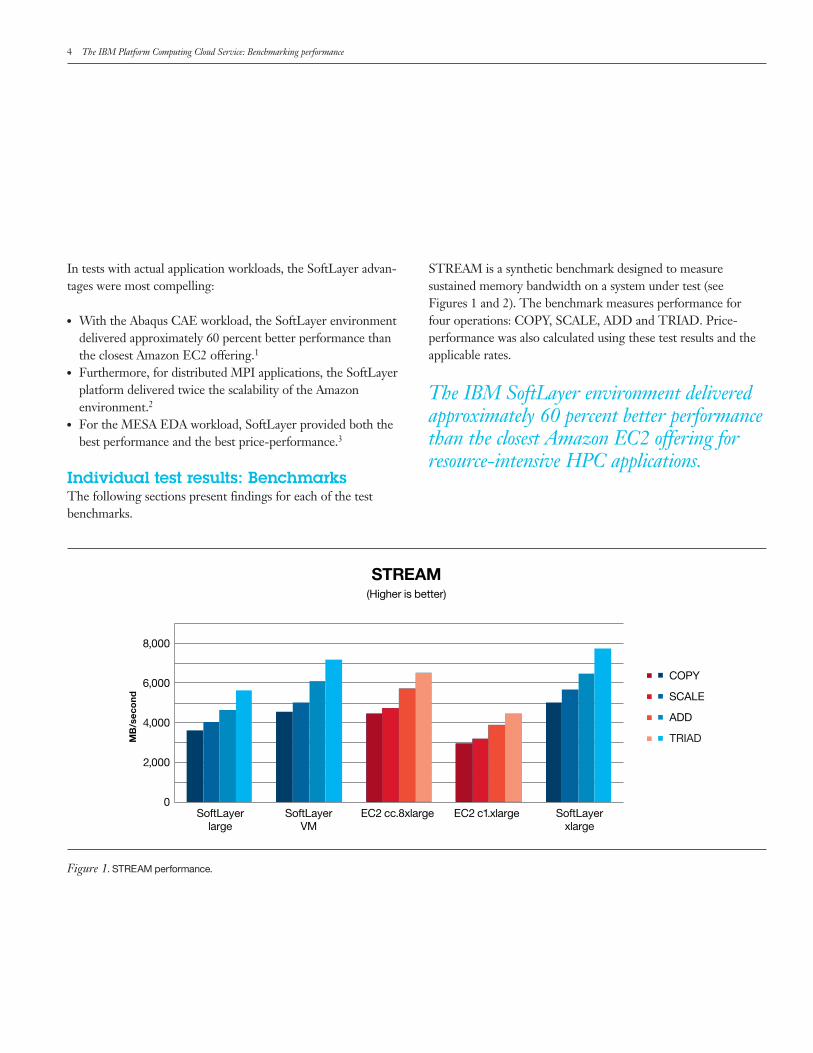
In tests with actual application workloads, the SoftLayer advan-tages were most compelling:
●● With the Abaqus CAE workload, the SoftLayer environment delivered approximately 60 percent better performance than the closest Amazon EC2 offering.1
●● Furthermore, for distributed MPI applications, the SoftLayer platform delivered twice the scalability of the Amazon environment.2
●● For the MESA EDA workload, SoftLayer provided both the best performance and the best price-performance. 3
Individual test results: BenchmarksThe following sections present findings for each of the test benchmarks.
Figure 1. STREAM performance.
0
2,000
4,000
6,000
8,000
SoftLayerlarge
SoftLayerVM
EC2 cc.8xlarge EC2 c1.xlarge SoftLayerxlarge
STREAM(Higher is better)
COPY
SCALE
ADD
TRIADMB
/sec
ond
STREAM is a synthetic benchmark designed to measure sustained memory bandwidth on a system under test (see Figures 1 and 2). The benchmark measures performance for four operations: COPY, SCALE, ADD and TRIAD. Price- performance was also calculated using these test results and the applicable rates.
The IBM SoftLayer environment delivered approximately 60 percent better performance than the closest Amazon EC2 offering for resource-intensive HPC applications.

5IBM Platform Computing
The SoftLayer xlarge (extra-large) configuration on bare metal was the clear performance leader. In terms of best value, the SoftLayer virtual machine delivered the best price-performance.
$0
$1,000
$2,000
$3,000
$4,000
SoftLayerlarge
SoftLayerVM
EC2 cc.8xlarge EC2 c1.xlarge SoftLayerxlarge
STREAM price-performance(Higher is better)
COPY
SCALE
ADD
TRIAD
MB
/sec
/$
Figure 2. STREAM price- performance.
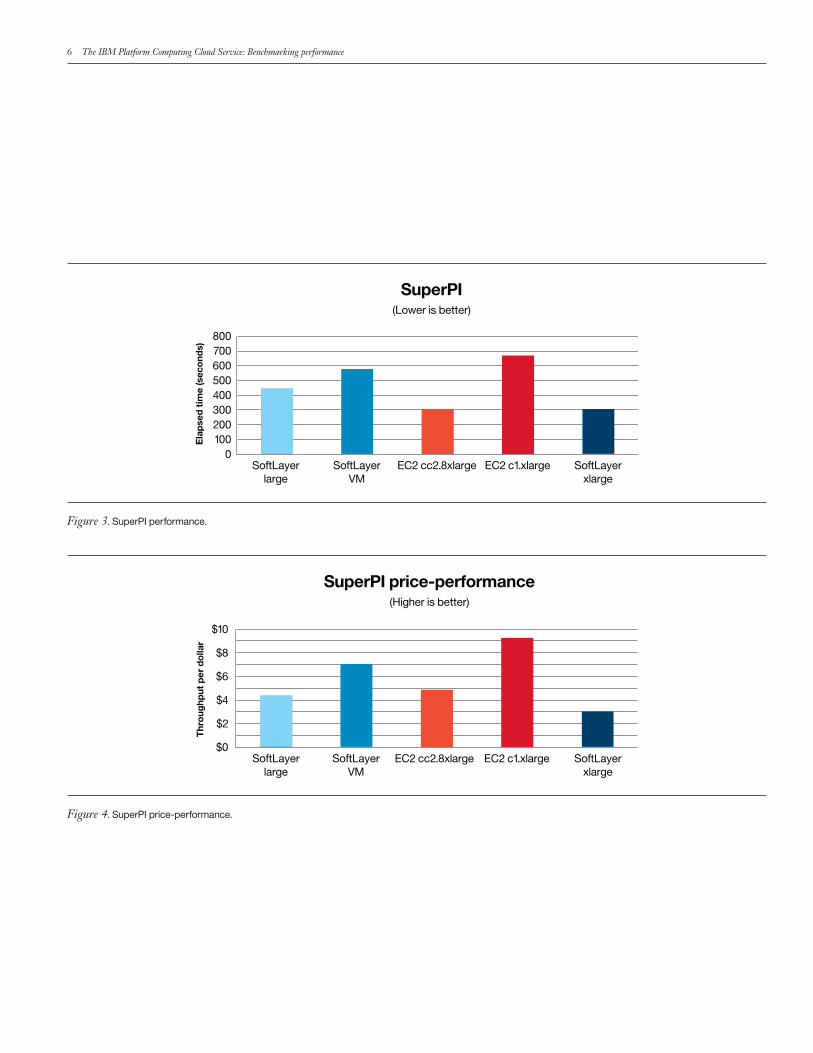
SuperPI is a benchmark that calculates pi to a specific number of digits to measure computing power (see Figures 3 and 4). Based on the Gauss-Legendre algorithm, it is a ported version of a program used in 1995 to compute pi to 232 digits. The measured time is the time required to compute the value of pi to this 232 level of precision on each machine tested, and price-performance is calculated using these test results and the applicable rates.
6 The IBM Platform Computing Cloud Service: Benchmarking performance
$0
$2
$4
$6
$8
$10
EC2 cc2.8xlarge EC2 c1.xlarge
Thr
ough
put
per
dol
lar
SuperPI price-performance(Higher is better)
SoftLayerlarge
SoftLayerVM
SoftLayerxlarge
0100200300400500600700800
SoftLayerlarge
SoftLayerVM
EC2 cc2.8xlarge EC2 c1.xlarge SoftLayerxlarge
Ela
pse
d t
ime
(sec
ond
s)
SuperPI(Lower is better)
Figure 3. SuperPI performance.
Figure 4. SuperPI price- performance.

7IBM Platform Computing
The SoftLayer extra-large configuration on bare metal was a performance leader again, but delivered essentially the same result as the EC2 cc2.8xlarge VM instance. In terms of best value, the lower-cost EC2 c1.xlarge instance delivered the best result, with the SoftLayer VM offering placing second.
NetPipe is a network-independent evaluator that uses a series of “ping-pong” tests between machines to assess network band -width and network latency performance (see Figures 5 and 6).
1
10
100
1,000
10,000
100,000
1 10 100 1,000 10,000 100,000 1,000,000 10,000,000
Ban
dwid
th (M
bits
/sec
ond)
Message size (bytes)
OpenMPI
EC2 c1.xlarge
EC2 cc2.8xlarge
SoftLayer PM large
SoftLayer VM
SoftLayer PM xlarge
(Higher is better)
Figure 5. NetPipe bandwidth performance.
The results shown are for the variant of the NetPipe test designed to exercise the MPI library, and similar results were obtained with a pure TCP network connection. The SoftLayer offerings garnered the top three results among the tests, suggest-ing that SoftLayer provides the best platform for network latency–sensitive applications.

8 The IBM Platform Computing Cloud Service: Benchmarking performance
Figure 6. NetPipe latency performance.
0
20
40
60
80
100
120
SoftLayerVM MPI 2 node
EC2 c1.xlargeMPI 2 node
EC2 cc2.8xlargeMPI 2 node
SoftLayerPM large
MPI 2 node
SoftLayerPM xlarge
MPI 2 node
OpenMPI network latency (Lower is better)
Mili
seco
nds
The displayed lower latency is a clear benefit of running on a dedicated physical infrastructure and explains why bare-metal infrastructure of the type used by the Platform Computing Cloud Service is preferable for distributed parallel applications.
Using the IOzone file system benchmark tool, file I/O bandwidth was measured for a variety of file sizes as a factor of the memory size of the machine being evaluated
(see Figures 7 and 8). Discrete results were measured for data amounts of 1x, 2x and 4x memory for the physical or virtual machine being tested, ensuring consistency of approach. For read performance, the EC2 cc2.8xlarge VM delivered the best performance, followed closely by the large SoftLayer physical machine. For write performance, the SoftLayer physical machine was significantly faster than all other platforms tested.

9IBM Platform Computing
Figure 7. IOzone performance – Write.
Figure 8. IOzone performance – Read.
0
100,000
250,000
350,000
1 2 3 4
KB
/sec
I/O file size (factor of memory size)
I/O Bandwidth - Write(Higher is better)
50,000
200,000
300,000
150,000
EC2 c1.xlarge Write
EC2 cc2.8xlarge Write
SoftLayer PM large Write
SoftLayer VM Write
SoftLayer PM xlarge Write
050,000
100,000150,000200,000250,000300,000350,000400,000
KB
/sec
I/O Bandwidth - Read(Higher is better)
1 2 3 4
I/O file size (factor of memory size)
EC2 c1.xlarge Read
EC2 cc2.8xlarge Read
SoftLayer PM large Read
SoftLayer VM Read
SoftLayer PM xlarge Read

10 The IBM Platform Computing Cloud Service: Benchmarking performance
Figure 9. Compilation performance.
0 100 200 300 400 500 600 700 800
SoftLayerVM
SoftLayerPM large
EC2 c1.xlarge EC2 cc2.8xlarge SoftLayerPM xlarge
Ela
psed
tim
e (s
econ
ds)
Software compile performance (Lower is better)
Based on the results, it is safe to conclude that SoftLayer delivers the best overall file system performance for workloads comprised of both read and write activity. Fast disk I/O is important for a number of HPC and analytic workloads and predictability is important also for clients that require applications to run within a particular timeframe—for example, financial risk calculations with tight batch windows or HPC workloads using resources during off-peak hours.
This test involves compiling a Linux kernel with the GCC com-piler to compare the performance of various physical and virtual cloud options (see Figure 9). Identical software configurations were used on all environments tested. In terms of absolute per-formance, the SoftLayer large virtual machine delivered the greatest performance, followed closely by the EC2 cc2.8xlarge
virtual machine instance. For price-performance, the EC2 c1.xlarge virtual machine delivered the best result, followed closely by the SoftLayer virtual machine.
Individual test results: HPC applicationsApplication tests were used to exercise the computational envi-ronment just as users would when performing real work. Tested workloads included life sciences, electronic design automation, structural mechanics and computational f luid dynamics.
BWA is a program for aligning sequencing reads against a large reference genome as might be performed in a life sciences orga-nization (see Figures 10 and 11). The result was evaluated on the basis of the total elapsed time to run a test against the reference genome. Also, price-performance was calculated based on the cost in terms of machine resources.

11IBM Platform Computing
Figure 10. Life sciences – Performance.
Figure 11. Life sciences – Price- performance.
SoftLayerPM xlarge
SoftLayerPM large
SoftLayer VM EC2 cc2.8xlarge EC2 c1.xlarge 0
5,000
10,000
15,000
20,000
25,000
30,000
35,000
40,000
Ela
psed
tim
e (s
econ
ds)
Life sciences benchmark (BWA) (Lower is better)
SoftLayerPM xlarge
SoftLayerPM large SoftLayer VM EC2 cc2.8xlarge EC2 c1.xlarge
$0
$5
$10
$15
$20
$25
Cos
t per
run
Life sciences benchmark (BWA) price-performance(Lower is better)

12 The IBM Platform Computing Cloud Service: Benchmarking performance
Figure 12. Electronic design automation – Performance.
0
500
1,000
1,500
2,000
2,500
3,000
3,500
Sof tLayerPM xlarge
Sof tLayerPM large
Sof tLayer VM EC2 c1.xlarge EC2 cc2.8xlarge
Ela
psed
tim
e (s
econ
ds)
EDA - IBM Mesa (Lower is better)
In terms of absolute performance, the SoftLayer extra- large physical machine delivered the greatest performance, followed closely by the EC2 cc2.8xlarge machine instance. The EC2 c1.xlarge machine delivered the best price-performance result, followed closely by the SoftLayer virtual machine.
Functionally similar to Synopsys Vera and Cadence NCSim, IBM MESA is an EDA logic verification tool that can be used to characterize the performance of different systems for real-world
design automation workloads (see Figures 12 and 13). Test results showed that in terms of absolute performance, the SoftLayer extra-large physical machine delivered the greatest performance, followed closely by the EC2 cc2.8xlarge machine instance. For price-performance, the SoftLayer -based virtual machine delivered the best result, followed closely by the EC2 c1.xlarge instance.

13IBM Platform Computing
Figure 13. Electronic design automation – Price- performance.
Figure 14. Structural mechanics/ CAE – Single node, S4D benchmark.
$0
$0.50
$1.00
$1.50
$2.00
$2.50
SoftLayerPM xlarge
SoftLayerPM large
SoftLayer VM EC2 c1.xlarge EC2 cc2.8xlarge
Cos
t per
run
EDA - IBM Mesa - Price-performance(Higher is better)
1
3
5
7
9
11
13
0 2 4 6 8 10 12 14 16
Spe
edup
(rel
ativ
e to
EC
2 c1
.xla
rge)
Number of cores
Single node - S4D
EC2 c1.xlarge
EC2 cc2.8xlarge
SoftLayer PM large
SoftLayer VM
SoftLayer PM xlarge
(Higher is better)
Abaqus is a nonlinear, finite element analysis-solver commonly used for engineering in the automotive and aeronautics industries. The software comes with its own benchmark library that can be used to verify functionality following installation of the tool. Two different benchmarks were run on a single node characterizing performance for variable numbers of MPI ranks executing in parallel (1, 2, 4, 8 and 16), with performance measured relative to the lowest-performing result (see Figures 14 and 15).

14 The IBM Platform Computing Cloud Service: Benchmarking performance
Figure 15. Structural mechanics/ CAE – Single node, S6 benchmark.
1
2
3
4
5
6
7
0 2 4 6 8 10 12 14 16
Spe
edup
(rel
ativ
e to
EC
2 c1
.xla
rge)
Single node - S6
EC2 c1.xlarge
EC2 cc2.8xlarge
SoftLayer PM large
SoftLayer VM
SoftLayer PM xlarge
Number of cores
(Higher is better)
The SoftLayer extra-large physical machine configuration was dramatically faster than competing alternatives, demonstrating positive scalability out to 16 MPI ranks executing in parallel. In both two-node tests of the Abaqus application performance, the Amazon platform appears to peak at 16 CPUs and declined as more CPUs were added. In contrast, the SoftLayer platform appears from the test to scale positively out to 32 CPUs, although the exact shape of the curve was not determined.
For compute-intensive applications that scale through MPI across multiple hosts, the performance of bare-metal infrastr ucture can be dramatically faster—in this test, over 60 percent faster.

15IBM Platform Computing
The same two benchmarks were run again on two identical network-connected nodes, and performance was characterized for the same variable numbers of MPI ranks (see Figures 16 and 17). The advantage of the SoftLayer extra-large physical machine configuration was particularly compelling, delivering
twice the scalability for both tests—over 32 MPI tasks executing in parallel. Also, the SoftLayer physical machine was the only environment that scaled positively across two nodes to 32 CPUs, with the other environments exhibiting f lat or negative scalabil-ity after approximately 16 parallel tasks.
Figure 16. Structural mechanics/ CAE – Two nodes, S4D benchmark.
1
3
5
7
9
11
13
15
17
19
0 2 4 6 8 10 12 14 16 18 20 22 24 26 28 30 32
Spe
edup
(rel
ativ
e to
EC
2 c1
.xla
rge)
Two nodes - S4D
EC2 c1.xlarge
EC2 cc2.8xlarge
SoftLayer PM large
SoftLayer VM
SoftLayer PM xlarge
Number of cores
(Higher is better)

16 The IBM Platform Computing Cloud Service: Benchmarking performance
Figure 17. Structural mechanics/ CAE – Two nodes, S6 benchmark.
1
2
3
4
5
6
7
8
9
0 2 4 6 8 10 12 14 16 18 20 22 24 26 28 30 32
Spe
edup
(rel
ativ
e to
EC
2 c1
.xla
rge)
Two nodes - S6
EC2 c1.xlarge
EC2 cc2.8xlarge
SoftLayer PM large
SoftLayer VM
SoftLayer PM xlarge
Number of cores
(Higher is better)

17IBM Platform Computing
In another test series, IBM ran a sample job using an open source computational f luid dynamics application, OpenFOAM. OpenFOAM was first run on a single machine (see Figure 18), and then run across two identical network-connected machines of the same type (see Figure 19). On both tests, the SoftLayer very large physical machine delivered a dramatic advantage over other platforms.
Figure 18. Computational fluid dynamics, single node.
0
2
4
6
8
10
12
14
16
18
1 3 5 7 9 11 13 15
Spe
edup
(rel
ativ
e to
EC
2 c1
.xla
rge)
Number of cores
OpenFoam speedup backplane (Higher is better)
EC2 c1.xlarge
SoftLayer VM
SoftLayer PM xlarge
EC2 cc2.8xlarge
SoftLayer PM large

18 The IBM Platform Computing Cloud Service: Benchmarking performance
Figure 19. Computational fluid dynamics, two nodes.
0
1
2
3
4
5
6
7
8
1 3 5 7 9 11 13 15 17 19 21 23 25 27 29 31
Spe
edup
(rel
ativ
e to
EC
2 c1
.xla
rge)
Number of cores
OpenFoam speedup ethernet (Higher is better)
EC2 c1.xlarge
SoftLayer VM
SoftLayer PM xlarge
EC2 cc2.8xlarge
SoftLayer PM large
Delivering performance and valueResults of the tests show that across a range of application types, physical machines in the IBM SoftLayer cloud deliver signifi-cantly better performance than similarly configured Amazon vir-tual machine EC2 images. For applications that are time-critical, IBM SoftLayer physical machines will often provide the best value even when the costs per hour of the resources may be slightly higher. For clients that can accept virtual machine envi-ronments for their applications, SoftLayer VM offerings were found to be comparable in terms of price-performance with similar Amazon EC2 offerings.
For clients where commercial software license costs are a factor, SoftLayer is likely the better choice since commercial software license costs and in-house staff time can dwarf any differential in the hourly costs of cloud-based computing resources. The
IBM SoftLayer cloud can help reduce per-node licensing costs by delivering more performance per machine and enabling the same work to be performed with fewer resources.
In addition, productivity and time-to- results can be improved by the enhanced usability of the SoftLayer cloud, which allows researchers and engineers to concentrate on their science, not computer science. These usability features include single-source services and support, access to technical computing experts, automated deployment on demand and integrated management software.
Since the SoftLayer environment is equally as good as Amazon for price-performance–sensitive customers—while providing the additional benefits of security, predictability and reliability—the clear choice should be the IBM cloud service.

Notes
Please Recycle
For more informationTo learn more about the IBM Platform Computing Cloud Service, please contact your IBM representative or IBM Business Partner, or visit: ibm.com/systems/technicalcomputing/platformcomputing/products/cloudservice/index.html
For an online demonstration of the IBM Platform Computing Cloud Service, visit: ibm.com/webapp/iwm/web/signup.do? source=stg-web&S_PKG=ov22218&cmp=ibmsocial&ct=stg&cr= techcomp&csr=tipsheet&cm=h&ccy=us
For more information about IBM SoftLayer, visit: www.softlayer.com
Additionally, IBM Global Financing can help you acquire the IT solutions that your business needs in the most cost-effective and strategic way possible. We’ll partner with credit-qualified clients to customize an IT financing solution to suit your business goals, enable effective cash management, and improve your total cost of ownership. IBM Global Financing is your smartest choice to fund critical IT investments and propel your business forward. For more information, visit: ibm.com/financing
© Copyright IBM Corporation 2014
IBM Corporation Systems and Technology Group Route 100 Somers, NY 10589
Produced in the United States of America May 2014
IBM, the IBM logo, ibm.com, LSF, Platform, and Platform Computing are trademarks of International Business Machines Corp., registered in many jurisdictions worldwide. Other product and service names might be trademarks of IBM or other companies. A current list of IBM trademarks is available on the web at “Copyright and trademark information” at ibm.com/legal/copytrade.shtml
CloudLayer and SoftLayer are trademarks or registered trademarks of SoftLayer, Inc., an IBM Company.
Linux is a registered trademark of Linus Torvalds in the United States, other countries, or both.
This document is current as of the initial date of publication and may be changed by IBM at any time. Not all offerings are available in every country in which IBM operates.
The performance data discussed herein is presented as derived under specific operating conditions. Actual results may vary.
THE INFORMATION IN THIS DOCUMENT IS PROVIDED “AS IS” WITHOUT ANY WARRANTY, EXPRESS OR IMPLIED, INCLUDING WITHOUT ANY WARRANTIES OF MERCHANTABILITY, FITNESS FOR A PARTICULAR PURPOSE AND ANY WARRANTY OR CONDITION OF NON-INFRINGEMENT. IBM products are warranted according to the terms and conditions of the agreements under which they are provided.
1 In the Abaqus S4D two-node test, the IBM SoftLayer machine delivered a 16.82 times speedup compared to a baseline reference, whereas the Amazon EC2 VM delivered a 10.04 times speedup. For this particular test, the IBM SoftLayer offering was 68 percent faster.
2 Please see Figure 16 in this paper. In the Abaqus S4D two-node benchmark, the IBM SoftLayer environment exhibited positive scalability to 32 CPUs, while the Amazon EC2 environment shows positive scalability only two 16 CPUs.
3 Please see Figures 12 and 13 in this paper, which show results on the MESA EDA workloads for absolute performance as well as price-performance.
DCW03055-USEN-00