the - iaria journals · massimo paolucci, ... antonio maria rinaldi, universita di napoli federico...
TRANSCRIPT


The International Journal on Advances in Intelligent Systems is Published by IARIA.
ISSN: 1942-2679
journals site: http://www.iariajournals.org
contact: [email protected]
Responsibility for the contents rests upon the authors and not upon IARIA, nor on IARIA volunteers,
staff, or contractors.
IARIA is the owner of the publication and of editorial aspects. IARIA reserves the right to update the
content for quality improvements.
Abstracting is permitted with credit to the source. Libraries are permitted to photocopy or print,
providing the reference is mentioned and that the resulting material is made available at no cost.
Reference should mention:
International Journal on Advances in Intelligent Systems, issn 1942-2679
vol. 2, no. 2&3, year 2009, http://www.iariajournals.org/intelligent_systems/
The copyright for each included paper belongs to the authors. Republishing of same material, by authors
or persons or organizations, is not allowed. Reprint rights can be granted by IARIA or by the authors, and
must include proper reference.
Reference to an article in the journal is as follows:
<Author list>, “<Article title>”
International Journal on Advances in Intelligent Systems, issn 1942-2679
vol. 2, no. 2&3, year 2009,<start page>:<end page> , http://www.iariajournals.org/intelligent_systems/
IARIA journals are made available for free, proving the appropriate references are made when their
content is used.
Sponsored by IARIA
www.iaria.org
Copyright © 2009 IARIA

International Journal on Advances in Intelligent Systems
Volume 2, Numbers 2&3, 2009
Editor-in-Chief
Freimut Bodendorf, University of Erlangen-Nuernberg, Germany
Editorial Advisory Board
Dominic Greenwood, Whitestein Technologies AG, Switzerland
Josef Noll, UiO/UNIK, Norway
Said Tazi, LAAS-CNRS, Universite Toulouse 1, France
Radu Calinescu, Oxford University, UK
Weilian Su, Naval Postgraduate School - Monterey, USA
Autonomus and Autonomic Systems
Michael Bauer, The University of Western Ontario, Canada
Radu Calinescu, Oxford University, UK
Larbi Esmahi, Athabasca University, Canada
Florin Gheorghe Filip, Romanian Academy, Romania
Adam M. Gadomski, ENEA, Italy
Alex Galis, University College London, UK
Michael Grottke, University of Erlangen-Nuremberg, Germany
Nhien-An Le-Khac, University College Dublin, Ireland
Fidel Liberal Malaina, University of the Basque Country, Spain
Jeff Riley, Hewlett-Packard Australia, Australia
Rainer Unland, University of Duisburg-Essen, Germany
Advanced Computer Human Interactions
Freimut Bodendorf, University of Erlangen-Nuernberg Germany
Daniel L. Farkas, Cedars-Sinai Medical Center - Los Angeles, USA
Janusz Kacprzyk, Polish Academy of Sciences, Poland
Lorenzo Masia, Italian Institute of Technology (IIT) - Genova, Italy
Antony Satyadas, IBM, USA
Advanced Information Processing Technologies
Mirela Danubianu, "Stefan cel Mare" University of Suceava, Romania
Kemal A. Delic, HP Co., USA
Sorin Georgescu, Ericsson Research, Canada
Josef Noll, UiO/UNIK, Sweden
Liviu Panait, Google Inc., USA
Kenji Saito, Keio University, Japan

Thomas C. Schmidt, University of Applied Sciences – Hamburg, Germany
Karolj Skala, Rudjer Bokovic Institute - Zagreb, Croatia
Chieh-yih Wan, Intel Corporation, USA
Hoo Chong Wei, Motorola Inc, Malaysia
Ubiquitous Systems and Technologies
Matthias Bohmer, Munster University of Applied Sciences, Germany
Dominic Greenwood, Whitestein Technologies AG, Switzerland
Arthur Herzog, Technische Universitat Darmstadt, Germany
Reinhard Klemm, Avaya Labs Research-Basking Ridge, USA
Vladimir Stantchev, Berlin Institute of Technology, Germany
Said Tazi, LAAS-CNRS, Universite Toulouse 1, France
Advanced Computing
Dumitru Dan Burdescu, University of Craiova, Romania
Simon G. Fabri, University of Malta – Msida, Malta
Matthieu Geist, Supelec / ArcelorMittal, France
Jameleddine Hassine, Cisco Systems, Inc., Canada
Sascha Opletal, Universitat Stuttgart, Germany
Flavio Oquendo, European University of Brittany - UBS/VALORIA, France
Meikel Poess, Oracle, USA
Said Tazi, LAAS-CNRS, Universite de Toulouse / Universite Toulouse1, France
Antonios Tsourdos, Cranfield University/Defence Academy of the United Kingdom, UK
Centric Systems and Technologies
Razvan Andonie, Central Washington University - Ellensburg, USA / Transylvania University of
Brasov, Romania
Kong Cheng, Telcordia Research, USA
Vitaly Klyuev, University of Aizu, Japan
Josef Noll, ConnectedLife@UNIK / UiO- Kjeller, Norway
Willy Picard, The Poznan University of Economics, Poland
Roman Y. Shtykh, Waseda University, Japan
Weilian Su, Naval Postgraduate School - Monterey, USA
GeoInformation and Web Services
Christophe Claramunt, Naval Academy Research Institute, France
Wu Chou, Avaya Labs Fellow, AVAYA, USA
Suzana Dragicevic, Simon Fraser University, Canada
Dumitru Roman, Semantic Technology Institute Innsbruck, Austria
Emmanuel Stefanakis, Harokopio University, Greece
Semantic Processing

Marsal Gavalda, Nexidia Inc.-Atlanta, USA & CUIMPB-Barcelona, Spain
Christian F. Hempelmann, RiverGlass Inc. - Champaign & Purdue University - West Lafayette,
USA
Josef Noll, ConnectedLife@UNIK / UiO- Kjeller, Norway
Massimo Paolucci, DOCOMO Communications Laboratories Europe GmbH – Munich, Germany
Tassilo Pellegrini, Semantic Web Company, Austria
Antonio Maria Rinaldi, Universita di Napoli Federico II - Napoli Italy
Dumitru Roman, University of Innsbruck, Austria
Umberto Straccia, ISTI – CNR, Italy
Rene Witte, Concordia University, Canada
Peter Yeh, Accenture Technology Labs, USA
Filip Zavoral, Charles University in Prague, Czech Republic

International Journal on Advances in Intelligent Systems
Volume 2, Numbers 2&3, 2009
CONTENTS
Integrating Web-based Sensor Information into Geospatial Mass-market Applications
through OGC Web Processing Services
Theodor Foerster, International Institute for Geo-information Science and Earth Observation (ITC),
Enschede, The Netherlands
Bastian Schaeffer, Institute for Geoinformatics, Muenster, Germany
Simon Jirka, Institute for Geoinformatics, Muenster, Germany
Johannes Brauner, Professorship of Geoinformation Systems, Technische Universität Dresden,
Dresden, Germany
278 - 287
Multimodal Robot/Human Interaction for Assisted Living
Ray Jarvis, Intelligent Robotics Research Centre, Monash University, Australia
Om Gupta, Intelligent Robotics Research Centre, Monash University, Australia
Sutono Effendi, Intelligent Robotics Research Centre, Monash University, Australia
Zhi Li, Intelligent Robotics Research Centre, Monash University, Australia
288 - 303
Utilizing Open Content for Higher-Layered Rich Client Applications
Monika Steinberg, Institute of Systems Engineering - System and Computer Architecture, Hannover,
Germany
Jürgen Brehm, Institute of Systems Engineering - System and Computer Architecture, Hannover,
Germany
303 - 316
Web Services Solutions for Hydrologic Data Access and Cross-Domain Interoperability
Bora Beran, Microsoft Research, USA
David Valentine, San Diego Supercomputer Center, University of California, USA
Ilya Zaslavsky, San Diego Supercomputer Center, University of California, USA
Simon Jonathan David Cox, Commonwealth Scientific and Industrial Research Organization (CSIRO),
Australia
John McGee, Renaissance Computing Institute, USA
317 - 324
Reliability Issues and Improvements in Remote Monitoring Security Systems
R. Hariprakash, BIHER, Bharath University, India
G. Venkat Ramu, University of Madras, India
T. Rajakumari, Polytechnic College, India
S. Ananthi University of Madras, India
K. Padmanabhan, Anna University, India
325 - 334
A Component-Based Approach Based on High-Level Petri Nets for Modeling Distributed
Control Systems
Aladdin Masri, An-Najah National University, Palestine
335 - 353

Thomas Bourdeaud’hui, Ecole Centrale de Lille, France
Armand Toguyeni, Ecole Centrale de Lille, France
Improving P2P Streaming Methods for IPTV
Majed Alhaisoni, University of Essex, UK
Antonio Liotta, Eindhoven University of Technology, The Netherlands
Mohammed Ghanbari, University of Essex, UK
354 - 365
Database Connection Monitoring for Component-based Persistence Systems
Uwe Hohenstein, Siemens AG, Corporate Research and Technologies, Germany
Michael C. Jaeger, Siemens AG, Corporate Research and Technologies, Germany
366 - 375
Run-Time Connector Synthesis for Autonomic Systems of Systems
Radu Calinescu, Computing Laboratory, University of Oxford, UK
376 - 386

Integrating Web-based Sensor Information into Geospatial Mass-market Applications through OGC Web Processing Services
Theodor Foerster Bastian Schaeffer Simon Jirka Johannes Brauner International Institute for Geo-information Science and Earth Observation (ITC),
Enschede, the Netherlands
Institute for Geoinformatics,
Muenster, Germany
Institute for Geoinformatics,
Muenster, Germany
Professorship of Geoinformation Systems, Technische Universität
Dresden, Dresden, Germany
[email protected] [email protected]
Abstract Sensor data are currently increasingly available on the web through Sensor Web technology. Sensors are an important asset in crisis management situations. However, to make decisions sensor information is required. This information is extracted using geoprocesses provided by for instance Web Processing Services. This paper describes an approach to provide sensor information to ordinary users by integrating sensor data and geoprocesses into mass-market applications. The applicability of the approach is demonstrated by a risk management scenario. The software presented has been developed within the Geoprocessing Community of the 52°North initiative and is available through an Open Source license. Keywords: Geospatial mass-market applications, OGC WPS, Google Earth, Sensor Web. 1. Introduction Sharing and accessing web-based geo-information (GI) is a key aspect in geospatial mass-market applications (such as Google Earth™ and Yahoo Maps™) and helps people answer spatially related questions. Currently, data services are organized in Spatial Data Infrastructures (SDIs) and allow anybody to access data on the web from anywhere at anytime. Those data services have matured within the last years, such as the suite of services published by the Sensor Web Enablement (SWE) initiative. However, sensor data available through the so-called Sensor Web often
requires certain processing to answer a specific question. As most of the current data are available through web services, the processing should also be established on the web. For this reason, the Open Geospatial Consortium (OGC) released the Web Processing Service (WPS) interface specification [1] and realizes thereby a shift from services providing data towards services providing information. Additionally, Web Processing Services are promising as the availability of network (gigabit bandwidth) and processing capabilities (such as provided by multiple processor cores and advanced processing hardware) increases. In general, Web Processing Services provide a means to customize data offered by data services mostly located in SDIs.
The extraction of information from such web-based sensor data and its integration into current geospatial mass-market applications is promising to provide user-friendly access to up-to-date information and thereby helps users to answer their questions regarding a geospatial context. However, such integration has not been realized yet.
This paper analyzes the technological requirements of geospatial mass-market applications towards integrating sensor information by the means of web-based geoprocesses. Furthermore, it describes an approach to realize this integration. Finally, the paper demonstrates the applicability of the proposed approach by a fire threat use case. This use case demonstrates how ordinary users can access the most current information through their geospatial mass-market application and take actions accordingly. The described scenario addresses a forest fire assessment
278
International Journal on Advances in Intelligent Systems, vol 2 no 2&3, year 2009, http://www.iariajournals.org/intelligent_systems/

use case, which is one of four key areas of the OSIRIS project1
OSIRIS (Open architecture for Smart and Interoperable networks in Risk management based on In-situ Sensors) is a European integrated project within the Sixth Framework Programme, aligned with GMES (Global Monitoring for Environment and Security). The main goal of the project comprises of the design, development and testing of a service-oriented architecture for risk monitoring and crisis management. A special focus is put on web services for integrating in-situ sensors and sensor data as well as higher level user services. Furthermore, during the design of the OSIRIS architecture, open standards, especially those provided by the OGC, are used as a valuable input.
.
The tools implementing the presented approach have been developed within the Geoprocessing Community2
The remainder of the paper is structured as follows. First the key concepts applied in the presented approach will be described. Section 3 will present the benefits of providing sensor information by the means of web-based geoprocesses. Based on this, Section 4 will present the developed approach. The details about the implementation of the approach is described in Section 5. The developed approach then is applied to the risk management scenario in Section 6. The paper ends with a conclusion and elaborates on future work items.
of the 52°North initiative and are available through an Open Source license (GNU General Public License 2).
This paper goes beyond the originally published work of [2] by reviewing work in the context of Sensor Web and providing insights into integrating Sensor Web and web-based geoprocessing.
2. Background The term geospatial mass-market application is closely related to what has been called Neogeography [3,4] and Volunteered Geographic Information (VGI; [5]). Both concepts describe processes for creating, sharing and annotating geodata (e.g. locations) through web-based applications by the public and can be summarized under the term Geoweb [3]. There are several different software vendors active within this market, providing data, applications and services such as Google, Yahoo, Microsoft or NASA. One of the commonly used formats to exchange geospatial-related
1 OSIRIS project website: www.osiris-fp6.eu. 2 52°North Geoprocessing Community website: www.52north.org/wps.
content within geospatial mass-market applications is KML. The following subsections will shortly introduce the KML standard, the WPS interface specification and the components of the Sensor Web.
2.1. The OGC KML standard KML is widely used for geospatial mass-market applications such as Google Maps and Google Earth. Most lately, it became an official OGC standard [6]. KML is unique in the family of OGC data encodings, as it combines data encoding, styling and the special network facilities, which are called NetworkLinks and are also known as dynamic KML. These NetworkLinks are especially interesting in the context of web-based information, as they allow the dynamic integration of remote resources. Therefore, the content of a KML file might become dynamic and provide temporal data (e.g. from sensors). As NetworkLinks use URLs, KML is not only bound to file-based access, but can link any web service, as long as it operates via HTTP-GET and serves KML. NetworkLinks provide additional properties such as update, scheduling etc.
It has to be noted that NetworkLinks have already been integrated in GIS applications such as described by [7], but not for processing purposes. 2.2. OGC Web Processing Service The WPS interface specification (OGC 2007) describes a standardized set of operations to publish and execute any type of geoprocess on the web. According to the WPS interface specification, a process is defined as an algorithm, calculation or model that operates on spatially referenced data.
In detail, the WPS specification describes three operations, which are all handled in a stateless manner: GetCapabilities, DescribeProcess and Execute. GetCapabilities is common to any type of OGC Web Service and returns service metadata. In case of a WPS it also returns a brief description of the processes offered by the specific WPS instance. To get further information about the hosted processes, the WPS is able to return the process metadata through the DescribeProcess operation. This operation provides the description of all parameters, which are required to run the process. Based on this information the client can perform the Execute operation upon the designated process. As any OGC Web Service, the WPS communicates through HTTP-GET and HTTP-POST using a messaging based on an OGC-specific XML-encoding.
279
International Journal on Advances in Intelligent Systems, vol 2 no 2&3, year 2009, http://www.iariajournals.org/intelligent_systems/

Besides that, the WPS interface specification describes mechanisms for asynchronous processing, processing of URL-referenced data and storing of process results. Especially the storing of process results is promising in the context of the presented approach. It allows to access process results server-side whenever required using a simple URL without re-initiating the process itself. Additionally, it is possible to request process results in a raw-data mode.
WPS implementations have already been successfully applied in several projects ranging from groundwater vulnerability analysis [8], bomb threat detection scenarios [9] and map generalization [10]. Additionally, an extensive discussion about the applicability of the WPS and its current drawbacks can be found in [11].
2.3 The Sensor Web The activities of the OGC are centered on the idea of the so-called Geospatial Web [12]. This describes the aim to integrate geospatial data sources as well as processing capabilities in to the WWW. One aspect of the Geospatial Web, the integration of sensors and (potentially real time) data delivered by these sensors, is addressed by the Sensor Web Enablement Working Group [13].
The SWE Working Group has created a comprehensive framework of standards that aim at fulfilling the following objectives of the Sensor Web:
• Accessing sensor data (observations made by sensors)
• Tasking sensors (e.g. setting the parameters of a sensor)
• Alerting if user-defined alert conditions are matched by sensor measurements (e.g. alert if the water level at a certain location reaches a critical threshold)
• Accessing sensor parameters (e.g. information about the sensor configuration)
• Retrieving descriptions of sensors (sensor metadata)
• Discovering sensors and observations made by sensors.
The resulting framework of standards is divided into two parts (Figure 1): The SWE Information Model addresses the encoding of sensor data and metadata whereas the SWE Service Model consists of standards defining (web service) interfaces that offer the required functionality. In the remaining paragraphs of this subsection a short introduction into the SWE framework will be given to illustrate the architecture.
Figure 1: Overview of the SWE framework. As previously explained the SWE Information
Model comprises a set of standards defining the SWE data formats. These encodings provide means for exchanging sensor observations and metadata about the sensors in a well defined way. In detail, the following four standards are part of the SWE Information Model:
• SWE Common [14]: There are several basic building blocks (e.g. simple data types) that are used across the different SWE encodings. These elementary types are standardized within SWE Common.
• Observations and Measurements (O&M) [15,16]: O&M is the encoding for the data captured by sensors (= observations and measurements).
• Sensor Model Language (SensorML) [14]: Besides the data delivered by sensors it is also important to describe metadata about the sensor so that measurements can be interpreted, their quality can be assessed and previous processing steps can be documented. SensorML offers an encoding to provide this kind of metadata in a standardized way.
• Transducer Markup Language (TML) [17]: TML is capable of encoding sensor data as well as metadata. However it was developed as a further standard to provide a data format that is optimized to support data streaming.
Besides defining the data formats for exchanging sensor data and metadata there must also be a common approach is required for interfaces providing sensor related functionality. Such a set of interface standards is defined by the SWE Service Model. Four different standards belong to the SWE Service Model:
280
International Journal on Advances in Intelligent Systems, vol 2 no 2&3, year 2009, http://www.iariajournals.org/intelligent_systems/

• Sensor Observation Service (SOS) [18]: The core functionality of the SOS is providing access to sensor data and metadata. It allows defining filter criteria to select the data on interest but also operations for inserting sensors and observations. Usually SOS instances return sensor data encoded in O&M and sensor metadata encoded in SensorML.
• Sensor Alert Service (SAS) [19]: Whereas the SOS is relying on a pull-based communication model, the SAS is able to push data to subscribers. These subscribers are able to define alert conditions in which they want to receive notifications.
• Sensor Planning Service (SPS) [20]: The SPS covers the issue of tasking sensors. This means that the SPS can be used for submitting tasks to sensors but also to manage these jobs (e.g. deleting, updating, and canceling).
• Web Notification Service (WNS) [21]: Finally, the WNS adds the capability of asynchronous communication to the SWE architecture. Thus, it can be seen as a helper service that can be used by the other SWE service (e.g. by the SAS for transmitting alerts).
3. Sensor Web and Web-based Geoprocesses The integration of Sensor Web data and web-based geoprocesses (published as WPS) has been described for the application of smoke forecast models [22]. In this study, the authors distinguish between data processing services and data analysis services. Data processing services are considered to be placed in-situ on the actual sensor data service to reduce the amount of transferred data (tight coupling). The data analysis service combines data from distributed sources to create the desired information (loose coupling).
To integrate Sensor Web and web-based geoprocesses successfully, interoperability is crucial. The Sensor Web as described in Section 2.3, with its Information Model creates the foundation to encode the gathered data. The Service Model provides a means to deliver the encoded data in a standardized fashion. Both models build the starting point to transform the data into information.
As already discussed by [22], data processing can either be performed tightly coupled to the sensor (i.e.
as a data processing service), or performed in a distributed fashion (data analysis service).
By tightly coupling the sensor with processing capabilities, such as in a simple case a temperature sensor only transmitting average values, the sensor device is able to perform the necessary calculations in-situ. This can be useful in several scenarios, especially for simple processes and low volumes of data. When it comes to processing large volumes of data and complex analysis functions of multiple data, the application of loosely-coupled and distributed services is more useful, since the processing power and storage power does not need to be located where the sensor is. Additionally, such web service-based analysis is reusable in different context with different sensor data. Limited power supply is also in many cases a crucial issue for sensor networks. Thus it is beneficial to process the data outside the sensor network and thereby to decrease the power consumption on the sensor web. Moreover, processing the data in a distributed fashion as a data analysis service turns into a requirement, when accessing multiple data sources is necessary.
By using WPS to generate information from Sensor Web data, there are basically two ways of communication:
• Data sent by value • Data sent by reference.
Especially transmitting data by reference allows a WPS to obtain the latest available data. This is especially interesting to set up persistent service chains for analyzing latest sensor data. The service chain is set up once and performed whenever it is requested, analyzing latest data (as specified by the reference). Furthermore, the references can be used to implement caching strategies, as the WPS can identify data based on the reference without retrieving it again. However, there is always the problem of retrieving latest data and processing out-dated data (without knowing). Applying a specific caching strategy mostly depends on the actual application scenario. The main aim is to reduce the latency of the system for the end user [23].
When integrating Sensor Web and web-based geoprocesses to analyze real time sensor data the Sensor Observation Service seems to the suitable entry point to access the Sensor Web. The data provided by SOS is encoded as O&M and can be used easily within WPS via reference.
The following section describes the integration of these two services using a mass-market application. It also illustrates the idea of designing a service chain once and running it multiple times based on the latest sensor data.
281
International Journal on Advances in Intelligent Systems, vol 2 no 2&3, year 2009, http://www.iariajournals.org/intelligent_systems/

4. Integrating Sensor Information into Geospatial Mass-market Applications To integrate web-based sensor information, several requirements of the geospatial mass-market applications have to be met. The major requirement is that the communication pattern (REST architecture & KML encoding) of the geospatial mass-market applications does not have to be changed. Thereby, the sensor information becomes capable of being seamlessly integrated into such applications. This requirement is met by the WPS interface specification, as it allows the invocation of processes via HTTP-GET. Additionally, the WPS interface specification does not foresee any data encoding for its input and output parameters, thus KML is a valid format for the WPS. Finally, as the WPS is able to return process results as raw data without any WPS-specific message overhead it is highly applicable for the integration into geospatial mass-market applications.
The integration of sensor information into mass-market applications is possible through WPS interface due to the following aspects:
• It transforms sensor data into sensor information through geoprocesses
• It converts internally the sensor data from O&M into KML.
As the configuration of such processes is highly complex and not supported by current geospatial mass-market applications, this paper proposes a two-fold approach (Figure 2). At first, the selection and configuration of the process should be done by an expert user, utilizing an expert user interface, most-likely a Geographic Information System (GIS) such as the User-friendly Desktop Internet GIS (uDig3
). At second, the user can integrate the pre-configured process into his geospatial mass-market application of choice. This is possible, as the WPS interface meets the requirements of geospatial mass-market applications, as explained in the previous paragraph. It is important to note, that the pre-configuration is not only necessary because of the lack of support for process configuration in geospatial mass-market applications, but is also highly applicable, as process configuration involves a lot of expert user knowledge. Thus the pre-configuration eases the integration of such information (extracted by geoprocesses) in mass-market applications for the user and is thereby not considered as a drawback.
3 uDig website: udig.refractions.net.
For this study, the processes are configured through
the 52°North WPS uDig client. This client application is extensively described in [24]. uDig has been enhanced to export these configured processes as KML, to integrate these geoprocesses and their results into geospatial mass-market applications. The export of the process from uDig to KML can be configured in two ways:
1. Export the KML file as a link to a stored process result. This is the static option, in which no process will be triggered when visualizing the KML file in Google Earth. This uses the store functionality of the WPS interface specification
2. Export the KML file as a link, which triggers the process on the WPS. This is the dynamic option and enables to trigger the process live, when incorporating the file in Google Earth. This allows one also to set a refresh rate to initiate the process on the server again. It is important to note, that in this case, the WPS process is triggered and if any WPS input data is defined as reference, the (updated) data is fetched and used as the basis for the calculation. This approach allows the processing of the latest available sensor data and thus visualizing the latest results in mainstream applications.
In both cases the files incorporate the links using the NetworkLink functionality of KML. Listing 1 shows the generated NetworkLink using the dynamic option in the KML export of uDig (option 2). The generated KML includes an Execute request via HTTP-GET to a spatial Buffer algorithm, which is also used in the scenario described in Section 6. The request references remote O&M data served by a SOS instance.
Figure 2: Approach to integrate sensor information in mass-market applications such as
Google Earth.
282
International Journal on Advances in Intelligent Systems, vol 2 no 2&3, year 2009, http://www.iariajournals.org/intelligent_systems/

<?xml version="1.0" encoding="UTF-8"?> <kml xmlns="http://earth.google.com/kml/2.2"> <Folder> <name>Buffered Features</name> <visibility>0</visibility> <open>0</open> <description>WPS Layer</description> <NetworkLink> <name>WPS Layer</name> … <description>WPS Layer</description> <refreshVisibility>0</refreshVisibility> <Link> <href>http://geoserver:8080/wps/WebProcessingService?request=execute&service=WPS&version=1.0.0&Identifier=org.n52.wps.server.algorithm.SimpleBufferAlgorithm&DataInputs=FEATURES=@mimeType=text/xml@href= http%3a%2f%2fv-wupper%2f52nSOSv2_ArcSDE%2fsos%3fService%3dSOS%26Version%3d0.0.0%26Offering%3dwv.offering2%26observedProperty%3dwv.phenomenon10%26responseFormat%3dtext%2fxml%3bsubtype%3d%2522om%2f0.0.0%2522@Schema=http://schemas.opengis.net/om/1.0.0/om.xsd;DISTANCE=20&RawDataOutput=BUFFERED_FEATURES@mimeType=application/vnd.google-earth.kml%2Bxml@schema=http://www.opengis.net/kml/2.2</href> <refreshMode>onInterval</refreshMode> <refreshInterval>20</refreshInterval> … </kml>
Listing 1: KML NetworkLink with a WPS-
Execute request via HTTP-GET. The request references sensor data provided by SOS. By supporting these two options (dynamic vs.
static), the integration is well-scalable and applicable to scenarios requiring dynamic or even static process results. In case of integrating sensor data, dynamic process results might be more applicable to always obtain the latest sensor information.
It is important to note, that the client is able to perform and export single and chained processes. Chained processes are built up by using the output of a process as input for another process. This task of chaining is performed locally at the client side and does not involve any central processing engine. A more sophisticated approach in the context of web-based geoprocessing by the means of the Business Process Execution Language (BPEL) is described in [25].
The overall architecture with its different components (e.g. WPS and SOS) and clients (e.g. uDig and Google Earth) is depicted in Figure 3.
Figure 3: Overview of the involved
components. 5. Implementation This section presents the implementation of the components incorporated in the architecture. The described implementations are available as Open Source software through the 52°North initiative4
. The implementations described in this section are all based on the Java programming language. The implemented Web Services (WPS and SOS) are deployed in servlet containers such as Tomcat.
5.1 52°North Initiative As described above the architecture is based on the 52° North WPS and SOS framework. 52° North is an international research and development network which supports the process of advancing early research results to stable implementations that can be productively used in the geospatial domain. To strengthen this process, 52° North is shaped as an open membership initiative that brings together partners from research, industry and practical users. The implementations published on the 52° North platform are available through a dual license model. This means that all software packages are published under the GNU General Public License 2 (GPL2) and concurrently under a commercial license.
5.2 52°North WPS Framework The 52°North WPS framework is fully-compliant to the WPS interface specification version 1.0.0 and is developed and maintained by the 52°North Geoprocessing Community. The framework is based on a pluggable architecture, which is extensible regarding the designated processes and data handlers. It can be 4 52°North website: www.52north.org.
283
International Journal on Advances in Intelligent Systems, vol 2 no 2&3, year 2009, http://www.iariajournals.org/intelligent_systems/
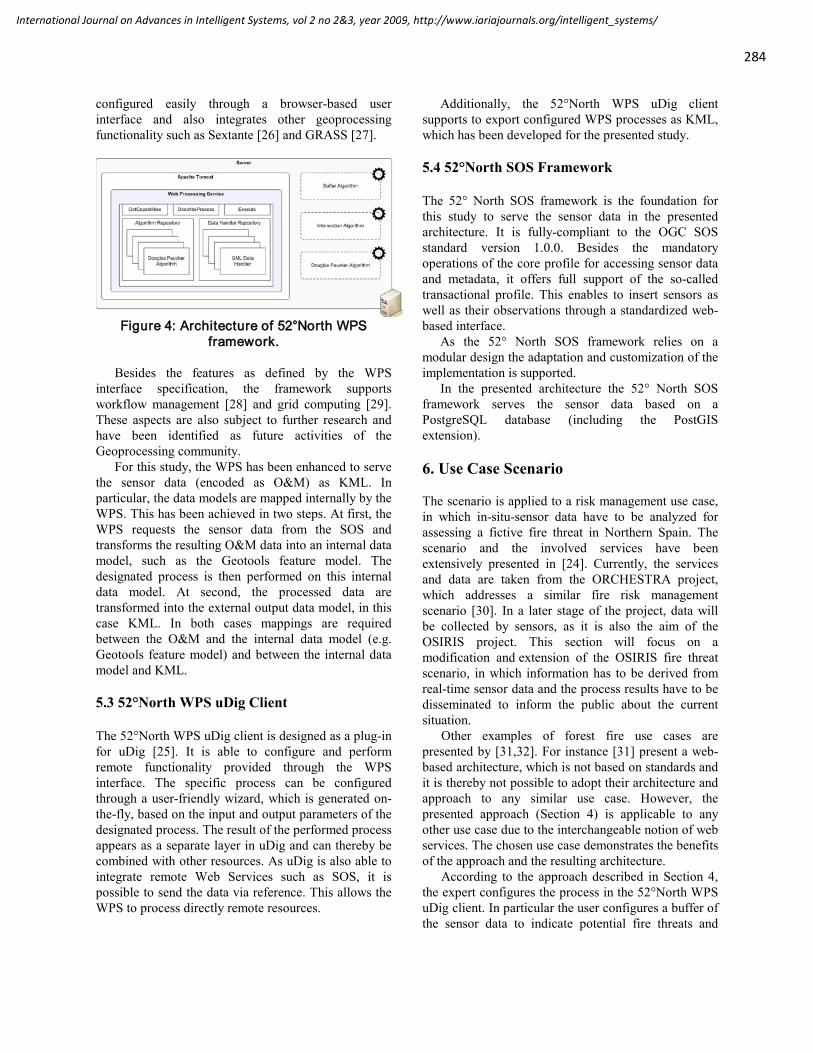
configured easily through a browser-based user interface and also integrates other geoprocessing functionality such as Sextante [26] and GRASS [27].
Figure 4: Architecture of 52°North WPS
framework.
Besides the features as defined by the WPS interface specification, the framework supports workflow management [28] and grid computing [29]. These aspects are also subject to further research and have been identified as future activities of the Geoprocessing community.
For this study, the WPS has been enhanced to serve the sensor data (encoded as O&M) as KML. In particular, the data models are mapped internally by the WPS. This has been achieved in two steps. At first, the WPS requests the sensor data from the SOS and transforms the resulting O&M data into an internal data model, such as the Geotools feature model. The designated process is then performed on this internal data model. At second, the processed data are transformed into the external output data model, in this case KML. In both cases mappings are required between the O&M and the internal data model (e.g. Geotools feature model) and between the internal data model and KML.
5.3 52°North WPS uDig Client The 52°North WPS uDig client is designed as a plug-in for uDig [25]. It is able to configure and perform remote functionality provided through the WPS interface. The specific process can be configured through a user-friendly wizard, which is generated on-the-fly, based on the input and output parameters of the designated process. The result of the performed process appears as a separate layer in uDig and can thereby be combined with other resources. As uDig is also able to integrate remote Web Services such as SOS, it is possible to send the data via reference. This allows the WPS to process directly remote resources.
Additionally, the 52°North WPS uDig client supports to export configured WPS processes as KML, which has been developed for the presented study.
5.4 52°North SOS Framework The 52° North SOS framework is the foundation for this study to serve the sensor data in the presented architecture. It is fully-compliant to the OGC SOS standard version 1.0.0. Besides the mandatory operations of the core profile for accessing sensor data and metadata, it offers full support of the so-called transactional profile. This enables to insert sensors as well as their observations through a standardized web-based interface.
As the 52° North SOS framework relies on a modular design the adaptation and customization of the implementation is supported.
In the presented architecture the 52° North SOS framework serves the sensor data based on a PostgreSQL database (including the PostGIS extension). 6. Use Case Scenario The scenario is applied to a risk management use case, in which in-situ-sensor data have to be analyzed for assessing a fictive fire threat in Northern Spain. The scenario and the involved services have been extensively presented in [24]. Currently, the services and data are taken from the ORCHESTRA project, which addresses a similar fire risk management scenario [30]. In a later stage of the project, data will be collected by sensors, as it is also the aim of the OSIRIS project. This section will focus on a modification and extension of the OSIRIS fire threat scenario, in which information has to be derived from real-time sensor data and the process results have to be disseminated to inform the public about the current situation.
Other examples of forest fire use cases are presented by [31,32]. For instance [31] present a web-based architecture, which is not based on standards and it is thereby not possible to adopt their architecture and approach to any similar use case. However, the presented approach (Section 4) is applicable to any other use case due to the interchangeable notion of web services. The chosen use case demonstrates the benefits of the approach and the resulting architecture.
According to the approach described in Section 4, the expert configures the process in the 52°North WPS uDig client. In particular the user configures a buffer of the sensor data to indicate potential fire threats and
284
International Journal on Advances in Intelligent Systems, vol 2 no 2&3, year 2009, http://www.iariajournals.org/intelligent_systems/

intersecting them with the road data. The buffer operation and the intersection operation are single processes hosted on a WPS. The road data has been additionally simplified to improve the process performance and to improve portrayal at smaller scales. Overall, this allows the expert to assess the parts of the road infrastructure which are at risk by a fire threat. The expert user exports the configured process as a KML file and links it on the national portal site. The citizen (i.e. ordinary user) is now able to visualize the latest analysis results in his/her geospatial mass-market application by loading the KML file from the portal site. He/she can inspect the latest data with underlying base information from areal imagery and/or topography. Thereby, the geospatial mass-market application makes use of distributed Web Services to get the latest information (extracted from sensor data & feature data) for each user request and processes it real-time using OGC WPS. Figure 5 depicts the result of the configured process in uDig and the same process accessed through Google Earth.
7. Conclusion & Outlook The presented approach enables the seamless integration of sensor information into geospatial mass-market applications by the means of OGC WPS. This is promising, as processes can generate geo-information and especially sensor information, which is required for instance by risk management scenarios. As described in Section 4, the WPS interface specification meets all the requirements for the integration into geospatial mass-market applications. By enabling KML support and the support of the HTTP-GET Execute operation the WPS is capable to be integrated in any geospatial mass-market application. Moreover, as WPS provides the means to extract sensor information from sensor data and to provide this information in KML format, it allows the user to have access to the Sensor Web as such.
The presented approach is two-fold, as it first
allows an expert user to configure the process within an expert client environment (such as uDig). At second, the exported process can be consumed by a geospatial mass-market application such as Google Earth.
The applied use case scenario demonstrates the necessity and applicability of the developed approach for a risk management scenario. Without the integration of sensor information into such applications, citizens would be unaware about current information and could not act accordingly in times of danger. The visualization of sensor information, such as affected road infrastructure combined with static satellite imagery or topography, provides sufficient information to the ordinary user regarding the aimed scenario. Additionally, the approach is interesting for research communities, which need to exchange latest
Figure 5: Screenshots of the configured processes in uDig (top) and exported to Google
Earth (bottom) – simplified roads & affected road infrastructure (red).
285
International Journal on Advances in Intelligent Systems, vol 2 no 2&3, year 2009, http://www.iariajournals.org/intelligent_systems/

research results in terms of process results (e.g. latest results of climate change models).
The approach is scalable as the sensor information can be integrated as dynamic or static processes (Section 4). It is important to note that the presented approach is fully compliant with the applied standards (KML, WPS, SOS & O&M), without amending or modifying any interfaces or encodings. Overall, the specifications for the OGC WPS interface and family of specifications in the context of the Sensor Web as well as the dynamic KML have shown great flexibility to enrich information on the currently evolving GeoWeb by enabling to integrate sensor information into geospatial mass-market applications.
In particular, the NetworkLink feature of KML and the capability of WPS to process referenced data (i.e. data sent by reference), allows the geospatial mass-market applications to integrate service chains accessing the latest data. This is a key aspect in developing architectures for risk management scenarios in the future.
As explained by [33], the performance of web-based geoprocesses as integrated into geospatial mass-market applications is of major interest in the future. Adequate performance is crucial for the usability of the application and opens a new market beyond enterprise applications for the Geospatial Web. Also, the integration of more complex and intelligent geoprocess chains is subject to research. References [1] OGC, OpenGIS Web Processing Service, Open
Geospatial Consortium, 2007. [2] T. Foerster, B. Schaeffer, J. Brauner, and S.
Jirka, “Integrating OGC Web Processing Services into Geospatial Mass-Market Applications,” International Conference on Advanced Geographic Information Systems & Web Services, 2009., Cancun, Mexiko: IEEE, 2009, pp. 98-103.
[3] P. McFedries, “The new geographers,” IEEE Spectrum, vol. December 2007, 2007, p. 96.
[4] A. Turner, Introduction to Neogeography, O'Reilly, 2006.
[5] M. Goodchild, “Citizens as Voluntary Sensors: Spatial Data Infrastructure in the World of Web 2.0,” International Journal of Spatial Data Infrastructures Research, vol. 2, 2007, pp. 24-32.
[6] OGC, OGC KML, Open Geospatial Consortium, 2008.
[7] T.M. Smith, O.K. Norman, and V. Lakshmanan, “Utilizing Google Earth as a GIS platform for weather applications,” 22nd International Conference on Interactive Information Processing Systems for Meteorology, Oceanography, and Hydrology, Atlanta, US: 2006.
[8] C. Kiehle, “Business logic for geoprocessing of distributed data,” Computers & Geosciences, vol. 32, 2006, pp. 1746-1757.
[9] B. Stollberg and A. Zipf, “OGC Web Processing Service Interface for Web Service Orchestration - Aggregating Geo-processing Services in a Bomb Threat Scenario,” Proceedings of Web and Wireless Geographical Information Systems, Heidelberg: Springer-Verlag, 2007, pp. 239-251.
[10] T. Foerster and J.E. Stoter, “Establishing an OGC Web Processing Service for generalization processes,” ICA workshop on Generalization and Multiple Representation, Portland, Oregon, USA: 2006.
[11] A. Friis-Christensen, N. Ostlander, M. Lutz, and L. Bernard, “Designing Service Architectures for Distributed Geoprocessing: Challenges and Future Directions,” Transactions in GIS, vol. 11, Dec. 2007, pp. 799-818.
[12] D. Roman and E. Klien, “SWING - A Semantic Framework for Geospatial ServicesRoman,” The Geospatial Web, A. Scharl and K. Tochtermann, eds., London, UK: Springer, 2007, pp. 229-234.
[13] M. Botts, G. Percivall, C. Reed, and J. Davidson, OGC Sensor Web Enablement: Overview And High Level Architecture, Wayland, MA, USA: OGC, 2007.
[14] M. Botts and A. Robin, OpenGIS Sensor Model Language (SensorML) Implementation Specification 1.0.0, Wayland, MA, USA: OGC, 2007.
[15] S. Cox, Observations and Measurements - Part 1 - Observation schema 1.0., Wayland, MA, USA: OGC, 2007.
[16] Cox, Observations and Measurements - Part 2 - Sampling Features 1.0, Wayland, MA, USA: OGC, 2008.
[17] S. Havens, OpenGIS Transducer Markup Language (TML) Implementation Specification 1.0.0, Wayland, MA, USA: OGC, 2007.
[18] A. Na and M. Priest, Sensor Observation Service 1.0, Wayland, MA, USA: OGC, 2006.
286
International Journal on Advances in Intelligent Systems, vol 2 no 2&3, year 2009, http://www.iariajournals.org/intelligent_systems/
[19] I. Simonis, OGC Sensor Alert Service Candidate Implementation Specification 0.9, Wayland, MA, USA: OGC, 2006.
[20] I. Simonis and P.C. Dibner, OpenGIS Sensor Planning Service Implementation Specification 1.0, Wayland, MA, USA: OGC, 2007.
[21] I. Simonis and J. Echterhoff, Draft OpenGIS Web Notification Service Implementation Specification 0.0.9, Wayland, MA, USA: OGC, 2006.
[22] S. Falke, E. Dorner, B. Dunn, and D. Sullivan, “Processing Services in Earth Observation Sensor Web Information Architectures,” Proceedings of the Earth Science Technology Conference 2008, College Park, Maryland: NASA, 2008.
[23] S. Sivasubramanian, G. Pierre, M.V. Steen, and G. Alonso, “Analysis of Caching and Replication Strategies for Web Applications,” IEEE Internet Computing, vol. 11, 2007, pp. 60-66.
[24] T. Foerster and B. Schaeffer, “A client for distributed geo-processing on the web,” W2GIS, G. Tayler and M. Ware, eds., Springer, 2007, pp. 252-263.
[25] B. Schaeffer and T. Foerster, “A Client for Distributed Geo-Processing and Workflow Design,” Journal for Location Based Services, vol. 2, Sep. 2008, pp. 194-210.
[26] V. Olaya, “SEXTANTE - the free geoprocessing library,” Notti: University of Nottingham, 2009.
[27] J. Brauner and B. Schaeffer, “Integration of GRASS functionality in web based SDI service chains,” Cape Town, South Africa: 2008, pp. 420-429.
[28] B. Schaeffer, “Towards a Transactional Web Processing Service (WPS-T),” Proceedings of the 6th Geographic Information Days, E. Pebesma, M. Bishr, and T. Bartoschek, eds., Muenster, Germany: Institute for Geoinformatics, 2008, pp. 91-116.
[29] B. Baranski, “Grid Computing Enabled Web Processing Service,” Proceedings of the 6th Geographic Information Days, E. Pebesma, M. Bishr, and T. Bartoschek, eds., Muenster, Germany: Institute for Geoinformatics, 2008, pp. 243-256.
[30] A. Friis-Christensen, L. Bernard, I. Kanellopoulos, J. Nogueras-Iso, S. Peedell, S. Schade, and C. Thorne, “Building Service Oriented Application on top of a Spatial Data Infrastructure - A Forest Fire Assessment
Example,” Proceedings of the 9th Agile Conference on Geographic Information Science, Visegrad, Hungary: 2006, pp. 119-127.
[31] S. Yassemi and S. Dragicevic, “Web Cellular Automata: A Forest Fire Modeling Approach and Prototype Tool,” Cartography and Geographic Information Science, vol. 35, 2008, pp. 102-115.
[32] J. Black, C. Arrowsmith, M. Black, and W. Cartwright, “Comparison of Techniques for Visualising Fire Behaviour,” Trans, vol. 11, 2007, pp. 621-635.
[33] J. Brauner, T. Foerster, B. Schaeffer, and B. Baranski, “Towards a Research Agenda for Geoprocessing Services,” 12th AGILE International Conference on Geographic Information Science, J. Haunert, B. Kieler, and J. Milde, eds., Hanover, Germany: IKG, Leibniz University of Hanover, 2009.
287
International Journal on Advances in Intelligent Systems, vol 2 no 2&3, year 2009, http://www.iariajournals.org/intelligent_systems/

Multimodal Robot/Human Interaction for AssistedLiving
Ray JarvisIntelligent RoboticsResearch Centre
Monash UniversityWellington RoadClayton Vic 3168+ 61 3 9905 3470
Om GuptaIntelligent RoboticsResearch Centre
Monash UniversityWellington RoadClayton Vic 3168+ 61 3 9905 3410
Sutono EffendiIntelligent RoboticsResearch Centre
Monash UniversityWellington RoadClayton Vic 3168+ 61 3 9905 3410
Zhi LiIntelligent RoboticsResearch Centre
Monash UniversityWellington RoadClayton Vic 3168+ 61 3 9905 3410
AbstractThis paper outlines the framework of a complex system todemonstrate multimodal spatial and transactional intelligencein a robot which autonomously supports aged, frail, orotherwise disabled people in a domestic assistive technologycontext. The intention is that the robot be able to navigatearound a known multi-room environment along optimal,collision-free paths in search and retrieval of requestedobjects such as spectacles, books etc. and must also becapable of tracking and following humans and of remindingthem of times for meals, medication etc. and to leaddisoriented subjects to their meal place at appropriate timesand even dispense medication, if necessary. The modes ofcommunication interchanges with the supported humaninclude spoken speech and gestures (including eye gazedirection) within the context of situational analysis whichaccommodates recent history, temporal factors and individualuser behavioural models. This paper provides an overview ofan ambitious research project in its early stages, describesmany components developed to date and outlines future work.
KeywordsIntelligent robotics, assistive technology, scene analysis, robotnavigation, gesture recognition, human/machine interaction.
1. IntroductionAs robots emerge from the structured industrial environmentsthey have habituated for some time into the relativelyunstructured spaces of the built and natural world it is clearthat they require increasing levels of intelligence, informed byrich sensory sources, to survive, adapt and serve humans,where humans and robots mix freely. In assistive technologyenvironments, where the served humans are perhaps aged,infirm or otherwise disabled, either mentally or physically, theuseful interactions between robots and humans need to beparticularly sensitive and sophisticated, since no expert
knowledge of the technology can be assumed to reside withthe served humans. Also, in some cases, even the basis ofnormal human to human interaction may be partiallyundermined by physical or mental dysfunction.
Two quite distinct, but functionally linked, types ofintelligence need to be mastered by the robot. The first is'spatial intelligence', which is the understanding of how theworking environment is structured in terms of geometry,occupancy and functional designations (eg. kitchen, bedroometc.) and how to deal with (find, recognise, handle) commonobjects in it (eg. cups, knives, forks, books, spectacles etc.) infulfilment of useful duties. This type of intelligence includesthe capacity to achieve goal directed path planning andfollowing, obstacle avoidance, collision-free robot armtrajectory planning and object recognition/manipulation.Each of these requirements are serious challenges inthemselves. Having them all function together in a smoothoperation to achieve some overall mission is at least one orderof magnitude higher in complexity, in operationalmanagement, context integration, conflict resolution andhierarchical planning terms.
Spatial intelligence, as defined above, has been wellresearched, in its various components, by the robotics researchcommunity over the last two decades or so (Jarvis and Byrne,1987; Jarvis, 1997; Durrant-Whyte and Guivant, 2000; Jafariand Jarvis, 2005 ; Rawlinson and Jarvis ,2007), with variouslevels of maturity and reliability being achieved in each.
The second type of intelligence, which must also be masteredto achieve the overall goal of serving humans correctly,safely, and with grace, is 'transactional intelligence'. By'transactional intelligence' is meant the understanding of howto communicate with humans to be able to correctly interpretand carry out their wishes and to clarify uncertain or detailedaspects of the task at hand. The interaction is a kind ofnegotiation process which should result in purposeful and
288
International Journal on Advances in Intelligent Systems, vol 2 no 2&3, year 2009, http://www.iariajournals.org/intelligent_systems/

correct interpretation and action, with intermediateinterchanges sometimes needed to resolve ambiguitywhenever it arises. Understanding the intent of the humanand how to go about fulfilling it are the essential requirementswithin the assistive technology context. Accommodating thepractical limitations imposed by the physical state of theenvironment (and the objects within it) and the capabilities ofthe robot is crucial to these ends. Understanding what ahuman intends is often fraught with considerable ambiguity.Resolving this ambiguity within the above constraints is thebasic goal of 'transactional intelligence' in this context.
Multimodality provides the crucial key, which unlocks howbest to resolve ambiguities of interpretation in both the spatialand transactional components of this project. Multiple sensormodes, including stereoscopic and panoramic vision, tactilesensing, laser range finding and range cameras are deployedto resolve issues concerning how to navigate efficientlythrough unoccupied space (avoiding fixed and dynamicobstacles), searching for and recognising target objects,manipulating objects (and carrying them), and finally puttingthem before or in the hands of the requester. Likewise,multiple communication modes, including spoken languageunderstanding, gesture recognition, face recognition and gazedirection analysis, are used to achieve 'transactionalintelligence' in the context of environmental constraints (e.g.where the robot can go, where objects are, what things can bepicked up etc.), individual behavioural modes of the user(once recognised) and maybe even the time of the day (e.g.the approach of meal or medication times).
The following section touches briefly on related work. Thenext outlines the robot’s attributes, its control structure, itssensory capability, and the methods of achieving localisation(i.e. position/pose), environmental modelling, path planning,obstacle avoidance, object recognition, and manipulation.This is followed by a section on the way in which variousmodes of human/machine communication are to be combinedto resolve ambiguity, including the possibility of querying thehuman to help resolve and/or refine intention. Then follows asection describing a functional subdivision of project tasksto enable various aspects of practical implementation to be putinto operation. The next section describes progress so far andthe type of experiments being planned for the future.References to papers developed in the author’s laboratoryhave been deliberately given emphasis to indicate thebackground work supporting this current project. This paperarose out of a previous conference presentation (Jarvis, 2009).
2. Related WorkAn increasing amount of research work has recently been
focussed on the area of assistive technology with therealisation of an anticipated large number of old/frail peoplelikely to be inhabiting most Western nations over the nexttwenty years and the corresponding reduction of younger/fitpeople available to look after them. Many proposed solutionslook to modern technology for support. The overall scope ofassistive technology is very wide. The more traditional workhas been to provide smarter wheelchairs which can providesensor informed assistance to their users, allowing them to beable to move about purposely with both independence andsafety (Jarvis, 2002; Hu et. al., 2007) and to use robotics toprovide physical prosthesis (Carrozza et. al.,2001; Pons et.
al.,2004)and therapeutic manipulation(Volpe et. al.,2009).More recently there has been a keen interest in tracking(Chakravarty and Jarvis, 2006) old/sick/feeble people to checkwhether their movement habits are changing, possibly as aharbinger of some serious physical or mental deterioration orto indicate when a fall has occurred (Lee and Mihailidis,2005) and requires immediate attention. Also, there is aninterest in the electronic monitoring of blood pressure, bloodsugar and heart rhythms (Gao et. al. 2005) which can berelayed directly to a medical centre for attention if required.Some of this effort has strong associations with security basedsurveillance (Kanade et. al., 1997), particularly if purelypassive methods of observation are used. Combining roboticwheelchair navigation with on-board robot arm manipulation(Prior, 1990) has also attracted research interest; therequirement for robotic hand/eye coordination (Hagar andChang, 1995) and pattern recognition is clearly evidencedhere. In the field of robotic companions (Dautenhahn et. al.2006), there has also been implications regarding theirapplication for assistive technology as well as entertainment(Tamura et. al. 2004). More generally, there has beenconsiderable work on improving human/machine interaction( BÝÝuhler et. al., 2002) with a focus on more natural modes ofindicating human needs and intentions; clearly, whilst theseefforts can enhance the way the general populationcommunicate with computers, they have particular importancein assistive technology applications, especially where the userhas limited mental capacities.In our project, to be outlined in what follow, we havecombined the areas of multimodal human/machine interactionwith both robotic hand/eye coordination and robot navigation.This holistic approach is fairly unique, as represented in theliterature. Whilst mobile robot navigation and robotichand/eye coordination have long been central to IntelligentRobotics research, until recently, questions relating tohuman/machine communications have mostly been of interestto the Human-Machine Interaction (HMI) researchcommunity. Now that robotics researchers have realised theimportance of this topic, they have been enthusiastic in theirinclusion of these human-centric elements in their research.Nevertheless, the combination of HMI, navigation and robotichand/eye coordination in the one project is rare but is the mainemphasis of our project which sets it apart from other researchefforts.
3. The Robot, Sensors, and 'SpatialIntelligence' Methodologies
The robot [See Figures 1 (a) and (b)] consists of two mainparts. The mobile base is simply an adapted electricwheelchair motor/gear/control set, which can carry a humanpayload for up to six hours between battery charging. It isdifferentially steered with castor wheels at front and back (forstability) and can turn on the spot. A UMI six degree offreedom robot arm is mounted on the mobile base. This armis safe to use in the vicinity of humans since it is slow,relatively weak and has plastic coverings. It has an extensivevertical movement axis, which makes it ideal for retrievingobjects off various height tables and shelves and has a simpletwo fingered gripper. The control schematic is shown inFigure 2. An onboard laptop computer drives a serial four portserver. One port sends commands to the robot manipulator
289
International Journal on Advances in Intelligent Systems, vol 2 no 2&3, year 2009, http://www.iariajournals.org/intelligent_systems/
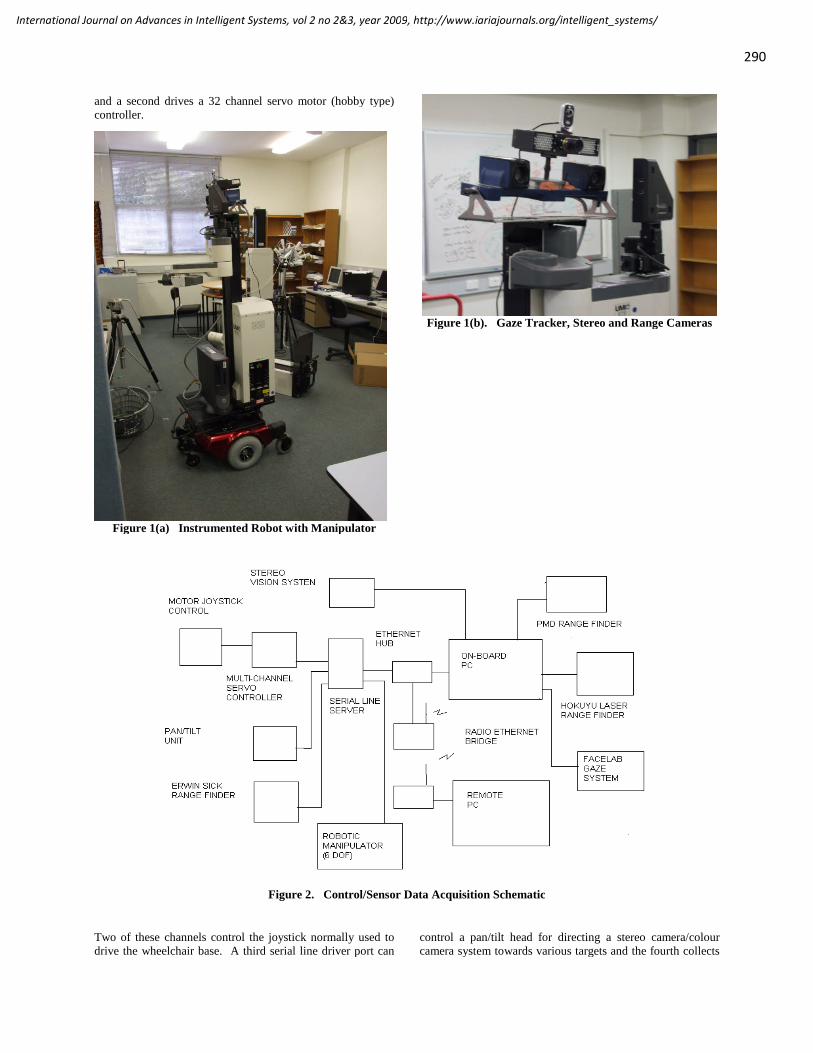
and a second drives a 32 channel servo motor (hobby type)controller.
Figure 1(a) Instrumented Robot with Manipulator
Figure 1(b). Gaze Tracker, Stereo and Range Cameras
Figure 2. Control/Sensor Data Acquisition Schematic
Two of these channels control the joystick normally used todrive the wheelchair base. A third serial line driver port can
control a pan/tilt head for directing a stereo camera/colourcamera system towards various targets and the fourth collects
290
International Journal on Advances in Intelligent Systems, vol 2 no 2&3, year 2009, http://www.iariajournals.org/intelligent_systems/
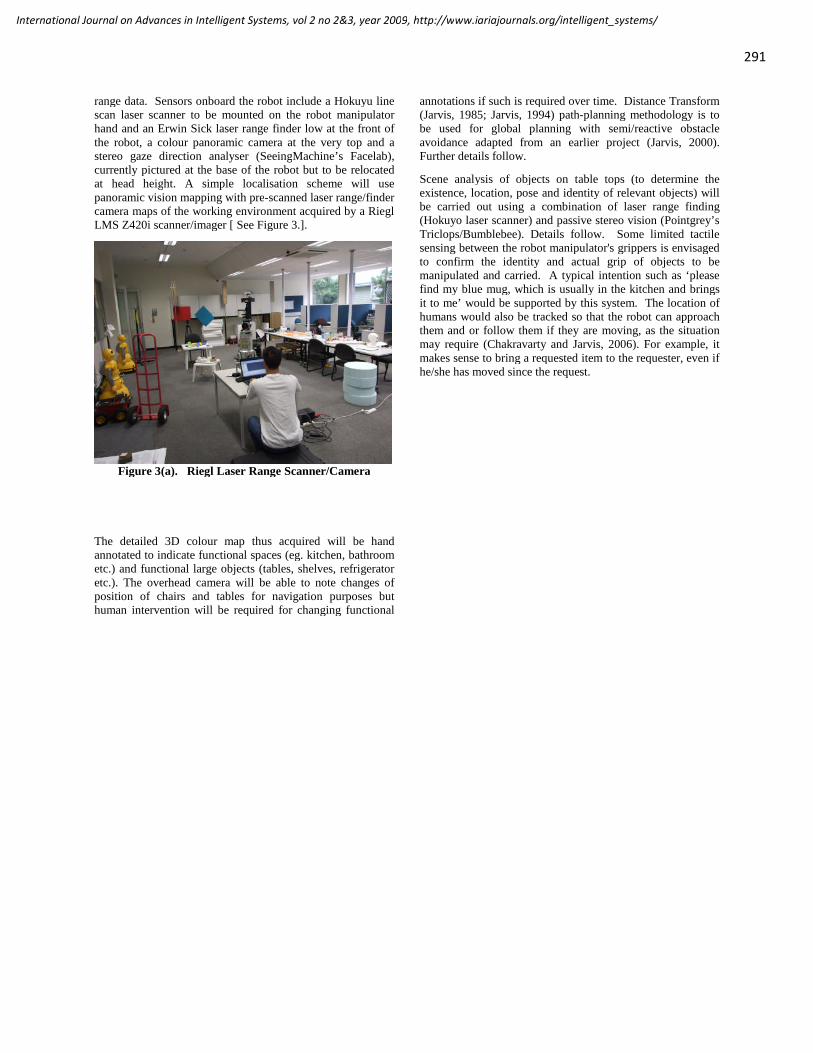
range data. Sensors onboard the robot include a Hokuyu linescan laser scanner to be mounted on the robot manipulatorhand and an Erwin Sick laser range finder low at the front ofthe robot, a colour panoramic camera at the very top and astereo gaze direction analyser (SeeingMachine’s Facelab),currently pictured at the base of the robot but to be relocatedat head height. A simple localisation scheme will usepanoramic vision mapping with pre-scanned laser range/findercamera maps of the working environment acquired by a RieglLMS Z420i scanner/imager [ See Figure 3.].
Figure 3(a). Riegl Laser Range Scanner/Camera
The detailed 3D colour map thus acquired will be handannotated to indicate functional spaces (eg. kitchen, bathroometc.) and functional large objects (tables, shelves, refrigeratoretc.). The overhead camera will be able to note changes ofposition of chairs and tables for navigation purposes buthuman intervention will be required for changing functional
annotations if such is required over time. Distance Transform(Jarvis, 1985; Jarvis, 1994) path-planning methodology is tobe used for global planning with semi/reactive obstacleavoidance adapted from an earlier project (Jarvis, 2000).Further details follow.
Scene analysis of objects on table tops (to determine theexistence, location, pose and identity of relevant objects) willbe carried out using a combination of laser range finding(Hokuyo laser scanner) and passive stereo vision (Pointgrey’sTriclops/Bumblebee). Details follow. Some limited tactilesensing between the robot manipulator's grippers is envisagedto confirm the identity and actual grip of objects to bemanipulated and carried. A typical intention such as ‘pleasefind my blue mug, which is usually in the kitchen and bringsit to me’ would be supported by this system. The location ofhumans would also be tracked so that the robot can approachthem and or follow them if they are moving, as the situationmay require (Chakravarty and Jarvis, 2006). For example, itmakes sense to bring a requested item to the requester, even ifhe/she has moved since the request.
291
International Journal on Advances in Intelligent Systems, vol 2 no 2&3, year 2009, http://www.iariajournals.org/intelligent_systems/

Figure 3(b). Range/Colour Scan of Laboratory
4. Multimodal Human/RobotTransactions
The dominant modes of human/robot communication for thisproject are spoken language understanding and gesturerecognition (including eye gaze). A complex aspect of thelanguage understanding component involves the use ofdialogue history and user models as disambiguatingknowledge sources and is thus dynamic (anytime) rather thanstatic process. A simple 'first try' version of this combination(speech/gesture) has been published (Harte and Jarvis, 2007).Also included are to be face recognition to establish theidentity of the user so that her/his particular habits ofcommunication may be accommodated, and to establishauthorisation and 'attachment' for a periodsufficient to complete a simple task following instruction.Face recognition can also be used to check whether a visitor isa familiar one or a stranger who perhaps should not be givenfree entry without further checks by authorised personnel. Agaze direction system (Facelab), previously used to help adisabled user to navigate a wheelchair (Jarvis, 2002), is also to
be used to refine gesture interpretation which will mainly beconcentrated on arm and hand movement (e.g. say whenlooking at an object being roughly pointed at). Details follow.The overall schema for the project is shown in Figure 4.However, it is hard to use such a conceptual breakdown as animplementation guide. A simpler way of resolvingambiguities of human intention than is shown in Figure 4. willbe used in the first instance. If several modalities (say speechand gesture) are in conflict as to the user’s intention, theconfidence weighted probabilities of interpretations for eachmode separately will be used as votes, looking for feasiblealternatives and the most likely correct one. If there remainshigh uncertainty after this process, the user can be asked forclarification or to simply repeat the request more carefully andperhaps slowly. Clearly we would like to avoid these kind ofclarification requests as they would annoy the users.Hopefully, if we are able to associate certain communicationhabits for individuals, we can minimise their use.
292
International Journal on Advances in Intelligent Systems, vol 2 no 2&3, year 2009, http://www.iariajournals.org/intelligent_systems/

Figure 4. Semantic Network Schematic
5. Task Subdivisions for ProjectDevelopment
In order to allow two fairly distinct groups of researchers, onepredominantly working in robotics, the other on languageunderstanding (within the context of the robot’s capability andpertinent human requests for assistance), a functionalsubdivision of the system has been developed with theintention of being able to integrate the two teams’ efforts in aseamless way. Three interlinking nodes can bedefined in this task subdivision plan. Firstly, one node will beresponsible for the generation of hypotheses of the intent ofthe user and possible reasonable robot responses and tasks,and the resolution of ambiguity towards discovering adominant hypothesis. This system will use current dialog,dialog history and user modelling as well the spatial(existence and probable location of objects) and temporalcontexts( time of day and scheduled events), together withlists acceptable task possibilities. Some kind of extendednegotiation (transaction) will sometimes be needed to obtainsome convergence between what the user wants and what isreasonable for the robot to do. Some clarification questionsmay also have to be posed for this purpose and feasiblealternatives may be offered for selection and acceptance.
The second node embodies the capabilities of the robot, itsvarious skills, such as collision-free navigation in dynamicenvironments (details follow), scene analysis, hand/eyecoordination and the means of triggering tasks relevant to theassistive technology domain. Inputs instructions to this nodefrom the hypothesis generation/resolution and task definitionnode are to be unambiguous and reasonable (but may prove tobe unfeasible in a particular instance) and ready for immediateexecution. The robot will then attempt the assigned task andreport success or failure of completion, with the possibility ofspecifying one of severable failure modes (such as navigationpassage blocked, object can not be found , object found butinaccessible, batteries exhausted etc.).
The third and most vital node concerns the database of spatialgeometry (room dimensions, locations, fixed furnishings etc.),
object lists (specific as well as generic), estimations ofprobable location, time stamps of all actions taken whichmodify the database and the source of the modification(robot/sensor system or hypothesis generator/ambiguityresolver system). Flagging all modifications for validationwould be a useful mechanism to support database integrity.
The initial database would be based on dense 3D geometricand surface colour data from the Riegl laser range/colourimage scanner which would collect information off-line as ahabitat specification , done only once beforehand. This rawscanner data will be hand annotated to label all relevantspaces, furniture, fittings, objects and utilities (stoves, fridges,heaters, toasters, kettles etc.) and extract size, colour andlocation data for the database. Fixed and movable items willbe so classified as would be specific (e.g. a particular book)and generic items (e.g. regular mugs, plates etc.). As objectmoving actions and/or sensor observations dictate, thedatabase would be modified to reflect the new reality. Clearlyall proposed changes will need validation before execution.Uncertainties can be specified probabilistically. Whilst onecould consider the robot (plus sensors) being able to constructthis database piece by piece as it moves about, the idea ofusing pre-scanned data is much more practical and almostcertainly more accurate. It also permits advancing the projectto the transactional intelligence development stages withminimal delay.
We intend to move towards an integrated system where thetime of day, the likelihoods of various objects being at variouslocations (normal expectations plus history of use), thebehavioural particulars of a user, the history of languagedialogues and gestures, the risk factors associated withmaking incorrect interpretations and the nuisance value of toomany clarification queries can all be taken into account withina working physical system where a real robot carries outuseful tasks for an aged, fragile or otherwise impaired humanin the familiar surroundings of a home-like environment,where people and robots freely and safely mix.
293
International Journal on Advances in Intelligent Systems, vol 2 no 2&3, year 2009, http://www.iariajournals.org/intelligent_systems/

6. Progress to Date and Plans for theFuture
The entire project is a quite ambitious and complex one withmany interlinked components. However, many of these havealready been addressed in earlier projects and are readilyadapted to this one. The Distance Transform methodology(Jarvis, 1985; Jarvis, 1994) for global path planning has beenfully investigated and applied successfully in conjunction withbarcode scanned localisation on an indoor robot capable offinding its own collision-free way around an obstacle strewnenvironment (Jarvis, 1997). Localisation using a panoramicvision system and image matching against pre-scanned 3Dplus colour detailed maps of the environment has also beendemonstrated (Jarvis, Ho and Byrne, 2007), yet the system ofoverhead panoramic camera localisation is preferred forsimplicity. Fusing simple speech recognition with primativegesture and object recognition has also been demonstrated(Harte and Jarvis, 2007). Gaze tracking and dynamic obstaclereactive avoidance in relation to a semi-autonomouswheelchair project has also been employed successfully(Jarvis, 2002) as has human target tracking (Chakravarty andJarvis, 2006) and face recognition (Axnick and Jarvis, 2005).The challenge is to combine all these previously testedsystems into a common framework and to providesemantically related clues and sophisticated ambiguityresolving methodology to meet the requirements of theassistive technology environment targeted.
It is intended (an already commenced PhD. Research project)that a sophisticated gesture capture and recognition system bedeveloped for markerless subjects, using a combination ofcolour video and range camera sensors (details follow), fusingthese two sources of spatial data to extract the dynamicparameters of link movements on a skeletal model (uppertorso and head only, initially) of a human and then to train thissystem to bind sequences of movement to intendedcommunication tokens (for each individual subject). Once anindividual is identified using face recognition their rawgesture sequences can be interpreted in a customised way,since different people often have differing ways of specifyingintention which may be sometimes culturally dependent aswell as individual. Gaze direction vectors and mouthmovement detection (for verifying that the person fronting therobot is speaking) will also be extracted.
In what follow, some details of progress to date are reportedas extensions of general approach material presented earlier inthe paper. These include navigational, scene analysis andgesture recognition work completed so far.
A. Mobile Robot Navigation
The three essential sub-system requirements for autonomousmobile robot navigation are localisation (determining thelocation and orientation of the robot), environmentalmodelling (capturing relevant details of the workingenvironment) and path planning (determining the collision-free movements of the robot through the environment from astart point to a nominated goal).
Localisation can be performed using simple odometry (frommeasuring wheel rotation) with a known starting
position/orientation but, due to slippage, imperfect circularityof wheels, undulation of the floor and wheel shape variationsunder load, errors accumulate incrementally and can,eventually, render the evaluated location/orientation unusable.Beacons at known locations can also be used but this requirescareful, possibly tedious, site preparation. Natural landmarksare an alternative, but the computational load is quite high,depending on what on-board sensors are used. In our projectwe have the advantage of a pre-scanned environment (using aRiegl LMS Z420i laser range scanner/camera) within whichparticular objects (eg. doors, tables, fridge, book shelves,cupboards etc.) can be annotated and localisation can bedetermined using an onboard panoramic vision system.However, we have chosen to use a fixed high vantage pointpanoramic video camera that can recognise the position andorientation of the robot as well as track people and notevariations in the obstacle strewn space, both slow and fastchanging. Thus the path planning can take into account bothstatic and dynamic obstacles and also accommodate thepositions and movements of people, perhaps even usingpredictions of human movement intention into consideration.
Environmental modelling requires either prior knowledge ofthe working environment (maps, plans, scans etc.) or a meansof incrementally constructing a model using on-board sensorswhilst the robot moves around the environment. Aconsiderable body of published work addresses the notion ofcombining localisation with environmental mapping(Simultaneous Localisation and Mapping – SLAM) (Durrant-Whyte and Guivant, 2000) but, until the map is sufficientlycomplete, optimal path planning cannot be carried out. In oursituation, a complete detailed scan of the environment is takenjust once using a Riegl LMS Z420i laser rangescanner/camera. The particular advantage of this approach (incontrast to SLAM) is that all functional details of theenvironment (tables, doors, stoves, cupboards) can beannotated in the data for proving goals for subsequent pathplanning in accordance to the task required to be carried outby the robot. The overhead panoramic camera mentioned inthe previous paragraph supplements this data to includeupdates and note dynamic aspects, particularly the movementof people.
Path planning has aims, firstly, to arrive at a nominatedlocation without obstacle collision and, secondly to do soefficiently as determined by some optimality criterion. Bothstatic and dynamic obstacles should be avoided, perhaps somebusy traffic areas a voided if possible as a courtesy to humansand perhaps even the approach to a human madeunobtrusively yet without startling the human from behindincluded in the path planning strategy. From amongst thelarge number of path planning strategies available we havechosen the Distance Transform approach since all the aspectsmentioned above, such as static and dynamic obstacleavoidance preferred no-go zones human movementpredictions, human approach preferences etc., can be easilytaken into account and the path plan re calculated frequencywhen required.
The Distance Transform (DT) path planning algorithm is verysimple to construct. Details are provided elsewhere (Jarvis,1994), but the gist of approach can be easily described:
294
International Journal on Advances in Intelligent Systems, vol 2 no 2&3, year 2009, http://www.iariajournals.org/intelligent_systems/

1. Construct a tessellated floor map with each cellrepresenting a 'floor tile' of appropriate dimensions relative tothe robot dimensions (say, a 2x2 set of tiles approximately the2D size of the robot). Each cell should contain a positive costrepresenting the cost of entering that cell, obstacles beinggiven an infinite cost. Preferred no-go zones can have highcosts. It is even possible to have the cost of entering a celldepend on which neighbour the entrance comes from, thusallowing preferred directions and one way only constructs butthis will not be included here.
2. In a separate map same structure as the cost map, describedabove, goal point cell is set to zero and all free space (spacenot occupied by obstacles) set to a large number). This iscalled the DT map.
3. In a forward raster order (left to right, top to bottom),skipping over obstacle cells, replace the constants of each cellby the least of recently visited neighbour's (three above andone to the left) number plus the cost (from the cost map) ofentering that all.
4. In a reverse raster order (right to left, bottom to top) repeatthe strategy of 3, noting that recently visited neighboursconsist of three below and one to the right.
5. Repeat 3 and 4, above, until no change occurs. Now theDT map is the cost weighted Distance Transform.
6. From any point in free space, the steepest descenttrajectory in the DT map leads optimally to the goal. The DTmap, itself, is starting point independent.
The starting point independence of the DT map has theadvantage that, should the robot wander off or deliberatelymove off the planned path (to avoid a fast mobbing obstaclenot yet in the cost map), it can recover by continuing asteepest descent path from its new location. Since the DTprovides the distance to the nearest goal for each free cell, thesteepest descent trajectory can be followed from any point infee space to reach the goal in an optimal path.
Multiple goals (any one of which when achieved is sufficient)can be included without altering the algorithm (putting zerosin the DT map), the steepest descent trajectory from any pointin free-space leading to the goal with the least cost ofachieving.
The DT strategy can be extended to any number ofdimensions and can also be adapted to cope with the sixdegree of freedom (or more) movements of robotmanipulations using configuration space.
Should one of the dimensions be time a spatio-temporal DTcan be generated. The only significant difference whencompared to physical dimensions is that, time beingirreversible, the construction of the DT only requires one passon the time dimension.
Suppose a time dimension were added to a two physicaldimension tessellated map space. A stack of 2D maps, eachrepresenting are point in discreet time, can be piled up, withthe top one being at the present and the bottom most one thetime count in the future represented the extent of the futurefactual details of obstacle space or even precautions of such.Cells in the 3D (2D + time) stack marked zero represent goals
in time/space (rendezvous). If these are all fixed in position(on a vertical pole through the stack) it means that anominated position can be reached at any time (of course westill want cost optimality in reaching it). Isolated goals mustbe reached precisely in the appropriate time interval. Acontinuous strength of goals through time is like trying tomeet a moving goal. Again a corresponding cost may containnon-negative cost values. If only distance and waiting iscosted a simple cost structure where waiting costs one unit,front/back and sideways moves costs 2 units and diagonal
moves costs 3 units3
2 2
. Details are given in (Jarvis,
1994). The algorithmic scan moves from the most future layerbackwards in time until the top (present) level, replacing costsat each level in parallel (each cells replacement can becalculated independently). Only one pass is necessary. Fromthe present level start point the steepest descent path throughtime space leads to the least costly achievable goals. The costreplacement rule is to calculate the cost from each neighbourand the cell itself in the next time interval plus the cost ofmoving into the cell and choosing the least sum. No physicalmovement costs one unit for waiting cost (like a taxi charge).
Of course, in the simplest case one must have a perfectprediction of the locations of all obstacles in the future untilthe time interval represented by the bottom map. However,these costs can be probability values calculated from predictedmovement observations. As the robot moves physically intime the future horizon can be extended and repopulated withestimated cost with the DT calculated repeated as open asrequired. Since the space/time DT is a one pass evaluationand essentially a parallelisable algorithm it can be executedquickly. If the obstacle prediction is based on observedmovements and simple expectations of straight linetrajectories the future costs can be simply determined.Uncertainty can be modelled using Gaussian or otherdistribution functions and even the distortions of the spreadfunctions caused by not being able to penetrate fixed obstaclescan be taken into account. Some example of dynamicobstacle field path planning are shown in Figure 5.
(a) Time Frame, t + 6Δt
295
International Journal on Advances in Intelligent Systems, vol 2 no 2&3, year 2009, http://www.iariajournals.org/intelligent_systems/

(b) Time Frame, t + 18Δt
(c) Time Frame, t + 54Δt
(d) Time Frame, t + 65ΔtFigure 5. A scenario where waiting is preferred
by path planning algorithm.
Figure 5 represents a collection of key snapshots from thesimulator at different time slices. In the figure, the greenshaded region represents the moving obstacle. When the robotencounters the predicted moving obstacles, it waits until theobstacle passes before continuing towards its destination.Although, it may seem that the moving entity is colliding withthe red-shaded static obstacles, this is not the case as both thered-shaded static obstacles and the green-shaded movingentities are dilated in order to avoid getting too close to eachother and the robot.
Thus in some scenarios, it can be argued that the optimal routemay require a robot to stop and wait approach to avoidmoving obstacle.
Unpredictable dynamic changes in the environment can beobserved from an overhead panoramic video camera and canbe quickly incorporated into the DT planner.
From time to time it may also be required that the annotatedmap of the environment be adjusted if more permanentchanges are to be accommodated. This can be done manually.
B. Robotic Hand/Eye Coordination
When the robot approaches the table or shelf where a targetobject (eg. cup, fruit, spectacles, pencil etc.) might be found,the local scene needs to be analysed to identify the targetobject and estimate its position and pose so that it can begrasped and withdrawn from its environment without collision(so that it might be taken to the human requester). Sceneanalysis concerns describing objects in terms of identity,position/pose and juxtaposition components may have tospecify proximity, access, support or containment aspects ofthe target object in the context of its relevant neighbours.Robotic hand eye coordination's refers to the capability ofdirecting a robot manipulator to manipulated objects in thescene based on it s visual analysis results. In our case, therobot arm is on a mobile robot also carrying the scene analysissensors. The aim of robot hand/eye coordination in thecontext of our application is to retrieve the target objectwithout collision. Scene analysis can be particularly difficultif objects in the scene and in a jumble or when some arevisually obscuring others. There are two classes of objectrecognition tasks involved. The first class is where a specific,unique object needs to be found against a database ofpossibilities. Methodologies based on Scale Invariant FeatureTransform (SIFT) (Lowe, 1999) features are ideal for solvingthis type of pattern recognition problem. A number oflocalised features are extracted by sight as signatures of theobjects they belong to. Finding sufficient matching signatureswith respect to a particular object in the database objects (precalculated) is all that is required to identify a specific object(eg. a particular mug, bottle, pan or spectacles etc.). Theobject database can have multiple entries of the same objectviewed from a variety of positions; this permits recognitioneven in severely obscured conditions and for varied poses.We use a Triclops (Pointgrey) stereo camera to initiallysegment the objects in a scene and to identify the supportingplane (eg. table surface). SIFT can then be used to identifythe target object if it is present and the stereo disparity (3Ddata) and segmentation results can be used to construct avirtual bounding box around the identified object to allowgrasping to be planned and executed from above (thusreducing the collision problem). A simple example isillustrated in Figure 6.
296
International Journal on Advances in Intelligent Systems, vol 2 no 2&3, year 2009, http://www.iariajournals.org/intelligent_systems/
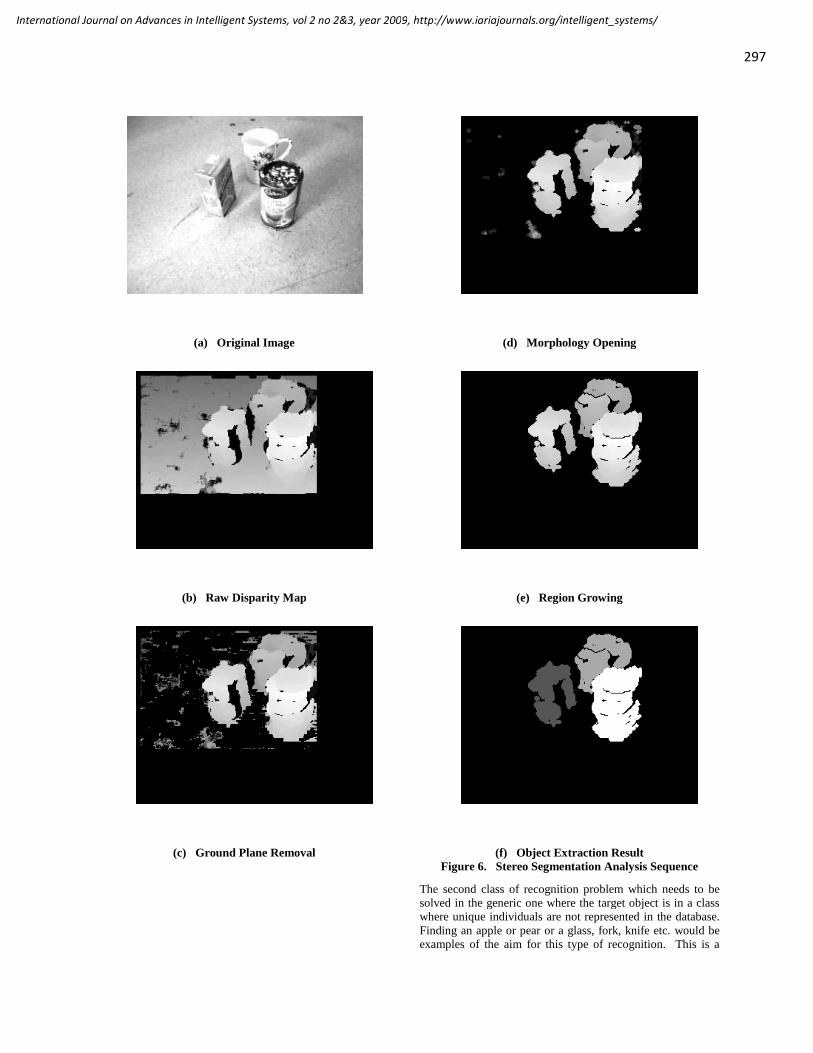
(a) Original Image
(b) Raw Disparity Map
(c) Ground Plane Removal
(d) Morphology Opening
(e) Region Growing
(f) Object Extraction ResultFigure 6. Stereo Segmentation Analysis Sequence
The second class of recognition problem which needs to besolved in the generic one where the target object is in a classwhere unique individuals are not represented in the database.Finding an apple or pear or a glass, fork, knife etc. would beexamples of the aim for this type of recognition. This is a
297
International Journal on Advances in Intelligent Systems, vol 2 no 2&3, year 2009, http://www.iariajournals.org/intelligent_systems/

more difficult problem, which we are still working on, theobscurance problem being a particularly difficult aspect ofthis task. The simple-minded approach of picking up andseparating each object and then attempting to recognise it inisolation is not considered a satisfactory methodology for ourapplication.
C. Gesture Recognition
Gesture recognition is to be one key component of thetransactional intelligence aspects of this project. Combininggesture with voice recognition to reduce ambiguity inexpressing a task intention to the robot is seen as proving anatural and robust human/machine interface, which could beused by non-technical, possibly frail users. Off-the-shelf facerecognition and voice recognition systems are used to supportthis aim. We adopted a face recognition software packagecalled ‘verilook’ (version 3.2), which is provided byNeurotechnology. It supports simultaneous multiple faceprocessing in live video and still images. It does not requirehigh resolution images; webcams or other low cost camerascan be used. Aquality threshold can be used during face enrolment to ensurethat only the best quality face template will be stored intodatabase. VeriLook has certain tolerance to face posture thatassures face enrolment convenience: rotation of a head can beup to 10 degrees from frontal ineach direction (nodded up/down, rotated left/right, tiltedleft/right).The voice recognition software we use is called‘Dragon Naturally Speaking’ (version 9) provided by NuanceCompany. It translates the user’s speeches into text. Therecognition accuracy can be significantly improved byintensive training. In addition, we can addwords or phrases into our own vocabulary set and putemphasis on them in the training stage, so that we can achievea high recognition rate for the frequently used phrases in ourapplication. By recognising an individual, his/her expectedbehaviour with respect to voice and gesture communicationscan be used to simplify and improve the quality ofgesture/voice command and dialog recognition.Also, the sameperson using a fetch command can be the recipient of thefetched object even if they have moved, provided theirmovements are tracked by the overhead camera. Facerecognition can be used to verify that tracking has beencarried out correctly. Gestures are useful and a natural way ofexpressing geometrical and spatial information, particularlypointing and come and go and stop indications.
We are using a PMD Technologies range camera whichprovides frontal surface distances at low resolution (160x120)but high speed. The technology behind this type of camera isinfrared laser time-of-flight measurement with each pixelevaluating this measure. A colour web-cam, mounted on therange camera, is also used as it provides higher resolutioncolour image data. Detecting a face is a first step todetermining the position of a person as a preliminary to armand hand gesture recognition. The resolution of the rangecamera is too low for reliable face detection so the colourweb-cam image is used instead. The algorithm used is basedon Hair- like features (Lienhart and Maydt, 2002) and boostedclassifiers (Lienhart, Kuranov and Pisarevsky, 2003).Subsequently, the position of the face is found in the range
camera data using the SAD (Sum of Absolute Difference)matching method.
We anticipate using a Xuuk's Eyebox 2 camera which detectsinfrared light reflected through the retinas (exploits the 'red-eye' effect) to count and localise people looking towards thecamera to instantly position the vision/range system mountedon the mobile robot in an appropriate position for face andsubsequent gesture recognition. We also hope to identify theperson who is giving commands to the robot, amongst thosefacing the robot, by lip movement and audio cues.
When the user's face has been located in the range cameradata, the distance between that user and the robot can beestimated. On the assumption that the human body (uppertorso, arms and head) can be enclosed in a cubic volumedetermined by the 3D position, all other objects (background)can be excluded from further analysis. This approachperforms well in cluttered and dynamic environments and isclearly insensitive to the colour of clothes worn, even if thesecolours are similar to background colours.
Upper body gestures are recognised using a model basedapproach which is less sensitive to noise than model-freealternatives and provides a comprehensive understanding ofall major joint angles (finger joints have not been tackled).The degree of freedom of the required model depends on thespecific application and a trade-off between accuracy and thenumber of parameters of the model to be determined (Gavrila,1999) must be made. Superquadrics are used for our bodymodels.
Whilst other researchers have used multiple cameras from avariety of surrounding viewpoints, this approach does not suitour application where the robot carries the gesture recognitionsensors and directs them at selected humans. Thus we areconstrained to single viewpoint methods. We use bothsilhouette and depth information from a single viewpoint toextract upper torso 3D joint angles by finding the bestmatches between the observed data and body models. Figure7 shows recognition results when the user's arm movesforwards and backwards. This example shows that the systemcan deal with self-occlusion problems.
298
International Journal on Advances in Intelligent Systems, vol 2 no 2&3, year 2009, http://www.iariajournals.org/intelligent_systems/

299
International Journal on Advances in Intelligent Systems, vol 2 no 2&3, year 2009, http://www.iariajournals.org/intelligent_systems/

Figure 7. Image, Silhouette and Gesture Model Sequence.
The gaze direction of a person’s attention is an important cueregarding nearby objects with which he/she is indicating.People tend to look at the target in the early stages of a handpointing gesture. Using a FaceLAB (from SeeingMachines)system manufactured by Seeing Machines, which uses a pairof video cameras to stereoscopically determine head pose andeye gaze direction, we can determine a vector of the usersgaze direction. The head pose and eye-gaze data can becombined using confidence-weighted factors to estimate thevisual attention vector. Intersecting this vector with ahand/arm pointing gesture and assist in identifying a targetobject.
So far we have concentrated on static gestures, but will soonextend the systems to understand dynamic gesturers, mostlikely by combining HMM (Hidden Markov Models) andFSM (Finite State Machines).
Since different particular gestures for a given intention arebehavioural aspects for certain races, ethnic groups andindividuals, we will customise our gesture recognition systemfor each registered individual who can be identified using facerecognition. For those not registered or identified a default setof general gesture parameters will be used but with a lesserexpectation of success.
We hope to eventually, not only combine gesture and speechbut also temporal and individual behavioural cues to attemptto correctly interpret the human intention of a robot command.Furthermore we intend to permit the robot to queryambiguous commands to refine its expectations of completinga mission successfully.
Using the high fidelity 3D/colour scan of the workingenvironment (using a Riegl LMS Z420i laser/camera scanner,as mentioned earlier) we will be able to label objects with
functional attributes and to build up probabilistic models ofwhere various objects might be found. We will then be ableto design optimal search paths for the robot to find the targetobject with the least expected time of discovery. Behaviourpatterns of individuals can also be learned and fed into thesystem to enhance both the Spatial Intelligence andTransactional Intelligence of the system.
We plan experiments to demonstrate the following kinds ofsupporting service to aged and/or fragile or otherwise disabledusers:(a) Find and fetch common objects such as spectacles,
books, mugs, utensils etc.(b) Reminders and dispensation of medications(c) Identify users (and maintain the continuity of a
transaction).(d) Check visitor's identity at the door(e) Lead a user to a nominated place (eg. dining hall).(f) Track and follow humans.
The particular behaviour of characteristics of the users, timeof day, known special circumstances (eg. anticipating avisitor) would be accommodated by the multi modaltransactional intelligence system and appropriate clarificationqueries prompted by the nature of unresolved ambiguitiesdesigned to minimise the nuisance value of such. Eventuallyit is hoped to have a learning system adaptively refine thewhole system to gradually improve the efficiency of theservice processes and minimise the annoyance of clarificationqueries. A lot has still to be done but the framework is now inplace and a number of individual components ready forintegration.
Conclusions
This paper has briefly outlined the framework of a multi-model spatial and transactional intelligence system directed athaving robots help aged, fragile or otherwise disabled peoplecope with their living environments in an assistive technologycontext. Much has yet to be done but the way forward is clearthough complex. Only actual physical demonstration willeventually prove the system functionally feasible andworthwhile. Such is the overall goal of the project. Much isyet to be done, but the elements for an integrated system arewell advanced. However, it is likely that integration will itselfbe a very difficult process and one which must be plannedcarefully, each member of the research team being aware ofthe need to provide clear interface data exchanges between thecomponents in a unambiguous format devised in concert. Asthe project progresses we would not be surprised to find thatthe natural ambiguity of human to human communication willhave to be resolved to an extent not initially envisioned as apre-requirement for effective human-robot collaboration.
AcknowledgmentThis research is supported by the Australian Research Councilthrough a Discovery Grant (DP0878195).
References[1] Axnick, K.B.J. and Jarvis, R.A. (2005), Face and pose
recognition for robotic surveillance, Proc. 2005Australasian Conference on Robotics and Automation,5th to7thDec., Sydney, pp. 1-9.
300
International Journal on Advances in Intelligent Systems, vol 2 no 2&3, year 2009, http://www.iariajournals.org/intelligent_systems/

[2] BÝÝuhler, D., Minker, W., Huluser, J and Kruger, S.(2002) Flexible Multimodal Human-machine Interactionin Mobile Environments, 7th International Conferenceon Spoken Language Processing, Sept. 16-20, Denver,Colorado, USA.
[3] Carrozza, M.C., Massa, B., Micera, S.,Zecca, M. andDario, P. (2001) A ‘Wearable’ Artificial Hand forProsthetics and Humanoid Robotics, Proc. 2001 IEEE-RAS International Conference on Humanoid Robots.
[4] Chakravarty, P. and Jarvis, R.A. (2006). PanoramicVision and Laser Range Finder Fusion for MultiplePerson Tracking, accepted for presentation at theInternational Conference on Intelligent Robots andSystems, Oct. 9-15, Beijing, China.
[5] Dautenhahn, K., Walters, M., Woods, S., Koay, K.L.,Nehaniv, C.L., Sisbot, A. and Simeon, T.(2006) Howmay I serve you?: a robot companion approaching aseated person in a helping context, ACM/IEEEInternational Conference on Human-Robot Interaction,Proc. 1st ACM/SIGART conference on Human-robotinteraction, Salt Lake City, USA, pp. 172-2006.
[6] Durrant-Whyte, H. F. and Guivant, J. (2000)Simultaneous localization and map building using naturalfeatures in outdoor environments, IntelligentAutonomous Systems 6. Vol 1, pp 581-588, IAS-6, Italy,25-28 July.
[7] Gao, T., Greenspan, D. Welsh, M., Juang, R.R. and Alm,(2005)Vital Signs Monitoring and Patient TrackingOver a Wireless Network, Proc. 27th AnnualInternational Conference of the IEEE EMBS, Shanghai,Sept.
[8] Gavrila, D.M. (1999) The Visual Analysis of HumanMovement. A Survey, Computer Vision and ImageUnderstanding.
[9] Hager, G.D., Chang, W-C., and Morse, A.S.(1995)Robot Hand-Eye Coordination Based on Stereo Vision,IEEE Control Systems Magazine, Vol.15. pp. 30-39.
[10] Harte, E. and Jarvis, R.A. (2007). Multimodal Human-Robot Interaction in an Assistive Technology Contextusing Environmental Knowledge, accepted forpresentation at the Australasian Conference on Roboticsand Automation , 10th to 12th. Dec. Brisbane, Australia.
[11] Hu, H.H.,Jia, P.,Lu, T. and Yuan, K. (2007) Headgesture recognition for hands-free control of anintelligent wheelchair,Industial Automation: AnInternational Jopurnal, Vol. 34, No. !, pp. 60-68.
[12] Jafari, S and Jarvis, R. (2005). Robotic Hand EyeCoordination from Observation to implementation,International Journal of Hybrid Intelligent Systems(IJHIS), 2, pp. 269-293.
[13] Jarvis, R.A.(1985) Collision-Free Trajectory PlanningUsing Distance Transforms, Proc. National Conference
and Exhibition on Robotics, Melbourne, 20-24th Aug.1984, also in Mechanical Engineering Transactions,Journal of the Institution of Engineers, Vol.ME10, No.3,Sept. pp. 187-191.
[14] Jarvis, R.A. and Byrne, J.C.(1987) An AutomatedGuided Vehicle with Map Building and Path FindingCapabilities, invited paper, Fourth InternationalSymposium of Robotics Research, University ofCalifornia at Santa Cruz, 9-14 Aug. pp. 155-162.
[15] Jarvis, R.A. (1994). On Distance Transform BasedCollision-Free Path Planning for Robot Navigation inKnown, Unknown and Time-Varying Environments,invited chapter for a book entitled 'Advanced MobileRobots' edited by Professor Yuan F. Zang, WorldScientific Publishing Co. Pty. Ltd., pp. 3-31.
[16] Jarvis, R.A. (1997). Etherbot - An Autonomous MobileRobot on a Local Area Network Radio Tether, Proc.Fifth International Symposium on ExperimentalRobotics, Barcelona, Catalonia, June 15-18, pp. 151-163.
[17] Jarvis, R.A. (2000). A User Adaptive Semi-AutonomousAll-Terrain Robotic Wheelchair, 6th InternationalConference on Intelligent Autonomous Systems, July 25-27, Venice, Italy, pp. 671-678.
[18] Jarvis, R.A. (2002). A Go Where you Look Tele-Autonomous Rough Terrain Mobile Robot, 8thInternational Symposium on Experimental Robotics(ISER’) 2, Sant’Angelo d’Ischia, Italy, 8-11 July.
[19] Jarvis, R.A., Ho, Nghia and Byrne, J.B.(2007).Autonomous Robot navigation in Cyber and RealWorlds, CyberWorlds 2007, Hanover, Germany, Oct.24th to 27th, pp. 66-73.
[20] Jarvis, R. A.(2009) Multimodal Robot/HumanInteraction In An Assistive Technology Context, The2nd International Conference on Advances in Computer-human Interaction,(ACHI 2009), Cancun, Mexico,1st
to 6th Feb.
[21] Kanade, T., Collins, R., Lipton, A., Anandan, P., Burt,P. and Wixson, L. (1997) Cooperative Multi-SensorVideo Surveillance, Proc. 1997 DARPA ImageUnderstanding Workshop, May, pp. 2-10.
[22] Lee, T. and Mihailidis, A. (2005) An Intelligentemergency response system; preliminary developmentand resting of automated fall detection, J. TelemedTelecare, Vol 11, pp. 194-198.
[23] Lienhart, R., Maydt, J. (2002). An extended set of Haar-like features for rapid object detection, Proceedings of2002 International Conference on Image Processing,Vol. 1, pp 900-903.
[24] Lienhart, R., Kuranov, E. and Pisarevsky, V. (2003)Empirical Analysis of Detection Cascades of BoostedClassifiers for Rapid Object Detection, in DAGM 25thPattern Recognition Symposium.
301
International Journal on Advances in Intelligent Systems, vol 2 no 2&3, year 2009, http://www.iariajournals.org/intelligent_systems/

[25] Lowe, David G. (1999) Object recognition from localscale-invariant features, International Conference onComputer Vision, Corfu, Greece (September ), pp.1150-1157.
[26] Pons, J.J, Rocon, E., Ceres, R., Reynaerts, D., Saro, B.,Levin, S. and Van Moorleghem, W. (2004) TheMANUS_HAND. Dextrous Robotics Upper LimbProsthesis: Mechanical and Manipulation Aspects,Autonomous Robots, 16, pp. 143-163.
[27] Prior, S.D. (1990) An Electric Wheelchair MountedRobotic ARM-A Survey of Potential Users, Journal ofMedical Engineering and Technology, Vol. 14, Issue 4,July, pp.143-154.
[28] Rawlinson, D. and Jarvis, R.A. (2007) Topologically-directed navigation, Robotica: International Journal ofInformation, Education and Research in Robotics andArtificial Intelligence (on-line publication 10th Sept.,(hard copy journal version imminent).
[29] Tamura, T., Yonemitsu, S., Itoh, A., Oikawa, D.,Kawakami, A., Higashi, Y., Fujimooto, T. andNakajima, K. (2004) Is an Entertainment Robot Usefulin the Care of Elderly People With Severe Dementia?,The Journals of Gerontology Series A: BiologicalSciences and Medical Sciencews, 59, M83-M85.
[30] Volpe. B.T., Huerta, P.T., Zipse, J.L., Rykman, A.,Edwards, D., Dipietro, L., Hogan, N. and Krebs, H.I.(2009) Robotic Devices as Therapeutic and DiagnosticToots for Stroke Recovery, Arch Neurol. Vol. 66, No. 9,pp. 1086-1090.
302
International Journal on Advances in Intelligent Systems, vol 2 no 2&3, year 2009, http://www.iariajournals.org/intelligent_systems/

Utilizing Open Content for Higher-Layered Rich Client Applications
Monika Steinberg, Jürgen BrehmInstitute of Systems Engineering - System and Computer Architecture
Hannover, Germany[steinberg, brehm]@sra.uni-hannover.de
Abstract - Accomplishing user interoperation and standardizedweb techniques is a promising mixture to build a nextgeneration of web applications in the currently arising SocialSemantic Web. Increasing heterogeneous Open Content is anongoing trend. Generic concepts for higher-layered reuse ofthe arbitrary information overload - mentioning the Internet ofServices - are not covered very well yet. For further, directeduse of distributed services and sources, inquiry, interlinking,analysis, machine- and human-interpretable representation areas essential as lightweight user-oriented interoperation andcompetency in handling. In the following we introduce theqKAI application framework (qualifying Knowledge Acquisitionand Inquiry) [1] - a service-oriented, generic and hybridapproach combining knowledge related offers for convenientreuse and tweaking them with interaction for improved access.qKAI aims at closing some residual gaps between the“sophisticated” Semantic Web and “hands-on” Web 2.0enabling loose-coupled knowledge and information servicesfocused on knowledge life cycles, learning aspects and rich userexperience. Overall, in qKAI Open Content is boosted as aninherent part of higher-layered, lightweight applications inknowledge and information transfer via standard tasks ofknowledge engineering and augmented user interaction. Weintroduce the qKAI hybrid data layer - a minimalistic datamodel with maximized depth - implementation results andsome lessons learnt. We discuss the Semantic Web querylanguage SPARQL critically to enlighten its limitations incurrent web application practice. Acquiring resources anddiscovering the Web of Data is a massively multithreading partof the qKAI hybrid data layer which serves as basis for furtherknowledge based tasks. Built upon this data layer, socialeducational gaming is instanced to simplify interoperation, tospread knowledge in a handy way and to enhance users’collaboration with Open Content. Attendance is increasedthrough game-based, incentive arrangements following RichClient paradigms. Long-term objective is to establish OpenContent in information and knowledge transfer as utilizedknowledge base.
Keywords: Open Content; Social Semantic Web; KnowledgeEngineering; Rich Clients.
I. INTRODUCTION
Currently the borders between Semantic Web and Web2.0 become fluid more and more and let us create newsynergies in the Web 3.0 [2] or also called the SocialSemantic Web. The combination of social user involvement,employing desktop-alike rich interfaces (RIA [3]), and theSemantic Web with technologically oriented operability fordata representation and processing is a promising conceptual
basis to solve two pending problems. On the one side, thereis still a lack of lightweight user participation in SemanticWeb contexts because of handling hurdles and missing fancyinteroperation ability. On the other side, there are claims forless trivial and more unitary content in Web 2.0 contexts.Currently DBpedia [4] and Freebase [5] start bringing theseefforts together by offering collaborative content collection,creation, refinement, or semantic interlinking to increaseOpen Data that is well interpretable by humans andmachines. Twine [6] is another semantic knowledge-enhancing platform, but does not offer its content with openaccess yet.
Metadata is an important factor for analyzing andcategorizing content. In case of missing metadata, automatedand manual annotations are approved workarounds to getinformation about the information while deriving usefulknowledge out of it. Conclusions about information quality(e.g., provenance, reputation, timeliness, correctness) areimportant for further deployment in knowledge transferscenarios and can be deduced out of metadata analyses andfurther interactive assessment.
We have to develop enjoyable interoperation scenariosthat permit interactive knowledge transfer and learning. Wesee facilitating access to Open Data by intuitive learninginteraction concepts as a promising combination to increaseOpen Knowledge and to prepare it for further learningpurpose. Knowledge transfer is in contrast to learning a non-linear process. Learners are able to move free in the createdenvironment and may decide on their own which learningorder to take. Further on users are embedded and activelyinvolved to influence learning sequences. Proved learningconcepts have to be active, self-controlled, constructive,situative and social following successful didactic concerns[7]. Systematically linear and non-linear learning scenarioswill be realized in the qKAI project [1] to allow differentinteraction types like exploring, questioning, answering orannotating.
Also fundamental are incentive and motivation of theusers to interoperation and collaboration. Next to commonmethods for annotating and exploring data, usingquestionnaires and data browsers, we see especiallyknowledge games as motivating way to implicitly inquire,analyze and annotate content while knowledge is interceded.Well-designed gaming flows can impart handling ofsuspenseful information in an easy understandable manner tothe user. Open Knowledge, that is well comprehensible forits users and machine-readable, increases this way. Newlydeveloped learning interaction services and enriched contentshould be tied up with conventional Learning Management
303
International Journal on Advances in Intelligent Systems, vol 2 no 2&3, year 2009, http://www.iariajournals.org/intelligent_systems/
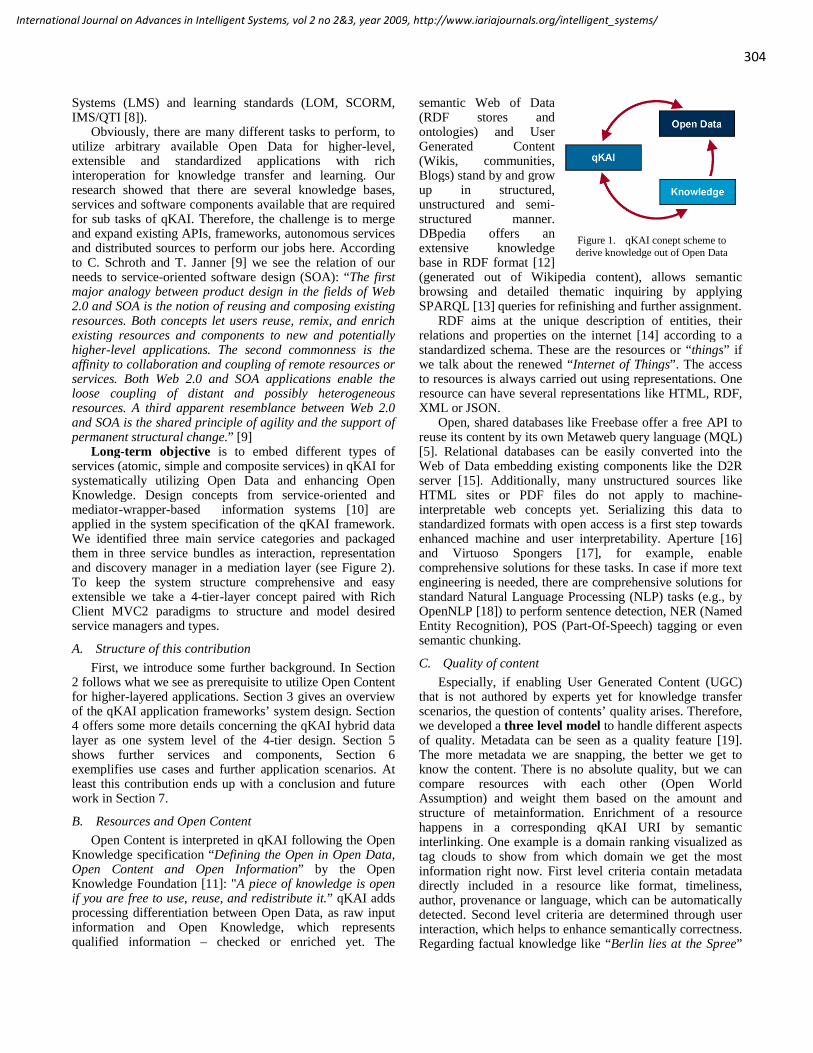
Systems (LMS) and learning standards (LOM, SCORM,IMS/QTI [8]).
Obviously, there are many different tasks to perform, toutilize arbitrary available Open Data for higher-level,extensible and standardized applications with richinteroperation for knowledge transfer and learning. Ourresearch showed that there are several knowledge bases,services and software components available that are requiredfor sub tasks of qKAI. Therefore, the challenge is to mergeand expand existing APIs, frameworks, autonomous servicesand distributed sources to perform our jobs here. Accordingto C. Schroth and T. Janner [9] we see the relation of ourneeds to service-oriented software design (SOA): “The firstmajor analogy between product design in the fields of Web2.0 and SOA is the notion of reusing and composing existingresources. Both concepts let users reuse, remix, and enrichexisting resources and components to new and potentiallyhigher-level applications. The second commonness is theaffinity to collaboration and coupling of remote resources orservices. Both Web 2.0 and SOA applications enable theloose coupling of distant and possibly heterogeneousresources. A third apparent resemblance between Web 2.0and SOA is the shared principle of agility and the support ofpermanent structural change.” [9]
Long-term objective is to embed different types ofservices (atomic, simple and composite services) in qKAI forsystematically utilizing Open Data and enhancing OpenKnowledge. Design concepts from service-oriented andmediator-wrapper-based information systems [10] areapplied in the system specification of the qKAI framework.We identified three main service categories and packagedthem in three service bundles as interaction, representationand discovery manager in a mediation layer (see Figure 2).To keep the system structure comprehensive and easyextensible we take a 4-tier-layer concept paired with RichClient MVC2 paradigms to structure and model desiredservice managers and types.
A. Structure of this contribution
First, we introduce some further background. In Section2 follows what we see as prerequisite to utilize Open Contentfor higher-layered applications. Section 3 gives an overviewof the qKAI application frameworks’ system design. Section4 offers some more details concerning the qKAI hybrid datalayer as one system level of the 4-tier design. Section 5shows further services and components, Section 6exemplifies use cases and further application scenarios. Atleast this contribution ends up with a conclusion and futurework in Section 7.
B. Resources and Open Content
Open Content is interpreted in qKAI following the OpenKnowledge specification “Defining the Open in Open Data,Open Content and Open Information” by the OpenKnowledge Foundation [11]: "A piece of knowledge is openif you are free to use, reuse, and redistribute it.” qKAI addsprocessing differentiation between Open Data, as raw inputinformation and Open Knowledge, which representsqualified information – checked or enriched yet. The
semantic Web of Data(RDF stores andontologies) and UserGenerated Content(Wikis, communities,Blogs) stand by and growup in structured,unstructured and semi-structured manner.DBpedia offers anextensive knowledgebase in RDF format [12](generated out of Wikipedia content), allows semanticbrowsing and detailed thematic inquiring by applyingSPARQL [13] queries for refinishing and further assignment.
RDF aims at the unique description of entities, theirrelations and properties on the internet [14] according to astandardized schema. These are the resources or “things” ifwe talk about the renewed “Internet of Things”. The accessto resources is always carried out using representations. Oneresource can have several representations like HTML, RDF,XML or JSON.
Open, shared databases like Freebase offer a free API toreuse its content by its own Metaweb query language (MQL)[5]. Relational databases can be easily converted into theWeb of Data embedding existing components like the D2Rserver [15]. Additionally, many unstructured sources likeHTML sites or PDF files do not apply to machine-interpretable web concepts yet. Serializing this data tostandardized formats with open access is a first step towardsenhanced machine and user interpretability. Aperture [16]and Virtuoso Spongers [17], for example, enablecomprehensive solutions for these tasks. In case if more textengineering is needed, there are comprehensive solutions forstandard Natural Language Processing (NLP) tasks (e.g., byOpenNLP [18]) to perform sentence detection, NER (NamedEntity Recognition), POS (Part-Of-Speech) tagging or evensemantic chunking.
C. Quality of content
Especially, if enabling User Generated Content (UGC)that is not authored by experts yet for knowledge transferscenarios, the question of contents’ quality arises. Therefore,we developed a three level model to handle different aspectsof quality. Metadata can be seen as a quality feature [19].The more metadata we are snapping, the better we get toknow the content. There is no absolute quality, but we cancompare resources with each other (Open WorldAssumption) and weight them based on the amount andstructure of metainformation. Enrichment of a resourcehappens in a corresponding qKAI URI by semanticinterlinking. One example is a domain ranking visualized astag clouds to show from which domain we get the mostinformation right now. First level criteria contain metadatadirectly included in a resource like format, timeliness,author, provenance or language, which can be automaticallydetected. Second level criteria are determined through userinteraction, which helps to enhance semantically correctness.Regarding factual knowledge like “Berlin lies at the Spree”
Figure 1. qKAI conept scheme toderive knowledge out of Open Data
304
International Journal on Advances in Intelligent Systems, vol 2 no 2&3, year 2009, http://www.iariajournals.org/intelligent_systems/
or “Hanover is the capital of Lower Saxony”, we see userrating and ranking following the established Web 2.0 manneras an effective solution to mark wrong content and to rankvaluable or popular content systematically. Next to thiscrowd sourcing community approach, we offer role- andlevel-based quality control mechanisms. Lecturers earnrewards while rating and creating educational resources outof Open Content; students earn rewards while answeringquestions, managing gaming tasks, exploring further contentor ranking their favorites. Gradually content can be qualifiedthis way. Resources are marked following their quality levelas reviewed, proofed or not yet qualified to enableembedding in different levels of knowledge transfer andlearning. Third level criteria are inferred employing NaturalLanguage Processing to detect some more informationhidden inside a resource.
D. Interaction in the Social Semantic Web
We are looking for some innovative interaction to deployOpen Content for further purpose. The state of the art showsfor example DBpedia mobile [20] that combines Wikipediaentities with images and places them on a map. At Revyu[21], we can rate and rank everything. For selection andrequesting Open Data in RDF format there are SPARQLquery tools available. Most of them are not very intuitive buttechnical. Altogether, we currently can search, display,group, edit and annotate content on the web. However,there is little cumulative advantage and not much incentivefor the user to interact and to deduce new knowledge.
E. Games with a purpose, social and educational gaming
The idea of combining social networking, gaming andrating is not new. As far as we know, there are noapplications available adding strong focus on knowledge andlearning to it. Available social games do not rely onstandardized Open Content or sustainable concepts. Gamingcontent is explicitly and laboratory created manually forevery single game. Generic approaches to build an ongoingsocial knowledge network based on available content are stillmissing. Embedding gaming into superior learning structuresregarding learning management standards, e-learninginfrastructures and the Internet of services seems to be notmentioned so far. Different to other gaming approachescontent creation in itself is part of our game-based learningconcept. Players get the ability to change the view ofrelevant resources. For example, text and multimedia ispresented as extracted chunks of information or imagehaving knowledge-snack concepts on mind to enhanceunderstanding and portioning not to overburden the user.Text sections out of articles are passed to the user and he hasto guess the context. Sights are presented in detailed zoomview to let users guess them. Locations have to be placed atthe right position on a map.
Luis van Ahn introduced crowd sourcing to gaming withESP game or reCAPTCHA [22]. Guess-the-Google is aterm-guessing game based on Google search results orimages [23]. Scoyo [24] offers a game-based learningplatform for kids, but does not deal with Open Content orOpen Access. All over, there are no generic game-based
learning concepts available regarding web standards andlearning management based on Open Content. Additionallythere are some commercial, social gaming applications likePlayfish, MegaZebra or Zynga [25] with casual character.They are often embedded into Web 2.0 platforms likeFacebook or MySpace [26] to increase participation.
Open Content is a huge knowledge base, but there aremissing augmented interaction abilities to confront userswith Open Knowledge bit by bit in enjoyable manner(knowledge-snacks, casual games). We can read Wikipediaarticles or watch some educational videos at e.g., YouTube,but knowledge-centered approaches reusing availablecontent in a standardized and generic manner (domainindependent) are still missing. We are looking formechanisms that bring more motivation and incentive to theuser while interoperating with Open Content. Therefore, wechose a game-based learning approach embedding OpenContent in knowledge games. Assessment methods - e.g.,self-assessment during lectures - to hold students’ attentionintegrated in Learning Management Systems (LMS) likeILIAS [27] showed good evaluation results among thestudents and they asked for more quiz-like interaction [28].About 70 percent of the students did the quizzes bythemselves at home again to repeat the material. Workload toprepare and realize online assessment and quizzes is veryhigh – so we are searching for (semi)automated approachesto generate e.g., question-answer-pairs. Furthermore, the weboffers a lot of information and knowledge available as Wikis,semantic or geographic data and multimedia.
F. Social Semantic Web behind the scenes
RDF: The Semantic Web, increasingly transcribed as„Linked Data“ [29] or “the Web of Data”, is supposed tobring new quality to the internet: What was formerly knownin form of internet pages only to human beings, shall now beapplied to automatic processing. In order to achieve this, theformerly in continuous text existent data will be classified,its properties transformed into defined forms and, as theiraggregation, connected through labeled links. The schema ofthe „Resource Description Framework“ (RDF) [12] -developed for this purpose - follows a natural speakingsentence structure. It consists out of the followinginformation carrier: The “subject”, “resource” or “node” ispresented as an URI (Unified Resource Identifier) just likethe “predicate” and the “object”. All of them might containproperties following their description. Properties their selfare typed and if we imagine RDF as a tree, they represent theleaves. Their type is normally declared like for example thenumber 42 is of the type “integer”, but functionallydependent from its predicate. The relation of the informationcarriers is modeled implicitly, always directed and qualifiedthrough the predicate. Instead of speaking about “subject”,„predicate” and „object” (the object might be a subject aswell), it is more efficient to name them “properties” that areassigned to resources. Resources are connected in three waysover relations: As source, target and identifier.
SPARQL: With SPARQL (SPARQL Protocol and RDFQuery Language) [13] a search and query language for RDFrepositories is designed. SPARQL is a W3C specification
305
International Journal on Advances in Intelligent Systems, vol 2 no 2&3, year 2009, http://www.iariajournals.org/intelligent_systems/
since the beginning of 2008. SPARQL’s syntax is similar toSQL while columns can be defined to answer requests.Filtering expressions are possible in SPARQL that are placedin the WHERE clause in SQL for example. Actually, there isno efficient functionality to implement full text search yet.Next to ASK there are no aggregate functions available inthe SPARQL specification at this time. ASK allows only atrue/false statement about whether a request delivers a resultor not. Abandon the special case of an identity, regularexpressions should be used for full text search. Suchexpressions do not fit properly to a large amount of data,because up to now there are no database indices available tospeed up them upon text. That is why every expression hasto be evaluated for any RDF property and all of theproperties have to be fully loaded too. To get more aggregatefunctionality next to ASK, many providers implementadditionally, proprietary extensions. This up to now notstandardized extensions use the strength of the traditional,relational query language SQL and a combination ofSPARQL and SQL. For this reasons also qKAI does not useSPARQL only. Temporary query results have to be storedanyway, to allow acceptable performance while requestingand combining distributed RDF resources. These results arestored in a relational database – MySQL – and SQL isutilized for effective, internal data processing (see Section 4).
REST: Representational State Transfer (REST) [30] [31]is an architectural style - not tied to any particular technology- although it is used as a guide for designing architecturesfollowing four key constraints: identification of resourceshandled by URIs, manipulation of resources throughrepresentations using the HTTP's uniform protocol (GET,PUT, POST, DELETE), self-descriptive messages andhypermedia as the engine of application state. REST wasdefined by Roy Fielding [30] in his dissertation as anarchitectural style he used for foundational Webspecifications - in particular HTTP and URIs. REST offersimportant architectural properties to improve reliability,scalability or simplicity. These properties are often named assuperior to SOAP web services so that we can speak aboutREST as a “thin” style SOA alternative. Especially in Web2.0 applications, REST web services are very popular thesedays.
Rich Clients: Regarding today’s browser-based userinterfaces, Rich Clients using especially asynchronousJavaScript and XML (AJAX) are a wide spread trend. Theaim of Rich Internet Applications (RIA) is to bring desktop-alike and easy to use interoperation to the Web. Next toAJAX, Adobe Flash/Flex [32] and Java based UserInterfaces (UI) are technical alternatives. The best techniqueto choose depends on the main requirements that have to befulfilled [3]. Flash/Flex3 for example offers the advantage ofless scripting work and easier event handling to reach highlyinteractive functionality, if the focus lies on multimedia anddesign issues. All these Rich Clients can be seen as anextended and enhanced view in the traditionally Model-View-Controller (MVC2) concept. Advantages Rich Clientsoffer are e.g., faster reaction to user requests with partiallyreloads of site parts without refreshing the whole site, lessnetwork traffic and server load as well as offline usage
possibility. A so-called Rich UI Engine delivers the GeneralUser Interface and the presentation logic is divided fromvisualization components. RIAs as standalone Web clientsthat interact with the server side through web services are apromising combination. One of the most importantadvantages of the Client-Server model is the idea that theUser Interface should be developed independently of thebusiness logic and data persistence technology. Nevertheless,to be honest, in today's Web programming practice beforeRIA, the UI is in fact tightly coupled with the server-sidetechnology of choice. If we like to change our backendfunctionality for example from Java to PHP we also have torework all the scripts generating the HTML UI from *.jsp to*.php. To avoid this problem we can now choose a RichClient communicating over standardized interfaces like webservices only and put the most of the UI logic to client sideto get a real separated solution.
II. HOW TO UTILIZE OPEN CONTENT FOR HIGHER-LAYERED APPLICATIONS?
In this section, we outline what we see as requisite to turnOpen Content into an organized, useful knowledge base forhigher-level applications. We are aiming at the establishmentof powerful, but by the user easy to handle mechanisms foracquisition and inquiry of relevant data out of heterogeneoussources. We have to serialize formats for unitary,comprehensive analysis and mediation of distributed,inconsistent content. Mediation means here to utilize inputdata for higher layered applications by offering personalizedquery plans, transformation, annotation and interoperation.Open access to knowledge and data in e.g.,RDF representation brings advantages in interlinking andeasily accessing distributed data on the Web. Dataprocessing concepts allowing machine- and human-interpretable staging without storing redundant datapermanently become possible by semantic interlinking.
Information chunking for easy to digest knowledge bitswithout losing context information is needed for betterunderstanding and human-capable representation duringinteraction. In qKAI (semi-)automatic extracted informationunits represent a piece of information that can be qualified byannotation and interaction to a knowledge unit – alwaysaware of its context not to lose information and to alloweffective change management (actuality).
Knowledge life cycle concerns have to be matched withcontent cycles of the Read-Write-Web. Acquiring (inquire,discover, categorize, index) maintaining and mediating(manage, analyze, enrich, transform) and particularly reusing(interoperation for information, learning, knowledgetransfer) services have to be established.
The more we know about a source, the better we canreuse it. Therefore, metadata and its annotation are essentialfor accurate thematic, semantic analysis and qualitydetermination. Determining the quality of content enables usto rearrange according to source criterions like provenance,timeliness or correctness. Emerging qualitative valence ofinformation units and sources raises information to validknowledge. To get the emerging qKAI knowledge baseapplicable, interaction services for learning, rating, ranking,
306
International Journal on Advances in Intelligent Systems, vol 2 no 2&3, year 2009, http://www.iariajournals.org/intelligent_systems/
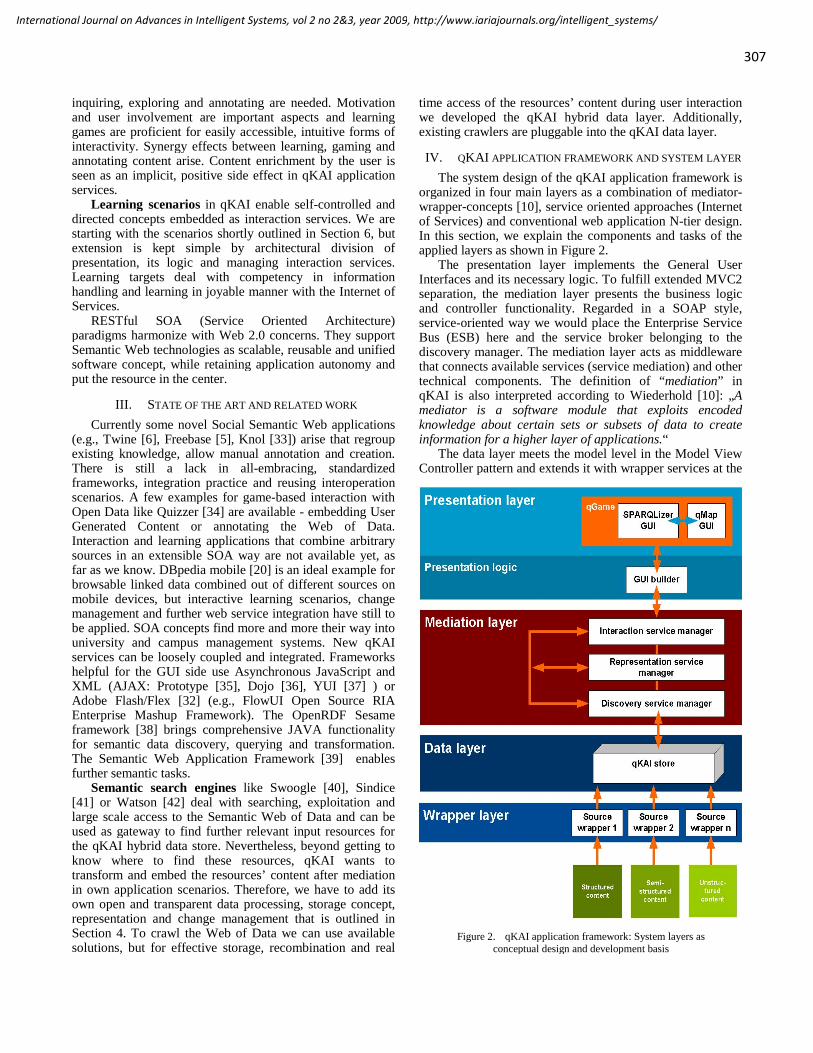
inquiring, exploring and annotating are needed. Motivationand user involvement are important aspects and learninggames are proficient for easily accessible, intuitive forms ofinteractivity. Synergy effects between learning, gaming andannotating content arise. Content enrichment by the user isseen as an implicit, positive side effect in qKAI applicationservices.
Learning scenarios in qKAI enable self-controlled anddirected concepts embedded as interaction services. We arestarting with the scenarios shortly outlined in Section 6, butextension is kept simple by architectural division ofpresentation, its logic and managing interaction services.Learning targets deal with competency in informationhandling and learning in joyable manner with the Internet ofServices.
RESTful SOA (Service Oriented Architecture)paradigms harmonize with Web 2.0 concerns. They supportSemantic Web technologies as scalable, reusable and unifiedsoftware concept, while retaining application autonomy andput the resource in the center.
III. STATE OF THE ART AND RELATED WORK
Currently some novel Social Semantic Web applications(e.g., Twine [6], Freebase [5], Knol [33]) arise that regroupexisting knowledge, allow manual annotation and creation.There is still a lack in all-embracing, standardizedframeworks, integration practice and reusing interoperationscenarios. A few examples for game-based interaction withOpen Data like Quizzer [34] are available - embedding UserGenerated Content or annotating the Web of Data.Interaction and learning applications that combine arbitrarysources in an extensible SOA way are not available yet, asfar as we know. DBpedia mobile [20] is an ideal example forbrowsable linked data combined out of different sources onmobile devices, but interactive learning scenarios, changemanagement and further web service integration have still tobe applied. SOA concepts find more and more their way intouniversity and campus management systems. New qKAIservices can be loosely coupled and integrated. Frameworkshelpful for the GUI side use Asynchronous JavaScript andXML (AJAX: Prototype [35], Dojo [36], YUI [37] ) orAdobe Flash/Flex [32] (e.g., FlowUI Open Source RIAEnterprise Mashup Framework). The OpenRDF Sesameframework [38] brings comprehensive JAVA functionalityfor semantic data discovery, querying and transformation.The Semantic Web Application Framework [39] enablesfurther semantic tasks.
Semantic search engines like Swoogle [40], Sindice[41] or Watson [42] deal with searching, exploitation andlarge scale access to the Semantic Web of Data and can beused as gateway to find further relevant input resources forthe qKAI hybrid data store. Nevertheless, beyond getting toknow where to find these resources, qKAI wants totransform and embed the resources’ content after mediationin own application scenarios. Therefore, we have to add itsown open and transparent data processing, storage concept,representation and change management that is outlined inSection 4. To crawl the Web of Data we can use availablesolutions, but for effective storage, recombination and real
time access of the resources’ content during user interactionwe developed the qKAI hybrid data layer. Additionally,existing crawlers are pluggable into the qKAI data layer.
IV. QKAI APPLICATION FRAMEWORK AND SYSTEM LAYER
The system design of the qKAI application framework isorganized in four main layers as a combination of mediator-wrapper-concepts [10], service oriented approaches (Internetof Services) and conventional web application N-tier design.In this section, we explain the components and tasks of theapplied layers as shown in Figure 2.
The presentation layer implements the General UserInterfaces and its necessary logic. To fulfill extended MVC2separation, the mediation layer presents the business logicand controller functionality. Regarded in a SOAP style,service-oriented way we would place the Enterprise ServiceBus (ESB) here and the service broker belonging to thediscovery manager. The mediation layer acts as middlewarethat connects available services (service mediation) and othertechnical components. The definition of “mediation” inqKAI is also interpreted according to Wiederhold [10]: „Amediator is a software module that exploits encodedknowledge about certain sets or subsets of data to createinformation for a higher layer of applications.“
The data layer meets the model level in the Model ViewController pattern and extends it with wrapper services at the
Figure 2. qKAI application framework: System layers asconceptual design and development basis
307
International Journal on Advances in Intelligent Systems, vol 2 no 2&3, year 2009, http://www.iariajournals.org/intelligent_systems/

Figure 3. qKAI and the LOD cloud
wrapper layer to embed various distributed sources. The datalayer has to manage hybrid data processing enabling RDFand XML related data as well as relational database content.Existing data sources are temporarily retained for mediationpurpose. qKAI processes provide new generated knowledgeas open RDF or serialized JSON representation aftermediation.
V. THE QKAI HYBRID DATA LAYER: SOME DETAILS
The qKAI knowledge representation consists forexample of RDF graphs and superior metadata about them.Existing graphs outside of qKAI are first stored as link to theorigin source in the qKAI service and source repository e.g.,using the URI of a SPARQL endpoint likehttp://DBpedia.org/sparql. New generated information isstored separately and sustainable at the qKAI data layer. Thedata processing concept contains a persistent, relationaldatabase component, flexible representation (RDF, N3,JSON) and temporary fetching of working data duringdiscovery and enrichment. To allow persistent storage and tohandle relational data with only a small set of classes in aneffective way we deployed the Java persistence API (JPA)with the EclipseLink implementation [43] and Builderpatterns.
Linked Data concepts [29] enable persistent, resource-related storage, change management and non redundant,context-aware data processing by interlinking identifiabledistributed resources. By qKAI services generatedknowledge about available sources is stored additionally inMySQL and can be represented as Linked Data on demand.Figure 3 illustrates, how the qKAI data layer embeds LinkedOpen Data resources and represents its data store as anothernode in the Linked Open Data cloud. Following the LinkedData keynote and overall desire of next generation webapplications, to combine different, distributed RDF stores ondemand in real time without buffering, our first trials toembed content while querying exemplary the DBpediaendpoint, failed. Without fetching a copy of relevant data,results showed that bad response times that we had todevelop a more practically solution. Main reason for the badresponse times is the SPARQL endpoints performance asoutlined in the following (see Section “Fetching andindexing”). Now the qKAI data layer buffers relevantresources in a traditional, relational database structure toallow adequateperformance to users’requests and ability tofurther processing andannotation of the acquiredcontent. Further on,affordable hardware canbe used to reach goodperformance resultswithout the need toinvestigate in high-endenterprise servertechnology.
This section gives anintroduction into the qKAI
data management based on the concept that every RDFresource is portable into a relational database structure andvice versa. DBpedia is used as an exemplary knowledge baseaccessed via its SPARQL endpoint to demonstrate firstresults while building the hybrid qKAI data store out ofdistributed web resources. Main criteria for the qKAI datastore are easy, affordable, scalable reusability, possibility tomediation and representation of acquired resources ofdifferent kinds and varying provenance. Points of Interest(POI) are deployed to give a starting point into theknowledge base by users or further applications and toupdate the qKAI store partially on demand in an effectiveway.
A. Discovering Linked Data by setting Points of Interest
Because of the wide web discovery space (open worldassumption), conceivable performance problems answering,and updating comprehensive queries in real-time, amongothers we are integrating POI (Point of Interest) settingfunctionality in qKAI. Further applications and the usersneed an interface to define points of interest and to limitinquiry space and knowledge base according to owninterests. Setting and storing several POIs according todifferent domains and themes becomes possible. Once set,POIs are stored for reuse and are interlinked with each other.The POIs enable defined entry points to the large RDFknowledge base and enable huge databases to updatetemporary redundant stored data to be efficient synchronizedwith their provenance source on demand when requested.Interesting parts of domains and knowledge bases will beupdated even often then irrelevant ones and weighting is setthis way implicitly for further statistically tasks. Weimplemented a thin, asynchronous updatable and practicabledata layer this way. Browsing Linked Data stores requiressemantic browsing functionality for different devices likeweb browsers or mobile devices. Representational Webservices are designed to fulfill device specific representationrequests of the qKAI knowledge base.
A single geographically and/or thematically orientedPoint of Interest (POI) is now using the qKAIimplementation completely reproducible by the qKAI datalayer through a single and effective SQL query. In thecurrent implementation, it is assumed that the topic the useris interested in is a part of the knowledge base yet – nowDBpedia for testing purposes. DBpedia contains allthematically categories out of Wikipedia – so we knowapproximately, what we got up to now. Under this conditiona thematically search space limitation is representablethrough the following SQL statement:
-- POI for personsSELECT DISTINCT r.resource, r.resourceURIFROM resources rJOIN relations l ON (r.resource=l.resource)WHERE l.predicate= ANY (SELECT resource FROM resources WHEREresourceURI="…/22-rdf-syntax-ns#type")AND l.target = ANY (SELECT resource FROMresources
308
International Journal on Advances in Intelligent Systems, vol 2 no 2&3, year 2009, http://www.iariajournals.org/intelligent_systems/

WHEREresourceURI="http://DBpedia.org/ontology/Person");
POIs can be combined without limitation. In SQL, thismeans an implementation as follows („NATURAL JOIN“ isa substitute for „INTERSECT“ which is not supported byMySQL):
SELECT resource FROM(/* SELECT from POIa */)NATURAL JOIN(/* SELECT from POIb */)NATURAL JOIN … -- for further POI
The derivation of this high-performance, multithreadingsolution to embed distributed Linked Open Data in higher-layered web applications is exemplary enlightened in thefollowing. A minimalistic data model with maximizeddepth is applied, because the implementation is suitable forseveral semantic data purposes on a Quadcore hardwareplatform that is available for about 500 € (May 2009).Because every table can be mapped to RDF and vice versa,there is no need for further extension. Further on, relationaldata storage brings the advantage of flexible, independentrepresentation and delivery on demand e.g., in JSON next toRDF/XML or N3 Turtle.
B. SQL replaces SPARQL
Considering the current infirmity of SPARQL shown inthe introduction and regarding the fact that popular SPARQLimplementations are still a facade for relational databases, itseems to be consequent at this time to abstain from the broadadoption of SPARQL. Significantly, even DBpedia usesVirtuoso for a SPARQL endpoint with proprietaryextensions, but MySQL is used for query processing in thebackground. Thus, we decided to choose MySQL directly forthe qKAI data layer and reduced the data processing bulk toSQL that most developers are more familiar with up to now.On the one side, we can resort to a broad pool of proofedSQL solutions – enabling hierarchical queries for example –on the other side following developers save incorporationtime to get started with the qKAI data layer.
SPARQL is used only to acquire DBpedia content orother RDF stores using hybrid indexing. Our first approach,sending complex SPARQL requests without SQLbackground support to the endpoint, failed. Even for a treeout of more than two nodes, results often could not bereturned and the endpoint timed out. Under these conditions,we discarded this approach. Present practice showed that toomany dependencies on distributed resources constrain furtherwork that relies on the qKAI data layer, because thereliability of reaching SPARQL endpoints is not wellcalculable this times.
C. Hybrid knowledge index
An initial qKAI knowledge base e.g., out of DBpedia canbe easily imported using the qKAI dump reader. This initialknowledge base is complemented on demand by the properconnected resources via SPARQL. The dump reader accepts
requests and queries the buffered qKAI data layer instead ofthe distant resource. A hybrid knowledge index arises thisway by and by.
D. Change management
The in MySQL buffered qKAI knowledge base willbecome obsolete earlier or later. Thereby the qKAI data storemight be soon as large that synchronizing all entries withtheir provenance resource is not possible anymore all atonce. The hybrid knowledge index allows updating thebuffered data store partially at runtime. If a user or anapplication signalizes that more elements out of e.g.,DBpedia are needed while setting Points of Interest, they canbe additionally loaded and their content can be updated ondemand. If the update amount and interval is set properly,“fluent” actualization of the whole qKAI knowledge base ispossible. Only small and relevant amounts of data have to befetched out of the provenance source this way and they canbe parallel processed in the qKAI data layer. Data can beprovided reliable at any time this way.
E. Reusability and extensibility
All database connectivity of the qKAI data layer isimplemented autonomic and persistent without relying onother qKAI components. To embed further SPARQLendpoints we only have to deploy the new endpoint’saddress. The implementation of generic classes allows usingeven different protocols – what we showed exemplary withthe qKAI dump reader. New sets of POIS can be integratedthe same easy way. At this time, we offer POI setter forthematically, geographically and full text POIs. Full textPOIs search like traditional search engines for matchingphrases.
F. Multithreading
Without to beware of it, most developers of webapplications work with multithreading on multicores. In caseof Java, the Container manager treats every request as aseparate thread. Most of the time there are no negative sideeffects, if the result is not especially tweaked for thispurpose. A different case we got with the qKAI data layerthat is forced to be driven parallel to reach practicablyperformance. In addition, blockades while querying to slowanswering resources had to be avoided.
G. Fetching and indexing
A first, not yet thread optimized version of the qKAI datalayer claimed over 30 seconds to fetch some test data and allof their properties. Most of the time was wasted with the onethread of the application waiting for DBpedia answers.
To understand the underlying processes and theirproblems to infer a more reactive solution, we analyzed thetasks to do while fetching our test data from a SPARQLendpoint:
1. For a given word the URI has to be found.2. All properties and relations of the constant URI and
their neighborhood are fetched. This happens
309
International Journal on Advances in Intelligent Systems, vol 2 no 2&3, year 2009, http://www.iariajournals.org/intelligent_systems/

gradually because SPARQL does not allow bindingconstants to variables.
3. Step 2 has to be repeated for every fund.
H. DBpedia Search example with the term „Nietzsche“
Now we take the famous search term „Nietzsche“ ,looking it up in DBpedia using SPARQL only and we get thefollowing results:
TABLE I. NECESSARY REQUESTS SEARCHING FOR
“NIETZSCHE” IN DBPEDIA
Step Document count Requests
1 444 hits for search term „Nietzsche“ 1
2 8458 properties41804 outgoing links2068 mutual properties among
444
Table 1 shows the necessary steps, document count andrequests searching for the example term “Nietzsche” inDBpedia using SPARQL only. In general, all hits have to beloaded, because SPARQL does not know any wordquantifier ordering and the wanted term might be at the endof the result list. We get a serial waiting time for 445 queryresults with 50.000 new created documents or even markers.This result can be constructed much shorter enabling qKAIbuffering DBpedia and then applying the following SQLqueries to the qKAI data layer:
SELECT resourceFROM properties_fulltextWHERE q="Nietzsche"
Repeated for table „properties“:
SELECT COUNT(*)FROM (SELECT resource FROM properties_fulltextWHERE q="Nietzsche") sub JOIN relations p ON (sub.resource=p.resource);
Also for “relations”:
SELECT p.property, COUNT(*) amountFROM (SELECT resourceFROM properties_fulltextWHERE q="Nietzsche") sub JOIN properties p ON (sub.resource=p.resource)GROUP BY p.property HAVING amount > 1;
We noticed that a trivial DBpedia request is answered in2 seconds at its best. Thus, without synchronous loading wehave to wait 14 minutes at least. To solve this problem, wedivided the process in a pipeline of five steps to identifyespecially working and waiting intensive tasks. Finally, wematched these tasks to a suitable number of threads andprocessor cores. In our implementation, the Java classes donot communicate directly. Instead, they use the
„FetchingMediator” as broker. For every step representedthrough a class, a predefined amount of„ThreadPoolExecutors“ is started. Class instances are linedin a queue. Every started thread will work constantly andmultiple threads accomplish tasks parallelized. With fourconcurrent „RelatedResourceProducern“ the waiting time ofthe above mentioned example theoretically increases to aquarter. Practically DBpedia answers slower with increasingconcurrent number of request. Next to qKAI there areseveral other applications querying DBpedia what makes theanswering times unforeseeable. Waiting times of severalminutes cannot be foreclosed.
The parallelized approach prevents the bottleneck inqKAI: Following requests might be answered faster allowingqueued search terms to be processed further on despite ofsmall blockades.
I. Evaluation of the qKAI hybrid data layer
Initial search space creation without preselected datadumps: If data is fetched only by requesting a SPARQLendpoint like DBpedia without buffering, the used time untilthe whole search space is available, depends on itsconnection. qKAI itself uses only very simple SPARQLexpressions and - if implemented in the endpoint - theVirtuoso extension ”bif:contains” [17] to allow faster fulltext search. According to our samples it takes about 20seconds until 10 results are available: To be presentable, aresult has to be found and must be fully loaded as well.Resulting out of this unacceptable response times while onlyusing SPARQL requests on distant resources, qKAI uses aprepared data store as copy of the provenance resource toutilize distributed data for further application scenarios inreal time. Therefore we currently dissuade from deploying“SPARQL only” installations in productive environments –even if this approach is desirable regarding the long term, itis not realizable in an affordable way up to now. Instead, aminimal data store - with at best domain or applicationcustomized data - should be prepared like explained in thefollowing using the example of the qKAI data layer.
Initial search space creation with preselected datadumps: A “dump” is a view of a database written down in afile. In case of DBpedia, we speak of 40 compressed filesthat reach decompressed 25 GB. The decompressing timetook about half an hour on test system 2 (see Table 3). Thisdata has to be transformed from N-Triples format into arelational data base structure to allow more effectiveprocessing and to optimize further queries. N-Triples are arather redundant data structure because e.g., a RDF subject isrepeated for each of its properties. Directly transferring of N-Triples into the qKAI data store is a quite ineffective task. Itwould mean to get tables with over 200 million lines andexpensive JOINs with more than one property concurrently.The up to now fastest known SPARQL implementationVirtuoso [17] uses just like qKAI OpenRDF Sesame [38] toparse data into a more effective representation. Aftercleaning up, the data are transformed into the qKAI datamodel. Therefore we turned off the database indices inMySQL because it is a rather time intensive task too.
310
International Journal on Advances in Intelligent Systems, vol 2 no 2&3, year 2009, http://www.iariajournals.org/intelligent_systems/
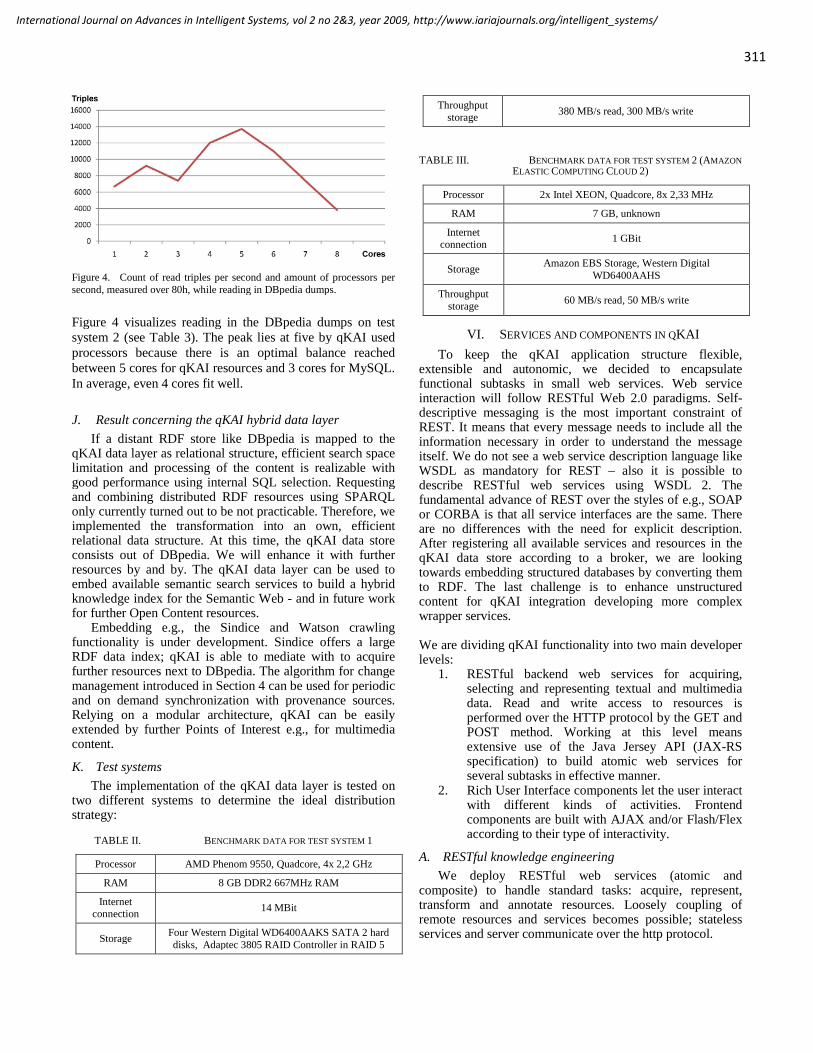
Figure 4. Count of read triples per second and amount of processors persecond, measured over 80h, while reading in DBpedia dumps.
Figure 4 visualizes reading in the DBpedia dumps on testsystem 2 (see Table 3). The peak lies at five by qKAI usedprocessors because there is an optimal balance reachedbetween 5 cores for qKAI resources and 3 cores for MySQL.In average, even 4 cores fit well.
J. Result concerning the qKAI hybrid data layer
If a distant RDF store like DBpedia is mapped to theqKAI data layer as relational structure, efficient search spacelimitation and processing of the content is realizable withgood performance using internal SQL selection. Requestingand combining distributed RDF resources using SPARQLonly currently turned out to be not practicable. Therefore, weimplemented the transformation into an own, efficientrelational data structure. At this time, the qKAI data storeconsists out of DBpedia. We will enhance it with furtherresources by and by. The qKAI data layer can be used toembed available semantic search services to build a hybridknowledge index for the Semantic Web - and in future workfor further Open Content resources.
Embedding e.g., the Sindice and Watson crawlingfunctionality is under development. Sindice offers a largeRDF data index; qKAI is able to mediate with to acquirefurther resources next to DBpedia. The algorithm for changemanagement introduced in Section 4 can be used for periodicand on demand synchronization with provenance sources.Relying on a modular architecture, qKAI can be easilyextended by further Points of Interest e.g., for multimediacontent.
K. Test systems
The implementation of the qKAI data layer is tested ontwo different systems to determine the ideal distributionstrategy:
TABLE II. BENCHMARK DATA FOR TEST SYSTEM 1
Processor AMD Phenom 9550, Quadcore, 4x 2,2 GHz
RAM 8 GB DDR2 667MHz RAM
Internetconnection
14 MBit
StorageFour Western Digital WD6400AAKS SATA 2 harddisks, Adaptec 3805 RAID Controller in RAID 5
Throughputstorage
380 MB/s read, 300 MB/s write
TABLE III. BENCHMARK DATA FOR TEST SYSTEM 2 (AMAZON
ELASTIC COMPUTING CLOUD 2)
Processor 2x Intel XEON, Quadcore, 8x 2,33 MHz
RAM 7 GB, unknown
Internetconnection
1 GBit
StorageAmazon EBS Storage, Western Digital
WD6400AAHS
Throughputstorage
60 MB/s read, 50 MB/s write
VI. SERVICES AND COMPONENTS IN QKAI
To keep the qKAI application structure flexible,extensible and autonomic, we decided to encapsulatefunctional subtasks in small web services. Web serviceinteraction will follow RESTful Web 2.0 paradigms. Self-descriptive messaging is the most important constraint ofREST. It means that every message needs to include all theinformation necessary in order to understand the messageitself. We do not see a web service description language likeWSDL as mandatory for REST – also it is possible todescribe RESTful web services using WSDL 2. Thefundamental advance of REST over the styles of e.g., SOAPor CORBA is that all service interfaces are the same. Thereare no differences with the need for explicit description.After registering all available services and resources in theqKAI data store according to a broker, we are lookingtowards embedding structured databases by converting themto RDF. The last challenge is to enhance unstructuredcontent for qKAI integration developing more complexwrapper services.
We are dividing qKAI functionality into two main developerlevels:
1. RESTful backend web services for acquiring,selecting and representing textual and multimediadata. Read and write access to resources isperformed over the HTTP protocol by the GET andPOST method. Working at this level meansextensive use of the Java Jersey API (JAX-RSspecification) to build atomic web services forseveral subtasks in effective manner.
2. Rich User Interface components let the user interactwith different kinds of activities. Frontendcomponents are built with AJAX and/or Flash/Flexaccording to their type of interactivity.
A. RESTful knowledge engineering
We deploy RESTful web services (atomic andcomposite) to handle standard tasks: acquire, represent,transform and annotate resources. Loosely coupling ofremote resources and services becomes possible; statelessservices and server communicate over the http protocol.
311
International Journal on Advances in Intelligent Systems, vol 2 no 2&3, year 2009, http://www.iariajournals.org/intelligent_systems/
B. Modular rich frontend
According to Rich Internet Application (RIA) concepts,user interfaces are executed at a stateful, client side Flashruntime. Desktop-alike applications offer advantages likefaster reaction to user requests, less network traffic, lessserver load and offline usage possibility. We decided for aRich Thin Client using Adobe Flash and Flex - so businesslogic remains at server side. The Flash player acts as rich UIengine and delivers the GUI. The presentation logic isdivided from visualization components. Flash is opening upits format with the Open Screen Project [44]. The Flashformat and Flex SDK are not that proprietary anymore likesome years ago. Nowadays the Flash plug-in is spread over90 percent around browsers. Flash also is promoted throughspreading its new FLV format in online video communitieslike YouTube. So Flash obtained enormous ubiquity and losta lot of its proprietary nature these days. Browser, platformand device independent developing interactivity is the bigadvantage of Flash/Flex applications compared to Ajax.Flash is predestinated to design gaming content because ofits effective possibilities with high design issues and focuson usability.
C. Interaction and game-based activity
As Ahn’s reCAPTCHA, ESP game [22] or AmazonMechanical Turk established gaming as a well-suitedinstrument to solve several tasks in knowledge engineering.However, they do not mention any learning or knowledgeconcerns while gaming. On the one hand, users can enrichcontent; on the other hand, users can learn and shareknowledge through gaming with Open Content in a socialincentive and challenging way. We are aggregating existinginformation and enriching it while interacting with OpenContent. Even statements about contents’ quality can bededuced out of users’ content and activity. Especially fact-related knowledge can be transferred and learned, ifresources are presented in rule-based manner to the user andhe has to solve predefined learning tasks earning rewards.
Creating and editing: We support authors to create andcombine content. For example, false answers areautomatically generated by wrong-answerizer services, if aquestion is generated by a user. qKAI offers proposals fornew learning games out of given domain knowledge andconcepts. Matching between available content and suitablegaming types is described in ontology-based concepts. At thesame time, the user enhances underlying ontologies whiledeploying game types and rating gaming content. We wantto create self-organized ontologies that adaptively grow withongoing user interaction.
Interlinking and grouping: Grouping of existingresources and interlinking with missing ones is rewardede.g., with in-game incentives.
Rating and ranking: Instead of simple questionnaires,rewarding concepts are deployed to get user feedback.
D. Educational aspects and suitable domains
Gaming is not overall suitable to learn every skill in anydomain. Some educational tasks or topics are learnable andtransferrable more effectively utilizing certain gaming types
then others. Furthermore, content has to be divided intodifferent difficulty levels and tasks for distinct audiences.Our game-based learning concept is not limited to a certainaudience. For example, undergraduates can learn withgaming content of lower difficulty level and other topics thenstudents in higher education. Game creation is a gaming andlearning challenge by itself – so lecturers can choose suitablecontent out of the gaming pool and add own missing materialor further web resources, where necessary. We identified thefollowing domains so far as most suitable to embed forfurther evaluation purposes: Geography, architecture,history, events, persons, medicine and health. Overall, everydomain seems to be suitable for our social educationalgaming approach, if learning aims can be fulfilled whilecreating, answering and querying factual knowledge andpredefined learning tasks (especially recall and rearrangingof factual content). Popular examples are multiple-choicequestions, text-text assignment, image-text assignment orordering questions. These question types have the advantage,that they are also available as learning standards in LearningManagement Systems. They can be easily converted intoIMS/QTI after in-game creation. Embedding multimedia likezoom parts out of images or video/audio sequences is alsopossible. Next to knowledge unit gaming types, we areimplementing and researching location-based gaming typesrelying on geocoded information and correct geographicallyplacement. Here, we can visualize information in a veryhandsome and effective manner using Yahoo! Maps andtheir Flash/Flex API to interact on map-based interfaces.
E. Further techniques and libraries
To perform backend and frontend tasks, there are someavailable and proofed libraries merged up and extended. Weare developing qKAI as a Java web application with Servletsand Java Server Pages deployed in a Tomcat ServletContainer [45]. The frontend is next to AJAX designed usingAdobe Flex and Flash components for highly interactivetasks with extended design issues (e.g., learning gamesequences). Most of the qKAI service and component offeris reusable in nearly any information and knowledge transferscenario. Additionally some gaming services andcomponents allow specialized functionality for socialeducational gaming.
F. Project management and build automation
qKAI is using the build and management tool ApacheMaven [46] with support of Subversion to automate workingtasks. qKAI offers fast start up and good documentationfacility of all working processes to reuse them as much aspossible this way. Interface classes can be used withoutknowing about the classes’ Weaving. In addition, thestandard for (JUnit) tests has been adopted with deployingMaven. The programmers get hints about code snippetswhere better handling of the framework and its language issuggested. Maven dissolves all dependencies amongpackages and downloads them automatically in the rightversion. Developers can use their IDE of choice. AdjustingqKAI to e.g., Netbeans or Eclipse is done through one
312
International Journal on Advances in Intelligent Systems, vol 2 no 2&3, year 2009, http://www.iariajournals.org/intelligent_systems/

Maven command. The server and the database qKAI arecurrently deployed on, can be changed very easy, too.
VII. FURTHER QKAI USE CASES AND APPLICATION
SCENARIOS
qKAI services enable embedding, querying and enrichingdistributed web sources for any kind of higher-levelapplication that likes to integrate a broad, structuredknowledge base with interoperation ability based on asuitable tools and services collection. We are focusing onprocess plans suitable for learning - realized by compositeservices. In the following, we give a few precise examplesfor use cases that are currently under development using afirst prototype of the qKAI framework.
qKAI will publish services in a service broker way forreuse in other web applications like Learning or ContentManagement Systems.
A qKAI user for instance places a question like “Whichauthors are influenced by Stanislav Lem?” using theSPARQLizer, gets five automatically generated Multiple-Choice answers presented with relational author images fromFlickr [47] and he has to choose the right ones out of it.Currently we are developing question-answer-learning-game-types generated out of well suitable Open Data in RDFformat. We see two main modes as most interesting forcreating first learning game scenarios out of Open Data:Players assign questions to (semi-)automatically extractedinformation units. Players create questions and get automatedanswers, which are transformed, into playable answers.
A. qMATCH
This is a prototype of an image-term assignment gamingtype. First, the user enters a term he likes to get imagesabout. Then qMATCH presents randomized terms andimages out of Flickr and the player has to assign the rightterm to the right image via Drag & Drop assignment. Herewe need a service called wrong-answerizer to assign wrong,but not stupid answers. Wrong-answerizer is deployed infurther gaming types. qMATCH is useful to enhance e.g.,,language skills, geographically, architectural or historicalknowledge. A conceptual gaming sequence is visualized in
Figure 5. If we use term-term assignment, a lot ofvocabulary out of various domains can be assessed:assigning English to German translations, assigningbuildings to right historical epochs or assigning cities to theright countries.
B. qCHUNK
This is a prototype for a text chunk guessing game basedon e.g. Wikipedia articles. qCHUNK presents small textualchunks and the player has to guess the quested term with asless chunks as possible. A conceptual gaming sequence isvisualized in Figure 6. Multimedia chunks like zoom partsout of images are conceivable too. The chunks are extracteddeploying the SentenceDetector of OpenNLP [18]. Theguessable term is exchanged with a placeholder like “?” andis displayed to the user. The user gets 20 seconds to solve orto switch to the next chunk related to the guessable term.qCHUNK is also suitable to integrate multimedia e.g.,,images, sounds or videos.
Example: Chunk: ?? is the capital of Lower Saxony founded in
1942. Answer: Hanover. Next chunk: ?? is located at the Leine. Next chunk: image of Hanover city.Often chunks imply indirect questions like “Is ?? the
capital of Lower Saxony”. The user will get the ability tocreate a question out of the content that is displayed. Whilestoring and processing hypermedia, it is mandatory thatchunks do not lose their origin context and provenance.
C. qMAP
With qMAP a map-based geocoding frontend is underdevelopment. Questions, answers and their combination(knowledge units) will be placed and enriched with geocodesat the qMAP. qMAP acts as a kind of gaming board forplacing, exploring and editing stored question-answer-pairs.The qMAP will interact with SPARQLizer (see Section D)and represents submitted questions and related answers.Figure 5. qMATCH gaming sequence
Figure 6. qCHUNK gaming sequence
313
International Journal on Advances in Intelligent Systems, vol 2 no 2&3, year 2009, http://www.iariajournals.org/intelligent_systems/

qMAP offers placement of locations, events, buildings,photos or persons. We provide interaction like filtering,searching, editing and adding knowledge. OpenStreetMap[48] or Yahoo! Maps [49] are good alternatives to GoogleMaps [50]. Map symbols are connected with differentgaming interactions and information units.
D. SPARQLizer
With the SPARQLizer a visual query interface is underdesign, that allows intuitive question to query plantransformation on distributed RDF stores deployingSPARQL endpoints and dynamic graph interlinking. User-generated SPARQL queries are stored as graphs enlargingthe qKAI knowledge base and ready to query against infurther query plans.
E. Annotating and qualifying services
Joker option services for annotating, rating andqualifying are currently under development belonging to theinteraction manager of the mediation layer. qKAI jokersallow game-based functionality to add additional sources and
to qualify metainformation by rating and ranking input to theqKAI knowledge base. Playing the “Know-it-all-Joker”bounds the player to add a source (or information) thatproves contrary statements. The “Nonsense-Joker” marks aninformation unit as semantically wrong or inconsistent anddefers it to review mode by other qKAI users. The “Hint-Joker” allows looking up related sources or other users’answers as solution suggestion. The “Explorer-Joker” allowsexploring the right answer on the web outside of qKAIduring a predefined time. The “History-Joker” enableslookups in played answers, ratings of other users by loggedinteraction and transaction protocols. Statistical protocolanalysis is suitable to infer further metainformation.
F. Social knowledge profiles
Personal profiles and self-reputation are a popular,ongoing web trend. There are useful Single-Sign-Onsolutions like OpenID [51] or FOAF [52] files to avoidredundant profile storage in different web communities.Knowledge and learning related properties are enlightenedless. qFOAF aims at building personalized, transparentknowledge profiles to connect users additionally thematicallyand semantically. qFOAF profiles are visible to other usersand list a statistical overview of the own knowledge activity.Categories applied contain domain interest and expert levelwith detailed scores and ranking. This profile serves alliedand alienated players as a hint for further activity as knownin common games. qFOAF builds a qKAI resource in RDFat the beginning of a game as extended FOAF file withunique URI for every user. It connects the user with topics,knowledge units or other players systematically whilegaming. The qFOAF file can be enriched (semi)automatedwith given information by the user. Existing FOAF files,geocodes or interests, can be included while gaming andinteracting with game points and content. Examples forgaming content are created questions, answers, knowledgeunits, ratings, resources, domains, locations or friends.
G. Global point and level system
A global point system is provided to document learningprogress, personal interests and to implement incentive andreputation ability. Every kind of interaction is rewarded withqPoints according to its grade of interoperation.
Incentive for user participation is implemented asglobally rewarding system of any interaction (qPOINT,qRANK). “Knowledge is power” is the simple conceptualslogan on top of qKAI gaming. The more users interact andadapt knowledge, the more they will be rewarded. Adaptingknowledge is possible while solving learning tasks on yourown or in alliances. Single player and alliances can challengewith each other offering knowledge battles of certain topics.A look into qFOAF user or alliance profiles allows toestimate the own chance to win a challenge or battle. We willenable to steal knowledge from others. Knowledge willbecome conquerable this way. Alliances and single playerwill be able to own others knowledge by solving game tasks.An underlying point based rewarding system can beconverted into avatar items and further awards. In the future,gaming with qualified content might bring gaming pointsFigure 8. SPARQLizer concept
Figure 7. qMAP concept
314
International Journal on Advances in Intelligent Systems, vol 2 no 2&3, year 2009, http://www.iariajournals.org/intelligent_systems/

into reality by allocating them with test examinations to offerfurther incentive to students. The global point and levelsystem documents learning progress and personalknowledge. qRANK services allow game-based rating andranking of resources by levels and in-game joker options.After users have played jokers, ranking, annotation and evensemantic correction becomes possible.
VIII. CONCLUSION AND FUTURE WORK
We introduced the qKAI application framework forutilizing arbitrary Open Data sources and services in astandardized, RESTful manner aiming at highly interactivescenarios in information and knowledge transfer. To keepqKAI easy extensible with reusable, autonomous servicedesign, we added next to a slim, RESTful SOA a 4-layeredmediator-wrapper-schema to the system specification. qKAIcombines Web 2.0, Semantic Web and SOA paradigms toapply and enable the Internet of Services for higher level,user-oriented applications with open access.
We are implementing first educational gaming prototypesand we are gaining at further features to utilize current webtrends like social interaction for learning purpose andsustainable, knowledge-related interoperation on OpenContent. Current focus lies on implementing use cases likethe SPARQLizer and qMAP based on the qKAI data layer.SPARQLizer needs a dynamic, adaptive GUI, template andontology structure to support users in (semi)automatedquestion and answering generation out of SPARQL requests.Chunking information into capable knowledge units is workin progress. The specification of qKAI information units isdone and exemplary implemented based on live Wikipediacontent. Requirements are derived to utilize Open Contentfor social educational gaming and standard tasks inknowledge engineering. Atomic services and frontendcomponents allow rearrangement and are suitable for anyother purpose in information and knowledge transfer – notonly for game-based learning. Services are adaptable toseveral domains.
Reusing and composing is a precept at all levels inqKAI, the challenge is to merge and to expand: Resources,ontologies, web services or available frameworks. We areaiming at standardized, machine- and human readablestaging of Open Content with lightweight interoperation todevelop incentive, web-based knowledge transfer andlearning scenarios. Therefore, we deploy Linked Data, RichClients and REST. The qKAI application framework servesas conceptual basis and system specification for further workexemplary highlighted in this contribution. We want to offerlearning scenarios based on user-oriented web services withlightweight interaction grounded on Open Content.Therefore, we have to implement standard tasks ofknowledge engineering for extended interaction as a genericapplication framework. qKAI combines and respectivelyextends available Java APIs for subtasks to a scalable,reusable and unifying software concept.
Overall, our research focus lies on three main aspects:
Provide standard tasks of knowledge engineering(acquisition, formalization, representation,visualization).
Determine and enhance quality of content (analyzesand enrichment of metainformation. User’s opinionand knowledge serves to annotate, rate and rankcontent).
Tackle extended interaction and incentive for user'sattendance while interoperating with Open Content.
We implemented an aware compact and hybrid data layerthat serves as basis for further knowledge-processingapplications and as interface to semantic search engines andRDF stores. The up to now missing possibilities of thetherefore designed query language SPARQL are substitutedby the transformation into a relational database schema.Resulting models are flexible and reusable, because anyrelational data structure can be mapped onto. The chosenapproach of parallel data fetching and processing was notthat easy to implement concerning thread safe programming,but it is very profitable regarding sustainable deployment -independent of external, at this time still unsecurecircumstances:
Time intensive requests will not block followingqueries in qKAI.
Only this way data can be loaded additionally withadequate response times, if a request is notanswerable through the pre-buffered data store.
Our research showed that up to now the power ofSPARQL is not yet applicable to the efforts of the qKAI datalayer. Even if suggested extensions like OpenLink [17] areintegrated into the final specification, it is not obvious up tonow, whether SPARQL alone will be properly suited forlarge, distributed data requests soon. Currently we noticed anongoing trend to deploy relational database concepts becauseof their majority and performance – like nearly all SPARQLendpoint and RDF repository implementations do [53].Future work in qKAI is to implement available algorithmsand APIs to crawl distributed resources and to amplify theoptimization of the qKAI data layer. Some MySQLoptimizations like the Sphinx full text indexer [54] areimplemented yet to allow faster search. For geographicallysearch space, a GIS extension is ready to use for peripherysearches.
All over, the interface to Open Data resources overSPARQL endpoints offers new ways to combine, enrich andexplore the data web as an open, semantically connectedgraph. Data sources are presented in a standardized, machineinterpretable and extensible manner deploying RDFrepositories. They offer many advantages like open LinkedData ability and annotation compared to traditional relationaldatabases under closed world assumption. Further SPARQLfunctionality is under development and will be part of itsspecification soon. We decided to mix up proven and newconcepts to get a nowadays practically data layerimplementation while buffering preselected data dumps in arelational database and acquiring Open Content out of RDF
315
International Journal on Advances in Intelligent Systems, vol 2 no 2&3, year 2009, http://www.iariajournals.org/intelligent_systems/

repositories using SPARQL. Additionally we developed withPOI setting for applications and users a practically solutionto update pre buffered resources partially on demand whenthey are requested.
ACKNOWLEDGMENT
The BMBF (Bundesministerium für Bildung undForschung) co-funded this work under the HELCA(Hannover E-Learning Campus) project. We thank especiallyMark Kubacki and Jan Hein for their support inimplementing and advancing the qKAI applicationframework.
REFERENCES
[1] M. Steinberg, J. Brehm, “Towards utilizing Open Data for interactiveknowledge transfer”. Proc. DigitalWorld 2009, InternationalConference on Mobile, Hybrid, and On-line Learning (IARIA’seLmL), IEEE Press, 2009, pp.61-66, doi:10.1109/ eLmL.2009.13.
[2] T. Berners-Lee, “Web 2.0 and Semantic Web”,http://www.w3.org/2006/Talks/1108-swui-tbl/#(1), W3C, visited10.04.2009.
[3] M. Domenig, “Rich Internet Applications und AJAX”, Entwickler-Magazin, http://www.canoo.com/news/entwickler.pdf, 2006, visited15.05.2009.
[4] DBpedia, http://dbpedia.org/About, visited 20.05.2009.
[5] Freebase, http://www.freebase.com, visited 25.05.2009.
[6] Twine, http://www.twine.com/, visited 27.05.2009.
[7] H. Mandl, G. Reinmann-Rothmeier, “Unterrichten undLernumgebungen gestalten”, Forschungsbericht Nr. 60, Instituts fürPädagogische Psychologie und Empirische Pädagogik, München,Ludwig-Maximilians-Universität, 1995.
[8] IMS/QTI, http://www.imsglobal.org/question/, IMS Global LearningConsortium, Inc., visited 25.05.2009.
[9] C. Schroth, T. Janner, “Web 2.0 and SOA: Converging ConceptsEnabling the Internet of Services”, IT Professional, Volume 9, Issue3, 2007, pp 36 – 41.
[10] G. Wiederhold, “Mediators in the Architecture of Future InformationSystems, IEEE Computer, Journal, 25(3), 38-49, 1992.
[11] Open Knowledge Foundation, The Open Knowledge Definition,http://opendefinition.org/, visited 25.05.2009.
[12] RDF, http://www.w3.org/RDF/, W3C, last update: 2008.
[13] SPARQL, http://www.w3.org/TR/rdf-sparql-query/, W3C, visited25.05.2009.
[14] J. H. Dieter Fensel, H. Lieberman, and W. Wahlster, “Spinning theSemantic Web: Bringing the World Wide Web to Its Full Potential”,The Mit Press, Massachusetts, 2005.
[15] C. Bizer, R. Cyganiak, “D2R server: Publishing Relational Databaseson the Semantic Web”, http://www4.wiwiss.fu-berlin.de/bizer/d2r-server/, visited 27.05.2009.
[16] Aperture, http://aperture.sourceforge.net/, Aduna, DFKI, visited27.05.2009.
[17] Openlink Virtuoso, http://virtuoso.openlinksw.com/, visited27.05.2009.
[18] OpenNLP, http://opennlp.sourceforge.net/, visited 27.05.2009.
[19] F. Naumann, “Quality-Driven Query Answering for IntegratedInformation Systems”, Lecture Notes in Computer Science Vol.2261, Springer, 2002.
[20] C. Becker, C. Bizer, “DBpedia Mobile: A Location Enabled LinkedData Browser”, 17th International World Wide Web ConferenceWWW2008, China, 2008.
[21] T. Heath, E. Motta, “Revyu.com: a Reviewing and Rating Site for theWeb of Data”, Proc. ISWC 2007, International Semantic WebConference, Lecture Notes in Computer Science 4825 Springer 2007,pp. 895-902.
[22] L. Ahn, S. Ginosar, M. Kedia, R. Liu, and Manuel Blum, “ImprovingAccessibility of the Web with a Computer Game”, Internationalconference for human-computer interaction, CHI 2006, Canada.
[23] GuessTheGoogle, http://grant.robinson.name/projects/guess-the-google/, visited 27.05.2009.
[24] Scoyo, www.scoyo.de, visited 27.05.2009.
[25] Playfish, www.playfish.com, Megazebra, www.megazebra.com,Zynga, www.zynga.com, visited 27.05.2009.
[26] Facebook, www.facebook.com, MySpace, www.myspace.com,visited 27.05.2009.
[27] ILIAS, http://www.ilias.de, visited 27.05.2009.
[28] J. Brehm, M. Steinberg, "Eine Arbeitsumgebung für elektronischunterstützte interaktive Lehre", 36. GI-Jahrestagung 2006 -Informatik für Menschen, Workshop Pervasive University.
[29] C. Bizer, T. Heath, T. Berners-Lee, “Linked Data: Principles andState of the Art”, 17th International World Wide Web Conference,WWW2008, China, 2008.
[30] R. Fielding, “Architectural Styles and the Design of Network-basedSoftware Architectures”, Dissertation, Irvine, 2000.
[31] E. Wilde, R. J. Glushko, “Document design matters”, Commun. ACM51, 10, 2008, pp. 43-49, doi:http://doi.acm.org/10.1145/1400181.1400195.
[32] Adobe Flash/Flex, http://www.adobe.com/products/flex/, visited27.05.2009.
[33] Knol, http://knol.google.com/k, visited 27.05.2009.
[34] C. Kiefer, Quizzer, http://www.d-elina.de/2008/index.php?option=com_content&task=view&id=97&Itemid=64, last update: 2008.
[35] Prototype, http://www.prototypejs.org/, visited 27.05.2009.
[36] Dojo, http://dojotoolkit.org/, visited 27.05.2009.
[37] YUI, http://developer.yahoo.com/yui, visited 27.05.2009.
[38] OpenRDF Sesame, http://www.openrdf.org/, visited 27.05.2009.
[39] Semantic Web Application Framework,http://doi.ieeecomputersociety.org/10.1109/MS.2007.126, visited27.05.2009.
[40] Swoogle, http://swoogle.umbc.edu/, visited 27.05.2009.
[41] Sindice, http://www.sindice.com, visited 27.05.2009.
[42] Watson, http://watson.kmi.open.ac.uk/WatsonWUI/, visited27.05.2009.
[43] JPA, EclipseLink, http://www.eclipse.org/proposals/eclipselink/,visited: 13.05.09.
[44] OpenScreen Project, http://www.openscreenproject.org/, visited27.05.2009.
[45] Apache Tomcat, http://tomcat.apache.org/, visited 27.05.2009.
[46] M. Loukides, „Maven - The Definitive Guide“, O´Reilly Media, Inc.,Sebastopol, 2008.
[47] Flickr, http://www.flickr.com/, visited 27.05.2009.
[48] OpenStreetMap, www.openstreetmap.de/, visited 27.05.2009.
[49] Yahoo! Maps, http://maps.yahoo.com/, visited 27.05.2009.
[50] Google Maps, www.maps.google.com, visited 27.05.2009.
[51] OpenID, http://openid.net/, visited 10.04.2009.
[52] FOAF, http://xmlns.com/foaf/spec/#term_name, visited 27.05.2009.
[53] M. Völkel, SparQL Implementations, ESW Wiki, 2008,http://esw.w3.org/topic/SparqlImplementations, visited 27.05.2009.
[54] J. Kumar, “Benchmarking results of mysql, lucene and sphinx”, 2006,http://jayant7k.blogspot.com/2006/06/benchmarking-results-of-mysql-lucene.htm, visited 27.05.2009.
316
International Journal on Advances in Intelligent Systems, vol 2 no 2&3, year 2009, http://www.iariajournals.org/intelligent_systems/

Web Services Solutions for Hydrologic Data Access and Cross-Domain Interoperability
Bora Beran
Microsoft Research
Redmond, Washington, USA
Simon Jonathan David Cox
Commonwealth Scientific and Industrial Research
Organization (CSIRO)
Bentley, Australia
David Valentine, Ilya Zaslavsky
San Diego Supercomputer Center
University of California, San Diego
La Jolla, California, USA
[email protected], [email protected]
John McGee
Renaissance Computing Institute
Chapel Hill, North Carolina, USA
Abstract— Agencies such as US Geological Survey (USGS),
Environmental Protection Agency (EPA), National
Oceanographic and Atmospheric Administration (NOAA) offer considerable amount of data on climate, hydrometry and
water quality in the United States spanning from 1860s to the
current day. While accessible through a web browser, data
from these sources typically cannot be directly ingested by
modeling or analysis tools without human intervention. Different input/output formats, syntax and terminology, and
different analysis scenarios the systems were designed to
support, make data discovery and retrieval a major time sink.
This paper examines the web services developed as a part of
Consortium of Universities for the Advancement of Hydrologic Science, Inc. (CUAHSI) Hydrologic Information System (HIS)
project as a means to standardize access to hydrologic data
repositories, facilitate data discovery and enable direct
machine-to-machine communication, and the efforts in larger
scale to create a standard which is more flexible and generic yet capable of capturing the domain semantics such that
interoperability with other scientific domains can be achieved
losslessly.
Keywords- Webservices; interoperability; international
standards; geosciences; hydrology
I. INTRODUCTION
The world is facing major challenges associated with the
environment particu larly around climate change and water
scarcity. Changing temperature patterns cause hydrologic
cycle to become less predictable while pollution and
increasing demand for water due to population growth are
pushing the limits of sustainability. Coping with these issues
require working across disciplines with data of vary ing
temporal and spatial scales. For instance while flood
warning systems rely on near real-t ime data, understanding
climate change and drought patterns or making engineering
decisions about structures such as dams or levees require
historical data which can be in-situ point observations as
well as remote sensing imagery.
In the US, Environmental Protection Agency (EPA), US
Geological Survey (USGS) and Nat ional Oceanographic
and Atmospheric Administration (NOAA) are the primary
sources of water quality, quantity and climate data. While
there are overlaps in data offerings NOAA is the main
source of meteorological data, USGS stands out with its
extensive water quantity (surface/subsurface) data whereas
EPA focuses on environmental quality. Heterogeneity is a
major issue. USGS data is available, v ia the National Water
Information System (NWIS) in different formats including
delimited text, HTML tables and USGS‘ own HydroML
markup language. EPA is moving from delimited text to
XML-based WQX (Water Quality eXchange) format. In
addition to different encodings, there is no common
vocabulary either. Lack of standards for hydrologic data
exchange is a major problem a solution to which would
eliminate the need for human involvement in data retrieval
thus not only saves valuable research time but also makes it
possible to implement automated workflows. This has been
the main motivation behind the water data services part of
the Consortium of Universities for the Advancement of
Hydrologic Science, Inc. (CUAHSI) Hydrologic
Information Systems (HIS) project [1]. The project‘s
experience in developing web for standardized access to
hydrologic data sources in the United States demonstrates
the challenges associated with establishing community
semantics of hydrologic data exchange, formalizing the
main notions of hydrologic observations, and evolution
towards compliance with general data exchange protocols
for cross-domain interoperability. However international
317
International Journal on Advances in Intelligent Systems, vol 2 no 2&3, year 2009, http://www.iariajournals.org/intelligent_systems/
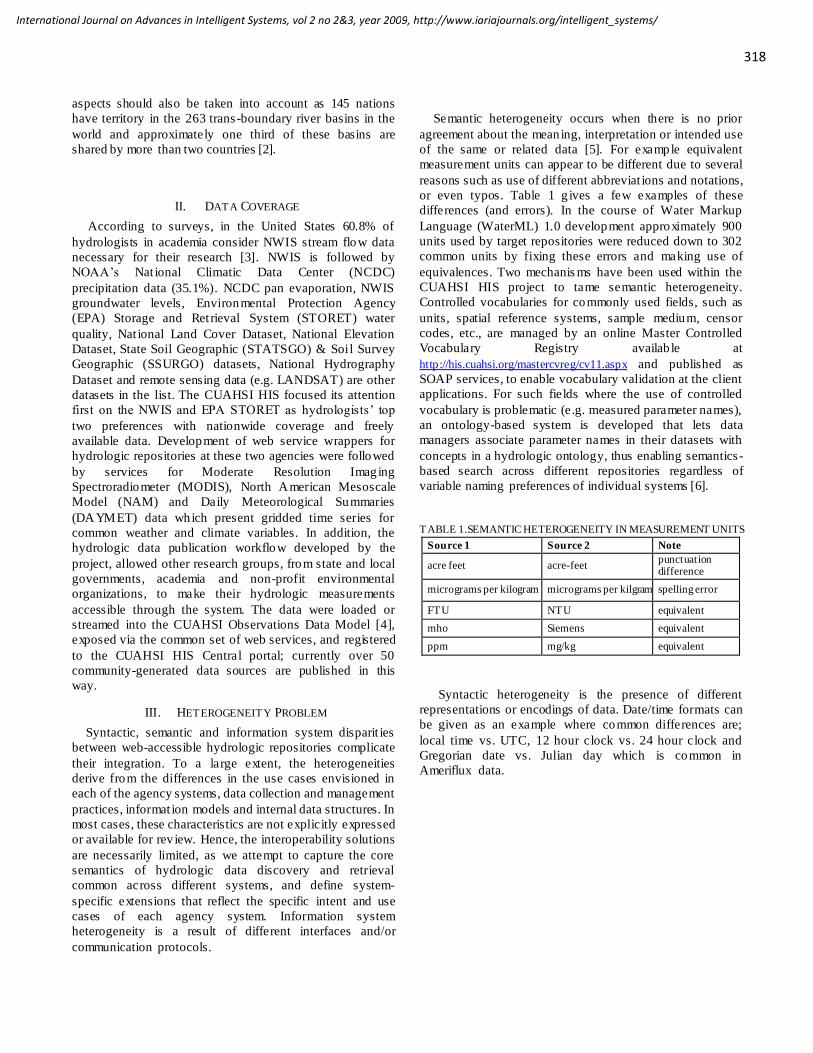
aspects should also be taken into account as 145 nations
have territory in the 263 trans-boundary river basins in the
world and approximately one third of these basins are
shared by more than two countries [2].
II. DATA COVERAGE
According to surveys, in the United States 60.8% of
hydrologists in academia consider NWIS stream flow data
necessary for their research [3]. NWIS is followed by
NOAA‘s National Climatic Data Center (NCDC)
precipitation data (35.1%). NCDC pan evaporation, NWIS
groundwater levels, Environmental Protection Agency
(EPA) Storage and Retrieval System (STORET) water
quality, Nat ional Land Cover Dataset, National Elevation
Dataset, State Soil Geographic (STATSGO) & Soil Survey
Geographic (SSURGO) datasets, National Hydrography
Dataset and remote sensing data (e.g. LANDSAT) are other
datasets in the list. The CUAHSI HIS focused its attention
first on the NWIS and EPA STORET as hydrologists‘ top
two preferences with nationwide coverage and freely
available data. Development of web service wrappers for
hydrologic repositories at these two agencies were followed
by services for Moderate Resolution Imaging
Spectroradiometer (MODIS), North American Mesoscale
Model (NAM) and Daily Meteorological Summaries
(DAYMET) data which present gridded time series for
common weather and climate variables. In addition, the
hydrologic data publication workflow developed by the
project, allowed other research groups, from state and local
governments, academia and non-profit environmental
organizations, to make their hydrologic measurements
accessible through the system. The data were loaded or
streamed into the CUAHSI Observations Data Model [4],
exposed via the common set of web services, and registered
to the CUAHSI HIS Central portal; currently over 50
community-generated data sources are published in this
way.
III. HETEROGENEITY PROBLEM
Syntactic, semantic and information system disparit ies
between web-accessible hydrologic repositories complicate
their integration. To a large extent, the heterogeneities
derive from the differences in the use cases envisioned in
each of the agency systems, data collection and management
practices, informat ion models and internal data structures. In
most cases, these characteristics are not explicitly expressed
or available for rev iew. Hence, the interoperability solutions
are necessarily limited, as we attempt to capture the core
semantics of hydrologic data discovery and retrieval
common across different systems, and define system-
specific extensions that reflect the specific intent and use
cases of each agency system. Information system
heterogeneity is a result of different interfaces and/or
communication protocols.
Semantic heterogeneity occurs when there is no prior
agreement about the meaning, interpretation or intended use
of the same or related data [5]. For example equivalent
measurement units can appear to be different due to several
reasons such as use of different abbreviat ions and notations,
or even typos. Table 1 g ives a few examples of these
differences (and errors). In the course of Water Markup
Language (WaterML) 1.0 development approximately 900
units used by target repositories were reduced down to 302
common units by fixing these errors and making use of
equivalences. Two mechanis ms have been used within the
CUAHSI HIS project to tame semantic heterogeneity.
Controlled vocabularies for commonly used fields, such as
units, spatial reference systems, sample medium, censor
codes, etc., are managed by an online Master Controlled
Vocabulary Registry availab le at
http://his.cuahsi.org/mastercvreg/cv11.aspx and published as
SOAP services, to enable vocabulary validation at the client
applications. For such fields where the use of controlled
vocabulary is problematic (e.g. measured parameter names),
an ontology-based system is developed that lets data
managers associate parameter names in their datasets with
concepts in a hydrologic ontology, thus enabling semantics-
based search across different repositories regardless of
variable naming preferences of individual systems [6].
TABLE 1.SEMANTIC HETEROGENEITY IN MEASUREMENT UNITS
Source 1 Source 2 Note
acre feet acre-feet punctuation difference
micrograms per kilogram micrograms per kilgram spelling error
FTU NTU equivalent
mho Siemens equivalent
ppm mg/kg equivalent
Syntactic heterogeneity is the presence of different
representations or encodings of data. Date/time formats can
be given as an example where common differences are;
local time vs. UTC, 12 hour clock vs. 24 hour clock and
Gregorian date vs. Julian day which is common in
Ameriflux data.
318
International Journal on Advances in Intelligent Systems, vol 2 no 2&3, year 2009, http://www.iariajournals.org/intelligent_systems/

IV. CUAHSI WEB SERVICES
The goal of CUAHSI web services is to reconcile the
aforementioned differences to the extent possible and return
uniform documents regardless of the repository of origin.
Hence CUAHSI HIS web services have been named
WaterOneFlow; emphasizing the idea of a seamless
interface through which researchers can gain access to
hydrologic data from multiple heterogeneous data sources.
TABLE 2. WATERONEFLOW WEB SERVICE METHODS
Methods Description
GetSiteInfo, GetSiteInfoObject
Given a site number, this method returns the site's metadata. Send the site code in this format: 'NetworkName:SiteCode'
GetSites,
GetSitesObject
Given an array of site numbers, this method returns
the site metadata for each one. Send the array of site codes in this format: 'NetworkName:SiteCode'
GetValues, GetValuesObject
Given a site number, a variable, a start date, and an end date, this method returns a time series. Pass in
the sitecode and variable in this format: 'NetworkName:SiteCode' and 'NetworkName:Variable'
GetVariableInfo, GetVariableInfoObject
Given a variable code, this method returns the variable's name. Pass in the variable in this format:
'NetworkName:Variable'
WaterOneFlow follows certain rules to ensure uniformity
of both input and output communication with the services.
To this end web services were designed to provide output in
a standard format; namely CUAHSI WaterML as part of the
CUAHSI HIS project. The ma in purpose of WaterML has
been to encode the semantics of discovery and retrieval of
hydrologic time series, as commonly used by research
hydrologists. This domain semantics has been derived from
the CUAHSI Observations Data Model as well as from the
organization, data structures and metadata exposed by
several common online repositories of water quantity and
water quality data. WaterML has been developed as a set of
core constructs (site, variab le, timeseries, etc) reflecting a
common usage scenario where time series are discovered
and retrieved by navigating to sites of interest and then
examining parameters measured at these sites and their
periods of record. As a result, WaterML offered an
attractively simple formal encoding of t ime series exchange,
which was implemented in WaterOneFlow services and
field tested within a distributed system of hydrologic
observatory test beds. WaterOneFlow services offer four
major functions and their variants. (See Table 2) Object
suffix (e.g. GetValuesObject) indicates that method returns
a WaterML created by deserializing the response into an
object, rather than WaterML being returned as a String.
Different options are provided for users of varying levels of
programming experience and not necessarily the same
preferences.
# Data for the following site(s) are contained in
this file USGS 06090800 Missouri River at Fort
Benton MT
#
# -----------------------------------------------
# Data provided for site 06090800
# DD parameter Description
# 02 00060 Discharge, cubic feet per
second
#
agency_cd site_no datetime 02_00060 02_00060_cd
5s 15s 16d 14n 10s
USGS 06090800 2009-09-06 04:00 5750 P
USGS 06090800 2009-09-06 04:15 5780 P
USGS 06090800 2009-09-06 04:30 5780 P
USGS 06090800 2009-09-06 04:45 5780 P
Figure 1. Sample USGS NWIS response to a data request
Figure 1 shows the output of a USGS NWIS inquiry for
discharge measurements at site number 0609800 between
4:00 AM and 4:45 AM on September 6th
, 2009. Figure 2
shows the response of WaterOneFlow GetValues service to
the same data request. It can easily be seen that Figure 2
contains significant amount of metadata lacking in the
original USGS response. Coordinates of measurement
location, type of measurement (instantaneous, average,
minimum, maximu m, incremental etc.) and t ime zone are
some of the additional content very important for correctly
interpreting the data. This is because WaterOneFlow
services are not just proxies that transform the data but are
supported by a local metadata catalog or they retrieve the
additional information by making several different inquiries
to underlying data repositories.
WaterOneFlow services for national datasets and hydrologic
observatory test-beds are operational and can be accessed at
http://river.sdsc.edu/wiki/CUAHSI%20WebServices.ashx and
http://www.watersnet.org/wtbs/ , respectively.
There are two main deployment scenarios for
WaterOneFlow services. If data is contained in CUAHSI
HIS‘ Observations Data Model (ODM), the deployment is
fairly straightforward. A different scenario is implemented
when the data are housed in a remote repository such as a
federal agency database accessible via a Web interface. In
such cases, WaterOneFlow services can be screen scraper
services aka web service wrappers. This is an error-prone
approach as the services are sensitive to slight alterations of
the remote web site. Th is bottleneck is removed as water
data collection agencies develop web service interfaces to
their repositories. Data repositories such as NCDC
Automatic Surface Observing System (ASOS) and USGS
NWIS have implemented WaterOneFlow webservices on
their servers, eliminating the need for screen scraping. More
repositories are expected to follow.
319
International Journal on Advances in Intelligent Systems, vol 2 no 2&3, year 2009, http://www.iariajournals.org/intelligent_systems/

<timeSeries>
<sourceInfo xsi:type="SiteInfoType">
<siteName>Missouri River at Fort Benton MT</siteName>
<siteCode network="NWIS">06090800</siteCode>
<timeZoneInfo>
<defaultTimeZone ZoneAbbreviation="MST" ZoneOffset="-07:00" />
<daylightSavingsTimeZone ZoneAbbreviation="MDT" ZoneOffset="-06:00" />
</timeZoneInfo>
<geoLocation>
<geogLocation xsi:type="LatLonPointType" srs="EPSG:4269">
<latitude>47.81746979</latitude>
<longitude>-110.6671586</longitude>
</geogLocation>
</geoLocation>
</sourceInfo>
<variable>
<variableCode vocabulary="NWIS">00060</variableCode>
<variableName>Discharge</variableName>
<variableDescription>Discharge, cubic feet per second</variableDescription>
<dataType>Instantaneous</dataType>
<units unitsAbbreviation="cfs">cubic feet per second</units>
<NoDataValue>-999999</NoDataValue>
<timeSupport isRegular="true">
<unit>
<UnitName>minute</UnitName>
<UnitType>Time</UnitType>
<UnitAbbreviation>min</UnitAbbreviation>
</unit>
<timeInterval>15</timeInterval>
</timeSupport>
</variable>
<values count="4">
<value dateTime="2009-09-06T11:00:00-7:00" qualifiers="P">5750</value>
<value dateTime="2009-09-06T11:15:00-7:00" qualifiers="P">5780</value>
<value dateTime="2009-09-06T11:30:00-7:00" qualifiers="P">5780</value>
<value dateTime="2009-09-06T11:45:00-7:00" qualifiers="P">5780</value>
</values>
</timeSeries>
Figure 2. Excerpt from WaterOneFlow GetValues response
V. APPLICATIONS OF WATERONEFLOW SERVICES
WaterOneFlow services have been leveraged by several
applications with purposes ranging from data discovery to
hydrologic & water quality modeling. Macros and toolbars
developed for Microsoft Excel, Matlab and ArcGIS allow
importing data d irectly into these applications [7]. Web-
based applications such as Data Access System for
Hydrology (DASH) [8] and Hydroseek [6] facilitate data
discovery and retrieval by providing unified map-based
interfaces over multiple repositories (Figure 3).
Applications in water resources modeling make use of
Open Modeling Interface (OpenMI). OpenMI defines an
interface that allows time-dependent models to exchange
data at run-time. Goodall et al. developed models to
calculate watershed storage and water quality [9].
Figure 3. WaterOneFlow as a bridge to analysis and data discovery tools
320
International Journal on Advances in Intelligent Systems, vol 2 no 2&3, year 2009, http://www.iariajournals.org/intelligent_systems/

Storage model is an applicat ion of conservation of mass
principle and uses precipitation, streamflow (inflow-
outflow) and evapotranspiration data from USGS NWIS,
DAYMET and Ameriflux repositories respectively. Water
quality calculat ions leverage USGS‘s SPAtially Referenced
Regressions On Watershed attributes (SPARROW) model.
SPARROW model performs the regression on total nitrogen
loadings derived from observations of organic n itrogen,
inorganic nitrogen, and flow. In this particular
implementation USGS stations measuring streamflow are
used along with nearby EPA stations with nitrogen
concentration measurements to obtain the necessary data for
the model. Once the observation results are retrieved from
USGS NW IS and EPA STORET they are aligned in space
and time and used as model input.
VI. INTEROPERABILITY, THE BIG PICTURE
WaterML and WaterOneFlow services have established
an in itial level of interoperability across hydrologic data
repositories that reflected the semantics of water data
discovery and retrieval common in hydrologic research.
Their implementation in the context of an operational
distributed system of the CUAHSI HIS pro ject providing
web service access to data measured at over 1.75 million
sites in the US, allows the project team to further specify
use cases and scenarios, and additional requirements for a
hydrologic data exchange format. To address
interoperability challenges beyond the hydrology domain,
and accommodate additional usage scenarios, the approach
has to be extended and harmonized with emerg ing standards
in other domains. Several such standards are being
developed under the aegis of the Open Geospatial
Consortium (OGC).
A hydrology domain working group has recently been
convened within OGC, to focus on formulation of
interoperability requirements and scenarios in hydrology,
and coordinate the development of a common exchange
protocol, referred to as WaterML 2.0 operating alongside a
meteorology working group under the umbrella of the
OGC‘s Earth System Science domain working group. As
part of this process WaterML is being harmonized with
OGC standards for sensor/geographic data exchange to
become interoperable with similar applications from
different domains.
A. Sensor Web Enablement
Open Geospatial Consortium (OGC) provides a
framework that specifies standard interfaces and encodings
to facilitate exchange of geographical information. OGC‘s
Sensor Web Enablement (SWE) init iative focuses on
integration of sensors and sensor systems [10].
SWE develops standards to enable:
· Discovery of sensor systems and observations
· Determination of a sensor‘s capabilities
· Retrieval of sensor metadata
· Retrieval of time-series observations and coverages
· Subscription to and publishing of alerts to be
issued by sensors based on certain criteria
· Tasking of sensors
The principal SWE service interface (related to the top
four bullets) is called Sensor Observation Service (SOS).
SOS [11] uses the OGC informat ion standards Observations
& Measurements (O&M) [12] and Sensor Model Language
(SensorML) [13] for encoding observations data/metadata
and sensor metadata respectively. Sensor Alert Service
(SAS) and Sensor Planning Service (SPS) [14] define
interfaces for subscription and tasking. SOS occupies the
services tier shown in Figure 4. This may be compared with
the IEEE 1451 family of standards which addresses the
transducer interface tier.
Figure 4. Generalized SWE stack
SOS defines three core and mandatory operations:
· GetObservation for retrieving sensor data
· GetCapabilities for retriev ing in formation about
the data offerings and supported functions (e.g.
filters) for the service instance
· DescribeSensor for retrieving sensor metadata
A typical sensor data consumption scenario starts with
service discovery which involves using one or more OGC
Catalog Serv ice (CS-W) [15] instances. CS-W provides an
interface to a registry allowing data consumers to discover
services by time period of observations, phenomena
captured by observations, spatial extent, names and
descriptions. Evaluating the suitability of a specific service
instance utilizes the GetCapabilities operation. A
GetCapabilit ies response contains detailed informat ion
about all of the offerings that are available from a SOS
instance, which typically exposes a small constellation of
sensors, details of which may be obtained through the
DescribeSensor operation. GetCapabilities response also
contains information on the filters supported by
GetObservation operation. Filters are used to subset
observation results based on temporal, spatial, logical or
scalar comparison operators [11].
Services
Data Repository
Transducer Interface
Sensor
321
International Journal on Advances in Intelligent Systems, vol 2 no 2&3, year 2009, http://www.iariajournals.org/intelligent_systems/
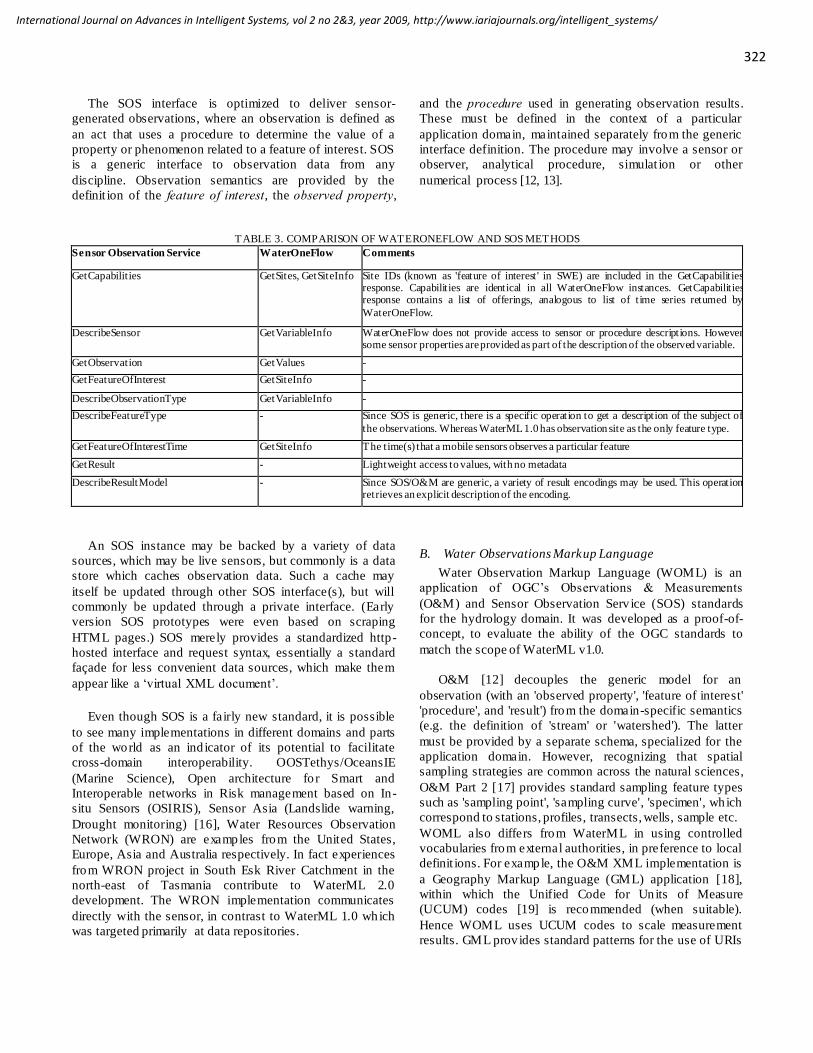
The SOS interface is optimized to deliver sensor-
generated observations, where an observation is defined as
an act that uses a procedure to determine the value of a
property or phenomenon related to a feature of interest. SOS
is a generic interface to observation data from any
discipline. Observation semantics are provided by the
definit ion of the feature of interest, the observed property,
and the procedure used in generating observation results.
These must be defined in the context of a particular
application domain, maintained separately from the generic
interface definition. The procedure may involve a sensor or
observer, analytical procedure, simulat ion or other
numerical process [12, 13].
TABLE 3. COMPARISON OF WATERONEFLOW AND SOS METHODS
Sensor Observation Service WaterOneFlow Comments
GetCapabilities GetSites, GetSiteInfo Site IDs (known as 'feature of interest ' in SWE) are included in the GetCapabilities response. Capabilities are identical in all WaterOneFlow instances. GetCapabilities response contains a list of offerings, analogous to list of time series returned by
WaterOneFlow.
DescribeSensor GetVariableInfo WaterOneFlow does not provide access to sensor or procedure descriptions. However some sensor properties are provided as part of the description of the observed variable.
GetObservation GetValues -
GetFeatureOfInterest GetSiteInfo -
DescribeObservationType GetVariableInfo -
DescribeFeatureType - Since SOS is generic, there is a specific operation to get a description of the subject of
the observations. Whereas WaterML 1.0 has observation site as the only feature type.
GetFeatureOfInterestTime GetSiteInfo The time(s) that a mobile sensors observes a particular feature
GetResult - Lightweight access to values, with no metadata
DescribeResultModel - Since SOS/O&M are generic, a variety of result encodings may be used. This operation retrieves an explicit description of the encoding.
An SOS instance may be backed by a variety of data
sources, which may be live sensors, but commonly is a data
store which caches observation data. Such a cache may
itself be updated through other SOS interface(s), but will
commonly be updated through a private interface. (Early
version SOS prototypes were even based on scraping
HTML pages.) SOS merely provides a standardized http-
hosted interface and request syntax, essentially a standard
façade for less convenient data sources, which make them
appear like a ‗virtual XML document‘.
Even though SOS is a fairly new standard, it is possible
to see many implementations in different domains and parts
of the world as an ind icator of its potential to facilitate
cross-domain interoperability. OOSTethys/OceansIE
(Marine Science), Open architecture fo r Smart and
Interoperable networks in Risk management based on In-
situ Sensors (OSIRIS), Sensor Asia (Landslide warning,
Drought monitoring) [16], Water Resources Observation
Network (WRON) are examples from the United States,
Europe, Asia and Australia respectively. In fact experiences
from WRON project in South Esk River Catchment in the
north-east of Tasmania contribute to WaterML 2.0
development. The WRON implementation communicates
directly with the sensor, in contrast to WaterML 1.0 which
was targeted primarily at data repositories.
B. Water Observations Markup Language
Water Observation Markup Language (WOML) is an
application of OGC‘s Observations & Measurements
(O&M) and Sensor Observation Serv ice (SOS) standards
for the hydrology domain. It was developed as a proof-of-
concept, to evaluate the ability of the OGC standards to
match the scope of WaterML v1.0.
O&M [12] decouples the generic model for an
observation (with an 'observed property', 'feature of interest'
'procedure', and 'result') from the domain-specific semantics
(e.g. the definition of 'stream' or 'watershed'). The latter
must be provided by a separate schema, specialized for the
application domain. However, recognizing that spatial
sampling strategies are common across the natural sciences,
O&M Part 2 [17] provides standard sampling feature types
such as 'sampling point', 'sampling curve', 'specimen', which
correspond to stations, profiles, transects, wells, sample etc.
WOML also differs from WaterML in using controlled
vocabularies from external authorities, in preference to local
definit ions. For example, the O&M XML implementation is
a Geography Markup Language (GML) application [18],
within which the Unified Code for Units of Measure
(UCUM) codes [19] is recommended (when suitable).
Hence WOML uses UCUM codes to scale measurement
results. GML prov ides standard patterns for the use of URIs
322
International Journal on Advances in Intelligent Systems, vol 2 no 2&3, year 2009, http://www.iariajournals.org/intelligent_systems/

to link to external resources, to enable and encourage the
use of pre-existing externally governed vocabularies. In this
way both data structures and key aspects of the content are
standardized, which leads to improved interoperability. So
overall WOML is composed from O&M Parts 1 and 2, plus
a lightweight domain model for hydrology (watercourse,
storage, catchment), some standard vocabularies of units,
sensors, interpolation rules, and state behavior and request
metadata provided by SOS.
TABLE 4. SEMANTIC DIFFERENCES OVER SHARED CONCEPTS BETWEEN DATA FORMATS
WaterML 1.0 NWIS STO RET WQ X SO S
Site Site Station Monitoring Location Feature
Lat-Long Lat-Long Lat-Long Lat-Long Arbitrary geometry (may be point coordinates)
Variable Parameter Characteristic Characteristic Name Observed property
Method Parameter Method Method Procedure
Series Period of Record - Characteristic Summary Offering
Through WOML work, use cases and experiences
from WaterML and WaterOneFlow in turn are contributing
design considerations for OGC standards under
development. This is also a key benefit to OGC from the
formation of the Hydro logy working group. For example
one of the key challenges in SOS/O&M is encoding time-
series. Existing coverage encodings are mostly tailored for
imagery, rather than functions with a temporal domain. The
WaterML time-series encoding provides a good solution for
handling this type of data.
From the point of view of CUAHSI, adopting externally
governed standards leads to both benefits and obligations.
The benefit of leveraging generic sensor and observation
standards is (i) the potential for easier cross -domain data
assimilation (important in hydrology, which clearly depends
on meteorology, climate science, ad ministrative and
engineering informat ion, and geology), (ii) more robust
design, based on a broader set of requirements, and (iii) tool
re-use. However, there are costs such as (i) dependency on
third-party governance and maintenance arrangements for
part of the language (ii) complexity due to specializat ion of
a generic component, in contrast to directly designing for a
limited use-case (iii) addit ional conformance constraints that
may not be directly relevant to the application domain.
C. Transition from WaterOneFlow to SOS
WOML showed that O&M + SOS, customized with
hydrology feature-types, property-types (variables or
parameters) and sensors can support the functionality
equivalent to WaterOneFlow. Table 3 shows how the SOS
operations map to WaterOneFlow requests.
One of the principal goals of the OGC Hydrology
Working Group is to develop WaterML v2, which will be
based on the OGC SW E standards, but will address the
detailed requirements identified for the WaterOneFlow
services. Looking at Tables 3 and Table 4 it is possible to
see that SOS is more generic and atomic, giving it much
more flexib ility and expressiveness as well as making it
easier to parse. However this also makes SOS document
structure more complex and less human-readable. While
there are many conceptual overlaps at a more abstract level,
hypernymy (super-ordinance) and hyponymy (sub-
ordinance) are common semantics issues observed between
different data sources, both in representations of the data
(Table 4) and web service methods (Table 3). A
consequence of this is the necessity to deal with much more
complex mappings and requirement for wrapper services to
often invoke multiple functions of the wrapped system and
aggregate the results to be able to respond to a single
request.
In order to make the adoption of SOS easier, an open–
source SOS implementation is being developed which can
be found at http://ogc.codeplex.com/. This work includes
class libraries to support SOS and templates to simplify
creation of SW E services for the Microsoft .NET
environment. Libraries and templates are generic hence can
be used outside the CUAHSI HIS framework and with
databases other than ODM. However to simplify the
migrat ion for existing WaterOneFlow systems, a ready to
use out-of-the-box web services/ODM database bundle is
also included in the d istribution. Operat ional services can be
accessed at http://www.sensordatabus.org/Pages/SOS.aspx.
VII. CONCLUSION
To enable programmat ic access to hydrometry/water
quality databases in the United States, a set of web services
has been developed. Standard web service functions
(WaterOneFlow) and a markup language as the medium
(CUAHSI WaterML) are used to provide a un iform v iew
over multip le heterogeneous data sources and allow
programs and modeling tools directly access and retrieve
323
International Journal on Advances in Intelligent Systems, vol 2 no 2&3, year 2009, http://www.iariajournals.org/intelligent_systems/
data from them without need to human intervention. This
not only reduces the time spent for data discovery and
preparation but also can be used in cases such as scientific
work flows. WaterOneFlow services are p lanned to cover
more data sources, offer more functions while WaterML is
evolving to become an OGC standard. Web services are an
important component in solving the interoperability puzzle
by linking the data and applications together. However it is
important to have a consensus on a standard otherwise,
more t ime would be spent to make different standards work
together. CUAHSI HIS now provides web services to USGS
National Water Information System (NWIS), EPA Storage
and Retrieval (STORET), Moderate Resolution Imaging
Spectroradiometer (MODIS), North American Mesoscale
Model (NAM) and Daily Meteorological Summaries
(DAYMET) data. Through WaterOneFlow 40 other data
sources are available including several international
datasets.
To further enhance data interoperability within and
beyond the hydrology domain, addit ional work focuses on
harmonizing WaterML development with OGC SW E
specifications. While this is a work in progress, WOML and
open-source OGC libraries that couple the CUAHSI
Observations Data Model with SOS interfaces are important
steps towards creation and adoption of a more universal
hydrologic data exchange protocol that will be both flexible
and generic, at the same time provid ing intuitive encodings
that are compatible with common hydrologic semantics.
ACKNOWLEDGMENT
This work has been partly supported by NSF under
award EAR-0622374 (PI: D.R. Maidment), CSIRO and the Australian Bureau of Meteorology under IWIS Theme
1010.2 WIRADA project 1.4 ―Water Data Transfer
Standards‖.
REFERENCES
[1] B. Beran, J. Goodall, D. Valentine, I. Zaslavsky and M. Piasecki,
―Standardizing Access to Hydrologic Data Repositories through Web Services‖, Proc. International Conference on Advanced Geographic Information Systems & Web Services (GEOWS 2009), IEEE Computer Society, Los Alamitos, CA. Feb. 2009, pp 64-67.
[2] E. Koncagül, D. Donovan, J. Treves-Habar, S. Lee, I. Brugnon, K. Pittman, A. Núñez-Luna, C. Walther and A. Hassan (Eds), ―Water: A shared responsibility: The United Nations World Water Development Report 2‖, UNESCO, Paris, 2006, pp 126. ISBN: 92-3-104006-5.
[3] D. Maidment (Ed), ―CUAHSI HIS Status Report‖, Sept ember 15, 2005. pp 48-87.
[4] J.S. Horsburgh, D.G. Tarboton, D.R. Maidment and I. Zaslavsky, ‖A relational model for environmental and water resources data‖, Water Resources Research. vol. 44. doi:10.1029/2007WR006392.
[5] A.P. Sheth and J. Larsen, ―Federated Database Systems for Managing Distributed, Heterogeneous and Autonomous Databases‖, ACM Computing Surveys: Special Issue on Heterogeneous Databases, 22(3) 183-236.
[6] B. Beran and M. Piasecki, ―Engineering new paths to water data‖, Computers & Geosciences vol 35, issue 4, Apr. 2009, pp. 753-760.
[7] S.R. Brady, A.K. Sinha and L.C. Gundersen (Eds), ―Geoinformatics 2006—Abstracts: U.S. Geological Survey Scientific Investigations Report 2006-5201‖, 2006. pp 23.
[8] J. L. Goodall, B.F. Robinson, F.M. Shatnawi and A.M. Castronova, ―Linking Hydrologic Models and Data: The OpenMI Approach‖, (2007). Eos Trans. AGU, vol. 88(52), Fall Meet. Suppl., Abstract H13H-1682
[9] T. Whitenack, I. Zaslavsky, D. Valentine and D. Djokic, "Data Access System for Hydrology", (2007). Eos Trans. AGU, 88(52), Fall Meet. Suppl., Abstract H13H-1685.
[10] M. Botts, G. Percival, C. Reed and J. Davidson, ―OGC Sensor Web Enablement: Overview and High Level Architecture‖, Open Geospatial Consortium Inc., OGC 06-052r2, 2006.
[11] A. Na and M. Priest, ―Sensor Observation Service‖, Open Geospatial Consortium Inc., OGC 06-009r6, 2007.
[12] S. J. D. Cox, ―Observations and Measurements, Part 1 - Observation Schema‖, Open Geospatial Consortium Inc., OGC 07-022r1, 2007.
[13] M. Botts, and A. Robin, ―Sensor Model Language (SensorML)‖, Open Geospatial Consortium Inc., OGC 07-000, 2007.
[14] I. Simonis (Ed), ―Sensor Planning Service Implementation Specification‖, Open Geospatial Consortium Inc., OGC 07-014r3.
[15] D. Nebert, A. Whiteside and P. Vretanos (Eds) ―Catalogue Services Specification‖, Open Geospatial Consortium Inc., OGC 07-006r1.
[16] K. Honda, D. H. Nguyen and H. Shimamura, ―Sensor Asia - Sensor Network and GIS for Environmental Monitoring in Asia‖, International Forum on Water Environmental Governance in Asia, pp.102-105, 2007.
[17] S. J. D. Cox, ―Observations and Measurements, Part 2 – Sampling Features‖, Open Geospatial Consortium Inc., OGC 07-002r3, 2007.
[18] C. Portele (Ed), "OpenGIS Geography Markup Language (GML) Encoding Standard, v3.2.1", ISO 19136:2007, International Organization for Standardization, 2007.
[19] G. Schadow and C.J. McDonald, "The Unified Code for Units of Measure v1.7", Regenstrief Institute, Inc. 2008. <http://aurora.regenstrief.org/~ucum/ucum.html> 2009-09-20
324
International Journal on Advances in Intelligent Systems, vol 2 no 2&3, year 2009, http://www.iariajournals.org/intelligent_systems/
Reliability Issues and Improvements in Remote Monitoring Security Systems
R. Hariprakash G. Venkat Ramu T. Rajakumari S. Ananthi K. PadmanabhanBIHER,Bharath University of Madras Polytechnic College Univ. of Madras AC Tech, AnnaUniv, Chennai-73 Chennai-25, India Chennai, India Chenna-25, India Univ., Chennai-25,[email protected] [email protected] [email protected] [email protected] [email protected]
Abstract – The paper deals with the methods of securityimplementation in community areas based on certainhigh technology sensor system and communicationmethods. Security systems for home or industry have alot to perform today in terms of reliability andperformance. After examining the various modes forsecurity management, the paper describes datacollection and fusion which demand careful processingand discerning of the security problem. Herein, theproblem of data detection without errors becomesimportant to avoid falsely discerning insecurity levels.This paper examines some signal management methodsfor error free operation of signals from Doppler motionsensors and camera image data. Amongst them this isconsidered the technique for encoding data using theHilbert Transform. This is better for motion sensorswith a few extra bits of transmission enabling error freereception at the monitoring computer station. Alsoconsidered are wavelet compression and transmissionfor remote site image data using spread spectrum.
Keywords: Home security system; Hilbert Transform fordata encoding; Wavelet transform; Spread spectrum.
1. REMOTE SENSOR SURVEILLANCE-METHODS AND PROBLEMS
Now-a-days, it is common to have a central monitoringsystem of remote surveillance doing the job for many ahome or industry floor. The monitoring system itself has tobe securely located in a place difficult to identify. It dealswith the problem of receiving inputs from a multitude ofsignal sensors, from all its customers, periodically. It has toprocess them despite any transmission system noise andidentify events of insecurity as well as send suitablecommands to take proper action [1]. In this, there are twocategories of security levels: i) totally un-manned anduninhabited; ii) partially manned by sentinel.
The methodology and implementation of securitymonitoring systems are varied and wide. On the one hand,there are various methods of sensing the internalenvironment to be monitored employing whatever sensorsthat would fit the environment best. On the other, there aredifferent approaches to prevent intrusion, by simulating the
presence of human existence in an unmanned area. Whenmany sensors and cameras are used for many rooms andareas, the quantity of signals become large; theircontinuous monitoring over extended periods of timerender the data manipulation large and extensive. Amongthese are the several CCTV, metal detectors, burglaralarms, fire alarms, access control and so on [2].
While new techniques in sensors have brought forthmore and more components for the security environment,there have also been incidents of pilferage, interferenceand mal-operation in many sites leading to failure of theentire monitoring system. Attacks against security havebeen very many. Therefore, in this write – up, we first citethe sensor techniques and then concentrate on how thesensor information is getting immense when a singlemonitoring station caters to many sites which haveentrusted their security problems to it. With such acontinuous flow of information to the processing station,data can be interrupted by hostile elements and it can gainerrors. Erroneous information in security monitoring wouldinvariably provide false alarms. So much so, it becomesnecessary to confirm the validity of such communicateddata while also being able to correct errors. In this context,methods conventionally available in data communicationfor error detection are not sufficient in this respect becausenone of these could provide the surety of correctness ofdata, though they could correct a very small percentage orerrors which might be present. Particularly important arethe motion sensor data with regard to error detection.
2. TYPES OF SECURITY SENSORS
Security makes use of sensors extensively. Sensors mustbe reliable and should not provide false alarms and mustoperate with low power and also from battery in order toprovide security signaling even when power is purposelyshut down in the area being protected. Vendors [3] supplyproducts for real estate developers and hotel operators acost effective and reliable way to provide their customerswith total control over home or hotel rooms.
To provide security in unattended situations, simulationmethods are common. The monitoring systems simulatethe presence of inmates for external observers. This is byswitching on and off, the several internal lights, issuing
325
International Journal on Advances in Intelligent Systems, vol 2 no 2&3, year 2009, http://www.iariajournals.org/intelligent_systems/

noise akin to speech and turning on the television set atintervals, particularly during day time. This means a pre-planned appliance switching control from an externalmonitoring station in order, to simulate the presence ofinmates in an actually vacant home or commercial site.Signal commands sent for activating these simulationsystems need to be protected because if they are watchedby an intruder, it makes it easy for him to intrude such asite.
Sites hired for security management by the centralmonitoring station may need activation and de-activationas and when needed. Current technology provides forsecurity systems activated with one or more buttons orwith a voice command key pad with select regions ofsecurity or levels. The activation can also be made fromexternal through telephony, but this has to be handled withsuitable password protection and encryption embedded init.
There are a variety of signal sensors available in thisarea. The most common are the switches in the severalmovement paths, tampering signal detection componentsfor lockable items, door signals, lighting signals. There aremotion sensors based on the Infra-red, microwave andultrasound reflectance principle which are capable ofsensing human and only human movement. The threestates of any sensor signal would be:
i) inactiveii) active, indicating a presence of an event
(closure, opening) andiii) failed sensor.
Here again, the characteristics of sensors - theresolution, linearity, sensitivity, response time, offset,range, hysterisis, long term stability, their temporalbehavior etc., need reliable proper signal hardwareconcepts.
For movement of humans in unexpected sites andareas, usually reflectance sensors or infra-red thermaldetecting sensors are used.
The path-way switches, the door hinge switches aredigital; the motion Doppler signals are analog and needprocessing further; the mixed signals arise from reflectancesensors with varying threshold depending on ambientlighting conditions. Most of these are available withwireless communication in built. Security monitoringbased on audible signals detected through remotemicrophony [4] is also cited with classification techniquesbased algorithms for detecting non-speech and speechaudio.
There are several issues relating to sensors that need tobe addressed today. Sensors should be precise and shouldbe communicative by themselves such as the radio remotetransmitting door lock sensor [5]. There are also systemslike the Sony’s Wireless iPod Whole-House S-AIR AudioSystem [6]. In this paper, with respect to motion sensors, anew encoding scheme is indicated that enables data to betransmitted with error correction embedded in the method.
With Doppler signal data from sensors, the movementprofile of the source, which, in our case, happens to be thepossible intrusion in the monitored site, should beidentified with high level of probability. The ability of theradar to reject faster than walking speed targets can also becontrolled by time constants in the circuit. A typical valueof radial velocity is 16 mm/s at the MID frequency of10.687GHz and this determines the range [7].
3. SIGNAL HANDLING AT MONITORING SITE
Sensor signal processing follows sensor signalconditioning. The question as to which signal sensorswould do all detection and processing at site and whichones at the remote monitoring station have to be decidedfirst. For most sensors, it involves advanced signalprocessing algorithms that go far beyond sensor signalconditioning. Examples are linearization, adaptivefiltering, correlation, signal transforms, signalcompression, and pattern recognition. While some of thesecan be implemented easily with analog circuits, digitalsignal processing does the rest. Signals digitized can bestored for long time for comparative inferences. It ispossible to send signals all collectively as and when theyare sampled and communicate them remotely to themonitoring site via a communication channel. Or else, theprocessing can be done by local hardware and only thefinal components of signal complexes be transmitted to themonitoring site.
Complex systems of security levels are required inthe several vulnerable locations. Once a preprocessedsignal is available, it is not necessary to perform all furtherprocessing in the site itself. Doppler signal processingfrom at least two different motion sensors would need notmerely be a signal indicating a motion that is causing asuspicion, but also the time course of the signal indicatingits positive aspect of suspicion.
Image signals are also now becoming more and moreimportant. These are usually transmitted with encryptionand compression. They need to reduce the data size andincrease the throughput.
326
International Journal on Advances in Intelligent Systems, vol 2 no 2&3, year 2009, http://www.iariajournals.org/intelligent_systems/

4. INFORMATION FUSION FROM MULTI-SITE
SENSOR COMPLEX
In areas related to industrial and military applications,there are such systems of information processing, such asthe (VMMD) Vehicular Multi-Sensor Mine Detection [8].Land mine detection sensor development and systemsintegration are evaluating new technologies, incrementallyimproving existing technologies, increasing the probabilityof detection, reducing the false alarm rate, and planningout usable deployment scenarios.
With all these sensors and data, one would think that abody of data would exist from which effective real timealgorithms for information fusion or “detection” could bedeveloped. The application of Dempster-Shafer evidentialtheory for implementing a home security system usingsensor data fusion has also been considered [9].
Figure 1 A early bird MID homebrew MID device using GunnDiode and Mullard CL8960 mixer [5] .
There should be a multiplexed signal processingsoftware, which would handle the several communicatedsignals from time to time from the customer sites.
Thus, 300 signal bits would need to be processed atleast once a few seconds, continuously and with around100 customers per one network that monitors its area, therewould be a signal processing of 30000 bits in unit timeslot.
The mathematical processing of the signals wouldvary from simple to mathematically time intensiveapproaches, such as complex Fourier transform, for theDoppler signals from motion sensors.
Then, the simulated testing of the sites are also to beincluded as part of the sentinel system. In this, the sitewould be simulated with events from a manned orautomatic program of closure or opening of proximityswitches, movement simulators with lights or infra red
beaming lights with motion and so on. The programs forsuch periodical testing would be part of the maintenanceroutine which would be run as often as needed or requestedby the customer.
So much so, a monitoring station hired to monitorsurveillance activity in about 50 sites would be dealingwith more than 500 signals over the whole day insequence; this would require sufficient processing powerand software management.
Consider a system with around fifty digital logicoutputs from switches and proximity sensors; around adozen motion sensor input signals processed or given inraw format with just a digitization on an 8 or 10 bit ADC.Combine this with the signals which are created tosimulate human presence by the outputs to the lights, thenoise speakers, the switching on and off the television orother similar simulated activity, including answering atelephone call from recorded information, all amounting toaround 40 approximately.
The above will need a signal vector, which could behaving a dimension that would be 50 + 12 2 10 + 40 =330. The sampling time could be anywhere between hoursto a few seconds, depending upon the security system’stime resolution. (The Doppler signals are two in number,which are analog but converted into 10 bits digital by theADC and hence we have 122 10). This is just from asingle site being monitored for security. There could bemany such homes and security monitored sites contractedby the monitoring central agency, which will be thereforecontinuously receiving information from the several sitesall through the 24 hours.
The job management and control strategy as well asemergency functions of the central monitoring systemwould be to analyze the above data, assuming that there isno loss or corruption in the system used for transmission orany man-made interference in the system ofcommunication. There could also be a protocolcommunicated via any of the wireless or similarcommunication systems, including the use of the cellularphone [10].Error free transmission should be the aim, sinceerrors in data, if not identified, will lead to false alarms anddisturbances to customers.
5. ENCODING OF SIGNSALS FROM MOTION SENSOR
Motion sensors are a very important of the totality ofsensors at sites.
The sensors of the motion detectors quantifies motionthat can be either integrated with or connected to otherdevices that alert the presence of a moving object withinthe field of view. In Simpler systems, the motion sensorsused to be connected to a burglar alarm to alert the security
327
International Journal on Advances in Intelligent Systems, vol 2 no 2&3, year 2009, http://www.iariajournals.org/intelligent_systems/

station after it detects motion or the signal used to trigger ared light camera. Amongst these sensors, (PIR) Passiveinfrared sensors [11] look for body heat. In Some specificcases the signals are usually detected either by all of theseand in addition, ultrasound or infra red sensors.
The ultrasonic active sensors send out pulses andmeasure the reflection off a moving object. The Dopplereffect principle is used for ultrasound signal transducers todetect and determine the moving intrusion and hence it ismore reliable. To avoid false alarms due to pets, the dual-technology motion detectors are used [12]. In thesePIR/Microwave combination detectors Pet-Immunefunctions that allow the sensor to ignore pets that weigh upto 40 pounds or 80 pounds. The IR sensor detectsmovement by thermal noise from the source which variesmuch more than threshold with an intrusion in the regionof the sensor.
This motion sensor detects IR energy changes inmultiple areas and then couples them for extremelyaccurate detections. Quad-zone Logic provides multi-segmented detection zones over the detection area. It isdesigned so that a human-size target will normally fill fourto eight zones [11], and this will cause an alarm to begenerated. Any smaller temperature change (i.e., small tomedium-size pets, rodents or moving curtains) onlyactivates one or two zones at the same time, creating amuch weaker detection signal.
Using a noise reduction current, the 40 40PIR/Microwave/Pet Immunity motion detector provideshigh-reliability performance against outside noise, such aselectromagnetic interference and especially noise fromfluorescent lights, thus solving a problem common tomicrowave motion sensors. Its Anti-Crosstalk Systemprevents interference from other microwaves if you havemore than one detector in the area.
In Motion artifacts, it is known that the signal at aninstantaneous time is likely to be corrupted by noise bursts,such as, for instance, a lightning flash (that could also benotoriously simulated by the intruder!). Dual sensors andcumulative signal processing would enable the detectionof such artifacts but at double the cost. If the motion isdetected without ambiguity, then the remote monitor willcall for operator intervention who would then switch on todirect video observation of the site.
With ultrasound motion sensors, we get two signals inquadrature. By taking a combination of these with theHilbert Transform, we can detect the motion direction. Leter, eq be the real and quadrature signals. Taking the HilbertTransform of the second, we get
H {eq} = eq’
Adding and subtracting to er, we get the forward andreverse direction time signals.
Therefore, we can transmit the signal er and eq’ as wellas the Hilbert transform of er and eq to the remote monitorfor evaluating the movement and assessing direction andfurther inferences. In this process, we can also detect errorsin the signal transmission, as we shall see in the nextparagraph, which is an added advantage of this technique.
But transmission of the signal through a medium, say,by some form of radio telephony, is beset with errors ofPCM data en-route. Then it means much more for thesemotion sensors than other direct sensors. A bit error in astream will intimate a sudden change which will beinterpreted as a movement caused by Doppler shift ofultrasound reflected. That is why some form of detectingerrors has also to be included.
6. ENCODING OF SIGNALS, NEW METHODS
The Signal s(t) that is picked from the sensor isusually digitized and the value of the same is stored in,say, N bits, for each sample.
The principle is to take an encoded version of thesignal, which uses the signal and its past samples, whiletransmitting to the distant monitoring site. This encoding isvery much like the encoding used for sending GSM signalswith convolution encoded data. The system of motionsensor along with this convolution encoding would be builtat the site, along with the hardware of the sensorelectronics. An example of such encoding by convolvingwith delayed signal components, would have a blockdiagram as shown below in a simple scheme with twodelays. Actually GSM uses a convolution with a largerconstraint length.
The signal is xn, in its nth sample; this is combined with x
n-2
in order to get yn
yn = xn EOR xn-2 ...(1)
Another bit that is transmitted is zn..
zn = x n EOR x n-1 EOR x n-2 ... (2)
At the receiving end the signals are combined by a simpleexclusive OR and we get the signal wn, which is same as xn-
1. Two bits are transmitted for each data bit, see Figure 2.The decoding process at the received monitor would detectand correct errors using Viterbi’s algorithm [12]. It ispossible to detect errors present and to some extent correctthe same.
328
International Journal on Advances in Intelligent Systems, vol 2 no 2&3, year 2009, http://www.iariajournals.org/intelligent_systems/

Figure 2 Sensor codes are also convolution encoded andtransmitted.
The scheme works alright because only detection oferrors is more important here rather than its correction.
There is yet another scheme which uses the improved(RS) Reed Solomon coding [13].This is useful forcorrecting bit errors in data by adding additional bits. Thescheme is very complex using Galois field numbers. Thishas provision only for correcting a small number of bits ina total stream. If n is the data bits, t is the number of errorsto be corrected, then n+2t bits will be total that would besent by the RS encoder. Usually t is very small fraction ofthe total n. For example, the RS (255,235) code has 8%(20/256) of the transmitted message as redundant and it
can correct ten errors. This scheme is very popular ingeneral communications. But here, for securityapplications, this has one drawback. It cannot tell if thedata is free from error. Though it can correct t errors in atotal of n+2t, if there were more than t, it will give a wrongresult. In security data, we can ignore a set of incorrectdata rather than having it fully corrected; but we should notbe informed with wrong data any time.
In the proposed method, the encoding does not suffersuch a limitation. Suppose for the signal s(t), afterdigitization, its Hilbert transform is calculated, this givesthe total signal as
s' = sr + jsh …(3)
Here, s’ denotes the transmitted signal comprising of thereal and imaginary parts of the signal. The imaginary partis obtained from the real part through the HilbertTransform. The same is done using digital data with theformula given in (5). The first term in the above equationis the actual signal and the second is the Hilbert transform.
Therefore, the data bits which are transmitted will bedouble the actual signal data.
Thus, each bit of sr is combined with the bit from sj
and a dibit is transmitted. This is having the same overheadof 1:2 like the convolutional encoder.
The property of the Hilbert transform is used at thereception data processor. If we take the Hilbert Transformof the latter signal sj, we get the negative of the real partsignal, giving
H{sj} = - sr …(4)
Figure 3a showing the data and parity symbols in the newlydeveloped H.T. coding.
Figure 3b Hilbert transform based data encoding for motionsensors
So, after collecting the data, its Hilbert Transformis also evaluated see Figure 3b.The N Hilbert transformvalues of N data are calculable directly as an (FIR) FiniteImpulse Response equation and the matrix of calculationsfor finding the transform can be shown [14] as
'11
Ny C yn nj nj
… (5)
The y is data (discrete form) and y’ the transform,while the C coefficients are a cyclic set of values,
Also, H {sr} = sj … (6)
Taking for example, 256 samples of data, the same numberof data which are obtained by transforming the former, willmake for total data of 512 samples, which is treated as acomposite data while sending through the channel. Inaddition, convolutional data can be used for additionalbasic bit error correction.
329
International Journal on Advances in Intelligent Systems, vol 2 no 2&3, year 2009, http://www.iariajournals.org/intelligent_systems/

Now, channel noise and interference will produce bit errorson the data, even after correction to the extent possible.Let us illustrate a sample data stream which is just a simplecontinuous analog signal. The same is digitized and aftercombining with the Hilbert transformed bits so that thetotal data stream has two bits for each actual sensor databit. Suppose, there are random locations of bit errors whichcause the value to differ in the received signal at certainsample locations. The signal and its transform are shown inFigure 5 (a-e).
Thus, a check is made on the above data bits byperforming digital Hilbert transform, the data part as wellas both the transform parts. From this, we calculate thesyndrome by the following equations.
[a] ae
The data a, gets corrupted as wrong data set ae.
[b] b
The other parity part b is the Hilbert Transform of a, whichalso gets corrupted. Denote H as the Hilbert transformoperator,
Evaluate [s] =H {H (b)} + [a] -Mean[a]
This [s] is the syndrome of the errors received in [ae].
This is plotted in Figure 4 for this sample data set.
Figure 4 a) Data set plotted, showing error point at (5).Figure 4 b) Showing Hilbert Transform of data as received.Figure 4 c) The syndrome shows exactly where errors haveoccurred.
Thus, it is inferred whether the data is free fromcorruption in the transmission channel or not. If theequation is non-zero at certain time slots, these time slotscould have erroneous data bits. Since some of the data slotsare known to be erroneous, ignoring these data bits, therest of the data is examined for a change from a previousdata set for detection of real motion effect. The sensorelectronics itself could be using an embedded controller, inwhich case, the output of the sensor could transmit acombined data set as per equation (3).
Figure 5 Showing methods of error detection and correction inthe Hilbert Transform coding Scheme.a). Sample segment of signal with bit errors.b). Hilbert Transform of original signal, as transmitted.c). Hilbert Transform of received signal part.d). Hilbert Transform component of the received signal.e). Transform of corrected Hilbert transform, the negative of
signal itself.
Thus, by a suitable encoding technique, it contributes tothe overall system reliability.
7. INTRUDER INTERVENTION – IMAGE DATA
Information is often transmitted with a view thatsecurity allows a transmitter to send a message to areceiver without the message being detected by an intruderor be disturbed from reception by jamming by a purposelyintroduced noise signal. Today, any of the mobilecommunication receivers can be inactivated by properlyjamming the select region with high power jammingtechniques [15]. A portable cell phone jammer featured byuniversal and handheld design, could block worldwide cellphone networks within 0.5-10meters, including
330
International Journal on Advances in Intelligent Systems, vol 2 no 2&3, year 2009, http://www.iariajournals.org/intelligent_systems/
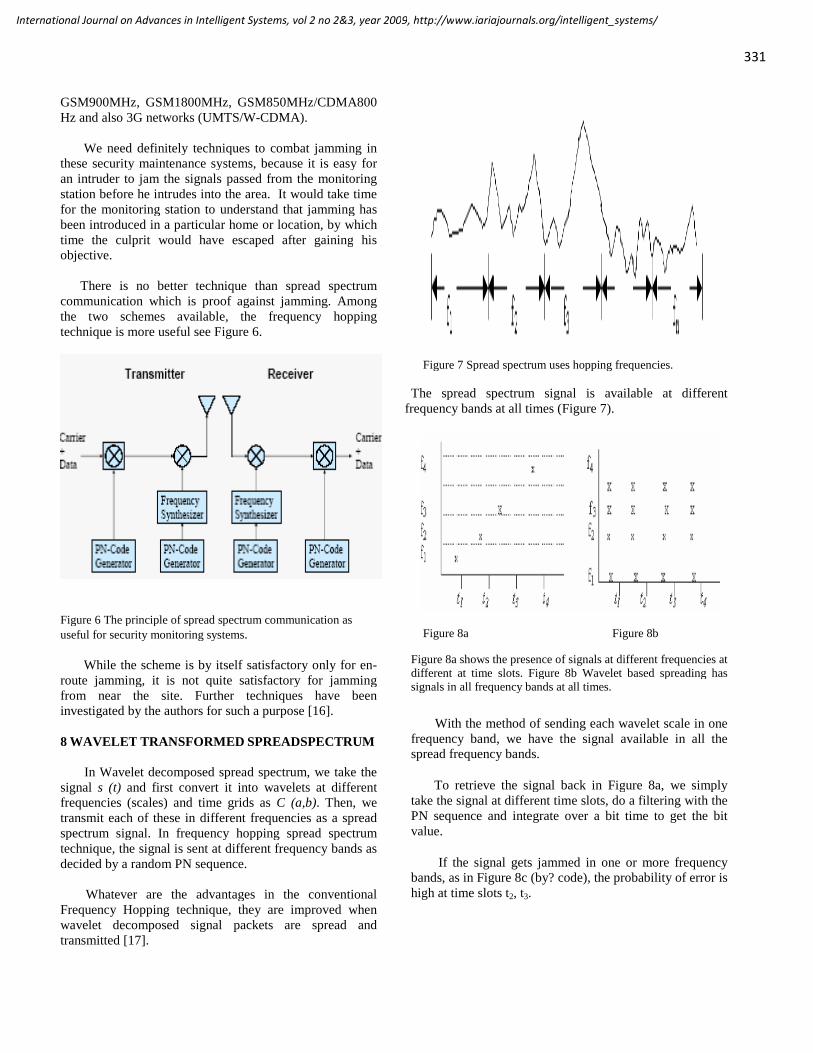
GSM900MHz, GSM1800MHz, GSM850MHz/CDMA800Hz and also 3G networks (UMTS/W-CDMA).
We need definitely techniques to combat jamming inthese security maintenance systems, because it is easy foran intruder to jam the signals passed from the monitoringstation before he intrudes into the area. It would take timefor the monitoring station to understand that jamming hasbeen introduced in a particular home or location, by whichtime the culprit would have escaped after gaining hisobjective.
There is no better technique than spread spectrumcommunication which is proof against jamming. Amongthe two schemes available, the frequency hoppingtechnique is more useful see Figure 6.
Figure 6 The principle of spread spectrum communication asuseful for security monitoring systems.
While the scheme is by itself satisfactory only for en-route jamming, it is not quite satisfactory for jammingfrom near the site. Further techniques have beeninvestigated by the authors for such a purpose [16].
8 WAVELET TRANSFORMED SPREADSPECTRUM
In Wavelet decomposed spread spectrum, we take thesignal s (t) and first convert it into wavelets at differentfrequencies (scales) and time grids as C (a,b). Then, wetransmit each of these in different frequencies as a spreadspectrum signal. In frequency hopping spread spectrumtechnique, the signal is sent at different frequency bands asdecided by a random PN sequence.
Whatever are the advantages in the conventionalFrequency Hopping technique, they are improved whenwavelet decomposed signal packets are spread andtransmitted [17].
Figure 7 Spread spectrum uses hopping frequencies.
The spread spectrum signal is available at differentfrequency bands at all times (Figure 7).
Figure 8a Figure 8b
Figure 8a shows the presence of signals at different frequencies atdifferent at time slots. Figure 8b Wavelet based spreading hassignals in all frequency bands at all times.
With the method of sending each wavelet scale in onefrequency band, we have the signal available in all thespread frequency bands.
To retrieve the signal back in Figure 8a, we simplytake the signal at different time slots, do a filtering with thePN sequence and integrate over a bit time to get the bitvalue.
If the signal gets jammed in one or more frequencybands, as in Figure 8c (by? code), the probability of error ishigh at time slots t2, t3.
331
International Journal on Advances in Intelligent Systems, vol 2 no 2&3, year 2009, http://www.iariajournals.org/intelligent_systems/

Figure 8c Figure 8d
In Figure 8c The time slots t2, t3 are noisy signals caused byjamming. In Figure 8d here, with wavelets at each band, all timeslots are noisy in f2, f3.
But, in (d), when two bands (f1, f2) are noisy andjammed, then at all times we get only noisy signals at thetwo bands f1 and f2.
However, the signal is only partly contained in thesebands. When we do the wavelet reconstruction of thesignal at the t1 time slot, we get the erroneous output as
… (8)
where the dwt (a,b) corresponds to the (discrete waveletdecomposed ) signal at the band a at all time slots (b) andN(b) denotes the noise time signal at the time slot b, whilethe function ψ(a,b) is the wavelet function chosen.
8.1 IMAGE DATA FROM LOCATION
The data of an image is coded and sent usually. Therewas a jamming as shown in Figure 10b, while Figure 10ashows the actual image.
In the method of wavelet based spread spectrum, theimage is converted into 2-D wavelet data. The waveletcoefficients for the first level are denoted as:
Ca1, Ch1, Cv1 and Cd1.
These are the wavelet coefficients known asapproximate coefficients and detailed coefficients. Ca1 isthe first level approximate coefficient.Ch1 is the horizontaldetailed coefficient; Cv1 the vertical detailed and CdI thediagonal detailed coefficient.
If the image is 256 256, the first level coefficientsabove will each be of size 128 128.
Then, a second level wavelet 2-D DWT decomposesthe same into a set of further four coefficients
Ca2, Ch2, Cv2, Cd2.
Note that the Ca2 is the second level approximateCoefficient; the others are second level detailedcoefficients. The Ca1 is not necessary for reconstruction, ifthe above four are given.
Thus, the picture or image of 2D DWT coefficients occupya matrix of size 256 256 by stacking the elements of theabove 7 coefficient matrices.
Figure 9 Wavelet coefficients for site image data shown inSegments.
The above matrix is also the same size as the originalimage for some of the wavelet transforms such as db1 orHaar, but its size will be slightly larger for other wavelets.
The data from the above matrix is got conveniently bytacking the row data and column data into a linear vector.This vector is 65536 1. This vector is what is fed to thecommunication receiver.
Suppose the jamming occurs in this data stream, thenwhat would the above matrix look like (?). It will bejammed at the exact locations as shown in Figure 10b. ThusFigure 10c shows this.
Then, this data is used by the receiving communicationsystem. It converts the stream of data thus jammed. Then,the image is got by an inverse 2-D DWT process byequation (8). This gives the matrix image of reconstructeddata, though jammed en route.
This image is decoded and shown in Figure 9d Thereis evidently loss of detail due to smear visible at a fewlocations in this, but not so many as in the image jammedby the direct jamming as in Figure 10b.
The information as to how much improvement in theprocess of reconstruction against jamming is given bysumming up the pixel errors for the entire image. Thus, if
332
International Journal on Advances in Intelligent Systems, vol 2 no 2&3, year 2009, http://www.iariajournals.org/intelligent_systems/

the image original and the image got after jamming shownin Figure 10b is considered, we get an error. But if we dothe same with the Figure 10d image, we get error less thanthe first one.
The ratio between the two errors is varying between 7to 14 for several images and several kinds of patterns ofjamming.
This method, therefore, combines data encryption(because wavelet information is not visible as anymeaningful image) as well as error detection. If an imageis in error, it might indicate an intruder for instance.Erroneous image received might be subject to falsealarming. Here, we can identify errors in data clearly,while maintaining image secrecy [18].
Figure 10a (Top left) Shows original image.Figure 10b (Top right) Shows erroneously received imageFigure 10c (Bottom left) WaveletsFigure 10d (Bottom right) reconstructed image, showing that datahad met with errors.
9. CONCLUSION AND SUGGESTIONS
Data collection from site [19] and transmission forremote monitoring were discussed. Among the severalsensors, a method for dealing with motion Doppler sensorswas described.
Also, data communication with encoding using theHilbert transform was considered for detection of errors indata. Clear detection of a motion event due to any intrusionis one of the major criteria in intruder detection. The
method based on the Hilbert transform encoding wasshown to be better in several respects, compared to theReed Solomon type of encoding.
Data of images are better handled by wavelets. Spreadspectrum communication which is the choice for remotesecurity management can benefit from sending images inwavelet coefficient encoding. This not only does somecompression but also provides secure image decoding anderror detection.
Security system remote monitoring has been discussedin the context of protecting a living environment so far.Other environments include plant and process units infactories.
In process plant units, data management and controlschemes are involved for operating the several plant itemslike motors, compressors, boiler, reaction vessels and soon. In mechanical plant, there would be robotic assemblylines handling jigs and fixtures. In these situations, securityaspects are concerned with data mismanagement byintruders.
With computer based controls all over, the computerdata are fed to process units through PLC modules to fixthe set values of operating levels of each equipment. It ispossible to add units for remote transmission of processvariables from every such unit, such as the temperature,pressure, concentration, flow rate etc to the remote stationwith the plant Identifier code juxtaposed at periodicintervals.
Intrusion herein can be done with undesirableintentions to mal-operate the plant by altering the setvalues or process variable data. Since most plants of thesekinds work under a bus scheme like the ProfibusR, securityaspects should be incorporated in these schemes of plantcontrol, with remote monitoring of the data. Schemes forkey encrypted handling in such fieldbus control arediscussed in [20]. The method uses one of the bits in theprotocol to provide for such encryption.
As to the pros and cons of totally local management ofsecurity problems versus totally remote monitoring, thereare several issues to be thought of. Wherever a securitysite is fully managed by local system, the problems ofcommunication and jamming by intrusion is avoided.Remote monitoring helps in assessing the integrity of thesecurity system by periodic checks on its inside hardware,which is not feasible with all local monitoring. Remotemonitoring is ideal for multiple sites as the cost isdistributed among them. Security of several plants locatedat different sites and handled by a single remotelymonitored system is helpful for interactive managementamong the plants.
333
International Journal on Advances in Intelligent Systems, vol 2 no 2&3, year 2009, http://www.iariajournals.org/intelligent_systems/

There is good scope for development of sensors withbuilt in remote transmission through some form of RFcommunication with encryption. There is likewise a needfor separately developing communication protocols similarto the ones employed for cellular telephony particularly forprocess plant management. Emphasis can be made on errorfree data communication even with greater redundancythan used in general communication schemes for absoluteerror free data collection, which is absolutely important inany security system management.
Future systems should examine and standardizesensors free from artifacts and develop methods forcommunication. Emphasis must be on detection of errorsand possibly correcting them to the extent possible by allknown methods of redundant data encoding.
References
[1]. R.Hariprakash, G.Venkat Ramu, T. Rajakumari, S.Ananthi, and K. Padmanabhan: “Some Problems &Methods for Remotely Controllable Automatic HomeSecurity Systems” presented at ICSNC.2008.41,pp. 400-403 , 978-0-7695-3371-1/08©2008 IEEE.
[2]. Security systems and Devices “, controlelectronic.com[3]. x10.com/security Systems[4]. Abu-El-Quran, A. R., and Goubran R. A: “Security
Monitoring Using Microphone Arrays and AudioClassification”, Proc. IEEE Conf., IMTC 2005 pp.1144-1148, May 2005.
[5]. www.pulseliving.com- Advanced KNX/EIB and Z-Wave automation for homes and hotels.
[6]. Sony AIR-SA20PK Wireless iPod Whole-House S-AIR Audio System smarthome.com
[7]. K. Holford, “Microwave intruder detection”, WirelessWorld, Vol.86, pp. 34-40.
[8]. Rob Siegel, “Land mine Detection”, IEEEInstrumentation and Measurement Magazine, Vol.5(4), pp. 22-27, 2002.
[9]. B. Moshiri, A. M. Khalkhali, and H. R Momeni,:“Designing a home security system using sensor datafusion with DST and DSmT methods”, Proc. of the10th IEEE Conf. on Information Fusion, July 2007,pp. 1-6, ISBN: 978-0-662-45804-3.
[10]. “GSM phone for remote control”, Elektor India,March 2002.
[11]. “Pet-Immune IR/Microwave Motion DetectorEliminates False Alarms” Optex Product No.: MX-40PI, UPC: 788924082486.
[12]. R.J.Mc. Eliece, R.B Ash and C.Ash, “Convolutionencoding and Viterbi’s algorithm”, Chapter-6,Introduction to .Discrete Mathematic, McGraw-HillIntl., 1989.
[13]. M. Sudan, “Decoding of Reed Solomon codes beyondthe error correction bound,” Jour. of Complexity, vol.13, pp. 180–193, 1997.
[14]. Cizek.V:“Discrete Hilbert Transform”, I.E.E.E. Trans.on audio and Electroacoustics”, Vol.18(4),pp. 340-44,1970.
[15]. blog.tayx.co.uk/2008/03/10/cell-phone-jammer.pp.682[16]. T. Rajakumari, S. Ananthi and K.Visalakshi, “Use of
Hilbert Transform Data encoding for spread spectrumcommunications”, Presented at the Intl. Conference onAdvanced Telecommunications , (AICT2007)Organized by IEEE at Mauritius , May 13-19, 2007
[17]. Sonia Grgic, Mislav Grgic and Branka Z-Cihlar,“Analysis of image compression using Wavelets,”IEEE Trans. Indl. Elec. 48(3), 2001.
[18]. S. Ananthi, R. Hariprakash, V.Vidya Devi and K.Padmanabhan “Spread Spectrum CommunicationUsing Wavelets of Signal for More Security”, Proc.of the Advanced International conf. onTelecommunications, (AICT/ICIW2006), pp. 87,19-25 Feb’ 06 at Guadelope, (0-7695-2522-9/06 © 2006IEEE).
[19]. Texas Instruments Data manual: “Converters - Analogto Digital (ADC) 12Bit 50KSPS I2C Lo-Power 8ChMUX Converters”, SBAS181C – Nov’ 01 - RevisedMar 2005.
[20]. P.Swaminathan, K.Padmanabhan, S. Ananthi andPradeep.R: “The Secure Fieldbus (SecFB) protocol --Network communication security for secure industrialprocess control”, Proc. of the TENCON 2006,Hongkong, pp. 1-4, 1-4244-0548-3/06©2006IEEE.
334
International Journal on Advances in Intelligent Systems, vol 2 no 2&3, year 2009, http://www.iariajournals.org/intelligent_systems/
A Component-Based Approach Based on High-Level Petri Nets for ModelingDistributed Control Systems
Aladdin MasriDepartment of Computer Engineering
An-Najah National UniversityNablus, Palestine
e-mail: [email protected]
Thomas Bourdeaud’hui Armand ToguyeniLAGIS – CNRS UMR 8146
Ecole Centrale de Lille59651 Villeneuve d’ASCQ, France
e-mail: [email protected],[email protected]
Abstract—The evaluation of using distributed systems DS inplace of centralized systems has introduced the distribution ofmany services and applications over the network. However,this distribution has produced some problems such as theimpacts of underlying networking protocols over thedistributed applications and the control of the resources. Inthis paper we are interested particularly in manufacturingsystems. Manufacturing systems are a class of distributeddiscrete event systems. These systems use the local industrialnetwork to control the system. Several approaches areproposed to model such systems. However, most of theseapproaches are centralized models that do not take intoaccount the underlying network. In this context, we proposethe modeling of the distributed services and the underlyingprotocols with High-Level Petri Nets. Since the model is large,complex and therefore difficult to modify, we propose acomponent-based modeling approach. This approach allowsthe reuse of ready-to-use components in new models, whichreduces the cost of development. To illustrate our approachand its reuse capabilities, we will implement it to model thelink layer protocols of the norms IEEE 802.11b and IEEE802.3.
Keywords-communication protocols; distributed systems;modeling; component-based; Petri nets;
I. INTRODUCTION
Distributed systems [1] [2] are increasing with thedevelopment of networks. The development of computernetworks has enabled the emergence of new applicationsbenefiting from the power and flexibility offered by thedistribution of their functions on different computers. Weare interested particularly in this work on the networkedcontrol of manufacturing systems. Manufacturing systemsare a class of discrete event systems whose elements areinteracting together to build products or to perform services.The concept of flexible manufacturing systems FMS hasbeen introduced to develop new manufacturing systems ableto produce small or average series of products.
Modeling such systems is very important to verify someproperties, especially performance issues. In the literature,many models have been proposed to model manufacturingsystems [3] [4] [5]. However, the classical modelingparadigm is generally based on a centralized point of view.Indeed, this kind of modeling does not take into account the
fact that the system will be distributed when implementedover different machines, sensors, actors, etc. So, theproperties obtained at the design stage are not necessarilyguaranteed at the implementation stage.
In addition, the proposed models do not take intoaccount the underlying network and protocols in terms ofperformance and information exchange. The behavior anddesign of manufacturing systems are affected by theunderlying network features: performance, mobility,availability and quality of service characteristics.
A way to overcome such problems is to model thesesystems in a distributed way. A distributed system-modeloffers means to describe precisely all interesting forms ofunpredictability as they occur. It takes into account eachpart of the system, available resources, and system changestogether with the underlying network. Once this model ismade, its implementation is easier since it has the samecharacteristic as the desired system. Nevertheless, thesesystems are complex: they show massive distribution, highdynamics, and high heterogeneity. Therefore, it is necessaryto model these systems in a way that provides higher degreeof confidence and rigorous solutions.
To cope with this challenge, we propose the use of acomponent-based methodology which is consistent with theprinciple of distributed systems in which elements arereusable and composable units of code. The component-based approach uses generic, hierarchical and modularmeans to design and analyze systems. It shows that thesystem model can be assembled from components workingtogether and the designer needs only to identify the goodcomponents that offer suitable services with regard toapplications requirements. This methodology allows thereusability and genericity of the components which reducesthe cost of the systems development.
In this paper, we propose to model these systems withHigh-Level Petri Nets which is a powerful tool particularlydedicated to concurrent and distributed formalism, allowingto model both protocol and service components. The workpresented in this paper is part of a larger approach on thedesign of distributed systems by the evaluation, in thedesign phase, of the impact of network protocols on thedistribution of the functions of a distributed system ondifferent computers [6] [7] [8].
335
International Journal on Advances in Intelligent Systems, vol 2 no 2&3, year 2009, http://www.iariajournals.org/intelligent_systems/
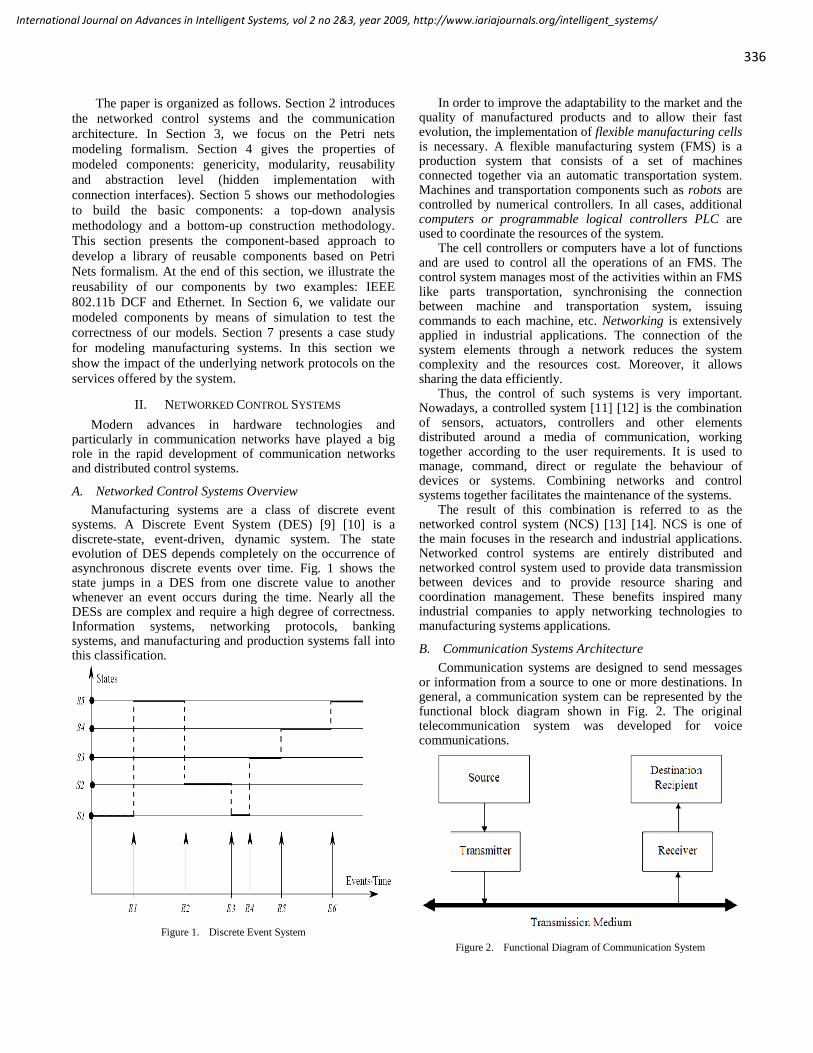
The paper is organized as follows. Section 2 introducesthe networked control systems and the communicationarchitecture. In Section 3, we focus on the Petri netsmodeling formalism. Section 4 gives the properties ofmodeled components: genericity, modularity, reusabilityand abstraction level (hidden implementation withconnection interfaces). Section 5 shows our methodologiesto build the basic components: a top-down analysismethodology and a bottom-up construction methodology.This section presents the component-based approach todevelop a library of reusable components based on PetriNets formalism. At the end of this section, we illustrate thereusability of our components by two examples: IEEE802.11b DCF and Ethernet. In Section 6, we validate ourmodeled components by means of simulation to test thecorrectness of our models. Section 7 presents a case studyfor modeling manufacturing systems. In this section weshow the impact of the underlying network protocols on theservices offered by the system.
II. NETWORKED CONTROL SYSTEMS
Modern advances in hardware technologies andparticularly in communication networks have played a bigrole in the rapid development of communication networksand distributed control systems.
A. Networked Control Systems Overview
Manufacturing systems are a class of discrete eventsystems. A Discrete Event System (DES) [9] [10] is adiscrete-state, event-driven, dynamic system. The stateevolution of DES depends completely on the occurrence ofasynchronous discrete events over time. Fig. 1 shows thestate jumps in a DES from one discrete value to anotherwhenever an event occurs during the time. Nearly all theDESs are complex and require a high degree of correctness.Information systems, networking protocols, bankingsystems, and manufacturing and production systems fall intothis classification.
Figure 1. Discrete Event System
In order to improve the adaptability to the market and thequality of manufactured products and to allow their fastevolution, the implementation of flexible manufacturing cellsis necessary. A flexible manufacturing system (FMS) is aproduction system that consists of a set of machinesconnected together via an automatic transportation system.Machines and transportation components such as robots arecontrolled by numerical controllers. In all cases, additionalcomputers or programmable logical controllers PLC areused to coordinate the resources of the system.
The cell controllers or computers have a lot of functionsand are used to control all the operations of an FMS. Thecontrol system manages most of the activities within an FMSlike parts transportation, synchronising the connectionbetween machine and transportation system, issuingcommands to each machine, etc. Networking is extensivelyapplied in industrial applications. The connection of thesystem elements through a network reduces the systemcomplexity and the resources cost. Moreover, it allowssharing the data efficiently.
Thus, the control of such systems is very important.Nowadays, a controlled system [11] [12] is the combinationof sensors, actuators, controllers and other elementsdistributed around a media of communication, workingtogether according to the user requirements. It is used tomanage, command, direct or regulate the behaviour ofdevices or systems. Combining networks and controlsystems together facilitates the maintenance of the systems.
The result of this combination is referred to as thenetworked control system (NCS) [13] [14]. NCS is one ofthe main focuses in the research and industrial applications.Networked control systems are entirely distributed andnetworked control system used to provide data transmissionbetween devices and to provide resource sharing andcoordination management. These benefits inspired manyindustrial companies to apply networking technologies tomanufacturing systems applications.
B. Communication Systems Architecture
Communication systems are designed to send messagesor information from a source to one or more destinations. Ingeneral, a communication system can be represented by thefunctional block diagram shown in Fig. 2. The originaltelecommunication system was developed for voicecommunications.
Figure 2. Functional Diagram of Communication System
336
International Journal on Advances in Intelligent Systems, vol 2 no 2&3, year 2009, http://www.iariajournals.org/intelligent_systems/

Today communication networks include all types ofvoice, video and data communication over copper wire,optical fibers or wireless medium. Networks [15] [16] areorganized into a hierarchy of layers where each layer has awell defined function and operates under specific protocols.The number of layers can vary from one network referencemodel to another but the goal of a layered structure remainscommon to all models. OSI model [17] is structured in aseries of 7 layers, while the TCP/IP model includes onlyfour layers, Fig. 3.
Figure 3. OSI and TCP/IP Reference Models
Each layer consists of hardware or software elementsand provides a service to the layer immediately above it.With the advent of Internet, an increasing number ofcomputer networks are now connected.
III. MODELING FORMALISM
Modeling communication protocols and distributedsystems is not new. Several formalisms, simulators andmodeling tools exist. However, one of the main challenges inmodeling nowadays is establishing a precise relationshipwithin a wide range of available modeling formalisms andcomparing their descriptive power and verificationcapabilities. Thus, we propose to unify the modeling of both,protocols and distributed systems, in one formalism. In thisway, our work eliminates the need to transform oneformalism to another one and so facilitates the modelingprocess. Since time is an important feature of communicationprotocols, it is necessary to choose a formalism that allows toproperly model the temporal behavior of distributed systems.
A. Formal Modeling
The Formal modeling consists of introducing systemrequirements (cost, security, manufacturing facilities,maintenance, evaluation, reliability and availability) into asmall fragment. This introduction of the system requirementsmust be inside the chosen mathematical framework for themodeling process. The main purpose of a formal modeling isto clarify largely inexplicit information. During theconstruction of a formal model, many ambiguities must beremoved. This consists, in general, of taking a decision. Agood model is initially a model that one can understandeasily and which can be explained simply. The procedures ofverification must be simple and convincing. Several formaltools exist. However, unified modeling language UML,timed automata TA and Petri nets are some of the most usedmodeling formalisms that take into account time factor.
UML [18] is a well-defined, powerful formalism.However, UML lacks one important feature to achieve thedesired needs since it has not a formal semantic and hence itis not possible to directly verify timing requirements whichare necessary in communication systems. Timed automataare mainly used to model temporal applications and are not ageneral purpose formalism.
On the contrary, Petri nets are widely used for modelingconcurrent and distributed systems. Many extensions andtools are available, mainly for time, identification of tokensand stochastic issues which are very important issues incommunication protocols and services. So, the modeling andintegration of all system elements (services and protocols)will be easier (no need to make a transformation). Table 1shows the most important criteria that we used to choose themodeling formalism.
TABLE I. MODELING FORMALISM
Formalism UML TA Petri nets
Method Semi-formal formal formal
Time modeling Recently Yes Yes
Application General purposes Hard timing General purposes
In computer science Petri Nets are used for modeling agreat number of hardware and software systems, and variousapplications in computer networks. A special advantage ofPetri Nets is their graphical notation which reduces the timeto learn Petri nets. This formalism has different extensionsand tools.
Communication protocols have some specificcharacteristics and requirements. Thus, the tool selectioncriteria depends on the following requirements:
Time: Communication protocols are real-timedemanding applications. Transmitting and receivingdata, accessing the channel, backoff procedure andother needs depend on time. Time Petri nets allowthis feature.
Headers and Data fields: Data packets have manyfields which may be modeled as tuples. This featureis supported in high-level Petri nets.
337
International Journal on Advances in Intelligent Systems, vol 2 no 2&3, year 2009, http://www.iariajournals.org/intelligent_systems/

Probabilistic and Stochastic Properties: Messagesexchanged over the network may be lost orperturbed, bit rate error is a function of noise, etc.The representation of such features can be made bystochastic functions. Stochastic Petri nets are apowerful model to handle such characteristics.
Sent and Received Packets: Messages exchangedover the network require packet identification.Colored Petri nets have been proposed to satisfy thisneed.
The previous requirements have led us to use the highlevel Petri nets that combine all the aspects and power of theother extensions in one modeling tool.
B. Modeling FMS with Petri nets
Different modeling formalisms are used to model FMS.Petri nets and Automata theory are of the most usedtechniques to describe DES. Peterson [19] has introducedPetri nets to model and analyze the manufacturing systems.Other works like [20] have also proposed to model andanalyze controllable DES. Later, Lin et al. [21] hasintroduced a decentralized control model. Zamaï et al. [22]has presented a hierarchical and modular architecture forreal-time control and monitoring of FMS. However, newestmodeling approaches are diverting towards the distributedmodeling for the manufacturing systems [23].
Petri nets have been proposed by C. A. Petri in 1962 inhis PhD thesis “Communications with Automata” [24]. Petrinets are a mathematical and graphical tool used formodeling, formal analysis, and design of different systemslike computer networks, process control plants,communication protocols, production systems,asynchronous, distributed, parallel, and stochastic systems;mainly discrete event systems.
As a graphical tool, Petri nets provide a powerfulcommunication medium between the user and the designer.Instead of using ambiguous textual description, mathematicalnotation difficult to understand or complex requirements,Petri nets can be represented graphically. The graphicalrepresentation makes also Petri nets intuitively veryappealing.
A Petri net graph contains two types of nodes: Places “p”and Transitions “t”. Graphically, places are represented bycircles, while transitions are represented by rectangles,Fig. 4. Places and transitions are directly connected by arcsfrom places to transitions and from transitions to places. Aplace P0 is considered as an input place of a transition t ifthere is an arc from P0 to t. A place P1 is considered asoutput place of a transition t if there is an arc from t to P1.
Places can contain tokens represented by dots. Thesetokens are the marking of places. The initial marking ofplaces is represented in the initial marking vector m0. Thegraphical presentation of Petri nets shows the staticproperties of the systems, but they also have dynamicproperties resulting from the marking of a Petri net.
As a mathematical tool, a Petri net model can be describedby a set of linear algebraic equations, linear matrix algebra,or other mathematical models reflecting the behavior of thesystem. This allows performing a formal analysis of the
model and a formal check of the properties related to thebehavior of the system: deadlock, concurrent operations,repetitive activities, etc.
Figure 4. Discrete Event System
C. Proporties of our High-Level Petri Nets
In this subsection we will give a brief definition on thedesired high-level Petri nets. This definition is not far fromthe definition of colored Petri nets [25]. However, we add tothis definition a time notation.
Definition: A High-Level Petri Net is a tuple N= (P, T,A, m0, Σ, Λ, G, E, D) where: Σ is a finite set of non-empty color sets. Λ is a color function, Λ: P → Σ G is a guard function, G: T → Boolean expression,
where:t T: [Type (G(t)) = Bexpr Type (Var (G(t))) Σ], where:Type is the color type of the guard function,Bexpr is a Boolean functionVar is the variables of the guard function.
E is an arc expression function, E: A→E(a), where: a A: [Type(E(a)) = Λ(p(a)) Type (Var (E(a))) Σ], p(a) is the place of arc a.
D is a delay function, D: E → TS, where TS is a delay associated to the arc inscription with theannotation symbol “@”.
The arc expression function can contain any sign and/ormathematical or logical functions, such as programminglanguage expressions. The delay function can be associatedto both output arcs (from places to transitions) and inputarcs (from transitions to places).
IV. COMPONENET-BASED MODELING
Component-based engineering [26] has a hugeimportance for rigorous system design methodologies. It isbased on the statement which is common to all engineeringdisciplines: complex systems can be obtained by assemblingcomponents, ideally commercial-off-the-shelf (COTS) [27].Reusability and extensibility are key factors that contributeto this success and importance. Component-baseddevelopment aims at decreasing development time and costsby creating applications from reusable, easily connectibleand exchangeable building blocks.
In component-based engineering research literature,several approaches [28] [29] have focused on the aspects ofthe development of components. However, reusing available,ready-to-use components decreases time-to-market for newsystems and applications. This may be done by selecting theappropriate components from the available components
338
International Journal on Advances in Intelligent Systems, vol 2 no 2&3, year 2009, http://www.iariajournals.org/intelligent_systems/
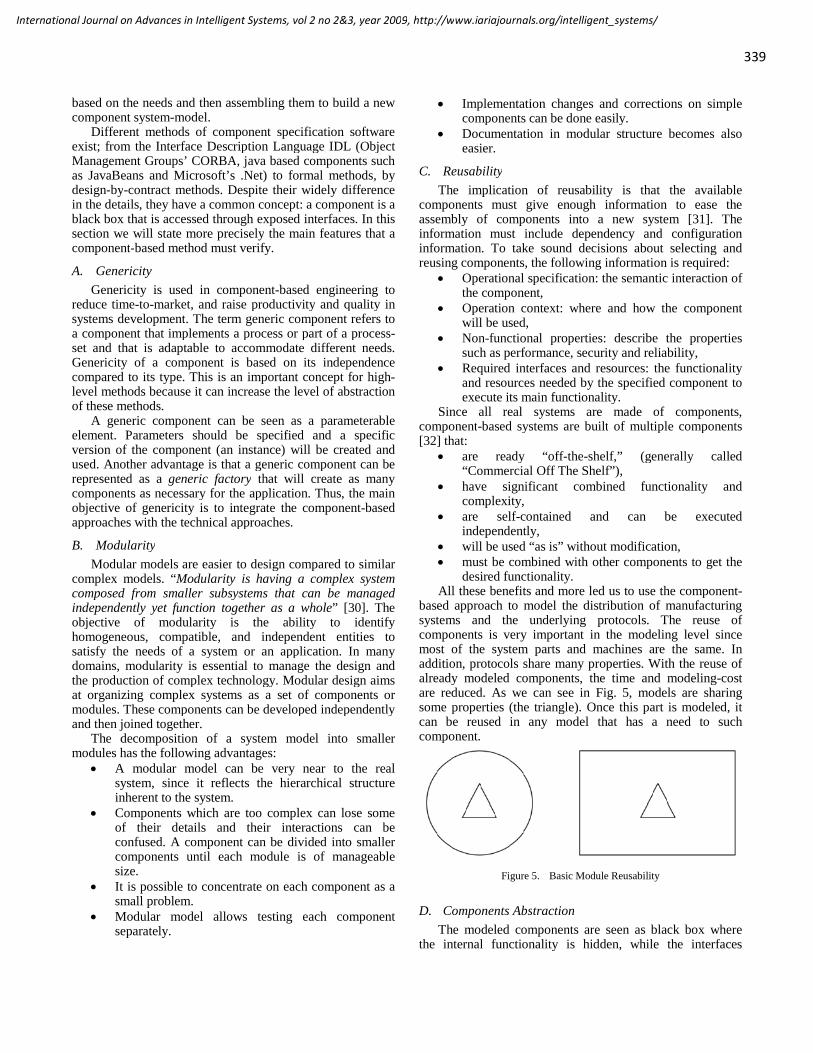
based on the needs and then assembling them to build a newcomponent system-model.
Different methods of component specification softwareexist; from the Interface Description Language IDL (ObjectManagement Groups’ CORBA, java based components suchas JavaBeans and Microsoft’s .Net) to formal methods, bydesign-by-contract methods. Despite their widely differencein the details, they have a common concept: a component is ablack box that is accessed through exposed interfaces. In thissection we will state more precisely the main features that acomponent-based method must verify.
A. Genericity
Genericity is used in component-based engineering toreduce time-to-market, and raise productivity and quality insystems development. The term generic component refers toa component that implements a process or part of a process-set and that is adaptable to accommodate different needs.Genericity of a component is based on its independencecompared to its type. This is an important concept for high-level methods because it can increase the level of abstractionof these methods.
A generic component can be seen as a parameterableelement. Parameters should be specified and a specificversion of the component (an instance) will be created andused. Another advantage is that a generic component can berepresented as a generic factory that will create as manycomponents as necessary for the application. Thus, the mainobjective of genericity is to integrate the component-basedapproaches with the technical approaches.
B. Modularity
Modular models are easier to design compared to similarcomplex models. “Modularity is having a complex systemcomposed from smaller subsystems that can be managedindependently yet function together as a whole” [30]. Theobjective of modularity is the ability to identifyhomogeneous, compatible, and independent entities tosatisfy the needs of a system or an application. In manydomains, modularity is essential to manage the design andthe production of complex technology. Modular design aimsat organizing complex systems as a set of components ormodules. These components can be developed independentlyand then joined together.
The decomposition of a system model into smallermodules has the following advantages:
A modular model can be very near to the realsystem, since it reflects the hierarchical structureinherent to the system.
Components which are too complex can lose someof their details and their interactions can beconfused. A component can be divided into smallercomponents until each module is of manageablesize.
It is possible to concentrate on each component as asmall problem.
Modular model allows testing each componentseparately.
Implementation changes and corrections on simplecomponents can be done easily.
Documentation in modular structure becomes alsoeasier.
C. Reusability
The implication of reusability is that the availablecomponents must give enough information to ease theassembly of components into a new system [31]. Theinformation must include dependency and configurationinformation. To take sound decisions about selecting andreusing components, the following information is required:
Operational specification: the semantic interaction ofthe component,
Operation context: where and how the componentwill be used,
Non-functional properties: describe the propertiessuch as performance, security and reliability,
Required interfaces and resources: the functionalityand resources needed by the specified component toexecute its main functionality.
Since all real systems are made of components,component-based systems are built of multiple components[32] that:
are ready “off-the-shelf,” (generally called“Commercial Off The Shelf”),
have significant combined functionality andcomplexity,
are self-contained and can be executedindependently,
will be used “as is” without modification, must be combined with other components to get the
desired functionality.All these benefits and more led us to use the component-
based approach to model the distribution of manufacturingsystems and the underlying protocols. The reuse ofcomponents is very important in the modeling level sincemost of the system parts and machines are the same. Inaddition, protocols share many properties. With the reuse ofalready modeled components, the time and modeling-costare reduced. As we can see in Fig. 5, models are sharingsome properties (the triangle). Once this part is modeled, itcan be reused in any model that has a need to suchcomponent.
Figure 5. Basic Module Reusability
D. Components Abstraction
The modeled components are seen as black box wherethe internal functionality is hidden, while the interfaces
339
International Journal on Advances in Intelligent Systems, vol 2 no 2&3, year 2009, http://www.iariajournals.org/intelligent_systems/
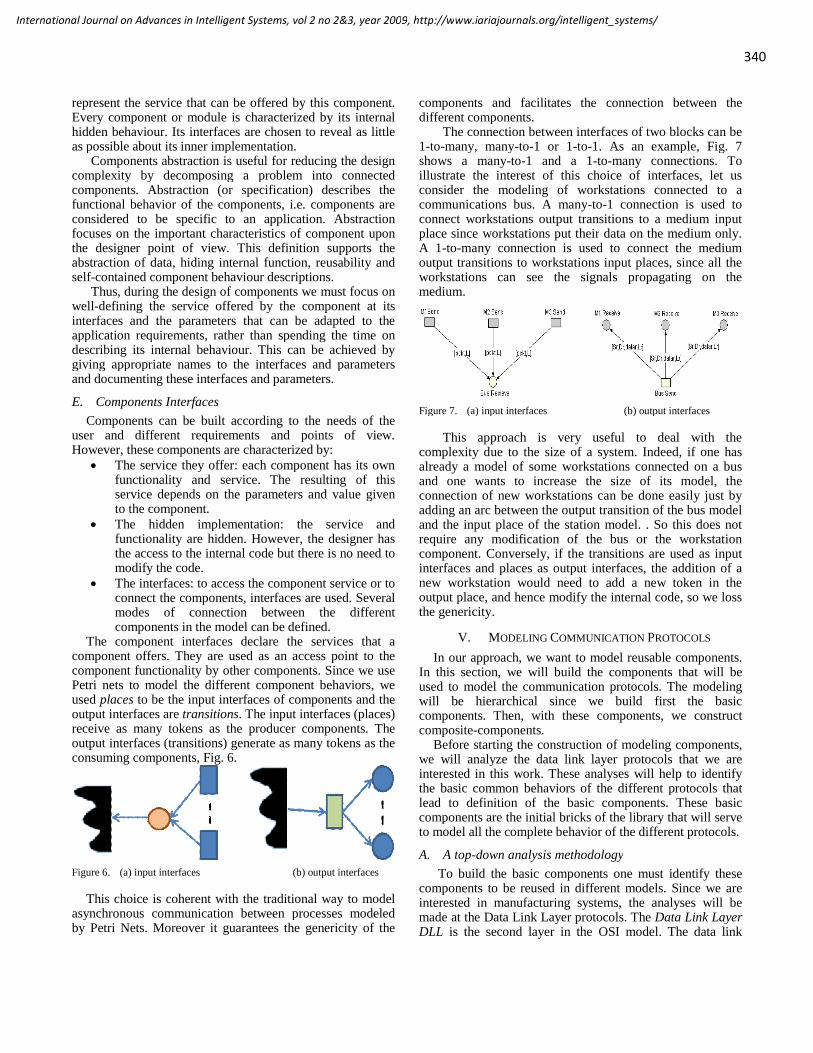
represent the service that can be offered by this component.Every component or module is characterized by its internalhidden behaviour. Its interfaces are chosen to reveal as littleas possible about its inner implementation.
Components abstraction is useful for reducing the designcomplexity by decomposing a problem into connectedcomponents. Abstraction (or specification) describes thefunctional behavior of the components, i.e. components areconsidered to be specific to an application. Abstractionfocuses on the important characteristics of component uponthe designer point of view. This definition supports theabstraction of data, hiding internal function, reusability andself-contained component behaviour descriptions.
Thus, during the design of components we must focus onwell-defining the service offered by the component at itsinterfaces and the parameters that can be adapted to theapplication requirements, rather than spending the time ondescribing its internal behaviour. This can be achieved bygiving appropriate names to the interfaces and parametersand documenting these interfaces and parameters.
E. Components Interfaces
Components can be built according to the needs of theuser and different requirements and points of view.However, these components are characterized by:
The service they offer: each component has its ownfunctionality and service. The resulting of thisservice depends on the parameters and value givento the component.
The hidden implementation: the service andfunctionality are hidden. However, the designer hasthe access to the internal code but there is no need tomodify the code.
The interfaces: to access the component service or toconnect the components, interfaces are used. Severalmodes of connection between the differentcomponents in the model can be defined.
The component interfaces declare the services that acomponent offers. They are used as an access point to thecomponent functionality by other components. Since we usePetri nets to model the different component behaviors, weused places to be the input interfaces of components and theoutput interfaces are transitions. The input interfaces (places)receive as many tokens as the producer components. Theoutput interfaces (transitions) generate as many tokens as theconsuming components, Fig. 6.
Figure 6. (a) input interfaces (b) output interfaces
This choice is coherent with the traditional way to modelasynchronous communication between processes modeledby Petri Nets. Moreover it guarantees the genericity of the
components and facilitates the connection between thedifferent components.
The connection between interfaces of two blocks can be1-to-many, many-to-1 or 1-to-1. As an example, Fig. 7shows a many-to-1 and a 1-to-many connections. Toillustrate the interest of this choice of interfaces, let usconsider the modeling of workstations connected to acommunications bus. A many-to-1 connection is used toconnect workstations output transitions to a medium inputplace since workstations put their data on the medium only.A 1-to-many connection is used to connect the mediumoutput transitions to workstations input places, since all theworkstations can see the signals propagating on themedium.
Figure 7. (a) input interfaces (b) output interfaces
This approach is very useful to deal with thecomplexity due to the size of a system. Indeed, if one hasalready a model of some workstations connected on a busand one wants to increase the size of its model, theconnection of new workstations can be done easily just byadding an arc between the output transition of the bus modeland the input place of the station model. . So this does notrequire any modification of the bus or the workstationcomponent. Conversely, if the transitions are used as inputinterfaces and places as output interfaces, the addition of anew workstation would need to add a new token in theoutput place, and hence modify the internal code, so we lossthe genericity.
V. MODELING COMMUNICATION PROTOCOLS
In our approach, we want to model reusable components.In this section, we will build the components that will beused to model the communication protocols. The modelingwill be hierarchical since we build first the basiccomponents. Then, with these components, we constructcomposite-components.
Before starting the construction of modeling components,we will analyze the data link layer protocols that we areinterested in this work. These analyses will help to identifythe basic common behaviors of the different protocols thatlead to definition of the basic components. These basiccomponents are the initial bricks of the library that will serveto model all the complete behavior of the different protocols.
A. A top-down analysis methodology
To build the basic components one must identify thesecomponents to be reused in different models. Since we areinterested in manufacturing systems, the analyses will bemade at the Data Link Layer protocols. The Data Link LayerDLL is the second layer in the OSI model. The data link
340
International Journal on Advances in Intelligent Systems, vol 2 no 2&3, year 2009, http://www.iariajournals.org/intelligent_systems/

layer is often split in two sub-layers: the logical link controlLLC and the Media Access Control MAC, Fig. 8.
Figure 8. IEEE MAC Sublayer
The MAC sub-layer provides hardware addressing andchannel access control mechanisms that enable hosts tocommunicate. Different MAC protocols are used. The datalink layer defines most LAN and wireless LAN technologies:IEEE 802.2 LLC, IEEE 802.3 Ethernet, IEEE 802.5 TokenRing, FDDI and CDDI, IEEE 802.11 WLAN.
The next step is to define the protocols that have thesame functionality. Here, one can find two protocolsEthernet IEEE 802.3 [33] and wireless IEEE 802.11Distributed Coordination Function DCF [34] protocols thatshare the carrier sense multiple access CSMA procedure [35]to send the data over the shared medium. Finally, one mustfind the common behaviors to associate basic components toit. The result of these analyses is three basic commonelements:
1) Channel check:A workstation attempting to send data must at first check
if the channel is free or not. Ethernet uses the CSMA/CDProtocol. Here, CD means collision detection. Theworkstation must check if the channel is free for a period of9.6µs first, then it starts its transmission.
The IEEE 802.11 DCF uses the CSMA/CA protocol.Here CA means collision avoidance. To use the network, aworkstation must before check if the channel is free for morethan a period of time called Distributed Inter-Frame SpaceDIFS, Fig. 9. If so, the workstation starts a random backoffbefore starting its transmission. If the channel status ischanged in both Ethernet and IEEE 802.11 deferring andbackoff times, the workstation must restart the process ofsensing the channel.
Figure 9. Channel Access in IEEE 802.11 DCF
2) Sending and Receiving: Data, Acknowledgments andJAM:
Workstations send and receive packets. These packetscan be data packets, acknowledgment packets or JAM frame(a 32-bit frame, put in place of the correct MAC CRC). InEthernet networks, workstations receive either a data packetor a JAM after a collision. The destination workstation doesnot need to send an acknowledgment to the transmitter atthe MAC layer. However, in wireless LANs, the destinationworkstation must send an acknowledgment to thetransmitter after a successful reception of a packet, Fig. 10.Otherwise, the transmitter will consider that its packet is lostor a collision has occurred, so it will retransmit this packetcausing an extra load on network worthlessly.
Figure 10. Backoff mechanism in IEEE 802.11 DCF without RTS/CTS
On the other hand, to send data, workstations need onlyto put the destination address in the packet. Since themedium is shared in most LAN technologies, all theworkstations will see the packet. However, only theworkstation that has the destination address reads the packetand the others will either forward it, or drop it.
3) Random and Binary Exponential BackoffsIn communication networks errors can occur. This is due
to many factors like the surrounding environment, noise andinterference, or because of collisions. Ethernet and IEEE802.11 networks use the channel check and the inter-framespace to decide the medium access. Thus, collisions mayoccur when more than one workstation transmit on theshared medium at the same time. In Ethernet, the maximumtime needed to send the first bit from one end to the otherend of a 10BaseT medium is 25.6 µs. During this time,(an)other workstation(s) may attempt to send its data, as thatthe channel is considered as free.
As a result, a JAM signal is propagated over the sharedmedium informing the occurrence of a collision. Eachworkstation concerned by a collision starts a binaryexpositional backoff procedure, called BEB, to decide whenit can do a new attempt to access the medium. The BEBalgorithm computes randomly a waiting delay that increaseswith the number of the attempts Tn of the workstation.
At the beginning Tn equals zero (See Fig. 11). Each timea collision occurs, the workstation increments Tn counteruntil it reaches 15. Before trying to transmit its data again,
341
International Journal on Advances in Intelligent Systems, vol 2 no 2&3, year 2009, http://www.iariajournals.org/intelligent_systems/

the workstation starts a BEB by taking a random valuebetween 0 and 2X and multiplies it by 51.2 µs, where:
X = ൜ܶ ,݊ if 0 < ܶ݊ ≤ 1010, if 10 < ܶ݊ ≤ 15
(1)�
This helps in decreasing the possibility for a collisionoccurrence. In case of no collision, the workstationcontinues transmitting and when it is done it leaves thechannel. However, If Tn reaches 15, (the load on thechannel is very high), then the workstation aborts itstransmission and tries it again later.
Figure 11. Transmission in Ethernet
In wireless LANs, after a collision, no JAM signal issent. However, if the workstation does not receive anacknowledgment after a period of time equals to Short IFSSIFS (Fig. 9), it considers that a collision has occurred andstarts a backoff procedure. For each retransmission attempt,the backoff grows exponentially according to the followingequation:
STbackoff = R(0,CW) * Slot-time (2)
Where: ST is the backoff time. CW is the Contention Window.
R is a random function.In general, the initial value of CW (CWmin) is 16. After eachunsuccessful transmission attempt, CW is doubled until apredefined maximum CWmax is reached (often 1024).
There are two major differences between Ethernet andIEEE 802.11 backoff processes:
1- The wireless LAN starts a backoff procedure evenat the first attempt to send its data (Fig. 10), whileEthernet does not. This is one of the mechanismsused to implement the Collision Avoidance featureof CSMA/CA.
2- Ethernet starts its BEB algorithm after a collision(without conceding the status of the channel) andthen restarts checking the channel to send its data.While in IEEE 802.11, the workstation checks firstthe channel status and then it decrements itsbackoff by:
R = ൜R − 1, if the channel is free during 1 time slotR, if the channel becoms busy
� (3)
The design of CSMA protocol offers fair access in ashared medium. This means that all the workstations have achance to use the network and workstations cannot capturethe channel for ever. The remaining value of R is reusedafter the channel status becomes free for more than a DIFSperiod. The workstation starts sending its data when Requals zero, Fig. 12.
Figure 12. Medium Access Process for 802.11 Protocol
≤10
342
International Journal on Advances in Intelligent Systems, vol 2 no 2&3, year 2009, http://www.iariajournals.org/intelligent_systems/

B. A bottom-up construction methodology
As one can see in the last subsection, three elements arein common. These elements can now be used to model thebasic components.
1) The channel-check componentFig. 13 shows a channel check component. Elements in
light gray represent the places and transitions used to buildthe component. Elements in dark gray represent theinterfaces of the component. Initially, the channel is idle forall workstations. This is represented by a token in place“Idle”. A workstation that wants to send data (a token inplace “Data send”) must first check the channel.
In wireless LANs, the channel must be free for a periodmore than DIFS, while in Ethernet, it is 9.6 μs. This isrepresented by the ‘@t’ at the arc between place “Idle” andtransition “TF” (t’ equals 9.6 μs in Ethernet and 50 μs in802.11b). The workstation must wait before it startstransmitting, represented by a token put in place “sdata”. InEthernet the wait “@t” equals to 9.6 μs, while in 802.11 it isequal to random value between CWmin and CWmax slotstime. Place “Backoff/Deferring Time” and transition “FC”is used to decrement the backoff in wireless LAN, while forEthernet, it can be left as it is in the figure (no dependenceto that transition in the model).
Figure 13. Transmission in Ethernet
Consequently, if the channel status is changed (a tokenis put in place “Busy”), the workstation can be in one of thefollowing states:
It is the transmitter (there is no more tokens inplace “sdata”), then nothing is changed and thetoken in place “Busy” is consumed by transitionT1;
It attempt to send or it has no data to send, then T2is fired;
It is in the backoff/deferring phase, then T3 is fired(the workstation rechecks the channel again) and atoken is put in place “BusyC” to stop decrementingthe backoff. Hence, in wireless LAN, theworkstation stops decrementing the backoff, but itkeeps its remaining value.
In the three cases the channel status is changed from idle tobusy.
Initially, this component has one token with value 1(representing the free channel) in place Idle. The use of thiscomponent is possible in any protocol that demands thesensing the channel before transmitting data. It representsalso the status of the channel free or idle. Let us notice herethat, for genericity, we use two parameters t’ and t to definethe delay on the arc Idle-FT and arc Backoff/DeferringTime-Transmit.
2) Receiving and sending ACK componentWorkstations receive two types of packets: data packet
and ACK/JAM frames. In Ethernet network, noacknowledgment is sent after the reception of packet.Therefore, the received packet can be either a data packet ora Jam frame. While in wireless LAN, the received packet iseither a data packet or an acknowledgment frame.
Fig. 14 shows the receiving and sendingacknowledgment component. One assumes that a token isput in place “Receive”. The fields of the token represents:the source address “Sr”, the destination address “Dr”, thereceived data “rdara” and the last field represents the lengthsof the packet. The workstation checks at first the destinationaddress “Dr” of the packet. The guard condition ontransition “Address” checks if the received packet belongsto this workstation, a token is put in place “Data?”.Otherwise, the token in place “Receive” is eliminated bytransition “Drop”. Hence, for simplicity, “Dr==1” isconsidered as the own address of the workstation, while“Dr==0” is used to represent the multicast or JAM framereception.
Next, the guard condition of transition “ACK/JAM” isused to check if the received frame is an ACK frame or aJAM frame (for Ethernet only). The “abc” in the guard canbe modified according to the needs of the designer and thetype of network. However, if the received packet is a datapacket, transition “DA” is enabled. This transition is firedafter a time equals to the time needed to receive the packetmodeled by the “@time(Lr)” at the outgoing arc. This“@time(Lr)” is a function that returns the timecorresponding to the length “Lr” of the packet.
Figure 14. Receiving and Sending ACK Component
343
International Journal on Advances in Intelligent Systems, vol 2 no 2&3, year 2009, http://www.iariajournals.org/intelligent_systems/

Let us notice here, the functions dynamicity can be usedto model mobility of a wireless networks nodes. This can bedone since the bit rate is a function of the signal strengthand that the signal strength is a function of distance. Thismeans if the source knows the location of the destination,then the distance can be computed, and hence the timeneeded to send a packet is determined.
The last step is to represent the bit rate or receivingerrors. The random function Random() is used to generate arandom variable i. Assuming that the bit rate error is lessthan or equal to 10% of the transmitted/received packets.So, if the value of i is less than 0.1, then the packet isdiscarded (the token in place RD is consumed by transition“BE”). Else, the packet is received correctly and then anacknowledgment is sent, by firing transition “SA”. Thisinterface can be left unconnected in Ethernet. As we can seein Fig. 14, the modification of tuples can be done easily, justby modifying the arc inscriptions according to our needs.
As one can see, this component has an importantfunctionality since it is used to identify the received data(own or not), the type of the received data (JAM, ACK, dataframe) and the process of sending an acknowledgment aftera successful reception. Thus the use of this component ispossible for the protocols demanding the identification ofdata and the send/receive process.
3) Backoff / BEB componentThe third component is the backoff / BEB component
shown in Fig. 15. As we can see in the figure, retransmittingthe packet depends on the value of n, (transitions T6 andT7). If the packet is correctly sent/received (a token is put inplace “Done”), then n is reset to z (0 for Ethernet and 1 forwireless), for the next attempt to transmit, place N.However, the component inscriptions depend on the type ofthe network. As an example, Table II shows the differencesbetween Ethernet and IEEE 802.11b networks.
Figure 15. Backoff / BEB Component
In addition to Table II, in Ethernet, places “FreeC” and“BusyCh” are not used (they can be left as it is), since thebackoff decrement in Ethernet does not depend on the statusof the channel. While in 802.11b, this interface is veryimportant in decrementing the backoff each time thechannel is free for a slot time or the backoff is conserved ifthe channel status is changed to busy.
TABLE II. DIFFERENCES BETWEEN ETHERNET AND IEEE 802.11B
NETWORKS
Variable Value Ethernet IEEE 802.11b
fun1(n) n<15 n<33
fun2(n) n=n+1 n=n*2
y 16 64
z 0 1
R(0, Q)random(0, 2X), X
depends on nrandom(0, CW)
Fun(R) R*51.2µs 0
ST(t) 0 Time slot (20μs)
The firing of transition TS represents the(re)transmission allowance of a packet (backoff equals to 0).The backoff component is useful for the protocols that mayneed a specific timing procedure since it can be related toanother components (which the case of wireless: bychecking channel always) or just for standalone use
C. Application protocols
In this subsection, we will illustrate our modelingapproach through two examples: IEEE 802.3 Ethernet MACprotocol and IEEE 802.11 MAC protocol because bothprotocols are based on CSMA. One of the objectives is toillustrate the advantage of having generic components andthe hierarchical composition that allows building composite-components.
1) Modeling an Ethernet workstationEthernet is the most widely used LAN technology in the
world. Ethernet was designed at its beginning at the XeroxPalo Alto Research Center PARC, in 1973. The usedprotocol differs from the classical protocols like tokencontrol, where a station cannot send before it receives anauthorization signal, the token. With Ethernet, beforetransmitting, a workstation must check the channel to ensurethat there is no communication in progress, which is knownas the CSMA/CD Protocol.
Fig. 16 shows the detailed and complete module for theEthernet workstation. As one can see in the figure, the threecomponents: Backoff component, Channel Checkcomponent and Receive/Send component are reused to buildthe workstation. To complete the model and to bind the usedcomponents together, some additional places and transitions(in white) are used to answer the specification of anEthernet workstation.
In the figure, one can see that five interfaces were notconnected:
The “FreeC” and “BusyCh” interfaces of theBackoff component, and the FC and BC interfaces ofthe Channel Check component, since Ethernetworkstations decrement their backoff without theneed to check whether the channel is idle.
The SA interface of the Receive/Send component,because in this part we do not model the serviceoffered by an Ethernet workstation
344
International Journal on Advances in Intelligent Systems, vol 2 no 2&3, year 2009, http://www.iariajournals.org/intelligent_systems/

Figure 16. Composite design of an Ethernet Workstation Component basedon Generic Basic Components
An important notice is that the whole component can bereused as one component for the Ethernet workstation tobuild a complete Ethernet network. In other words, this newcomponent is seen as a composite-component with the blackplaces and transitions as the interfaces of this newcomponent.
2) Modeling a 802.11b DCF workstationWireless technology has become popular to access to
internet and communication networks. The IEEE 802.11offers the possibility to assign part of the radio channelbandwidth to be used in wireless networks. The IEEE802.11 protocol is a member of the IEEE 802 family, whichis a series of specifications for local area networktechnologies, (Fig. 8). IEEE 802.11 is a wireless MACprotocol for Wireless Local Area Network WLAN, initiallypresented in 1997. The IEEE 802.11 standard definesMedium Access Protocol and Physical (PHY) frameworks(layer 2 in the OSI model) to provide wireless connectivityin WLAN. This independence between the MAC and PHYhas enabled the addition of the higher data rate 802.11b,802.11a, and 802.11g PHYs. The physical layer for each802.11 type is the main differentiator between them.However, the MAC layer for each of the 802.11 PHYs is thesame.
Many other 802.11 variants have appeared. For instance,in 2004, the 802.11e was an attempt enhancement of the802.11 MAC to increase the quality of service. The 802.11iand 802.11x were defined to enhance the security andauthentication mechanisms of the 802.11 standard. Manyother variants exist like 802.11c, 802.11d, 802.11h. TheIEEE 802.11 MAC layer defines two coordination functionsto access the wireless medium: A distributed coordination
function DCF and a centralized coordination function PCF(Point Coordination Function).
Fig. 17 shows the detailed and complete module for theDCF IEEE 802.11b workstation model by the reuse ofready-to-use components designed from the previoussections. The workstation sets the value of N to 1 (place“N”), sense the channel (transition “TF”), sends its data(place and transition “Send”) and waits for anacknowledgment (place “Wait”). If no acknowledgment isreceived during the SIFS period or 10μs, Transition T11will fire putting a token in place “Retransmit?” to check ifthe packet can be retransmitted (transition T6) or not(transition T7).
As one can see in this figure, all the components arereused to compose the workstation module. All theinterfaces were also used in this module.
Figure 17. Hierarchical Design of a DCF IEEE 802.11b WorkstationComponent based on Generic Basic Components
VI. EXPERIMENTAL VALIDATION
In the previous sections, we have modeled severalcomponents (basic and composite components). In thissection, we will validate and evaluate the quality andaccuracy of our model by means of simulation. Theobtained results will be compared with the data given byother studies about IEEE 802.11b network and also theresults of NS-2 simulations performed in the sameconditions.
A. Performance evaluation techniques
Different models and methods are used to evaluate theperformance in communication and distributed systems [9]:
345
International Journal on Advances in Intelligent Systems, vol 2 no 2&3, year 2009, http://www.iariajournals.org/intelligent_systems/

1) Measurement can offer the most exact and accurateresults. The system is observed directly. However,measurement is often the most costly of the techniques sinceit is only possible if the system already exists. In somecases, measurements may not be accurate since it dependson the state of the system. For example, if networkmeasurements are done during peak period, the observedresults would not be the same as if the measurements weredone during a period of low use of the network.
2) Analytical models may provide exact answers.Analytical modeling uses simple mathematical expressionsto obtain the performance results for a system. However,these results may not be accurate, because of theirdependencies on the made assumptions in order to create themodel. The behavior of computer systems includingprocessing periods, communication delays, and interactionsover the communication channels is difficult to model.Analytical models are excellent to model small to mediumsystems that fulfil some requirements but this is not the casefor industrial-sized, networked and distributed systems.
3) Simulation models [36] allow modeling andobserving the system behavior. It facilitates theunderstanding of the real system. Simulation allows theevaluation of a system model in an executable form, and thedata of such process are used to calculate different measuresof interest. Simulation is generally used because thecomplexity of most systems requires the use of simplemathematical ways for practical performance studies. Thismakes simulation as a tool for evaluation. Simulationmodels allow creating very detailed, potentially accuratemodels. However, developing the simulation model mayconsume a big amount of time, but once the model is built ittakes a little time to get results.
Table III shows a qualitative comparison between thedifferent methods used to evaluate the systems performance.
TABLE III. COMPARISON OF THE DIFFERENT PERFORMANCE
EVALUATION TECHNIQUES
Criterion Analytical Simulation Measurement
Stage Any Any Post prototype
Time Required Small Medium Varies
Tools AnalystsComputerLanguages
Instrumentation
Accuracy Low Moderate Varies
Trade-offevaluation
Easy Moderate Difficult
Cost Small Medium High
Scalability Low Medium High
Flexibility High High Low
This comparison is based on different criteria [37] [38]: Stage: Which performance evaluation technique
should be used at any point in life cycle,
Time required: The time consumed/required by aparticular technique,
Tools: Which analytic tools, simulators,measurement packages are used,
Accuracy: It represents the degree to which theobtained results match the reality (evaluates thevalidity and reliability of the results obtained).
Scalability: It represents the complexity degree toscale a particular technique
Trade-off evaluation: It represents the ability of atechnique to study the different systemconfigurations.
Cost: This cost must not be considerable in term oftime and money needed to perform the study.
Flexibility: The system-model under test should beeasy to modify and extend. The used evaluationtechnique should provide the possibility to integratethese considerations easily in the developed model.
Simulation seems to be the mostly used technique usedto evaluate the performance of the computer systems. Itrepresents a useful means to predict the performances of asystem and compare them under many conditions andconfigurations. One major advantage of this technique isthat even if the system is already implemented, it offersflexibility difficult to reach with measurement techniques.
Our modeling formalism, Petri nets, combines both theanalytical and simulation models which let the possibility tomodel system mathematically. However, communicationnetworks and distributed systems are so complex thatbuilding and solving the equations’ system are too difficultand needs tools capable to perform this process.
More suitable for our aims are the discrete-eventsimulations [9]. Discrete-event simulation is a powerfulcomputing technique for understanding the behavior ofsystems. In discrete-event simulations, the state changesoccur at discrete steps in time. Discrete event simulation ismainly used in real environments such as communicationnetworks and protocols [39], manufacturing systems [40],material handling [41], etc. General purpose programminglanguages like C/C++ and Java and several simulators suchas NS-2 [42] and OPNET [43] are based on the discreteevent simulation.
B. Simulations and Results
To perform the simulations, many tools and extensionsof Petri Nets exist such as PROD, Renew, ALPHA/Sim,CPN Tools, Artifex and other tools [44]. However, thedevelopment of most of these tools has been stopped for along time, or they do not support our needs or they arecommercial. Two main, free of charge tools were possible tocover the previous features “CPN Tools” [45] and “Renew2.1.1” [46].
However, during simulation, “CPN Tools” has shown animportant problem that does not apply to our timing needs.We have chosen “Renew” since it is a Java-based high-levelPetri nets discrete-event simulator.
Our simulations are based on full-mesh dense networkswith different numbers of workstations:
346
International Journal on Advances in Intelligent Systems, vol 2 no 2&3, year 2009, http://www.iariajournals.org/intelligent_systems/

i- The simulations were performed for differentnumber of workstations sharing the medium.
ii- For each case, the simulations were repeated 100times to get average measures.
iii- Each simulation assumes that all nodes transmit at11Mbps.
iv- All nodes attempt to send data as soon as possible.v- Each node has 1000 packets (to get the average
possible measures) with average packet length of1150 bytes (packet length varied from 800 byte to1500byte).
vi- All simulations were accomplished on Intel®Core™ 2 Duo Processor T2300, 2G of RAM.
1) Average bandwidth per nodeThe first result is the average bandwidth per workstation.
Fig. 18 shows the throughput of 802.11b nodes sharing abandwidth of 11Mbps. As illustrated by the figure, thebandwidth per node decreases logically with the increase ofnodes number. When the number of nodes is small eachworkstation has more bandwidth from the shared effectivebandwidth. However, when the number of the nodes on thenetwork increases, the bandwidth is decreasingexponentially. This is due to the increased number ofcollisions on the network, and so more bandwidth will belost.
The other factor is that CSMA gives fair timing to themachines to access the channel. Thus, workstations mustwait longer time to have access to the channel. Anotherfactor is after a collision, the workstations must double theircontention window which means longer backoff time. So,more time is spent to decrement the backoff or less totalbandwidth.
Figure 18. Bandwidth Variation with Number of Nodes
2) Collisions rate percentageThe next step is to compute the collision rate percentage
or errors versus the network utilization. Fig. 19 shows howthe collision rate increases when the number of workstationsincreases. As we can see in the figure, when threeworkstations are sharing the medium, the collision rate isnearly 8%. However, when there are 12 workstationssharing the medium, the collision rate reaches 23.2%. These
results confirm the results obtained in the previous sectionand our explanation.
As one can see, the collision rate is increasing linearlyuntil certain point (8 workstations). The reason is whenmore workstations attempt to send, more packets are on theshared channel and hence the probability that a collisionoccurs increases. However, when the number increasesmore, the collision rate increase becomes slower. Theexplanation for this evolution is the backoff procedure.With more workstations, the number of collisions increases,and the value of CW also increases (backoff time). On theother hand, this increment of backoff time decreases theprobability of a collision, since workstations in collisionmust wait for longer time before attempting to send again.So, the collision rate increment becomes slower.
Figure 19. Collisions Rate Percentage
3) Transmission Time per PacketThe next test is to measure the overall time needed to
send a packet over Ethernet or DCF protocols (from senderside to receiver side). Fig. 20 shows the time required totransmit one packet versus the number of nodes on thenetwork. The transmission time increases linearly due to theincreased number of sent packets on the network andcollision rate.
Figure 20. Transmission Time per Packet
347
International Journal on Advances in Intelligent Systems, vol 2 no 2&3, year 2009, http://www.iariajournals.org/intelligent_systems/

However, sending a packet over Ethernet requires lesstime than sending it over DCF. The figure shows that withthree nodes on the network, DCF seems to be the same asEthernet. However, with the increase of nodes the differencebecomes obvious. This is due to:
1- A workstation attempting to use the channel inwireless networks needs to ensure that the channelis idle during a DIFS period or 50µs, while inEthernet it only needs 9.6 µs.
2- From the first attempt to transmit, wireless nodesstarts a backoff procedure (Bavg = 8 * 20 µs)decremented only if the channel is idle, while inEthernet, workstations defers only for 9.6 µs.
3- After a collision, in wireless networks, the channelstatus becomes idle only when all the workstationsfinish their transmissions (no collision detectionprocess), while in Ethernet the channel becomesidle after 51.2 µs (channel acquisition slot time).
4- The backoff procedure used after each collision inwireless networks doubles the contention windowvalue which is already 8 times greater than the oneused in Ethernet. This makes the backoff inwireless greater than Ethernet BEB even with slottime (20µs) less than the 51.2 µs used in Ethernet.
C. Comparison with ns-2 simulator and other studies
To evaluate the quality and accuracy of our model, wehave used the network simulator NS-2 as a comparative toolsince it is widely used to model communication protocols.The NS-2 simulator is a discrete-event network simulatorthat allows simulating many scenarios defined by the user. Itis commonly used in the research due to its extensibility,since it is an open source model. NS2 is widely used in thesimulation of routing, multicast protocols and ad-hocnetwork.
Fig. 21 shows the results obtained from NS-2 and thosefrom our model, (Fig. 18). As we can see the results of bothsimulations Renew and NS-2, are nearly identical whichconfirms the correctness of our model. Moreover, if wecompare our obtained results with those in [Anastasi05] and[Heusse03], we can get also the same results from both thesimulation technique and the equation we obtained from theresults.
Figure 21. Comparison between our model and NS-2
The other comparison is the effective simulation time.As we can see in Fig. 22, the simulation time increases in alinear way when the number of nodes increases (confirmedby the results in Fig. 20). The figure shows that NS2 needsless time to perform the same simulation. However, NS2does not support the step-by-step simulation to verify thesystem event by event. The second important issue is that itis not possible to model distributed services with NS2 (nosupporting package). However, with “Renew” as Petri netseditor and simulator, it is possible to combine both servicesand protocols in one global model.
Figure 22. Effective Simulation Time versus number of nodes
VII. CASE STUDY: EVALUATING PERFORMANCE OF A
DISTRIBUTED MANUFACTURING SYSTEM
In the last sections, we have shown the modeling part ofthe communication protocols. In this section we will showthe modeling part that concerns the services. An illustrativeexample, Fig. 23, will be used to model the services offeredby a production system. The used modeling technique willbe the same as the communication protocols, i.e. component-based methodology, where each part of the system ismodeled in hierarchical composition: “service-workstation”,i.e. each service is modeled over a workstation.
Figure 23. Manufacturing Plant with Flexibilities
348
International Journal on Advances in Intelligent Systems, vol 2 no 2&3, year 2009, http://www.iariajournals.org/intelligent_systems/

A. System Components
Fig. 24 shows the complete system components used totransfer one product from IN/OUT area to any machine M1,M2 or M3. Z1 to Z4 represent the input and output areas foreach machine and the IN/OUT area. The capacity of each islimited to one product. IS1 to IS6 areas represent the stockarea before and after machining a product. The capacity ofeach stock area is greater than one. R1 to R4 represent therobots used to make a transfer from a Z area to a machine orIN/OUT area and vice versa. Finally, T1 to T8 represent thetransfer elements from and to a Z and an IS stock areas. Thecomponent represents the service offered by a resource, arobot or a transfer component. Machines, Z’s and stockareas are considered as shared resources.
Figure 24. Complete Area and Transfer Components
B. Product transfer
In order to transfer a product from one area to anotherone, areas must allocate the required area/resource. Pre-allocation is passed through a transfer component. Transfercomponents check the possibility to allocate the destinationarea (depending on the capacity of each area). Anacknowledgement is from the destination area when a placeis free. During this time the source area and the transfercomponent are in waiting period (machines and Z areas donot perform any action during this time, while stock areascan receive products from other components).
Fig. 25 shows the centralized model of a product transferfrom S to D areas. In the figure, to transfer a product, theproduct must be available in area S (a token put in placeS/REQ), the transfer component must be also available (a
token in place SD/NOP) and a free place in area D (atoken in place D/CONS). These three tokens enable thetransition SD/t1 and a token is then put in placeSD/TRSF-START starting the transfer process. Thetransfer component takes the product from area S. The firingof transition SD/t2 and the put of a token in place S/ACKinform that a place is released up in area S. The transferprocess continues by putting a token in place SD/TRSF-END. When the product arrives to area D (transitionSD/t3), the transfer component becomes free again (atoken is put in place SD/NOP) and an area is used in areaD (a token is put in place D/PROD).
Figure 25. Product Transfer in centralized model
Fig. 26 shows the complete messages exchanged in caseof implementation of the 3 processes (S, SD, and D) on 3different computers.
Figure 26. Exchanged Messages over the Network for the Transfer
Each process plays a different role with regard to theclient/server mechanism. S is always a client and D is
349
International Journal on Advances in Intelligent Systems, vol 2 no 2&3, year 2009, http://www.iariajournals.org/intelligent_systems/
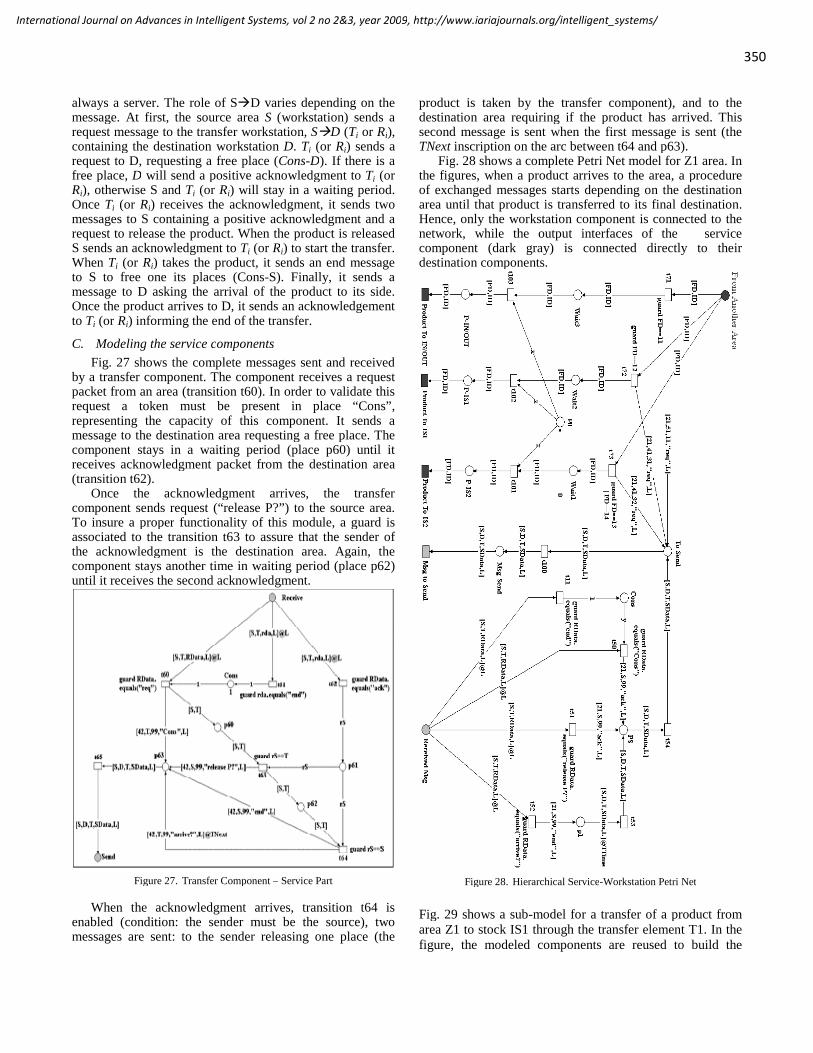
always a server. The role of SD varies depending on themessage. At first, the source area S (workstation) sends arequest message to the transfer workstation, SD (Ti or Ri),containing the destination workstation D. Ti (or Ri) sends arequest to D, requesting a free place (Cons-D). If there is afree place, D will send a positive acknowledgment to Ti (orRi), otherwise S and Ti (or Ri) will stay in a waiting period.Once Ti (or Ri) receives the acknowledgment, it sends twomessages to S containing a positive acknowledgment and arequest to release the product. When the product is releasedS sends an acknowledgment to Ti (or Ri) to start the transfer.When Ti (or Ri) takes the product, it sends an end messageto S to free one its places (Cons-S). Finally, it sends amessage to D asking the arrival of the product to its side.Once the product arrives to D, it sends an acknowledgementto Ti (or Ri) informing the end of the transfer.
C. Modeling the service components
Fig. 27 shows the complete messages sent and receivedby a transfer component. The component receives a requestpacket from an area (transition t60). In order to validate thisrequest a token must be present in place “Cons”,representing the capacity of this component. It sends amessage to the destination area requesting a free place. Thecomponent stays in a waiting period (place p60) until itreceives acknowledgment packet from the destination area(transition t62).
Once the acknowledgment arrives, the transfercomponent sends request (“release P?”) to the source area.To insure a proper functionality of this module, a guard isassociated to the transition t63 to assure that the sender ofthe acknowledgment is the destination area. Again, thecomponent stays another time in waiting period (place p62)until it receives the second acknowledgment.
Figure 27. Transfer Component – Service Part
When the acknowledgment arrives, transition t64 isenabled (condition: the sender must be the source), twomessages are sent: to the sender releasing one place (the
product is taken by the transfer component), and to thedestination area requiring if the product has arrived. Thissecond message is sent when the first message is sent (theTNext inscription on the arc between t64 and p63).
Fig. 28 shows a complete Petri Net model for Z1 area. Inthe figures, when a product arrives to the area, a procedureof exchanged messages starts depending on the destinationarea until that product is transferred to its final destination.Hence, only the workstation component is connected to thenetwork, while the output interfaces of the servicecomponent (dark gray) is connected directly to theirdestination components.
Figure 28. Hierarchical Service-Workstation Petri Net
Fig. 29 shows a sub-model for a transfer of a product fromarea Z1 to stock IS1 through the transfer element T1. In thefigure, the modeled components are reused to build the
350
International Journal on Advances in Intelligent Systems, vol 2 no 2&3, year 2009, http://www.iariajournals.org/intelligent_systems/

whole system. This reuse is applicable for the otherelements in the system. Some additional places andtransitions are used to complete the system-model and toinsure its functionality.
Figure 29. Service-Workstation Composite-Component
D. Simulating the complete model
The simulation was performed on the same PCs used inthe above sections. The system is assumed to perform 100different products. The simulation aims to see the impact ofusing different type of products and different protocols overthe system. The transfer time is supposed to be 50 msec andthe machining time to be 100 msec. These values have beenchosen in milliseconds to really verify the impact of theunderlying network on the system. Otherwise, if we use thereal values in minutes, the impact of the underlying networkwould not be obvious with the example we have used. Thenumber of simultaneous products per type is varied from 2 to5 products.
The type of services on the system affects the number ofexchanged messages and transactions on the network. Forexample, to perform the service f2, the number oftransactions is 72 exchanged messages per product.However, to complete service f1 or f2, the number ofexchanged messages is 90 messages per product. This is inthe case of one product only on the system. However, whenthere are several products on the system, this numberincreases due to collisions. So, this number may reach
90~100 messages per product for service f2, and 110~120messages per product for service f1 or f3.
a) One Product
The first simulation is performed to get an idea about thetime needed to machine one product over the system. TableIV shows the impact of changing the communicationprotocol in the system over the time needed to finish oneproduct. An important difference appears between Ethernetat 10Mbps and 100Mbps. However, the 1Gbps does notcreate a big difference, since the machining and transfertimes are the dominant in this case.
TABLE IV. TIME TO MACHINE A PRODUCT
Service 802.11b E-10Mbps E-100Mbps E-1Gbps
f2 564.5 ms 567.6 ms 506.7 ms 500.7 ms
f1 or f3 680.2 ms 684.5 ms 608.5 ms 600.9 ms
The other interesting result is the time difference whenthe required service is f2, or f1 or f3. Since the path to finishthe product is longer, the time needed to make the product isclearly longer. In this part, 11Mbps 802.11b seems to bebetter than 10Mbps Ethernet.
b) Same Products; Different Protocols
The second results are the most important, since theyshow the impact of changing the communication protocolon the system. Different remarks can be done from the Fig.30:
1- 802.11b protocol does not present a good choice.This result is conforming with the results of Fig.20. This becomes clear when the number ofsimultaneous products increases (the number ofexchanged messages increase also).
2- A big time difference is noticed when using100Mbps Ethernet (compared to 10Mbps Ethernetand 802.11b). The number of messages isimportant. With 2 simultaneous products of eachtype, the number of exchanged messages reaches500 to 600 exchanged messages. With 3simultaneous products of each type, the number ofexchanged messages reaches 900 to 1000exchanged messages. While with 5 simultaneousproducts of each type, there are nearly 1400 to1500 exchanged messages on the network.The type and speed of protocols is very importantsince to exchange this huge number of messages onthe network, the bit rate is very important anddecreases obviously the time needed to exchangethese messages between the differentresource/workstation on the system.
3- The use of 1Gbps Ethernet did not show a bigdifference with respect to 100Mbps Ethernet.However, this conclusion is not really correct. Theimpact of using Giga Ethernet can appear if themodeled system is larger (more machines, stockareas, resources, etc.).In that case, the number of exchanged messagesover the network will be greater. Thus, the impact
351
International Journal on Advances in Intelligent Systems, vol 2 no 2&3, year 2009, http://www.iariajournals.org/intelligent_systems/
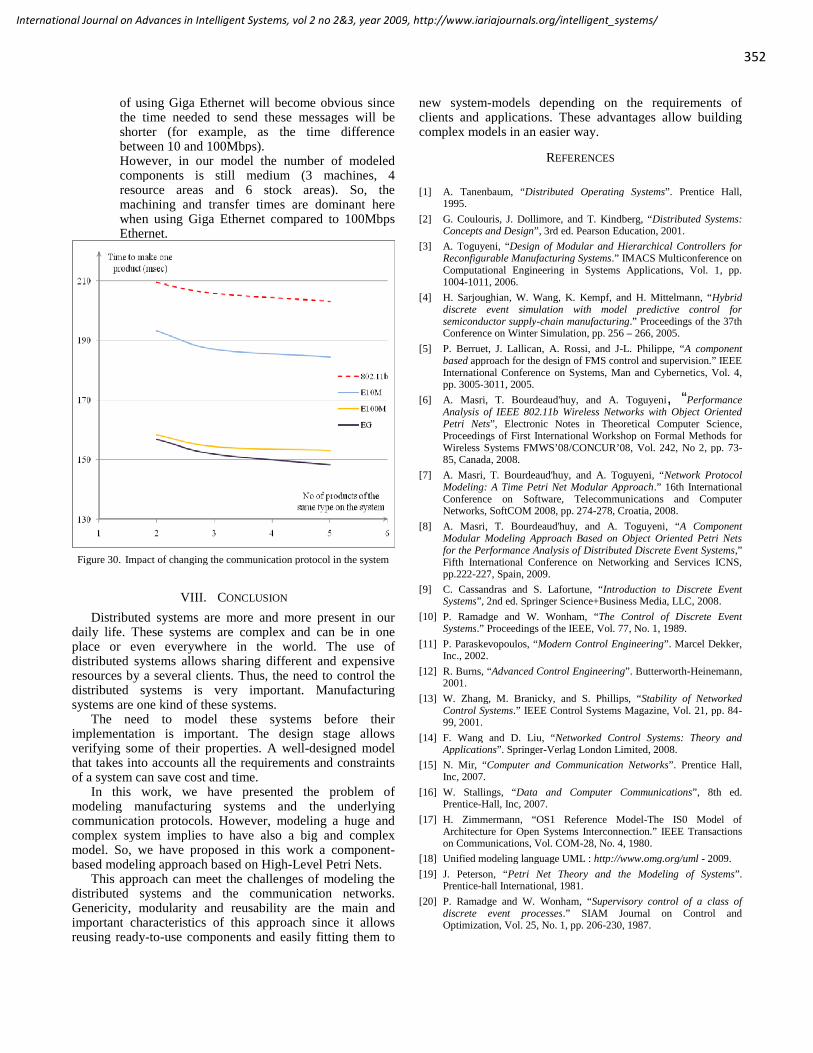
of using Giga Ethernet will become obvious sincethe time needed to send these messages will beshorter (for example, as the time differencebetween 10 and 100Mbps).However, in our model the number of modeledcomponents is still medium (3 machines, 4resource areas and 6 stock areas). So, themachining and transfer times are dominant herewhen using Giga Ethernet compared to 100MbpsEthernet.
Figure 30. Impact of changing the communication protocol in the system
VIII. CONCLUSION
Distributed systems are more and more present in ourdaily life. These systems are complex and can be in oneplace or even everywhere in the world. The use ofdistributed systems allows sharing different and expensiveresources by a several clients. Thus, the need to control thedistributed systems is very important. Manufacturingsystems are one kind of these systems.
The need to model these systems before theirimplementation is important. The design stage allowsverifying some of their properties. A well-designed modelthat takes into accounts all the requirements and constraintsof a system can save cost and time.
In this work, we have presented the problem ofmodeling manufacturing systems and the underlyingcommunication protocols. However, modeling a huge andcomplex system implies to have also a big and complexmodel. So, we have proposed in this work a component-based modeling approach based on High-Level Petri Nets.
This approach can meet the challenges of modeling thedistributed systems and the communication networks.Genericity, modularity and reusability are the main andimportant characteristics of this approach since it allowsreusing ready-to-use components and easily fitting them to
new system-models depending on the requirements ofclients and applications. These advantages allow buildingcomplex models in an easier way.
REFERENCES
[1] A. Tanenbaum, “Distributed Operating Systems”. Prentice Hall,1995.
[2] G. Coulouris, J. Dollimore, and T. Kindberg, “Distributed Systems:Concepts and Design”, 3rd ed. Pearson Education, 2001.
[3] A. Toguyeni, “Design of Modular and Hierarchical Controllers forReconfigurable Manufacturing Systems.” IMACS Multiconference onComputational Engineering in Systems Applications, Vol. 1, pp.1004-1011, 2006.
[4] H. Sarjoughian, W. Wang, K. Kempf, and H. Mittelmann, “Hybriddiscrete event simulation with model predictive control forsemiconductor supply-chain manufacturing.” Proceedings of the 37thConference on Winter Simulation, pp. 256 – 266, 2005.
[5] P. Berruet, J. Lallican, A. Rossi, and J-L. Philippe, “A componentbased approach for the design of FMS control and supervision.” IEEEInternational Conference on Systems, Man and Cybernetics, Vol. 4,pp. 3005-3011, 2005.
[6] A. Masri, T. Bourdeaud'huy, and A. Toguyeni, “PerformanceAnalysis of IEEE 802.11b Wireless Networks with Object OrientedPetri Nets”, Electronic Notes in Theoretical Computer Science,Proceedings of First International Workshop on Formal Methods forWireless Systems FMWS’08/CONCUR’08, Vol. 242, No 2, pp. 73-85, Canada, 2008.
[7] A. Masri, T. Bourdeaud'huy, and A. Toguyeni, “Network ProtocolModeling: A Time Petri Net Modular Approach.” 16th InternationalConference on Software, Telecommunications and ComputerNetworks, SoftCOM 2008, pp. 274-278, Croatia, 2008.
[8] A. Masri, T. Bourdeaud'huy, and A. Toguyeni, “A ComponentModular Modeling Approach Based on Object Oriented Petri Netsfor the Performance Analysis of Distributed Discrete Event Systems,”Fifth International Conference on Networking and Services ICNS,pp.222-227, Spain, 2009.
[9] C. Cassandras and S. Lafortune, “Introduction to Discrete EventSystems”, 2nd ed. Springer Science+Business Media, LLC, 2008.
[10] P. Ramadge and W. Wonham, “The Control of Discrete EventSystems.” Proceedings of the IEEE, Vol. 77, No. 1, 1989.
[11] P. Paraskevopoulos, “Modern Control Engineering”. Marcel Dekker,Inc., 2002.
[12] R. Burns, “Advanced Control Engineering”. Butterworth-Heinemann,2001.
[13] W. Zhang, M. Branicky, and S. Phillips, “Stability of NetworkedControl Systems.” IEEE Control Systems Magazine, Vol. 21, pp. 84-99, 2001.
[14] F. Wang and D. Liu, “Networked Control Systems: Theory andApplications”. Springer-Verlag London Limited, 2008.
[15] N. Mir, “Computer and Communication Networks”. Prentice Hall,Inc, 2007.
[16] W. Stallings, “Data and Computer Communications”, 8th ed.Prentice-Hall, Inc, 2007.
[17] H. Zimmermann, “OS1 Reference Model-The IS0 Model ofArchitecture for Open Systems Interconnection.” IEEE Transactionson Communications, Vol. COM-28, No. 4, 1980.
[18] Unified modeling language UML : http://www.omg.org/uml - 2009.
[19] J. Peterson, “Petri Net Theory and the Modeling of Systems”.Prentice-hall International, 1981.
[20] P. Ramadge and W. Wonham, “Supervisory control of a class ofdiscrete event processes.” SIAM Journal on Control andOptimization, Vol. 25, No. 1, pp. 206-230, 1987.
352
International Journal on Advances in Intelligent Systems, vol 2 no 2&3, year 2009, http://www.iariajournals.org/intelligent_systems/

[21] F. Lin and W. Wonham, “Decentralized supervisory control ofdiscrete event systems with partial observation.” IEEE transaction inAutomatic Control, Vol. 35, pp. 1330-1337, 1990.
[22] E. Zamaï, A. Chaillet-Subias and M. Combacau, “An architecture forcontrol and monitoring of discrete events systems.” Computers inIndustry, Vol. 36, No. 1 - 2, pp. 95-100, 1998.
[23] J. Petin, P. Berruet, A. Toguyeni, and E. Zamaï, “Impact ofinformation and communication emerging technologies in automationengineering : outline of the intica proj.” 1st Workshop on NetworkedControl System and Fault Tolerant Control, 2005.
[24] C. A. Petri, “Communication with Automata.” Technical ReportRADC-TR-65-377 Rome Air Dev. Center, New York, 1966.
[25] K. Jensen, “Coloured Petri nets: A high level language for systemdesign and analysis”, Lecture Notes in Computer Science, Vol.483/1991, pp. 342-416, 1991.
[26] P. Brereton and D. Budgen, “Component-Based Systems: AClassification of Issues.” IEEE Computer, Vol. 33, No. 11, pp. 54-62,2000.
[27] D. Carney and F. Long, “What Do You Mean by COTS? Finally, aUseful Answer.” IEEE Software, 2000.
[28] G. Gössler, S. Graf, M. Majster-Cederbaum, M. Martens, and J.Sifakis, “An Approach to Modelling and Verification of ComponentBased Systems.” Lecture Notes in Computer Science, SOFSEM 2007:Theory and Practice of Computer Science, Vol. 4362, pp. 295-308,2007.
[29] R. Bastide and E. Barboni, “Component-Based BehaviouralModelling with High-Level Petri Nets.” In MOCA’04 Aahrus,Denmark, DAIMI, pp. 37-46, 2004.
[30] R. Langlois, “Modularity in technology and organization.” Journal ofEconomic Behavior & Organization, Vol. 49, p. 19–37, 2002.
[31] C. Geisterfer and S. Ghosh, “Software Component Specification: AStudy in Perspective of Component Selection and Reuse.” FifthInternational Conference on Commercial-off-the-Shelf (COTS)-Based Software Systems, pp. 100-108, 2006.
[32] A. Brown and K. Wdlnau, “Engineering of Component-BasedSystems.” Second IEEE International Conference on Engineering ofComplex Computer Systems, 1996.
[33] IEEE 802.3 Ethernet Working Group: http://www.ieee802.org/3/ -2009.
[34] IEEE Computer Society, “Wireless LAN Medium Access Control(MAC) and Physical Layer (PHY) Specifications.” IEEE Std.802.11™, 2007.
[35] IEEE Std 802.3™, “Carrier sense multiple access with collisiondetection (CSMA/CD) access method and physical layerspecifications.” 2002.
[36] P. Fortier and H. Michel, “Computer Systems PerformanceEvaluation and Prediction”. Digital Press , 2003.
[37] A. Chhabra and G. Singh, “Parametric Identification for ComparingPerformance Evaluation Techniques in Parallel Systems.”Proceedings the 1st National Conference on Challenges andOpportunities in Information Technology, COIT, pp. 92-97, 2007.
[38] R. Jain, “The Art of Computer Systems Performance Analysis:Techniques for Experimental Design, Measurement, Simulation, andModeling ”. John Wiley & Sons,Inc., 1991.
[39] H. Lim, B. Wang, C. Fu, A. Phull, and D. Ma, “A MiddlewareServices Simulation Platform forWireless Sensor Networks.” The 28thInternational Conference on Distributed Computing SystemsWorkshops, ICDCS, pp. 168-173, 2008.
[40] N. Kumar and R. Sridharan, “Simulation modelling and analysis ofpart and tool flow control decisions in a flexible manufacturingsystem .” Robotics and Computer-Integrated Manufacturing, 2009.
[41] V. Giordano, J. Zhang, D. Naso, M. Wong, F. Lewis, and A. Carbotti,“Matrix-based discrete event control of automated material handlingsystems.” Proceedings of the 45th IEEE Conference on Decision &Control, 2006.
[42] NS2 Official Website:
http://nsnam.isi.edu/nsnam/index.php/Main_Page - 2008.
[43] OPNET Technologies, Inc. http://www.opnet.com/ - 2009.
[44] Petri Nets World: http://www.petrinetz.de/ - 2009.
[45] Computer Tool for Coloured Petri Nets . CPN Tools:http://wiki.daimi.au.dk/cpntools/cpntools.wiki - 2007.
[46] The Reference Net Workshop. Renew : http://www.renew.de/ - 2008.
353
International Journal on Advances in Intelligent Systems, vol 2 no 2&3, year 2009, http://www.iariajournals.org/intelligent_systems/

Improving P2P Streaming Methods for IPTV
Majed Alhaisoni Antonio Liotta Mohammed Ghanbari
University of Essex Eindhoven University of Technology University of Essex
Colchester, UK The Netherlands Colchester, UK
[email protected] [email protected] [email protected]
Abstract
Peer-to-Peer (P2P) IPTV applications have
increasingly been considered as a potential approach
to online broadcasting. These overcome fundamental
client-server issues and introduce new, self-
management features that help improving
performance. Recently, many applications such as
PPlive, PPStream, Sopcast, and Joost have been
deployed to deliver live and Video-on-Demand
streaming via P2P. However, the P2P approach has
also shown some points of failure and limitations. In
this paper we analyze, assess and compare two
popular Live and Video-on-Demand P2P streaming
applications, Sopcast and Joost. Fundamental
shortcomings of existing applications are then
countered by our approach where we employ a cross-
layered method aimed at improving network efficiency
and quality of experience. We show how simple
modifications to existing protocols have the potential
to lead to significant benefits in terms of latency, jitter,
throughput, packet loss, and PSNR.
Keywords: P2P streaming; Ne; Network efficiency;
Load balancing; QoS; QoE.
1. Introduction Peer-to-Peer (P2P) video streaming is becoming a
viable alternative to conventional IPTV systems for
distributing video content over the Internet. The
underlying mechanism is based on the distribution of
the stream through a self-managed, application-level
overlay including the user terminals in the role of peers
i.e., content distribution relays. This is in contrast to
other IPTV approaches which are based on content
distribution networks. These require a dedicated
multicasting infrastructure whose cost increases
dramatically with the scale and dynamics of the system.
On the other hand, in the P2P approach any capable
(user) terminal becomes a distribution hub for any
incoming stream, reducing in this way the possibility of
failure points and bottlenecks that are traditionally
associated with servers. Moreover, as the number of
connected users increases, the number of distribution
points grows too. As a consequence, the system scales
much better than any client-server counterpart.
The P2P streaming concept has nowadays been
deployed into several trial P2P streaming systems, such
as Sopcast [2], Joost [3], and Zattoo [4]. The online
broadcasting arena is then evolving, mainly due to the
clear commercial interest for these new technologies.
Many hosts can be supported by a P2P multimedia
system, possibly in excess of hundreds or even
millions, with miscellaneous heterogeneity in
bandwidth, capability, storage, network and mobility.
However, although most of the P2P applications are
designed to automatically load-balance computing
resources, they fail to pursue network efficiency.
Accordingly, this article begins by describing
experiments to assess the network efficiency in two of
the most popular P2P applications that is Sopcast for
the real-time broadcasting and Joost for the Video-on-
Demand (VoD) services. By analyzing traffic traces we
calculate and compare the network efficiency of these
systems, in terms of network locality and percentage of
P2P traffic (as a fraction of CS (Client-Server) traffic).
The percentage of P2P traffic, gives another form of
computational efficiency since the aim of P2P systems
is to minimize server intervention. We find, however,
that due to the particular nature of P2P streaming, it is
not always possible to do without server support and
that various systems address this issue in radically
different ways. P2P traffic percentage gives an
indication of both computational and network load
balancing. We also look at the latter property from the
view point of network locality, which is the ability to
keep traffic local (in addition to being spread out). Our
analysis reveals that network efficiency is being
354
International Journal on Advances in Intelligent Systems, vol 2 no 2&3, year 2009, http://www.iariajournals.org/intelligent_systems/
exploited poorly in the conventional P2P streaming
systems, which indicate new opportunities for
designing future applications aiming at network
computational and cost efficiency.
Following our analysis of two representative P2P
platforms, we then propose ways in which simple
modifications to existing protocols have the potential to
lead to significant benefits in terms of latency, jitter,
throughput, packet loss, and PSNR (Peak signal to
noise ratio). The important aspect of locality shows up
in our results as it confirms that user satisfaction and
network locality cannot be treated independently. For
instance in order to satisfy more users, network
resources should be treated efficiently which will in
return help in supporting more users. Our method aims
at improving network utilization and locality whilst at
the same time not degrading computational load
balancing. The proposed scheme is run under the ns-2
simulator [27].
2. Related Work Many studies have been published about P2P
streaming, but very few actually focus on the analysis
of the inter-relationship between computational and
network efficiency deriving from self-managed, P2P
networks. Existing work aims at understanding the
underlying algorithms of current applications which are
mostly proprietary. Single-systems analysis has been
carried out, like for example in the case of Joost.
Consideration on network utilization and locality are
given in [5] and [6].
Other studies are based on the comparison of two or
more P2P applications for video streaming [7].
However the focus is on examining similarities and
differences from the structural point of view, looking at
protocol utilization, percentage of download and
upload traffic, and signaling overheads. This is the
case, for example, of the work published by Silverston
and Fourmaux about Sopcast, TVAnts, and PPlive [7],
and by Ali et al. about Sopcast and PPlive [8] [9].
Other studies have considered different applications
such as [10] and [11]. Moreover, Gustavo Marfia et al
[12] have conducted an experimental study on Video-
On-Demand system and they were concerned about the
performance of the system on different environments
such as campus and residential. Thus, they gave some
results about protocol utilization and the start-up delay.
Additionally, they gave brief descriptions for the
existing architectures such as Tree and Mesh.
On the other hand, ways to pursue efficiency between
overlay and underlay networks have started to be
investigated only recently. Authors in [13] propose a
technique, where the peers on the overlay are chosen
based on their mutual physical proximity, in order to
keep traffic as localized as possible. A similar approach
is described in [14], where they measure the latency
distance between the nodes and appropriate Internet
servers called landmarks. A rough estimation of
awareness among nodes is obtained to cluster them
altogether, as in [15] [16].
Overlay locality is studied also by [17], where the
authors make use of network-layer information (e.g.
low latency, low number of hops and high bandwidth).
We use though a different distance metric, based on
RTT (round trip time) estimations, to prioritize overlay
transmissions. Additionally, we use a cluster
management algorithm whereby communicating peers
are forced to periodically handover, in order to pursue
computational as well as network efficiency (as
explained in [1] and [23]).
Hefeeda et al [18] have proposed a mechanism for P2P
media streaming using Collectcast. Their work was
based on downloading from different peers. They
compare topology-aware and end-to-end selection
based approaches.
The latter approach is also the subject of [19], which
employs a simpler version of our RTT approach based
on continuous pinging of peers. Similarly, we adopt
clustering to limit the signaling overheads associated
with this process and prevent bottlenecks.
Other studies such as [20], propose relevant methods to
serve multiple clients based on utility functions or
clustering. A dynamic overlay capable of operating
over large physical networks is presented in [21]. In
particular, they show how to maximize the throughput
in divisible load applications.
Looking at previous studies, we can say that our main
contributions are:
1. To complement other on-going studies with a view
to better understand the impact of P2P streaming
onto the network. Our main attention is on network
efficiency and locality, with the aim to identify
intrinsic deficiencies of existing platforms.
2. To propose a new approach to improve network
locality.
3. To study a new combination of existing techniques
(cross-layer optimization, localization, switching
over, forced handovers).
4. To take the perspective of the network operator, in
trying to harmonize overlay and underlay networks
355
International Journal on Advances in Intelligent Systems, vol 2 no 2&3, year 2009, http://www.iariajournals.org/intelligent_systems/

5. To quantify the impact of the network-aware
approach on QoS (Quality of Service) and QoE
(Quality of Experience) factors.
3. Experimental Setup Our experiments were conducted in the United
Kingdom. Measurements and data collection have been
carried out during Euro 2008, a major event when
thousands of users adopted P2P Sopcast application to
watch football matches live. We collected a unique
data set, measuring most of the Euro games. We have
collected 1.10 GB and that was observing the whole
match which is around 1 hour and 30 minutes.
Figure 1 - Experimental Environment
On the other hand, VoD data was collected from P2P
application Joost version 1.1.4. The overall size of our
trace files was 277 Mbytes. Moreover, it is worth
mentioning that the collected data for both live and on
demand includes the video of the game which was sent
to our client in UK. However, Figure 1, outlines the set
up of the two machines used for the collection of
traces, which were then used for packet analysis. The
machines were connected to a 100Mbps Ethernet,
connected to the campus Internet leased line. This
ensured that both inbound and outbound bandwidth
were considerably higher than the minimum required
for the correct functioning of Joost and Sopcast which
is 300-350 kbps for Sopcast and 500 kbps for Joost [5].
4. Performance Metrics Every single application can make use of different
strategies in order to provide a video streaming service.
However, there are some features that a P2P streaming
system should have in order to fully benefit from
resource distribution and load balancing. First of all,
for efficient network utilization, locality is one of the
main goals. Network locality is the ability to maintain
the P2P overlay in such a way as to create logical
connections among peers who are physically close to
each other. The ideal condition occurs when the most
intensive data exchanges happen among nearby peers.
4.1. Network Efficiency In order to evaluate the network efficiency of the two
scrutinized applications, we first had to come up with a
way to measure it, taking into consideration factors that
have an influence. Our approach has been to weight
positively those characteristics that improve efficiency
and vice versa.
We considered 15 observation windows, each of one
minute duration. Within each window we considered
the relative distance among all pairs of peers in terms
of average Round Trip Time (RTT) and its relation
with the amount of exchanged traffic volume
(expressed in Mbytes). The result is weighted by the
minimum RTT obtained during the whole observation
period (15 minutes) divided by the total of traffic
expressed in Mbytes. Moreover, it is commonly agreed
that the lower is the “RTT”, the more would be the
offered data rate (bandwidth). Thus, peers offering
lower RTTs are considered as having a higher available
bandwidth and that may be shared fairly among the
services.
∑∑=
=
=n
i i
i
n
j
j
i
d
d
t
tNe
1
1
)min(* [Eq1]
We have come up with Eq 1 which gives an account of
network efficiency.
Where Ne is the network efficiency and i = 1 …. n
identifies the set of connected hosts; ti is the traffic
coming into the node under scrutiny (or client node)
from each peer i, (expressed in Mbytes); ∑t j represents the total traffic coming from all the
connected hosts (considering all the observed peers in a
window); di represents the distance between the
intending client and each peer i, expressed as Round
Trip Time (RTT), min (di) indicates the minimum
distance between the client and all other peers across
the observed window. Hence, we can define the
efficiency factor for each of peer in a minute window.
4.2. Peers vs. Servers In order to ensure uninterrupted streaming experience,
P2P applications make use of servers that kick in the
streaming process when P2P traffic cannot meet the
necessary delivery deadlines. Hence, another measure
of efficiency is the ratio between client-server (CS) and
P2P traffic incurred in the network. Clearly, an
efficient system is the one in which most of the traffic
356
International Journal on Advances in Intelligent Systems, vol 2 no 2&3, year 2009, http://www.iariajournals.org/intelligent_systems/
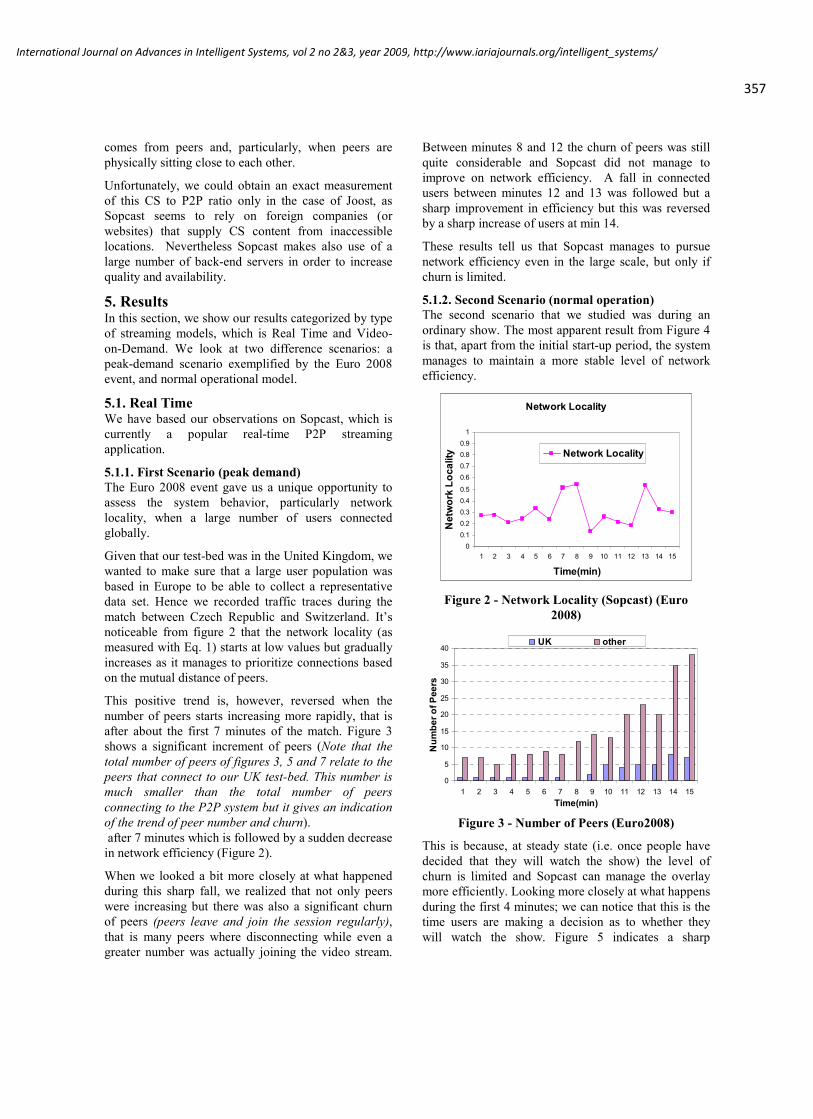
comes from peers and, particularly, when peers are
physically sitting close to each other.
Unfortunately, we could obtain an exact measurement
of this CS to P2P ratio only in the case of Joost, as
Sopcast seems to rely on foreign companies (or
websites) that supply CS content from inaccessible
locations. Nevertheless Sopcast makes also use of a
large number of back-end servers in order to increase
quality and availability.
5. Results In this section, we show our results categorized by type
of streaming models, which is Real Time and Video-
on-Demand. We look at two difference scenarios: a
peak-demand scenario exemplified by the Euro 2008
event, and normal operational model.
5.1. Real Time We have based our observations on Sopcast, which is
currently a popular real-time P2P streaming
application.
5.1.1. First Scenario (peak demand)
The Euro 2008 event gave us a unique opportunity to
assess the system behavior, particularly network
locality, when a large number of users connected
globally.
Given that our test-bed was in the United Kingdom, we
wanted to make sure that a large user population was
based in Europe to be able to collect a representative
data set. Hence we recorded traffic traces during the
match between Czech Republic and Switzerland. It’s
noticeable from figure 2 that the network locality (as
measured with Eq. 1) starts at low values but gradually
increases as it manages to prioritize connections based
on the mutual distance of peers.
This positive trend is, however, reversed when the
number of peers starts increasing more rapidly, that is
after about the first 7 minutes of the match. Figure 3
shows a significant increment of peers (Note that the
total number of peers of figures 3, 5 and 7 relate to the
peers that connect to our UK test-bed. This number is
much smaller than the total number of peers
connecting to the P2P system but it gives an indication
of the trend of peer number and churn).
after 7 minutes which is followed by a sudden decrease
in network efficiency (Figure 2).
When we looked a bit more closely at what happened
during this sharp fall, we realized that not only peers
were increasing but there was also a significant churn
of peers (peers leave and join the session regularly),
that is many peers where disconnecting while even a
greater number was actually joining the video stream.
Between minutes 8 and 12 the churn of peers was still
quite considerable and Sopcast did not manage to
improve on network efficiency. A fall in connected
users between minutes 12 and 13 was followed but a
sharp improvement in efficiency but this was reversed
by a sharp increase of users at min 14.
These results tell us that Sopcast manages to pursue
network efficiency even in the large scale, but only if
churn is limited.
5.1.2. Second Scenario (normal operation)
The second scenario that we studied was during an
ordinary show. The most apparent result from Figure 4
is that, apart from the initial start-up period, the system
manages to maintain a more stable level of network
efficiency.
Network Locality
0
0.1
0.2
0.3
0.4
0.5
0.6
0.7
0.8
0.9
1
1 2 3 4 5 6 7 8 9 10 11 12 13 14 15
Time(min)
Network Locality Network Locality
Figure 2 - Network Locality (Sopcast) (Euro
2008)
0
5
10
15
20
25
30
35
40
1 2 3 4 5 6 7 8 9 10 11 12 13 14 15
Time(min)
Number of Peers
UK other
Figure 3 - Number of Peers (Euro2008)
This is because, at steady state (i.e. once people have
decided that they will watch the show) the level of
churn is limited and Sopcast can manage the overlay
more efficiently. Looking more closely at what happens
during the first 4 minutes; we can notice that this is the
time users are making a decision as to whether they
will watch the show. Figure 5 indicates a sharp
357
International Journal on Advances in Intelligent Systems, vol 2 no 2&3, year 2009, http://www.iariajournals.org/intelligent_systems/

decrease in watchers. Our in-depth observations also
showed that there was also significant churn, hence the
poor network performance.
We also notice that, although most of the traffic is
coming from outside the UK, there is a good level of
locality. This was due to the fact that the network was
relatively uncongested with relatively low values of
RTTs.
Network Locality
0
0.2
0.4
0.6
0.8
1
0 1 2 3 4 5 6 7 8 9 10 11 12 13 14 15
Time(min)
Network Locality
Network locality
Figure 4 - Network Locality (Sopcast) (Ordinary
Day)
0
2
4
6
8
10
12
1 2 3 4 5 6 7 8 9 10 11 12 13 14 15
Time(min)
Number of Peers
UK Other SERVER
Figure 5 - Number of peers (Ordinary)
5.2. Video-On-Demand Video-On-Demand traces were taken from Joost which
has emerged more recently but is already gaining
significant attention. Joost operates in a rather different
way than Sopcast [5] [6]. It employs a statistical load-
balancing algorithm which seems more efficient than
other systems from the computational viewpoint [5].
Our study shows, however, that this benefit is achieved
at the expenses of network efficiency. Our experiments
were conducted running Joost in our UK-based test-
bed. Traces relating to the most popular Joost channels
were collected. Equation 1 was used to benchmark
network efficiency as for the case of Sopcast.
By looking at the combined results from Figures 6 and
7 we can draw some lessons about the approach
followed by Joost. The most apparent difference with
the results obtained from Sopcast is that in Joost there
is a continuous fluctuation in network efficiency. This
results from the fact that Joost continuously forces
handover among the intercommunicating peers, with
the aim to maximize computational load-balancing.
Network Locality
0
0.1
0.2
0.3
0.4
0.5
0.6
0.7
0.8
0.9
1
1 2 3 4 5 6 7 8 9 10 11 12 13 14 15
Time(min)Network Locality Network Locality
Figure 6 - Network Locality (Joost)
0
1
2
3
4
5
6
7
8
9
10
1 2 3 4 5 6 7 8 9 10 11 12 13 14 15
Time(min)
Number of Peers and Servers
Uk Other Joost Server
Figure 7 - Number of peers (Joost)
Because inter-communicating peers are forced to
handover, network efficiency is dominated by varying
link conditions (i.e. RTT values).
To counter the best-effort nature of those links, Joost
deploys streaming servers in strategic locations.
Currently there appear to be 2 servers in the US and 2
in Europe (one of which in the UK). Each server has
many clients to upload the content to the receivers and
this is clear from figures 6 and 7 where we sometime
notice number of servers up to 5.
When those servers kick in, network efficiency drops,
as is visible for instance at minutes 6 and 9. Figure 7
actually shows that the server-originating content is
considerable in Joost. Also the amount of P2P traffic
coming from outside the UK is significantly higher
358
International Journal on Advances in Intelligent Systems, vol 2 no 2&3, year 2009, http://www.iariajournals.org/intelligent_systems/
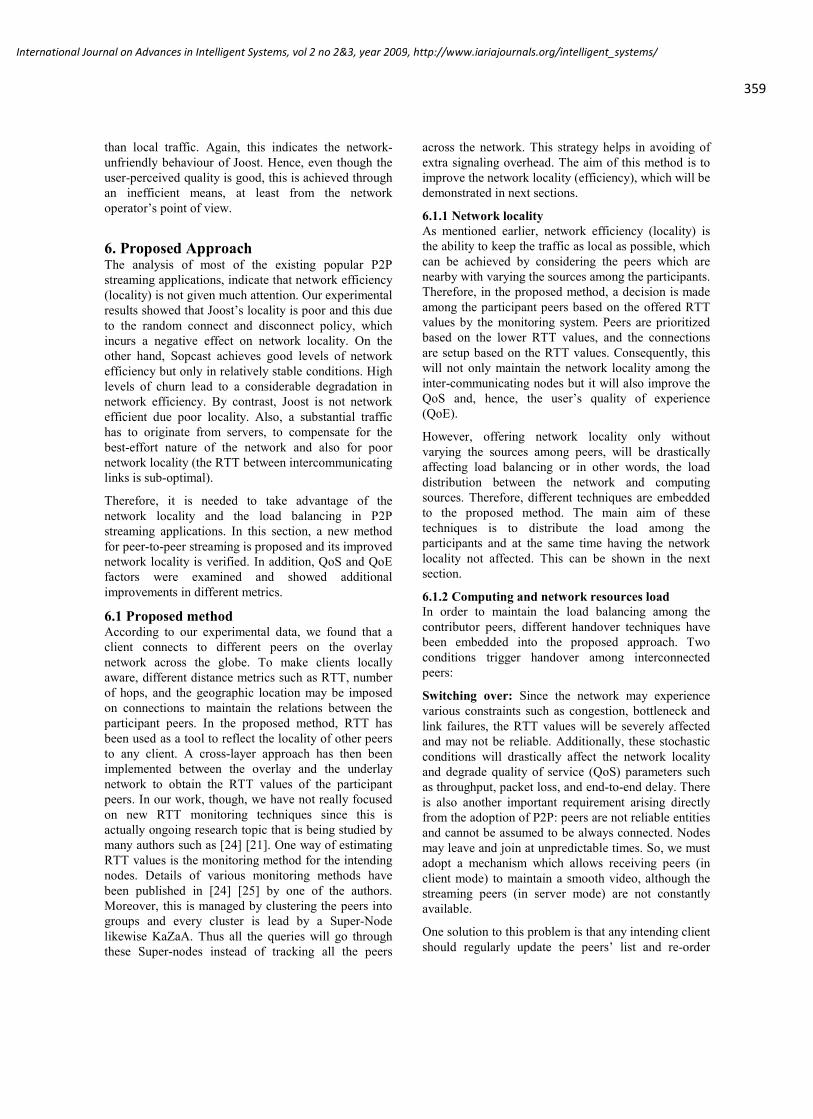
than local traffic. Again, this indicates the network-
unfriendly behaviour of Joost. Hence, even though the
user-perceived quality is good, this is achieved through
an inefficient means, at least from the network
operator’s point of view.
6. Proposed Approach The analysis of most of the existing popular P2P
streaming applications, indicate that network efficiency
(locality) is not given much attention. Our experimental
results showed that Joost’s locality is poor and this due
to the random connect and disconnect policy, which
incurs a negative effect on network locality. On the
other hand, Sopcast achieves good levels of network
efficiency but only in relatively stable conditions. High
levels of churn lead to a considerable degradation in
network efficiency. By contrast, Joost is not network
efficient due poor locality. Also, a substantial traffic
has to originate from servers, to compensate for the
best-effort nature of the network and also for poor
network locality (the RTT between intercommunicating
links is sub-optimal).
Therefore, it is needed to take advantage of the
network locality and the load balancing in P2P
streaming applications. In this section, a new method
for peer-to-peer streaming is proposed and its improved
network locality is verified. In addition, QoS and QoE
factors were examined and showed additional
improvements in different metrics.
6.1 Proposed method According to our experimental data, we found that a
client connects to different peers on the overlay
network across the globe. To make clients locally
aware, different distance metrics such as RTT, number
of hops, and the geographic location may be imposed
on connections to maintain the relations between the
participant peers. In the proposed method, RTT has
been used as a tool to reflect the locality of other peers
to any client. A cross-layer approach has then been
implemented between the overlay and the underlay
network to obtain the RTT values of the participant
peers. In our work, though, we have not really focused
on new RTT monitoring techniques since this is
actually ongoing research topic that is being studied by
many authors such as [24] [21]. One way of estimating
RTT values is the monitoring method for the intending
nodes. Details of various monitoring methods have
been published in [24] [25] by one of the authors.
Moreover, this is managed by clustering the peers into
groups and every cluster is lead by a Super-Node
likewise KaZaA. Thus all the queries will go through
these Super-nodes instead of tracking all the peers
across the network. This strategy helps in avoiding of
extra signaling overhead. The aim of this method is to
improve the network locality (efficiency), which will be
demonstrated in next sections.
6.1.1 Network locality
As mentioned earlier, network efficiency (locality) is
the ability to keep the traffic as local as possible, which
can be achieved by considering the peers which are
nearby with varying the sources among the participants.
Therefore, in the proposed method, a decision is made
among the participant peers based on the offered RTT
values by the monitoring system. Peers are prioritized
based on the lower RTT values, and the connections
are setup based on the RTT values. Consequently, this
will not only maintain the network locality among the
inter-communicating nodes but it will also improve the
QoS and, hence, the user’s quality of experience
(QoE).
However, offering network locality only without
varying the sources among peers, will be drastically
affecting load balancing or in other words, the load
distribution between the network and computing
sources. Therefore, different techniques are embedded
to the proposed method. The main aim of these
techniques is to distribute the load among the
participants and at the same time having the network
locality not affected. This can be shown in the next
section.
6.1.2 Computing and network resources load
In order to maintain the load balancing among the
contributor peers, different handover techniques have
been embedded into the proposed approach. Two
conditions trigger handover among interconnected
peers:
Switching over: Since the network may experience
various constraints such as congestion, bottleneck and
link failures, the RTT values will be severely affected
and may not be reliable. Additionally, these stochastic
conditions will drastically affect the network locality
and degrade quality of service (QoS) parameters such
as throughput, packet loss, and end-to-end delay. There
is also another important requirement arising directly
from the adoption of P2P: peers are not reliable entities
and cannot be assumed to be always connected. Nodes
may leave and join at unpredictable times. So, we must
adopt a mechanism which allows receiving peers (in
client mode) to maintain a smooth video, although the
streaming peers (in server mode) are not constantly
available.
One solution to this problem is that any intending client
should regularly update the peers’ list and re-order
359
International Journal on Advances in Intelligent Systems, vol 2 no 2&3, year 2009, http://www.iariajournals.org/intelligent_systems/

them based on the lower RTT values. In our
implementation, we keep a ranking list based on RTT
distances. Each peer streams to and from 3 other ones.
Hence, when this list changes, we apply a switch-over
to the new top 3 peers (those with minima RTT to the
peer under consideration). This approach has been
chosen according to previous findings published in [4]
where we found that the average of the active peers that
usually a node is downloading from is 3 to 4.
Therefore, in this model, the maximum number of
sender nodes has been set to be three.
Enforced handover: Another favorable property in the
proposed method is the computational efficiency. This
can be achieved when the load is periodically
distributed among the peers. However, under normal
network conditions, peers with lower RTT are selected,
but if the condition changes, switch over is applied to
the new peers with lower RTT values.
However, some peers may not experience any
constraints such as congestion, bottleneck, and link
failures. The RTT values will not be affected and may
not be changed, so those peers may become the best in
every periodical check. Therefore, selecting them
regularly would impair the load balancing between the
computing and network resources among the peers and
the network locality, so an enforced handover is
applied.
Furthermore, to avoid pure randomness on the enforced
handover process, network locality is applied into
clusters of peers, named super-peers, similar to the one
adopted in KAZA [27]. Thus, peers are grouped and
they are managed by a special peer, or super node. Our
experiments have confirmed that the peers on the same
cluster share nearly the same RTT values.
7. Performance Evaluation
7.1 Simulation setup The proposed method has been tested using the ns-2
simulator [27]. The network topology considered for
simulations is shown in Figure 8. Moreover, different
parameters have been set on for the target topology.
First of all, links bandwidth is distributed to all the
links evenly as 2Mbps for every link with the same
delay; so, all the participants’ peers have the same
properties. IP as the network protocol and UDP as the
transport protocol have been chosen. For simulation of
video traffic, the “Paris” sequence of CIF resolution
with 4:2:0 formats, was H.264/AVC coded and its
packets (chunks) were sent from different peers to the
receiver to be assembled on-the-fly by the decoder.
These techniques mimic the mesh-based approach on
P2PTV streaming. Additionally, to simulate the
proposed mechanisms in a more realistic environment,
CBR background traffic with UDP transport protocol
of packet size of 512-bytes for an average of 1.5Mbps
was injected on to the network.
7.2 Simulation scenarios To verify the proposed method, two scenarios have
been implemented, run, evaluated, and compared to
each other. The two scenarios have been considered in
this paper. The first one considers the proposed
method; the second one mimics a typical P2PTV
system where peers connect and switchover to and
from different peers randomly (in results section called
Randomized approach), striving for computational
load-balancing, as described in [1] [23]. Both scenarios
are applied to the same network and loading
conditions.
Figure 8 - Simulation Topology
7.3 Evaluation metrics In order to assess the proposed scheme, different
network parameters should be identified, tested and
evaluated. The following parameters have been
considered:
• Network Locality
• Quality of Service (QoS)
• Quality of Experience (QoE)
8. Results
8.1 Network locality Network efficiency is the first demand of the proposed
method where the inter-connections among the peers
should not be done randomly. Thus, it can be seen from
figure 9 how the approach is supporting the receiving
360
International Journal on Advances in Intelligent Systems, vol 2 no 2&3, year 2009, http://www.iariajournals.org/intelligent_systems/
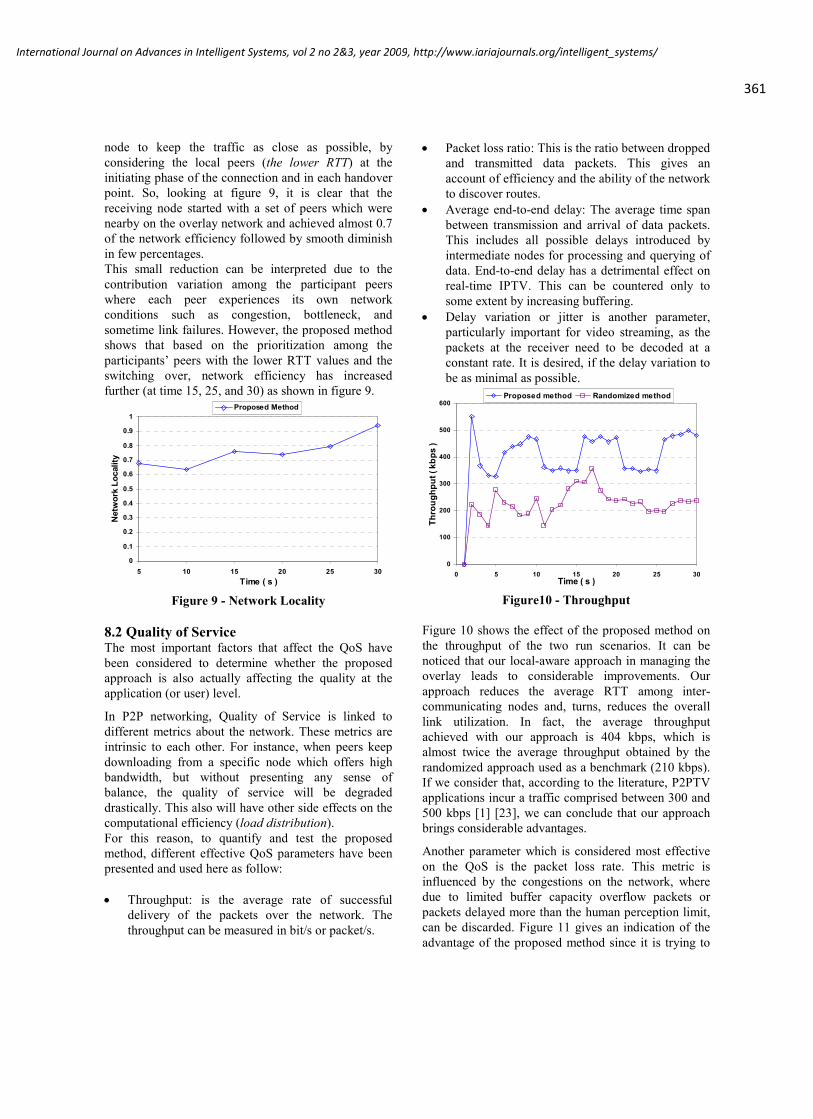
node to keep the traffic as close as possible, by
considering the local peers (the lower RTT) at the
initiating phase of the connection and in each handover
point. So, looking at figure 9, it is clear that the
receiving node started with a set of peers which were
nearby on the overlay network and achieved almost 0.7
of the network efficiency followed by smooth diminish
in few percentages.
This small reduction can be interpreted due to the
contribution variation among the participant peers
where each peer experiences its own network
conditions such as congestion, bottleneck, and
sometime link failures. However, the proposed method
shows that based on the prioritization among the
participants’ peers with the lower RTT values and the
switching over, network efficiency has increased
further (at time 15, 25, and 30) as shown in figure 9.
0
0.1
0.2
0.3
0.4
0.5
0.6
0.7
0.8
0.9
1
5 10 15 20 25 30
Time ( s )
Network Locality
Proposed Method
Figure 9 - Network Locality
8.2 Quality of Service The most important factors that affect the QoS have
been considered to determine whether the proposed
approach is also actually affecting the quality at the
application (or user) level.
In P2P networking, Quality of Service is linked to
different metrics about the network. These metrics are
intrinsic to each other. For instance, when peers keep
downloading from a specific node which offers high
bandwidth, but without presenting any sense of
balance, the quality of service will be degraded
drastically. This also will have other side effects on the
computational efficiency (load distribution).
For this reason, to quantify and test the proposed
method, different effective QoS parameters have been
presented and used here as follow:
• Throughput: is the average rate of successful
delivery of the packets over the network. The
throughput can be measured in bit/s or packet/s.
• Packet loss ratio: This is the ratio between dropped
and transmitted data packets. This gives an
account of efficiency and the ability of the network
to discover routes.
• Average end-to-end delay: The average time span
between transmission and arrival of data packets.
This includes all possible delays introduced by
intermediate nodes for processing and querying of
data. End-to-end delay has a detrimental effect on
real-time IPTV. This can be countered only to
some extent by increasing buffering.
• Delay variation or jitter is another parameter,
particularly important for video streaming, as the
packets at the receiver need to be decoded at a
constant rate. It is desired, if the delay variation to
be as minimal as possible.
0
100
200
300
400
500
600
0 5 10 15 20 25 30Time ( s )
Throughput ( kbps )
Proposed method Randomized method
Figure10 - Throughput
Figure 10 shows the effect of the proposed method on
the throughput of the two run scenarios. It can be
noticed that our local-aware approach in managing the
overlay leads to considerable improvements. Our
approach reduces the average RTT among inter-
communicating nodes and, turns, reduces the overall
link utilization. In fact, the average throughput
achieved with our approach is 404 kbps, which is
almost twice the average throughput obtained by the
randomized approach used as a benchmark (210 kbps).
If we consider that, according to the literature, P2PTV
applications incur a traffic comprised between 300 and
500 kbps [1] [23], we can conclude that our approach
brings considerable advantages.
Another parameter which is considered most effective
on the QoS is the packet loss rate. This metric is
influenced by the congestions on the network, where
due to limited buffer capacity overflow packets or
packets delayed more than the human perception limit,
can be discarded. Figure 11 gives an indication of the
advantage of the proposed method since it is trying to
361
International Journal on Advances in Intelligent Systems, vol 2 no 2&3, year 2009, http://www.iariajournals.org/intelligent_systems/

reduce the packet loss by switching over among the
peers in case of congestion. On the other hand, the
randomized approach is showing packet loss and which
is due to the randomness in selecting and switching
over among the peers.
Packet loss can be considered the most crucial factor in
video decoding and, consequently, a determining factor
for video Quality of Experience (QoE). It is therefore
essential to verify that the P2P overlay is optimized
with this regard. Table 1 summarizes findings
published in [28], correlating packet loss ratio with
video streaming Quality-of-Experience (QoE), for the
case of single-layer coding. It is noticeable that any
value above around 14% leads to poor quality.
According to this table, the proposed method shows a
smooth video to the end-users.
0
2
4
6
8
10
12
14
0 5 10 15 20 25 30
Time ( s )
Packet loss ratio (%)
Proposed method Randomized method
c
Figure11 - Packets loss ratio
Packet loss
ratio [%]
QoE
acceptability
[%]
Video quality playback
0 84 Smooth
14 61 Brief interruptions
18 41 Frequent interruptions
25 31 Intolerable interruptions
31 0 Stream breaks
Table 1 Quality of experience acceptability
thresholds
Another important performance metric in video
streaming is end-to-end latency (or delay), which is
critical in the process of meeting strict playback
deadlines. In turn, this has a direct impact on quality of
service and quality of experience.
Figure 12 shows the average end-to-end delays of both
scenarios. Noticeably, our approach gives a lower
average latency (order of 0.02 seconds); also, we can
see that the delay is consistent, due to the fact that
connections are not chosen randomly. On the other
hand, delay in the randomized approach is fluctuating.
This variation in delay may in turn increase packet loss
with detrimental effect on QoE.
Figure 13 illustrates this attribute in terms of jitter. A
nearly constant jitter derives from the fact that peer
handover is governed by a prioritization process (based
on RTT values), which ensures that nearby nodes are
chosen first. The small variation in jitter in our
approach is due to the fact that we still need to force
handover even in the case of optimal connections, to
maintain a good computational load balance.
0
0.01
0.02
0.03
0.04
0.05
0.06
0 5 10 15 20 25 30Time ( s )
AVG.E2E Delay
Proposed method Randomized method
Figure12 - End-to-End Delay
0
0.01
0.02
0.03
0.04
0.05
0.06
0 5 10 15 20 25 30Time ( s )
AVG.Jitter (sec)
Proposed method Randomized method
Figure13 - Jitter
8.3 Quality of Experience Finally, the objective and subjective quality of decoded
video under the proposed and randomized methods are
compared. The received packets are decoded using
error concealment of H.264/AVC encoder JM15. The
resulting PSNR is shown in fig. 14 comparing both the
362
International Journal on Advances in Intelligent Systems, vol 2 no 2&3, year 2009, http://www.iariajournals.org/intelligent_systems/

algorithms. It is clear that the PSNR improvement is
more than 2 dB in most cases, showing the efficiency
of our proposed algorithm. The key reason behind the
improved PSNR is the smaller degree of packet loss of
the proposed method, as shown in fig 11.
Figures 15 and 16 compare the subjective quality of the
proposed method against the randomized method
respectively, quality of picture on the table, where on
the randomized method, the cup, pen, and papers are
missing, but in the proposed method, picture quality is
considerably better.
17
19
21
23
25
27
29
31
1.5 1.6 1.7 1.8 1.9 2
Netrwork Overload (Mbps)
PSNR(dB)
Proposed Method Randomized Method
Figure14 – PSNR
6. Concluding Remarks In this paper, we first evaluate the state of the art in
P2P streaming by carrying out a methodical study base
on two popular frameworks. Once we identify key
shortcomings, we move into an attempt to find simple
yet practical and effective ways to address them.
We have looked at two different approaches (Sopcast
and Joost), two different streaming models (real-time
and VoD), and two different scenarios (peak and
ordinary demand levels). In each of the above cases,
the aim of the designer was to build a self-managed
network overlay that could handle large-scale demand,
regardless of fluctuating network conditions and user
location.
The P2P paradigm addresses the issue of scalability by
limiting the amount of server intervention. As of today,
however, P2P application designers do not seem to
have placed sufficient emphasis on the need to come up
with network-friendly solutions. In this article we have
introduced a formula to measure network efficiency in
a way that captures network locality (distance among
interconnecting peers), link conditions (RTT of those
links), and degree of server intervention (ratio between
CS and P2P traffic).
A key outcome of our study is that existing approaches
do not achieve a good trade-off between computational
and network efficiency. Sopcast achieves good levels
of network efficiency but only in relatively stable
conditions. High levels of churn lead to a considerable
degradation in network efficiency. By contrast, Joost is
not network efficient due poor locality. Also, a
substantial traffic has to originate from servers, to
compensate for the best-effort nature of the network
and also for poor network locality (the RTT between
intercommunicating links is sub-optimal).
Figure 15 - Video Quality (Proposed)
Figure 16 - Video Quality (Randomized)
Existing P2P streaming applications (such as Sopcast
and Joost) are appealing from the point of view of the
application (or P2P framework) provider as well as the
content provider due to the reduced digital distribution
costs. However, from the network provider’s
perspective, such applications do not represent an ideal
solution. Problems include:
363
International Journal on Advances in Intelligent Systems, vol 2 no 2&3, year 2009, http://www.iariajournals.org/intelligent_systems/

• Network inefficiency: as demonstrated by our
study, network resources are used sub-optimally.
• Traffic aggregation: it is very hard, if not
impossible to perform traffic aggregation since
traffic sources and destination are not chosen
deterministically.
• Manageability: it is very hard to forecast and
monitor traffic since user behaviour is
unpredictable and traffic sources and destination
are not deterministic. Network dimensioning,
planning, and control are also difficult.
• Economic models: it is hard to think of a way for
the network operator to profit from P2P streaming
when most charging models are based on flat rates.
Our proposal is to look for algorithms that employ a
certain degree of cross-layer optimization but that
retain the simplicity of existing approaches to the best
possible extent. In the second part of this article we
give an example of a possible way to improve network
efficiency and, ultimately, quality of experience.
Our study suggests that the prospects of P2P streaming
seem very good if the scalability of this approach is
assessed from the application (or even the user) view
point. However, if we look from the angle of the
network operator the scenario is rather different.
Tackling the complex issue of P2P streaming in
isolation from network and network management and
dimensioning problems is not promising. Simple yet
effective approaches based on cross-layer techniques
are significantly more powerful.
7. References [1] M. Alhaisoni, A. Liotta, M. Ghanbari, “An assessment of Self-
Managed P2P Streaming”, In Proc. Of ICAS2009 (the 6th International Conference on Autonomic and Autonomous Systems and published by IEEE Computer Society, pp.34-39, 21-24 April 2009 Valencia, Spain.
[2] www.Sopcast.com. Last Access was on 15th of October 2008
[3] www.Joost.com. Last Access was on 27th of October 2008
[4] www.zattoo.com. Last Access was on 20th of October 2008
[5] M. Alhaisoni,, A. Liotta. (2009). Characterization of signaling and traffic in Joost. Peer-to-Peer Networking and Applications, 2(1), 75-83.
[6]
[7] Jun Lei, ,Lei Shi and Xiaoming Fu, (2007)An Experimental Analysis of Joost Peer to Peer VOD Services, Technical
Report, Computer Networks Group, University of Gottingen ,Germany.
[8] T. Silverston and O. Fourmaux, “P2P IPTV Measurement: A Comparaison Study”, Universit´e Pierre et Marie Curie, Paris, France.
[9] Ali, S., Mathur, A., and Zhang, H. 2006. "Measurement of commercial peer-to-peer live video streaming". In Proceedings First International Workshop on Recent Advances in Peer-to-Peer Streaming (WRAIPS), August 10, 2006, Waterloo, Ontario, Canada,(pp. 1-12).
[10] Hei,X., Liang,C. ,Liu,Y. and Ross,K.(2007) ‘A measurement stud y of a large scale P2P IPTV system’, IEEE Transactions on Multimedia, Volume: 9, Issue: 8, page(s): 1672-1687
[11] Yong Liu, Yang Guo, Chao Liang, "A survey on peer-to-peer video streaming systems". The Journal of P2P Networking and Applications, Springer, Volume 1, Number 1 / March, 2008, pp. 18-28
[12] Tobias Hoßfeld et al , "A Qualitative Measurement Survey of Popular Internet-based IPTV Systems" 4-6 June 2008, page(s): 156-161
[13] Susu Xie, Bo Li Keung, G.Y. Xinyan Zhang .(2007) ‘Coolstreaming: design, theory ,and practice’ ,IEEE Transactions on Multimedia,Vol.9,No.8,December, page(s): 1661-1671
[14] Y. Liu, X. Liu, L. Xiao, L. M. Ni, and X. Zhang, "BLocation-aware topology matching in P2P systems", in Proc. INFOCOM, Date: 7-11 March 2004 Volume: 4, On page(s): 2220- 2230 vol.4
[15] Z. Xu, C. Tang, and Z. Zhang, “Building topology-aware overlays using globalsoft-state”, in Proc. ICDCS, 19-22 May 2003 On page(s): 500- 508
[16] S. Banerjee, B. Bhattacharjee, and C. Kommareddy, “Scalable application layer multicast”, Dept. of Comput. Sci., Univ. of Maryland, 2002, Tech. Rep. UMIACS.
[17] B. Zhao, A. Joseph, and J. Kubiatowicz, “Locality aware mechanisms for large-scale networks”, in Proc. Workshop Future Directions Distrib. Comput. (FuDiCo), 2002.
[18] Mushtaq, M., Ahmed, T. “P2P Object-based adaptivE Multimedia Streaming”, In J Netw Syst Manage (2007), Volume 15 , Issue 3, Pages: 289 - 310
[19] T. P. Nguyen and A. Zakhor. “Distributed video streaming over Internet”, In Proc. SPIE, Multimedia Computing and Networking., volume 4673, pages 186–195, December 2001.
[20] T. Nguyen and A. Zakhor. “Distributed video streaming with
forward error correction”, In Proc. Packet Video Workshop, Pittsburgh, USA, April 2002.
[21] M.Hefeeda, A.Habib, B.Botev, D.Xu, and B.Bhargava (2003), "PROMISE:peer-to-peer media streaming using CollectCast".
364
International Journal on Advances in Intelligent Systems, vol 2 no 2&3, year 2009, http://www.iariajournals.org/intelligent_systems/
In Proc.of ACM Multimedia 2003,pages 45–54, Berkeley ,CA ,USA, November.
[22] Mushtaq, M., Ahmed, T. “Adaptive Packet Video Streaming over P2P Networking Using Active measurements”, In ISCC 2006, Proceeding of the 11th IEEE Symposium on Computers and Communications, pp. 423-428, IEEE Computer Society, Los Alamitos.
[23] Hefeeda ,M.M and Bhargava ,B.K.(2003 ) ‘On-demand media streaming over the internet’, In Proceedings of the The Ninth IEEE Workshop on Future Trends of Distributed Computing Systems, Page: 279
[24] M. Alhaisoni, A. Liotta, M. Ghanbari, “Resource awareness and trade off optimization in P2P Video Streaming", accepted in International Journal of Advance Media Communication, special issue on High-Quality Multimedia Streamingin P2P Environments.
[25] Ragusa C, Liotta A, Pavlou G. “An adaptive clustering approach for the management of dynamic systems”, IEEE
Journal on Selected Areas in Communications, 2005; 23(12) 2223–2235
[26] Liotta A, Pavlou G, Knight G. “Exploiting agent mobility for large-scale network monitoring”, IEEE 2002; 16(3), 7–15
[27] KaZaA: http://www.kazaa.com. Last Access was on 27th of Sep. 2009
[28] http://isi.edu/nsnam/ns/ Last Access was on 27th of Sep. 2009
[29] Agboma, F., Smy, M. and Liotta, A. (2008) QoE analysis of a peer to-peer television system. In Proceedings of IADISInt. Conf. on Telecommunications, Networks and Systems, Pages 111-116
365
International Journal on Advances in Intelligent Systems, vol 2 no 2&3, year 2009, http://www.iariajournals.org/intelligent_systems/

Database Connection Monitoringfor Component-based Persistence Systems
Uwe Hohenstein and Michael C. JaegerSiemens AG, Corporate Research and Technologies
Otto-Hahn-Ring 6, D-81730 Munich, GermanyEmail: {uwe.hohenstein|michael.c.jaeger}@siemens.com
Abstract—Server applications often use a relational databasemanagement system (RDBMS) for storing and managing theirdata. Storage and management is not limited to the RDBMSitself, but involves also other software forming a persistencesystem. Such system has become complex. Besides the RDBMSit includes drivers, connection pools, query languages, themapping between application logic and a database data modeland it involves the optimisation of resources. One importantresource is the connection from applications to the databasesystem, because the acquisition of a connection is a veryexpensive operation.
This work introduces monitoring facilities for the use ormisuse of connections in component-based applications. Inparticular, it explains how the monitoring can take place inorder to configure connection pooling for a set of differentcomponents. The implemented solution uses conventional pro-gramming methods as well as an aspect-oriented approach.The described facilities are integrated into the development ofan enterprise-scale application implementing a communicationsmiddleware.
Keywords-persistence systems; O/R mapping; connectionpooling; performance;
I. INTRODUCTION
When it comes to persisting application data, relationaldatabase management systems (RDBMSs) are still the mostused technology. If the application is written in an object-oriented programming language and a RDBMS is chosen,a mapping between the object data and the relational datamodel takes place. For this purpose, object-relational (O/R)persistence frameworks exist that implement the orthogonalpersistence of data objects [1]. Examples are Hibernate [11],or OpenJPA [22] for the Java platform. By using such atechnology, the data model can stay purely object-oriented.Then, programming can be done on an abstract object-oriented level, i.e., operations for storing and retrieving Javaobjects are provided. The O/R framework translates thoseobject-oriented operations into SQL statements.
In principle, these O/R frameworks ease the work withRDBMSs. However, once the application becomes morecomplex, once it involves different components and when itprocesses huge amounts of data, the allocation of resourcesbecomes an important issue for providing optimal perfor-mance. An intuitive use of persistence frameworks is notsufficient anymore; the developer must know implications of
the used technology and must understand the basic principlessuch as caching and lazy/eager fetching strategies in orderto preserve a high performance level.
Functionality and operations that involve persistence in-volve also the use of heavy-weight objects or can requirethe handling of large amounts of data. For example, carelesssetting of eager fetching can multiply the amount of datasetsretrieved. With O/R frameworks and database communi-cation, several heavy-weight objects are used, such as anentity that manages the mapping during run time, or theentity that handles the connection to the RDMS. As aconsequence, developers must be aware of settings such asfetching strategies as well as of the proper use of API withregard to the creation of heavy-weight objects.
This work will explain the technical mechanisms manag-ing the connections from the application to the RDMS in thecontext of a large-scale application middleware developed bySiemens Enterprise Communications (SEN). This middle-ware implements a service-oriented, server-based platformfor common services in the communications domain.
The next Section 2 will explain the particular problemswith database connections for component-based systems.The architecture of the SEN middleware is explained inmore detail in the next Section 3. Section 4 describesthe persistence subsystem of this middleware. Then, themonitoring of connections for this middleware will be ex-plained in Section 5. The presented approach makes useof the recent technology of aspect-orientation (AO) and isapplicable to common O/R frameworks such as Hibernateor OpenJPA. The subsequent Section 6 discusses the resultsof the connection monitoring. The paper will end with ourconclusions and future work in this area in Section 7.
II. COMMON PROBLEMS WITH DATABASECONNECTIONS
One important resource that must be handled carefullyin large-scale applications is a database connection. A con-nection object is generally considered a heavy-weight datastructure. A database system requires a lot of resourcesfor setting up the communication and to keep space forquery results etc. Hence, acquiring and releasing databaseconnections are expensive operations.
366
International Journal on Advances in Intelligent Systems, vol 2 no 2&3, year 2009, http://www.iariajournals.org/intelligent_systems/
A. Amount of Database Connections
In general, the number of connections is often limitedby a configuration parameter. Moreover, the underlyingoperating system, or the RDMS itself has its own limitswith regard to a maximum amount of open connections.This means that if one component missed to release aconnection, not only resources are wasted, but also othercomponents could be blocked when the overall number ofconnections is exhausted. O/R frameworks abstract fromdatabase connections by offering the concept of a session.A session includes a connection to the database, but doesnot solve those problems.
Moreover, large applications, having a lot of compo-nents and serving a lot of users, require a large numberof connections. But in most cases, it is not reasonableto keep connections for a long time. Especially service-oriented architectures (SOAs) are characterised by short-living operations where it does not make sense to holdconnections for a long time. Thus, such system has typicallya high rate of connection acquisitions.
And also the best practices for O/R frameworks suchas Hibernate and OpenJPA suggest using one connectionfor each transaction and to release it afterwards. This isinconsistent with general recommendations for using JDBCconnections, since requesting and releasing a connection istime-consuming. But this is necessary, because each sessionhas an associated object cache that becomes out-of-date attransaction end.
B. Connection Pooling
The efficient handling of short-living connections is sup-ported by connection pools. A connection pool is an entitythat allows multiple clients to share a set of connection ob-jects each one providing access to a database. This becomesimportant, if a large application will serve many clients thateach require connection objects. Most O/R frameworks suchas Hibernate can be configured to work with a connectionpool such as c3p0 [4] or DBCP [7]. Sharing connections in apool leads to less initialisation attempts of this data structureand thus significantly reduces the time when accessing theRDBMS.
However, a connection pool does not solve all the men-tioned problems. It basically reduces the number of requiredphysical connections by means of sharing. Whenever alogical connection is closed, the underlying physical con-nection is not closed but put back into the pool for furtherusage. Anyway, closing a logical connection can still beforgotten. Moreover, the parameterization of this pool is nottrivial. If the pool contains too few connections, componentswill have to wait until connections will be released byothers. If the pool maintains too many connections, the poolitself, the RDBMS and the operating system will consumeunnecessary resources for keeping connections open that arenot effectively used.
In order to cope with this case, a pool can be configuredto release pooled items after a certain period of inactivity.However, also this feature requires special attention, becauseif the connection pool might shrink too fast so that new con-nections must be acquired again; the advantage of a pooledconnection is lost. Finally, it is not easy to understand theentire semantics of configuration parameters. Details aboutthese parameters are not scope of this work, but interestedreaders are advised to compare the behaviour resulting fromsetting particular DBCP parameters with similarly appearingparameters from c3p0.
C. Issues with Component-Orientation
In a component-based system and also in SOA-basedsystems, the persistence system is usually provided as anindividual instance for each unit of deployment, in mostcases for each component or service. This is required,because the O/R mapping information must be given atthe persistence systems initialisation time. Otherwise theO/R framework would not know which mapping to performbetween objects and relational tables.
As a consequence, also an individual connection poolis maintained for each unit of deployment. Therefore, ina dynamic runtime environment, one can expect differentconnection pools for each persistence system that coversa domain of O/R mapping definitions. It becomes clearthat for a proper use of a connection pool an appropriateparameterization is required in order to ensure optimal per-formance: Each unit of deployment must provide sufficientconnections for the highest throughput, but otherwise justas few connections as possible to allow appropriate settingsfor other connection pools as well.
Configuring one connection pool is difficult, becauseit requires an appropriate load model and also sufficientmeasurements facilities. Besides the number of used con-nections, it must be also tracked, how long a component orthread is blocked when obtaining a connection. Consideringa component-based system, it becomes clear that configuringseveral pools is even more difficult: How can we obtainan appropriate load model that also resembles the requiredparallelism?
Moreover, services call each other, which implicitly relatetheir connection pools somehow implicitly. Even if theconnection pool of a service is large enough for its purpose,performance is degraded if the service is calling anotherservice the pool of which is congested. It is also clear thatconnection information from the RDBMS is not sufficient,because the RDBMS does usually not provide informationabout the originating component for a connection. Suchinformation can only be obtained by intercepting JDBCdrivers or the internals of O/R mapping frameworks.
367
International Journal on Advances in Intelligent Systems, vol 2 no 2&3, year 2009, http://www.iariajournals.org/intelligent_systems/

Java VM / OSGi Container
Service User Management
Service Contact
Managment
Service Device
Management
Service for 3rd party app...
Desktop Application
Administrator Application
3rd Party Application ...
SOA Platform / OSGi Extensions
ComponentLogging
ComponentService
Discovery
ComponentPersistence ...
Figure 1. OpenSOA Basic Architecture
III. THE OPENSOA MIDDLEWARE
The application case where the monitoring was appliedis a middleware called OpenSOA [28]. OpenSOA is im-plemented in Java and provides an open service platformfor the deployment and provision of communication ser-vices. Examples for such services are the capturing of userpresence, the management of calling domains, notifications,an administration functionality for the underlying switchtechnology, and so forth. One business case is to sellthese services for the integration in groupware and othercommunication applications along with the Siemens privatebranch exchange (PBX) solutions. The technical basis forOpenSOA is an OSGi container [23]. This specification waschosen over JEE [8] because of its smaller size and focusedfunctional extent.
In order to establish an infrastructure for the provisionof services, custom built or common off-the-shelf com-ponents (depending on the availability) were added. Forexample, they implement the discovery and registration ofservices among containers on different computers for a high-performance messaging infrastructure. Figure 1 outlines thebasic architecture: as the foundation, the software runs onJava and an OSGi container. Then, a tier provides com-ponents and extensions in order to implement a service-oriented architecture (SOA). On top of that, different ser-vices implement common functionality of a communicationsystem. Finally, different application can communicate withthis system using service interfaces.
The size of the entire code base (infrastructure andcommunication services) has similar dimensions as the dis-tribution of the JBoss application server with regard to thedefined classes (in the range of 5.000 to 10.000). It involvesabout 170 sub-projects among which about 20 projects usethe persistence system.
OpenSOA Service
OpenSOA Comp. / Lib.
Wrapper Template, Configuration
RDBS
O/R Mapping Framework (Hibernate, OpenJPA)
Connection Pool
JDBC Driver
OpenSOA Comp. / Lib.OpenSOA
Comp. / Lib.OpenSOA Comp. / Lib.
OpenSOA ServiceOpenSOA
ServiceOpenSOA Service
Figure 2. Persistence System Architecture
IV. OPENSOA PERSISTENCE SYSTEM
The previous overview OpenSOA did not explain thepersistence system of OpenSOA which is subject of thissection. Figure 2 shows the persistence architecture as anoutline. The persistence system is divided into different tiers.Each of the tiers accesses the functionality provided by thetier below. An OpenSOA service using persistence servicesgenerally accesses the wrapping template.
A direct access of the O/R mapping framework or JDBC isnot desired, however, cannot be prevented. The O/R mappingframework obtains connection from a connection pool. Andthe pool accesses the database via the JDBC driver. Again,the direct access to the database cannot be prevented byusing the JDBC driver. But in practise it is a set rule thatsuch calls are forbidden.
In the beginning, the Hibernate framework was used asimplementation of the O/R mapping. Then, because of apatent infringement claim against Red Hat (the vendor ofHibernate), the persistence system was migrated to OpenJPAdistributed by the Apache Software Foundation.
The entire persistence system allows OpenSOA for run-ning on several RBDSs. Various business reasons requirethe support of solidDB from IBM: solidDB provides highperformance paired with high reliability because of its hot-stand-by feature. In addition, MySQL and PostgreSQL arealso supported. Moreover, the persistence framework makesprogramming easier by offering an object-relational mappingin order to store and retrieve the data of Java objects.
A. Working with O/R Mapping
An O/R mapping framework like Hibernate or OpenJPArequires the information about which Java classes and whichfields in them are persistent, how classes map to tables,and how fields map to table columns and how pointers aremapped to foreign keys. OpenJPA supports the definition of
368
International Journal on Advances in Intelligent Systems, vol 2 no 2&3, year 2009, http://www.iariajournals.org/intelligent_systems/

mappings by using an XML-document or by annotation inthe Java code (with Java 5). In JPA, a self-contained set ofmapping definitions forms a so called persistence unit.
The APIs of Hibernate and OpenJPA are very similar.Both use a factory object that maintains connection objectsto the storage. The connection object is called Sessionin Hibernate and EntityManager in the JPA specification.Accordingly the factory objects are called SessionFactoryand EntityManagerFactory respectively. An EntityManager-Factory exists for each persistence unit. Consequently, aconnection pool is by default maintained for each persistenceunit.
For programming actual operations, the developers needsto obtain a Session or an EntityManager object. From aconceptual point of view, a connection to the databaseis opened then (Actually, OpenJPA, for example, can beconfigured to actually defer the opening of a connection inorder to tune for a shorter period of connection obtainment).The O/R mapping framework obtains database connectionsfrom a connection pool implementation, while the poolobtains concrete database connection from the JDBC driver.In addition, a connection pool such as DBCP or c3p0 is setbetween the JDBC driver and the persistence framework.The JDBC driver is used to communicate with the RDBMS.
A general recommended programming practice is to begina transaction as well at this point. When a session isopened, the developer can perform various object operations,such as creation, deletion, modifications that are translatedto according SQL statements. If a set of operations isfinished, the developer should commit the transaction andclose the session. From a conceptual point of view, theconnection to the database is closed then. In conjunctionwith a connection pool, the connection is free for the nextconnection acquisition then. Listing 1 shows an example usewith OpenJPA.
Listing 1. Example Use of OpenJPAEntityManagerFactory emf =Persistence.createEntityManagerFactory("myPerUnit");EntityManager em = emf.createEntityManager();EntityTransaction tx = em.getTransaction();Customer c = new Customer(4711);em.persist(c);Query q =
em.createQuery("SELECT c FROM Customer c");List result = q.list();Customer c2 = mySession.find(Customer.class, 42);tx.commit();em.close();
B. Wrapping Template
The OpenSOA middleware extends the persistence frame-work with a wrapping template implementation, whichstandardises the use of Hibernate or OpenJPA. This tem-plate works in a similar way as the JDBC abstraction inthe Spring framework [26]. It offers different functionalityupon the O/R mapping framework. It basically abstracts
from concepts such as OpenJPAs EntityManagerFactory(in principle a database with a schema and an associatedconnection pool), EntityManager (a database connection)and persistence units (logical database name). It ensures theappropriate and standardised use of this framework. Whena developer uses the persistence system via the wrappingtemplate, the following functions are provided:
1) Standardised parameterization of the persistenceframework. This includes the RDBMS URL, the ac-cess credentials as well as other settings performed bythe framework.
2) Standardised allocation of resources. A general settingfor opening and closing connections and transactionsis performed.
3) Standardised error handling. In case of recoverableerrors, exceptions returned by the persistence frame-work or by the JDBC driver are caught and a retryis initiated, e.g., in case of concurrency conflicts.Furthermore, exceptions are converted into OpenSOA-specific ones for coverage in the layers above.
Although it is theoretically possible for developers tocreate, for example for the OpenJPA case, an EntityMan-ager directly, this is generally a not allowed practice. Thesubsequent discussion will focus on OpenJPA and solidDBalthough the principles have been applied to the Hibernateframework and the other RDBMSs as well.
V. CONNECTION MONITORING
The general aim of the monitoring is the proper config-uration and usage of connections and the connection pool.Main pool parameters are the initial number of connections,the maximum and minimum number possible and the idletime after which a connection is closed after inactivity. It is acomplex task to determine appropriate settings for the pool.Moreover, it is important to monitor the correct usage ofconnections, e.g., to avoid that connections are not released.
The monitoring functionality has been implemented atdifferent levels in order to cover the different ways a client tothe persistence system can obtain connections. Generally, thedeveloper of a service should implicitly obtain connectionsby using the wrapping template. That is the first place tointegrate monitoring. However, this corresponds to a logicalacquisition of connections since not always real physicalconnections are requested thanks to pooling. The overallgoal is also to get information about any physical open/closeconnection activity in order to keep track of the number ofcurrently used connections for each functional unit. How-ever, there is major a problem to obtain this information:in principle, the JDBC driver needs to be intercepted, butfor example in case of solidDB, its source code is notavailable. To this end, the recent technology of aspect-oriented programming AOP provides an adequate solution.
369
International Journal on Advances in Intelligent Systems, vol 2 no 2&3, year 2009, http://www.iariajournals.org/intelligent_systems/

A. Aspect-Oriented Programming with AspectJ
Aspect-oriented programming (AOP) provides a solution,which is not immediately obvious. AOP has originally beenproposed for developing software to eliminate crosscuttingconcerns (CCCs) [10]. Those CCCs are functionalities thatare typically spread over several classes, thus leading to codetangling and scattering [5], [20] in conventional program-ming. AOP provides special extensions to Java to separatecrosscutting concerns. Recent research has shown usefulnessto this respect, e.g., [12], [25], [29], [13], [19].
AOP is ideal for monitoring purposes. So far, some toolsare implemented with AOP to monitor the system perfor-mance [3], [9]. We applied the AO language AspectJ [18],[16] to monitor the usage of database connections.
Programming with AspectJ is essentially done by Javaand newly aspects. An aspect concentrates crosscuttingfunctionality. The main purpose of aspects is to change thedynamic structure of a program by changing the programflow. An aspect can intercept certain points of the programflow, called join points. Examples of join points are methodand constructor calls or executions, attribute accesses, andexception handling. Join points are syntactically specifiedby means of pointcuts. Pointcuts identify join points in theprogram flow by means of a signature expression. Once joinpoints are captured, advices specify weaving rules involvingthose joint points, such as taking a certain action before orafter the join points.
As AspectJ is a new language, which offers no syntacticconstructs such as aspect, pointcut and advice, it requiresa compiler of its own. Usually, the AJDT plug-in willbe installed in Eclipse. However, a new compiler requireschanges in the build process, which is often not desired.Then, using Java-5 annotations is an alternative: Aspect codecan be written in pure Java; we could rely on standardEclipse with an ordinary Java compiler, without AJDT plug-in for AspectJ compilation etc. The Listing 2 is an examplethat uses Java classes with AspectJ annotations.
Listing 2. Example Use of OpenJPA@Aspectclass MyAspect {internal variables and methods;@Before(execution(* MyClass*.get*(..)) )public void myPC() {
do something before join point} ... }
An annotation @Aspect lets a Java class MyAspect be-come an aspect. If a method is annotated with @Before,@After etc., it becomes an advice that is executed before orafter join points, resp. Those annotations specify pointcuts asa String. This aspect possesses a @Before advice that addslogic before executing those methods that are captured bythe pointcut myPC. In order to use annotations, the AspectJruntime JAR is required in the classpath. To make the aspectactive, we also have to start the JVM (e.g., in Eclipse or an
OSGi container) with an javaagent argument referring to theAspectJ weaver. Annotations are then evaluated and becomereally active, because a so-called load-time weaving takesplace: Aspect weaving occurs whenever a matching class isloaded.
If loadtime weaving cannot be applied, e.g., if AspectJshould be applied to code running in an OSGi container, an-other pre-compilation approach can be used which requiresthe iajc compiler. We can take the aspect class and compileit into a JAR file with an ordinary Java compiler. Then,the aspects JAR can be applied to classes or existing JARs,particularly, 3rd party JARs such as Hibernate or JDBCdrivers. There is an iajc taskdef in ANT to make both stepseasier. That is the approach we are pursuing. This is only abrief overview of AspectJ; examples are given later in thecode samples.
B. Monitoring Component
All the connection information is collected by a cen-tral persistence statistics component. This component im-plements an OSGi component and acts as a subpart ofthe persistence system. This component offers two basicinterface parts:
One part provides the parameterisation of the statisticsfunctionality. It covers switching certain functionality on andoff. And it defines how detailed the monitoring results shouldbe. The output is written to a log with a definable frequency.
The other part receives the notifications of various con-nection attempts to obtain and release connections. The com-ponent receives such notifications and saves this informationin a counter-based local data structure. Since during thelife cycle, the entire application uses millions of connec-tions, a comprehensive logging of every attempt would notmake sense. Hence, the persistence statistics tracks for onlycurrently open entities and stores an operational maximumnumber in addition.
Furthermore, the persistence statistics component canplace an alert, if a connection remains open without anyclosing action, or if an attempt to close a non-existentconnection happens (where no preceding obtainment hastaken place). It is important to determine the origin ofconnection acquisitions, which could be resembled by thedatabase user or by the persistence unit. In our case, thereare only few database users are configured. Extracting thepersistence unit is a better choice.
The data for these events is also separated by the func-tional components. That is, the persistence statistics storesall attempts separated by the user management services, allby the contact list service, etc. Depending on the parame-terisation of the persistence statistics component, reports ofthis data can be written at different levels of granularity atdifferent time intervals.
370
International Journal on Advances in Intelligent Systems, vol 2 no 2&3, year 2009, http://www.iariajournals.org/intelligent_systems/

C. Connection Pool Monitoring: Wrapper Template
As already mentioned, the persistence system introducesa wrapping template that encapsulates database requests at acentral place. This template is a first place to add monitoringfunctionality. It covers the notification of following events:First, the wrapping template notifies the obtainment and therelease of an EntityManager of OpenJPA (which is a Sessionin Hibernate). Then, the template notifies the persistencestatistics component when such a logical connection isobtained or released. Depending on the parameterisation,the persistence framework can automatically initialise aconnection when a Session/EntityManager is obtained, orit can defer this step to later phases. For example, OpenJPAallows for three settings of connection initialisation:
a) a connection is automatically obtained for an obtainedEntityManager,
b) a connection is obtained if a transaction is opened andc) a connection is opened on demand when a connection
is actually used by the persistence framework.This represents the acquisition of logical connections.
Due to a connection pool, this does not necessarily acquirea new physical JDBC connection. Similarly, closing anEntityManager is handled. The Listing 3 presents an excerptof the template implementation.
Listing 3. Control Points in Operation Flowstart = System.currentTimeMillis();session = sessionFactory.openSession();if (OpenJPAWrapper.getStatistics()
.isNotificationsGenerallyEnabledYN()) {EntityManagerFactory emf =
this.sessionFactory.getEMF();persistenceUnit = (String)
emf.getConfiguration().toProperties(false).get("openjpa.Id");
OpenJPAWrapper.getStatistics().notifySessionOpened(
persistenceUnit, getActionId());}...EntityManager oem = session.getEM();trans = session.beginTransaction();if (OpenJPAWrapper.getStatistics().isNotificationsGenerallyEnabledYN()) {connectionId = jdbcConn.hashCode();
OpenJPAWrapper.getStatistics().notifyTemplateConnectionObtain(
persistenceUnit, getActionId(),connectionId, elapsed);
}stop = System.currentTimeMillis();elapsed = stop start;if (elapsed > THRESHOLD) {printTimingWarning("connection",
action, sql, elapsed);}start = System.currentTimeMillis();
if (OpenJPAWrapper.getStatistics().isNotificationsGenerallyEnabledYN()) {OpenJPAWrapper.getStatistics()
.notifyTemplateConnectionRelease(persistenceUnit, getActionId(), connectionId);
OpenJPAWrapper.getStatistics().notifySessionClosed(
persistenceUnit, getActionId());}session.close();
D. Connection Pool Monitoring: JDBC Driver
The overall goal is also to get information about any phys-ical open/close connection activity in order to keep track ofthe number of currently used connections for each functionalunit. Since the JDBC driver needs to be intercepted thesource code of which is generally not available, we applythe monitoring aspect as listed in Listing 4.
Listing 4. Aspect for JDBC Driver: Origin@Aspectpublic class ConnectionMonitorAspect {@AfterReturning(pointcut = "execution(Connection
solid.jdbc.SolidDriver.connect(..))",returning = "ret")public void monitorOpenJDBC(final Connection ret) {if (monitoringIsPossible) {String unit = determineFunctionalUnit();SolidConnection conn =
(SolidConnection) ret;theStatistics.notifyJDBCConnectionObtain
(unit, conn.hashCode());} } ...}
At a first glance, ConnectionMonitorAspect is a Javaclass that possesses a method named monitorOpenJDBC.However, an annotation @Aspect lets the Java class becomean aspect. Since the method is annotated with @AfterRe-turning, it becomes an advice that is executed after returningfrom a method; the returning clause binds a variable retto the return value. The method possesses a correspondingparameter Connection ret that yields access to the returnvalue.
The @AfterReturning annotation also specifies the point-cuts as a String. Here, any execution (execution) of amethod SolidDriver.connect with any parameters (..) re-turning a Connection is intercepted and the logic of themonitorOpenJDBC method is executed after being re-turned. In other words, this aspect monitors whenever aconnection is opened. It determines the functional unitand uses the hashCode to identify the connection andpass both to the persistence statistics by using theStatis-tics.notifyJDBCConnectionObtain.
There are other forms of advices such as @Before(executing before) or @Around (putting logic around orreplacing the original logic) which are handled similarly.Closing a connection via JDBC is monitored by the aspectshown in Listing 5.
Listing 5. Aspect for JDBC Driver: Counting@Before("execution(*solid.jdbc.SolidConnection.close(..))")public void monitorCloseJdbc (final JoinPoint jp) {
371
International Journal on Advances in Intelligent Systems, vol 2 no 2&3, year 2009, http://www.iariajournals.org/intelligent_systems/

if (monitoringIsPossible) {String unit = determineFunctionalUnit();SolidConnection conn =
(SolidConnection)jp.getThis();theStatistics.notifyJDBCConnectionRelease
(unit, conn.hashCode());} }
The parameter JoinPoint jp gives access to context in-formation about the join point, especially the object onwhich the method is invoked (jp.getThis()). The gatheredinformation is sent to the central theStatistics object thatkeeps this information to determine the number of currentlyopen connections. Moreover, it keeps track of the maximalvalue. This information is managed for each functional unit.The important point is that the solidDB JDBC driver isintercepted although its source code is not available. Thatis, the aspect code is applied to a 3rd party JAR file.
E. Detecting Misusage
Developers should use the template to access the database,however, there is no way to force them. Sometimes devel-opers use JDBC to connect to the RDBMS directly, thusbypassing the entire infrastructure, e.g., for administration orsetup purposes. When it comes to the monitoring of connec-tions, all the attempts from different levels of the persistencesystem architecture must be monitored: Directly using JDBCconnections has the inherent danger of programmers notreleasing the connection, which would lead to an increasein connection usage.
Additional aspect advices allow for monitoring certainkinds of misusage when using the persistence frameworkdirectly. For example, it is monitored whenever an Entity-ManagerFactory is created by bypassing our wrapper tem-plate (creation is usually not done explicitly, but implicitlyin the template). This means that an additional connectionpool would be created for the same functional unit. Thecorresponding pointcut is:@Before("execution(
* *..*.createEntityManagerFactory(String, java.util.Map)) && args(str,map)")
Another pointcut detects any direct usage of JDBC con-nection handling beside the connection pool:@Pointcut("execution(*
org.apache.commons.dbcp.*.*(..))")public void withinDbcp() {}@AfterReturning(pointcut = "execution(*
solid.jdbc.SolidDriver.connect(..))&& !cflow(withinDbcp)", returning = "ret")
In both cases, an advice will issue a warning.
F. Connection Aquisition Times
Besides the amount of actual open connections and alsobesides the information of the origin, a problem remains:From the counting of connections, it cannot be seen, ifthe pool actually performs efficiently when providing con-nection objects. It is obvious that connection counting can
happen only at specified intervals. However, an overloadsituation can easily slip through the measurement points.
Thus, another measurement facility has been added to thewrapping template, a time measurement, how long actually aconnection obtainment takes place. If the obtainment takesplace obviously the demand is higher than the number ofconnections that the connection pool provides.
In addition, we can guess at medium-ranged connectionobtain times that the pool has freshly created the connection.Please note that it depends on the computer system used howmany milliseconds the initialization of a connection objectactually takes. This can have two reasons: Either the settingsof the pool reduce the number of kept open connectionstoo quickly. Or the integrity conditions for a connection aremissed too often, which lets the pool replace an existingconnection with a new one. Both cases also reduce theperformance of the overall system. In the first case, thesettings of the pool need revision. In the second case,the connection integrity conditions must be checked or thehandling of connections must be evaluated for inappropriateoperations on the connection object.
Although we issue a warning whenever the time to obtaina connection exceeded a certain threshold, we still do notknow the reason why: Is it because the pool is exhausted andthe DBS has to create a new one? Or has the connectionpool some contention problems solving parallel requests?To get more diagnostics, we added an additional aspectthat allows distinguishing whether a connection is newlycreated or taken from the pool, thereby passing a threshold.In addition, the current connection pool properties (recentlyactive and idle connections) are printed.
G. Summary
The proposed environment offers the desired informationabout connections. It presents an overview of currentlyrequested logical database connections and really used phys-ical connections for any component a certain time intervals.Moreover, it keeps track of maximal values. If the logicalnumber value is higher than the physical one, then the poolseems to be undersized. Similarly, an oversized pool caneasily be detected. An example output send top the log filesis listed in Listing 6.
Listing 6. Example Output of Monitoring14:12:00,097 DEBUG [PersistenceStatistics]@b6d6ab says: sess opened ever/current: (1/1),template conn obtain
ever/max at once/current open: (1/1/1),jdbc conn max same time/current: (35/35).
...14:12:00,097 DEBUG [PersistenceStatistics]session referrer history:---------------------------------------domain:|_ com.siemens...createDomain(),
ever: 1, curr: 1|_ max 1 session(s) in use at the same time.
---------------------------------------
372
International Journal on Advances in Intelligent Systems, vol 2 no 2&3, year 2009, http://www.iariajournals.org/intelligent_systems/

connection referrer history:---------------------------------------domain:|_ com.siemens...createDomain(),
ever: 1, curr: 1|_ max 1 template conn(s) at the same time.
---------------------------------------1 current template connections (max at once: 1):---------------------------------------12743356 origin: com.siemens...createDomain(),
---------------------------------------35 current jdbc connections (max at once: 35):---------------------------------------|_ domain: 35---------------------------------------...
In addition to the introduced monitoring in the previoussections, also the RDBMS is queried for the connectedusers and the number of open connections. Figure 3 showsa comprehensive overview of the monitoring points in thearchitecture.
VI. RESULTS
The introduced connection monitoring allowed insights onthe use of connections for particular services or components.Such kind of information is important for the followingreasons:
1) Some functionality is called very seldom, resulting infew database operations, for example a backup service,while other functionality is called in a continuous man-ner, for example, a user management service in severalthreads. The distinction by the functional units allowsfor an assessment of required parallel connections tothe RDBMS. Over- and under-sizing can be avoided.
2) The OpenSOA platform and the services will becombined in different deployment scenarios resultingin different total amount of required connections.Such aggregated numbers are important for the properparameterisation of the RDBMS, or the server runningthe RDBMS.
3) The monitoring of JDBC connections also verifies theproper use of the persistence framework. When using apersistence framework, avoiding direct connections tothe RDBMS is very important. Otherwise, the objectinitialization, caching and the retry mechanisms canlead to inconsistent data. Using our monitoring, wecould detect one component that uses JDBC directly.
4) The monitoring revealed that the number of connec-tions oscillates within seconds with some settingsof the DBCP: sometimes, even if components werewaiting for a connection from DBCP, newly releasedconnections were physically closed and immediatelyrequested again because of the load. This is an im-portant performance issue that leaded to severe per-formance degradation. Using our monitoring, it turnedout that the maxActive configuration parameter definesthe upper limit of connections. If another maxIdle
parameter is lower, then DBCP immediately releasesany exceeding connection - even if there are stillrequests!Furthermore, idle connections are evicted in a con-figurable interval until a minIdle threshold is passed.Again some kind of oscillation occurs, since a bulk ofconnections is released first, and then connections areacquired to satisfy the minIdle parameter. This strangeand unexpected behavior of the DBCP could then befixed.
5) If one component calls additionally internal operationswithin the same persistence unit and thus the samepool a deadlock situation can occur: At high loadsthe maximum amount of possible open connection canbe reached by originating calls. Then a sub operationrequired cannot obtain further connections. However,the originating operation cannot proceed, because itwaits for the sub operation. Thus, the combination ofappropriate load models for testing and detailed mon-itoring facilities is required to systematically identifysuch deadlock situations.
The applied connection monitoring has clearly improvedthe knowledge about the deployment needs of the OpenSOAplatform. We ask the reader for understanding that nodetailed figures can be given as the OpenSOA platform iscommercial software acting in competition to other solu-tions. Regarding related solutions, it must be noted that thepresented implementation of such a monitoring was requiredfor the following reasons:
1) Not every connection pool offers this information atthe required grade: For example, the DBCP connectionpool that we integrated into OpenJPA offers no loggingat all in the current version.
2) The solidDB JDBC driver does not offer such loggingfacilities as required.
3) Even if some of the information were available withOpenJPA, Hibernate, or if an alternative connectionpool like c3p0 would provide the information here andthere, the analysis would require a cumbersome searchinside the log files. In contrast, the a centralised per-sistence statistics component offers also the advantageof an aggregated reporting.
4) A RDBMS stores the information at system level.However, such information can be only used to verifythe information gathered from the various other points.The RDBMS stores in most cases information aboutthe number of connections obtained by a particu-lar database user. Since different components of anapplication use the same database user, no detailedinformation can be found from there.
VII. CONCLUSIONS
Monitoring database connections in complex software ismanifold and cannot be done by the database system only,
373
International Journal on Advances in Intelligent Systems, vol 2 no 2&3, year 2009, http://www.iariajournals.org/intelligent_systems/

OpenSOA Service
OpenSOA Comp. / Lib.
Wrapper Template, Configuration
RDBS
OpenJPA
Connection Pool
JDBC Driver
OpenSOA Comp. / Lib.OpenSOA
Comp. / Lib.OpenSOA Comp. / Lib.
OpenSOA ServiceOpenSOA
ServiceOpenSOA Service
Code Session /EntityManager /Connection AquisitionCode ConnectionAquisition Time
AspectJ Session / EntityManagerAquisition
AspectJConnection Misuse
QueryOpen Connections
AspectJConnection Aquisition
Figure 3. Monitoring in the Persistence System
if the application is distributed and involves many differentcomponents. Moreover, statistics over the counted connec-tions is mandatory in order to precisely define parametersfor optimal resource consumption/performance trade-off ofthe connection pool. The discussion has motivated that aprecise monitoring of connections to the database and theirorigin is relevant in order to optimise different deploymentconfigurations in terms of the parameters for a connectionpool.
As future work, a self-parameterisation of the connectionpool parameters can be implemented based on the moni-toring functionality. For this purpose, dynamic connectionpools exist already. However, a combination with the dy-namic deployment of bundles in the OSGi container wouldimprove adaptation of connection pool parameters insteadof monitoring the resulting traffic on the connection poollevel only. Such a mechanism requires additional research,because the optimal number of connections would resultfrom a statistical model that includes also usage patternsand the number of served users.
REFERENCES
[1] M.P. Atkinson, R.Morrison: Orthogonally Persistent ObjectSystems. VLDB Journal 4, 3 (1995) pp 319-401.
[2] M. Aksit (ed.): Proc. of 2nd Int. Conf. on Aspect-OrientedSoftware Development, Boston 2003
[3] R. Bodkin: AOP@Work: Performance monitoring withAspectJ. http://www.ibm.com/developerworks/java/library/j-aopwork10/index.html
[4] c3p0 Connection Pool, Project site available at:http://c3p0.sourceforge.net/
[5] Y. Coady, G. Kiczales: Back to the Future: A RetrospectiveStudy of Aspect Evolution in Operating System Code. In[AOSD03]
[6] M. Chapman, A. Vasseur, G. Kniesel (eds.): Proc. Of IndustryTrack 3rd Conf. on Aspect-Oriented Software Development,AOSD 2006, Bonn, ACM Press
[7] Commons DBCP Component. project website available athttp://commons.apache.org/dbcp/
[8] The EJB3 Specification (JSR 220): http://java.sun.com /prod-ucts/ejb/docs.html
[9] K. Govindraj, S. Narayanan et al.: On Using AOP for Appli-cation Performance Management. In [CVK06]
[10] R. Filman, D. Friedman: Aspect-Oriented Programming isQuantification and Obliviousness. Worksh. on Advanced Sep-aration of Concerns, OOPSLA 2000
374
International Journal on Advances in Intelligent Systems, vol 2 no 2&3, year 2009, http://www.iariajournals.org/intelligent_systems/
[11] Hibernate Reference Documentation.http://www.hibernate.org /hib docs/v3/reference/en/html/
[12] J. Hannemann and G. Kiczales: Design Pattern Implementa-tion in Java and AspectJ. In Proc. of the 17th Annual ACMConf. on Obj.-Orien. Programming, Systems, Languages, andApplications, OOPSLA 2002, Seattle
[13] U. Hohenstein: Using Aspect-Orientation to ManageDatabase Statistics. In:
[14] JSR-000012 JavaTM Data Objects Specification. http://jcp.org/aboutJava/communityprocess/first/jsr012/
[15] Java Persistence API. http://java.sun.com/javaee/technologies/persistence.jsp
[16] G. Kiczales, E. Hilsdale, J. Hugunin, M. Kersten, J. Palm, W.Griswold: An Overview of AspectJ. ECOOP 2001, SpringerLNCS 2072
[17] G. Kiczales: Adopting AOP. In Proc. 4th Conf. on Aspect-Oriented Software Development; AOSD 2005, Chicago, ACMPress
[18] R. Laddad: AspectJ in Action. Manning Publications Green-wich 2003
[19] N. Lesiecki: Applying AspectJ to J2EE Application Develop-ment. IEEE Software, January/February 2006
[20] G. Murphy, A. R. Walker, M. Robillard: Separating Featuresin Source Code: An Exploratory Study. In Proc. of 23rd Int.Conf. on Software Engineering 2001
[21] H. Masuhara, A. Rashid (eds.): Proc of 5th Int. Conf.on Aspect-Oriented Software Development. Bonn (Germany)2006
[22] Java Persistence API. http://java.sun.com/javaee/ technologies/persistence.jsp
[23] Open Service Gateway Initiative. Home Page of the OSGiConsortium. http://www.osgi.org.
[24] Rashid, A.: Aspect-Oriented Database Systems. SpringerBerlin Heidelberg 2004
[25] A: Rashid, R. Chitchyan: Persistence as an Aspect. In[AOSD03]
[26] Rod Johnson: Introduction to the Spring Framework.October 2007. http://www.theserverside.com/tt/articles/ arti-cle.tss?l=IntrotoSpring25
[27] S. Soares, P. Borba: Implementing Modular and ReusableAspect-Oriented Concurrency Control with AspectJ: InWASP05, UberlŁndia, Brazil
[28] W. Strunk: The Symphonia Product-Line. Java and Obj.-Orient. (JAOO) Conf. 2007, Arhus, Denmark (2007)
[29] C. Zhang, H.-A. Jacobsen: Quantifying Aspects in Middle-ware Platforms. In [AOSD03].
375
International Journal on Advances in Intelligent Systems, vol 2 no 2&3, year 2009, http://www.iariajournals.org/intelligent_systems/

Run-Time Connector Synthesis for AutonomicSystems of Systems
Radu CalinescuComputing Laboratory, University of Oxford, UK
Abstract—A key objective of autonomic computing is to re-duce the cost and expertise required for the management ofcomplex IT systems. As a growing number of these systemsare implemented as hierarchies or federations of lower-levelsystems, techniques that support the development of autonomicsystems of systems are required. This article introduces one suchtechnique, which involves the run-time synthesis of autonomicsystem connectors. These connectors are specified by means ofa new type of autonomic computing policy termed a resource-definition policy, and enable the dynamic realisation of collectionsof collaborating autonomic systems, as envisaged by the originalvision of autonomic computing. We propose a framework for theformal specification of autonomic computing policies, and useit to define the new policy type and to describe its applicationto the development of autonomic system of systems. To validatethe approach, we present a sample data-centre application thatwas built using connectors synthesised from resource-definitionpolicies.
Keywords—autonomic computing; systems of systems; auto-nomic system connectors; model-driven development; automatedcode generation.
I. INTRODUCTION
The original vision of autonomic computing was one ofself-managing systems comprising multiple inter-operating,collaborating autonomic elements [2]. Like the components ofa biological system, these autonomic elements were envisagedto contain well-differentiated resources and deliver servicesto each other, to integrate seamlessly, and to work togethertowards a global set of system-level objectives [2][3][4].
This view of self-managing systems as collections of col-laborating autonomic elements is entirely consistent with theway in which many of the most important computing systemsare designed, built and managed. Indeed, key computingsystems in areas ranging from transportation and healthcareto aerospace and defence can no longer be implemented asmonolithic systems. Instead, the capabilities and functionalitythat these systems are required to provide can only be achievedthrough employing collections of collaborative, heterogeneousand autonomously-operating systems [5][6].
Thus, the characteristics of the computing systems thatwould benefit most from self-managing capabilities, and thevision behind the sustained research efforts in the area ofautonomic computing are well aligned. Nevertheless, the sameis hardly true about the outcome of these efforts: what theoverwhelming majority of the autonomic computing researchto date has produced is a collection of methods, tools and com-ponents for the development of monolithic autonomic systems;
and exemplars of such systems. The few notable exceptions(overviewed in Section II) are either high-level architectures[7] that refine the “collection-of-autonomic-elements” archi-tecture from the seminal autonomic computing paper [2],or domain-specific instances of this architecture that involvepre-defined interactions between small numbers of autonomicelement types [8][9][10][11].
What is needed to bridge this gap between vision and realityis a generic technique for the development of systems com-prising multiple autonomic elements. The technique shouldsupport autonomic elements that can join and leave the systemdynamically, which have local objectives to achieve in additionto the overall system objectives, and whose characteristics areunknown at system design time.
This extended version of [1] presents such a generic tech-nique for the development of autonomic systems of systems bymeans of a new type of autonomic computing policy. The newpolicy type is termed a resource-definition policy, and definesthe autonomic system connectors through which the autonomicmanager at the core of an autonomic system should expose thesystem to its environment.
As illustrated in Figure 1, the implementation of resource-definition policies requires that the reference autonomic com-puting loop from [2] is augmented with a synthesise step. Likein the reference architecture, an autonomic manager monitorsthe system resources through sensors, uses its knowledge toanalyse their state and to plan changes in their configurableparameters, and implements (or “executes”) these changesthrough effectors. Additionally, the autonomic manager mod-ule that implements the “synthesise” step has the role todynamically generate connectors that expose the underlyingsystem to its environment as requested by the user-specifiedresource-definition policies. This new functionality supportsthe flexible, run-time integration of existing autonomic sys-tems into hierarchical, collaborating or hybrid autonomicsystems of systems, as illustrated in Figure 2.
The main contributions of the article are:1) A theoretical framework for the formal, unified specifi-
cation and analysis of autonomic computing policies.2) The introduction of resource-definition policies within
this framework.3) A set of automated code generation techniques for the
run-time synthesis of autonomic system connectors asweb services, and an augmented version of the author’sgeneral-purpose autonomic manager [12][13] that usesthese techniques to support the new policy type.
376
International Journal on Advances in Intelligent Systems, vol 2 no 2&3, year 2009, http://www.iariajournals.org/intelligent_systems/

Managed resources
Autonomicmanager
Manageability adaptors
sensors effectors
Monitor
Analyse
Synthesise
Plan
Knowledge
sensors effectors
PoliciesExecute
connector
Fig. 1. Policy-based autonomic computing system whose control loop isaugmented with a connector synthesis step.
Fig. 2. Resource-definition policies support the run-time integration ofautonomic systems into autonomic systems of systems.
4) A case study that illustrates the use of resource-definition policies to implement an autonomic data-centre application.
The remainder of the article starts with an overview ofrelated work in Section II, followed by the description ofour framework for the specification of autonomic computingpolicies in Section III. Section IV provides a formal intro-duction to resource-definition policies. Section V describesthe prototype implementation of an autonomic manager thathandles resource-definition policies. System-of-systems appli-cation development using the new policy type is discussedin Section VI. Finally, Section VII provides an overview ofthe problem addressed by our research work and the solutionproposed in the article, a summary of the case study used tovalidate this solution, and a list of future work directions.
II. RELATED WORK
The idea to integrate a set of autonomic systems into ahigher-level autonomic system is not new. Indeed, the seminal
paper of Kephart and Chess [2] envisaged autonomic elementsthat “interact with other elements and with human program-mers via their autonomic managers”. More recently, this visionwas adapted and extended successfully to specific applicationdomains including aerospace [7] and “beyond 3G” networking[10]. However, these extensions represent work in progress.
The high-level architecture proposed in [7] is also char-acterised by pre-defined types of interactions between theirautonomic elements. Due to the statically implemented sensor-effector interfaces of their autonomic elements, the potentialapplications of this approach are limited to those pre-plannedwhen the autonomic elements are originally developed.
The ongoing research project whose agenda is described in[10] will employ event services to enable flexible interactionsamong autonomic network management elements. When thiswork will be completed, the functionality of the resultingframework will resemble that of the autonomic system con-nectors described in our article, but in the area of autonomicnetworking.
The work described in [9] proposes the use of hierar-chical systems of event-driven sensors for monitoring andsymptom recognition within autonomic systems. The use ofdedicated policies to dynamically configure an instance ofthe architecture in [9] is somewhat similar to our use ofresource-definition policies. However, unlike our approachthat supports the automated, run-time synthesis of connectorscomprising a combination of autonomic computing sensorsand effectors, the framework in [9] focuses exclusively onsensors, and requires manual coding for the implementationof these sensors.
Fully-fledged instances of the data-centre autonomic sys-tems comprising a pair of collaborating autonomic elementsand a two-level hierarchy of autonomic elements are describedin [8] and [11], respectively. The two successful domain-specific applications by research teams at IBM Researchdemonstrate the benefits of partitioning the autonomic func-tionality of large computing systems among multiple auto-nomic elements. However, the use of hard-coded autonomicmanager interfaces limits the inter-operation of the autonomicelements of the applications in [8][11] to pre-defined typesof interactions. Furthermore, the need to implement each ofthese interfaces upfront requires a significant amount of codingeffort, and does not scale well to autonomic systems of systemscomprising more than a few autonomic elements (the systemsin [8] and [11] comprise two and three autonomic managers,respectively).
In contrast with all these approaches, the use of resource-definition policies makes possible the automated, runtimegeneration of the sensor-effector connectors of an autonomicelement. Thus, the main advantage of our novel approachto implementing autonomic systems of systems resides inits unique ability to support the development of unforeseenapplications by dynamically (re)defining the interfaces ofexisting autonomic systems. As an added benefit, the use ofresource-definition policies eliminates completely the effortand costs associated with the manual implementation of theseinterfaces.
The architecture and functionality of the autonomic systems
377
International Journal on Advances in Intelligent Systems, vol 2 no 2&3, year 2009, http://www.iariajournals.org/intelligent_systems/

of systems built using resource-definition policies resemblethose of intelligent multi-agent systems [14]. However, thestandard approaches used for the development of multi-agentsystems differ significantly from the approach proposed inthis paper. Thus, the typical approach to multi-agent systemdevelopment [14] involves defining and implementing theagent interfaces statically, before the components of the systemare deployed. In contrast, our approach has the advantagethat these interfaces can flexibly be defined at runtime, thusenabling the development of applications not envisaged untilafter the components of the system are deployed.
A unified framework that interrelates three types of auto-nomic computing policies was introduced in [15]. Based onthe concepts of state and action (i.e., state transition) adoptedfrom the field of artificial intelligence, this framework makespossible the effective high-level analysis of the relationshipsamong action, goal and utility-function policies for autonomiccomputing. Our policy specification framework differs essen-tially from the one in [15], which it complements throughenabling the formal specification and analysis of all thesepolicy types in terms of the knowledge employed by theautonomic manager that implements them.
III. A FRAMEWORK FOR THE FORMAL SPECIFICATION OFAUTONOMIC COMPUTING POLICIES
Before introducing the new type of policy, we will formallydefine the knowledge module of the autonomic manager inFigure 1. This knowledge is a tuple that models the n ≥ 1resources of the system and their behaviour:
K = (R1, R2, . . . , Rn, f), (1)
where Ri, 1 ≤ i ≤ n is a formal specification for the ithsystem resource, and f is a model of the known behaviour ofthe system. Each resource specification Ri represents a namedsequence of mi ≥ 1 resource parameters, i.e.,
Ri = (resIdi, Pi1, Pi2, . . . , Pimi),∀1 ≤ i ≤ n, (2)
where resIdi is an identifier used to distinguish betweendifferent types of resources. Finally, for each 1 ≤ i ≤ n,1 ≤ j ≤ mi, the resource parameter Pij is a tuple
Pij = (paramId ij ,ValueDomainij , typeij) (3)
where paramId ij is a string-valued identifier used to distin-guish the different parameters of a resource; ValueDomainij
is the set of possible values for Pij ; and typeij ∈ {ReadOnly,ReadWrite} specifies whether the autonomic manager canonly read or can both read and modify the value of the pa-rameter. The parameters of each resource must have differentidentifiers, i.e.,
∀1 ≤ i ≤ n • ∀1 ≤ j < k ≤ mi • paramId ij 6= paramId ik
We further define the state space S of the system as theCartesian product of the value domains of all its ReadOnlyresource parameters, i.e.,
S = 1≤i≤n
1≤j≤mi
typeij=ReadOnly
ValueDomainij (4)
Similarly, the configuration space C of the system is definedas the Cartesian product of the value domains of all itsReadWrite resource parameters, i.e.,
C = 1≤i≤n
1≤j≤mi
typeij=ReadWrite
ValueDomainij (5)
With this notation, the behavioural model f from (1) is apartial function1
f : S × C 7→ S
such that for any (s, c) ∈ domain(f), f(s, c) represents theexpected future state of the system if its current state is s ∈ Sand its configuration is set to c ∈ C. Presenting classes ofbehavioural models that can support the implementation ofdifferent autonomic computing policies is beyond the scopeof this paper; for a description of such models see [12].
The standard types of autonomic policies described in[15][11][16] can be defined using this notation as follows:
1) An action policy specifies how the system configurationshould be changed when the system reaches certainstate/configuration combinations:
paction : S × C 7→ C. (6)
A graphical representation of an action policy is shownin Figure 3a. Note that an action policy can be im-plemented even when the autonomic manager has noknowledge about the behaviour of the managed re-sources, i.e., when domain(f) = ∅ in eq. (1).
2) A goal policy partitions the state/configuration combi-nations for the system into desirable and undesirable:
pgoal : S × C → {true, false}, (7)
with the autonomic manager requested to maintain thesystem in an operation area for which pgoal is true.Figure 3b shows a graphical representation of a goalpolicy within the theoretical framework introduced inthis section.
3) A utility policy (Figure 3c) associates a value witheach state/configuration combination, and the autonomicmanager should adjust the system configuration such asto maximise this value:
putility : S × C → R. (8)
Example 1 To illustrate the application of the notationintroduced so far, consider the example of an autonomic data-centre comprising a pool of nServers ≥ 0 servers that need tobe partitioned among the N ≥ 1 services that the data-centrecan provide. Assume that each such service has a priorityand is subjected to a variable workload. The knowledge (1)for this system can be expressed as a tuple
K = (ServerPool ,Service1, . . . ,Servicen, f) (9)
1A partial function on a set X is a function whose domain is a subset ofX . We use the symbol 7→ to denote partial functions.
378
International Journal on Advances in Intelligent Systems, vol 2 no 2&3, year 2009, http://www.iariajournals.org/intelligent_systems/

state (S) configuration (C)
S × C
(s, c)
s c c′
state (S) configuration (C)
S × C
(s, c)
s c
state (S) configuration (C)
S × C
(s, c)
s c
a) action policy: specifies new system configurations c′ ∈ Cfor certain state-configuration combinations (s, c) ∈ S × C
a) goal policy: specifies area of the S × C state-configurationspace where the system should be maintained at all times(i.e., the shaded area)
c) utility policy: specifies the utility of each state-configurationcombination (s, c) ∈ S × C for the system—darkershading indicates higher utility
Fig. 3. Graphical representation of the standard types of autonomiccomputing policies
where the models for the server pool and for a generic servicei, 1 ≤ i ≤ N are given by:
ServerPool = ("serverPool",("nServers", N, ReadOnly),("partition", NN , ReadWrite))
Servicei = ("service",("priority", N+, ReadOnly),("workload", N, ReadOnly))
(10)The state and configuration spaces of the system are S =N × (N+ × N)N and C = NN , respectively. For sim-plicity, we will consider that the workload of a servicerepresents the minimum number of operational servers itrequires to achieve its service-level agreement. Sample ac-tion, goal and utility policies for the system are specifiedbelow by giving their values for a generic data-centre state
s = (n, p1, w1, p2, w2, . . . , pN , wN ) ∈ S and configurationc = (n1, n2, . . . , nN ) ∈ C:
paction(s, c) = (dαw1e, dαw2e, . . . , dαwNe) (11)
pgoal(s, c) = ∀1 ≤ i ≤ N •(ni >0 =⇒ (∀1≤j≤N • pj >pi =⇒ nj =dαwje)) ∧(ni = 0 =⇒
N∑j = 1
pj ≥ pi
nj = n
)(12)
putility(s, c)=
−∞, if
N∑i=1
ni >n
N∑i = 1
wi > 0
piu(wi, ni)− εN∑
i=1
ni, otherwise
(13)We will describe these policies one at a time. First, the actionpolicy (11) prescribes that dαwie servers are allocated toservice i, 1 ≤ i ≤ N at all times. Notice how a redundancyfactor α ∈ (1, 2) is used in a deliberately simplistic attempt toincrease the likelihood that at least wi servers will be availablefor service i in the presence of server failures. Also, the policyis (over)optimistically assuming that n ≥
∑Ni=1dαwie at all
times.The goal policy (12) specifies that the desirable
state/configuration combinations of the data-centre are thosein which two conditions hold for each service i, 1 ≤ i ≤ N .The first of these conditions states that a service should beallocated servers only if all services of higher priority havealready been allocated dαwie servers. The second conditionstates that a service should be allocated no server only if alln available servers have been allocated to services of higheror equal priority.
Finally, the utility policy requires that the value of theexpression in (13) is maximised. The value −∞ in thisexpression is used to avoid the configurations in which moreservers than the n available are allocated to the services.When this is not the case, the value of the policy is givenby the combination of two sums. The first sum encodes theutility u(wi, ni) of allocating ni servers to each service i withwi > 0, weighted by the priority pi of the service. By settingε to a small positive value (i.e., 0 < ε � 1), the second sumensures that from all server partitions that maximise the firstsum, the one that uses the smallest number of servers is chosenat all times. A sample function u is shown in Figure 4. Morerealistic utility functions u and matching behavioural modelsf from eq. (9) are described in [12].
IV. RESOURCE-DEFINITION POLICIES
A. Definition
Using R to denote the set of all resource models with theform in (2), and E(S, C) to denote the set of all expressionsdefined on the Cartesian product S×C, we can now give thegeneric form of a resource-definition policy as
pdef : S × C → R× E(S, C)q, (14)
379
International Journal on Advances in Intelligent Systems, vol 2 no 2&3, year 2009, http://www.iariajournals.org/intelligent_systems/

u : R+ × R+ → [0, 1]
u(w, n) =
0, if n < (2− α)w
n−(2−α)w2(α−1)w , if (2− α)w ≤ n ≤ αw
1, if n > αw
α ∈ (1, 2)
u(w0, n)
0
1
w0 αw0(2− α)w0
n
Fig. 4. Sample function u for Example 1—the graph shows u for a fixed value of its first argument, i.e., w = w0
where, for any (s, c) ∈ S × C,
pdef(s, c) = (R,E1, E2, . . . , Eq). (15)
In this definition, R represents the resource that the autonomicmanager is required to synthesise, and the expressions E1, E2,. . . , Eq specify how the autonomic manager will calculate thevalues of the q ≥ 0 ReadOnly parameters of R as functions of(s, c). Assuming that the value domain for the ith ReadOnlyparameter of R, 1 ≤ i ≤ q is ValueDomainsynth RO
i , we have
Ei : S × C → ValueDomainsynth ROi . (16)
Example 2 Consider again the autonomic data-centre fromExample 1. A sample resource-definition policy that comple-ments the utility policy in (13) is given by
pdef(s, c) = (("dataCentre",("id",String , ReadOnly)("maxUtility", R, ReadOnly),("utility", R, ReadOnly)),"dataCentre A",
max(x1,x2,...,xN )∈NN
∑1≤i≤Nwi>0 piu(wi, xi),∑1≤i≤N
wi>0 piu(wi, ni))
(17)
This policy requests the autonomic manager to synthesisea resource termed a "dataCentre". This resource com-prises three ReadOnly parameters: id is a string-valuedidentifier with the constant value "dataCentre A", whilemaxUtility and utility represent the maximum and actualutility values associated with the autonomic data-centre whenit implements the utility policy (13). (The term ε
∑Ni=1 ni from
the policy definition is insignificant, and was not includedin (17) for simplicity.) Exposing the system through thissynthesised resource enables an external autonomic manager tomonitor how close the data-centre is to achieving its maximumutility.
Note that the generic form of a resource-definition policy(14)-(15) allows the policy to request the autonomic man-ager to synthesise different types of resources for differentstate/configuration combinations of the system. While the pre-liminary use cases that we have studied so far can be handledusing resource-definition policies in which the resource modelR from (15) is fixed for all (s, c) ∈ S × C, we envisage thatthis capability will be useful for more complex applicationsof resource-definition policies.
B. Synthesised Resources with ReadWrite Parameters
In this section we explore the semantics and applicationsof ReadWrite (i.e., configurable) parameters in synthesisedresources. These are parameters whose identifiers and valuedomains are specified through a resource-definition policy, butwhose values are set by an external entity such as anotherautonomic manager. Because these parameters do not corre-spond to any element of the managed resources within theautonomic system, the only way to ensure that they have aninfluence on the autonomic system in Figure 1 as a whole is totake them into account within the set of policies implementedby the autonomic manager. This is achieved by redefiningthe state space S of the system. Thus, in the presence ofresource-definition policies requesting the synthesis of high-level resources with a non-empty set of ReadWrite parame-ters {P synth RW
1 , P synth RW2 , . . . , P synth RW
r }, the state spacedefinition (4) is replaced by:
S =
1≤i≤n
1≤j≤mi
typeij=ReadOnly
ValueDomainij
×
(
1≤i≤rValueDomainsynth RW
i
),
(18)
where ValueDomainsynth RWi represents the value domain of
the ith synthesised resource parameter P synthi , 1 ≤ i ≤ r.
Given that the synthesised sensors involve setting the valueof the connector parameters by the autonomic manager, theconfiguration space of the system can be redefined in ananalogous way as:
C =
1≤i≤n
1≤j≤mi
typeij=ReadWrite
ValueDomainij
×
(
1≤i≤qValueDomainsynth RO
i
).
(19)
Figure 5 illustrates graphically the way in which a policy-definition policy extends the state and configuration spaces ofan autonomic system.
Example 3 Consider again our running example of an auto-nomic data-centre. The resource-definition policy in (17) canbe extended to allow a peer data-centre (such as a data-centre
380
International Journal on Advances in Intelligent Systems, vol 2 no 2&3, year 2009, http://www.iariajournals.org/intelligent_systems/

state (S) configuration (C)
S × C
(s, c)
s c
V alueDomainsynth ROi×
1≤ i≤qV alueDomainsynth RW
i×1≤ i≤r
Fig. 5. Resource-definition policies extend the state and configuration spacesof an autonomic system with the value domains of the synthesised connectors.
running the same set of services within the same securitydomain) to take advantage of any spare servers:
p′def(s, c) = (("dataCentre",("id",String , ReadOnly)("maxUtility", R, ReadOnly),("utility", R, ReadOnly)),("nSpare", N, ReadOnly)),("peerRequest", NN , ReadWrite)),"dataCentre A",
max(x1,x2,...,xN )∈NN
∑1≤i≤Nwi>0 piu(wi, xi),∑1≤i≤N
wi>0 piu(wi, ni), n−∑N
i=1 ni)
(20)
The synthesised resource has two new parameters: nSparerepresents the number of servers not allocated to any (local)service; and peerRequest is a vector (nl
1, nl2, . . . , n
lN ) that a
remote data-centre can set to request that the local data-centreassigns nl
i of its servers to service i, for all 1≤ i≤N .
To illustrate how this is achieved, we will consider twodata-centres that each implements the policy in (20), andwhich have access to each other’s "dataCentre" resourceas shown in the lower half of Figure 10. For simplicity, wewill further assume that the data-centres are responsible fordisjoint sets of services (i.e., there is no 1 ≤ i ≤ N suchthat wi > 0 for both data-centres). To ensure that the twodata-centres collaborate, we need policies that specify howeach of them should set the peerRequestr parameter of itspeer, and how it should use its own peerRequestl parameter(which is set by the other data-centre). The "dataCentre"parameters have been annotated with l and r to distinguishbetween identically named parameters belonging to the localand remote data-centre, respectively. Before giving a util-ity policy that ensures the collaboration of the two data-centres, it is worth mentioning that the state of each has theform s = (n, p1, w1, p2, w2, . . . , pN , wN , nr, nl
1, nl2, . . . , n
lN )
(cf. (18)); and the system configuration has the form c =(n1, n2, . . . , nN , nr
1, nr2, . . . , n
rN ). The utility policy to use
alongside policy (20) is given below:
p′utility(s, c) =
=
−∞, ifN∑
i=1
ni >n ∨N∑
i=1
nri >nr
N∑i = 1
wi > 0
piu(wi, ni + nri )− ε
N∑i=1
ni−
−λN∑
i=1
nri + µ
N∑i = 1
nli > 0
min(1, ni
nli
) , otherwise
(21)where 0 < ε � λ, µ � 1 are user-specified constants. Thevalue −∞ is used to avoid the configurations in which moreservers than available (either locally or from the remote data-centre) are allocated to the local services. The first two sumsin the expression that handles all other scenarios are similarto those from utility policy (13), except that ni + nr
i ratherthan ni servers are being allocated to any local service i forwhich wi >0. The term −λ
∑Ni=1n
ri ensures that the optimal
utility is achieved with as few remote servers as possible, andthe term µ
∑1≤i≤N
nli>0
min(1, ni
nli
) requests the policy engine toallocate local servers to services for which nl
i >0. Observe thatthe contribution of a term µmin(1, ni
nli
) to the overall utilityincreases as ni grows from 0 to nl
i, and stays constant if ni
increases beyond nli. Together with the utility term −ε
∑Ni=1ni,
this determines the policy engine to never allocate more thanthe requested nl
i servers to service i. Small positive constantsare used for the weights ε, λ and µ so that the terms theybelong to are negligible compared to the first utility term.Further, choosing ε � λ ensures that using a local serverdecreases the utility less than using a remote one; and settingε� µ ensures that allocating up to nl
i servers to a service iat the request of the remote data-centre increases the systemutility.
Finally, note that because the requests for remote serversand the allocation of such servers take place asynchronously,there is a risk that the parameter values used in policy (21)may be out of date.2 However, this is not a problem, asthe allocation of fewer or more remote servers than ideallyrequired is never decreasing the utility value for a data-centre below the value achieved when the data-centre operatesin isolation. Additionally, local servers are never used forremote services at the expense of the local services because∑1≤i≤N
wi>0 piu(wi, ni) � µ∑1≤i≤N
nli>0
min(1, ni/nli)) in the
utility expression.
V. PROTOTYPE IMPLEMENTATION
The policy engine (i.e., policy-based autonomic manager)introduced by the author in [13] was extended with theability to handle the new type of autonomic computing policy.Implemented as a model-driven, service-oriented architecturewith the characteristics presented in [12], the policy engine
2In practical scenarios that we investigated this happened very infrequentlyrelative to the time required to solve the linear optimisation problem (21)automatically within the policy engine.
381
International Journal on Advances in Intelligent Systems, vol 2 no 2&3, year 2009, http://www.iariajournals.org/intelligent_systems/

ManagedResource〈〉 :System.Web.Services.WebService
ManagedResource〈T1〉ManagedT1 :
ManagedResource〈T2〉ManagedT2 :
ManagedResource〈Tn〉ManagedTn :
Fig. 6. Generic programming is used to implement the manageability adaptors for the system resources.
from [13] can manage IT resources whose model is sup-plied to the engine in a runtime configuration step. TheIT resource models described by eq. (1) are represented asXML documents that are instances of a pre-defined meta-model encoded as an XML schema [12][13]. This choice wasmotivated by the availability of numerous off-the-shelf toolsfor the manipulation of XML documents and XML schemas—a characteristic largely lacking for the other technologies weconsidered. The policy engine is implemented as a .NET webservice. In its handling of IT resources whose characteristicsare unknown until runtime, the policy engine takes advantageof object-oriented (OO) technology features including:
• polymorphism—the ability to use instances of deriveddata types in place of instances of their base data types;
• reflection—an OO programming technique that allows theruntime discovery and creation of objects based on theirmetadata [17].
• generic programming—the ability to write code in termsof data types unknown until runtime [18].
The manageability adaptors from Figure 1 are implementedby the framework in [13] as web services that specialise ageneric, abstract web service ManagedResource〈〉. For eachtype of resource in the system, a manageability adaptor is builtin two steps. First, a class (i.e., a data type) Ti is generatedfrom the resource model (2) that will be used to configurethe policy engine, ∀1 ≤ i ≤ n. Second, the manageabilityadaptor ManagedTi for resources of type Ti is implementedby specialising our generic ManagedResource〈〉 adaptor, i.e.,ManagedTi : ManagedResource〈Ti〉. This process is illus-trated in Figure 6 and described in detail in [13].
Adding support for the implementation of the resource-definition policy in (14)–(15) required the extension of thepolicy engine described above with the following functional-ity:
1) The automated generation of a .NET class T for thesynthesised resource R from (15). This class is built byincluding a field and the associated getter/setter methodsfor each parameter of R. The types of these fields aregiven by the value domains of the resource parameters.
2) The automated creation of an instance of T. Reflection isemployed to create an instance of T for the lifespan ofthe resource-definition policy. The ReadOnly fields ofthis object are updated by the policy engine using theexpressions E1, E2, . . . , Eq from eq. (16); the updatesare carried out whenever the object is accessed by an
external entity.3) The automated generation of a manageability adaptor
web service ManagedT : ManagedResource〈T〉. Theweb methods provided by this autonomic system con-nector allow entities from outside the autonomic system(e.g., external autonomic managers) to access the objectof type T maintained by the policy engine. The fields ofthis object that correspond to ReadOnly parameters ofR can be read, and those corresponding to ReadWriteparameters can be read and modified, respectively.
The .NET components generated in steps 1 and 3 aredeployed automatically, and made accessible through thesame Microsoft IIS instance as the policy engine. Thesynthesised connector is available as soon as the enginecompletes its handling of the resource-definition policy.The URL of the connector has the same prefix as that ofthe policy engine, and ends in “ManagedresID.asmx”,where resID is the resource identifier specified in theresource-definition policy. For instance, if the policy engineURL is http://www.abc.org/PolicyEngine.asmx,the synthesised connector for a resource of typedataCentre will be accessible at the addresshttp://www.abc.org/ManagedDataCentre.asmx.
Example 4 Returning to our running example of an auto-nomic data-centre, the class diagram in Figure 7 depicts themanageability adaptors in place after policy (20) was suppliedto the policy engine. Thus, the ManagedServerPool andManagedService classes in this diagram represent the man-ageability adaptors implemented manually for the ServerPooland Service resources described in Example 1. The othermanageability adaptor derived from ManagedResource〈〉 (i.e.,ManagedDataCentre) was synthesised automatically by thepolicy engine as a result of handling the resource-definitionpolicy.
Also shown in the diagram are the classes used to representinstances of the IT resources within the system—serverPooland service for the original autonomic system, and data-Centre for the resource synthesised from policy (20). Noticethe one-to-one mapping between the fields of these classesand the parameters of their associated resources (described inExamples 1 and 3).
VI. APPLICATION DEVELOPMENT
System-of-systems application development with resource-definition policies involves supplying such policies to existing
382
International Journal on Advances in Intelligent Systems, vol 2 no 2&3, year 2009, http://www.iariajournals.org/intelligent_systems/

resource synthesised from policy (18)manually implemented manageability
service
priority : unsignedworkload : unsigned
serverPool dataCentre
id : StringmaxUtility : doubleutility : doublenSpare: unsignedpeerRequest : unsigned[1..N]
adaptors
generic autonomic computing framework from [3]
ManagedResource〈〉 :System.Web.Services.WebService
ManagedServerPool :
ManagedResource〈service〉ManagedService : ManagedDataCentre :
ManagedResource〈dataCentre〉
Fig. 7. Class diagram for Example 4
synthesisedconnectors
Fig. 8. Hierarchical system-of-systems development with resource-definitionpolicies
autonomic systems whose autonomic managers support thenew policy type. Hierarchical systems of systems can be builtby setting a higher-level autonomic manager to monitor and/orcontrol subordinate autonomic systems through synthesisedconnectors that abstract out the low-level details of the systemsthey expose to the outside world. As illustrated in Figure 8,the hierarchy of autonomic systems can comprise any numberof levels.
Alternatively, the original autonomic systems can be config-ured to collaborate with each other by means of the synthesisedresource sensors and effectors. In this scenario, the sensors areused to expose the global state of each system and the effectorsare employed to provide services to peer autonomic systemsas envisaged in the seminal paper of Kephart and Chess [2].The approach is illustrated in Figure 9.
Hybrid applications comprising both types of interactionsmentioned above are also possible, as illustrated by the fol-
synthesisedconnectors
Fig. 9. Collaborating autonomic systems that inter-operate by means ofrun-time synthesised connectors
lowing example.
Example 5 The policy engine from Section V was usedto simulate an autonomic system of systems comprising thepair of autonomic data-centres described in Example 3, and atop-level autonomic manager that monitors and summarisestheir performance using a dashboard resource (Figure 10).The policies implemented by the autonomic managers localto each data-centre are policies (20)–(21) from Example 3.The top-level autonomic manager implements a simple actionpolicy that periodically copies the values of the maxUtilityand utility parameters of the "dataCentre" resources syn-thesised by the data-centres into the appropriate ReadWriteparameters of the dashboard. For brevity, we do not give thispolicy here; a sample action policy was presented earlier inExample 1.
We used the data-centre resource simulators from [12], andimplemented the dashboard resource as an ASP.NET webpage provided with a manageability adaptor built manuallyas described in Section V and in [13]. Separate series ofexperiments for 20-day simulated time periods we run fortwo scenarios. In the first scenario, the data-centres werekept operating in isolation, by blocking the mechanisms theycould use to discover each other. In the second scenario, the
383
International Journal on Advances in Intelligent Systems, vol 2 no 2&3, year 2009, http://www.iariajournals.org/intelligent_systems/

autonomic data-centre
top-levelautonomicmanager
dashboard
service service service serviceautonomic data-centre
synthesised"dataCentre"
resource
synthesised"dataCentre"
resource
Fig. 10. Autonomic system of systems
data-centres were allowed to discover each other, and thusto collaborate through implementing policy (21). Figure 11depicts typical snapshots of the dashboard for both scenariosand for one of the data-centres; the same simulated serviceworkloads were used in both experiments shown. As expectedfrom the analysis in Example 3, the system achieves higherutility when data-centre collaboration is enabled, thus allowingdata-centres to utilise each other’s spare servers.
VII. CONCLUSION AND FUTURE WORK
Many of today’s computing systems are built through theintegration of components that are systems in their own right:they operate autonomously and follow local goals in additionto contributing to the realisation of the global objectives ofthe overall system. The research results presented in thisarticle enable the addition of self-managing capabilities tothis class of systems. This is achieved through the run-timegeneration of autonomic system connectors that can be usedto dynamically assemble autonomic systems of systems out ofa set of individual autonomic systems.
We introduced a policy specification framework for auto-nomic computing, and used it to formally define the existingtypes of autonomic computing policies from [15][11][16] anda new type of policy that we termed a resource-definition pol-icy. We described the semantics of resource-definition policies,and explained how they can be used to dynamically generateconnectors that enable the integration of multiple autonomicsystems into autonomic systems of systems. This representsa significant step towards addressing a major challenge ofautonomic computing, namely the seamless integration of mul-
tiple autonomic elements into larger self-managing computingsystems [2].
Additionally, the article presented how resource-definitionpolicies can be implemented by augmenting the referenceautonomic computing loop with a connector synthesis step,and described a prototype implementation of an autonomicmanager that comprises this additional step.
To validate the proposed approach to developing autonomicsystems of systems, we used the prototype autonomic managerin a case study that was presented as a running examplein Sections III to VI. The case study involved the adaptiveallocation of data-centre servers to services with differentpriorities and variable workloads. The system of systemsconsidered by our case study included a couple of simulatedautonomic data-centres that employed utility-function policiesto dynamically partition their physical servers among localservices. Within this autonomic system of systems, resource-definition policies were used successfully to synthesise a"dataCentre" resource fulfilling two distinct purposes:
1) Collaboration between the autonomic data-centres. Eachdata-centre exposed its number of unused, spare serversthrough a ReadOnly parameter of the synthesised re-source, and the peer data-centre could set a ReadWriteparameter of the same resource to request that someof its services are run on these spare servers. Theeffectiveness of the technique was demonstrated by theimproved utility achieved by the simulated data-centreswhen this collaboration was enabled, compared to thescenario when the data-centres operated in isolationfrom each other.
384
International Journal on Advances in Intelligent Systems, vol 2 no 2&3, year 2009, http://www.iariajournals.org/intelligent_systems/

Fig. 11. Dashboard for isolated data-centre (top) and for identical data-centre operating as part of the autonomic system of systems from Figure 10 (bottom).
385
International Journal on Advances in Intelligent Systems, vol 2 no 2&3, year 2009, http://www.iariajournals.org/intelligent_systems/

2) High-level reporting of data-centre utility. TwoReadOnly parameters of the synthesised resource wereused to reflect the instantaneous data-centre utility andmaximum (or ideal) utility attainable, respectively. Atop-level instance of the prototype autonomic managerwas employed to monitor this information and, throughsuitable action policies, to forward it to a web-baseddashboard for real-time plotting.
The two uses of resource-definition policies show that bothfederations of collaborative autonomic elements and hierar-chical autonomic systems can be implemented successfullyusing the tool-supported development technique proposed inthe article.
The work presented in the article is part of an ongoingproject aimed at devising novel approaches for the effectivedevelopment of autonomic systems and systems of systems.Related future objectives of this project include extending thepolicy specification framework with techniques for the analysisof policy properties such as state/configuration space coverageand conflict freeness, and applying resource-definition policiesto additional, real-world case studies from the area of data-centre resource management.
ACKNOWLEDGEMENT
This work was partly supported by the UK EPSRC grantEP/F001096/1.
REFERENCES
[1] R. Calinescu, “Resource-definition policies for autonomic computing,”in Proceedings of the 5th International Conference on Autonomic andAutonomous Systems (ICAS 2009), 2009, pp. 111–116.
[2] J. O. Kephart and D. M. Chess, “The vision of autonomic computing,”IEEE Computer Journal, vol. 36, no. 1, pp. 41–50, January 2003.
[3] M. Huebscher and J. McCann, “A survey of autonomic computing—degrees, models, and applications,” ACM Comput. Surv., vol. 40, no. 3,pp. 1–28, 2008.
[4] M. Parashar and S. Hariri, Autonomic Computing: Concepts, Infrastruc-ture & Applications. CRC Press, 2006.
[5] Carnegie Mellon Software Engineering Institute, Ultra-Large-ScaleSystems. The Software Challenge of the Future. Carnegie MellonUniversity, 2006.
[6] G. Goth, “Ultralarge systems: Redefining software engineering?” IEEESoftware, vol. 25, no. 3, pp. 91–94, May/June 2008.
[7] M. Hinchey et al., “Modeling for NASA autonomous nano-technologyswarm missions and model-driven autonomic computing,” in Proc. 21stIntl. Conf. Advanced Networking and Applications, 2007, pp. 250–257.
[8] J. O. Kephart, H. Chan, R. Das, D. W. Levine, G. Tesauro, F. L. R.III, and C. Lefurgy, “Coordinating multiple autonomic managers toachieve specified power-performance tradeoffs,” in Proceedings FourthInternational Conference on Autonomic Computing (ICAC’07), 2007.
[9] J. Li, P. Martin, W. Powley, K. Wilson, and C. Craddock, “A sensor-based approach to symptom recognition for autonomic systems,” inProceedings of the 5th International Conference on Autonomic andAutonomous Systems (ICAS 2009), 2009, pp. 45–50.
[10] D. Raymer et al., “From autonomic computing to autonomic networking:an architectural perspective,” in Proc. 5th IEEE Workshop on Engineer-ing of Autonomic and Autonomous Systems, 2008, pp. 174–183.
[11] W. Walsh et al., “Utility functions in autonomic systems,” in Proc. 1stIntl. Conf. Autonomic Computing, 2004, pp. 70–77.
[12] R. Calinescu, “General-purpose autonomic computing,” in AutonomicComputing and Networking, M. Denko et al., Eds. Springer, 2009, pp.3–20.
[13] ——, “Implementation of a generic autonomic framework,” in Proc. 4thIntl. Conf. Autonomic and Autonomous Systems, D. Greenwood et al.,Eds., March 2008, pp. 124–129.
[14] M. Wooldridge, An Introduction to Multi-agent Systems. J. Wiley andSons, 2002.
[15] J. O. Kephart and W. E. Walsh, “An artificial intelligence perspectiveon autonomic computing policies,” in Proc. 5th IEEE Intl. Workshop onPolicies for Distributed Systems and Networks, 2004.
[16] S. White et al., “An architectural approach to autonomic computing,”in Proc. 1st IEEE Intl. Conf. Autonomic Computing. IEEE ComputerSociety, 2004, pp. 2–9.
[17] J. M. Sobel and D. P. Friedman, “An introduction to reflection-orientedprogramming,” in In Proceedings of Reflection96, 1996.
[18] R. Garcia et al., “A comparative study of language support for genericprogramming,” ACM SIGPLAN Notices, vol. 38, no. 11, pp. 115–134,November 2003.
386
International Journal on Advances in Intelligent Systems, vol 2 no 2&3, year 2009, http://www.iariajournals.org/intelligent_systems/

www.iariajournals.org
International Journal On Advances in Intelligent Systems
ICAS, ACHI, ICCGI, UBICOMM, ADVCOMP, CENTRIC, GEOProcessing, SEMAPRO,BIOSYSCOM, BIOINFO, BIOTECHNO, FUTURE COMPUTING, SERVICE COMPUTATION,COGNITIVE, ADAPTIVE, CONTENT, PATTERNS
issn: 1942-2679
International Journal On Advances in Internet Technology
ICDS, ICIW, CTRQ, UBICOMM, ICSNC, AFIN, INTERNET, AP2PS, EMERGING
issn: 1942-2652
International Journal On Advances in Life Sciences
eTELEMED, eKNOW, eL&mL, BIODIV, BIOENVIRONMENT, BIOGREEN, BIOSYSCOM,BIOINFO, BIOTECHNO
issn: 1942-2660
International Journal On Advances in Networks and Services
ICN, ICNS, ICIW, ICWMC, SENSORCOMM, MESH, CENTRIC, MMEDIA, SERVICECOMPUTATION
issn: 1942-2644
International Journal On Advances in Security
ICQNM, SECURWARE, MESH, DEPEND, INTERNET, CYBERLAWS
issn: 1942-2636
International Journal On Advances in Software
ICSEA, ICCGI, ADVCOMP, GEOProcessing, DBKDA, INTENSIVE, VALID, SIMUL, FUTURECOMPUTING, SERVICE COMPUTATION, COGNITIVE, ADAPTIVE, CONTENT, PATTERNS
issn: 1942-2628
International Journal On Advances in Systems and Measurements
ICQNM, ICONS, ICIMP, SENSORCOMM, CENICS, VALID, SIMUL
issn: 1942-261x
International Journal On Advances in Telecommunications
AICT, ICDT, ICWMC, ICSNC, CTRQ, SPACOMM, MMEDIA
issn: 1942-2601