the iab job vacancy surveydoku.iab.de/fdz/reporte/2017/dr_04-17_en.pdf · processes is a unique...
TRANSCRIPT

The IAB Job Vacancy Survey Establishment survey on labour demand and recruitment processes
Waves 2000 to 2014 and subsequent quarters since 2006
Alexander Kubis, Andreas Moczall, Martina Rebien
04/2017
FDZ-Datenreport 04/2017 2
The IAB Job Vacancy Survey Establishment survey on labour demand and recruitment processes Waves 2000 to 2014 and subsequent quarters since 2006
Alexander Kubis, Andreas Moczall, Martina Rebien
Die FDZ-Datenreporte beschreiben die Daten des FDZ im Detail. Diese Reihe hat somit eine doppelte Funktion: zum einen stellen Nutzerinnen und Nutzer fest, ob die angebotenen Daten für das Forschungsvorhaben geeignet sind, zum anderen dienen sie zur Vorbereitung der Auswertungen.
FDZ-Datenreporte (FDZ data reports) describe FDZ data in detail. As a result, this series of reports has a dual function: on the one hand, those using the reports can ascertain whether the data offered is suitable for their re-search task; on the other, the data can be used to prepare evaluations.

FDZ-Datenreport 04/2017 3
Contents
1 Differences to previous versions ................................................................................... 5 1.1 New sampling weights 5 1.2 Corrections in waves 2000-2004 6 1.3 Corrections in wave 2005 6 2 Description of the data set ............................................................................................ 7 2.1 Overview 8 2.2 Population and sample of the main questionnaire 8 2.3 Extrapolation procedure of the main survey 10 2.4 Sampling and extrapolation of the quarterly survey 11 3 Usage notes for users of the data set ..........................................................................11 3.1 Structure of the data set 11 3.2 Using the sampling weights 12 3.3 Questions with multiple responses 13 3.4 Classifications of industries and occupations 14 3.5 STATA examples 16
FDZ-Datenreport 04/2017 4
Zusammenfassung Die IAB-Stellenerhebung ist eine quartalsweise durchgeführte Betriebsbefragung, die reprä-sentativ das gesamtwirtschaftliche Stellenangebot in Deutschland abbildet. Sie ermittelt die Gesamtzahl aller offenen Stellen am Arbeitsmarkt, einschließlich jener Stellen, die nicht der Bundesagentur für Arbeit (BA) gemeldet werden. Der Hauptfragebogen enthält Informationen zu Zahl und Struktur offener Stellen, dem erwarteten künftigen Arbeitskräftebedarf, zur wirt-schaftlichen Lage und zur Entwicklung der befragten Betriebe. Der Zusatzfragebogen enthält Fragen zum letzten Fall einer Neueinstellung und zum letzten Fall eines gescheiterten Rekru-tierungsversuchs. Der erfragt die betriebliche Einschätzung und Nutzung aktueller arbeits-marktpolitischer Instrumente. Im Forschungsdatenzentrum der Bundesagentur für Arbeit wer-den die Befragungswellen ab 2000 mit allen Fragebogenteilen einschließlich der Quartalsbe-fragungen für externe Wissenschaftlerinnen und Wissenschaftler angeboten.
Abstract The IAB Job Vacancy Survey is a quarterly establishment survey covering the entire unfilled labour demand in Germany. It identifies the entire number of vacancies on the German labour market, including those vacancies that are not reported to the Federal Employment Agency (FEA), Germany’s public employment service. The main questionnaire enquires information about the number and structure of vacancies, future labour demand, about the current eco-nomic situation and the expected development of participating establishments. The additional questionnaire enquires information about the last new hiring and the last case of a failed re-cruitment effort. The special questionnaire enquires employer attitudes and firm use of current labour market instruments. The Research Data Centre of the Federal Employment Agency offers the data sets from the survey waves 2000 on.
Keywords: Establishment survey, vacancies, recruitment processes
We thank Franziska Zimmert, Torben Liebers and Christian Braun for their help in creating the data documentation of the IAB Job Vacancy Survey.

FDZ-Datenreport 04/2017 5
1 Differences to previous versions
1.1 New sampling weights New sampling weights are provided, going back to the year 2000. These sampling weights are the result of a new extrapolation procedure. The increasing relevance of temporary employ-ment agencies, with their specific vacancy-reporting behaviour, made a new extrapolation pro-cedure necessary. The number of reported vacancies from the survey is no longer adjusted to the number published by the Federal Employment Agency (FEA). Now, only the number of employees subject to social security contributions and the number of establishments per size class and industry are used as anchor variables.
Adjusting the number of reported vacancies to the FEA-published number was previously achieved by way of estimated vacancies that implicitly included publicly-funded jobs not sub-ject to social security contributions as well. Without this adjustment, the IAB Job Vacancy Sur-vey from 2000 to 2009 now only represents unsubsidized vacant positions as well as those subsidized vacant positions which are subject to social security contributions. From 2010 on, it continues to only represent unsubsidized vacant positions. In addition to this change, the extrapolation procedure now incorporates non-response correction.
The revision shifts the level of the total number of vacancies downward. This shift represents the sum of hoarded vacancies, vacancies not deregistered in time, and subsidized vacant po-sitions not subject to social security contributions. The development of the number of vacan-cies as well as the distribution of structural characteristics change only within the confidence intervals.
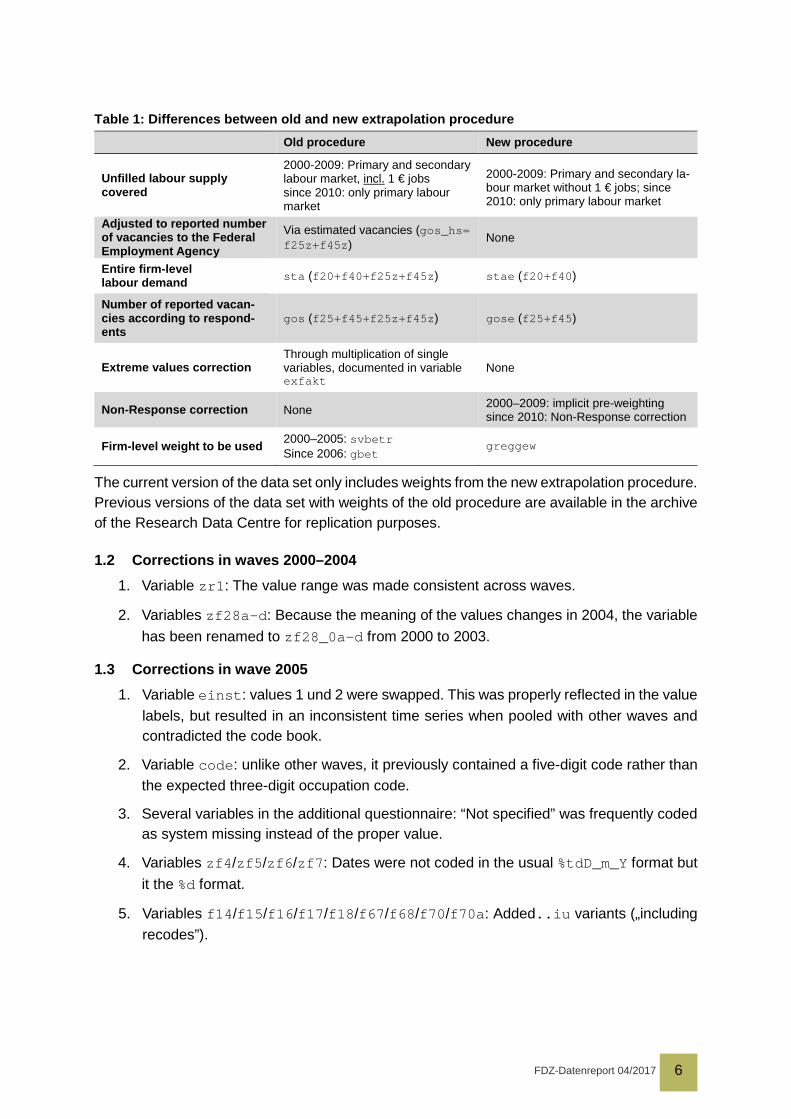
The extrapolation procedure now uses a single establishment weight (greggew). The previous distinction between “employee weight” (formerly gsvb) and “establishment weight” (formerly gbet) no longer applies, as the new generalized regression estimator adjusts simultaneously for the two anchor variables number of establishments and number of employees (see Section 2.3). Table 1 summarizes the relevant differences between the new and old extrapolation pro-cedures. See the IAB Research Report No. 4/2016 (Brenzel et al. 2016) for background and details on the new extrapolation procedure.
FDZ-Datenreport 04/2017 6
Table 1: Differences between old and new extrapolation procedure Old procedure New procedure
Unfilled labour supply covered
2000-2009: Primary and secondary labour market, incl. 1 € jobs since 2010: only primary labour market
2000-2009: Primary and secondary la-bour market without 1 € jobs; since 2010: only primary labour market
Adjusted to reported number of vacancies to the Federal Employment Agency
Via estimated vacancies (gos_hs= f25z+f45z) None
Entire firm-level labour demand sta (f20+f40+f25z+f45z) stae (f20+f40)
Number of reported vacan-cies according to respond-ents
gos (f25+f45+f25z+f45z) gose (f25+f45)
Extreme values correction Through multiplication of single variables, documented in variable exfakt
None
Non-Response correction None 2000–2009: implicit pre-weighting since 2010: Non-Response correction
Firm-level weight to be used 2000–2005: svbetr Since 2006: gbet
greggew
The current version of the data set only includes weights from the new extrapolation procedure. Previous versions of the data set with weights of the old procedure are available in the archive of the Research Data Centre for replication purposes.
1.2 Corrections in waves 2000–2004 1. Variable zr1: The value range was made consistent across waves.
2. Variables zf28a-d: Because the meaning of the values changes in 2004, the variable has been renamed to zf28_0a-d from 2000 to 2003.
1.3 Corrections in wave 2005 1. Variable einst: values 1 und 2 were swapped. This was properly reflected in the value
labels, but resulted in an inconsistent time series when pooled with other waves and contradicted the code book.
2. Variable code: unlike other waves, it previously contained a five-digit code rather than the expected three-digit occupation code.
3. Several variables in the additional questionnaire: “Not specified” was frequently coded as system missing instead of the proper value.
4. Variables zf4/zf5/zf6/zf7: Dates were not coded in the usual %tdD_m_Y format but it the %d format.
5. Variables f14/f15/f16/f17/f18/f67/f68/f70/f70a: Added..iu variants („including recodes”).
FDZ-Datenreport 04/2017 7
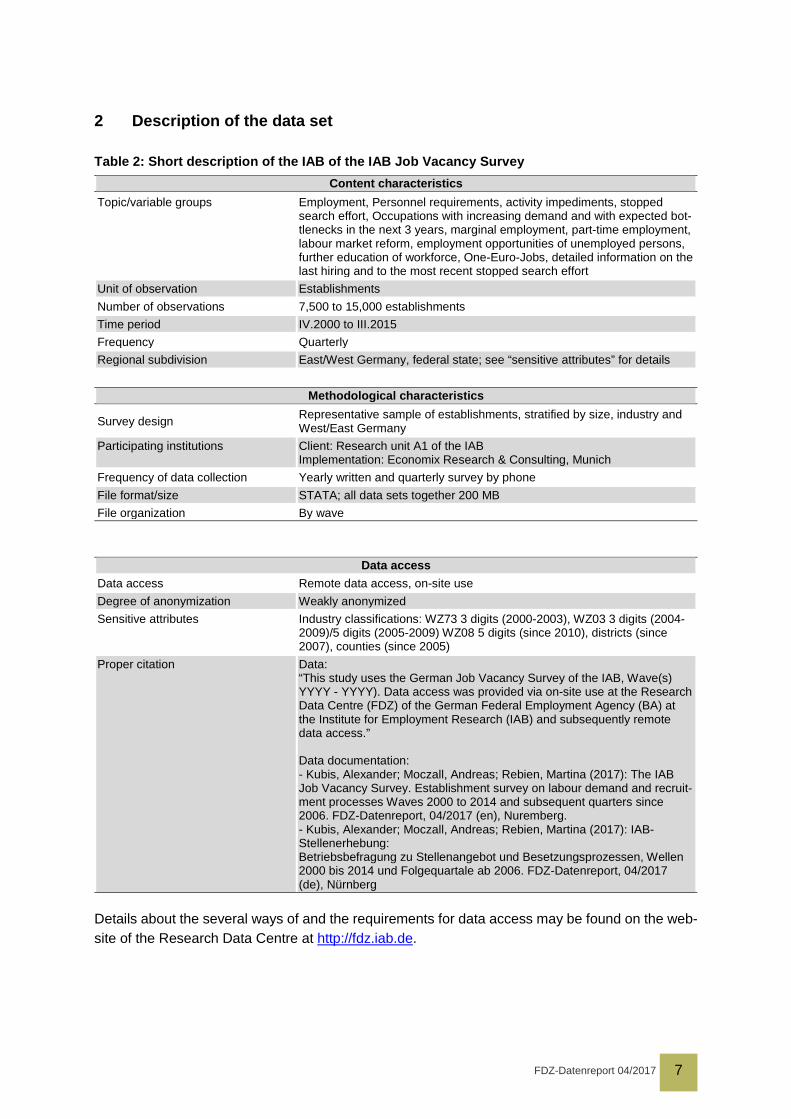
2 Description of the data set
Table 2: Short description of the IAB of the IAB Job Vacancy Survey Content characteristics
Topic/variable groups Employment, Personnel requirements, activity impediments, stopped search effort, Occupations with increasing demand and with expected bot-tlenecks in the next 3 years, marginal employment, part-time employment, labour market reform, employment opportunities of unemployed persons, further education of workforce, One-Euro-Jobs, detailed information on the last hiring and to the most recent stopped search effort
Unit of observation Establishments Number of observations 7,500 to 15,000 establishments Time period IV.2000 to III.2015 Frequency Quarterly Regional subdivision East/West Germany, federal state; see “sensitive attributes” for details
Methodological characteristics
Survey design Representative sample of establishments, stratified by size, industry and West/East Germany
Participating institutions Client: Research unit A1 of the IAB Implementation: Economix Research & Consulting, Munich
Frequency of data collection Yearly written and quarterly survey by phone File format/size STATA; all data sets together 200 MB File organization By wave
Data access
Data access Remote data access, on-site use Degree of anonymization Weakly anonymized Sensitive attributes Industry classifications: WZ73 3 digits (2000-2003), WZ03 3 digits (2004-
2009)/5 digits (2005-2009) WZ08 5 digits (since 2010), districts (since 2007), counties (since 2005)
Proper citation Data: “This study uses the German Job Vacancy Survey of the IAB, Wave(s) YYYY - YYYY). Data access was provided via on-site use at the Research Data Centre (FDZ) of the German Federal Employment Agency (BA) at the Institute for Employment Research (IAB) and subsequently remote data access.” Data documentation: - Kubis, Alexander; Moczall, Andreas; Rebien, Martina (2017): The IAB Job Vacancy Survey. Establishment survey on labour demand and recruit-ment processes Waves 2000 to 2014 and subsequent quarters since 2006. FDZ-Datenreport, 04/2017 (en), Nuremberg. - Kubis, Alexander; Moczall, Andreas; Rebien, Martina (2017): IAB-Stellenerhebung: Betriebsbefragung zu Stellenangebot und Besetzungsprozessen, Wellen 2000 bis 2014 und Folgequartale ab 2006. FDZ-Datenreport, 04/2017 (de), Nürnberg
Details about the several ways of and the requirements for data access may be found on the web-site of the Research Data Centre at http://fdz.iab.de.
FDZ-Datenreport 04/2017 8
2.1 Overview The IAB Job Vacancy Survey is an establishment survey covering the entire unfilled labour demand in Germany. It identifies the entire number of vacancies on the German labour market, including those vacancies that are not reported to the Federal Employment Agency (FEA), Germany’s public employment service. This number alone allows for valid and unbiased con-clusions about labour demand in the economy as a whole, for the reporting quota, which is the share of vacancies reported to the FEA among all vacancies, greatly fluctuates over time and exhibits systematic differences between industries, regions and occupations.
The survey has been conducted since 1989 in the fourth quarter of every year using a written multi-part questionnaire. Since 2002, establishments may participate on-line via internet as well. This web questionnaire is identical to the written questionnaire. The main questionnaire enquires information about the number and structure of vacancies, future personnel require-ments, about the current economic situation and the expected development of participating establishments. The additional questionnaire enquires information about the last new hiring and the last case of a failed recruitment effort. This regular and detailed enquiry into hiring processes is a unique characteristic of the IAB Job Vacancy Survey, providing information on characteristics of the job, the person hired, search and recruitment channels including the en-gagement of job placement services, search and recruitment durations, the number of appli-cants, hiring difficulties as well as any compromises made. The additional questionnaire is only answered by establishments who have hired a new employee in the past year or have tried.
Main and additional questionnaire are basically the same from wave to wave except for editing changes and possible shifts in emphasis. The special questionnaire by contrast changes from wave to wave. Since 2000, it enquires employer attitudes and firm use of current labour market instruments. From 2005 to 2013, it mostly focused on the workfare scheme One-Euro-Jobs and for that reason only was provided to establishments in the public sector which pro-vided the vast majority of One-Euro-Jobs.
Since 2005, there are short follow-up surveys by phone on the core questions among partici-pants of the main survey. These quarterly surveys complement the written main survey in the respective fourth quarter. They enquire and update the most important data points in the main questionnaire, including the number of employees, the assessment of current workforce de-velopments and the number of vacancies.
The Research Data Centre of the Federal Employment Agency offers the data sets from the survey waves 2000 on. It includes the data from questionnaire parts including the quarterly surveys. Since September 2015, all documentation including variable and value labels, data reports and code books, is available in English as well.
2.2 Population and sample of the main questionnaire The population of the main survey in the fourth quarter of every year are all establishments in Germany with at least one employee subject to social security contributions in June (until wave 2004) or December (waves 2005 and later) of the preceding year, excluding private
FDZ-Datenreport 04/2017 9
households. “Establishment” is an economic unit according to the establishment identifier con-cept of the establishment identifier service of the Federal Employment Agency (Federal Em-ployment Agency 2013).
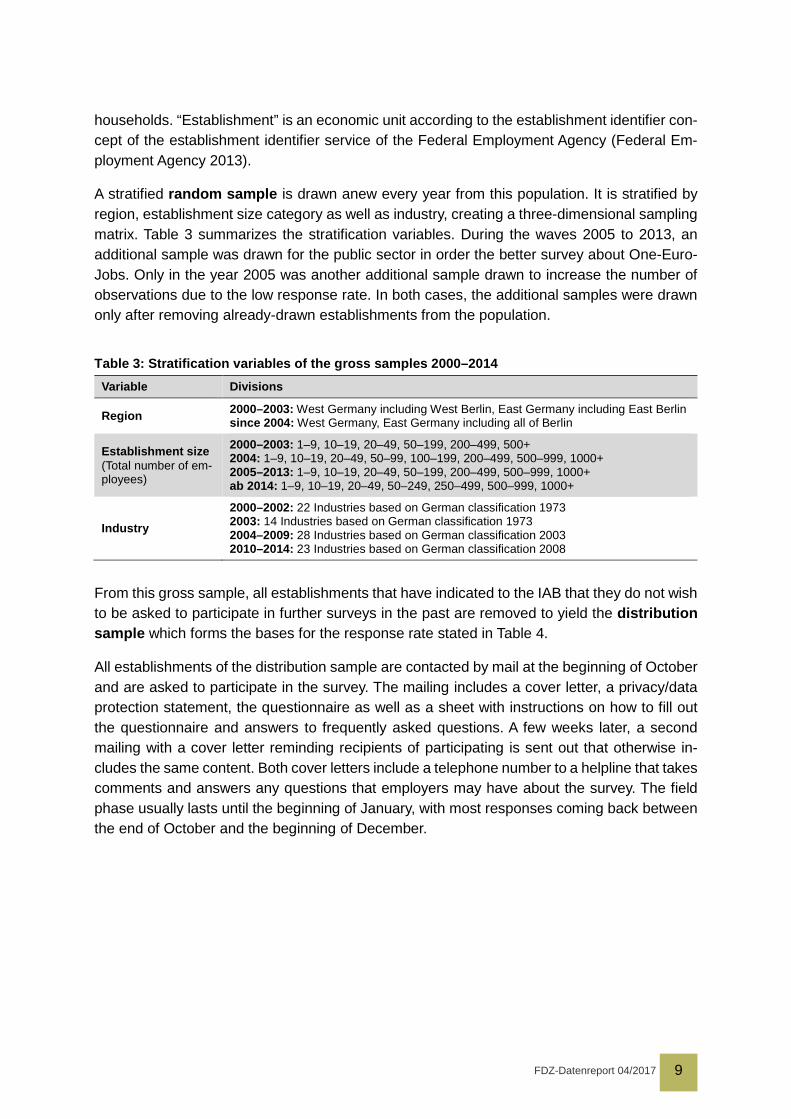
A stratified random sample is drawn anew every year from this population. It is stratified by region, establishment size category as well as industry, creating a three-dimensional sampling matrix. Table 3 summarizes the stratification variables. During the waves 2005 to 2013, an additional sample was drawn for the public sector in order the better survey about One-Euro-Jobs. Only in the year 2005 was another additional sample drawn to increase the number of observations due to the low response rate. In both cases, the additional samples were drawn only after removing already-drawn establishments from the population.
Table 3: Stratification variables of the gross samples 2000–2014 Variable Divisions
Region 2000–2003: West Germany including West Berlin, East Germany including East Berlin since 2004: West Germany, East Germany including all of Berlin
Establishment size (Total number of em-ployees)
2000–2003: 1–9, 10–19, 20–49, 50–199, 200–499, 500+ 2004: 1–9, 10–19, 20–49, 50–99, 100–199, 200–499, 500–999, 1000+ 2005–2013: 1–9, 10–19, 20–49, 50–199, 200–499, 500–999, 1000+ ab 2014: 1–9, 10–19, 20–49, 50–249, 250–499, 500–999, 1000+
Industry 2000–2002: 22 Industries based on German classification 1973 2003: 14 Industries based on German classification 1973 2004–2009: 28 Industries based on German classification 2003 2010–2014: 23 Industries based on German classification 2008
From this gross sample, all establishments that have indicated to the IAB that they do not wish to be asked to participate in further surveys in the past are removed to yield the distribution sample which forms the bases for the response rate stated in Table 4.
All establishments of the distribution sample are contacted by mail at the beginning of October and are asked to participate in the survey. The mailing includes a cover letter, a privacy/data protection statement, the questionnaire as well as a sheet with instructions on how to fill out the questionnaire and answers to frequently asked questions. A few weeks later, a second mailing with a cover letter reminding recipients of participating is sent out that otherwise in-cludes the same content. Both cover letters include a telephone number to a helpline that takes comments and answers any questions that employers may have about the survey. The field phase usually lasts until the beginning of January, with most responses coming back between the end of October and the beginning of December.
FDZ-Datenreport 04/2017 10
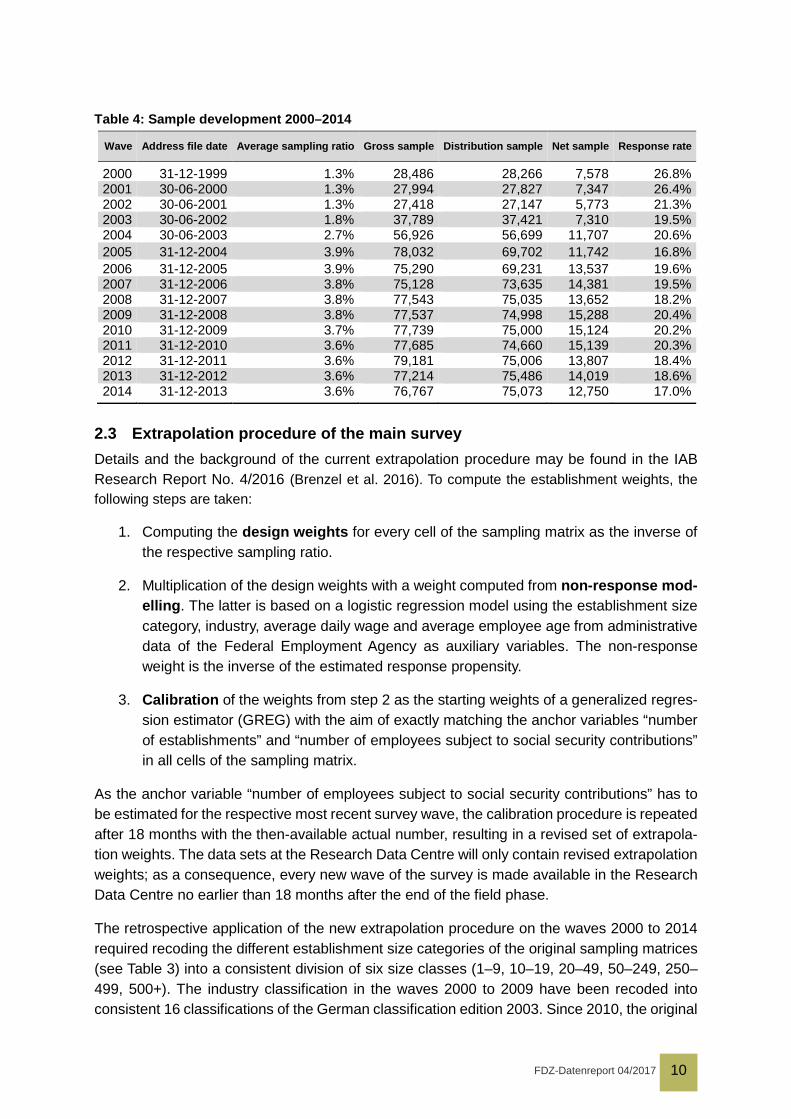
Table 4: Sample development 2000–2014
Wave Address file date Average sampling ratio Gross sample Distribution sample Net sample Response rate
2000 31-12-1999 1.3% 28,486 28,266 7,578 26.8% 2001 30-06-2000 1.3% 27,994 27,827 7,347 26.4% 2002 30-06-2001 1.3% 27,418 27,147 5,773 21.3% 2003 30-06-2002 1.8% 37,789 37,421 7,310 19.5% 2004 30-06-2003 2.7% 56,926 56,699 11,707 20.6% 2005 31-12-2004 3.9% 78,032 69,702 11,742 16.8% 2006 31-12-2005 3.9% 75,290 69,231 13,537 19.6% 2007 31-12-2006 3.8% 75,128 73,635 14,381 19.5% 2008 31-12-2007 3.8% 77,543 75,035 13,652 18.2% 2009 31-12-2008 3.8% 77,537 74,998 15,288 20.4% 2010 31-12-2009 3.7% 77,739 75,000 15,124 20.2% 2011 31-12-2010 3.6% 77,685 74,660 15,139 20.3% 2012 31-12-2011 3.6% 79,181 75,006 13,807 18.4% 2013 31-12-2012 3.6% 77,214 75,486 14,019 18.6% 2014 31-12-2013 3.6% 76,767 75,073 12,750 17.0%
2.3 Extrapolation procedure of the main survey Details and the background of the current extrapolation procedure may be found in the IAB Research Report No. 4/2016 (Brenzel et al. 2016). To compute the establishment weights, the following steps are taken:
1. Computing the design weights for every cell of the sampling matrix as the inverse of the respective sampling ratio.
2. Multiplication of the design weights with a weight computed from non-response mod-elling. The latter is based on a logistic regression model using the establishment size category, industry, average daily wage and average employee age from administrative data of the Federal Employment Agency as auxiliary variables. The non-response weight is the inverse of the estimated response propensity.
3. Calibration of the weights from step 2 as the starting weights of a generalized regres-sion estimator (GREG) with the aim of exactly matching the anchor variables “number of establishments” and “number of employees subject to social security contributions” in all cells of the sampling matrix.
As the anchor variable “number of employees subject to social security contributions” has to be estimated for the respective most recent survey wave, the calibration procedure is repeated after 18 months with the then-available actual number, resulting in a revised set of extrapola-tion weights. The data sets at the Research Data Centre will only contain revised extrapolation weights; as a consequence, every new wave of the survey is made available in the Research Data Centre no earlier than 18 months after the end of the field phase.
The retrospective application of the new extrapolation procedure on the waves 2000 to 2014 required recoding the different establishment size categories of the original sampling matrices (see Table 3) into a consistent division of six size classes (1–9, 10–19, 20–49, 50–249, 250–499, 500+). The industry classification in the waves 2000 to 2009 have been recoded into consistent 16 classifications of the German classification edition 2003. Since 2010, the original
FDZ-Datenreport 04/2017 11
sampling matrices already contained the still-current 23 classifications of the German Classi-fication edition 2008.
2.4 Sampling and extrapolation of the quarterly survey In each subsequent quarter, establishments are drawn from the participants of the written main questionnaire of the fourth quarter, until a threshold of least 9,000 establishments is met. The net sample of the written main survey therefore is the gross sample of follow-up surveys by phone.
Every one of the three subsequent quarters has its own establishment weight comprised of the establishment weight of the main survey in the fourth quarter of the original year and the result of another non-response model for the respective subsequent quarter.
3 Usage notes for users of the data set
3.1 Structure of the data set Every wave’s data are stored in one STATA 13 format data file. It contains the variables of the main, additional and special questionnaires and, since 2005, the data from the follow-up tele-phone surveys in the three subsequent quarters. Every file thus does not contain the four quarters of a calendar year, but instead the data of the fourth quarter plus the three quarters of the subsequent year. This division is useful as the participants of the follow-up surveys in the first to third quarter of the following year are recruited from the participants of the main survey in the fourth quarter of the respective original year. This creates an unbalanced panel with four data points in every wave of the survey.
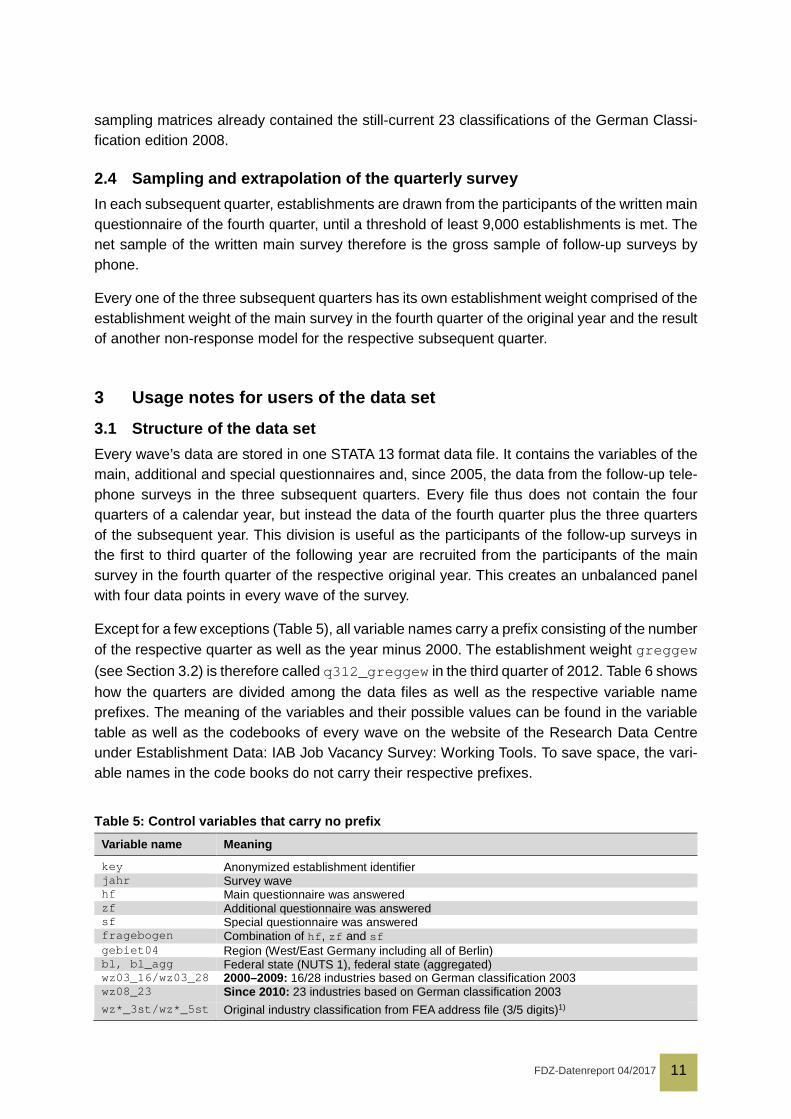
Except for a few exceptions (Table 5), all variable names carry a prefix consisting of the number of the respective quarter as well as the year minus 2000. The establishment weight greggew (see Section 3.2) is therefore called q312_greggew in the third quarter of 2012. Table 6 shows how the quarters are divided among the data files as well as the respective variable name prefixes. The meaning of the variables and their possible values can be found in the variable table as well as the codebooks of every wave on the website of the Research Data Centre under Establishment Data: IAB Job Vacancy Survey: Working Tools. To save space, the vari-able names in the code books do not carry their respective prefixes.
Table 5: Control variables that carry no prefix Variable name Meaning
key Anonymized establishment identifier jahr Survey wave hf Main questionnaire was answered zf Additional questionnaire was answered sf Special questionnaire was answered fragebogen Combination of hf, zf and sf gebiet04 Region (West/East Germany including all of Berlin) bl, bl_agg Federal state (NUTS 1), federal state (aggregated) wz03_16/wz03_28 2000–2009: 16/28 industries based on German classification 2003 wz08_23 Since 2010: 23 industries based on German classification 2003 wz*_3st/wz*_5st Original industry classification from FEA address file (3/5 digits)1)

FDZ-Datenreport 04/2017 12
kreis Since 2007: district (NUTS 3)1) rbezirk Since 2005: county (NUTS 2)1)
1) Sensitive attribute: provided to external users only upon request
Table 6: File names and variable name prefixes File name Quarter Variable name prefix
iabse_00.dta 4th quarter 2000 q40_
iabse_01.dta 4th quarter 2001 q41_
iabse_02.dta 4th quarter 2002 q42_
iabse_03.dta 4th quarter 2003 q43_
iabse_04.dta 4th quarter 2004 q44_
iabse_05.dta
4th quarter 2005 (written main questionnaire) q45_ 1st quarter 2006 (subsequent phone survey) q16_ 2nd quarter 2006 (subsequent phone survey) q26_ 3rd quarter 2006 (subsequent phone survey) q36_
(…)
iabse_14.dta
4th quarter 2014 (written main questionnaire) q414_ 1st quarter 2015 (subsequent phone survey) q115_ 2nd quarter 2015 (subsequent phone survey) q215_ 3rd quarter 2015 (subsequent phone survey) q315_
3.2 Using the sampling weights For descriptive analyses, the sampling weights must be used to infer from the net sample to the underlying population.1 For multivariate analyses, sampling weights usually are not used when all stratification variables (see Table 3) are included in the model specification (see Win-ship/Radbill 1994).
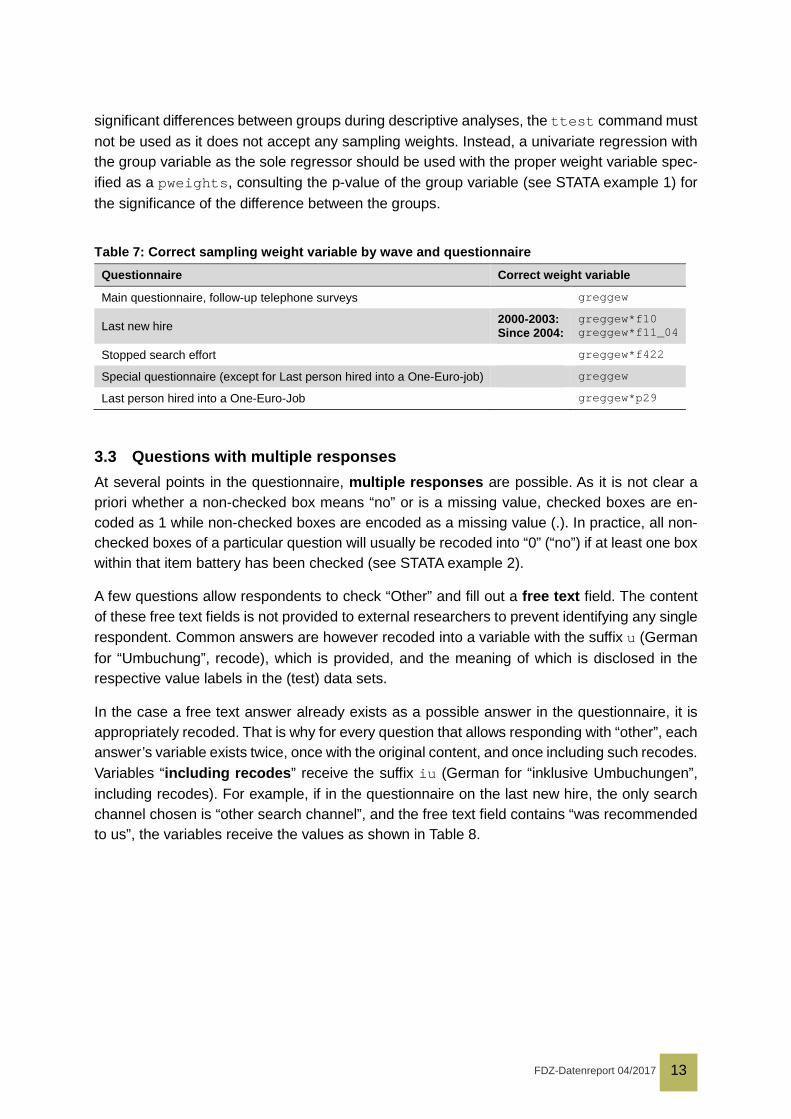
For variables from the main questionnaire as well as the special questionnaire, except for questions on the last person hired into a One-Euro-Job, the Establishment weight greggew must be used. For questions from the additional questionnaire on the last new hire, the hiring weight (Establishment weight multiplied with the number of new hires, since 2004 with the number of new hires subject to social security contributions), for questions on the last stopped search effort, the stopped search weight (establishment weight multiplied with the number of stopped search efforts) must be used. Table 7 summarizes the proper weights for each questionnaire. The data from the follow-up telephone surveys in the three subsequent quarters each use their own establishment weight greggew which differs from the main sur-vey’s establishment weight by having a different quarter-specific variable name prefix.
These weights are sampling weights by nature, so that in STATA, the weight type pweights must be specified, requiring the use of commands that support this type (svyset, svy:tab-ulate, regress). When using the commands tabulate (without svy:) and summarize, the weight type iweight may be used as well; this however precludes the interpretation of standard errors, for example after chi² tests. If it becomes necessary to test for statistically
1 When using weights in descriptive analyses, analogue unweighted results must always be specified
as well. The weighted and the corresponding unweighted result tables must always be listed one directly below the other. This will speed up the check for compliance with data protection laws.
FDZ-Datenreport 04/2017 13
significant differences between groups during descriptive analyses, the ttest command must not be used as it does not accept any sampling weights. Instead, a univariate regression with the group variable as the sole regressor should be used with the proper weight variable spec-ified as a pweights, consulting the p-value of the group variable (see STATA example 1) for the significance of the difference between the groups.
Table 7: Correct sampling weight variable by wave and questionnaire Questionnaire Correct weight variable
Main questionnaire, follow-up telephone surveys greggew
Last new hire 2000-2003: Since 2004:
greggew*f10 greggew*f11_04
Stopped search effort greggew*f422
Special questionnaire (except for Last person hired into a One-Euro-job) greggew
Last person hired into a One-Euro-Job greggew*p29
3.3 Questions with multiple responses At several points in the questionnaire, multiple responses are possible. As it is not clear a priori whether a non-checked box means “no” or is a missing value, checked boxes are en-coded as 1 while non-checked boxes are encoded as a missing value (.). In practice, all non-checked boxes of a particular question will usually be recoded into “0” (“no”) if at least one box within that item battery has been checked (see STATA example 2).
A few questions allow respondents to check “Other” and fill out a free text field. The content of these free text fields is not provided to external researchers to prevent identifying any single respondent. Common answers are however recoded into a variable with the suffix u (German for “Umbuchung”, recode), which is provided, and the meaning of which is disclosed in the respective value labels in the (test) data sets.
In the case a free text answer already exists as a possible answer in the questionnaire, it is appropriately recoded. That is why for every question that allows responding with “other”, each answer’s variable exists twice, once with the original content, and once including such recodes. Variables “including recodes” receive the suffix iu (German for “inklusive Umbuchungen”, including recodes). For example, if in the questionnaire on the last new hire, the only search channel chosen is “other search channel”, and the free text field contains “was recommended to us”, the variables receive the values as shown in Table 8.

FDZ-Datenreport 04/2017 14
Table 8: Example of recoding a free text answer Variable name Label Value
zf97 Search channel: via own employees/personal contacts . (not checked)
zf9n Other search channel 1 (checked)
zf9txt* Other search channel: free text „was recommended to us“
zf9u Recoded into… 11 (personal contacts)
zf97iu Search channel: via own employees/personal contacts (including recodes) 1 (checked or recoded into)
zf9niu Other search channel 0 (not checked, or recoded from)
* not included in data set at the Research Data Centre
3.4 Classifications of industries and occupations An establishment’s industry is not enquired in the questionnaire but instead is taken from the address file of the Federal Employment Agency during the drawing of the sample. As Table 3 shows, this was done until 2003 according to the German Classification of Economic Activities, 1973 edition 1973 (WZ73), from 2004 to 2009 according to the 2003 edition (WZ03), and from 2010 on according to the 2008 edition (WZ08). The provided data set however contains the classification WZ03 from 2000 to 2009 with 16 and 28 classifications (from 2000 to 2003 in recoded form) and classification WZ08 from 2010 on. The Research Data Centre provides the original three/five digit codes from the address file of the Federal Employment Agency to ex-ternal users only upon request.
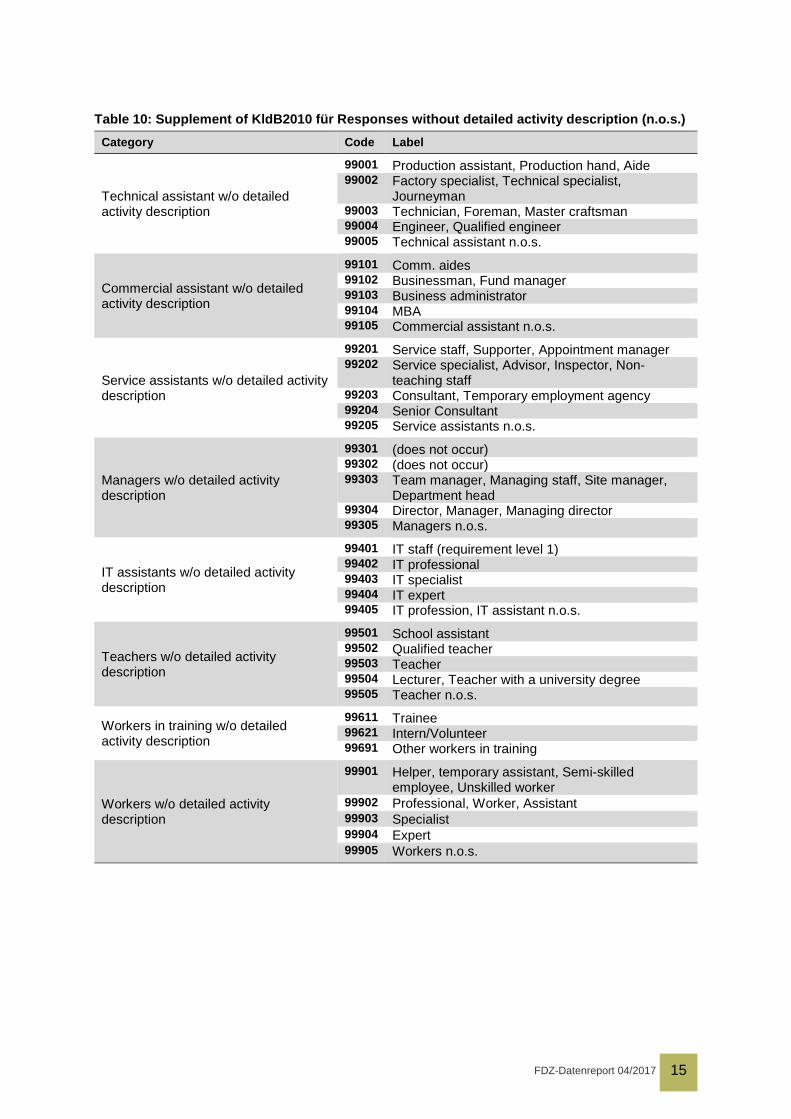
Several parts of the questionnaire ask respondents to specify occupations. Because determin-ing the proper occupational codes is too much to ask of respondents, the questionnaire in-stead inquires occupations in free text form which is coded into two classifications by the insti-tute that conducts the survey, as Table 9 shows. In a few cases, the responses were too gen-eral to find a proper code, requiring the definition of custom codes outside the official classifi-cation, which are listed in Table 10.
Table 9: Occupational classifications by wave Wave Occupational classification Variables
Classification 1 (German system)
2000-2011 Klassifikation der Berufe, 1992 edition (KldB92), 3 digits
c[1-5], bkz[1-3], f418_c[1-5], f423_c[1-5], f424c_[1-5], code, codeab, c430-c432
since 2012
Klassifikation der Berufe, 2010 edition (KldB10), 5 digits
kb10_*
Classification 2 (international system)
2000-2004 None
2005-2011 International Standard Classification of Occupations, 1988 Edition (ISCO-88)
isco*, isc1-3, f418isc*, f423isc*, f424isc*, i430-i432
since 2012
International Standard Classification of Occupations, 2008 Edition (ISCO-08)
isco08_*
FDZ-Datenreport 04/2017 15
Table 10: Supplement of KldB2010 für Responses without detailed activity description (n.o.s.) Category Code Label
Technical assistant w/o detailed activity description
99001 Production assistant, Production hand, Aide 99002 Factory specialist, Technical specialist,
Journeyman 99003 Technician, Foreman, Master craftsman 99004 Engineer, Qualified engineer 99005 Technical assistant n.o.s.
Commercial assistant w/o detailed activity description
99101 Comm. aides 99102 Businessman, Fund manager 99103 Business administrator 99104 MBA 99105 Commercial assistant n.o.s.
Service assistants w/o detailed activity description
99201 Service staff, Supporter, Appointment manager 99202 Service specialist, Advisor, Inspector, Non-
teaching staff 99203 Consultant, Temporary employment agency 99204 Senior Consultant 99205 Service assistants n.o.s.
Managers w/o detailed activity description
99301 (does not occur) 99302 (does not occur) 99303 Team manager, Managing staff, Site manager,
Department head 99304 Director, Manager, Managing director 99305 Managers n.o.s.
IT assistants w/o detailed activity description
99401 IT staff (requirement level 1) 99402 IT professional 99403 IT specialist 99404 IT expert 99405 IT profession, IT assistant n.o.s.
Teachers w/o detailed activity description
99501 School assistant 99502 Qualified teacher 99503 Teacher 99504 Lecturer, Teacher with a university degree 99505 Teacher n.o.s.
Workers in training w/o detailed activity description
99611 Trainee 99621 Intern/Volunteer 99691 Other workers in training
Workers w/o detailed activity description
99901 Helper, temporary assistant, Semi-skilled employee, Unskilled worker
99902 Professional, Worker, Assistant 99903 Specialist 99904 Expert 99905 Workers n.o.s.
FDZ-Datenreport 04/2017 16
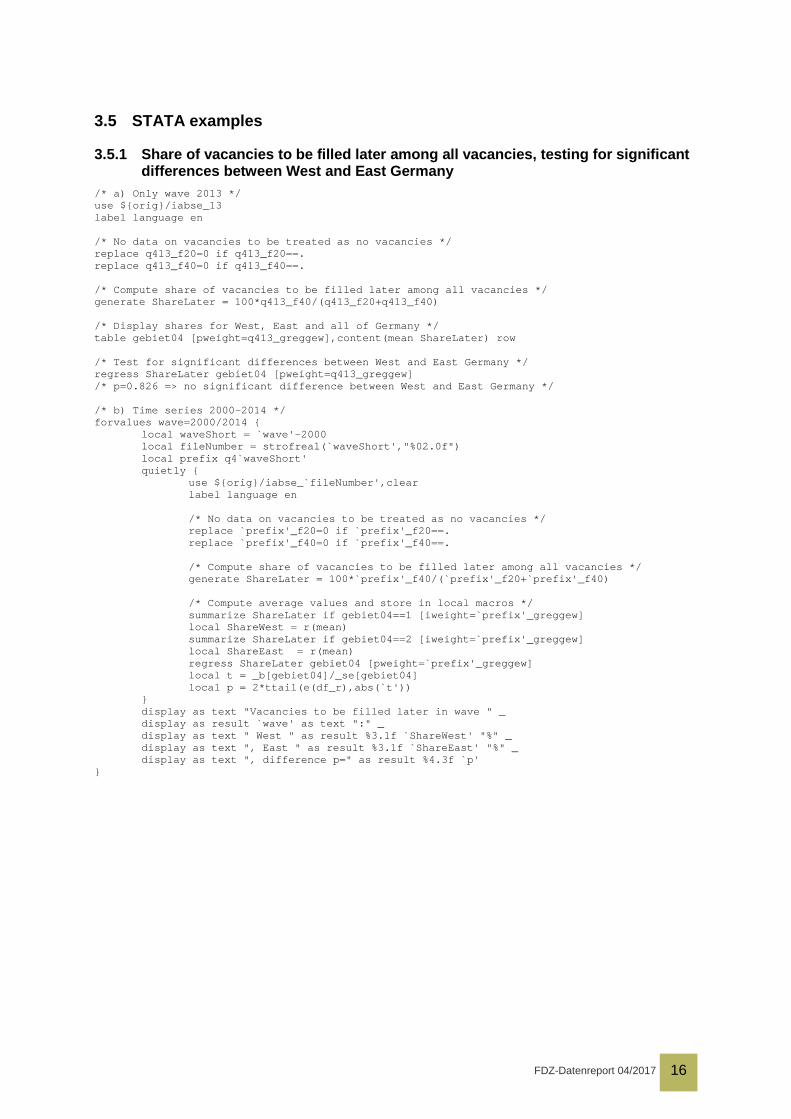
3.5 STATA examples
3.5.1 Share of vacancies to be filled later among all vacancies, testing for significant differences between West and East Germany
/* a) Only wave 2013 */ use ${orig}/iabse_13 label language en /* No data on vacancies to be treated as no vacancies */ replace q413_f20=0 if q413_f20==. replace q413_f40=0 if q413_f40==. /* Compute share of vacancies to be filled later among all vacancies */ generate ShareLater = 100*q413_f40/(q413_f20+q413_f40) /* Display shares for West, East and all of Germany */ table gebiet04 [pweight=q413_greggew],content(mean ShareLater) row /* Test for significant differences between West and East Germany */ regress ShareLater gebiet04 [pweight=q413_greggew] /* p=0.826 => no significant difference between West and East Germany */ /* b) Time series 2000-2014 */ forvalues wave=2000/2014 { local waveShort = `wave'-2000 local fileNumber = strofreal(`waveShort',"%02.0f") local prefix q4`waveShort' quietly { use ${orig}/iabse_`fileNumber',clear label language en /* No data on vacancies to be treated as no vacancies */ replace `prefix'_f20=0 if `prefix'_f20==. replace `prefix'_f40=0 if `prefix'_f40==. /* Compute share of vacancies to be filled later among all vacancies */ generate ShareLater = 100*`prefix'_f40/(`prefix'_f20+`prefix'_f40) /* Compute average values and store in local macros */ summarize ShareLater if gebiet04==1 [iweight=`prefix'_greggew] local ShareWest = r(mean) summarize ShareLater if gebiet04==2 [iweight=`prefix'_greggew] local ShareEast = r(mean) regress ShareLater gebiet04 [pweight=`prefix'_greggew] local t = _b[gebiet04]/_se[gebiet04] local p = 2*ttail(e(df_r),abs(`t')) } display as text "Vacancies to be filled later in wave " _ display as result `wave' as text ":" _ display as text " West " as result %3.1f `ShareWest' "%" _ display as text ", East " as result %3.1f `ShareEast' "%" _ display as text ", difference p=" as result %4.3f `p' }

FDZ-Datenreport 04/2017 17
3.5.2 Tabulating a multi-response question use ${orig}/iabse_13 label language en /* Create hiring weight */ generate gregneu = q413_greggew*q413_f11_04 /* Weight for all subsequent tabulations */ svyset [pweight=gregneu] /* Share of difficult hirings */ svy: tabulate q413_zf8 /* If a reason was checked, recode all non-checked reasons as “no”, Otherwise keep them on “missing” */ generate byte answered_zf8reason = q413_zf8aiu==1 | q413_zf8b1iu==1 | /// q413_zf8c1iu==1 | q413_zf8eiu==1 | q413_zf8niu==1 foreach var of varlist q413_zf8aiu q413_zf8b1iu q413_zf8c1iu q413_zf8eiu q413_zf8niu { replace `var'=0 if `var'==. & answered_zf8reason==1 } /* Make sure that a reason was checked only for difficult hirings */ assert answered_zf8reason == 0 if q413_zf8 != 1 /* Print reasons one after the other */ foreach var of varlist q413_zf8aiu q413_zf8b1iu q413_zf8c1iu q413_zf8eiu q413_zf8niu { svy: tabulate `var' if answered_zf8reason }
References Bundesagentur für Arbeit (2013): Betriebsnummernvergabe. https://www3.arbeitsagen-tur.de/web/wcm/idc/groups/public/documents/webdatei/mdaw/mtax/~edisp/l6019022dst-bai391187.pdf [2016-12-14]
Brenzel, Hanna; Czepek, Judith; Kiesl, Hans; Kriechel, Ben; Kubis, Alexander; Moczall, Andreas; Rebien, Martina; Röttger, Christof; Szameitat, Jörg; Warning, Anja; Weber, Enzo (2016): Revision of the IAB job vacancy survey * backgrounds, methods and results. (IAB-Forschungsbericht, 04/2016 (en)), Nürnberg, 61 S.
Winship, Christopher; Radbill, Larry (1994): Sampling Weights and Regression Analysis. Sociolog-ical Methods & Research 23 (2): 230–257

01/2009
FDZ-Datenreport 4/2017 (EN)
Dana Müller, Dagmar Theune
Dagmar Theune
http://doku.iab.de/fdz/reporte/2017/DR_04-17_EN.pdf
Dr. Alexander Kubis Institute for Employment Research (IAB) Regensburger Str. 104 D-90478 Nürnberg Phone: +49-911-179-8978 Email: [email protected]