the hurricane rainband and intensity change experiment (rainex
TRANSCRIPT

8/8/2005 3:21:46 PM Last saved by Sara Metz
The Hurricane Rainband and Intensity Change Experiment (RAINEX) Operations Plan
15 August-30 September 2005
R. A. Houze, Jr., and S. S. Chen Principal Investigators
J. Moore, R. Dirks, J. Meitín
Project Coordinators
1

8/8/2005 3:21:46 PM Last saved by Sara Metz
Table of Contents 1. RAINEX Science Overview ...................................................................................... 4
1.1 Introduction to RAINEX Science............................................................................ 4 1.2 RAINEX Objectives............................................................................................... 4 1.3 Ideas to be tested in RAINEX ............................................................................... 5 1.4 Analysis methods and modelling to be used in RAINEX........................................ 7
2. Project Facilities........................................................................................................ 8 2.1 Aircraft ................................................................................................................... 8 2.2 Airborne Doppler radars ...................................................................................... 19 2.3 Dropsondes ......................................................................................................... 20
3. Aircraft Flight Operations....................................................................................... 21 3.1 Airborne Doppler Radar Sampling Strategies...................................................... 21 3.2 Dropsonde sampling strategies ........................................................................... 26
4. RAINEX Operations Center .................................................................................... 28 4.1 Functions of the RAINEX Operations Center....................................................... 28 4.2 Location and layout of ROC................................................................................. 29 4.3 Real-time products at the ROC............................................................................ 30
4.3.1 Zebra and real-time aircraft updating ............................................................ 30 4.3.2 Aircraft radar, track and in-situ data and products......................................... 31 4.3.3 Satellite data products................................................................................... 31 4.3.4 RSMAS model products................................................................................ 32 4.3.5 Project Chat capabilities................................................................................ 32 4.3.6 Access to HRD/NHC special products .......................................................... 32 4.3.7 JOSS Field Catalog....................................................................................... 32
4.4 Alternative operations center support .................................................................. 33 4.5 Mission Science Summaries................................................................................ 33
5. Science Mission Planning Process ....................................................................... 33 5.1 Advance notifications for agencies and facilities regarding formation, location and movement of hurricanes ............................................................................................ 33 5.2 Mission selection and coordination with facilities ................................................. 35 5.3 Aircraft scientist staffing....................................................................................... 35 5.4 Mature Storms Experiment Flight Planning Considerations................................. 36 5.5 Mission plan approval .......................................................................................... 37 5.6 Pre-flight briefing.................................................................................................. 38 5.7 Post-flight debriefing ............................................................................................ 38 5.8 Crew duty day requirements................................................................................ 38
6. Rainex Operations Coordination ........................................................................... 39 6.1 Daily Planning Process........................................................................................ 39 6.2 Two or more Days Before Flight Day................................................................... 40 6.8 Daily Operations Plan .......................................................................................... 42
7. Critical communications and data transfer........................................................... 43 7.1 Real time radar and satellite data transmission to NRL P-3 ................................ 43 7.2 Flight track data to ROC ...................................................................................... 44 7.3 Voice communications......................................................................................... 44 7.4 Data for real time mesoscale model runs ............................................................ 44
2
8/8/2005 3:21:46 PM Last saved by Sara Metz
7.5 Transfer of aircraft data after landing................................................................... 44 8. In-Field Data Management...................................................................................... 45
8.1 Real time data collection...................................................................................... 45 8.2 RAINEX Field Catalog ......................................................................................... 45 8.3 Special datasets for real-time modeling activities ................................................ 46 8.4 Special satellite and other products ..................................................................... 46
8.4.1 GOES Data Collection .................................................................................. 46 8.4.2 Satellite Data Archival at JOSS..................................................................... 47 8.4.3 Browse products for field campaign .............................................................. 47
8.5 Supporting operational data................................................................................. 47 8.6 Processing/distribution of research flight datasets............................................... 48
9. Project Safety .......................................................................................................... 49 9.1 Miami ................................................................................................................... 49 9.2 Tampa ................................................................................................................. 51
10. References............................................................................................................. 52
3

8/8/2005 3:21:46 PM Last saved by Sara Metz
1. RAINEX SCIENCE OVERVIEW 1.1 Introduction to RAINEX Science One of the primary outstanding problems in hurricane dynamics is the tendency of mature storms to undergo rapid intensity changes. These intensity changes appear to be related to dynamical interactions between the inner-core region of the storm (eyewall) and rainbands located outside the eyewall region. Previous aircraft studies of tropical cyclones have tended to emphasize either the inner-core region or the rainbands located outside the eyewall. In contrast, relatively little has been done on eyewall-rainband interactions. The NSF sponsored Hurricane Rainband and Intensity Experiment (RAINEX) is an aircraft investigation of hurricane intensity changes associated with eyewall-rainband interactions. Three Doppler-radar-equipped P-3 aircraft will be deployed to obtain Doppler radar and dropsonde data simultaneously in the rainband and eyewall regions. Supplemental dropsonde data will be obtained in some cases with the NOAA G-IV aircraft and the AF C-130 reconnaissance aircraft. The Doppler radar and dropsondes will be analyzed in coordination with the University of Miami’s high-resolution, vortex-following, coupled ocean-atmosphere version of the MM5 mesoscale model and an experimental version of the Weather Research and Forecasting (WRF) model. In near real time, the model output and observations from the immediately preceding aircraft mission will be used to assess the success of the flights and to help make modifications to the flight program to maximize the chance of successful flights. In post-analysis, the aircraft data will be compared to the model output to determine the accuracy of the model simulations and the model will be used to extend the diagnosis possible from the data alone. 1.2 RAINEX Objectives The objectives of RAINEX are to document hurricane rainband and inner-core structures to gain insight into how they interact and, ultimately, affect hurricane intensity changes. Despite many years of hurricane studies, there is a general dearth of observations indicating how hurricane outer rainbands interact with the storm’s inner core, and hence with storm intensity changes. This problem will be addressed in RAINEX by Doppler radar observations. The coverage by Doppler radar in past studies using the two NOAA P-3 aircraft has generally not been aimed at obtaining simultaneous dual-Doppler observation of the rainbands outside the eyewall and of the eyewall itself. Typically, the observations have aimed at either the inner core or rainbands separately. To address this observational gap, RAINEX will bring a third Doppler radar aircraft (the NRL P-3 with the NCAR ELDORA radar) to the NOAA 2005 Hurricane Field Program. The availability of three Doppler aircraft allows for simultaneous quadruple Doppler coverage of the principal rainband and continuous monitoring of the eyewall dynamics (see flight plan discussion above). With three Doppler radar aircraft, RAINEX will:
4
8/8/2005 3:21:46 PM Last saved by Sara Metz
i. Document rainband and inner-core structures simultaneously by intensive multiple aircraft dual-Doppler radar. These airborne data will determine the evolution and structure of the rainbands relative to their environments and relative to the evolution of the inner-core region of the storm. The radar data will indicate which portions of rainbands are convective and stratiform. The patterns of divergence and vorticity associated with the convective and stratiform precipitation within the rainbands will be identified in the Doppler radar data and used to indicate the spatial configuration of fine-scale PV generation within the rainbands and eyewall.
ii. Describe the environments of the rainbands by using GPS dropsonde data. These data will provide the thermodynamic framework for the dual-Doppler radar observations of rainband and eyewall structure and dynamics.
iii. Use a high-resolution, non-hydrostatic, and full physics numerical model (the UM/RSMS coupled atmosphere-wave-ocean, vortex-following MM5) to investigate the interaction of rainbands and the inner-core region and the impact of this interaction on overall hurricane structure and evolution—particularly intensity changes. The aircraft Doppler radar and dropsonde observations will be used as constraints on what model output can or cannot be considered realistic. The subdivision of rainbands into convective and stratiform region will be examined in relation to the vertical profile of heating and PV generation on the sub-rainband scale. These small scale PV patterns related to latent heating profiles in the convective and stratiform regions will traced in the model through the axisymmetrization process, which is thought to be related to storm intensity change. The role of convectively induced gravity waves will also be examined in the model context and examined for consistency with the radar and dropsonde data.
It is the premise of RAINEX that broad dual-Doppler radar coverage by multiple aircraft with dropsondes on the same aircraft missions can add substantially to the knowledge of the structure and, evolution of the outer rainbands and concentric eyewalls, if they are directed toward simultaneously observing the rainbands and in the inner-core (eyewall) region. It is a further premise that simultaneous behavior of the rainband and eyewall regions relates to the rainband-inner core dynamical interactions and hence to understanding storm intensity changes.
1.3 Ideas to be tested in RAINEX The vertical distribution of heating is different in convective and stratiform regions (Houze 1982, 1989, Mapes and Houze 1995, Houze 1997). The deep convective cores produce PV in a deep layer and maximum heating in the low-to-mid troposphere, whereas the PV is confined to the mid-troposphere with a maximum heating in the upper troposphere in stratiform rain area. The experience of airborne scientists on hurricane flights has been to notice that radar observations tend to show rainbands having more deep convective cores on the upwind side of the storm, whereas stratiform precipitation dominates in the downwind part of the storm. This impression constitutes an important empirical working hypothesis: A bias toward convective structure on the
5

8/8/2005 3:21:46 PM Last saved by Sara Metz
upwind side versus stratiform structure on the downwind side would produce asymmetric heating and PV profiles around the storm. We would expect this asymmetry to affect the vortex dynamics and storm intensity. In this study we will measure the heating asymmetry and determine how it affects the interaction between the rainbands and hurricane mean vortex. Hurricane rainbands are the major source of heating outside of the hurricane eyewall region. Convectively induced PV in the rainbands can be stretched into filaments that spiral inward along the bands toward the storm center. This process may increase PV in the inner core region when the rainbands evolve into a rainband pattern that includes a principal band (as defined by Willoughby et al. 1984). The complex of rainbands in the region outside the eyewall constitutes a relatively steady and stationary but asymmetric source of diabatic heating and PV production near the radius of maximum wind. Studies by Hack and Schubert (1986), Chen and Frank (1993), and Nolan and Grasso (2003) indicate that the intensification caused by such heating increases dramatically as the affected air moves closer to the center of the storm. The vertical structure of the heating in the stationary rainband complex is not known. Studies by Chen and Frank (1993), Bister and Emanuel (1997), and Ritchie et al. (2003) suggest that regions of stratiform rain in the center of a developing tropical storm favor intensification of the vortex. The vertical structure of the heating will be addressed in the research proposed here along with the horizontal pattern of rainband structure. We expect from past studies and experience that that the heating will have a vertical structure of a more convective type farther from the storm in the tail of the principal band and of a more stratiform type in the part of the principal band that is close to and making contact with the eyewall. Outside the hurricane inner core, PV is "axisymmetrized" by the shear of the symmetric vortex and may ultimately contribute further to intensification via the wave-mean flow interactions of associated vortex-Rossby waves (Montgomery and Kallenbach, 1997). Through this process, PV perturbations in rainbands can change the symmetric PV fields and thus the mean vortex itself. Since the vertical distribution of the heating (and hence the PV generation) in a rainband may depend on the rainband’s structure and location relative to the hurricane center, as noted above, the vertical structure of the PV being axisymmetrized will be a function of the position of the rainband relative to the storm. The location of a rainband and its attendant convective and stratiform regions relative to the shear of the symmetric wind field may determine whether the PV of the rainband becomes axisymmetrized. By documenting the convective vs. stratiform structure of rainbands in various positions relative to the storm center, we will indicate the nature of the PV anomalies being axisymmetrized at different radii and azimuths from relative to the storm center. The proposed study will determine the asymmetry of the heating by using airborne Doppler radar to map the convective and stratiform echo structures in the rainbands and eyewall to determine the vertical structure of heating as a function of horizontal position relative to the storm. RAINEX will extend the analyses of the aircraft data by examining
6

8/8/2005 3:21:46 PM Last saved by Sara Metz
the implications of the observed heating patterns relative to the storm via numerical modeling. Detailed simulations will be made with a high-resolution, nonhydrostatic, full-physics numerical model (operated by Professor Shuyi Chen at the UM) to determine the nature of the interactions between the mean vortex and convective and stratiform rainbands at different locations relative to the hurricane. The pattern of rainbands, and in particular the principal rainband (PRB) identified by Willoughby et al. (1984), appear to be key dynamic elements and are readily identified in real time by airborne radar. The features are persistent and therefore amenable to performing aircraft penetrations of them, as directed by scientists on the aircraft. The data collected on RAINEX flight tracks can be organized relative to a composite storm with a characteristic pattern of eyewall and principal band. By real time identification and targeted probing of these features by multiple dual-Doppler aircraft and dropsondes, we will obtain data that will constrain model simulations of the rainband/inner-core interactions. Our proposed experimental and modeling study will in this way focus on the principal band and other rainbands close to the inner core region and their dynamic connection with the inner core region of the storm. 1.4 Analysis methods and modelling to be used in RAINEX The RAINEX aircraft missions will focus on the inner-core rainband interactions relevant to hurricane intensity change. Each storm investigated by aircraft in RAINEX will be simulated with the UM model. Each storm will present a distinct set of rainbands and inner-core structures and interactions. The model simulations will assimilate the extensive dropsonde data collected in RAINEX. The analysis of the RAINEX aircraft data collected in rainbands will be broken down into convective and stratiform components (related to the vertical distribution of heating). Dual-Doppler synthesis of the aircraft radar data will be done at the UW by standard methods. To integrate the Doppler analyses, the aircraft-observed convective/stratiform patterns, and vertical echo-structure analysis with the information derived from model runs, RAINEX will use a UW version of the NCAR Zebra software (Corbet et al. 1994, James et al. 2000) to compare directly the dual-Doppler synthesized wind fields, reflectivity, and model output. The Zebra analysis will be invaluable both for forming working hypotheses relevant to the rainband/inner-core interactions that are relevant to hurricane intensity variation on a case-by-case basis and for testing those hypotheses by further examination of the data. The model output will be decomposed into symmetric and asymmetric parts, and the asymmetric parts into separate azimuthal wave numbers (Wang 2002, Chen and Yau 2001, and Zhang et al. 2001). Representing the storm-center-relative fields in terms of their symmetric and asymmetric parts, we will develop budgets for symmetric and asymmetric momentum, PV, and kinetic and potential energy. This methodology will use techniques developed by Nolan and Grasso (2003) and will lead to a diagnosis of the fundamental mechanics of rainband-eyewall interactions during development and intensity changes.
7

8/8/2005 3:21:46 PM Last saved by Sara Metz
Once working hypotheses are formed and tested by visual interactive analysis in Zebra, the aircraft data and model output will be approached statistically as well as in case-study mode. Hypotheses will be tested by accumulating probability distributions of variables associated with storm features. Statistics determined from the model output will be compared to statistics determined from the aircraft data to assess the validity of physical interpretations gleaned from the analyses in Zebra. 2. PROJECT FACILITIES 2.1 Aircraft The aircraft participating in RAINEX are:
• NOAA N42 WP-3D • NOAA N43 WP-3D • NOAA N49 G-IV • NRL 154589P-3B • USAF C-130
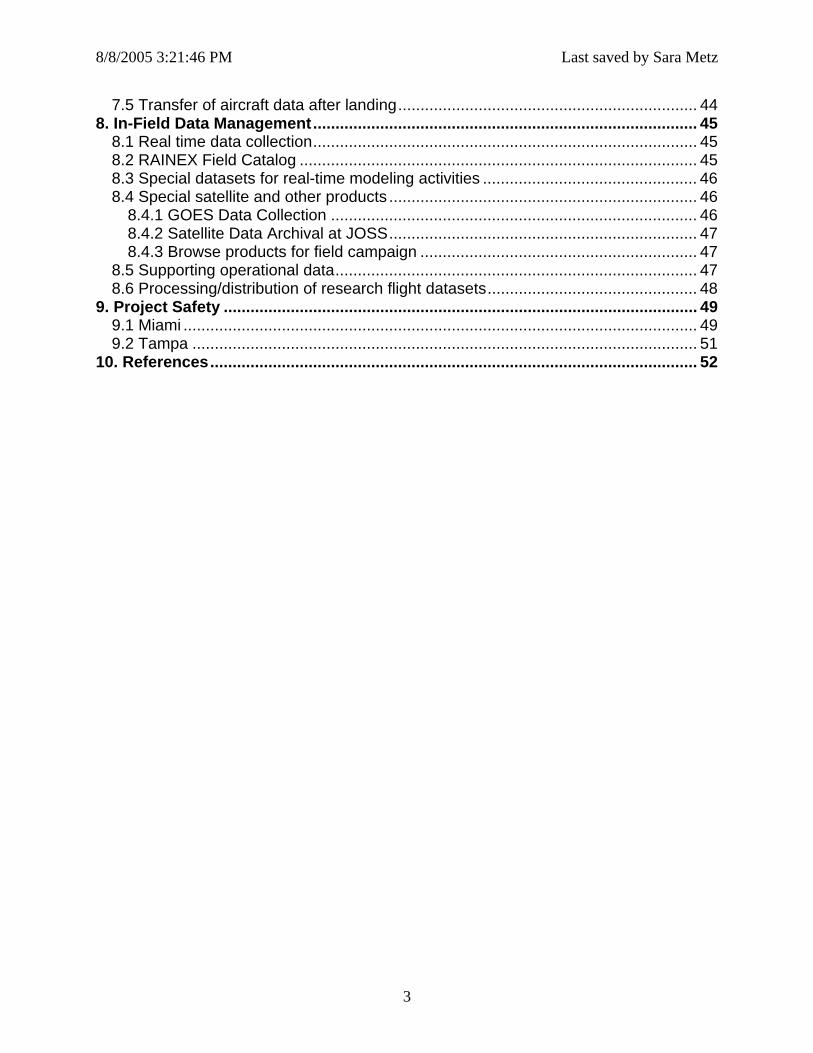
The two NOAA WP-3D aircraft (Fig. 2.1) are supported and deployed by the NOAA Aircraft Operations Center (AOC) in Tampa FL and are equipped with a variety of scientific instrumentation, radars and recording systems for both in-situ and remote sensing measurements of the atmosphere, the earth and its environment. General specifications of the NOAA aircraft and standard instrumentation are provided in Table 2.1 and a general description of the instrumentation aboard both aircraft is listed in Table 2.2. These aircraft have led NOAA's continuing effort to monitor and study hurricanes and other severe storms, the quality of the atmosphere, the state of the ocean and its fish population, and climate trends. The Naval Research Laboratory (NRL) P-3 (Fig. 2.2) is supported and deployed out of Patuxent River Naval Air Station, MD and has been modified to house with NSF funds the RAINEX research instrumentation package. The NRL P-3 has aircraft performance specifications similar to the NOAA P-3 aircraft (Table 2.1). The instrumentation aboard the aircraft, described more completely in Table 2.3, includes the ELDORA Doppler radar, a GPS dropsonde system, selected state parameters, and a data system, all provided by NCAR/EOL.
8
8/8/2005 3:21:46 PM Last saved by Sara Metz
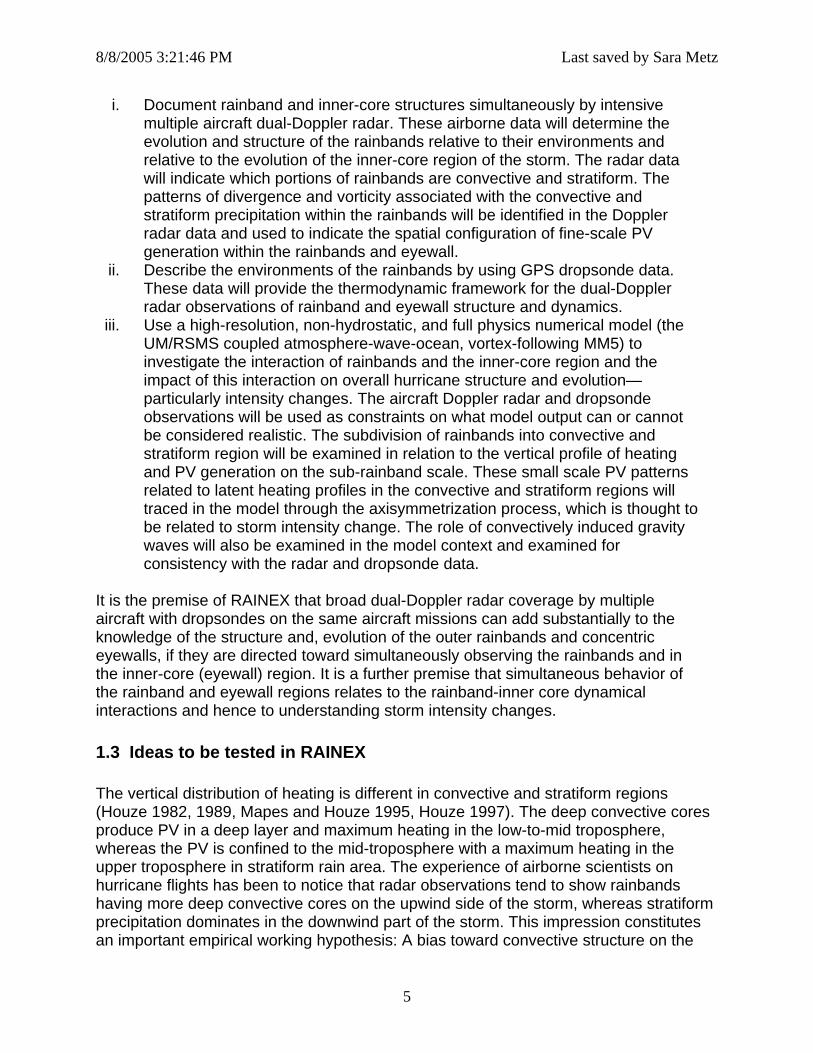
Fig. 2.1 NOAA P-3 Table 2.1 NOAA P-3 specifications Type Engines: 4 Allison T56-14 Turbo Prop Engines
Each rated at 4600 Shaft Horse Power (SHP)
Crew: 2 Pilots, Flight Engineer, Navigator, Flight Director (meteorologist), 2 or 3 Engineering/Electronic specialists, Radio/Avionics specialist, and a up to 12 Scientist or Media personnel.
Max. Takeoff Weight: 135,000 lbs.
Ceiling: 27,000'
Rate of Climb: Up to 3000 FPM depending on aircraft gross weight and density altitude
Operational Airspeeds: 170 - 250 KIAS
Electrical: 4 Generators (3 are engine driven, 1 Auxiliary Power Unit) each generator yields 120 volt, 3 phase, 400HZ power 90 KVA max power
Max. Gross Weight: 135,000 lbs max takeoff weight 114,000 lbs max landing (103,880 is normal)
9
8/8/2005 3:21:46 PM Last saved by Sara Metz
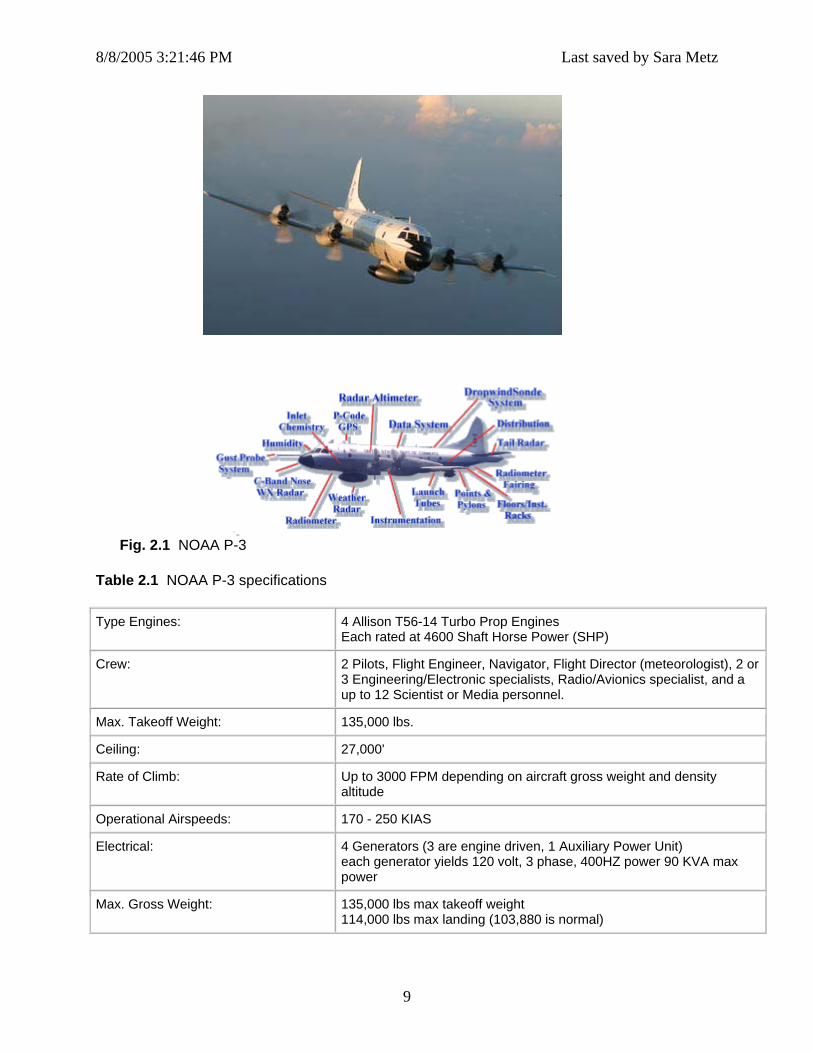
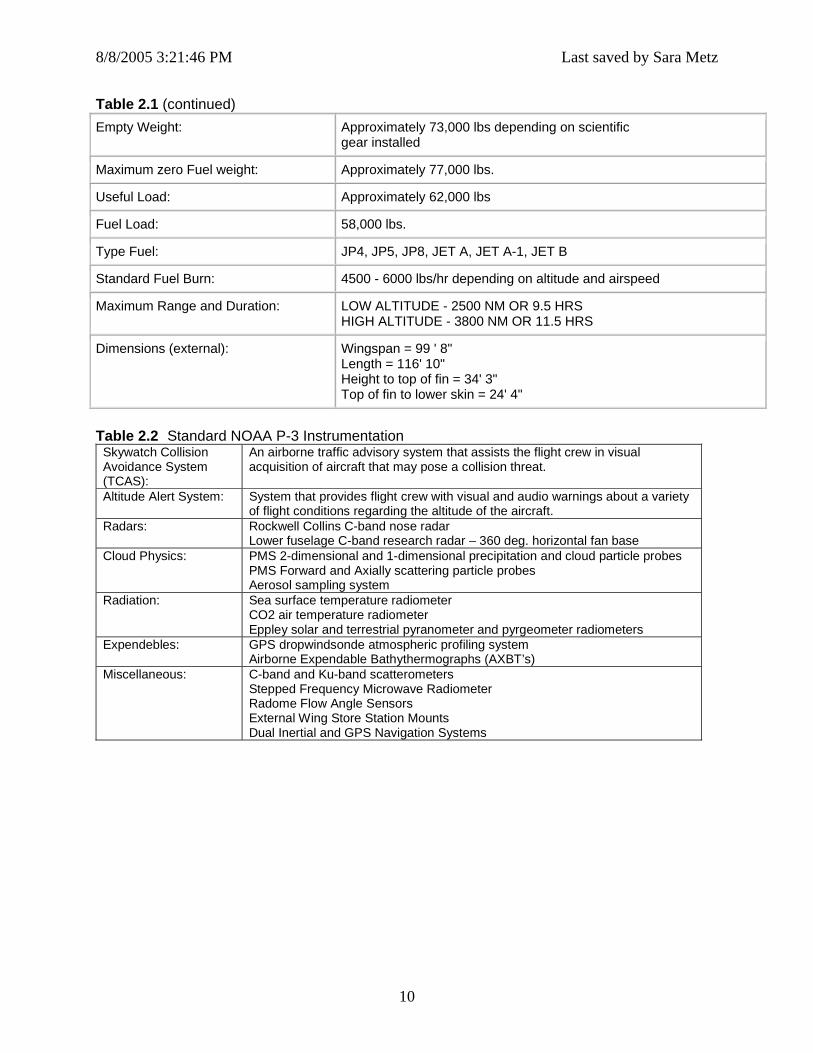
Table 2.1 (continued) Empty Weight: Approximately 73,000 lbs depending on scientific
gear installed
Maximum zero Fuel weight: Approximately 77,000 lbs.
Useful Load: Approximately 62,000 lbs
Fuel Load: 58,000 lbs.
Type Fuel: JP4, JP5, JP8, JET A, JET A-1, JET B
Standard Fuel Burn: 4500 - 6000 lbs/hr depending on altitude and airspeed
Maximum Range and Duration: LOW ALTITUDE - 2500 NM OR 9.5 HRS HIGH ALTITUDE - 3800 NM OR 11.5 HRS
Dimensions (external): Wingspan = 99 ' 8" Length = 116' 10" Height to top of fin = 34' 3" Top of fin to lower skin = 24' 4"
Table 2.2 Standard NOAA P-3 Instrumentation
Skywatch Collision Avoidance System (TCAS):
An airborne traffic advisory system that assists the flight crew in visual acquisition of aircraft that may pose a collision threat.
Altitude Alert System: System that provides flight crew with visual and audio warnings about a variety of flight conditions regarding the altitude of the aircraft.
Radars: Rockwell Collins C-band nose radar Lower fuselage C-band research radar – 360 deg. horizontal fan base
Cloud Physics: PMS 2-dimensional and 1-dimensional precipitation and cloud particle probes PMS Forward and Axially scattering particle probes Aerosol sampling system
Radiation: Sea surface temperature radiometer CO2 air temperature radiometer Eppley solar and terrestrial pyranometer and pyrgeometer radiometers
Expendebles: GPS dropwindsonde atmospheric profiling system Airborne Expendable Bathythermographs (AXBT’s)
Miscellaneous: C-band and Ku-band scatterometers Stepped Frequency Microwave Radiometer Radome Flow Angle Sensors External Wing Store Station Mounts Dual Inertial and GPS Navigation Systems
10

8/8/2005 3:21:46 PM Last saved by Sara Metz
Fig. 2.2 NRL P-3 Aircraft
able 2.3 NRL P-3 Instrumentation List
irborne Data System
T AA. Acquisition
torola 680o ADS2 (Mo 40 based) dules (1 unit)
t adjustable rates (1, 5, 25, 250 sps) B.
Motherboard with 2 Pentium III-500 CPUs, 512 MB Memory, Redhat Linux 7.2 OS
24 TFT Flat Panel Color Monitor (2 units)
C. /Distribution eal-time display package
ork link
o NCAR Distributed Sampling Moo Analog, digital and serial recording available aOperator Station o Intel L440GX+o 9GB Disk Storage with RAID-1 o General Digital 17 inch 1280x10o IBM-DRHS36D 36GB Removable Disk Drives In Kingston Carrierso UPS Data Displayo NCAR/RAF "WINDS" ro ASCII serial data feed available to Users via netw
Airc ftra Position, Velocity and Attitude A. Honeywell Model HG1095-AC03 Laseref SM Inertial Reference System (Research): LATITUDE,
MPONENT,
B. Garmin GPS16 Global Positioning System (GPS): LATITUDE, LONGITUDE, N-S GROUND SPEED
LONGITUDE, PITCH, ROLL, TRUE HEADING, VERTICAL VELOCITY, VERTICAL ACCELERATION, N-S GROUND SPEED COMPONENT, E-W GROUND SPEED COALTITUDE (MSL)
COMPONENT, E-W GROUND SPEED COMPONENT, ALTITUDE (MSL) Static Pressures A. Rosemount Model 1201F1 Pressure Transducer - Fuselage Pitot/Static, SN: 1516 (PSF, PSFC,
PSXC)
11

8/8/2005 3:21:46 PM Last saved by Sara Metz
Radars A. ELDORA Doppler Radar
e nose radar B. C-band weather avoidancDropsonde A. EOL GPS Dropsonde System Dynamic Pressures A. Rosemount Model 1221F1VL - Radome Gust Probe, SN: 148 (QCR, QCRC) B. Rosemount Model 1221F1VL - Fuselage Pitot, SN: 659 (QCF, QCFC) Temperatures A. Rosemount Type 102 Non-deiced Sensor - Rosemount Model 510BF Amplifier - Starboard Fuselage
B. -deiced Sensor - Rosemount Model 510BF Amplifier - Port Fuselage Mount, SN: 3183 (TTRR) Rosemount Type 102 NonMount, SN: 3245 (TTRL)
Dew Point and Humidity A. General Eastern, Model 1011B Dew Point Hygrometer - Starboard Fuselage Mount, SN: 1991293
(DPT, DPTC) Flo rs, Radome Gust Probe w Angle SensoA. Attack - Rosemount Model 1221F1VL Differential Pressure Transducer, SN: 1177 (AKRD)
B. Sideslip - Rosemount Model 1221F1VL Differential Pressure Transducer, SN: 1176 (SSRD)3-D Wind Field: WIND SPEED, WIND DIRECTION, VERTICAL WIND SPEED, N-S WIND COMPONENT, E-W WIND COMPONENT. Geometric Altitude A. NAVCOM Model APN-232 Radar Altimeter. Fuselage Mount, 0 to 15,000 m AGL (HGM232) Of primary interest to RAINEX are the lower fuselage (LF) radar and tail Doppler radar
e
he
able 2.4 Characteristics of the NOAA P-3 lower fuselage radar
aboard each of the NOAA P-3 aircraft and the ELDORA tail Doppler radar on the NRL P-3. The specifications of the NOAA P-3 LF radar are provided in Table 2.4. The LF radar will provide imagery used to guide flight operations in the vicinity of the hurricanrainbands and eyewall. Table 2.5 lists the NOAA tail Doppler radar characteristics. The tail Doppler radar aboard the NRL P-3 is the NCAR ELDORA system. Table 2.6 presents the specifications of ELDORA and a comparison of the NOAA and NCARDoppler radar systems. These radars will collect data to quantify 3-D air motion in trainbands and eyewall. T
Parameter
LF Radar
Scanning Method PPI
Wavelength 5.59 cm (C-band)
Beamwidth:
Steerable antenna:
1° Horizontal .
Vertical
1
4.1°
12

8/8/2005 3:21:46 PM Last saved by Sara Metz
Table 2.4 (continued)
from main lobe):
3.0 dB
Sidelobes:
(dB down -2
Gain:
37.5 dB
Antenna Rotation Rate RPM 2
Tilt Elevation: 10 deg
Pulse Repetition Frequency 200 s-1
Range Resolution
Unambiguous Range
ax; half pulse length) 750 m (m
750 km
Maximum Range (archived) 384 km
able 2.5 Characteristics of the NOAA P-3 vertical scanning Doppler radar T
Parameter
Tail Radar
Scanning Method ertical about the aircraft’s longitudinal axis; fore/aft Valternate sweep methodology
Wavelength 3.22 cm (X-band)
Beamwidth:
Steerable antenna:
nna:
.35°
ft: 2.07°, fore: 2.04°
Horizontal
Vertical
CRPE flat plate ante
Horizontal
Vertical
1
1.90°
a
aft: 2.10°, fore: 2.10°
Polarization (along sweep axis):
inear vertical
l
Steerable antenna:
CRPE flat plate antenna:
L
Linear horizonta
Sidelobes:
Steerable antenna:
3.0 dB
ft: -57.6 dB, fore: -55.6 dB
Horizontal:
Vertical:
CRPE flat plate antenna:
Horizontal:
Vertical:
-2
-23.0 dB
a
aft: -41.5 dB, fore: -41.8 dB
13

8/8/2005 3:21:46 PM Last saved by Sara Metz
Table 2.5 (continued)
Steerable antenna
0.0 dB
dB, fore: 35.9 dB
Gain:
CRPE flat plate antenna
4
aft: 34.85
Antenna Rotation Rate Variable up to 10 RPM (60° s-1)
Fore/Aft Tilt:
Steerable antenna ariable up to ± 25°
5° CRPE flat plate antenna
V
aft: -19.48°, fore: 19.2
Pulse Repetition Frequency Variable, 1600 s-1 – 3200 s-1
Dual PRF ratios 3/2 and 4/3
Pulses Averaged per Radial typical Variable, 32
Pulse Width 0.5 µsec, 0.375 µsec, 0.25 µsec
Gate Length 150 m Table 2.6 Parameters of System Characteristics of the NOAA P-3 and NRL P-3 tail mounted Doppler radars
Parameter NOAA NRL P-3 (ELDORA)
Scanning Me Vertical abou craft’s
y
Verticthod t the airlongitudinal axis; fore/aft alternate sweep methodolog
al about the aircraft’s longitudinal axis; fore/aft simultaneous sweep methodology
Wavelength 3.22 cm (X-band) 3.2 cm
Beamwidth:
Horizontal ft: 2.07°, fore: 2.04°
Vertical
a
aft: 2.10°, fore: 2.10°
1.8°
Polarization (along sweep axis): inear horizontal Linear horizontal L
Sidelobes:
Horizontal: ft: -57.6 dB, fore: -55.6 dB 5 dB
Vertical:
a
aft: -41.5 dB, fore: -41.8 dB
-3
Gain: aft: 34.85 dB, fore: 35.9 dB 39 dB
Antenna Rotation Rate e: 5-144 deg s-1 Variable 0-60° s-1 Variabl
Fore/Aft Tilt: aft: -19.48°, fore: 19.25° g on ±15-19 deg, dependin frequency
Pulse Repetition Frequency Variable, 1600 s-1 – 3200 s-1 00-5000 /sec Variable: 20
Dual PRF ratios Variable: 3/2 and 4/3, typical Variable
Pulses Averaged per Radial Variable, 32 typical Variable
Pulse Width 0.5 µsec, 0.375 µsec, 0.25 µsec ec 0.25-3 µs
14

8/8/2005 3:21:46 PM Last saved by Sara Metz
Table 2.6 (continued) Variable, 1° typical .075-2° Rotational Sampling Rate
Peak Transmitted Power 60 kW 35-40 kW
Unambiguous Range with Interlaced m PRT technique
38-92 k 20-90 km
Unambiguous Radial Velocity with 13-71 m/s 13-110 m/s Interlaced PRT technique
Number of transmitted frequencies NA 4
Along track beam spacing ~1.4 km 00 m ~3
Range resolution 150 m 37.5 m – 1200 m The NOAA G-IV jet aircraft (Fig. 2.3) is operated by the AOC out of Tampa FL and is
s
G-IV Aircraft
used primarily for dropsonde deployment in the vicinity of hurricanes. The specificationof the NOAA G-IV are in Table 2.7. The G-IV may be able to launch some additional sondes on behalf of RAINEX to aid in the analysis of the hurricane environment and vertical structure.
Fig. 2.3 NOAA
15

8/8/2005 3:21:46 PM Last saved by Sara Metz
Table 2.7 Standard aircraft specifications for NOAA G-IV aircraft
Tay 611-8 twin spool turbofan jet engines
Engines: Two Fuselage Mounted Rolls Royce
Crew: (Hurricane and Winter Storm Missions): 2 pilots 1 flight engineer/mechanic 1 flight meteorologist (flight director) 1 High Altitude Profiling Sysautomated) 3 Engineering Technicians/Dropwindsonde (Sonde) system operat
tem (HAPS) system operator (can be
ors
Ceiling: 45,000 feet
Rate of Cfully loade
limb (approximate - d):
st 25000 ft.) rough 33000 ft.)
ax wt. ceiling)
3000 fpm (fir1500 fpm (th1000 fpm (to 41,000 ft. – m
Operational Airspeeds: .77-.80, 440-460 kts.) 41,000 – 45,000 ft. True Airspeeds (Mach
Electrical: Two engine driven alternators (36KVA, 115 volt, unregulated 3 phOne Auxiliary Power Unit (APU) (36KVA, 115 volt, 400Hz, 3 phas
ase)e)
Two Converters (converts and regulates engine alternator power) Each provides: 23KVA, 400Hz, 3 phase AC power 250 amps, 28 volts DC power
Scientific Power: r scientific gear SED has an Uninterruptable Power Source (UPS) fo
Max. Gross Weight: Ramp 75,000 pounds Takeoff 74,600 pounds
Landing 66,000 pounds
Empty Weight: )
43,700 pounds (operational configuration
Useful Load: 31,300 pounds (operational configuration)
Fuel Load: 29,500 pounds
Type Fuel: Jet A, JP4, JP5, JP8
Standard Fuel Burn: ounds/hr for first hour and 3000 pounds/hr for (fully loaded) = 5000 pevery hour after that
Maximum Range: 3800 nm. (with a 1 hour fuel reserve)
Maximum Duration: rve) 8 hrs. 45 minutes (with 1 hour fuel rese
External Dimensions: er = 87.58 ft. Radome to trailing edge of horizontal stabilizRadome to aft end of fuselage = 78.83 ft. Wing Span = 77.83 ft. Horizontal Tail Span = 32 ft. Vertical Tail Height = 24.4 ft
16

8/8/2005 3:21:46 PM Last saved by Sara Metz
Table 2.7 (continued) Internal Dimensions: Head Roo
Bulkhead to Bulkhead = 8 ft. Cabin Length (Cockpit to Baggage Comp.) = 33 ft.
m = 6ft.
Useable Volume: Usable Length = 33Usable Width = 6 ft. Usable Height = 4 ft. Usable Volume = 792 cubic ft.
ft.
Additional Standard Equipment
Cockpit:
ll SATCOM Phone nce Systems (IRS) for navigation
S II System (with FAA Change 7) n System
2 High Frequency (HF) Radios 2 VHF Radios HoneyweGPS and Inertial Refere1 UHF Radio Honeywell TCAEROS Quick Donning OxygeCollins WXR-700C (C-band weather radar)
Cabin: bility ransmission capability
Dropwindsonde Tube with 8-channel tracking capaSatellite Communication System with voice/data tNumerous Computer Systems
The US Air Force (USNational Hurricane C cument conditions in developing and
ature hurricanes. There are several C-130 aircraft that are deployed for this purpose data
AF) Reserve C-130 (Fig. 2.4) is a primary tool used by the enter to investigate and do
mfrom the 53rd Weather Reconnaissance Squadron at Keesler AFB, MS. Aircraft, system and dropwindsonde system specifications are provided in Table 2.8.
17

8/8/2005 3:21:46 PM Last saved by Sara Metz
Fig. 2.4 USAFR WC-130 Hercules Weather Reconnaissance Aircraft
Table 2.8 United States Air Force Reserve WC-130 Weather Reconnaissance Aircraft General Specifications Aircraft Type WC-130H, J Model Aircraft Powerplant Allison Turboprop (4), 4000+ horsepower Aircraft Size 132’ 7” wingspan, 99’ 6” length, 38’ 6”
height Speed >350 mph Ceiling >33,000 ft Maximum Range: >4000 miles Maxiumum Takeoff Weight 155,000 lbs Crew Complement 6 (pilot, copilot, navigator, flight engineer,
aerial reconnaissance officer, dropsonde system operator)
Flight Level Data System Specifications Improved Weather Reconnaissance System (IWRS) Temperature Rosemount thermistor Dewpoint Edgetech 137-C3 dewpoint hygrometer Altitude Radar altimeter Pressure AirResearch Pressure altimeter Winds Multiple pressure and navigation
parameters Position Global Positioning System (GPS) Sampling rate 1, 10 second selectable archive rates.
Observations sent to NHC every 30 seconds
Dropswindonde System Specifications Sonde expendable size 16” x 2.25“ (diameter) Sonde fall rate ~2500 ft/min (depending on altitude)
18

8/8/2005 3:21:46 PM Last saved by Sara Metz
Table 2.8 (continued) Sonde position GPS triangulation Sonde winds GPS derived with drift Other measurements Pressure, temperature, humidity Data system Relay to aircraft. Edited and formatted
message to ground following end of each drop via satcom.
2.2 Airborne Doppler radars The primary objective of RAINEX is to obtain simultaneous dual-Doppler radar coverage in the eyewall and rainband regions with the three P-3 aircraft. The characteristics of the NOAA P-3 and NRL P-3 (ELDORA) x-band radars are listed in Table 2.6. ELDORA transmits up to four frequencies during a sampling period to increase the number of independent samples in each range sample to allow for a faster antenna scan rate (to ~144° s-1) without sacrificing measurement accuracy. The NOAA P-3 transmits a single frequency and consequently is restricted to a maximum antenna rotation rate of ~60° s-1 (~10 RPM). Both system employ a multiple PRF (pulse repetition frequency) scheme to extend their respective radial velocity Nyquist intervals to > 50 m s-1, greatly easing the work required to dealias (or unfold) radial velocity data sets. Fig. 2.5 illustrates the scanning methodology. Both ELDORA and the NOAA P-3 Doppler radar antennas are mounted in the tail of their respective aircraft. They utilize the fore/aft scanning technique to sweep out a three-dimensional volume during the aircraft’s flight track. For the NOAA P-3, alternative sweeps are scanned forward then aft by about 20° from a plane that is normal to the aircraft’s longitudinal axis. ELDORA transmits both fore and aft looking beams simultaneously. At intersection points of the fore and aft beams, a horizontal wind estimate can be made. The horizontal data spacing of those intersection points depends on the antenna rotation rate and the ground speed of the aircraft. For typical values of ground speed, the differences in antenna rotation rate lead to a ~300 m horizontal data spacing for ELDORA versus about a 1.4 km spacing for the NOAA P-3. For that reason the RAINEX flight patterns usually have the NRL P-3 flying outside of a primary rainband. The NOAA P-3s will observe the inner side of the same rainband and sample the vortex scale flow field.
19

8/8/2005 3:21:46 PM Last saved by Sara Metz
Fig. 2.5 Tail radar scanning geometry for both the NOAA P-3s and the NRL P-3. The left plot shows a schematic of the antenna scanning methodology. A horizontal projection of the beams is shown on the right.
2.3 Dropsondes Another major objective of RAINEX is to obtain as much dropsonde coverage as possible, especially in conjunction with the multiple Doppler radar coverage. All participating aircraft have GPS dropsonde capability, and drops will be performed as frequently as possible on all flights, according to the flight plans described in Section 3. All aircraft will be using the latest versions of dropsondes manufactured by Vaisala (RD90 and/or RD93). Table 2.9 lists general specifications of the dropsonde expendable package to be used during RAINEX. All facilities will be requested to provide high resolution raw data to RAINEX. A combination of facility and JOSS data quality checks will be performed prior to data archival. Table 2.9 Vaisala RD93 Dropsonde Specifications
General Characteristics Size 7 cm diameter, 41 cm long Weight <400 g Max Deployment Airspeed 125 m/s Indicated Air Speed Descent Speed ~11 m/s at sea level (adjustable by
parachute type) Descent Time ~15 min from 14 km
8 min from 7.5 km Transmitter RF, range 400-406 MHz
20

8/8/2005 3:21:46 PM Last saved by Sara Metz
Table 2.9 (continued) Telemetry range 325 km (assuming recommended
antenna) Battery 2 hr operating life, Lithium Receiver System AVAPS multi-dropsonde unit
Sensor Characteristics Pressure Vaisala BAROCAP. Range 1080 – 3 hPa.
Resolution 0.1 hPa. Accuracy 0.4 hPa. Temperature Vaisala THEROMCAP capacitive bead.
Range -90 ºC to +60 ºC. Resolution 0.1 ºC. Accuracy 0.2 ºC.
Relative Humidity (dual sensors) Vaisala H-HUMIDAD thin film capacitive bead. Range 0% to 100% RH. Resolution 1% RH. Accuracy 2% RH.
Horizontal winds GPS derived. Range 0-200 m/s. Resolution 0.1 m/s. Accuracy 0.5 m/s RMS.
3. AIRCRAFT FLIGHT OPERATIONS 3.1 Airborne Doppler Radar Sampling Strategies The flight track modules to be flown by the three Doppler radar aircraft in RAINEX are illustrated conceptually in Fig. 3.1. These modules are designed to be simple and adaptable. They will obtain the desired dual-Doppler and dropsonde data with a minimal degree of complexity, and they are readily modified in real time to accommodate whatever eyewall/rainband configuration presents itself. The Eyewall
21

8/8/2005 3:21:46 PM Last saved by Sara Metz
Fig. 3.1 RAINEX Doppler radar module nomenclature. Dots indicate possible dropsonde locations, to be adjusted depending on scale of storm features. The Eyewall Module will be flown repeatedly, rotating its orientation by increments of ~45 deg. The Inner and Outer Principal Rainband Modules will be flown in tandem for quadruple Doppler coverage, and they will be flown a few km outside the 35 dBZ contour.
EyewallModule
35 dBZ
35 dBZ
50 km
35 dBZ
35 dBZ
Inner PRB Module
Outer PRB Module
Module is a figure-four, which will be rotated by approximately 45 deg each time it is repeated. The other two modules are designed to cover the PRB. The second module is flown back and forth on the inside edge of the PRB and will be designated as the Inner PRB Module. The third module is flown back and forth on the outside edge of the PRB and will be designated as the Outer PRB Module. All three modules include dropsondes at intervals of 10-40 km along the track. The modules are designed so that each will give considerable useful information for RAINEX purposes. They will have the greatest advantage when used in combination, giving the best possible indication of the ongoing interaction between the eyewall and rainband components of the tropical cyclone. The dropsonde data will be assimilated into model simulations of the observed cases. The modules are geometrically simple and readily scalable by design, making it easier to adapt them to different storm scenarios. The simplicity and adaptability of the modules in Fig. 3.1 will allow the data collected by the aircraft to be useful both in individual case studies and statistically. The cases with multiple aircraft coverage will be especially useful for case study analysis. Figs 3.2-3.5 show how the Doppler radar aircraft will be deployed as a function of how many aircraft are available. Fig. 3.2 provides an overview of the triple-Doppler-aircraft flight plan most sought after in RAINEX. This three-aircraft pattern provides contemporaneous quadruple Doppler coverage in the PRB and continuous figure-four monitoring of the eyewall. This is the ideal pattern for achieving the objective of understanding rainband-eyewall interactions. This is only possible by having three Doppler aircraft on-station for extended (i.e., >2-3 h) periods. Simultaneous Doppler radar coverage of the major rainband and of the eyewall are required to satisfy the primary RAINEX science objectives. The coordination of three Doppler aircraft, made
22

8/8/2005 3:21:46 PM Last saved by Sara Metz
possible by NSF-supported involvement of the NRL P-3, has not heretofore been possible, and thus constitutes a valuable opportunity unique to the 2005 Atlantic hurricane season.
Fig. 3.2 RAINEX D
Three Doppler Aircraft1) NOAA P32) NOAA P33) NRL P3
2233
11
100 km
RAINEX Doppler A/C Deployment
oppler radar aircraft modules for NRL P-3 and two NOAA P-3 Doppler
this three-Doppler aircraft plan, Aircraft #1 is the Eyewall Module aircraft and will be
of
ition.
e
raft #3 will
o
nd al
ig. 3.3 illustrates how a three-Doppler-aircraft mission of the type described in wer-
It
aircraft. Aircraft #1 arrives first, reconnoiters, and executes a rotating figure-four Eyewall Module for the duration of the mission. Aircraft #2 enters under the guidance of Aircraft #1and flies reciprocal Inner PRB modules. Aircraft #3 enters under the guidance of Aircraft #2and flies reciprocal Outer PRB Modules.
Inone of the NOAA P-3 aircraft. It will arrive at the storm first and execute a figure-four in the inner core region and reconnoiter for the positioning of the second and third aircraft while performing this repeated survey. Aircraft #2 is the second NOAA P-3, and it will perform the Inner PRF Module, repeatedly going back and forth along the inside edge the PRB. It will arrive after Aircraft #1 has completed the initial figure-four, and it will be guided by Aircraft #1 into a position on the inside edge of the principal rainband (as described by Willoughby et al. 1984), or whatever rainband appears to be most significant at the time). Once in position, Aircraft #2 will guide Aircraft #3 into posAircraft #3 will be the NRL P-3, and it will arrive a short time after the Aircraft #2 to perform the Outer PRB Module, flying back and forth parallel to the outer edge of thPRB. Aircraft #2 will guide the NRL P-3 into position on the outside edge of the rainband. Aircraft #1 will continue to do figure-four patterns in the inner core, progressively rotating their orientations by ~45 deg, while Aircraft #2 and Aircfly back and forth on the inside and outside edge of the rainband, respectively, for the duration of the mission. Aircraft #2 and Aircraft #3 will attempt to coordinate their legs sthat quadruple Doppler coverage can be obtained in the rainband. If the rainband diminishes after the patterns have begun, Aircraft #2 will select another rainband adirect itself and Aircraft #3 to the new rainband and resume flying coordinated reciproctracks on the inside and outside edges of the rainband for the duration of the mission. FFig. 3.2 could be applied to a rather typical hurricane, as seen on a NOAA P-3 lofuselage radar display. Note that the NRL P-3 will be restricted to fly in echo <35 dBZ.is shown in the example to be avoiding intense portions of the outer rainbands (if
23

8/8/2005 3:21:46 PM Last saved by Sara Metz
present) by utilizing gaps between cells of higher reflectivity (depicted both by its nradar and frequent updates of the telemetered NOAA LF reflectivity pattern) and ultimately positioning itself so as to begin its first Outer PRB Module.
ose
ig. 3.3 RAINEX Doppler radar example. Reflectivity thresholds are for 27 (blue), 31 nd 3
r
If only two P-3 aircraft are available, the RAINEX objectives will be pursued with two at
s
l
dule.
e
2211
33
1 0 0 k m
F(green), 35 (yellow), 38 (brown), and 44 (red). The aircraft tracks are numbered 1, 2 ain Fig. 3.1. Aircraft #1 executes a repeating Eyewall Module. Aircraft #2 executes the InnePRB Module. Aircraft #3 is the NRL P-3, which must fly in rain with echo intensity < 35 dBZ. This schematic shows Aircraft #3 flying through gaps between cells to get in position to do the Outer PRB Module in tandem with Aircraft #2. Module nomenclature is defined in Fig. 3.1.
Doppler aircraft, but compromises will be required. Figs 3.4 and 3.5 show two ways ththe RAINEX goals can be accomplished, depending on which two Doppler aircraft participate and on which compromise is made. Fig. 3.4 shows the case in which themission is flown by either the NRL P-3 with one NOAA P-3 or by two NOAA P-3’s. In this option, continuous coverage of the eyewall is sacrificed to maintain more intensive(quadruple) Doppler coverage of the PRB. Aircraft #1 is a NOAA P-3 aircraft, and it begins the mission as the Eyewall Module aircraft. It arrives at the storm first and doeone or two figure-fours in the inner core region and reconnoiters for the location of the PRB and for the positioning of the second aircraft relative to the PRB. After completing its figure-four survey, Aircraft #1 assumes the role of Inner PRB Module aircraft and begins to fly in tandem with and directing Aircraft #2. Aircraft #2 is the NRL P-3. It wilarrive after Aircraft #1 has completed the initial figure-four, and it will be guided by Aircraft #1 into a position on the outside edge of the PRB and fly the Outer PRB Module. It will fly in tandem with Aircraft #1, which will be flying the Inner PRB MoThe two aircraft will coordinate their legs so that quadruple Doppler coverage can be obtained in the PRB. If the PRB diminishes after the patterns have begun, Aircraft #1 will select another rainband and direct itself and Aircraft #2 to the new rainband and resume flying reciprocal tracks on the inside and outside edges of that rainband for th
24

8/8/2005 3:21:46 PM Last saved by Sara Metz
duration of the mission. Aircraft #1 may perform a final figure-four in the eyewall at the end of the mission.
RAINEX Doppler A/C DeploymentOne NOAA P3 + NRL P3
1) NOAA P32) NRL P3 or NOAA P3
22
11
100 km
Fig. 3.4 RAINEX Doppler radar aircraft pattern for two P-3 aircraft. Aircraft #1 must be a NOAA P-3. Aircraft #2 is either the NRL P-3 or a NOAA P-3. Aircraft #1 first flies a figure-four Eyewall Module pattern, then when Aircraft #2 arrives, Aircraft #2 flies a quadruple Doppler track in tandem with Aircraft #1. The quadruple Doppler track entails Aircraft #1 and 2 flying reciprocal tracks of the Inner and Outer PRB Modules, respectively. At the end of the mission, Aircraft #1 may fly an additional Eyewall Module. See Fig. 3.1 for Module nomenclature. This option for two Doppler radar aircraft sacrifices continuous coverage of the eyewall region in favor of quadruple Doppler coverage in the PRB.
Fig. 3.5 shows another choice for the case in which only two Doppler aircraft are available. In this case, quadruple Doppler coverage is sacrificed to maintain continuous monitoring of the eyewall region. This option is available only when the two aircraft are both NOAA P-3s, because the NRL P-3 cannot fly the Inner PRB module. In this option, Aircraft #1 arrives first and flies the rotating figure-four Eyewall Module repeatedly for the entire mission, to provide continuous coverage in the eyewall. During its first figure-four pattern, it reconnoiters for the positioning of the second aircraft. Aircraft #2 is the second NOAA P-3. It will arrive after Aircraft #1 aircraft has completed the initial figure-four, and it will be guided by Aircraft #1 into a position on the inside edge of the principal rainband, where it will fly a racetrack pattern consisting of an Inner PRB Module followed by an Outer PRB Module. The racetrack is repeated as often as possible. In this pattern (just as in the case of PRB tracks shown in Figs. 2 and 4), some upwind legs are unavoidable, but will be balanced by intervening downwind legs. By flying the Inner PRB Module upwind the net distance upwind will be minimized. If the PRB diminishes after the patterns have begun, Aircraft #2 will select another rainband and commence flying the racetrack around the new rainband.
25

8/8/2005 3:21:46 PM Last saved by Sara Metz
Two NOAA Doppler Aircraft1) NOAA P32) NOAA P3
2211
100 km
Fi 5 Alt t RAINEX D l d i ft d l f t NOAA
RAINEX Doppler A/C Deployment
Fig. 3.5 Alternate RAINEX Doppler radar aircraft modules for two NOAA P-3 aircraft. Aircraft #1 arrives first, reconnoiters, and executes a rotating figure-four Eyewall Module for the duration of the mission. Aircraft #2 enters and flies an upwind Inner PRB module, goes around the end of the PRB and flies a downwind Outer PRB module. Then Aircraft #2 repeats the racetrack around the PRB for the duration of the mission. The racetrack could be flown in the opposite direction, but would be slower overall since it would have a longer upwind leg. This alternate can be used only when the NRL P-3 is not participating since the NRL P-3 may fly only the outer PRB Modules. This option for two Doppler radar aircraft sacrifices quadruple Doppler coverage of the PRB in favor of continuous coverage in the eyewall region.
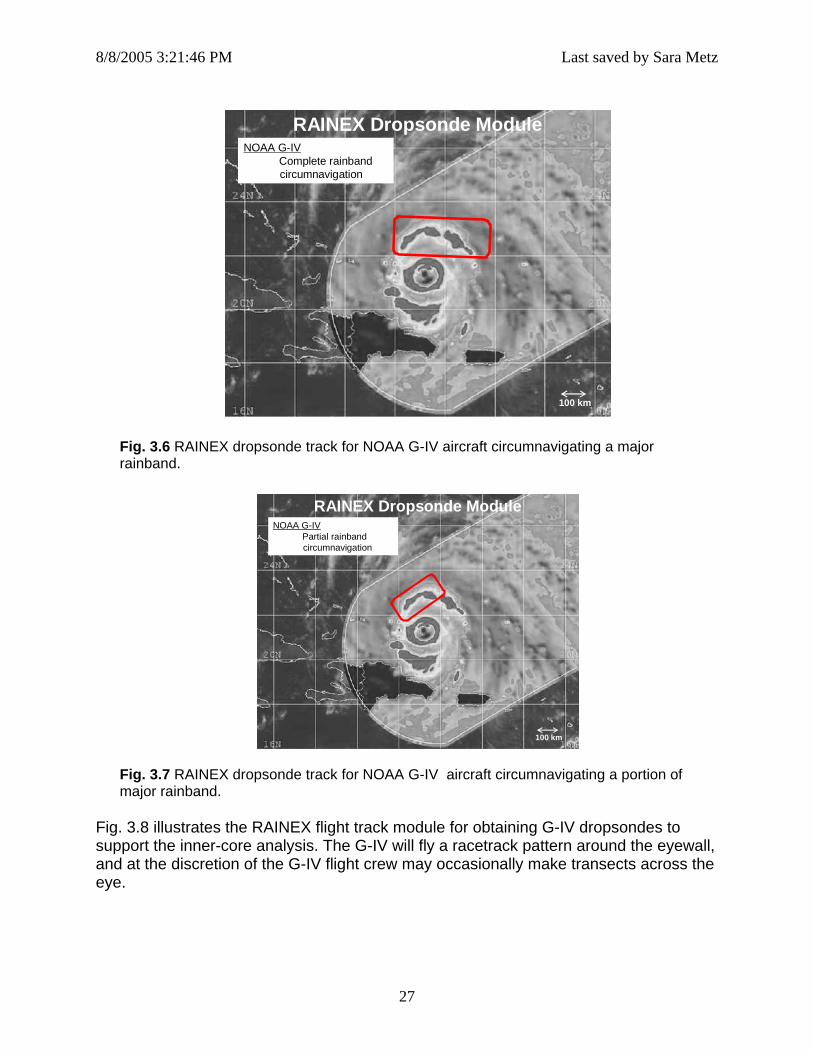
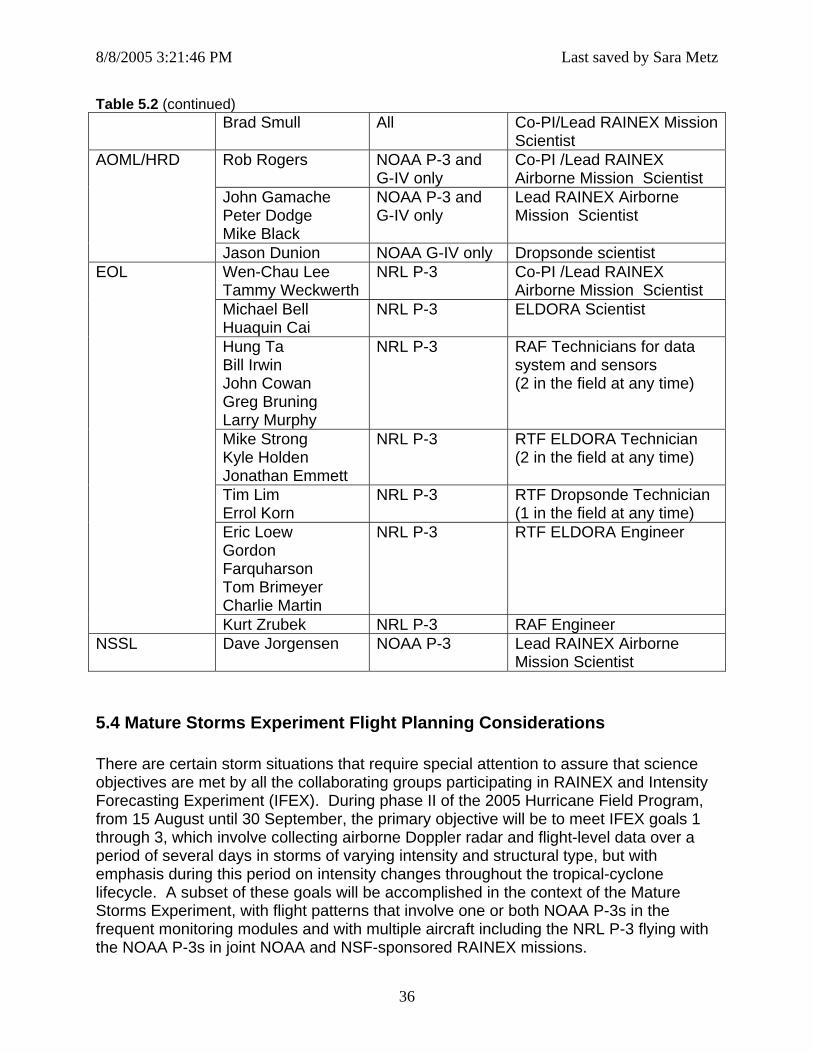
3.2 Dropsonde sampling strategies Figs 3.6-3.8 show dropsonde modules to be executed via the NOAA G-IV jet. Ideally, the dropsonde modules should be contemporaneous with the Doppler modules, but in real operations they may have to be separated in time. Figs 3.6 and 3.7 illustrate the RAINEX flight track modules for obtaining G-IV dropsondes to support analysis of the PRB. These modules are flown as part of HRD’s Saharan Air Layer Experiment (SALEX). The lead P-3 aircraft (see above) will guide the G-IV to the PRB, and the G-IV will fly a racetrack pattern around the entire rainband (Fig. 3.6) or around a selected segment of the rainband (Fig. 3.7). Soundings from the G-IV provide considerable additional data in the upper troposphere.
26
8/8/2005 3:21:46 PM Last saved by Sara Metz
RAINEX Dropsonde ModuleNOAA G-IV
Complete rainband circumnavigation
100 km
Fig. 3.6 RAINEX dropsonde track for NOAA G-IV aircraft circumnavigating a major rainband.
RAINEX Dropsonde ModuleNOAA G-IV
Partial rainband circumnavigation
100 km
Fig. 3.7 RAINEX dropsonde track for NOAA G-IV aircraft circumnavigating a portion of major rainband.
Fig. 3.8 illustrates the RAINEX flight track module for obtaining G-IV dropsondes to support the inner-core analysis. The G-IV will fly a racetrack pattern around the eyewall, and at the discretion of the G-IV flight crew may occasionally make transects across the eye.
27

8/8/2005 3:21:46 PM Last saved by Sara Metz
RAINEX Dropsonde ModuleNOAA G-IV
Eyewall circumnavigation & possible transect of eye
100 km
Fig. 3.8 RAINEX dropsonde track for NOAA G-IV aircraft circumnavigating the eyewall. Dashed track indicates an optional transect of the eye.
4. RAINEX OPERATIONS CENTER 4.1 Functions of the RAINEX Operations Center The success of RAINEX depends on the coordination of the NRL P-3 flights with NOAA aircraft missions (as described in the NOAA 2005 Hurricane Field Program Plan). The RAINEX flights involving the NRL P-3 require special operations on the ground because the NRL P-3 will fly in RAINEX only if NOAA P-3 lower-fuselage (LF) radar data are passed to the NRL P-3 for navigation through the hurricane environment and to line up for the Outer PRB Module tracks (Fig. 3.1). The LF radar data will be transmitted from the NOAA P-3 to the RAINEX Operations Center (ROC), where it will be processed and transmitted to the NRL P-3. NSF also expects that during the field phase of RAINEX, scientists will assemble a set of detailed near real time Science Summaries of each mission. During the field phase, the RAINEX scientists are also expected to archive preliminary data and products via the UCAR JOSS Data Catalog (http://www.joss.ucar.edu/Rainex/catalog ). In order for RAINEX scientists to assemble the Storm Science Summaries preliminary in-field analysis and accomplish the data archiving requirements, radar data sets from all three P-3 aircraft will be transmitted from Tampa AOC, the staging point of the aircraft, to the ROC. The Storm Science Summaries will include model products. Preliminary intercomparison between observed eyewall/rainband evolution and model storm development will be made after flights have been conducted. To support this activity, the UM MM5 and/or WRF will be run in near real time for the storms investigated by aircraft. The model runs will be done as soon as the NCEP 3-5 day
28

8/8/2005 3:21:46 PM Last saved by Sara Metz
forecast is available to supply boundary conditions to the MM5. The preparation of the Science Summaries, including the comparison of the aircraft data to near real-time model runs, will be used to guide the next RAINEX mission. A further essential function of the ROC is that it will be the center of daily planning activities for RAINEX (see Sec. 5 below). These planning activities will provide structure and management for the coordination of the NRL P-3 operations with the NOAA flight operations, HRD and other groups. 4.2 Location and layout of ROC The RAINEX Operations Center (ROC) will be located at the U. of Miami (RSMAS) campus on Virginia Key. The ROC is located on the third floor of the Marine Science Center (MSC-309) and will house critical functions and supporting computer infrastructure needed to plan and direct field operations and to permit in-field analysis of RAINEX data. See Fig. 4.1 for campus layout including the location of the ROC, the parking area for those participating in RAINEX and the NOAA Hurricane Research Division (HRD).
ROC
HRD
Project Parking
Fig. 4.1 Aerial view of ROC location.
The layout of the ROC is shown in Fig. 4.2. Workstations will be located in the operations center to support the following key functions:
1. In-field analysis Support (UW) 2. A/C Coordination, operations summary, etc. (JOSS) 3. Coordination/Mission Summaries (UW) 4. Zebra (UW) 5. Models (RSMAS)
29

8/8/2005 3:21:46 PM Last saved by Sara Metz
6. Field catalog (JOSS) 7. Dual Doppler quality control processing (EOL)
There will likely be some additional workstations brought by project participants. Space is limited in the ROC (room dimensions are 19 X 16 feet) so there may have to be some restriction on the total number of people in the room at any one time.
Fig. 4.2 Layout of RAINEX Operations Center (ROC).
ccess to the ROC may be necessary 24 hours a day, seven days a week. Project
.3 Real-time products at the ROC
4.3.1 Zebra and real-time aircraft updating The unctions of the ROC, described above,
s.
s.
uring aircraft flights, lower fuselage data from one or both of the NOAA P-3 aircraft will
A/C Coord Coord/MissionSummaries Zebra
Models
Supp
ort
JOSSField Catalog
Dual Doppler processing
RAINEX OPERATIONS
CENTER (ROC) at RSMAS
Laptops
A/C Coord Coord/MissionSummaries Zebra
Models
Supp
ort
JOSSField Catalog
Dual Doppler processing
RAINEX OPERATIONS
CENTER (ROC) at RSMAS
Laptops
Aparticipants requiring access at other than regular business hours will be required to obtain temporary U. of Miami campus badges and keys to the building. 4
successful performance of all three major fdepends on NCAR/EOL’s Zebra software. Zebra is a time-based, data integration, analysis, and display system, which has been used in many previous field campaignIt provides the ability to overlay many different types of data and view user-defined cross-sections. A special RAINEX Zebra configuration will run in the ROC at all time Dbe transmitted to the ROC in real-time and ingested into Zebra. Additionally, ground tracks from both NOAA and NRL P-3’s will be transmitted to the ROC in real-time andingested into Zebra. Every 15 minutes, at a minimum, gif images of the track data
30

8/8/2005 3:21:46 PM Last saved by Sara Metz
overlaid on the lower fuselage radar data will be automatically generated and transmitted to the NRL P-3. If lower fuselage data are not available at any time, GOES satellite data will be used in its place in the uplinked images.
4.3.2 Aircraft radar, track and in-situ data and products The NOAA P-3 aircraft data consists of lower fuselage and tail radar data and in-situ data. Part of this dataset will be available in real-time (lower fuselage radar and some in-situ), and the remainder after the aircraft land. During missions, all radar and in-situ data will be stored on onboard computers provided by NESDIS. After each mission, once the radars are turned off, the data from each computers will be dumped onto a portable, external, USB hard drive. Once the aircraft land, the data will be immediately transmitted from AOC to the ROC via high-speed data line. The volume of radar data from each aircraft from each mission is estimated at 2GB. At the tested rate of 0.5GB per hour, the radar data transfer from each aircraft should take approximately two hours. The electronic transfer time of the in-situ data should be trivial. The NRL P-3 aircraft data consists of the ELDORA radar data and the in-situ data. Some of the in-situ dataset will be available in real-time, and the remainder after the aircraft lands. During missions, all data will be stored on tape. Immediately after each mission, the mission scientist will be responsible for completing the QC process on the ELDORA data. The estimated size of the ELDORA dataset from each flight is <10 GB. Owing to its large size, the method of transmitting the radar data from AOC to the ROC is likely to be via courier (e.g. FedEx) and should take less than 24 hours. The in-situ and dropsonde data will be transmitted from AOC to EOL in Boulder for QC and forwarded to the ROC via high-speed data line. Once the aircraft data arrive at the ROC, they will be converted to sweep file format (radar data) or NetCDF file format (in-situ data) and ingested into Zebra for use in post-mission analysis and mission summary completion.
4.3.3 Satellite data products GOES satellite products from the UCAR (Boulder) ground station will be sent to the ROC in near-real-time. Infrared, visible, and water vapor products will all be provided in NetCDF format and ingested directly into Zebra. TRMM TMI and PR images will be obtained during the aircraft missions from one of several websites including but not limited to these: http://www.nrlmry.navy.mil/tc_pages/tc_home.html http://trmm.gsfc.nasa.gov As soon as possible post-mission, TRMM PR HDF data products 2A23 and 2A25 will be obtained for all overpasses of the region of interest. They will be viewable either via the TSDIS Orbit Viewer on in Zebra (after an interpolation step).
31

8/8/2005 3:21:46 PM Last saved by Sara Metz
4.3.4 RSMAS model products
The UM MM5 and/or WRF will be run in near real time for the storms investigated by the aircraft. Products will be converted into NetCDF files (using UM software) and ingested into Zebra for use in post-mission analysis and mission summary completion.
4.3.5 Project Chat capabilities NCAR/EOL will implement chat capabilities for communications during aircraft operations between the ROC and the three P-3s. Xchat is an IRC (Internet Relay Chat) program that runs on Windows, Linux, and Mac operating systems. The server, password, and channels are TBD. See instructions for setup at Appendix X. Daniels and/or Bradford. There will be a dedicated person at each location to monitor Xchat during each flight. Since the NRL P-3 relies on the NOAA P-3 lower fuselage data for navigational purposes, this is a critical communications link.
4.3.6 Access to HRD/NHC special products We will be receiving HRD Surface Wind Analysis System (HWIND) data at regular intervals in NetCDF format via their anonymous ftp server. HWIND data is a synthesis of surface winds data from multiple sources. We will receive the following data from the NHC: 1. LDM messages (These messages will be collected by JOSS and made available
as they are received via the field catalog) a. Dropsonde – from drops every 400nm to and from storm, in eyewall, and
in eye b. Vortex – summarizes hurricane data, to include location of eye, minimum
central pressure, maximum winds on way into eye, temperature inside and outside eye, etc
c. Supplementary Vortex – profiles flight level data during one pass through the eye; data provided at 15nm spacing from 105nm out, into the center, and out to 105nm
d. RECCO – contains time, lat/lon, pressure altitude, flight level wind direction/wind speed/temperature/dew point, etc; typically messages only provided at turn points and can be 15 – 60 minutes apart
2. Automatic Tropical Cyclone Forecast (ATCF) – includes model runs, forecast tracks, and wind radii
3. Air Force Reconn HDOBs – flight level data from Air Force
4.3.7 JOSS Field Catalog The description of the catalog is provided in Section 8.2. Products and reports will be made available as they are received via the catalog web interface. Anyone with Internet access can view the catalog and all contents.
32

8/8/2005 3:21:46 PM Last saved by Sara Metz
4.4 Alternative operations center support The ROC is located in the Level 1 evacuation zone in the Miami-Dade region (see Section 9.1). If an evacuation is imminent, it will be possible for essential RAINEX personnel to move to NHC, with proper HRD escorts, to conduct critical project support functions. Access to hardware and software to continue various tasks may be possible but depends on the specific situation. If the ROC becomes inoperative for any reason, every effort will be made to reroute the NOAA P-3 LF data and all P-3 flight track data to the alternate Operations Center location. 4.5 Mission Science Summaries Scientists at the ROC will assemble Science Summaries for each mission and will archive project data via the UCAR JOSS Data Catalog System. In order for RAINEX scientists to assemble the Science Summaries and accomplish the data archiving requirements, radar data sets from all three P-3 aircraft will be transmitted from Tampa AOC, the staging point of the aircraft, to the ROC (see Sec. 4.4). The Science Summaries for each mission created at the ROC will also incorporate model output. The Science Summaries constructed by comparing the aircraft data to near real-time model runs will be used to guide the next RAINEX mission, and they will lay the groundwork for the post-field model simulations and analysis, which will be greatly enhanced by extensive dropsonde data and by in depth comparison with the extensive airborne dual-Doppler radar data that will be available in more complete and quality-controlled form after the project. 5. SCIENCE MISSION PLANNING PROCESS 5.1 Advance notifications for agencies and facilities regarding formation, location and movement of hurricanes Both NHC and HRD will be continuously monitoring weather conditions and reporting on the development, movement and evolution of tropical disturbances in the region. RAINEX will take advantage of these reports, issued several times a day to prepare for potential flight operations. Sections 5.2-5.4 describes the typical operations planning process. Table 5.1 shows a typical 3-4 day cycle of meetings and decisions, leading up to a mission as well as important following flight operations. The details of the operational support preparation and timing is further described in Sec. 6. RAINEX scientists will routinely assess weather products and satellite imagery to provide advance alert information to all personnel. This information can be found on the RAINEX In-field data catalog and will be updated at least once per day by 1830 UTC in the RAINEX Operations Summary http://www.joss.ucar.edu/rainex/catalog
33

8/8/2005 3:21:46 PM Last saved by Sara Metz
Table 5.1 RAINEX Operations 3 Day Timetable for Flights Staged out of Tampa. T/O refers to first aircraft's take off time.
Day Time (UTC)
Time (local) Event
1500 1100 RAINEX briefing with AOC/NRL 1630 1230 NHC alert for possible tasking, HRD daily briefing (Mon-Fri) or
receive info from HRD on-duty staff (Sat-Sun). 1800 1400 HRD email discussion to all participants
2 Days Before Mission
1830 1430 RAINEX daily operations summary issued 1500 1100 RAINEX brief with AOC/NRL 1630 1230 NRL briefing in Tampa 1630-1730
1230-1330 NHC Operational Tasking Request, HRD daily briefing (Mon-Fri) or receive info from HRD on-duty staff (Sat-Sun); HRD research request to AOC (including RAINEX) and AOC approval
1730 1330 CARCAH Plan of the Day (POD) issued; ROC informs NRL of T/O time for tomorrow.
1800 1400 HRD email discussion to all participants 1830 1430 RAINEX daily operations summary issued
1 Day Before Mission
2000-0000
1600-2000 RAINEX/HRD scientists commute to Tampa (assuming mission next day)
T/O-4 hours
T/O-4 hours
HRD/RAINEX Scientists conference call
T/O-3 hours
T/O-3 hours
Scientists, AOC flight crew, NRL flight crew pre-flight brief
T/O-45 min
T/O-45 min Science crew at aircraft
T/O nominal 1200, but can be variable
Nominal 0800
A/C operations for RAINEX will involve at least one AOC P-3 to lead and accompany NRL P-3
1500 1100 RAINEX briefing with AOC/NRL regarding next-day follow-on mission 1630 1230 NHC alert for possible tasking for follow-on mission, HRD daily
briefing (Mon-Fri) or receive info from HRD on-duty staff (Sat-Sun). 1800 1400 HRD email discussion to all participants 1830 1430 RAINEX daily operations summary issued 2200 1800 End aircraft operations for the day (9-10 hours duration) Landing +30 min
Landing +30 min
Post flight debriefing (by phone or on-site)
2330 1930 Transfer of AOC tail radar, flight level and dropsondes to ROC via internet
Mission Days
0000 2000 ELDORA data processing in Tampa Day After Mission
1200-1600
0800-1200 RAINEX scientists return to Miami if no mission planned
34

8/8/2005 3:21:46 PM Last saved by Sara Metz
Table 5.1 (continued) Before
1600 Before 1200
ELDORA data shipped to ROC
1500 1100 RAINEX briefing with AOC/NRL 1630 1230 NHC alert for possible tasking, HRD daily briefing (Mon-Fri) or
receive info from HRD on-duty staff (Sat-Sun). 1800 1400 HRD email discussion to all participants 1830 1430 RAINEX daily operations summary issued 5.2 Mission selection and coordination with facilities The RAINEX scientists have proposed several flight modules depending on the storm situation and availability of aircraft. These are all presented in the text and figures of Sec. 3. The highest priority scientific missions will be those utilizing all three aircraft in a coordinated mission (Fig. 3.2 and 3.3 in Sec. 3.) This deployment provides the best opportunity to document the interactions of the principal rainband and the eyewall. As discussed in Sec. 3, all of these modules are designed to be simple and adaptable to real storm conditions. As shown in Table 5.1 the RAINEX scientists will establish their priorities at or immediately following the RAINEX Daily Briefing at 1500 UTC. Following this meeting, mission priorities will be discussed and finalized. Immediately following the 1630 UTC HRD briefing, RAINEX and HRD scientists will meet to decide on a final plan for research flight operations. These plans will be modified or cancelled if there is higher priority operational tasking from NHC or EMC. 5.3 Aircraft scientist staffing RAINEX project support flight crew positions are listed in Table 5.2. These people will be available for all or a portion of the 6 weeks field deployment. Some individuals are excluded from flights aboard the NRL P-3 aircraft if they have not taken and passed obligatory NP4 training.
Table 5.2 RAINEX Aircraft Flight Crews
Institution Personnel Aircraft Eligibility
Position
Shuyi Chen All PI/Lead RAINEX Airborne Mission Scientist
Wei Zhao Melicie Desflots
NRL P-3 General flight scientist
University of Miami
Dave Nolan NOAA P-3 Co-PI/RAINEX Airborne Mission Scientist
University of Washington
Jasmine Cetrone Deanne Hence
NRL P-3 Airborne Communications Aide
35
8/8/2005 3:21:46 PM Last saved by Sara Metz
Table 5.2 (continued) Brad Smull All Co-PI/Lead RAINEX Mission
Scientist Rob Rogers NOAA P-3 and
G-IV only Co-PI /Lead RAINEX Airborne Mission Scientist
John Gamache Peter Dodge Mike Black
NOAA P-3 and G-IV only
Lead RAINEX Airborne Mission Scientist
AOML/HRD
Jason Dunion NOAA G-IV only Dropsonde scientist Wen-Chau Lee Tammy Weckwerth
NRL P-3 Co-PI /Lead RAINEX Airborne Mission Scientist
Michael Bell Huaquin Cai
NRL P-3 ELDORA Scientist
Hung Ta Bill Irwin John Cowan Greg Bruning Larry Murphy
NRL P-3 RAF Technicians for data system and sensors (2 in the field at any time)
Mike Strong Kyle Holden Jonathan Emmett
NRL P-3 RTF ELDORA Technician (2 in the field at any time)
Tim Lim Errol Korn
NRL P-3 RTF Dropsonde Technician (1 in the field at any time)
Eric Loew Gordon Farquharson Tom Brimeyer Charlie Martin
NRL P-3 RTF ELDORA Engineer
EOL
Kurt Zrubek NRL P-3 RAF Engineer NSSL Dave Jorgensen NOAA P-3 Lead RAINEX Airborne
Mission Scientist 5.4 Mature Storms Experiment Flight Planning Considerations There are certain storm situations that require special attention to assure that science objectives are met by all the collaborating groups participating in RAINEX and Intensity Forecasting Experiment (IFEX). During phase II of the 2005 Hurricane Field Program, from 15 August until 30 September, the primary objective will be to meet IFEX goals 1 through 3, which involve collecting airborne Doppler radar and flight-level data over a period of several days in storms of varying intensity and structural type, but with emphasis during this period on intensity changes throughout the tropical-cyclone lifecycle. A subset of these goals will be accomplished in the context of the Mature Storms Experiment, with flight patterns that involve one or both NOAA P-3s in the frequent monitoring modules and with multiple aircraft including the NRL P-3 flying with the NOAA P-3s in joint NOAA and NSF-sponsored RAINEX missions.
36
8/8/2005 3:21:46 PM Last saved by Sara Metz
Conducting three-P-3 (2 NOAA P-3s and the NRL P-3) dedicated RAINEX missions in mature storms is a top priority. The presence of the NRL P-3 in the 2005 Hurricane Field Program is a unique opportunity to obtain this type of dataset. Attaining RAINEX missions will be subject to constraints on available opportunities, flight-hours, and operational constraints. Two-P-3 RAINEX missions (1 NOAA P-3 and the NRL P-3) may be flown when both NOAA P-3s are not available, either as dedicated missions, as part of other research missions, or as part of operationally-tasked missions. In addition to the RAINEX flights, HRD will conduct a set of frequent monitoring missions over several days encompassing as much of a particular storm’s life cycle as possible. This would entail using the NOAA P-3s on back-to-back flights on a 12-hour schedule when the system is at tropical depression or tropical storm strength, followed by single NOAA P-3 sorties every 24 hours once the tropical cyclone (TC) is nearing hurricane status (55-60 knot max winds). The aircraft flying the 24 hour cycle could multi-task with a RAINEX mission involving the 2nd NOAA P-3 and/or the NRL P-3, provided there is not any additional operational tasking. At times, one set of flights may take precedence over others depending on factors such as storm strength and location, operational tasking, and aircraft availability. Two general scenarios could likely occur that illustrate how the mission planning is determined: 1) An incipient TC, at depression or weak tropical storm stage is within range of an operational base and is expected to develop and remain within range of operational bases for a period of several days. Here, the highest HRD priority would be to start the set of frequent-monitoring flights, first at 12-hour intervals with single NOAA P-3 missions while the TC is below hurricane strength, followed by single or dual NOAA P-3 missions at 24-hour intervals until the system is out of range or makes landfall. During the 24-h-interval portion of this scenario, the flight plan for the "inner P-3" would be designed to get wavenumber 0 and 1 coverage of the hurricane out to the largest radius possible, rather than the highest time resolution of the eyewall winds. The 2nd NOAA P-3 and the NRL P-3 could fly in the RAINEX mode, with the 2nd NOAA P-3 flying along the inner side of the principal rainband and the NRL P-3 flying along the outer side of the principal rainband (see Sec. 3, Fig 3.4) 2) A TC, not previously flown by NOAA, is at or near hurricane strength and is within range of an operational base. In this case, the highest HRD research priority would be the three Doppler aircraft RAINEX missions (see Sec. 3, Fig. 3.2). This mission could be flown on one or more days depending on aircraft range limitations and any operational constraints. For these missions, the inner P-3 will emphasize achieving high time resolution of the eyewall winds. 5.5 Mission plan approval The RAINEX and HRD scientists will receive mission approval from AOC sometime around 1730 UTC on the day before flight operations are planned (see Table 5.1). Any
37

8/8/2005 3:21:46 PM Last saved by Sara Metz
adjustments to mission objectives, dropsonde launch points and take-off times will be made at that time. Details of these decisions and plans will be included in the RAINEX Daily Operations Plan found on the RAINEX On-line Field Catalog (www.joss.ucar.edu/rainex/catalog). 5.6 Pre-flight briefing There will be two pre-flight briefings prior to RAINEX missions (see Table 5.1). The first will be four hours before nominal take-off of the first aircraft participating in coordinated RAINEX flight operations. RAINEX and HRD scientists will discuss aircraft coordination details, finalize scientific crew complements for each aircraft and discuss flight pattern coordination. It is recognized that there are some restrictions in the vertical separation of multiple aircraft as well as limits on modifications to pre-set flight patterns (e.g., figure fours through the storm center and dropsonde launch points.) A second pre-flight briefing will be held with AOC/NRL flight crews (pilots, co-pilots and navigators) and the flight scientists three hours before nominal take-off time of the first aircraft participating in coordinated RAINEX flight operations. A weather update will be provided along with other information critical to flight operations. 5.7 Post-flight debriefing Once the last aircraft participating in RAINEX coordinated flight operations has landed, there will be a post flight debriefing of scientific crews on-site at AOC in Tampa and linked by phone to the ROC (refer to timeline table). A quick update on facility status will be provided as well as a summary of scientific highlights from the flight scientists and observers. The availability of aircraft for the next day’s operations will be confirmed. Flight scientists will then be asked to submit a mission summary within a reasonable time to ROC personnel to accurately document the flight. Transmission of and/or the preparation of radar, flight level and dropsonde data for shipment to the ROC will begin as soon as possible following the end of the flight (see Table 5.1). 5.8 Crew duty day requirements RAINEX will observe basic aircraft operating rules that have been used in hurricane field experiments for many years, including:
• All flights must comply with the current ICAO regulations, including the pertinent deviations.
• Crew duty limits and rest periods will be fully observed. • Airport operating regulations pertain. • Certain flight tracks may be restricted by government or ATC regulations
necessitating revisions in the daily flight plans, sometimes even after filing if the information was not available for planning.
38

8/8/2005 3:21:46 PM Last saved by Sara Metz
• Flights planned to use the maximum aircraft endurance may be limited by diversion fuel requirements, necessitating revisions in the daily flight plans after filing. The aircraft facility operators have well-established procedures concerning operations of their facilities to insure safe operations. These constraints assume a single crew for the turboprop aircraft. RAINEX personnel in the operations of all three aircraft will observe the following operational constraints:
• A maximum crew duty day of 16 hours. A crew duty day is defined as when an aircrew member reports to their designated place to begin mission preflight and ends when he/she departs the work location after completion of the mission.
Nominally, the pre-flight period is ~3 hours, and the post flight period, following block-in, is ~1 hour. These constraints imply that the maximum possible delay in take-off for a maximum duration mission (~9 hours) would be 3 hours. Delays longer than 3 hours would shorten the mission.
• A minimum crew rest period of 12 hours from the time the last person leaves the airplane to the time the first person reports for next mission pre-flight.
A crew member cannot report for a subsequent preflight until the crew rest period is completed. This constraint implies a 16 hour period for consecutive flights between previous mission landing and next mission takeoff. After 3 consecutive flight days, the NRL crew requires a minimum rest period of 15 hours, thus a 19 hour period between the 3rd mission landing and the 4th mission takeoff.
• 1 mandatory down day following 6 consecutive standby (i.e., alerts) or flight days. • Takeoff times are set at least 12 hours in advance if the anticipated flight
operations (i.e., alerts) are consistently in the same diurnal cycle, i.e., daytime or nighttime flights. If the takeoff alert is being shifted from predominately daytime to nighttime cycle or visa versa, then at least 24 hours notice is required.
• Following 3 consecutive maximum endurance missions the NOAA AOC facility manager for the NOAA P-3 or the NRL Aircraft/Mission Commander for the NRL P-3 may authorize a 24-hour down period.
6. RAINEX OPERATIONS COORDINATION 6.1 Daily Planning Process Planning for RAINEX flight operations will require close coordination with several groups. Table 5.1 shows the typical timing and progression of forecast briefings, meetings and documents that are prepared before any missions as well as the steps taken during and immediately following a mission day. It is emphasized that this example can and likely will be modified based on the storm situation and if deployments occur from some place other than Tampa, Florida.
39

8/8/2005 3:21:46 PM Last saved by Sara Metz
6.2 Two or more Days Before Flight Day Early alerting for possible hurricane research and surveillance flights can occur several days before operations are planned. RAINEX will hold a daily briefing at 1500 UTC (1100 EDT) every day to discuss potential future activity. RAINEX personnel in both Miami and Tampa should participate. This briefing will be used to update the status of facilities, preview the weather scenario, discuss upcoming missions and flight strategies and provide preliminary operations alert notification. RAINEX Operations Center (ROC) staff participate in the daily weather briefing held at HRD at 1630 UTC (1230 EDT) Monday through Friday.This briefing will be accessible via conference call from Tampa. This will be immediately followed by direct communication among RAINEX scientists, aircraft facilities as well and NOAA NCEP and NESDIS to establish flight objectives and schedule modules that meet project objectives. Operational hurricane reconnaissance flights to meet NHC forecast and nowcast requirements have the highest priority. The HRD briefing is typically not held on weekends although a staff member prepares information as needed for planning future missions. In those situations the ROC staff will assist HRD in preparing requests and disseminating flight plans as described below. 6.3 The Day Before Flight Day On the day before a potential RAINEX flight the meeting schedule described above remains unchanged. See Table 5.1. [see correction to table] In the 1500 UTC RAINEX briefing, RAINEX scientists will discuss potential flight patterns and strategies (see Chapter 3) to be used the next day. At around 1630 UTC (1230 EDT) the NHC submits its operational support tasking of USAF and AOC aircraft for the following day. The HRD brief is held at 1630 UTC, and immediately following it, a call is made by HRD to relay HRD and RAINEX research flight requests to NOAA AOC. At ~1730 UTC, after AOC approval and discussion with Chief, Aircraft Reconnaissance Coordination, All Hurricanes (CARCAH), CARCAH issues a Plan of the Day (POD) [for the next day]. The POD will include operational support requirements and, as a courtesy, provide some general outline of planned research. At the same time that the POD is issued, ROC will alert NRL of the planned take-off times of each aircraft for the next day. At 1800 UTC, HRD will issue a general email describing plans for research the next day. At 1830, the information in the email will be combined along with other support and timing details into the RAINEX Daily Operations Plan Summary, issued by the ROC. The RAINEX Operations Summary will be available via the web on the RAINEX On-line Field Catalog site. http://www.joss.ucar.edu/rainex/catalog. Appropriate rest is required for all personnel who will be flying the next day. If there is a decision to conduct operations the next day, any RAINEX and HRD scientists who are located in Miami and are expected to fly the next day from Tampa will commute to Tampa in the late afternoon.
40
8/8/2005 3:21:46 PM Last saved by Sara Metz
6.4 Flight Day The first day of flight operations staged from Tampa will either be a flight into a named storm or will consist of ferrying the aircraft and personnel to an alternate base of operations (for further details of alternate-site operations, see below). On the day of flight operations the first contact will be a conference call with HRD, ROC and RAINEX scientists 4 hours before scheduled take-off of the first aircraft. This conference call will update the weather situation and clarify other flight details. This call may be taken at participants' hotel rooms, homes, HRD, or the ROC. All flight scientists, NRL and AOC flight crew personnel will meet approximately 3 hours before scheduled take-off for the air crew pre-flight briefing. This meeting will be held at the AOC Hangar 5 at McDill AFB in Tampa. All science and technical support crew must be on board all aircraft 45 minutes prior to scheduled take-off. The NRL P-3 will always fly with one or both NOAA P-3s. Both AOC aircraft will transfer LF data via satellite to the ROC. The airspace during hurricane missions is pre-assigned for the aircraft in most cases. Image update rate on NRL will be less than 15 minutes. A NOAA aircraft will lead the NRL aircraft to allow time for initial lower fuselage radar surveillance scans to be made and relayed to the ROC for interpretation and relay on to NRL. Flight durations for the turbo-prop aircraft are typically 8-10 hours. Flight strategies are further described in Section 3. Upon return to Tampa, the flight scientists on both AOC aircraft will leave the aircraft with a complete dataset including LF and tail Doppler radar and flight level data. These datasets will be sent electronically (e.g. ftp or scp) from the ground to the ROC as soon as reasonably possible to allow mission summaries to be prepared at the ROC. The flight scientists will leave the NRL P-3 with ELDORA radar and flight-level data. These data will require further processing that may commence soon after landing as is reasonable. NRL can participate in one flight in a 24 hour period. Maximum flight duration is typically about 10 hours. NRL will follow the NOAA crew duty day procedures in order to maximize the opportunity for coordinated missions with either or both P-3 aircraft. Crew duty day procedures are described in Section 4.8 of this Operations Plan. In Miami, the 1500 and 1630 meetings will be conducted as on previous day to determine whether a follow-on mission will be carried on the next day. The decision will be made no more than 24 hours in advance of the follow-on mission's take-off of first aircraft. The decision process will follow the procedures described above. HRD will issue email discussion at 1800 UTC. The RAINEX daily operations summary will be issued at 1830 UTC.
41

8/8/2005 3:21:46 PM Last saved by Sara Metz
6.5 The Next Days (Follow-on Mission) Under normal conditions it is possible to have three consecutive flight days for the NRL P-3. On each flight day, the flight operations and download and transfer of all aircraft datasets following the missions will follow the process described above, provided it does not interfere with the proper rest period in between missions. Otherwise data download and transfer will be done as soon as possible after the last of a set of flights into a named storm. Facility crew duty day procedures will be followed as outlined above. 6.6 The Next Day (No Follow on Mission) In the case of no follow-on mission the next day, it may be possible for the RAINEX scientists to return to the ROC. This decision will be made in the morning. The processing of ELDORA radar data should be completed during the morning and it should be shipped or carried by returning personnel to the ROC. In Miami, the 1500 and 1630 meetings will be conducted as on previous day to assess future mission possibilities. HRD will issue email discussion at 1800 UTC. The RAINEX daily operations summary will issued at 1830 UTC. 6.7 Alternate Bases of Operation For any storm, the first mission day may be devoted to ferrying aircraft and personnel to an alternate base of operations, as conditions warrant. NRL will accompany AOC to alternate sites. If the hurricane of interest is far to the east of Tampa, alternate bases of operations could include San Juan Puerto Rico, the US Virgin Islands or Barbados. Alternate operations site in the southeast US may be required if there is a danger of the hurricane getting close to Tampa. These sites could include but will not be limited to Jacksonville, FL and New Orleans, LA. All aircraft datasets should be transferred to the ROC in some reasonable time following return to Tampa. Participating RAINEX science crew should always carry proper identification (e.g. passport), and enough extra clothes and personal supplies in case a few days’ stay at an alternate site (potentially international) is required. 6.8 Daily Operations Plan A Daily Operations Plan will be prepared by the ROC each day at 1830 UTC and contain information regarding operations (aircraft flight times, major instrument systems sampling times, weather forecasts and synopses, etc.).These summaries will be entered into the on-line Field Catalog either electronically (via upload forms and/or e-mail) or manually. It is important and desirable for the investigators to contribute graphical products (e.g., plots in gif, jpg, png, or PostScript format) and/or data for retention on the catalog whenever possible. Updates of the status of data collection and instrumentation (on a daily basis or as required) will be available.
42
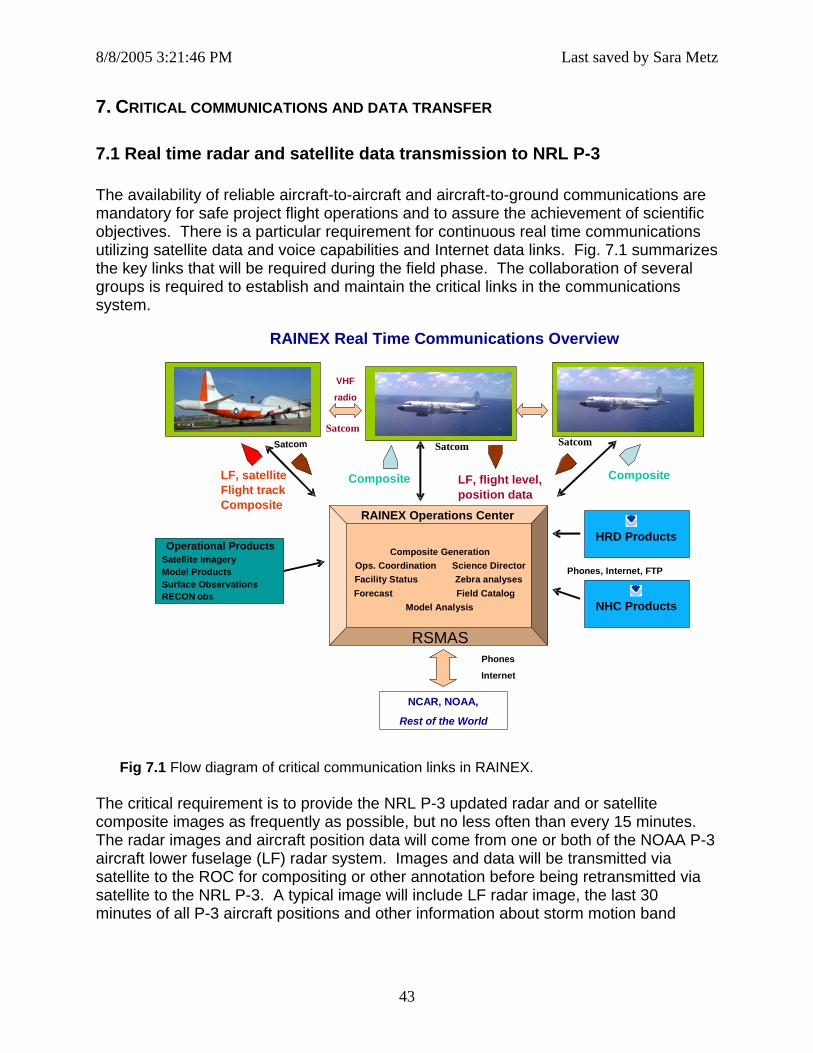
8/8/2005 3:21:46 PM Last saved by Sara Metz
7. CRITICAL COMMUNICATIONS AND DATA TRANSFER 7.1 Real time radar and satellite data transmission to NRL P-3 The availability of reliable aircraft-to-aircraft and aircraft-to-ground communications are mandatory for safe project flight operations and to assure the achievement of scientific objectives. There is a particular requirement for continuous real time communications utilizing satellite data and voice capabilities and Internet data links. Fig. 7.1 summarizes the key links that will be required during the field phase. The collaboration of several groups is required to establish and maintain the critical links in the communications system.
RAINEX Real Time Communications Overview
NCAR, NOAA,
Rest of the World
Operational ProductsSatellite ImageryModel ProductsSurface Observations RECON obs
Phones
Internet
Satcom
VHF
radio
Phones, Internet, FTP
RAINEX Operations Center
Composite GenerationOps. Coordination Science DirectorFacility Status Zebra analyses Forecast Field Catalog
Model Analysis
RSMAS
NHC Products
HRD Products
Satcom
Satcom Satcom
LF, satelliteFlight trackComposite
Composite CompositeLF, flight level,position data
Fig 7.1 Flow diagram of critical communication links in RAINEX.
The critical requirement is to provide the NRL P-3 updated radar and or satellite composite images as frequently as possible, but no less often than every 15 minutes. The radar images and aircraft position data will come from one or both of the NOAA P-3 aircraft lower fuselage (LF) radar system. Images and data will be transmitted via satellite to the ROC for compositing or other annotation before being retransmitted via satellite to the NRL P-3. A typical image will include LF radar image, the last 30 minutes of all P-3 aircraft positions and other information about storm motion band
43
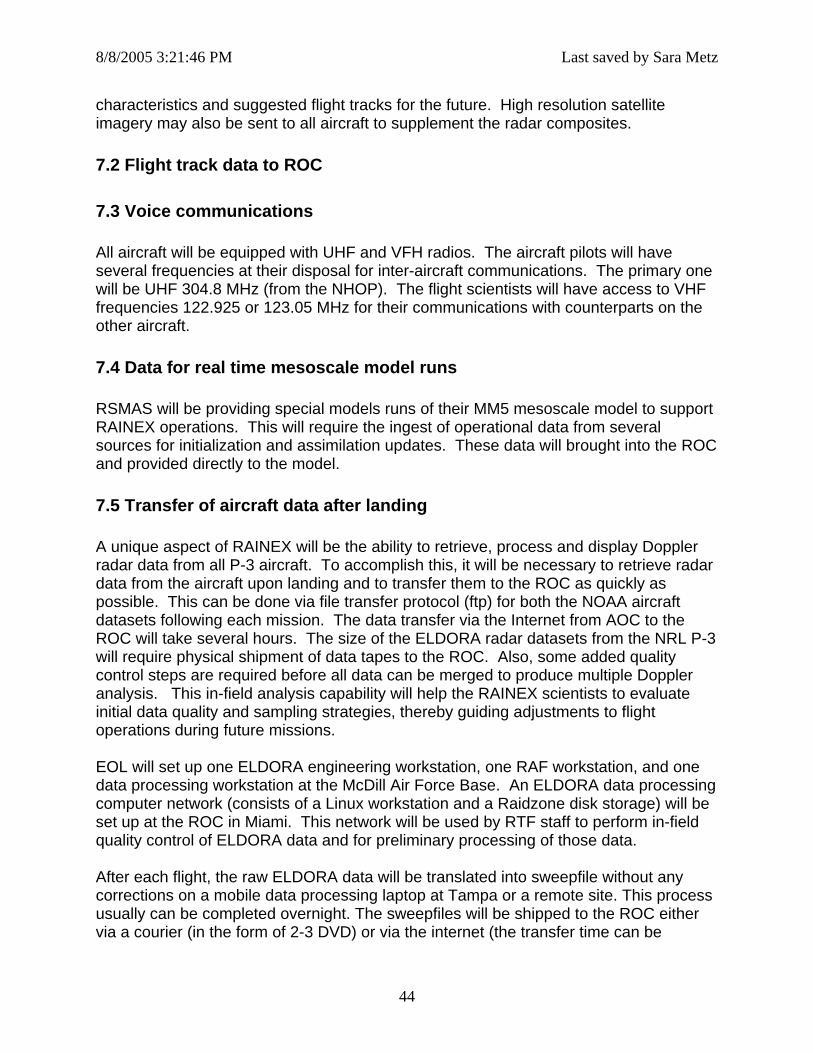
8/8/2005 3:21:46 PM Last saved by Sara Metz
characteristics and suggested flight tracks for the future. High resolution satellite imagery may also be sent to all aircraft to supplement the radar composites. 7.2 Flight track data to ROC 7.3 Voice communications All aircraft will be equipped with UHF and VFH radios. The aircraft pilots will have several frequencies at their disposal for inter-aircraft communications. The primary one will be UHF 304.8 MHz (from the NHOP). The flight scientists will have access to VHF frequencies 122.925 or 123.05 MHz for their communications with counterparts on the other aircraft. 7.4 Data for real time mesoscale model runs RSMAS will be providing special models runs of their MM5 mesoscale model to support RAINEX operations. This will require the ingest of operational data from several sources for initialization and assimilation updates. These data will brought into the ROC and provided directly to the model. 7.5 Transfer of aircraft data after landing A unique aspect of RAINEX will be the ability to retrieve, process and display Doppler radar data from all P-3 aircraft. To accomplish this, it will be necessary to retrieve radar data from the aircraft upon landing and to transfer them to the ROC as quickly as possible. This can be done via file transfer protocol (ftp) for both the NOAA aircraft datasets following each mission. The data transfer via the Internet from AOC to the ROC will take several hours. The size of the ELDORA radar datasets from the NRL P-3 will require physical shipment of data tapes to the ROC. Also, some added quality control steps are required before all data can be merged to produce multiple Doppler analysis. This in-field analysis capability will help the RAINEX scientists to evaluate initial data quality and sampling strategies, thereby guiding adjustments to flight operations during future missions. EOL will set up one ELDORA engineering workstation, one RAF workstation, and one data processing workstation at the McDill Air Force Base. An ELDORA data processing computer network (consists of a Linux workstation and a Raidzone disk storage) will be set up at the ROC in Miami. This network will be used by RTF staff to perform in-field quality control of ELDORA data and for preliminary processing of those data. After each flight, the raw ELDORA data will be translated into sweepfile without any corrections on a mobile data processing laptop at Tampa or a remote site. This process usually can be completed overnight. The sweepfiles will be shipped to the ROC either via a courier (in the form of 2-3 DVD) or via the internet (the transfer time can be
44

8/8/2005 3:21:46 PM Last saved by Sara Metz
between 5-20 hours depending on the network capacity). If the NRL P-3 is deployed outside the US, no attempt will be made to ship data back to Miami until the NRL P-3 returns to Tampa. If the NRL P-3 is deployed within the US, attempts will be made to Fed Ex data on DVDs to Miami. These activities will be performed on a non-interference basis with the crew duty days of ELDORA crew so the next mission will not be affected. RAF data will be QC-ed by staff at Jeffco the day after each mission. The QC-ed data will be available for download via internet. Once in Miami the ELDORA sweepfiles will be first loaded onto the Raidzone data storage. The non-QCed data will be available to the PIs at the ROC via Web access for preliminary analysis and/or project review purposes. Once the ELDORA data is secured and properly duplicated on site, the ELDORA data manager will then carry out normal ELDORA data QC procedures to the dataset and compute the navigation corrections when time is available. The data will be processed sequentially in time unless a special request is made by the PIs to the ELDORA data manager. The in-field QC procedures for a flight of data can take up to 3-4 days to complete. Dropsonde data collected on AOC and HRL aircraft will be stored on-board at the highest resolution. High resolution datafiles will be transmitted to the ROC following each mission via the Internet. Preliminary data and plots will be available via the RAINEX Field Catalog. 8. IN-FIELD DATA MANAGEMENT 8.1 Real time data collection All standard GTS data feeds will be monitored and archived. Several quick-look products will be produced for the RAINEX field catalog, amongst these are ASOS surface reports (Fig. 1), all regional radiosonde releases (Fig. 2), base reflectivities from regional radars (Fig. 3), buoys and other marine reports (Fig. 4) within the RAINEX domain of interest. 8.2 RAINEX Field Catalog UCAR/JOSS will implement and maintain an online RAINEX Field Catalog that will be operational during the field phase to support the operational planning, product display, and documentation (e.g., facility status, daily operations summary, and mission reports). The catalog is accessible at http://www.joss.ucar.edu/rainex/catalog/ . Data collection information about both operational and research products (including documentation) will be entered into the system in near real time beginning 1 August 2005. The catalog provides authoring tools for report submission (data collection details,
45

8/8/2005 3:21:46 PM Last saved by Sara Metz
field summary notes, certain operational data etc.), and products browsing (loops, plots). 8.3 Special datasets for real-time modeling activities In order to run model ensemble products for the RAINEX Operations Center, JOSS will explore the possibility of providing RSMAS with binary (GRIB) initialization fields from NOGAPS, NCEP/GFS, Canadian Meteorological Centre and UK Met Office global models. 8.4 Special satellite and other products Satellite data collection for the RAINEX project will begin during the first week of August and will continue uninterrupted until 1 week after the project ends (30 Sept 2005). Data will be routinely collected from the GOES-East satellite during this period by JOSS. Other satellite imagery of interest, (as defined by the PIs), including wind-field products, will be collected and made available via the field catalog. Table 8.1 lists the satellite products that will be part of the JOSS Field Catalog for RAINEX.
Table 8.1 Satellite Browse Products provided in the JOSS Field Catalog (Near real-time)
Instrument Channel/ Product
Spatial Resolution
Temporal Resolution
File Format
GOES-12 1 1 km 15 min gif 3,4 4 km 15 min gif Ch2-Ch4 4 km 30 min gif MODIS 1,2 250 m As available gif Color
Composite 500 m As available gif
QuikSCAT Winds 25 km Daily png AVHRR-GOES SST Composite 6 km 3 hourly gif
GOES Cloud Drift Winds
Low-level Upper-level 6 hourly gif
SSM/I 85 GHz, 37 GHz 12.5, 25km As available jpg
TMI 85 GHz, 37 GHz ~ 5, 12km As available jpg
AMSR-E 85 GHz, 37 GHz 5, 12 km As available jpg
8.4.1 GOES Data Collection High temporal resolution satellite data for RAINEX is limited to the GOES-East satellite (Currently GOES-12). Depending upon storm location, routine imagery is available as often as every 15 minutes. Rapid Scan Operations (which are likely when a storm is
46
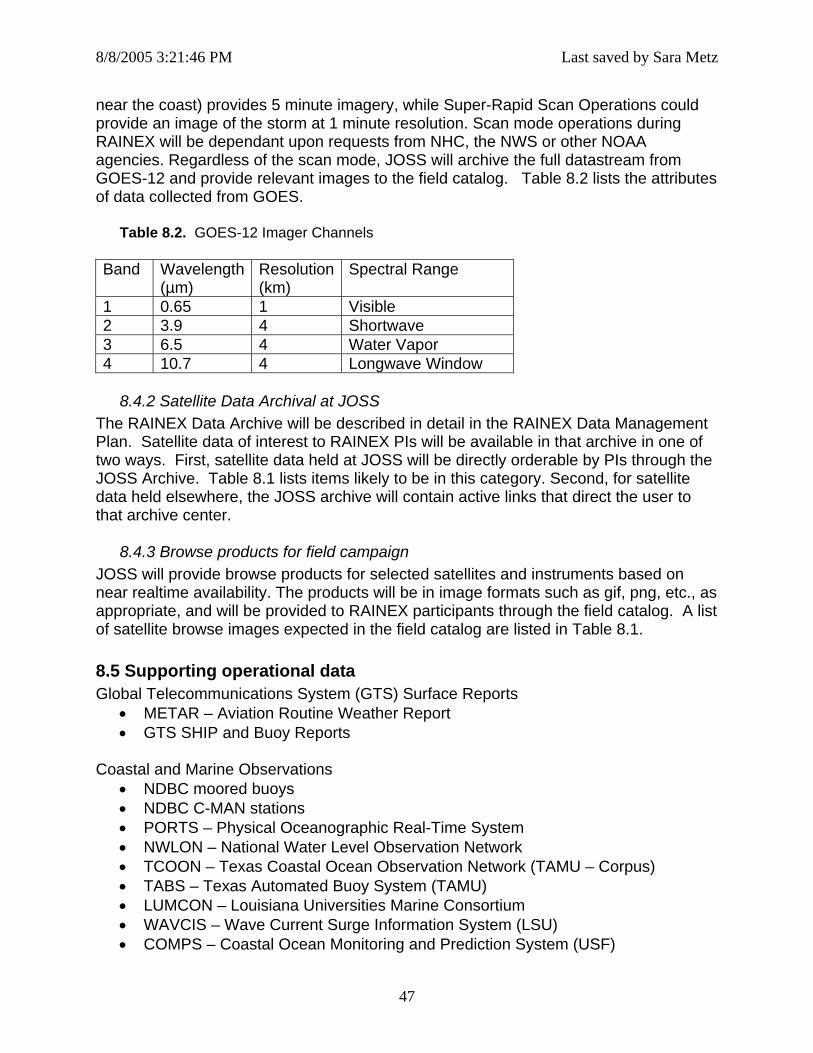
8/8/2005 3:21:46 PM Last saved by Sara Metz
near the coast) provides 5 minute imagery, while Super-Rapid Scan Operations could provide an image of the storm at 1 minute resolution. Scan mode operations during RAINEX will be dependant upon requests from NHC, the NWS or other NOAA agencies. Regardless of the scan mode, JOSS will archive the full datastream from GOES-12 and provide relevant images to the field catalog. Table 8.2 lists the attributes of data collected from GOES.
Table 8.2. GOES-12 Imager Channels Band Wavelength
(µm) Resolution (km)
Spectral Range
1 0.65 1 Visible 2 3.9 4 Shortwave 3 6.5 4 Water Vapor 4 10.7 4 Longwave Window
8.4.2 Satellite Data Archival at JOSS
The RAINEX Data Archive will be described in detail in the RAINEX Data Management Plan. Satellite data of interest to RAINEX PIs will be available in that archive in one of two ways. First, satellite data held at JOSS will be directly orderable by PIs through the JOSS Archive. Table 8.1 lists items likely to be in this category. Second, for satellite data held elsewhere, the JOSS archive will contain active links that direct the user to that archive center.
8.4.3 Browse products for field campaign JOSS will provide browse products for selected satellites and instruments based on near realtime availability. The products will be in image formats such as gif, png, etc., as appropriate, and will be provided to RAINEX participants through the field catalog. A list of satellite browse images expected in the field catalog are listed in Table 8.1. 8.5 Supporting operational data Global Telecommunications System (GTS) Surface Reports
• METAR – Aviation Routine Weather Report • GTS SHIP and Buoy Reports
Coastal and Marine Observations
• NDBC moored buoys • NDBC C-MAN stations • PORTS – Physical Oceanographic Real-Time System • NWLON – National Water Level Observation Network • TCOON – Texas Coastal Ocean Observation Network (TAMU – Corpus) • TABS – Texas Automated Buoy System (TAMU) • LUMCON – Louisiana Universities Marine Consortium • WAVCIS – Wave Current Surge Information System (LSU) • COMPS – Coastal Ocean Monitoring and Prediction System (USF)
47

8/8/2005 3:21:46 PM Last saved by Sara Metz
Land-based Observations
• ASOS – Automated Surface Observing System • AWOS –Automated Weather Observing System • GAEMN – Georgia Automated Environmental Monitoring Network (U of Georgia) • GFC – Georgia Forestry Commission • ALMESO – Alabama Mesonet (Auburn U) • LAIS – Louisiana Agriclimatic Information System (LSU) • TX ET – Texas Evapotranspiration Network (TAMU) • FAWN – Florida Automated Weather Network (U of Florida) • TNRCC – Texas Natural Resources Conservation Commission
8.6 Processing/distribution of research flight datasets
48

8/8/2005 3:21:46 PM Last saved by Sara Metz
9. PROJECT SAFETY 9.1 Miami
Fig 9.1 Hurricane storm surge evacuation zones for Miami-Dade County, Florida Both the ROC at RSMAS and HRD are located on Virginia Key just off shore of Miami. This area is in the first level evacuation zone if a hurricane approaches the region. Fig. 9.1 shows the storm surge evacuation zones for the Miami Dade region of south Florida.
49

8/8/2005 3:21:46 PM Last saved by Sara Metz
The University of Miami and RSMAS in particular have a Hurricane Plan that describes the decision process prior to evacuation, the preparations required if a hurricane approaches and procedures in the event of evacuation. This plan will be available to RAINEX staff upon arrival at the ROC. The RSMAS buildings are vulnerable to flooding from storm tides as the ground floor of the building housing the ROC is only 5.5.feet above Mean Sea Level. RSMAS has an alert ladder as follows: Hurricane Alert Phase 1: When a storm system of tropical storm strength or greater is either within a 1000-mile radius or within 72 hours from potential landfall near the South Florida area. No specific preparation required—pay attention to updated information. Phase Two: When a storm system of tropical storm strength or greater is either within a 600-mile radius or within 48 hours from potential landfall near the South Florida area. The radius or time values may change depending on the characteristics of a particular storm system. Hurricane watch First warning that a hurricane is a threat to a portion of the coast of Florida; normally given 36 hours before the storm is expected to hit the coast. Landfall is uncertain and broad geographic areas are alerted. This is the time to start securing areas that take more than 12 hours to prepare. RSMAS faculty and staff have certain responsibilities that may require disruption or cessation of ROC activities. We will make arrangement with RSAMS and HRD staff to move critical functions elsewhere as necessary. Hurricane warning This is normally issued 24 hours before the storm is expected to strike the coast. More accurate landfall is predicted, with narrower geographic boundaries. As warnings are updated, mandatory evacuation will apply to Virginia Key and the Port of Miami. At this time, start securing areas that take less than 12 hours to complete. This will require evacuation of the ROC. Figure 9.1 shows that this area is in the initial evacuation zone should such an order be given by local authorities. RSMAS faculty and staff will assist RAINEX participants with these arrangements and/or explain what steps are required.
50
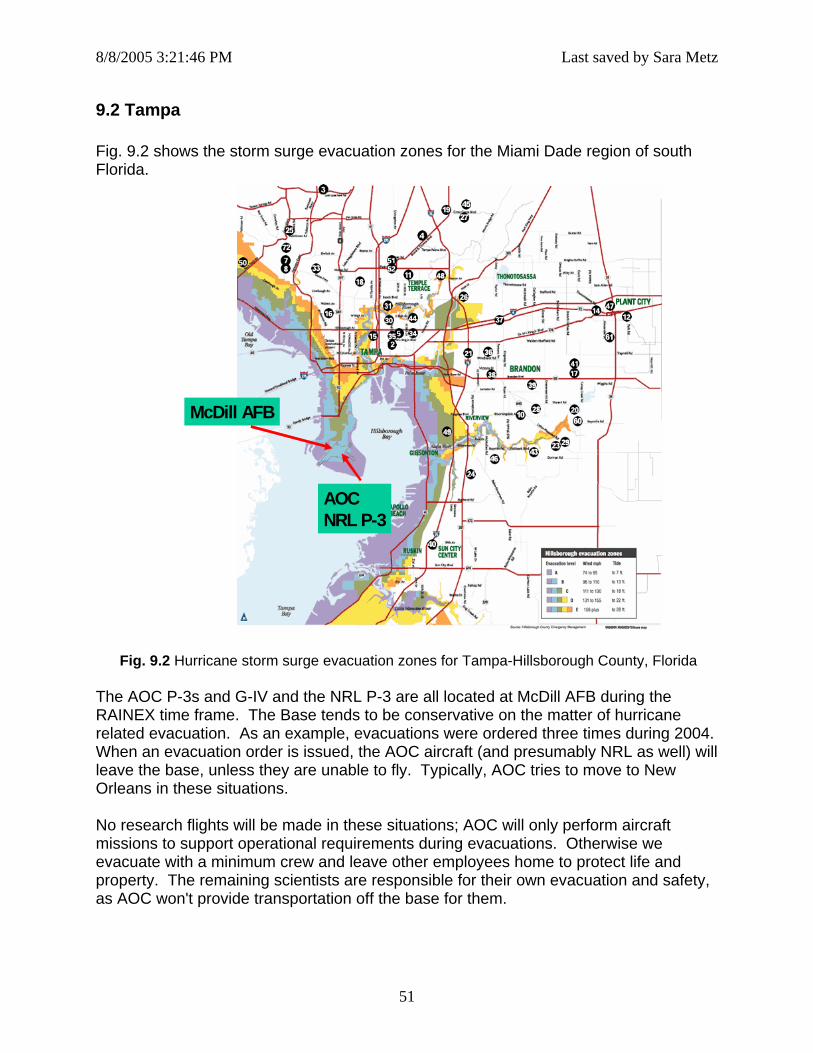
8/8/2005 3:21:46 PM Last saved by Sara Metz
9.2 Tampa Fig. 9.2 shows the storm surge evacuation zones for the Miami Dade region of south
Florida.
Fig. 9.2 Hurricane storm surge evacuation zones for Tampa-Hillsborough County, Florida
he AOC P-3s and G-IV and the NRL P-3 are all located at McDill AFB during the
04.
o research flights will be made in these situations; AOC will only perform aircraft
d ty,
McDill AFB
AOCNRL P-3
TRAINEX time frame. The Base tends to be conservative on the matter of hurricanerelated evacuation. As an example, evacuations were ordered three times during 20When an evacuation order is issued, the AOC aircraft (and presumably NRL as well) will leave the base, unless they are unable to fly. Typically, AOC tries to move to New Orleans in these situations. Nmissions to support operational requirements during evacuations. Otherwise we evacuate with a minimum crew and leave other employees home to protect life anproperty. The remaining scientists are responsible for their own evacuation and safeas AOC won't provide transportation off the base for them.
51

8/8/2005 3:21:46 PM Last saved by Sara Metz
10. REFERENCES
ster, 1986: The structure and decay of a rainband in Hurricane Irene
– 792.
c.
of
Jorg
Nol,
arnes, G. M., and G. J. StossmeiB
(1981). Mon. Wea. Rev. 114, 2590–2601. Barnes, G. M., E. J. Zipser, D. P. Jorgensen, and F. D. Marks, Jr., 1983: Mesoscale and convective
structure of a hurricane rainband. J. Atmos. Sci., 40, 2125-2137. Bister, M., and K. A. Emanuel, 1997: The genesis of Hurricane Guillermo: TEXMEX analysis and a
modeling study. Mon. Wea. Rev., 125, 2662-2682. Black, M. L., and H. E. Willoughby, 1992: The concentric eyewall cycle of Hurricane Gilbert. Mon. Wea.
Rev., 120, 947-957. Chen, S. S., and W. M. Frank, 1993: A numerical study of the genesis of extratropical convective
mesovortices. Part I: Evolution and Dynamics. J. Atmos. Sci., 50, 2401 - 2426. Chen, Y., and M. K. Yau, 2001: Spiral bands in a simulated hurricane. Part I: Vortex Rossby wave
verification. J. Atmos. Sci., 58, 2128-2145. Corbet, J., C. Mueller, C. Burghart, K. Gould, and G. Granger, 1994: Zeb: Software for integration,
display, and management of diverse environmental datasets. Bull. Amer. Meteor. Soc., 75, 783Gamache, J. F., R. A. Houze, Jr., and F. D. Marks, Jr., 1993: Dual-aircraft investigation of the inner core
of Hurricane Norbert. Part III: Water Budget. J. Atmos. Sci., 50, 3221-3243. Hack, J. J., and W. H. Schubert, 1986: Nonlinear response of atmospheric vortices to heating by
organized cumulus convection. J. Atmos. Sci., 43, 1559-1573. Houze, R. A. Jr., 1989: Observed structure of mesoscale convective systems and implications for
large-scale heating. Quart. J. Roy. Meteor. Soc, 115, 425-461. Houze, R. A., Jr., 1982: Cloud clusters and large-scale vertical motions in the tropics. J. Meteor. So
Japan, 60, 396-410. Houze, R. A., Jr., 1997: Stratiform precipitation in regions of convection: A meteorological paradox?
Bull. Amer. Meteor. Soc., 78, 2179-2196. Houze, R. A., Jr., F. D. Marks, Jr., and R. A. Black, 1992: Dual-aircraft investigation of the inner core
Hurricane Norbert. Part II: Mesoscale distribution of ice particles. J. Atmos. Sci., 49, 943-962. James, C. N., S. R. Brodzik, H. Edmon, R. A. Houze, Jr., and S. E. Yuter, 2000: Radar data processing
and visualization over complex terrain. Wea. Forecasting, 15, 327-338. Jorgensen, D. P., 1984a: Mesoscale and convective scale characteristics of mature hurricanes. Part I: Jorgensen, D. P., 1984a: Mesoscale and convective scale characteristics of mature hurricanes. Part I:
General observations by research aircraft. J. Atmos. Sci., 41, 1268-1285. Jorgensen, D. P., 1984b: Mesoscale and convective scale characteristics of mature hurricanes. Part II:
Inner core structure of Hurricane Allen (1980). J. Atmos. Sci., 41, 1287-1311. Jorgensen, D. P., T. R. Shepherd, and A. Goldstein, 2000: A multiple pulse repetition frequency scheme
for extending the unambiguous Doppler velocity of the NOAA P-3 airborne Doppler radar. J. Atmos. Ocean. Tech., 17, 585-594. ensen, D. P., E. J. Zipser, and M. A. LeMone, 1985: Vertical motions in intense hurricanes. J. Atmos.Sci., 42, 839-856.
Mapes, B. M., and R. A. Houze, Jr., 1995: Diabatic divergence profiles in Western Pacific mesoscale convective systems. J. Atmos. Sci., 52, 1807-1828.
Marks, F. D., Jr., and R. A. Houze, Jr., 1984: Airborne Doppler-radar observations in Hurricane Debby. Bull Amer. Meteor. Soc., 65, 569-582.
Montgomery, M. T., and R. J. Kallenbach, 1997: A theory for vortex Rossby-waves and its application to spiral bands and intensity changes in hurricanes. Quart. J. Roy. Meteor. Soc., 123, 435-465.
Nolan, D. S., and L. D. Grasso, 2003: Nonhydrostatic, three-dimensional perturbations to balanced, , hurricane-like vortices. Part II: Symmetric response and nonlinear simulations. J. Atmos. Sci., 60
2717-2745. an, D. S., and L. D. Grasso, 2003: Nonhydrostatic, three-dimensional perturbations to balanced, hurricane-like vortices. Part II: Symmetric response and nonlinear simulations. J. Atmos. Sci., 602717-2745.
52
8/8/2005 3:21:46 PM Last saved by Sara Metz
Powell, M. D., 1990a: Boundary layer structure and dynamics in outer hurricane rainbands. Part I: Mesoscale rainfall and kinematic structure. Mon. Wea. Rev., 118, 891-917.
Powell, M. D., 1990b: Boundary layer structure and dynamics in outer hurricane rainbands. Part II: Downdraft modification and mixed layer recovery. Mon. Wea. Rev., 118, 918-938.
Ritchie, E. A., J. Simpson, W. T. Liu, J. Halverson, C. Velden, K. F. Brueske, and H. Pierce (2003), Present day satellite technology for hurricane research: A closer look at formation and intensification, in Hurricane! Coping With Disaster, edited by R. Simpson, chap. 12, pp. 249–289, AGU, Washington, D. C.
Samsury, C. E., and E. J. Zipser, 1995: Secondary wind maxima in hurricanes: Airflow and relationship to rainbands. Mon. Wea. Rev., 123, 3502-3517.
Wang, Y., 2002: Vortex Rossby waves in a numerically simulated tropical cyclone. Part II: The role in tropical cyclone structure and intensity changes. J. Atmos. Sci., 59, 1239-1262.
Willoughby, H. E., 1990: Temporal changes of the primary circulation in tropical cyclones. J. Atmos. Sci., 47, 242-264.
Willoughby, H. E., F. D. Marks, and R. J. Feinberg, 1984: Stationary and moving convective bands in hurricanes. J. Atmos. Sci., 41, 3189-3211.
Willoughby, H. E., J. A. Clos, and M. G. Shoreibah, 1982: Concentric eyewalls, secondary wind maxima, and the evolution of the hurricane vortex. J. Atmos. Sci., 39, 395-411.
Zhang, D.-L., Y. Liu and M. K. Yau, 2001: A multiscale study of hurricane Andrew (1992). Part IV: Unbalanced flows. Mon. Wea. Rev., 129, 92-107.
53