the human eye as a camera - wearcam.org
TRANSCRIPT

The Human Eye as a CameraSteve Mann∗, Derek Lam∗, Kyle E. Mathewson∗ †, Jeremy Stairs∗, Cayden Pierce∗, Jesse Hernandez∗,
Georges Kanaan∗, Luke Piette∗, Humza Khokhar∗, and Christina Mann∗∗MannLab Canada, 330 Dundas Street West, Toronto, Ontario
†Department of Psychology, University of Alberta
Abstract—We propose the use of SSVEP (Steady State VisualEvoked Potentials) in such a way as to cause the eye itselfto function as a camera. By recording brainwaves in responseto flickering visual stimuli, we read the “mind’s eye” and areable to successfully reconstruct a visual image of subject matterthat a person is looking at. In addition to causing the eyeitself to function as a camera (see Fig 1), we also propose anew way to visualize and photograph human vision and humanperception, i.e. a new way to see and understand human vision.This new “meta-vision” (vision of vision) has many applicationsin healthcare, from testing human vision to furthering ourunderstanding of the brain.
I. INTRODUCTION
The field of wearable and mobile computing, as well asbody-sensor networks [1] and implants [2], [3] is increasinglybeing applied to healthcare [4] and prosthetics [5]. Smarttechnologies like smart homes [6] and smart cities [7] withdense wireless networks are evolving into a mesh of sensorsand communications networks that span entire cities, withcameras and microphones in every streetlight to monitor thehealth of the city, through wireless mesh routing [7]. At theindividual human scale, sensors are working their way into thefabric of everyday life, improving our health and well-beingthrough the Internet-of-Things [8]–[10], as well as throughsensing in almost all living things, not just humans [11]. Inthe future, nearly every light fixture will have a camera in it tosense occupancy and adapt its light output, and nearly everyperson will wear at least one camera. There will be challengesto overcome regarding privacy, security, and trust [12]–[14]. Inthe future there may be a camera in every room, not only forplaying games, but also to measure and sense our health [15].Thus, understanding vision (human vision as well as machinevision) is of vital importance to health, well-being, and themodern world in general.
A. Meta-sensing (the sensing of sensing)
In this paper, we wish to photograph, explore, and under-stand in new ways a human’s capacity to see. Let us begin byreviewing previous work on photographing and understandinga camera’s ability to “see” (sense). This sensing of sensors iscalled meta-sensing.
We have previously shown that it is possible to visualize thesensory capacity of sensors, such as video cameras, by way ofvideo feedback with a television display or even simply oneor more light bulbs or other sources of light [16], [17]. SeeFig 2.
Input viewed
by subject
Output from
EEG (brainwaves)
Fig. 1: Capturing and processing brainwaves causes the humaneye itself to function as a photographic camera.
We can photograph such a sensor’s ability to sense, usinga process we refer to as “metavision” or “metaveillance” (i.e.the sensing of sensors and the sensing of their capacity tosense) [17].
For example, we have constructed a number of roboticmechanisms, including swarms of drones [18], as well as deltaand cartesian 3D plotters that map out the capacity of sensorsto sense. See Fig 3 where we photograph a smart street light’scapacity to sense, by using a moving light source arrangedso that its light output increases in proportion to a camera’sability to sense it.
In a similar way, we can also photograph automobiles alongwith their capacity to sense. Such photographs (metaveillo-graphs) are useful because they provide us with insight regard-ing the sensory capacity of these devices, which is especiallyvaluable when lives are at stake (e.g. self-driving cars, andhaving photographic evidence to verify that the automotiveproduct was in good order when it left the assembly line)[19]. Judges and juries appreciate photographic evidence, andphotographic evidence like that of Fig. 3 can serve a usefulpurpose in verifying the integrity of vision systems.
2019 IEEE International Conference on E-health Networking, Application & Services (HealthCom)
978-1-7281-0402-7/19/$31.00 ©2019 IEEE

(a)
Surveillance camera
Transmitter
"Rabbit ears"receive antenna
Wearablecomputer andphenomena.-lock-inamplifier
Light bulbbrightens whenin the Sightfield
Light bulb
(b)
Fig. 2: (a) Metaveillography, where a long-exposure photo-graph is captured of a light bulb being waved back-and-forthin front of a surveillance camera. Picture c©1975 S. Mann. (b)The experimental setup. A television receiver is implementedin a wearable computer system with lock-in amplifier to pickup even extremely weak television signals, amplify them, andfeed them to a light bulb. The light bulb is set to always beat least slightly illuminated. When it comes into the field-of-view of the camera, it goes to full-on, due to video feedback.This allows us to see a camera’s capacity to see. This sensingof sensors, and sensing of their capacity to sense, is calledmetaveillance [17]. Note the delayed response between whenthe light bulb enters the camera’s field of view, and whenit reaches full output. There is also a delayed “desponse”between when the light bulb exits the camera’s field of viewand it desponds. This is the phenomena of hysteresis (delayedresponse and delayed desponse) that is captured as the lightsource moves alternately left and right.*Response time is the time delay on the rising edge of astimulus, whereas “desponse” time is the time delay on thefalling edge of a stimulus.
B. Meta-sensing of human vision
Mann et. al. [20] and Janzen et. al. [21] have previouslyphotographed human vision, e.g. using photography as amedium of display for data captured through an eye test. Thesubject was asked to report on what is seen while a visualstimulus was presented by the experimenter.
In a recent abstract (the ACM WearSys 2019 Keynote,[12]) we very briefly described how the human visual systemcould be investigated directly, from nature itself, i.e. withoutasking the subject any questions about what is visible. Theresulting “ayinographTM” can thus be regarded as evidencerather than testimony. Our method consists of monitoring thebrain’s response to a flickering visual stimulus, and plottingor photographing the magnitude of the response to the visualstimuli in different parts of the visual field using Steady StateVisual Evoked Potentials (SSVEPs). For example, a flickeringcomputer display was moved back and forth horizontally(or vertically, or both) across and beyond the visual fieldof view of a human observer, while EEG was monitoredusing a portable EEG headband called MuseTM(manufacturedby InteraxonTM). The magnitude of the brain’s response tothe flickering stimulus at the same frequency was used tochange the colour and luminance of an RGB LED light thatwas attached to the moving computer display. Long exposure
Fig. 3: Top: Long-exposure photograph of a sensor’s ability tosense. Here is a photograph of a smart city LED streetlight.Like many smart city streetlights, it has a camera in it.Beneath the streetlight, we have placed a robotic mechanismthat moves a light source in circular arcs. The light sourceis connected to an amplifier that receives input from thestreetlight’s vision (i.e. its capacity to sense), establishing afeedback loop as was done in Fig 2 [17]. The light source isan RGB LED with voltage to color converter, such that redis the background (bias) color (like the dull red glow of anincandescent light bulb of Fig 2 at very low voltage), green isfor medium veillance, and blue is for strong veillance. Bottom:closeup showing the first six sweeps. The first sweep is acounterclockwise sweep nearest the camera. The 6th sweep isa clockwise sweep. Note the slight hysteresis (as explained inFig 2).
2019 IEEE International Conference on E-health Networking, Application & Services (HealthCom)

Fig. 4: Top: Metaveillography of a subject captured withmechanical prototype. Here, stepper motors move a brain-modulated light source through space. The bright red colorof the RGB LED shows areas where the EEG picked upa strong SSVEP signal. The observer focuses on a singlepoint directly ahead, and lets the smartphone move in andout of their peripheral vision. The long-exposure photographshows only a narrow beam of sight approximately equal tothe height of the phone. Bottom: Another subject’s interpolatedmetaveillograph. Sparsely sampled SSVEP data is interpolatedto make the high-resolution image [12].
photography was used to integrate this image over time fordirect photography of the receptive field properties of thehuman visual system. In this paper we build upon this work.See for example Fig 4.
II. EYE IS A CAMERA
Previous work has been done to capture a person’s visionfrom the exact same perspective as the human eye itself. Thiswas done either from one eye, such as the wearer’s right eye(see Fig 5) or both eyes (in the case of a stereo vision system).
We begin with a series of studies in photographing ahuman’s capacity to see, i.e. meta-vision, which we believemay be useful for diagnosing and understanding vision, healthcare, eye testing, vision testing, and at the very least, a newform of visual art.
For this we created a 3D plotter which held a smartphone.The smartphone presents a set of four squares alternatingbetween light colours and black at a fixed frequency such as
Fig. 5: The EyeTap Principle uses a camera and 45-degreemirror or beamsplitter to capture exactly the same viewpointas the human eye. If we look into the eye of the wearer, itlooks as though the eye is made of glass (camera lens) becausewe’re seeing a reflection of the left-facing camera sitting onthe nose bridge. IEEE Spectrum, used with permission.
12 Hz. The observer’s head is fixed by a chin rest as wellas a headrest on a high chair back. The observer looks atthe smartphone’s display located initially 4cm from the eye.The display is then moved slowly vertically with the plotter,going up and down at 5mm/sec, and retreating further fromthe participant on each pass, at 1/10th that rate (0.5mm/sec),traveling a distance of up to 21cm. This has the effect ofrastering a slice of visual space in a vertical plane coming outfrom the face of the participant.
While this is occurring the observer is wearing a portable,wearable, EEG system (MuseTMby InteraxonTM), which is mod-ified with one or more additional EEG electrodes secured in a3D printed holder and attached to a flexible headband holdingit over the occipital lobe. Specifically the center electrode isplaced at location Oz (with others, optionally, at locations O1and O2). The SSVEP is collected by measuring the powerspectra of the resultant EEG signal over time. The powerspectra are computed with a windowed FFT (Fast Fouriertransform) with a window size of 10 seconds. The ratio of12 Hz power to power in the rest of the frequency bands isthen estimated, and used to modify the colour of the flickeringcheckerboard pattern, as well as an LED attached the plotteritself, facing orthogonal to the line of sight of the observer. TheLED faces directly toward a camera that takes a long-exposurephotograph of the person’s face (side-view), their right eye(though both eyes are sensed), and the moving light source.The LED colour is changed from blue to red in proportion to
2019 IEEE International Conference on E-health Networking, Application & Services (HealthCom)

NOFig. 6: The first sessions in which an image was reconstructedfrom recordings of brainwaves. The power of the flickeringfrequency in the EEG data at each point of the eyes’ move-ments on the screen was captured. For every location the eyeslooked, a color was added proportional to the coincident powerof the flickering frequency (akin the the pixel value of animage). Darker areas of the image provide lower response,and lighter areas of the image provide higher response of theSSVEP (Steady State Visual Evoked Potential). Large SSVEPpower was observed when the individual was looking at lightcolored objects such as the letters, and low SSVEP power wasobserved when the individual was looking at the darker (lessflicker amplitude) background. The word “NO” was visiblyreconstructed from mind’s eye, based on SSVEP amplitude ofEEG signal at each eye location during viewing of a flickeringimage of the word “NO”. The image was interpolated in2D to create a rough visualization of image in view of theobserver. While blurry, this is the first ever reconstruction ofa visual image from human brainwave activity captured withsimple dry surface electrodes and using a simple commerciallyavailable EEG headband.
the relative power of 12 Hz activity compared to the rest ofthe spectra. This creates a way to visualize the useful field ofview of the human visual system as shown in top of Fig 4.
We have established that the eye can function as a camera.By projecting the image to the side and collecting it withlong exposure photography, we can photograph the observer’svisual field. When the observer used overt attention to trackthe phone with their eyes, the effect created a broad cone ofvision. However, when the observer fixated on a point directly
ahead, and covertly attended to the moving smartphone displayscreen in the periphery, the photographed visual field appearedmuch narrower. Therefore we think of this visualization beingrelated to a person’s visual attention, or consciousness of thespace around them. Other results from these experiments aredetailed in [22].
III. PICTURES FROM THE “MIND’S EYE”Initially we created a flickering visual stimulus on the screen
with contours created by non flickering black areas. We spelledthe word “NO” as flickering subject matter. The observer wastasked with rastering their eyes horizontally and verticallyacross the flickering stimulus in a prescribed uniform raster-scan pattern, identical to the raster-scan of a progressivelyscanned television image. The observer’s eye movements andlocation of fixation were tracked with a TobiiTMdesktop eyetracker which was pre-calibrated. The observer’s EEG wasrecorded with a Muse headset, with an auxiliary Oz electrodeproviding high quality EEG data sampled at 256 Hz. SeeFig. 6.
For every location to which the eyes moved, an estimate ofthe SSVEP magnitude was made from the EEG by performinga windowed FFT (10 second window) and computing therelative power of 12 Hz activity compared to the rest of thespectra. The more flickering light that entered the eye at thatfixation location, the stronger the SSVEP magnitude was. Wepredicted that this modulation in SSVEP was a function of thesubject matter’s light level for each position of the raster scan.Thus lighter areas of the image produce higher SSVEP anddarker areas lower SSVEP. This information was combinedwith the eye tracking data to recreate an image of what theparticipant was observing. See Fig. 6.
In some experiments we eliminated the need for the eyetracker, by simply displaying a cursor that moved along thesubject matter in the prescribed pattern, to guide the personwhere to look. However, even in this case, the eye tracker isuseful as it allows us to detect saccades, blinking, or otheranomalies to be filtered out or down-weighted.
Although the unstructured eye-tracking based scanning ap-proach successfully captures large patterns, it fails to capturefine details. A list of some of the problems with the previousapproach:
1) eye-tracking is only accurate to within a few centimeters2) consecutive rasters (without breaks for the subject) lead
to fatigue3) an SSVEP response is elicited not only when a person
looks directly at a flashing point, but also (to a lesserdegree) when there is flashing in their peripheral vision,thereby decreasing the resolution of the output image.
To address these issues, a new process was devised in whicha cursor would slide across the target image. The cursor’sshape, size, speed, closeness to face, colour, frequency offlashing, and brightness were optimized for maximal responseand response reliability.
In this approach, the subject follows a white dot in the centerof a square cursor as it slides from the left side of the image
2019 IEEE International Conference on E-health Networking, Application & Services (HealthCom)
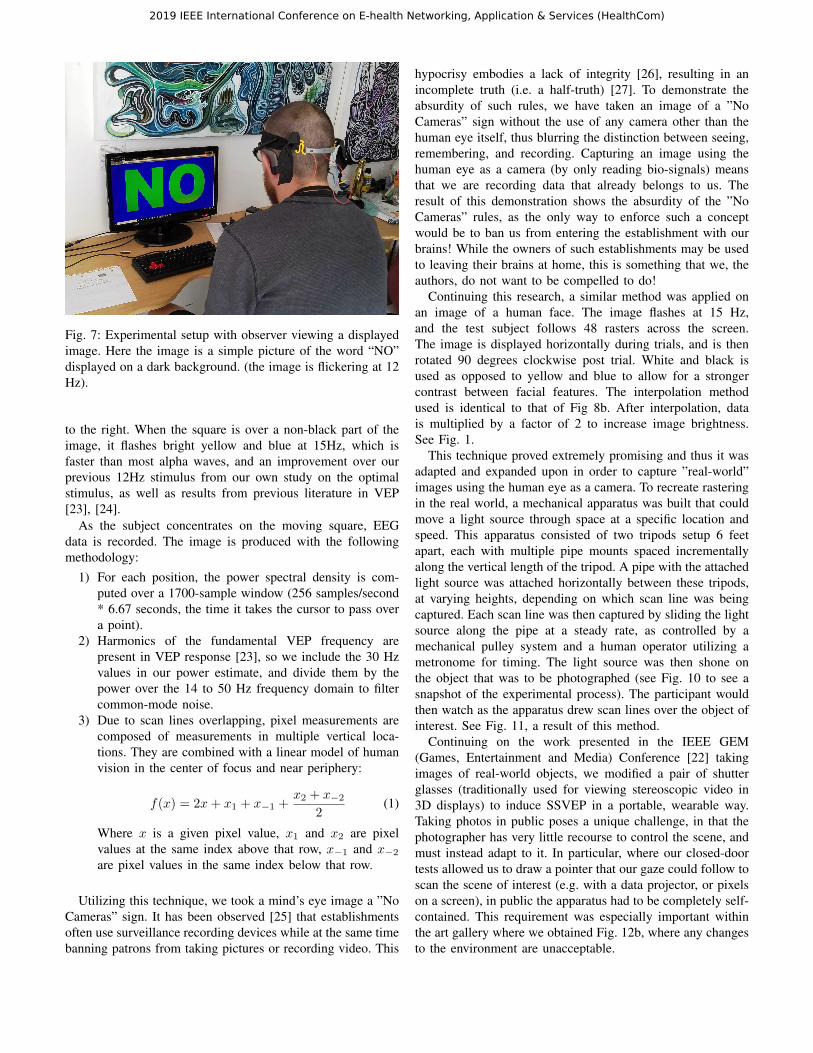
Fig. 7: Experimental setup with observer viewing a displayedimage. Here the image is a simple picture of the word “NO”displayed on a dark background. (the image is flickering at 12Hz).
to the right. When the square is over a non-black part of theimage, it flashes bright yellow and blue at 15Hz, which isfaster than most alpha waves, and an improvement over ourprevious 12Hz stimulus from our own study on the optimalstimulus, as well as results from previous literature in VEP[23], [24].
As the subject concentrates on the moving square, EEGdata is recorded. The image is produced with the followingmethodology:
1) For each position, the power spectral density is com-puted over a 1700-sample window (256 samples/second* 6.67 seconds, the time it takes the cursor to pass overa point).
2) Harmonics of the fundamental VEP frequency arepresent in VEP response [23], so we include the 30 Hzvalues in our power estimate, and divide them by thepower over the 14 to 50 Hz frequency domain to filtercommon-mode noise.
3) Due to scan lines overlapping, pixel measurements arecomposed of measurements in multiple vertical loca-tions. They are combined with a linear model of humanvision in the center of focus and near periphery:
f(x) = 2x+ x1 + x−1 +x2 + x−2
2(1)
Where x is a given pixel value, x1 and x2 are pixelvalues at the same index above that row, x−1 and x−2
are pixel values in the same index below that row.
Utilizing this technique, we took a mind’s eye image a ”NoCameras” sign. It has been observed [25] that establishmentsoften use surveillance recording devices while at the same timebanning patrons from taking pictures or recording video. This
hypocrisy embodies a lack of integrity [26], resulting in anincomplete truth (i.e. a half-truth) [27]. To demonstrate theabsurdity of such rules, we have taken an image of a ”NoCameras” sign without the use of any camera other than thehuman eye itself, thus blurring the distinction between seeing,remembering, and recording. Capturing an image using thehuman eye as a camera (by only reading bio-signals) meansthat we are recording data that already belongs to us. Theresult of this demonstration shows the absurdity of the ”NoCameras” rules, as the only way to enforce such a conceptwould be to ban us from entering the establishment with ourbrains! While the owners of such establishments may be usedto leaving their brains at home, this is something that we, theauthors, do not want to be compelled to do!
Continuing this research, a similar method was applied onan image of a human face. The image flashes at 15 Hz,and the test subject follows 48 rasters across the screen.The image is displayed horizontally during trials, and is thenrotated 90 degrees clockwise post trial. White and black isused as opposed to yellow and blue to allow for a strongercontrast between facial features. The interpolation methodused is identical to that of Fig 8b. After interpolation, datais multiplied by a factor of 2 to increase image brightness.See Fig. 1.
This technique proved extremely promising and thus it wasadapted and expanded upon in order to capture ”real-world”images using the human eye as a camera. To recreate rasteringin the real world, a mechanical apparatus was built that couldmove a light source through space at a specific location andspeed. This apparatus consisted of two tripods setup 6 feetapart, each with multiple pipe mounts spaced incrementallyalong the vertical length of the tripod. A pipe with the attachedlight source was attached horizontally between these tripods,at varying heights, depending on which scan line was beingcaptured. Each scan line was then captured by sliding the lightsource along the pipe at a steady rate, as controlled by amechanical pulley system and a human operator utilizing ametronome for timing. The light source was then shone onthe object that was to be photographed (see Fig. 10 to see asnapshot of the experimental process). The participant wouldthen watch as the apparatus drew scan lines over the object ofinterest. See Fig. 11, a result of this method.
Continuing on the work presented in the IEEE GEM(Games, Entertainment and Media) Conference [22] takingimages of real-world objects, we modified a pair of shutterglasses (traditionally used for viewing stereoscopic video in3D displays) to induce SSVEP in a portable, wearable way.Taking photos in public poses a unique challenge, in that thephotographer has very little recourse to control the scene, andmust instead adapt to it. In particular, where our closed-doortests allowed us to draw a pointer that our gaze could follow toscan the scene of interest (e.g. with a data projector, or pixelson a screen), in public the apparatus had to be completely self-contained. This requirement was especially important withinthe art gallery where we obtained Fig. 12b, where any changesto the environment are unacceptable.
2019 IEEE International Conference on E-health Networking, Application & Services (HealthCom)

(a) (b)
Fig. 8: (a) The 100px x 100px flashing yellow and blue square slides across ”NO CAMERAS”. Each scan line of the rastertakes approximately 106 seconds. 48 overlapping scan lines make up the entire image. (b) The image obtained from capturinga participant’s EEG data while looking at ”NO CAMERAS”.
Fig. 9: The setup of the display, control computer (runningUbuntuTMGNU/Linux operating system), MuseTMEEG system,and participant for the ”NO CAMERAS” imaging trials.
Fig. 10: Process shot of how a picture of the human form wascaptured using the human eye as a camera.
Fig. 11: Left: Individual being imaged by participant. Right:Output from EEG.
(a) Reference image: work byVija Celmens, part of the “Un-titled (Ocean)” series
(b) The image of 12a obtainedfrom the photographer’s EEGdata.
Fig. 12
2019 IEEE International Conference on E-health Networking, Application & Services (HealthCom)

To this end, we moved all features of the test apparatusinto the wearable computer. We occluded most of the viewon our shutter glasses so the photographer could only focuson the spot directly in front of their gaze, to emulate the finespatial control of a pointer. Then, to avoid unpredictable timingand positioning with rastering, we subdivided the scene intodiscrete rectangular chunks and fixated on each at a time toobtain pixels of the image. To obtain the image in Fig. 12b,the photographer fixated on each chunk for 8 seconds.
IV. FUTURE DIRECTIONS
We obtained a compelling set of results. We will continueto work to maximize the resolution, speed, and usefulness ofthese techniques. Here, we also present some further possibleapplications.
Equipment: One limitation is the use of an LCD monitor,which has irregular pixel onset time with respect to eachrefresh cycle, which reduces the spectral purity of the stimulusand decreasing our signal to noise ratio. In our future researchwe will use an improved monitor that can flicker more reliablysuch as a CRT (Cathode Ray Tube) which we modify tooperate in vector graphics rather than raster graphics (akinto a cathode-ray oscillograph). Finally, another limitation isthe use of a low cost portable EEG system with dry electrodeconnections. In our follow up research we will utilize a betterEEG system that can record from more channels, at a fastersampling rate, and with a better signal to noise ratio.
Signal Processing: A number of potential signal processingschemes were tested and we have imagined a number ofpotential improvements to these schemes. We realize thatsome eye movements are quite quick and will not linger atthe location long enough to entrain the SSVEP in the EEG.Here we corrected this by using a low pass 1.5 Hz 6th orderButterworth digital filter on the eye movement X and Y dataprior to plotting. This minimizes the large eye movements butdoes not remove their influence all together. A future schemewill use a weighting based on the speed of eye movements,to maximize the influence of slow movements and reduce thissource of error. Further, during blinking (which shuts the eye-camera and creates an electrical artifact in the EEG), this samereduced weight will be used, whereas here we ignored thiscomplexity. Further improvements include using VEP basedon the wavelet or chirplet transform [28], [29].
Imaging light vs. the mind - Simple visual illusions createthe precept of contours that are non-veridical, they are all inthe mind. Recording of neurons and EEG has shown thatthese illusions are associated with activation as if there isa real stimulus there. We predict that this technique couldbe used to visualize the percept of a stimulus instead of thestimulus itself. That is, if we present a visual illusion withan artificial contour perceived by the observer, we predictthat the reconstructed image would also contain that illusorycontour. Additionally, we may be able to record images thathave a human element of relevancy. This might allow us to,for example, capture a picture with emphasis on objects theperson deems relevant. Objects that a person deems relevant
Fig. 13: SSVEPVMP apparatus.
will show up more clearly in the picture, so that we will havea new artistic and scientific “window” into human vision.
Health Applications: We believe that the veillance imageswe are collecting are more related to the spotlight of attentionthan they are to the physical input of light to the eye.We found that when observers fixate on a single point andignore the flickering light in their visual field, the veillancefield is narrowed. However, when they track the flickeringobject itself, the veillance field becomes wider. Concretely,this methodology presents new opportunities for diagnosingand understanding vision, e.g. the vision test of the future.This will be useful because it goes beyond simply an eye test,and includes important elements of brain function. This couldhave far-reaching implications for health care, and will allowus to better understand the brain and mental health. We alsopropose that this could represent a useful predictive biomarkerof attention issues associated with ADHD and aging, and thusa potential target for intervention.
A future direction of this research is the application ofvisual focus metrics in wearable computing. We have alreadybegun to explore this through a new custom WearCompsystem, the SSVEPVMP (Steady State Visually Evoked Po-tentials Visual Memory Prosthetic). The SSVEPVMP consistsof shutter glasses, EEG headset, head-worn camera, head-worn microphone, and a central processor (Nvidia JetsonTM orRaspberry PiTM 4). While the user goes about their day, theirworld is mediated to flicker at 15 Hz. Then, we measure theuser’s SSVEP response to predict attention to events seen ineveryday life. When the user’s visual environment is of littleimportance, no (or very weak) SSVEP response is measured.When the user’s visual stimulus is interesting and engaging,there is a high SSVEP response. This system has been testedto successfully predict events that were of importance to thecyborg user. See Fig. 14
V. CONCLUSION
We proposed a method of visualizing the eye’s gaze usingsynchronized EEG data with SSVEP. By mapping brain waveresponse to a 12 Hz or 15 Hz flashing light stimulus, we’ve
2019 IEEE International Conference on E-health Networking, Application & Services (HealthCom)

Fig. 14: We collected the SSVEP response of an individualwearing the SSVEPVMP WearComp for 30 minutes. Duringthis time, we also recorded interesting visual events as indi-cated by the user. We then predicted the points of interestby collecting the times of high SSVEP response. This figureshows a graph of the normalized SSVEP power (blue) over30 minutes. The red bands are interesting events that occurredduring these 30 minutes, which were indicated by the user.In our initial tests we have seen an 89% hit rate on theseinteresting events.
successfully displayed images seen by the visual cortex. Wehope to further advance this technique for metavision ofthe brain, and are working on applying the technology tocommercial and medical applications.
REFERENCES
[1] J. M. Caldeira, J. J. Rodrigues, and P. Lorenz, “Toward ubiquitousmobility solutions for body sensor networks on healthcare,” IEEECommunications Magazine, vol. 50, no. 5, pp. 108–115, 2012.
[2] C. Garcia-Pardo, C. Andreu, A. Fornes-Leal, S. Castello-Palacios,S. Perez-Simbor, M. Barbi, A. Valles-Lluch, and N. Cardona, “Ultraw-ideband technology for medical in-body sensor networks: An overviewof the human body as a propagation medium, phantoms, and approachesfor propagation analysis,” IEEE Antennas and Propagation Magazine,vol. 60, no. 3, pp. 19–33, 2018.
[3] C. Garcia-Pardo, R. Chavez-Santiago, N. Cardona, and I. Balasingham,“Experimental uwb frequency analysis for implant communications,” in2015 37th Annual International Conference of the IEEE Engineering inMedicine and Biology Society (EMBC). IEEE, 2015, pp. 5457–5460.
[4] P. Ray, J. Li, A. Ariani, and V. Kapadia, “Tablet-based well-beingcheck for the elderly: development and evaluation of usability andacceptability,” JMIR human factors, vol. 4, no. 2, p. e12, 2017.
[5] G. R. Muller-Putz and G. Pfurtscheller, “Control of an electricalprosthesis with an ssvep-based bci,” IEEE Transactions on biomedicalengineering, vol. 55, no. 1, pp. 361–364, 2007.
[6] N. Noury, G. Virone, P. Barralon, J. Ye, V. Rialle, and J. Demongeot,“New trends in health smart homes,” in Proceedings 5th InternationalWorkshop on Enterprise Networking and Computing in HealthcareIndustry (HealthCom). IEEE, 2003, pp. 118–127.
[7] C. Lozano-Garzon, M. Camelo, P. Vila, and Y. Donoso, “A multi-objective routing algorithm for wireless mesh network in a smart citiesenvironment.” JNW, vol. 10, no. 01, pp. 60–69, 2015.
[8] C. Thuemmler, L. Fan, W. Buchanan, O. Lo, E. Ekonomou, andS. Khedim, “E-health: chances and challenges of distributed, serviceoriented architectures,” Journal of Cyber Security and Mobility, vol. 1,no. 1, pp. 37–52, 2012.
[9] C. Thuemmler and C. Bai, Health 4.0: How virtualization and big dataare revolutionizing healthcare. Springer, 2017.
[10] J. J. Rodrigues, D. B. D. R. Segundo, H. A. Junqueira, M. H. Sabino,R. M. Prince, J. Al-Muhtadi, and V. H. C. De Albuquerque, “Enablingtechnologies for the internet of health things,” Ieee Access, vol. 6, pp.13 129–13 141, 2018.
[11] C. A. L. Garzon and O. J. R. Riveros, “Temperature, humidity andluminescence monitoring system using wireless sensor networks (wsn)in flowers growing,” in 2010 IEEE ANDESCON. IEEE, 2010, pp. 1–4.
[12] S. Mann, D. Defaz, C. Pierce, D. Lam, J. Stairs, J. Hernandez, Q. L.an Yi Xin Xiang, G. Kanaan, H. Chen, G. Aylward, M. Jorritsma,and C. Mann, “Eye itself as a camera: Sensors, integrity, and trust,”in WearSys ’19 The 5th ACM Workshop on Wearable Systems andApplications. New York, NY, USA: ACM, 2019, pp. 1–2. [Online].Available: https://doi.org/10.1145/3325424.33302100
[13] C. Zhu, J. J. Rodrigues, V. C. Leung, L. Shu, and L. T. Yang,“Trust-based communication for the industrial internet of things,” IEEECommunications Magazine, vol. 56, no. 2, pp. 16–22, 2018.
[14] S. Londono, C. Urcuqui, M. F. Amaya, J. Gomez, and A. N. Cadavid,“Safecandy: System for security, analysis and validation in android,”Sistemas & Telematica, vol. 13, no. 35, pp. 89–102, 2015.
[15] A. Navarro, Y. Castano, J. Valderrama, B. Munoz, and J. Orozco,“Objective levodopa response in parkinson’s disease: A study withinthe medical consultation using an rgb-d camera (kinect R©),” in 2019 9thInternational IEEE/EMBS Conference on Neural Engineering (NER).IEEE, 2019, pp. 122–125.
[16] S. Mann, “Phenomenal augmented reality: Advancing technology forthe future of humanity,” IEEE Consumer Electronics, pp. cover + 92–97, October 2015.
[17] S. M. , “Surveillance, sousveillance, and metaveillance,” pp. ”1408–1417”, ”CVPR2016”.
[18] S. Mann, K. M. Kitani, Y. J. Lee, M. Ryoo, and A. Fathi, “Anintroduction to the 3rd workshop on egocentric (first-person) vision,” inComputer Vision and Pattern Recognition Workshops (CVPRW), 2014IEEE Conference on. IEEE, 2014, pp. 827–832.
[19] J. H. Q. L. B. C. Z. Y. X. X. Steve Mann, Cayden Pierce, “Drone swarmsfor Sensing-of-Sensing,” IEEE Sensors, p. to appear, Aug. 2019.
[20] S. Mann, S. Feiner, S. Harner, M. A. Ali, R. Janzen, J. Hansen, andS. Baldassi, “Wearable computing, 3d aug* reality, ...” in ACM TEI2015, pp. 497–500.
[21] R. Janzen and S. Mann, “Sensory flux from the eye: Biological sensing-of-sensing (veillametrics) for 3d augmented-reality environments,” inIEEE GEM 2015, pp. 1–9.
[22] T. A. D. L. M. A. J. S. C. P. C. M. Steve Mann, Diego Defaz,“Encephalogames (brain/mind games): Inclusive health and wellbeingfor people of all abilities,” IEEE GEM (Games, Entertainment andMedia) Conference, Jun. 2019.
[23] C. S. Herrmann, “Human EEG responses to 1-100Hz flicker:resonance phenomena in visual cortex and their potential correlationto cognitive phenomena,” Experimental Brain Research, vol.137, no. 3-4, pp. 346–353, Apr. 2001. [Online]. Available:http://link.springer.com/10.1007/s002210100682
[24] M. A. Pastor, J. Artieda, J. Arbizu, M. Valencia, andJ. C. Masdeu, “Human Cerebral Activation during Steady-State Visual-Evoked Responses,” The Journal of Neuroscience,vol. 23, no. 37, pp. 11 621–11 627, Dec. 2003. [Online]. Avail-able: http://www.jneurosci.org/lookup/doi/10.1523/JNEUROSCI.23-37-11621.2003
[25] M. A. Ali and S. Mann, “The inevitability of the transition from asurveillance-society to a veillance-society: Moral and economic ground-ing for sousveillance,” in ISTAS. IEEE, 2013, pp. 243–254.
[26] S. Mann, “Big data is a big lie without little data: Humanistic in-telligence as a human right,” Big Data & Society, vol. 4, no. 1, p.2053951717691550, 2017.
[27] S. Mann, R. Janzen, M. A. Ali, and K. Nickerson, “Declaration of veil-lance (surveillance is half-truth),” in 2015 IEEE Games EntertainmentMedia Conference (GEM). IEEE, 2015, pp. 1–2.
[28] J. Cui and W. Wong, “The adaptive chirplet transform and visual evokedpotentials,” IEEE Transactions on Biomedical Engineering, vol. 53,no. 7, pp. 1378–1384, 2006.
[29] J. Cui, W. Wong, and S. Mann, “Time-frequency analysis of visualevoked potentials using chirplet transform,” Electronics Letters, vol. 41,no. 4, pp. 217–218, 2005.
2019 IEEE International Conference on E-health Networking, Application & Services (HealthCom)