the honorable lisa jackson
TRANSCRIPT


The Honorable Lisa Jackson Administrator U.S. Environmental Protection Agency 1200 Pennsylvania Avenue, N.W. Washington, D.C. 20460 Subject: An Urgent Call to Action – Report of the State-EPA Nutrient Innovations Task Group Dear Administrator Jackson,
We are pleased to transmit the enclosed An Urgent Call to Action - Report of the State-EPA Nutrient Innovations Task Group for your review and consideration. The initial concept for a joint State-EPA review of both existing and innovative approaches to nutrient management was introduced at the 2008 annual summer meeting of the Association of State and Interstate Water Pollution Control Administrators (ASIWPCA). Further discussions occurred in October 2008 at EPA's Water Division Directors meeting which included EPA regional and headquarters water managers as well as senior program managers representing ASIWPCA and the Association of State Drinking Water Administrators (ASDWA). At the October meeting, State and EPA surface water and drinking water program managers agreed to form an ad hoc Nutrient Innovations Task Group to identify and frame key nutrient issues, questions, and options on how to improve and accelerate nutrient pollution prevention and reduction at the state and national level.
As outlined in the enclosed report, the spreading environmental and drinking water supply degradation associated with excess levels of nitrogen and phosphorus in our nation's waters has been studied and documented extensively. Current efforts to control nutrients have been hard-fought but collectively inadequate at both a statewide and national scale. Concern with the limitations of current nutrient control efforts is compounded by the certain knowledge that as the U.S. population increases by more than 135 million over the next 40 years, the rate and impact of nitrogen and phosphorus pollution will accelerate - potentially diminishing even further our progress to date.
In this report, the Task Group presents a summary of scientific evidence and analysis that characterizes the scope and major sources of nutrient impacts nationally. This information is not new; it has been synthesized from a number of reports and examined in a holistic framework. The enclosed report also considers the tools currently used under existing federal authority and presents options for new, innovative tools to improve control of nutrient pollution sources. Finally the Task Group presents findings and suggests next steps needed to better address nutrient pollution.
Key findings address the points above, but also extend to a number of additional conclusions including the following:
* Nutrient-related pollution significantly impacts drinking water supplies, aquatic life,
and recreational water quality. While available cost data associated with these impacts is limited, what we do know paints a sobering picture and a compelling reason for more urgent and effective action.
* Sound science, technical analysis, collaboration, and financial incentives will fail to
adequately address nutrient impacts at a state-wide and national level without a common framework of responsibility and accountability for all point and nonpoint sources - this framework does not presently exist.
* Current tools such as numeric nutrient criteria, water quality assessments and listings,
urban stormwater controls, POTW nutrient permit limits, and animal feedlot controls are underused and poorly coordinated.
* Other broadly applicable tools, such as CZARA, antidegradation, limits on discharges
to impaired waters, and compliance with downstream water quality standards are rarely used. * Current regulations disproportionately address certain sources in a watershed (e.g.,
municipal sewage treatment) at the exclusion of others contributing substantial loadings of similar pollutants to the same watershed.
* Specific aspects of state nonpoint source programs have been highly successful in
addressing individual sources of nutrients, but their broader application has been undercut by the absence of a common multi-state framework of mandatory point and nonpoint source accountability within and across watersheds.
The Nutrient Innovations Task Group believes that national leadership is vital to
supporting and requiring more consistent and fuller utilization of existing tools from state to state and source to source. Establishing a cross-state, enforceable framework of responsibility and accountability for all point and nonpoint pollution sources is central to ensuring balanced and equitable upstream and downstream environmental protection. It is also essential to strengthen the ability of any single state to demand environmental accountability without jeopardizing the loss of economic activity that might shift to another state with less rigorous standards. We believe that absent a profound change in current approaches and support for the development of a multi-sector framework of accountability for both point and nonpoint sources, we collectively are unlikely to be successful in responding to an increasingly pervasive source of pollution that comes from multiple sources in every state and affects not only near-field waters and habitats, but also those of neighboring and downstream states.


In addition to the Task Group, the following contributed to the deliberations of the Task Group:
State Representatives Jon Craig , OK Alan Pollock, VA
EPA Office of Water Benita Best‐Wong Tim Jones Roy Simon Tanya Code Jim Keating Dana Thomas Katie Flahive Sylvia Malm Rosaura Vega Peter Gold Roberta Parry Shanika Whitehurst John Goodin Jeff Peterson Rob Wood Sharon Hayes Steve Potts Phil Zahreddine Patricia Lee Harrigan Suzanne Schwartz Marcus Zobrist
EPA Regions Kevin Bricke, R2 Linda Holst , R5 Evelyn MacKnight, R3
Ed Decker, R4 Roger Janson, R1 Joe Piotrowski , R3 Bert Garcia, R8 Jane Leu, R2 Mark Tedesco, R2
StateEPA Nutrient Innovations Task Group
State Representatives Michael Baker, OH, co‐lead Lee Dunbar, CT Derek Smithee, OK Walt Baker, UT Ellen Gilinsky, VA, co‐lead Mike Tate, KS Kathy Bunting‐Howarth, DE Jill Jonas, WI Marcia Willhite, IL
Organizations of State Drinking Water and Water Quality Managers Linda Eichmiller , ASIWPCA Jim Taft , ASDWA Peter Tennant, ORSANCO
EPA Office of Water Ephraim King, co‐lead James Hanlon Craig Hooks Cynthia Dougherty
EPA Regions Jon Capacasa, R3, co‐lead Karen Flournoy, R7 Tim Henry, R5 Carol Campbell, R8 Jim Giattina, R4 Christine Psyk, R10 Barbara Finazzo, R2 Lynne Hamjian , R1 Jane Watson, R6
Tetra Tech, Inc., under contracts (EP‐C‐04‐030 and EP‐C‐05‐046) provided technical and logistical support.


An Urgent Call to Action
Contents I. Introduction ..................................................................................................................................1
II. Scope and Impacts of Nitrogen and Phosphorus Pollution .........................................................2 Drinking Water Supplies............................................................................................................2 General Water Quality and Ecological Impacts.........................................................................5 Stream Impairments..................................................................................................................6 Lake and Reservoir Impairments...............................................................................................8 Estuarine and Coastal Waters ...................................................................................................9
III. Primary Sources of Nutrients ....................................................................................................12 Background Information .........................................................................................................12 Urban Stormwater Runoff.......................................................................................................13 Municipal Wastewater Treatment ..........................................................................................14 Atmospheric Nitrogen Deposition...........................................................................................15 Agricultural Livestock Activities...............................................................................................15 Agricultural Row Crops............................................................................................................17
IV. Tools and Authorities................................................................................................................18 Existing Tools ...........................................................................................................................18 New and Innovative Tools .......................................................................................................20
Incentive-based Tools ..........................................................................................................21 Regulatory Mechanisms That Are Rarely Used....................................................................23
Examples of Innovative Tools Applied to Sources of Nutrients ..............................................26 Urban Stormwater ...............................................................................................................26 Municipal Wastewater Treatment.......................................................................................26 Atmospheric Nitrogen Deposition .......................................................................................27 Agricultural Livestock Activities ...........................................................................................27 Agricultural Row Crops.........................................................................................................28 Summary ..............................................................................................................................29
V. Task Group Findings and Call to Action .....................................................................................31
Appendix A: Drinking Water Case Studies
Appendix B: Nutrient Innovations - Review and Analysis of Existing Tools
CALL TO ACTION ......................................................................................................................33
References .....................................................................................................................................35
Appendix C: Review and Analysis of Alternative Tools
Appendix D: Accountability Fact Sheets
August 2009 i


An Urgent Call to Action
An Urgent Call to Action—Report ofthe State-EPA Nutrient Innovations Task GroupI. Introduction The amount of nutrients entering our waters has dramatically escalated over the past 50 years, and nutrients now pose significant water quality and public health concerns across the United States. In terms of growing drinking water impacts, expanding impairment of inland
Continuing the status quo at the national, state and local levels and relying upon our current practices and control strategies will not support a positive public health and environmental outcome.
waters, and compromised coastal estuaries, nitrogen and phosphorus pollution has the potential to become one of the costliest, most difficult environmental problems we face in the 21st century (Boesch 1999).
Current efforts to control nutrients have been hard-fought but collectively inadequate at both a statewide and national scale. Perhaps even more disturbing than our current inadequate nutrient control strategies is the certain knowledge that as our population increases from about 300 million people in 2008 by more than 135 million over the next 40 years (U.S. Census Bureau 2008; U.S. Census Bureau 2009), the rate and impact of nitrogen and phosphorus pollution will accelerate—potentially diminishing even further our progress to date. As the U.S. population expands, nutrient pollution from urban stormwater runoff, municipal wastewater discharges, air deposition, and agricultural livestock activities and row-crop runoff is expected to grow as well.
The spreading environmental degradation associated with excess levels of nitrogen and phosphorus in our nation’s waters has been studied and documented extensively. Over the past decade, there have been numerous major reports, a substantially large number of national and international scientific studies, and a growing number of quantitative analyses and surveys at the state and national levels indicating that we are falling Examples of recent key reports on nutrient
pollution EPA SAB: Reactive Nitrogen in the United
States: An Analysis of Inputs, Flows, Consequences, and Management Options (USEPA 2009a)
EPA SAB: Hypoxia in the Northern Gulf of Mexico (USEPA 2007c)
NRC: Mississippi River Water Quality and the Clean Water Act: Progress, Challenges, and Opportunities (NRC 2008a)
NRC: Urban Stormwater Management in the United States (NRC 2008b)
EPA: National Coastal Condition Report III (USEPA 2008a)
EPA: Wadeable Streams Assessment (USEPA 2006b)
NOAA: Effects of Nutrient Enrichment in the Nation’s Estuaries: A Decade of Change (Bricker et al. 2007)
behind. The National Academy of Sciences has addressed the impacts of nutrient pollution on our coastal and estuarine waters in two major reports. The National Oceanic and Atmospheric Administration (NOAA) also has documented and analyzed this issue extensively. EPA’s Science Advisory Board has prepared two critical reports. The Agency itself has issued numerous reports over the years sounding the alarm. And this body of data, analysis and conclusions is substantiated by numerous published articles, state-level technical reports, and university studies across the country.
Faced with the reality of losing ground to a growing environmental crisis, state and EPA water quality and drinking water directors and program managers formed a State-EPA Nutrient Innovations Task Group (Task Group) to
August 2009 1

An Urgent Call to Action
review past nutrient control efforts and evaluate the potential for creating a new synthesis of existing tools and innovative approaches to change how we currently respond to nutrient pollution. The Task Group agreed on the following charge:
States and EPA recognize that eutrophication and nutrient overloading are significant environmental problems, not just for aquatic resources but also from a drinking water standpoint. In the past, we have been successful in some areas, but not in others. We agree to meet to develop a strategy to change the way we act to improve ways to reduce or eliminate nutrient releases.
In this report, the Task Group presents a summary of scientific evidence and analysis that characterizes the scope of nutrient impacts and the major sources of nutrients. This information is not new; it has been synthesized from a number of reports and surveys and examined in a holistic framework. This summary considers the tools currently used under existing federal authority and presents options for new, innovative tools to control sources of nutrient pollution. Finally, the Task Group presents findings and suggests next steps needed to better address nutrient pollution.
This summary report was developed through a series of discussions and iterations. The Task Group first met in December 2008 to determine the charge and identify work groups to evaluate the subjects considered in this summary. The Task Group met again in February 2009 to present the work groups’ findings, in March 2009 to share with and receive input from state program directors, and finally in May 2009 to share the outline of this summary with EPA Water Division Directors for their input and feedback.
II. Scope and Impacts of Nitrogen and Phosphorus Pollution Nutrient-related pollution significantly affects drinking water supplies, aquatic life and recreational water quality. These impacts occur in all categories of waters—rivers, streams, lakes, reservoirs, estuaries and coastal areas. Although only limited cost data are available, what we do know about the scope, impacts and costs of nutrient pollution presents a sober and compelling reason for more urgent and effective action. This chapter outlines the scope and impacts of nutrient pollution based upon recent and historical data and analyses. The first section of the chapter focuses on public health impacts associated with nutrient pollution in connection with public drinking water systems and private wells. The nature and scope of water quality impacts are then addressed in the following section.
Drinking Water Supplies There are approximately 52,000 community water systems across the United States serving more than 290 million people (USEPA 2009d). The community water systems serve many communities that are vulnerable to the public health impacts of a contaminated drinking water supply, as well as to the cost of continued contaminant monitoring and the substantial financial burden of adding or upgrading treatment. About 78 percent of these community water systems, serving 88 million people, use ground water as a drinking water supply. The vast majority of the community systems (78 percent) serve small to very small communities (defined as populations of 25 to 500 and 501 to 3,300) with minimal treatment and limited resources (USEPA 2009d).
August 2009 2

• High nitrate levels in drinking water have been linked to methemoglobinemia
(a decrease in the oxygen-carrying capacity of red blood cells), which causes serious illness and sometimes death in infants, as well as other potential human health effects (DeSimone 2009).
• The combination of organic carbon (from algae in source waters) and disinfection agents used in water treatment can sometimes lead to elevated levels of disinfection by-products in drinking water. Yet another related concern is the possible direct role of organic nitrogen compounds in the creation of disinfection by-products. More than 260 million Americans are exposed to disinfection by-products in their drinking water each year ( USEPA 2005b). Disinfection by-products such as trihalomethanes, haloacetic acids, bromate and chlorite have been linked to increased cancer and reproductive health risks in humans, as well as liver, kidney and central nervous system problems (USEPA 2009b).
An Urgent Call to Action
Treatment and resources are even more limited for the 15 million households that rely on private wells for their drinking water (DeSimone 2009). In a recent report on the quality of water in domestic wells, the U.S. Geological Survey (USGS) found that contaminants such as nutrients co-occurred with other contaminants in 73 percent of the wells tested in the study (DeSimone 2009). Contamination of a ground water drinking water supply by both nutrient pollution and co-occurring pathogenic, pesticide, and emerging contaminants is a significant concern for small communities and individual households in terms of the need for treatment technologies or alternative water supplies.
About 22 percent of community water systems, serving more than 200 million people (about two-thirds of the U.S. population), use surface water as their key drinking water supply (USEPA 2009d). These systems tend to be larger than those using ground water, but by virtue of their size, they are equally challenged (if not more so) by the cost and complexity of treatment for nutrients and associated co-contamination from nutrient pollution sources. They have the added challenge of needing to address widespread algal blooms and related toxins in their surface drinking water supplies caused by pollution sources that can occur not only locally but also across state lines and even hundreds of miles upstream. Appendix A presents several case studies that illustrate the problems and costs associated with nitrates in drinking water systems. Following is a summary of key information that describes examples of nutrient pollution problems in drinking water sources:
• From 1998 to 2008, the number of reported violations for exceeding the maximum contaminant level (MCL) of 10 mg/L for nitrate in public drinking water systems varied from year to year. It ranged from 517 to 1,163 violations (Figure 1), affecting from about 200,000 to nearly 1.9 million people.
Figure 1. Annual number of nitrate violations in community water systems (USEPA 1998; USEPA 1999; USEPA 2000; USEPA 2001; USEPA 2002a; USEPA 2003; USEPA 2004; USEPA 2005a; USEPA 2006a; USEPA 2007a; USEPA 2008b).
August 2009 3

An Urgent Call to Action
During these 11 years, nitrate exceedances showed a significant increasing trend, nearly doubling the number of violations (USEPA 1998; USEPA 1999; USEPA 2000; USEPA 2001; USEPA 2002a; USEPA 2003; USEPA 2004; USEPA 2005a; USEPA 2006a; USEPA 2007a; USEPA 2008b).
• USGS sampled 2,100 private wells in 48 states from 1991 to 2004 and found nitrate was detected in about 72% of the wells and was the most common contaminant derived from man-made sources. It was found at concentrations greater than the drinking water standard in about 4 percent of sampled wells. Elevated nitrate concentrations were largely associated with intensively farmed land such as the Midwest Corn Belt and the Central Valley of California (DeSimone 2009). Figure 2 illustrates the widespread nature of nitrate pollution in wells.
• For a small community water system serving 500 people, the estimated capital cost of a drinking water ion exchange treatment system to remove nitrates would be more than $280,000 with annual operation and maintenance (O&M) of about $17,500. That capital cost goes up to over $550,000 with annual O&M of over $50,000 for a community water system serving 3,300 people. Such treatment costs pose a difficult affordability challenge for small systems with a limited number of customers (Khera 2009, personal communication).
Figure 2. Concentrations of nitrate were greater than the U.S. Environmental Protection Agency’s Maximum Contaminant Level of 10 milligrams per liter as N in about 4 percent of the wells (DeSimone et al. 2009).
• Co-occurring contamination from sources of nutrients often carries the added risk of drinking water supply pollution from associated pathogens, anthropogenic chemicals, livestock medicines and other emerging contaminants (DeSimone 2009; Focazio et al. 2008).
August 2009 4

An Urgent Call to Action
• Taste and odor compounds and cyanotoxins, which are produced by cyanobacteria (also known as blue-green algae), represent a further challenge (Carmichael 2000). Taste and odor problems are treatable with ion exchange, oxidation or adsorption with activated carbon. For cyanotoxins, the source cyanobacteria often are no longer present when the public health problem occurs. Without continual monitoring, cyanobacterial toxins may pass through normal water treatment processes (Carmichael 2000).
• Ingestion of water contaminated with chemicals produced by harmful algal blooms can cause gastrointestinal complications, acute or chronic liver damage, neurological symptoms and even death (Falconer et al. 1994; WHOI 2007).
• In 1991 Des Moines (Iowa) Water Works constructed a $4 million (1991 dollars) ion exchange facility to remove nitrate from its drinking water supply. Starting in 1992, this facility has been used an average of 43 days per year to remove excess nitrate levels with O&M costs of nearly $3,000 per day (Jones et al. 2007).
• Water supply costs associated with the increased expense for bottled water purchased during taste and odor episodes have been estimated at $942 million per year in 2008 dollars (Dodds et al. 2009).
• Fremont, Ohio (a city of approximately 20,000) has experienced high levels of nitrate from its source, the Sandusky River, resulting in numerous drinking water use advisories. An estimated $15 million will be needed to build a reservoir (and associated piping) that will allow for selective withdrawal from the river to avoid elevated levels of nitrate, as well as to provide storage (Taft 2009, personal communication).
• In regulating allowable levels of chlorophyll a in Oklahoma drinking water reservoirs, the Oklahoma Water Resources Board estimated that the long-term cost savings in drinking water treatment for 86 systems would range between $106 million and $615 million if such regulations were implemented (Moershel and Derischweiler 2009, personal communication).
General Water Quality and Ecological Impacts In addition to the public health and drinking water treatment issues outlined above, the range and severity of water quality impacts from nutrient pollution, principally through the mechanism and consequences of eutrophication, are even broader and ecologically more severe. The adverse effects of nutrient pollution on water quality are well documented in state water quality assessments (Clean Water Act (CWA) section 305(b) reports); state lists of impaired waterbodies (CWA section 303(d) lists); EPA’s Wadeable Stream Assessment; state and USGS surveys of ground water contamination, and other sources of national, regional or local data.
Nationally, nutrient pollution is one of the top causes of water quality impairment; for those waters assessed, it is directly linked to 20% of impaired river and stream miles, 22% of impaired lake acres and 8% of impaired bay and estuarine square miles. Nutrients are also indirectly linked to additional listed impairments related to low dissolved oxygen, impaired habitat, algal
August 2009 5

An Urgent Call to Action
August 2009 6
growth and noxious aquatic plants. These indirect links to impairments result in an additional 31% of impaired river and stream miles, 30% of impaired lake acres, and 50% of impaired bay and estuarine square miles (USEPA 2009c). Increased plant or algal production can often adversely affect sensitive aquatic organisms by altering the type or quality of food resources available, resulting in impacts on the entire food chain. In addition, changes in algal/plant species in a waterbody can alter habitat structure, causing large-scale changes in aquatic community structure and function. Increased algal abundance in the water column can also negatively affect aquatic biota by increasing turbidity and impairing visual foraging by fish and other aquatic life. Increased turbidity is also linked to extensive loss of ecologically essential sea grasses (Chesapeake Bay Program 2009b). Eutrophication is the process that occurs in waterbodies that receive excess nitrogen, phosphorus, or both. Elevated nutrient levels stimulate excessive plant growth (algae, periphyton-attached algae, and nuisance plants and weeds, often referred to as algal blooms). Some of these blooms are toxic and generate a range of paralytic, diarrheic and neurotoxic effects with negative impacts on animals, humans and aquatic species (NOAA 2009). When the algae die, the resulting dead-plant organic material decomposes, pulling dissolved oxygen from the water and leading to hypoxic conditions, which in turn causes other organisms to die (NOAA 2009).
Stream Impairments Streams serve as conduits of water flowing from the land, particularly during rainfall events. Nutrients carried from the land by stormwater runoff can cause significant local impacts. Streams and rivers also carry nutrient-rich runoff to downstream waters, including lakes, estuaries and coastal waters, where the degradation is even more widespread and significant.
• In the current EPA National Summary of State Information on Water Quality Impairments (USEPA 2009c), more than 80,000 miles of rivers and streams across the United States are listed as “impaired” and not meeting state water quality goals because of nutrients. Note, however, that this number is a substantial underestimate of total stream impacts because only 25 percent of the Nation’s rivers and streams have been assessed.
• According to the Wadeable Stream Assessment, analysis of the association between the
results of nutrient pollution (such as algal growth and changes to stream benthic communities) and the resulting changes to aquatic organisms in streams shows that high levels of nutrients and excess streambed sedimentation more than double the risk of poor biological condition (USEPA 2006b). For phosphorus, approximately 31 percent of the Nation’s stream length (207,355 miles) had “high” concentrations; an additional 16 percent (108,039 miles) had “medium” concentrations.1
1 Medium concentrations are greater than the 75th percentile of reference condition, and high concentrations are greater than the 95th percentile of reference condition (USEPA 2006b).
With regard to nitrogen, 32 percent (213,394 miles) of the Nation’s stream length had “high” concentrations, and an additional 21 percent (138,908 miles) had “medium” concentrations.1 Figure 3 shows the distribution of nitrogen pollution in U.S. streams (USEPA 2006b).

An Urgent Call to Action
Figure 3. Nitrogen pollution is prevalent in many U.S. streams (USEPA 2006b).
• The Wadeable Stream Assessment (USEPA 2006b) evaluated a variety of environmental factors (stressors) that were likely to be detrimental to instream biological quality. These stressors included nitrogen and phosphorus pollution, riparian disturbance and vegetative cover, streambed sediments, instream fish habitat, salinity and acidification. Of these factors, impacts to streams from nitrogen and phosphorus pollution and excess streambed sediments result in over double the risk of impairment to the biological condition (Figure 4) (USEPA 2006b).
Figure 4. Relationship of stressors to biological condition in U.S. streams (USEPA 2006b).
August 2009 7

• In the current EPA National Summary of State
Information on Water Quality Impairments (USEPA 2009c), over 2.5 million acres of lakes, reservoirs and ponds across the United States are listed as impaired and not meeting a state’s water quality
An Urgent Call to Action
Lake and Reservoir Impairments Nutrient pollution in lakes and reservoirs is equally well documented. Excess loadings of nutrient pollution in lakes and reservoirs produce enhanced plant growth or extensive algal blooms, along with the associated reduced dissolved oxygen levels that result from the eventual decomposition of the excessive vegetative growth (Mueller and Helsel 1996). Accelerated plant growth coupled with the storage of nutrients deposited or accumulated in the sediment can lead to a substantial loss The state of Nebraska is concerned about
harmful algal blooms resulting from excess nutrients in surface waters and has had a sampling program for microcystin (a cyanotoxin) in place for several years. Since 2005, 29 percent of the sampled lakes have exceeded the health alert level for microcystin. In 2008 eight lakes were closed to recreation for 2 to 11 weeks due to microcystin levels exceeding the state’s health alert level (Nebraska DEQ 2009).
of aquatic resources as water quality becomes progressively worse and leads to low dissolved oxygen and loss of species diversity.
goals due to nutrients. Again, this is considered an underestimate; only about 43 percent of the Nation’s lakes, reservoirs and ponds have been assessed.
• Nutrient problems and cyanobacteria plagued Lake Erie in the 1960s and 1970s, which prompted the United States and Canada to agree to develop and implement Lakewide Management Plans (Lake Erie LaMP Workgroup 2008a). Although phosphorus levels were reduced to record lows in 1995 and the goal levels of the Great Lakes Water Quality Agreement were met, within the past decade phosphorus levels have been increasing again. This has caused increased growth of algae, which in turn has created eutrophic conditions (Lake Erie LaMP Workgroup 2008b; USEPA 2007b).
• Despite extensive recent efforts to reduce pollution, the amount of phosphorus in Lake Champlain has not changed in most places and appears to be increasing in some parts of the lake. Wetter-than-normal weather and an increase in the population of the Lake Champlain Basin are thought to be the two most significant causes of increased phosphorus loading (LCC 2009a). Excess phosphorus in Lake Champlain is linked to toxic algal blooms (LCC 2009b). For example, in 2008, volunteer monitoring programs observed significant algal blooms in several sections of Lake Champlain, resulting in three high alerts and 21 low alerts issued to users of the lake (LCC 2009b). Low alert areas are open for recreation, but bathers are cautioned to avoid areas of dense algal growth; and high alert areas are not safe for recreational use (VDH 2009). Several actions have been taken in an effort to reduce phosphorus pollution in the lake. Many farmers have voluntarily instituted best management practices, including nutrient and waste management applications targeted to existing soil fertility levels and crop needs. Other programs address the problem of reducing phosphorus runoff from lawns and roads in developed areas. On a per acre basis, developed land contributes about 3.5 times as much phosphorus to Lake Champlain than does agricultural land (LCLT 2009).
• Algal blooms from cyanobacteria, the major harmful algal group in freshwater environments, also affect people through contamination of drinking water supplies and recreational areas (Falconer 1999; WHOI 2007).
August 2009 8

An Urgent Call to Action
• Grand Lake St. Marys, Ohio’s largest inland lake, has become enriched with phosphates and nitrates from several sources. Water samples collected as a result of participating in EPA’s National Lakes Survey indicated the presence of algal toxins in the lake. Ohio EPA performed follow-up analyses, which confirmed that high levels of microcystins were present in the lake water. On May 21, 2009, Ohio EPA, Ohio Department of Health and Ohio Department of Natural Resources issued a health advisory warning people to use caution and limit contact with the lake water (Ohio EPA 2009).
• For fresh waters, Dodds et al. (2009) predict losses in fishing and boating trip-related revenues of up to $1.2 billion in 2001 dollars ($1.4 billion in 2008 dollars) due to lake closures.
• Both Dodds et al. (2009) and Anderson et al. (2000) have noted declines in property values based on excessive algal growth fueled by excess nutrients. Dodds et al. focused on lakefront properties under private ownership. Estimated lake property value loss can be as much as $2.8 billion annually because of nutrient enrichment.
Estuarine and Coastal Waters Estuarine and coastal waters are perhaps the best indicators of the scope and magnitude of nutrient pollution impacts. Harmful algal blooms have been reported in almost every coastal state in the United States (Figure 5) (WHOI 2007). These blooms produce toxins that can kill fish, shellfish, and mammals (NOAA 2009; WHOI 2007). Higher tropic level animals are more susceptible to algal toxins because such toxins accumulate in the food web.
Figure 5. Occurrences of algal blooms throughout the United States (WHOI 2007).
August 2009 9

An Urgent Call to Action
Submerged aquatic vegetation (SAV), or seagrasses, provides critical coastal and estuarine habitat in U.S coastal waters. The primary functions of SAV are serving as a food source and habitat for aquatic species (especially for sensitive life stages such as larval and juvenile), trapping and anchoring sediment, lessening erosion by softening wave action, and absorbing some excess nutrients (FDEP 2001). Because SAV responds rapidly to water quality changes, its health can be an indicator of the overall health of the coastal ecosystem (Chesapeake Bay Program 2009b). Excess nitrogen and phosphorus cause an increased growth of phytoplankton and epiphytes (plants that grow on other plants). Phytoplankton growth leads to increased turbidity, blocking light attenuation, and epiphytic growth further blocks sunlight from reaching the SAV surface. When sunlight cannot reach SAV, photosynthesis decreases and eventually the submerged plants die.
• Of over 400 hypoxic zones reported worldwide, more than 40 percent (168) have been located in U.S. estuarine and coastal waters from 2000 to 2007 (Diaz and Rosenberg 2008).
• In addition, a disturbing 78 percent of the assessed continental U.S. coastal area exhibits symptoms of eutrophication, including excess algal growth, low dissolved oxygen and loss of SAV (Figure 6) (Selman et al. 2008).
• More than one-third of the 102 estuaries in the United States are identified as eutrophic, and this subset drains about 53 percent of the total land area of the continental United States (Campbell 2004; Engle et al. 2007; FDEP 2009; GulfBase 2009; MEOEEA 2009; Neuse River Education Team 2009; NSTC 2003; USACE 2004; USEPA 2009f; USFWS 1997; USFWS 2009).
Figure 6. Hypoxic zone locations (Selman et al. 2008).
August 2009 10
An Urgent Call to Action
• The Gulf of Mexico receives flow from the Mississippi/Atchafalaya River Basin (MARB), which represents 41 percent of the contiguous United States and includes 31 states (NRC 2008a). In 2007 the measured size of the hypoxic zone in the Gulf of Mexico was 7,900 square miles, or about the size of Massachusetts in area. It was the third largest hypoxic zone since measurements began in 1985 (Mississippi River/Gulf of Mexico Watershed Nutrient Task Force 2008).
• Anderson et al. (2000) reported commercial fishery losses as high as $25.3 million ($31.3 million in 2008 dollars) as a result of harmful algal blooms.
• The Chesapeake Bay receives flow from a watershed which stretches across parts of six states and the District of Columbia (Chesapeake Bay Program 2009a). The area of the Chesapeake Bay is about 4,480 square miles, and the hypoxic zone is typically on the order of 40 percent of its area (about 1,792 square miles) (Chesapeake Bay Program 2008; Malmquist 2008).
• Researchers in Florida looked at the relationship between nutrient inputs and SAV growth in two estuaries in Southeast Florida. Study results showed that between 1938 and 1976, nitrogen loadings in Tampa Bay increased by five times. This resulted in a 46 percent decline in SAV between 1950 and 1982. After implementing significant improvements in the treatment of domestic wastewater, and thereby achieving large-scale reductions in point source nitrogen loadings, there was a 57 percent reduction of nitrogen inputs to Tampa Bay. This reduction resulted in a 24 percent increase in SAV from 1982 to 1996 (Tomasko et al. 2005).
• Similarly, Tomasko et al. (2005) estimated that Sarasota Bay experienced a five times increase in nitrogen loadings from 1890 to 1988, resulting in a 28 percent decline in SAV from 1950 to 1988. Point source nitrogen loadings were reduced 46 percent from 1988 to 1990 with improvements to wastewater treatment facilities, resulting in a SAV increase of 19 percent by 1996 (Tomasko et al. 2005).
August 2009 11

An Urgent Call to Action
III. Primary Sources of Nutrients The primary sources of nitrogen and phosphorus pollution are urban and suburban stormwater runoff, municipal wastewater treatment systems, air deposition, agricultural livestock activities, and row crops. In the sections that follow, each of the primary sources of nutrient pollution will be discussed, along with their contribution to the scope of nutrient impacts. This chapter presents a general overview of nitrogen and phosphorus pollution.
Background Information Nitrogen and phosphorus are essential nutrients that control the growth of plants and animals. Nitrogen is readily abundant in the environment as an inert gas, N2, that composes over 70 percent of the earth’s atmosphere. To be used by living organisms, however, nitrogen gas must be fixed into its reactive forms—for plants, either nitrate (NO3
-) or ammonium (NH4
+). Nitrogen can be fixed naturally in soils through bacteria (biological nitrogen fixation (BNF); BNF-terrestrial; and BNF-cultivation) or in the air by lightning. Chemically (artificially), nitrogen is fixed through industrial (Haber-Bosch) and combustion processes (fossil fuels). Most of the reactive nitrogen produced per year—about 24 billion pounds—is artificially produced (Haber-Bosch process) and used to make fertilizers for agriculture and lawns and in some industrial processes. As shown in Figure 7, the artificial production of nitrogen fertilizers has grown exponentially since the 1950s and will continue to grow into the foreseeable future without a significant change in demand and how it is utilized (Nielsen 2005). Phosphorus occurs naturally, mainly as phosphate (PO4
-3), and has been mined for its use as a fertilizer, detergent or animal feed. Like most chemicals, nitrogen and phosphorus become problematic when they occur in excessive amounts in a given area.
The sources of nitrogen or phosphorus pollution to a waterbody depend on the prevailing land use activities surrounding and upstream of a particular waterbody. For example, Figure 8 shows how these proportions can vary regionally for two large watersheds (the land draining into the Chesapeake Bay and the Gulf of Mexico) and illustrates the variability of the relative proportions of the sources.
Figure 7. Sources of reactive nitrogen (Nielsen 2005).
August 2009 12

Year U.S. Population* 1950 152 million 2008 304 million 2050 439 million
*U.S. Census Bureau 1952; U.S. Census Bureau 2008; U.S. Census
Bureau 2009
An Urgent Call to Action
Figure 8. Comparison of nitrogen and phosphorus sources in the Chesapeake Bay and Gulf of Mexico watersheds (USGS 2008; Chesapeake Bay Program 2009). Note: urban and population-related sources include urban stormwater and municipal treatment.
The dramatic increase in the U.S. population over the past 50 years has boosted the demand for food, required additional wastewater treatment needs, increased burning of fossil fuels and expanded urban environments. The projected growth of the U.S. population from 2008 to 2050 will result in an additional 135 million people—continuing and slightly accelerating the annual rate of population growth over the previous 50-year period. This will further increase the public
health risks and aquatic resource degradation from nutrient pollution as discussed in Chapter II.
Urban Stormwater Runoff The U.S. population is primarily consolidated in urban areas; 80 percent of the people live on less than 10 percent of the land. With a total U.S. land area of over 2.3 billion acres, urban areas accounted for about 66 million acres in 1997 (based on Vesterby and Krupa 2001). Our urban landscape will continue to change and expand over time. For example, about half of the current urban areas are expected to be redeveloped between 2000 and 2030, and an estimated 30% (131 billion square feet) of the needed built environment for 2030 does not yet exist (Nelson 2004). Urban landscapes contain a variety of features pervious and impervious to water. Some of the more common pervious features of the urban landscape are landscaped and turf areas,
August 2009 13

An Urgent Call to Action
August 2009 14
recreational areas, and undeveloped tracts of land. Impervious lands include roofs, parking lots and streets. Stormwater collects fertilizers and other applied nutrients, as well as other pollutants on impervious surfaces, before it is discharged to receiving waters. As noted in the EPA SAB report Urban Stormwater Management in the United States (NRC 2008b):
Urban stormwater may actually have slightly lower pollutant concentrations than other nonpoint sources of pollution, especially for sediments and nutrients. The key difference is that urban watersheds produce a much larger annual volume of runoff waters, such that the mass of pollutants discharged is often greater following urbanization.
Urban stormwater discharges via municipal separate storm sewer systems (MS4s) and combined storm sewer systems (CSSs) are regulated under the National Pollutant Discharge Elimination System (NPDES) permit program of the CWA. There are several thresholds for MS4 stormwater regulations. However, a significant number of communities and a substantial amount of urban growth occur outside of MS4s and are only subject to construction stormwater general permits.
Municipal Wastewater Treatment Municipal wastewater treatment plants, also known as publicly owned treatment works (POTWs), usually discharge both phosphorus and nitrogen. Depending on the local ecological conditions and their relative contribution, POTW discharges can be a significant source of nutrients in some watersheds. People produce about 18 million tons of solid waste (feces) annually (based on Freitas Jr. 1999; MERCK 2007). U.S. municipal wastewater treatment facilities currently treat about 34 billion gallons of wastewater per day (USEPA 2008c). For most of the country, municipal wastewater treatment generates two waste streams—biosolids and discharges of treated wastewater to surface water—which are regulated under the provisions of sections 301, 402, and 405 of the CWA, respectively. Municipal or sewage waste biosolids that are to be land applied must meet specific CWA and state regulatory standards to protect surface water and groundwater from contamination. Treatment for surface water discharges is regulated through NPDES permits, which must reflect both the technology-based requirements of secondary treatment (biological oxygen demand (BOD), total suspended solids (TSS), and pH) and applicable water quality standards. However, only a subset of POTW permits currently contain nitrogen and phosphorus limits. Of more than 16,500 municipal POTWs nationwide (USEPA 2008c), approximately 4 percent have numeric limits for nitrogen2
and 9.9 percent for phosphorus (USEPA 2009e). Estimated costs for municipal nutrient removal can vary widely depending on level of treatment and process used, wastewater characteristics, plant capacity, existing treatment facilities, and other site-specific factors.
The estimated cost to upgrade all the POTWs in the United States to achieve the more stringent technology-based limits—3 mg/L for nitrate and nitrite and 0.1 mg/L for phosphate—would be about $44 billion to remove nitrogen, about $44.5 billion to remove phosphorus, and approximately $54 billion to include capabilities to simultaneously remove both nitrogen and phosphorus (based on USEPA 2008c). In addition, our growing population will result in
2 Although 43.5 percent of POTW permits have limits for ammonia, limiting ammonia generally does not reduce overall nitrogen loadings because nitrates and nitrites continue to be discharged.

An Urgent Call to Action
expanding urban and suburban communities. The capacity of wastewater treatment facilities to treat for nitrogen and phosphorus will require further upgrades to decrease future loadings associated with this population growth. In addition, municipal collection systems (sewers) can also be sources of excess nutrients when aging sewer collection systems in cities overflow and are discharged to urban waters or leak nutrient-rich water that infiltrates into the ground.
Onsite and decentralized wastewater treatment systems (septic systems) are used in approximately 20 percent of U.S. homes, and they can be significant contributors of nutrients in the watershed (USEPA 2008d). Almost 25 million homes, including about one-third of new homes and more than half of all mobile homes nationwide, depend on decentralized systems (U.S. Census Bureau 1999). It has been estimated that more than half the systems in the United States were installed more than 30 years ago. Older conventional onsite systems may not be adequate for minimizing nitrate contamination of ground water, depending on design and maintenance by homeowners. Studies reviewed by USEPA cite failure rates ranging from 10 to 20 percent (USEPA 2002b). The actual problem might be worse because system failure surveys typically do not include systems that may be designed and installed according to appropriate standards, but are currently contaminating surface or ground water with nutrients due to poor maintenance. However, nutrient contamination from septic systems is typically detectable only through site-level monitoring (USEPA 2002b).
Atmospheric Nitrogen Deposition Gaseous and particulate forms of nitrogen oxides (NOx) are emitted into the air from the burning of fossil fuels and other combustion processes. Mobile sources (e.g., vehicles) account for approximately 55 percent of NOx emissions to the atmosphere; stationary sources account for the remainder. Nationwide, the deposition of NOx compounds released to the air during fossil fuel combustion contributes significant inputs of additional nitrogen to the land and surface water (USEPA 2007c). Although atmospheric deposition is a major contributor to nitrogen loadings affecting many waterbodies, EPA lacks the statutory authority to regulate air emissions of such sources under the CWA. The Clean Air Act (CAA), however, does offer a number of options for controls on nitrogen through other regulations, as well as creative and innovative options to control greenhouse gases.
Agricultural Livestock Activities As our population grows, more food production will be required through a range of agricultural practices. Current livestock agricultural practices are one of the largest sources of nutrient pollution to our nation’s waters. Estimates of major livestock production for 2008 in the United States were as follows (USDA 2009a; USDA 2009b; USDA 2009c; USDA 2009d):
• 96 million head of cattle (including about 9.3 million head of dairy cows) • 68 million head of swine • 9 billion broilers and 446 million laying hens
The value of U.S. agricultural livestock production at the farm (estimated as the gross producer income; USDA 2009a; USDA 2009b; USDA 2009d) includes:
• Cattle and calves: $48.6 billion
August 2009 15

An Urgent Call to Action
• Hogs: $16.1 billion • Dairy (milk production): $34.8 billion • Poultry (broiler production): $23.1 billion • Poultry (egg production): $8.2 billion
In contrast to the 18 million tons of human fecal material treated annually (based on Freitas Jr. 1999; MERCK 2007) at POTWs, animal agriculture production results in the generation of more than 1 billion tons of manure each year (based on Brodie 1974; Chastain et al. 2003; USDA 2009a; USDA 2009b; USDA 2009c; USDA 2009f). This manure results in over 8 million pounds per day of nitrogen and 3 million pounds per day of phosphorus. Much of the manure is applied to farmland as organic fertilizer for crops. Some of the nutrients in this applied manure end up in harvested plant tissue, but significant portions end up in our nation’s waters.
Although evidence shows that livestock production is a leading source of nutrient pollution, significant parts of this activity nonetheless remain generally unregulated. The exception is the portion of livestock production that meets the definition of a Concentrated Animal Feeding Operation (CAFO). CAFOs are considered point sources under CWA section 502(14) and are regulated by the NPDES program if discharging or proposing to discharge (see text box). Under the current regulation at 40 CFR 122.23, CAFOs are generally described as large-scale agricultural feeding operations where animals are confined and raised in concentrated areas. There are many ways in which these operations can reduce the amount of nutrients released, such as covered storage and the use of nutrient management plans, buffers and stream fencing.
Technology-based limits for most existing Large CAFOs include the following:
• Production area: The regulations require no discharge from the production area.
• Land application: Each facility must develop and implement a nutrient management plan, analyze the nutrient content of the manure and soils, and ensure setbacks or buffers adjacent to surface waters, well heads and the like.
CAFOs are point sources under section 502(14) of the CWA. Under the current regulation at 40 CFR 122.23, CAFOs are generally described as large-scale agricultural feeding operations where animals are confined and raised in concentrated areas. An operation is defined as a Large CAFO if it confines above the threshold number of animals in a particular sector, such as 700 mature dairy cows or 1,000 beef cattle. A large broiler CAFO has 125,000 chickens, but 30,000 chickens if the facility has a system defined as a liquid manure handling system. Medium AFOs may be CAFOs either by definition (number of animals plus discharge through conveyance or stream running through facility) or designation. A small operation may be a CAFO only if it is so designated by the Regional Administrator or state permitting authority.
August 2009 16

An Urgent Call to Action
Agricultural Row Crops Row crop agriculture is also driven by the need to keep pace with our growing population. It now represents over a $120 billion industry nationally on an annual basis. The current trend of increasing row crop agriculture yields is due in part to the expanded use of livestock manure and chemical fertilizers. Table 1 shows the extent of the crop acreage for the top 10 commodities produced in 2008. Although the creation and use of chemical fertilizers and the overabundance of animal manure from expanded production has enabled contemporary farming to keep pace with the increasing population’s demands for food and fiber, the amount of nitrogen the crop plants need and use (and similarly for phosphorus) does not match the amount of nutrients applied to crops. Even when fertilizers (in the form of manure or chemical fertilizers) are applied at agronomic rates, agricultural production of crops typically has an efficiency of less than 30 percent for nitrogen (based on Galloway et al. 2003). The nutrients not used by crops can volatilize into the air, infiltrate into ground water or run off the land with stormwater. Simply put, only a fraction of the applied nitrogen and phosphorus in fertilizers is converted into and used by plants, and only a fraction of the nitrogen and phosphorus content of plants is used by humans and livestock; the excess that is applied and not used in row crop production becomes a waste product in the environment (NRC 2008b).
Table 1. Acreage, production and value of major agricultural row crops in 2008 (USDA 2009e)
Crop Acreage
(thousand acres) Production (thousand)
2008 Value ($1,000)
Corn 85,982 12,101,238 (bushels) 47,377,576 Sorghum 8,284 472,342 (bushels) 1,681,558 Barley 4,234 239,498 (bushels) 1,208,173 Oats 3,217 88,635 (bushels) 262,240 Wheat 63,147 2,499,524 (bushels) 16,568,211 Rice 2,995 203,733 (hundred wt) 3,390,666 Soybeans 75,718 2,959,174 (bushels) 27,398,638 Cotton 9,471 12,815 (bushels) 3,538,573 Hay 60,062 145,672 ( tons) 18,777,138 Total 313,110 NA 120,202,773
Nutrient pollution from row crop agricultural operations, a by-product of excess manure and chemical fertilizer application, is the source of many local and downstream adverse nutrient-related impacts. Currently, stormwater runoff and irrigation return flow from row crop agriculture are exempt from regulation under the CWA generally and the NPDES program specifically. There are many ways in which agricultural operations can reduce the amount of nutrients released from farm fields, namely, by applying nutrients at the proper rate and timing, with the appropriate application method, and in the proper form or by using cover crops.
August 2009 17

An Urgent Call to Action
IV. Tools and Authorities Existing Tools The Task Group was unanimous in its assessment that existing CWA tools have not been fully implemented to reduce nutrients. As a first step, the Task Group developed a list of tools (Appendix B) currently being used by EPA and the states to address nutrient pollution; then the Task Group analyzed the effectiveness and limitations of the tools in achieving the desired results. Appendix B contains a spreadsheet listing the full array of existing point and nonpoint source tools currently in use and explaining how well they are working. The list includes a range of traditional tools, predominantly CWA, that are either directly regulatory in nature or can form the foundation of an effective regulatory program, such as water quality standards, waterbody assessments, impairment listings, Total Maximum Daily Loads (TMDLs), national technology-based performance standards, stormwater controls and NPDES permit tools (both individual and general) that are broadly applicable to any point source but are not always fully utilized. The most commonly used tools are highlighted below, along with an analysis of why they have not been effective to date in reducing nutrient pollution and suggested ways in which they could be better utilized.
NPDES permit requirements for municipal wastewater treatment. There are over 16,500 POTWs across the country that constitute a major source of nitrogen and phosphorus to the Nation’s waterways. Most of these facilities are regulated under state NPDES permits and are currently subject to national technology-based “secondary treatment” limits on BOD, TSS and pH. They also must comply with applicable water quality standards. In terms of a targeted nutrient pollution focus, however, only a limited number of POTWs have specific numeric nutrient permit limits—4 percent with numeric limits for nitrogen and 9.9 percent with numeric limits for phosphorus—which is a reflection of the few state numeric nutrient standards in place. Although not all POTW permits may need numeric phosphorus and nitrogen limits to address water quality issues, there is a potential for more widespread use of nutrient limits in NPDES POTW permits where impaired or vulnerable waters are present. Also, the Task Group considered the use of technology-based requirements to set minimum technology-based effluent limitations for nutrients. An alternative limits- of-technology approach could incorporate the flexibility to consider the cost in combination with loadings reductions. Detailed NPDES permit language stipulating proper operation and maintenance of municipal collection systems and aggressive enforcement of this can be effective in curbing nutrient pollution from sanitary sewer overflows, exfiltration and leakage from aging infrastructure.
NPDES permit requirements for urban stormwater controls. Polluted urban stormwater runoff, a major cause of waterbody impairments, is currently regulated under the CWA section 402(p) National Stormwater Protection Program. The program’s current focus is on runoff from MS4s and 29 industrial sectors that discharge stormwater to an MS4 or to surface waters. The national stormwater program applies to medium and large MS4s that serve incorporated communities in urbanized areas with a population of over 100,000, as well as to other “small” MS4s in urbanized areas that have been specifically designated by the NPDES permitting authority. Industrial facilities and certain construction activities are covered by a range of “general permits,” and MS4s are required to adopt pollution prevention practices that prevent stormwater discharges to the “maximum extent practicable.” The national stormwater program more than doubled the universe of NPDES permittees when it was established in 1990, thereby significantly extending a pollution prevention regulatory focus to urban stormwater.
August 2009 18

An Urgent Call to Action
Section 305 Assessments and 303(d) Listings. States have listed more than 14,000 waters as impaired by nutrient-related causes under the state section 303(d) programs. Given the incomplete scope of current assessments and listings referenced in Chapter II, the full impact of nutrient impairment is larger than these figures suggest but will remain not quantified until more of the Nation’s waters can be evaluated.
TMDLs. Under CWA section 303(d), once waters are listed as impaired, TMDLs must be developed. A TMDL identifies the pollutant reductions needed from point and nonpoint sources to meet water quality standards. Once approved, TMDL allocations are implemented through NPDES permit limits for point sources and discretionary loading reduction targets for nonpoint sources. To date, more than 7,000 nutrient-related TMDLs have been developed (or about one-quarter of all TMDLs). More extensive numeric water quality standards and increased water quality assessments could lead to a larger number of section 303(d)-listed waters, resulting in additional TMDLs being developed and implemented through point source requirements. Where “reasonable assurance” exists that nonpoint sources will reduce their nutrient pollutant loadings, a state may allocate more of the needed loadings reductions to nonpoint sources, allowing for less stringent point source reductions. States have undertaken and explored different limited approaches to control nonpoint sources. Authority at the federal level for state development of effective, enforceable and transparent nonpoint source accountability is lacking.
CAFO regulations. At present, federal requirements for the management of concentrated animal feedlots apply to only a small subset of the total confined animal production in the United States. This suggests a potential for significant additional reductions in nutrient loadings if federal requirements are applied to a larger portion of animal production operations by decreasing the size threshold, regulating the offsite transport of manure and/or expanding the reach of nutrient management plans. Some states have already taken this approach.
Water quality standards. Standards define the goals for a waterbody but do not, by themselves, result in a reduction. Narrative nutrient criteria are widely used but are not easily applied. Adopting numeric nutrient water quality criteria would provide the basis for better assessment of impairments, and for NPDES permit writers to require numeric limits for point source dischargers. Numeric criteria could also be used as a tool to set nutrient capping levels for point and nonpoint sources.
Water quality trading. Programs are increasingly using water quality trading as a means to provide cost-effective reductions in nutrient loading within a watershed. This approach requires a target load or water quality standard in order to generate “credits” or have some idea of how many pounds are available for trading in a particular watershed. The process is usually implemented through an NPDES permit.
Section 319. Grant money from the CWA Section 319 Program supports a wide variety of activities, including technical assistance, financial assistance, education, training, technology transfer, demonstration projects and monitoring to assess the success of specific nonpoint source implementation projects. The program relies on watershed plans as a primary tool. The effectiveness of the program in achieving nutrient reductions depends on the comprehensiveness of the plan, the management of the grant funds, and how completely the
August 2009 19

An Urgent Call to Action
plan is implemented. As a voluntary program, the Section 319 Program relies on the commitment of watershed groups and other stakeholders to implement and maintain controls.
Farm Bill. The Farm Bill includes funding for a variety of conservation programs, including the Environmental Quality Incentives Program (EQIP). The program offers financial and technical help to assist eligible participants in installing or implementing structural and management practices on eligible agricultural land. The effectiveness of this tool will depend on the willingness of farmers to implement voluntary nutrient controls. Agriculture has been identified as a primary source of nutrients in many areas of the country; this program could help achieve the reductions needed in those areas. Current limitations of the program are that it is dependent on the willingness of farmers to install and maintain controls that will reduce nutrients and the willingness of state technical committees/county offices to distribute funds for nutrient controls.
Coordinated land application permitting. Permitted activities regarding land applications could be required to consider the total nutrient loading within a watershed.
New and Innovative Tools The Task Group identified a number of tools that are appropriate for use by national or state programs to reduce the discharge of and impacts from nutrients to our nation’s waters. In some cases, there are examples at the state level where these tools have been successfully used to control nutrients. In other cases the Task Group identified a number of tools, particularly regulatory mechanisms, that are only partially used, as well as some that are underutilized but could potentially offer state and national programs innovative ways to effectively control nutrients.
Table 2 lists the tools that the Innovative Tools and Accountability Work Groups identified. The highlighted tools in the table are the top five tools, judged by the work groups as potentially the most effective for reducing sources of nutrient pollution. Appendix C provides a complete list of the tools with descriptions and a summary of the process used by the Workgroup to evaluate and derive the list of tools as well as the top 5 recommended tools. In addition, the group identified a number of existing, but rarely or unused, regulations that can be effective in controlling nutrient pollution. Collectively, these three mechanisms (Innovative Tools Work Group, Accountability Work Group, and Task Group brainstorming) resulted in the Task Group identifying over 35 tools and authorities that could be used to address nutrient pollution impacts. The tools can be grouped into two categories: (1) incentive-based and (2) regulatory.
August 2009 20

An Urgent Call to Action
Table 2. Tools recommended by Innovative Tools and Accountability Work Groups
• Water quality trading • Detergent phosphate ban* • Protection of natural nutrient
sinks • Expand NPDES permit post-
construction requirements • Comprehensive CAFO
regulation • NPDES stormwater regulation
of smaller communities • Market based nutrient
reduction land use incentives • Control onsite wastewater
treatment systems discharge • Implement large-scale
watershed TMDL • Nutrient load reduction
strategy • Pilot studies • Volunteer monitoring • Nonpoint source regulation* • Issue nutrient limit permits
• Federally required state WQS numeric nutrient water quality criteria* • Update secondary nutrient
treatment requirements* • Adoption of a monitoring
paradigm/watershed action level for fertilizer application • Green labeling* • Develop nutrient numeric
criteria-permit limits guidance • State-established nutrient
ceiling for listings • Tracking of watershed and
TMDL implementation plans • Tsca required reduction of
phosphorus in detergent and water solubility of fertilizer • Control air deposition of
nitrogen • Tri for nutrient releases • Sip process
• Nutrient capping for point and nonpoint sources at current levels • Nutrient bioharvesting • MS4-type regulations • Corporate stewardship
program • Use of USDA EQIP funds • Watershed impervious surface
limit action levels • Agricultural waste composting • Voluntary agreements • Phased WQS for “restoration
uses” • Nutrient-focused targeted
watershed initiative EPA/USDA • Regulate point source
treatment and post-nonpoint source BMP application loading
*Voted top five most promising tools by the work groups.
The following section of the report provides a brief, descriptive summary of the tools identified by the Task Group that could be used nationally or regionally, and it offers a number of examples or points contained in the fact sheets referenced in the box. The section also provides a synthesis of the Task Group’s deliberations, which led to innovative recommendations of combinations of incentive-based and regulatory tools that national or state programs can use to control nutrients from the five main sources of nutrients (urban stormwater runoff, municipal wastewater treatment, atmospheric nitrogen deposition, agricultural livestock activities, and agricultural row crops).
Incentive-based Tools Incentive-based, nonregulatory tools comprise a variety of mechanisms to encourage the voluntary implementation of activities that promote source controls of nutrients. The use of economic incentives allows interested parties to implement measures that would otherwise be unaffordable, and these practices might eventually lead to savings in other areas (e.g., use of less water).
August 2009 21

An Urgent Call to Action
Accountability fact sheets (Appendix D) • Numeric Nutrient Criteria • Maryland BayStat Program • Florida’s Impaired Waters Rule • Economic Incentives and Disincentives • Green and Eco-Labeling of Farm Products (Based on
Farming Methods) • Voluntary Agreements with Private Sector • The Massachusetts Wetlands Protection Act • Toxic Release Inventory • Pinto Creek Decision • Virginia Watershed-based Permit • Strengthening Reasonable Assurance for TMDLs • Connecticut Nitrogen Credit Exchange Program • Dutch Nutrient Trading System • Maryland Policy for Nutrient Cap Management and
Trading • Ohio Water Quality Trading • Pennsylvania Nutrient Trading Program
• California Nonpoint Source (NPS) Program • Iowa Onsite Wastewater Loan Program • North Carolina Community Conservation Assistance
Program (CCAP) • Wisconsin’s Priority Watershed and Priority Lake
Program • CAFO/AFO Nutrient Management • California Agricultural Water Quality Grant Program • Delaware’s Nutrient Management Program • Iowa Livestock Water Quality Facilities Program • Kansas Clean Water Farms—River Friendly Farms
Project • North Carolina Agriculture Cost Share Program (ACSP) • Ohio Agriculture Pollution Abatement Program • Virginia Agricultural Stewardship Act • Wisconsin Agriculture Performance Standards • Clean Air Act: State Implementation Plans
Accountability for incentive-based tools should include transparency, public input, monitoring, regular progress reports, and consequences for failing to spend money or maintain funded practices. States can consider these components or elements of a potentially more comprehensive accountability approach that might merit further evaluation.
However, as noted in the attached fact sheets (Appendix D), some of the challenges with exclusive reliance on incentive-based tools:
• The absence of sustainable long-term funding for all projects
• Uncertain follow-up accountability and documented results
• The ability of certain nonpoint sources to simply “opt out” of voluntary programs
• Growing resistance of heavily regulated point sources to accept major increases in required loading reductions when unregulated nonpoint sources that might be contributing substantial nutrient pollution to the same watershed are not held accountable (through, for example, regulation under the CWA) for achieving comparable load reductions
The Task Group recommends consideration of the following incentive-based tools as components of programs to control nutrient pollution:
Agricultural waste composting. Unused portions of harvested crops, manure, and other organic forms of agricultural wastes are composted and recycled for their nutrient and soil additive value, rather than being wasted.
Corporate stewardship program. Provides corporations, such as food services, with an opportunity to actively participate in conservation activities by establishing continuous
August 2009 22

An Urgent Call to Action
improvement programs to reduce nutrient pollution at all levels of the food production process (farms, processors, distributors, and wholesale buyers).
Green labeling. Labeling of products from farms that are certified in the implementation of nutrient reduction practices (e.g., organic and sustainable farming practices).
Market-based nutrient reduction land-use incentives. Programs that encourage and reward effective manure management and nutrient reduction practices on farms and urban landscapes.
Nutrient bioharvesting. Harvesting nutrients in the form of algae or other aquatic plants for use in animal feed or biofuels.
Pilot studies. Innovative studies, funded through grants and performed on a small scale to determine the feasibility of application at a larger scale.
Tracking of watershed or TMDL implementation plans. Using a rigorous tracking system for watershed and TMDL implementation plans and providing regular progress reports to the public on actions completed to meet the plans’ objectives.
TRI for nutrient releases. Creating an inventory of agricultural and urban nitrogen and phosphorus “releases” or discharges (similar to the Toxics Release Inventory of industrial toxic chemicals) based on a national reporting requirement. The program would rely on the public, academic institutions and other organizations to review the data and convey what is acceptable and unacceptable.
Use of USDA EQIP funds for nutrient control projects on farms. More fully use existing grant programs and available federal dollars to directly fund implementation of best management practices and other nonpoint source management programs in vulnerable or targeted watersheds; currently, the 2009 funded USDA budget calls for about $3.2 billion in funding for conservation program payments.
Voluntary agreements. An agreement to reduce nutrient pollution, which could be made by a corporation, a farmer or a resident.
Volunteer monitoring. Local groups develop a monitoring program for a local waterbody; data can be used to track progress or identify problems associated with nutrient pollution.
Regulatory Mechanisms That Are Rarely Used The Task Group also identified a second set of potentially broader regulatory authorities that could be applied to address nutrients and, when implemented, might result in creating strong incentives for more effective cross-sector point and nonpoint nutrient control programs. In the
Financial assistance programs States have developed a variety of financial assistance programs to encourage the voluntary implementation of measures to reduce nonpoint source (NPS) pollution. Some states, including North Carolina and Ohio, provide cost-sharing for installation of best management practices to address issues such as erosion, flooding, poor drainage, stream restoration, and other water quality concerns. Kansas is among the states that offer cost-share and planning assistance for parties willing to adopt clean water farming practices in vulnerable watersheds. States such as Iowa offer loans for a variety of activities that reduce NPS pollution, including replacement of inadequate or failing septic systems by rural homeowners and preventing, minimizing, and eliminating NPS pollution from animal feeding operations by implementing best management practices. Other states, such as Wisconsin and California, offer grants focused on runoff and NPS discharges from agricultural lands, respectively. Many financial assistance programs also offer technical assistance (e.g., design assistance).
August 2009 23

An Urgent Call to Action
rarely used category, the Task Group identified a mix of CWA, CAA, and Coastal Zone Management Act authorities.
States such as Wisconsin and Massachusetts have used regulatory mechanisms to manage nutrient pollution. Massachusetts’ Wetlands Protection Act requires careful review of activities that could impact wetland and coastal areas. In Wisconsin, performance standards for agriculture, nonagricultural construction and post-construction, and development of urban areas are codified. These standards have the potential to reduce nutrient inputs to waterways.
Detergent phosphate ban. States and local governments are prohibiting the use of detergent phosphates to reduce phosphorus loadings to waters.
Protection, restoration and enhancement of natural nutrient sinks. Some areas, such as wetlands, tend to store organic matter and therefore often act as nutrient sinks. State programs can be implemented to protect these natural nutrient sinks to maintain their nutrient removal functionality.
40 CFR section 122.4(i) (CFR 2000). This regulation restricts the issuance of new point source permits in watersheds with impaired waters. This restriction applies in cases where the impairment is caused by NPDES-permitted facilities, as well as when the impairment is caused by nonpoint sources. The provisions of section 122.4(i) focus on permits for new point sources. However, its applicability in the case of nutrients will often be triggered by the combined loadings from point and nonpoint sources in a particular watershed that have caused the initial impairment. In other words, while the result of the impairment is a potential restriction on new point source discharges and potentially associated economic development, the cause and solution lie with both point and nonpoint sources and their combined ability to reduce loadings. An effective response to a section 122.4(i) challenge may lie with a State’s ability to demonstrate that it has an effective, enforceable and transparent nonpoint source program in place to assure loadings reduction from both nonpoint and point sources are being addressed.
CWA section 402(p)(6). This section authorizes EPA to establish priorities and develop “comprehensive” state stormwater management program requirements that may include
performance standards, guidance, management practices and treatment standards. This authority could be used to expand MS4-type regulations to include more nutrient controls in urban/suburban areas. It could also be used to require NPDES stormwater regulation for smaller communities, establish independent performance standards applicable within and outside existing MS4s, or to establishing best management practice standards for urban stormwater outside existing MS4s. Section 402(p) also provides authority to make “residual” designations of urban stormwater sources that are affecting water quality.
The CWA provides a number of options for protecting water quality at both the federal and state levels. States have the options of developing more stringent laws, regulations and policies to protect water quality from nonpoint source nutrient pollution impacts. The states have varying levels of regulatory authority to control nonpoint sources of nutrients. California presents the best example of broad legal authority that can address all point sources and nonpoint sources. The state authority presents a tiered system to encourage nonpoint source control implementation, with the lower tiers providing a strong regulatory program as needed. This law, the Porter-Cologne Act, has been used to protect water quality from impacts from irrigated agriculture, small animal feeding operations, and forest tracts, among other sources.
August 2009 24

An Urgent Call to Action
Antidegradation. Provisions in the current CWA regulations at 40 CFR 131.12 offer a mechanism to protect high-quality waters where existing conditions are better than necessary to support the designated use of the water. Under these provisions, states may authorize a lowering of water quality to existing uses and applicable standards “to accommodate important economic or social development” under certain conditions, including a demonstration that “all cost-effective and reasonable best management practices for nonpoint source controls” are achieved. Where nonpoint sources are not included in a common effort to reduce nutrient loadings and those best management practice controls are not in place, a state may lose its flexibility to issue permits for increased point source discharges even though, for other reasons, it might be appropriate. Thus, states may choose to consider using existing antidegradation provisions to better address nonpoint sources in addition to increasing the use of antidegradation for point sources.
CZARA section 6217. A joint program of NOAA and EPA, which distributed $200 million to grantees in 2009, requires coastal states to establish programs to control nonpoint sources of pollution that are affecting coastal and estuarine waters. These programs are required to contain enforceable policies and mechanisms, such as nutrient load reduction strategies and control plans, to ensure the implementation of management measures. As currently defined, section 6217 of the Coastal Zone Act Reauthorization Amendments (CZARA) applies only to coastal states with Coastal Zone Management Programs. EPA could withhold CWA section 319 funds where CZARA programs are not fully implemented.
CWA section 504. Section 504 grants power to the EPA Administrator “upon receipt of evidence that a pollution source… may bring suit on behalf of the United States in the appropriate district court to immediately restrain any person causing or contributing to the alleged pollution to stop the discharge of pollutants causing or contributing to such pollution or to take such action as may be necessary.” The section provides the Agency an option to reduce nutrient pollution in the areas that are exempt from the CWA, such as agricultural stormwater.
SIP process. The development and submittal of a state implementation plan that provides for implementation, maintenance and enforcement of National Ambient Air Quality Standards for NOx could reflect implementation of more stringent nutrient control strategies.
Control of air deposition of nitrogen. Emissions into the air from vehicles, industries, power plants, dry cleaners, gas-powered lawn tools and other emission sources are major sources of nitrogen in waterbodies that can be controlled to reduce air deposition problems downwind.
TSCA-required reduction of phosphorus in detergent and water solubility of fertilizer. The Toxic Substances Control Act (TSCA) was enacted to ensure that chemicals manufactured, imported, processed, or distributed in commerce, or used or disposed of in the United States, do not pose any unreasonable risks to human health or the environment. TSCA could be applied to detergent manufacturers to require reduced phosphorus levels in detergents and in the manufacturing of fertilizers to reduce water solubility of nutrients after application.
CWA section 303(d) assessments. Current ecoregional numeric nutrient water quality criteria recommendations could be used as numeric benchmarks to facilitate section 303(d) assessments of waters as impaired.
August 2009 25

An Urgent Call to Action
Examples of Innovative Tools Applied to Sources of Nutrients The following are examples of innovative uses of the incentive-based and regulatory approaches outlined above to control nutrients. They are presented for the five sources of nutrients: urban stormwater, POTWs, air deposition, agricultural livestock, and agricultural row crops.
Urban Stormwater EPA has recently begun to act to strengthen and add tools to the policies and regulations that allow for controls of nutrient pollution from urban stormwater. EPA is finalizing the Construction Storm Water Effluent Guideline. Development of a Post-Construction Storm Water Rule to complement these new controls would make a significant impact on urban stormwater pollution prevention practices. In addition, section 438 of the Energy Security Independence Act (EISA) requires all new development on federal lands to adhere to strict stormwater guidelines, which are currently being developed. Although there are many tools in place through the point source provisions in the CWA, EPA has clear opportunities to expand existing regulations to reduce the nutrient impacts from urban stormwater on the Nation’s water quality.
• Expand some of NPDES MS4-type stormwater regulations to communities at a smaller size than those addressed by the current regulations, either by using residual designation authority or by creating a new “Phase III” under CWA section 402. This option could exempt any community that has a program and authorities in place to ensure that all new development activity maintains an effective impervious cover below a particular threshold, protect drinking water sources, and establish turf fertilizer limits.
• Initiate an aggressive policy to use CWA section 402(p)(2)(E) to regulate stormwater discharges causing or contributing to nutrient-related impairments of water quality standards or “significantly contributing” nutrient pollution to waters of the United States.
• Expand the use of stormwater residual designation authority to reach currently unregulated sources of nutrients.
• Consider clarifying that the CWA agricultural stormwater exemption applies only where agriculture is consistent with sustainable agricultural practices (e.g., fertilizer application no greater than agronomic rates).
• Implement nutrient capping to regulate growth and development (e.g., cap nonpoint source and point source at current (2010) load).
• Protect natural nutrient sinks.
Municipal Wastewater Treatment
• Consider redefining the secondary treatment requirement for wastewater treatment plants to include nitrogen and phosphorus by adding them to the list of pollutants that require technology-based effluent limits.
August 2009 26

An Urgent Call to Action
• Require all municipal wastewater treatment facilities to monitor nitrogen and phosphorus effluent levels.
• Provide guidance on specific nitrogen and phosphorus reduction technologies that can meet the technology-based requirement to promote broad-scale implementation of available and economically achievable technologies to encourage facilities to upgrade.
• Provide economic incentives (such as grants and low-interest loans) for implementing new nutrient control technologies.
• Require better management of biosolids applications, ensuring that they are consistent with the agronomic rates for the land to which they are applied, and reduce runoff or volatilization of unincorporated nutrients. This could include expanding the agronomic rate restriction for nitrogen to phosphorus in the CWA section 503 biosolids program.
• Investigate and control improperly surface-discharging wastewater treatment systems (onsite or septic systems).
• Explore the use of section 6 of TSCA to require reformulation of detergents to reduce phosphorus.
• Encourage broader adoption of nutrient trading programs, such as point source-to-point source trading, including guidance on the costs and how to ensure transparency.
Atmospheric Nitrogen Deposition
• Maximize projected reductions through a new Clean Interstate Air Rule (CAIR).
• Leverage air quality programs to decrease air deposition of nitrogen by using opportunities to replicate and implement existing air quality programs and regulations to the benefit of water quality.
• Ensure that existing air regulatory authorities and programs, such as the National Ambient Air Quality Standards, fully take into account and ultimately reduce nitrogen deposition to water.
• Encourage trading between air sources of nitrogen and POTW or nonpoint source reductions.
Agricultural Livestock Activities
• Establish a lower regulatory size threshold for AFOs under section 402(p)(6) of the CWA, or multiple AFOs in impaired watersheds that are determined to collectively contribute to water quality impairments.
August 2009 27

An Urgent Call to Action
• Initiate a comprehensive data collection program authorized by section 308 of the CWA in an effort to demonstrate that all CAFOs discharge and thereby all CAFOs must apply for NPDES permits.
• Inspect more AFOs to determine which might be significant contributors of nutrient pollution to waters of the United States, warranting designation of the AFO as a CAFO under 40 CFR 122.23(c). (This could be done through case-by-case designations and/or enforcement actions.)
• Require more liquid manure and process wastewater storage capacity, and covered storage of solid manure, in those areas where there is a need to better protect water quality standards.
• Include controls to protect ground water through permits in source water protection areas.
• Subsidize transportation to remove land-applied nutrients to where they can be of beneficial use.
• Develop markets for easily transportable fertilizer pellets made from litter.
• Work with USDA to expand the number of certified technical service providers to help farmers develop and implement nutrient management plans.
• Work with states to develop projects that encourage the use the manure as a source of fuel to reduce the amount of nutrients that are land applied, redistributing nutrient concentrations.
• Work with state transportation departments to obtain manure from CAFOs so that it can be applied, at agronomic rates, during high landscaping.
Agricultural Row Crops
• Explore the use of CWA section 402 to determine point source application when fertilizer, manure or another water-based row crop application is applied in excess of agronomic rates near or overlapping a water of the United States.
• Place additional requirements on states to ensure that CWA section 319 funding is used to implement sound watershed plans with reasonable assurance that the nonpoint sources will be reduced.
• Explore the use of section 6 of TSCA to require reformulation of fertilizers from highly water-soluble formulations to less water-soluble formulations.
• Adopt a monitoring paradigm or watershed action level for fertilizer application (based on the Atrazine example for pesticides).
August 2009 28

An Urgent Call to Action
• Increase accountability among the fertilizer user community by establishing a registration process leading to monitoring and reporting on a watershed level.
• Work with large food and beverage companies, integrators and/or distributors (or other market intermediaries who have a direct purchasing relationship with producers) to develop practice standards and processes for the producers that supply them.
• Develop a system for voluntary monitoring and provide an incentive for responsible fertilizer use tailored to agronomic rates, growing season limitations, runoff timing, and watershed sensitivity.
• Work with third parties to establish independent certification programs and to develop economic incentives based on them.
• Explore famers selling credits based on reduced fertilizer use.
• Require or provide heavy incentives to place constructed wetlands or bioreactors at tile drain outlets.
Summary The following chart presents more detailed examples of the specific tools that were analyzed by the Task Group.
August 2009 29

An Urgent Call to Action
Existing but currently underutilized tools
Possible expansion of current tools either geographically or to include more sources
Regulatory
Drinking water regulations Safe Drinking Water Act section 1438 emergency response authority
CAFO regulations
Apply to smaller AFOs Water quality-based residual AFO designations Broader manure management controls Technology-based nitrogen and phosphorus limits
Municipal wastewater NPDES permits
Numeric nutrient standards to support nitrogen and phosphorus limits
Urban stormwater MS4s Finalize active construction effluent limitation guidelines Use section 402(p)(6) to address post-construction outside MS4s Define MEP to address post-construction
State numeric nutrient criteria (only 7 states have statewide and 18 have
partial)
More states to develop to protect vulnerable waters and address downstream impacts
Implementation of narrative standards in permits
EPA determinations to establish numeric standards in response to litigation
Technology-based requirements EPA finding that new and revised standards not necessary because transparent, effective and enforceable NPS state program in place
TMDLs Enhanced guidance on reasonable assurance
State NPS programs Accountability for nonpoint sources State programs that are comprehensive and locally enforceable
Non-municipal NPDES permits
Read 40 CFR 122.4(i) to ban new discharges to impaired waters unless transparent, enforceable NPS program in place 131.12(a) ban on new discharges to high-quality waters unless ”all cost-effective and reasonable best management practices for nonpoint source control” are in place New permits must ensure compliance with downstream standards
State water quality standards Must ensure compliance with downstream standards Section 504
Nonregulatory: Policy and Program Expand CZARA-like program nationally
Incentive
Funding Enhance and target section 319 watershed planning and implementation in states Better targeting of USDA funding
Corporate Stewardship Engage major food corporations in sustainability efforts for suppliers
August 2009 30

An Urgent Call to Action
V. Task Group Findings and Call to Action State and EPA drinking water and surface water quality program directors agree that the current national approach to controlling nutrients will not result in adequate water quality protections. We are losing ground in addressing existing sources of nitrogen and phosphorus pollution. Although certain federal and state programs have made some progress in reducing nutrient impacts, without a comprehensive approach that holds all sectors accountable, population growth will lead to an expansion of our nutrient pollution concerns. More specifically, we know that absent a change in our current approach, nutrient loadings and resulting impacts will grow sharply over the next 40 years as a result of increased urbanization, expanded agriculture, demand for energy, and need for increased transportation. In light of these facts, the Task Group’s key findings are outlined below.
• The nutrient pollution problem is nationally significant, expanding, and likely to substantially accelerate.
• Existing efforts are not succeeding at improving water quality.
• Knowledge, collaboration and financial incentives will fail without a common framework of responsibility and accountability for all point and nonpoint sources.
• TMDL implementation, while an effective tool for point sources, has not been able to fully address the larger problem of nonpoint sources.
• Current tools such as numeric nutrient criteria, water quality assessments and listings, urban stormwater controls, POTW nutrient limits, and animal feedlot controls are underused and poorly coordinated.
• Other broadly applicable tools, such as CZARA, antidegradation, 40 CFR part 122.4 limitations on discharges to impaired waters, and compliance with downstream water quality standards, are rarely used.
• Current regulations disproportionately address certain sources (e.g., municipal sewage treatment) at the exclusion of others (e.g., row crop agriculture).
• Uneven responsibility between point and nonpoint sources continues to be a major barrier to coordinated and collaborative multi-sector partnerships.
• Specific aspects of state nonpoint source programs have been highly successful in addressing individual sources of nutrients, but their broader application has been undercut by the absence of a common multistate framework of mandatory point and nonpoint source accountability within and across watersheds.
The evidence presented and referenced in this Task Group report clearly indicates that nitrogen and phosphorus pollution is widespread and significant. Increased public health risks and treatment costs from contamination of drinking water supplies is a major concern. Almost 50 percent of our nation’s smaller streams have elevated levels of nitrogen and phosphorus. Over
August 2009 31

An Urgent Call to Action
2 million acres of lakes and reservoirs across the country are impaired and not meeting water quality standards due to excess nutrients. A startling 78 percent of the assessed continental U.S. coastal area exhibits symptoms of eutrophication. And, as the sidebar illustrates, the numerous impacts from this pollution are well documented and severe.
The impacts of nutrient pollution • Disinfection by-product and
methemoglobinemia (blue baby syndrome) • Co-occurring contaminants (pathogens,
pesticides, industrial chemicals) • Toxic algal blooms (neuro-toxins, paralytic,
and diarrhetic effects) • Increased treatment costs • Recreation and tourism economic impacts • Widespread water quality impairments • Low dissolved oxygen levels
(hypoxia/anoxia) • Decreased species diversity and increased
species vulnerability • Significant habitat loss (seagrasses and
submerged aquatic vegetation)
The costs of these impacts across the country have not been comprehensively estimated, but there are some powerful and cautionary examples. The Chesapeake Bay is a national model of research, information collection, analysis, voluntary partnerships, stakeholder involvement, extensive outreach and collaboration, and a collective investment of over $10 billion that, to-date, has achieved only about 27 percent of the water quality standards targets for dissolved oxygen, water clarity and chlorophyll a. The estimated remaining cost of restoration for the Chesapeake Bay exceeds $28 billion.
The high cost of nutrient pollution • $28 billion to restore Chesapeake Bay
health • $1.2 billion in 2001 for lost fishing and
boating revenues • $15 million for Fremont, Ohio, for
nutrient control • $4 million for Des Moines for drinking
water taste and odor • $280,000 for a community of 500 to install
ion exchange to treat nitrate contamination
The Gulf of Mexico hypoxic zone surpasses that of the Chesapeake Bay by several orders of magnitude, and it continues to grow. It represents a comparable undertaking of investments in research, analysis of new information, multistate alliances, action plan development, local/state/federal partnerships, local and regional pilots, targeted resources, and financial incentives. And yet, to date, extensive analysis of state and basin-wide data document a picture of water quality progress in reverse (NRC 2008a; USEPA 2007c). Unlike the Chesapeake Bay, the cost to restore and recover the lost and damaged aquatic resources adversely affected by nutrient pollution from the Mississippi Basin has not yet been fully calculated.
The magnitude of these regional impacts is formidable but does not include comparable examples from Puget Sound, Casco Bay, portions of the Great Lakes, and literally thousands of lakes and reservoirs across the country in combination with hundreds of other coastal areas and numerous river and stream segments. Bringing the focus closer to home in a context less widely appreciated or understood is the challenge and dilemma facing individual communities. For a community whose water supply is contaminated with nitrates requiring new treatment or a town whose tourism, fishing or recreational economic base has been impacted, the consequences can be even more severe.
It should not go unstated that application of both regulatory and incentive-based tools will have associated costs if they are to be implemented effectively. Costs to dischargers of excess nutrients will increase as the dischargers implement controls, and costs to state agencies to implement, monitor and enforce controls will also expand unless other water programs are dropped or decreased. Those implementation costs, however, are expected to be dwarfed by the benefits attained from reduced health care costs, reduced drinking water treatment costs,
August 2009 32

An Urgent Call to Action
increased recreational opportunities, increased property values, increased abundance and diversity of fish and shellfish, and higher quality water for agricultural and industrial uses.
Although there is no single tool for achieving reduced nutrient loadings to our ground water and surface waters, significantly more can be done by integrating and more fully utilizing existing tools; implementing new, innovative approaches to create common frameworks of accountability, both nonregulatory and regulatory; and expanding the application of existing general authorities while exploring the availability of additional authority.
The major sources of nitrogen and phosphorus are well understood. But the application of a combination of new and existing tools that could apply to all sources is less well recognized, and the existing architecture to ensure common accountability between sources has rarely been emphasized. The Task Group believes that a coordinated and innovative synthesis of existing regulatory authorities and voluntary tools must be used across all sources and sectors of nutrient pollution. To address these needs, the Task Group makes these primary recommendations:
• Fuller utilization of existing point source tools; some tools are being only partially used, and others could be expanded in scope.
• A national framework of accountability for nonpoint sources is necessary to make a significant and essential difference, without which long-term success is doubtful.
• Broader reliance on incentives, trading and corporate stewardship—but only within a multistate framework of public transparency, common responsibility, and both point and nonpoint source accountability for meeting water quality and drinking water goals.
CALL TO ACTION All major sources of nutrients must be held accountable for their contributions to the problem. The valid and growing perception that nutrient reduction burdens are not equitably shared or cost-effectively managed across all sources or between upstream and downstream contributors is a major barrier to accelerating progress. There is growing reluctance and resistance on the part of highly regulated entities and downstream users to pay for increasingly expensive loading reductions, even where necessary and possible, when upstream sources are not held responsible for their own nutrient contributions to the same watershed. Combating the challenge of widespread nutrient pollution will require a renewed emphasis on prevention and a profound change in how we share accountability and responsibility between sources, within watersheds, and across state lines.
The Nutrient Innovations Task Group believes that national leadership is vital to supporting and requiring a more consistent and full utilization of existing tools from state to state and source to source. Establishing a cross-state, enforceable framework of responsibility and accountability for all point and nonpoint pollution sources is central to ensuring balanced and equitable upstream and downstream environmental protection. It is also essential to strengthening the ability of any single state to demand environmental accountability without jeopardizing the loss of economic activity that might shift to another state with less rigorous standards. Establishing a national
August 2009 33

An Urgent Call to Action
framework of accountability that includes nonpoint sources would create a level playing field of responsibility for all sources to reduce nutrient loadings. Continuing the status quo, on the other hand, will ensure increasingly degraded ecosystems, lost aquatic habitat and species diversity, abandonment of water quality standards in vulnerable watersheds, increased drinking water risks, and the greater future costs associated with lost economic opportunity, vanishing recreational resources, and increased treatment, recovery and restoration.
At the end of the day, innovation in the context of nutrient pollution means:
• Acting on what we know
• Fully using the tools we have
• Exploring new authorities that we need
• Demanding of each other, from the local to national levels, stronger, multi-sector cross-state engagement and support for a shared commitment to environmental protection, public health, and shared economic opportunities.
In short, urgent action is needed.
August 2009 34

An Urgent Call to Action
References Anderson, D.M., P. Hoagland, Y. Kaoru, and A.W. White. 2000. Estimated Annual Economic Impacts from Harmful Algal Blooms (HABs) in the United States. Technical Report WHOI-2000-11. Woods Hole Oceanographic Institute, Woods Hole, MA.
Boesch, D.F. 1999. Causes and Consequences of Nutrient Overenrichement of Coastal Waters. In Proceedings of 24th Annual Seminar on World Planetary Emergencies, Erice, Italy.
Bricker, S., B. Longstaff, W. Dennison, A. Jones, K. Biocourt, C. Wicks, and J. Woerner. 2007. Effects of Nutrient Enrichment in the Nation’s Estuaries: A Decade of Change. NOAA Coastal Ocean Program Decision Analysis Series No. 26. National Centers for Coastal Ocean Science, Silver Spring, MD.
Brodie, H.L. 1974. Manure Production from Livestock. Biological Resources Engineering Facts No. 66. University of Maryland, Department of Biological Resources Engineering, College Park, MD.
Campbell, D.E. 2004. Evaluation and emergy analysis of the Cobscook Bay ecosystem. Northeastern Naturalist 11(2):355–424.
Carmichael, W.W. 2000. Assessment of Blue-Green Algal Toxins in Raw and Finished Drinking Water. AWWA Research Foundation, Denver, CO.
Chastain, J.P., J.J. Camberato, and P. Skewes. 2003. Chapter 3b: Poultry Manure Production and Nutrient Content. Clemson University Extension, South Carolina Confined Animal Manure Managers Certification Program: Poultry, Clemson, SC.
Chesapeake Bay Program. 2009a. 2009 State of the Chesapeake Bay Program. http://archive.chesapeakebay.net/pressrelease/EC_2009_stateofprogram.pdf. Accessed July, 2009.
Chesapeake Bay Program. 2009b. Underwater Bay Grasses. http://www.chesapeakebay.net/baygrasses.aspx?menuitem=14621. Accessed July, 2009.
Chesapeake Bay Program. 2008. Facts and Figures. http://www.chesapeakebay.net/factsandfigures.aspx?menuitem=14582. Accessed July, 2009.
CFR. 2000. 40 CFR 122.4: Prohibitions. Code of Federal Regulations, Washington, DC. http://cfr.vlex.com/vid/122-4-prohibitions-applicable-npdes-see-123-19812650. Accessed July, 2009.
DeSimone, L.A. 2009. Quality of Water from Domestic Wells in Principal Aquifers of the United States, 1991-2004. U.S. Geological Survey Scientific Investigations Report 2008-5227. U.S. Geological Survey, National Water-Quality Assessment Program, Reston, VA.
Diaz, R.J., and R. Rosenberg. 2008. Spreading dead zones and consequences for marine ecosystems. Science 321:926–929.
August 2009 35

An Urgent Call to Action
Dodds, W.K., W.W. Bouska, J.L. Eitzmann, T.J. Pilger, K.L. Pitts, A.J. Riley, J.T. Schloesser, and D.J. Thornbrugh. 2009. Eutrophication of U.S. freshwaters: analysis of potential economic damages. Environmental Science and Technology 43(1):12–19.
Doering, O.C., F. Diaz-Hermelo, C. Howard, R. Heimlich, F. Hitzhusen, R. Kazmierczak, J. Lee, L. Libby, W. Milon, T. Prato, and M. Ribaudo. 1999. Evaluation of the Economic Costs and Benefits of Methods for Reducing Nutrient Loads to the Gulf of Mexico. Decision Analysis Series No. 20. National Oceanic and Atmospheric Administration, Coastal Ocean Program, Silver Spring, MD.
Engle, V.D., J.C. Kurtz, L.M. Smith, C. Chancy, and P. Bourgeois. 2007. A classification of U.S. estuaries based on physical and hydrologic attributes. Environmental Monitoring and Assessment 129:397–412.
Falconer, I.R. 1999. An Overview of problems caused by toxic blue-green algae (cyanobacteria) in drinking and recreational water. Environmental Toxicology and Water Quality 14(1):5–12.
Facloner, I.R., M.D. Burch, D.A. Steffensen, M. Choice, and O.R. Coverdale. 1994. Toxicity of the blue-green alga (cyanobacterium) Microcystis aeruginosa in drinking water to growing pigs, as an animal model for human injury and risk assessment. Environmental Toxicology and Water Quality 9(2):131–139.
FDEP. 2009. Florida Watersheds and River Basins Map. Florida Department of Environmental Protection, Water Resource Management and Environmental Assessment and Restoration, Tallahassee, FL. http://www.protectingourwater.org/watersheds/map/. Accessed April, 2009.
FDEP. 2001. Seagrass Management Plan for Big Lagoon and Santa Rosa Sound. Florida Department of Environmental Protection, Ecosystem Restoration Section, Pensacola, Florida.
Focazio, M.J., D.W. Kolpin, K.K. Barnes, E.T. Furlong, M.T. Meyer, S.D. Zaugg, L.B. Barber, and M.E.Thurman. 2008. A national reconnaissance for pharmaceuticals and other organic wastewater contaminants in the United States II: Untreated drinking water sources. Science of the Total Environment 402(2-3):201–216.
Freitas Jr. R.A. 1999. Nanomedicine, Volume I: Basic Capabilities. Landes Bioscience, Georgetown, TX.
Galloway, J.N., J.D. Aber, J.W. Erisman, S.P. Seitzinger, R.W. Howarth, E.B. Cowling, and B.J. Cosby. 2003. The nitrogen cascade. BioScience 53(4):341–356.
GulfBase. 2009. Bays and Estuaries. http://www.gulfbase.org/bay/. Accessed April, 2009.
Jones, C.S., D. Hill, and G. Brand. 2007. Use a multifaceted approach to manage high source-water nitrate. Opflow 2007 (June) 20–22.
Khera, R. 2009. Email from Rajiv Khera, U.S. EPA, to John Hochheimer, Tetra Tech, Inc., regarding anion exchange treatment cost for nitrate removal.
August 2009 36

An Urgent Call to Action
Lake Erie LaMP Workgroup. 2008a. Lake Erie LaMP Section 2: Overview. Lake Erie LaMP Management Committee, Lake Erie LaMP Workgroup.
Lake Erie LaMP Workgroup. 2008b. Lake Erie LaMP Section 11: Significant Ongoing and Emerging Issues. Lake Erie LaMP Management Committee, Lake Erie LaMP Workgroup.
LCC. 2009a. Phosphorus Pollution. Lake Champlain Committee, Burlington, VT. http://www.lakechamplaincommittee.org/lcc-at-work/phosphorus-pollution-in-lake/. Accessed June, 2009.
LCC. 2009b. Blue-Green Algae. Lake Champlain Committee, Burlington, VT. http://www.lakechamplaincommittee.org/lcc-at-work/algae-in-lake/. Accessed June, 2009.
LCLT. 2009. Phosphorus and Lake Champlain. Lake Champlain Land Trust, Burlington, VT. http://www.lclt.org/Phosphorus.htm. Accessed June, 2009.
Malmquist, D. 2008. VIMS: “Dead zones” continue to spread. The College of William and Mary, Virginia Institute of Marine Science, Williamsburg, VA. http://www.wm.edu/news/stories/2008/vims-study-shows-continued-spread-of-dead-zones-0814.php. Accessed July, 2009.
MEOEEA. 2009. Boston Harbor Watershed. Massachusetts Executive Office of Energy and Environmental Affairs, Boston, MA. http://www.mass.gov/?pageID=eoeeaterminal&L=4&L0=Home&L1=Air%2c+Water+%26+Climat e+Change&L2=Preserving+Water+Resources&L3=Massachusetts+Watersheds&sid=Eoeea&b=te rminalcontent&f=eea_water_bostonharbor&csid=Eoeea. Accessed April, 2009.
MERCK. 2007. Diarrhea. The Merck Manuals: Online Medical Library. http://www.merck.com/mmpe/sec02/ch008/ch008c.html?qt=diarrhea%20constipation&alt=sh. Accessed July, 2009.
Mississippi River/Gulf of Mexico Watershed Nutrient Task Force. 2008. Gulf Hypoxia Action Plan 2008 for Reducing, Mitigating, and Controlling Hypoxia in the Northern Gulf of Mexico and Improving Water Quality in the Mississippi River Basin. Washington, DC.
Moershel, Philip, Oklahoma Water Resources Board (OWRB) and Mark Derischweiler, Oklahoma Department of Environmental Quality (ODEQ). 2009. Personal Communication.
Mueller, D.K., and D.R. Halsel. 1996. Nutrients in the Nation’s Waters–Too Much of a Good Thing? U.S. Geological Survey Circular 1136. U.S. Geological Survey, National Water-Quality Assessment Program, Reston, VA.
Nebraska DEQ. 2009. 2008 Nebraska Water Monitoring Programs Report. Nebraska Department of Environmental Quality, Water Quality Division, Lincoln, NE.
Nelson, A.C. 2004. Toward a New Metropolis: The Opportunity to Rebuild America. The Brookings Institution, Metropolitan Policy Program, Washington, DC.
August 2009 37
An Urgent Call to Action
Neuse River Education Team. 2009. General Information on the Neuse River Basin. http://www.neuse.ncsu.edu/geninfo.htm. Accessed April, 2009.
Nielsen, R. 2005. Can We Feed the World? Is there a Nitrogen Limit of Food Production? http://home.iprimus.com.au/nielsens/nitrogen.html. Accessed July, 2009.
NOAA. 2009. Harmful Algal Blooms. National Oceanic and Atmospheric Administration, Silver Spring, MD. http://oceanservice.noaa.gov/topics/coasts/hab/. Accessed April, 2009.
NRC. 2008a. Mississippi River Water Quality and the Clean Water Act: Progress, Challenges, and Opportunities. National Research Council, Committee on the Mississippi River and Clean Water Act, The National Academies Press, Washington, DC.
NRC. 2008b. Urban Stormwater Management in the United States. National Research Council, Committee on Reducing Stormwater Discharge Contributions to Water Pollution, The National Academies Press, Washington, DC.
NSTC. 2003. An Assessment of Coastal Hypoxia and Eutrophication in U.S. Waters. National Science and Technology Council, Committee on Environment and Natural Resources, Washington, DC. http://coastalscience.noaa.gov/documents/hypoxia.pdf. Accessed July, 2009.
Ohio EPA. 2009. Grand Lake St. Marys Toxic Algae- June 2009. Ohio Environmental Protection Agency, Columbus, OH. http://www.epa.state.oh.us/pic/glsm_algae.aspx. Accessed June, 2009.
Selman, M., S. Greenhalgh, R. Diaz, and Z. Sugg. 2008. Eutrophication and Hypoxia in Coastal Areas: A Global Assessment of the State of Knowledge. WRI Policy Note No. 1. World Resources Institute, Washington, DC.
Taft, Jim, Association of State Drinking Water Administrators (ASDWA). 2009. Personal Communication.
Tippett, J.P., and R.C. Dodd. 1995. Cost-Effectiveness of Agricultural BMPs for Nutrient Reduction in the Tar-Pamlico River Basin. NWQEP Notes, No. 72. North Carolina State University, North Carolina Cooperative Extension Service, Raleigh, NC. http://www.bae.ncsu.edu/programs/extension/wqg/issues/72.html. Accessed July, 2009.
Tomasko, D.A., C.A. Corbett, H.S. Greening, and G.E. Raulerson. 2005. Spatial and temporal variation in seagrass coverage in Southwest Florida: assessing the relative effects of anthropogenic nutrient load reductions and rainfall in four contiguous estuaries. Marine Pollution Bulletin 50:797–805.
USACE. 2004. The Mississippi River and Tributaries Project. U.S. Army Corps of Engineers, New Orleans District, New Orleans, LA. http://www.mvn.usace.army.mil/pao/bro/misstrib.htm. Accessed April, 2009.
U.S. Census Bureau. 2009. People Quick Facts. U.S. Census Bureau, Washington, DC. http://quickfacts.census.gov/qfd/states/00000.html. Accessed June, 2009.
August 2009 38

An Urgent Call to Action
U.S. Census Bureau. 2008. Table 1. Projections of the Population and Components of Change for the United States: 2010 to 2050. NP2008-T1. U.S. Census Bureau, Washington, DC.
U.S. Census Bureau. 1999. Historical National Population Estimates: July 1, 1900 to July 1, 1999. U.S. Census Bureau, Washington, DC. http://www.census.gov/popest/archives/1990s/popclockest.txt. Accessed June, 2009.
U.S. Census Bureau. 1952. Census of Population: 1950, Volume I: Number of Inhabitants. 993440-52-4. U.S. Census Bureau, Washington, DC.
USDA. 2009a. Meat Animals Production, Disposition, and Income: 2008 Summary. Mt An 1-1 (09). U.S. Department of Agriculture, National Agricultural Statistics Service, Washington, DC.
USDA. 2009b. Poultry – Production and Value: 2008 Summary. Pou 3-1 (09). U.S. Department of Agriculture, National Agricultural Statistics Service, Washington, DC.
USDA. 2009c. Chickens and Eggs: 2008 Summary. Pou 2-4 (09). U.S. Department of Agriculture, National Agricultural Statistics Service, Washington, DC.
USDA. 2009d. Milk Production, Disposition, and Income: 2008 Summary. Da 1-2 (09). U.S. Department of Agriculture, National Agricultural Statistics Service, Washington, DC.
USDA. 2009e. Data and Statistics. U.S. Department of Agriculture, National Agricultural Statistics Service, Washington, DC. http://www.nass.usda.gov/Data_and_Statistics/Quick_Stats/. Accessed July, 2009.
USDA. 2009f. Manure Use for Fertilizer and for Energy: Report to Congress. U.S. Department of Agriculture, Economic Research Service, Washington, DC.
USDA. 2008. Development and Evaluation of Biological Treatment Systems for Animal Manure. U.S. Department of Agriculture, Agricultural Research Service, Washington, DC. http://www.ars.usda.gov/research/projects/projects.htm?ACCN_NO=408114. Accessed July, 2009.
USEPA 2009a. Reactive Nitrogen in the United States: An Analysis of Inputs, Flows, Consequences, and Management Options, June 22, 2009 Draft. U.S. Environmental Protection Agency, Washington, DC.
USEPA. 2009b. Drinking Water Contaminants. U.S. Environmental Protection Agency, Washington, DC. http://www.epa.gov/safewater/hfacts.html. Accessed June, 2009.
USEPA. 2009c. National Summary of State Information. U.S. Environmental Protection Agency, Washington, DC. http://iaspub.epa.gov/waters10/attains_nation_cy.control. Accessed June, 2009.
USEPA. 2009d. Public Drinking Water Systems: Facts and Figures. U.S. Environmental Protection Agency, Office of Ground Water and Drinking Water, Washington, DC. http://www.epa.gov/safewater/pws/factoids.html. Accessed July, 2009.
August 2009 39

An Urgent Call to Action
USEPA. 2009e. Permit Compliance System (PCS). Retrieved April, 2009. U.S. Environmental Protection Agency, Washington, DC.
USEPA. 2009f. NEP Profiles. U.S. Environmental Protection Agency, National Estuary Program, Washington, DC. http://www.epa.gov/owow/estuaries/profiles.html. Accessed April, 2009.
USEPA. 2008a. National Coastal Condition Report III. EPA 842-R-08-002. U.S. Environmental Protection Agency, Washington, DC.
USEPA. 2008b. FACTOIDS: Drinking Water and Ground Water Statistics for 2008. EPA 816-K-08-004. U.S. Environmental Protection Agency, Washington, DC.
USEPA. 2008c. Clean Watersheds Needs Survey 2004 Report to Congress. U.S. Environmental Protection Agency, Washington, DC.
USEPA. 2008d. Septic Systems Fact Sheet. EPA 832-F-08-057. U.S. Environmental Protection Agency, Office of Wastewater Management, Washington, DC.
USEPA. 2008e. Municipal Nutrient Removal Technologies Reference Document. EPA 832-R-08-006. U.S. Environmental Protection Agency, Office of Wastewater Management, Washington, DC.
USEPA. 2007a. FACTOIDS: Drinking Water and Ground Water Statistics for 2007. EPA 816-K-07-004. U.S. Environmental Protection Agency, Washington, DC.
USEPA. 2007b. Dissolved Oxygen Depletion in Lake Erie. U.S. Environmental Protection Agency, Washington, DC. http://epa.gov/greatlakes/glindicators/water/oxygenb.html. Accessed June, 2009.
USEPA. 2007c. Hypoxia in the Northern Gulf of Mexico: An Update by the EPA Science Advisory Board. EPA-SAB-08-003. U.S. Environmental Protection Agency, Washington, DC.
USEPA. 2006a. FACTOIDS: Drinking Water and Ground Water Statistics for 2006. EPA 816-K-06-012. U.S. Environmental Protection Agency, Washington, DC.
USEPA. 2006b. Wadeable Streams Assessment. EPA 841-B-06-002. U.S. Environmental Protection Agency, Washington, DC.
USEPA. 2005a. FACTOIDS: Drinking Water and Ground Water Statistics for 2005. EPA 816-K-03-001. U.S. Environmental Protection Agency, Washington, DC.
USEPA. 2005b. Fact Sheet: Stage 2 Disinfectants and Disinfection Byproducts Rule. EPA 815-F-05-003. U.S. Environmental Protection Agency, Washington, DC.
USEPA. 2004. FACTOIDS: Drinking Water and Ground Water Statistics for 2004. EPA 816-K-05-001. U.S. Environmental Protection Agency, Washington, DC.
August 2009 40

An Urgent Call to Action
USEPA. 2003. FACTOIDS: Drinking Water and Ground Water Statistics for 2003. EPA 816-K-03-001. U.S. Environmental Protection Agency, Washington, DC.
USEPA. 2002a. FACTOIDS: Drinking Water and Ground Water Statistics for 2002. EPA 816-K-03-004. U.S. Environmental Protection Agency, Washington, DC.
USEPA. 2002b. Onsite Wastewater Treatment Systems Manual. EPA 625-R-00-008. U.S. Environmental Protection Agency, Office of Research and Development, Washington, DC.
USEPA. 2001. FACTOIDS: Drinking Water and Ground Water Statistics for 2001. EPA 816-K-02-004. U.S. Environmental Protection Agency, Washington, DC.
USEPA. 2000. FACTOIDS: Drinking Water and Ground Water Statistics for 2000. EPA 816-K-01-004. U.S. Environmental Protection Agency, Washington, DC.
USEPA. 1999. EPA Safe Drinking Water Information System Factoids: FY1999 Inventory Data. U.S. Environmental Protection Agency, Washington, DC.
USEPA. 1998. IMB SDWIS/FED Factoids: FY1998 Inventory Data. U.S. Environmental Protection Agency, Washington, DC.
USFWS. 1997. Significant Habitats and Habitat Complexes of the New York Bight Watershed. U.S. Fish and Wildlife Service, Southern New England – New York Bight Coastal Ecosystems Program, Charlestown, RI.
USFWS. 2009. A Chesapeake Bay Primer. U.S. Fish and Wildlife Service, Washington, DC. http://www.baylink.org/fieldtrips/primer.html#top. Accessed April, 2009.
USGS. 2008. Differences in Phosphorus and Nitrogen Delivery to the Gulf of Mexico from the Mississippi River Basin: Sources of Nutrients Delivered to the Gulf of Mexico. U.S. Geological Survey, Washington, DC. http://water.usgs.gov/nawqa/sparrow/gulf_findings/primary_sources.html. Accessed July, 2009.
VDH. 2009. Status of Blue Green Algae on Lake Champlain. Vermont Department of Health, Burlington, VT. http://healthvermont.gov/enviro/bg_algae/weekly_status.aspx. Accessed July, 2009.
Vesterby, M., and K.S. Krupa. 2001. Major Uses of Land in the United States, 1997. Bulletin No. 973. U.S. Department of Agriculture, Economic Research Service, Washington, DC.
WHOI. 2007. Harmful Algae: Ecosystems. Woods Hole Oceanographic Institution, Woods Hole, MA. http://www.whoi.edu/redtide/page.do?pid=9257. Accessed April, 2009.
August 2009 41


Nutrient Innovations Task Group Report Appendix A
Appendix A: Drinking Water Case Studies
High Nitrogen Levels in Wastewater Effluent Contaminating Water Source: Mashpee, MA .........2
Regional Strategy to Address Nutrient Problems from Runoff, Fertilizers, and Septic Systems: Newport, RI ......................................................................................................................................3
Feasibility Study to Address Nitrate Contamination of County Water Supplies: North Whatcom County, WA ......................................................................................................................................4
Nitrate from Fertilizer Cooperative with Waste Lagoon Contaminates City’s Water Supply: Chippewa Falls, WI...........................................................................................................................5
Nitrate in City Wells Addressed by Wellhead Ordinance and Cropping Agreement: City of Waupaca, WI....................................................................................................................................6
August 2009 A-1

Nutrient Innovations Task Group Report Appendix A
High Nitrogen Levels in Wastewater Effluent Contaminating Water Source: Mashpee, MA
Topic Case study illustrating the cost to reduce nitrogen from a community on-site septic system.
Problem High nitrogen levels from a community septic system effluent are occurring in a wellhead protection area and need to be reduced to meet strict water quality regulations. The nitrogen levels in the septic tank have averaged 57 mg/L.
Impacts The Town of Mashpee in Cape Cod, Massachusetts, consists of 24 units of mixed housing styles with 9,800 square feet of shops. The town was faced with a dilemma of how to meet the strict water quality regulation of ten mg/L maximum total nitrogen concentration in its wastewater effluent in a cost effective manner. The town is located in a wellhead protection area and its wastewater discharges contribute to water supply aquifers.
Solutions The town added a new passive nitrogen removal process that includes a biofilter and a nitrogen filter to its community septic system at an average cost of less than $30,000 per household, plus an electrical cost of about $0.75 per day. The operation and maintenance costs are minimal and can be monitored from a remote location. The effluent discharged from the system now averages 3.53 mg/L.
For more information www.ci.mashpee.ma.us
August 2009 A-2
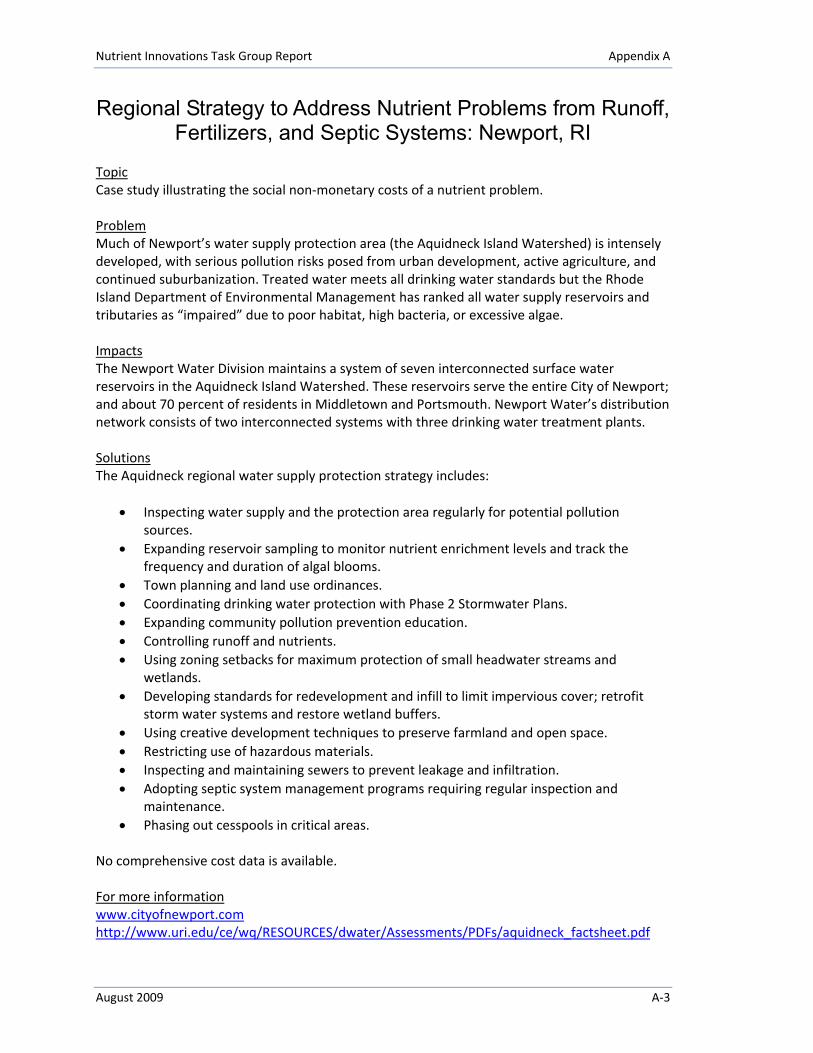
Nutrient Innovations Task Group Report Appendix A
Regional Strategy to Address Nutrient Problems from Runoff, Fertilizers, and Septic Systems: Newport, RI
Topic Case study illustrating the social non-monetary costs of a nutrient problem.
Problem Much of Newport’s water supply protection area (the Aquidneck Island Watershed) is intensely developed, with serious pollution risks posed from urban development, active agriculture, and continued suburbanization. Treated water meets all drinking water standards but the Rhode Island Department of Environmental Management has ranked all water supply reservoirs and tributaries as “impaired” due to poor habitat, high bacteria, or excessive algae.
Impacts The Newport Water Division maintains a system of seven interconnected surface water reservoirs in the Aquidneck Island Watershed. These reservoirs serve the entire City of Newport; and about 70 percent of residents in Middletown and Portsmouth. Newport Water’s distribution network consists of two interconnected systems with three drinking water treatment plants.
Solutions The Aquidneck regional water supply protection strategy includes:
Inspecting water supply and the protection area regularly for potential pollution sources.
Expanding reservoir sampling to monitor nutrient enrichment levels and track the frequency and duration of algal blooms.
Town planning and land use ordinances. Coordinating drinking water protection with Phase 2 Stormwater Plans. Expanding community pollution prevention education. Controlling runoff and nutrients. Using zoning setbacks for maximum protection of small headwater streams and
wetlands. Developing standards for redevelopment and infill to limit impervious cover; retrofit
storm water systems and restore wetland buffers. Using creative development techniques to preserve farmland and open space. Restricting use of hazardous materials. Inspecting and maintaining sewers to prevent leakage and infiltration. Adopting septic system management programs requiring regular inspection and
maintenance. Phasing out cesspools in critical areas.
No comprehensive cost data is available.
For more information www.cityofnewport.com http://www.uri.edu/ce/wq/RESOURCES/dwater/Assessments/PDFs/aquidneck_factsheet.pdf
August 2009 A-3

Nutrient Innovations Task Group Report Appendix A
Feasibility Study to Address Nitrate Contamination of County Water Supplies: North Whatcom County, WA
Topic Case study illustrating the cost of treatment or using an alternative supply to reduce nitrates in a ground water supply.
Problem Nine community water systems in North Whatcom County have high nitrate concentrations in their groundwater supplies. Samples taken at various sites throughout the Abbotsford Aquifer (the largest unconfined and the most extensively used aquifer in the region) have frequently exceeded 10 mg/L of nitrate as nitrogen, with individual values ranging from 0.03 mg/L to 91.9 mg/L.
Impacts These systems are under compliance orders to reduce the nitrate levels to meet drinking water standards.
Summary of Study The Washington Department of Health contracted with the nearby City of Lynden to evaluate the most feasible method of reducing nitrate concentrations for these systems. The study included a minimum of two alternatives: 1) Water system treatment; 2) Water supplied by the City of Lynden. Two other alternatives were considered for two of the systems which were using blended water from each base alternative.
It was found (from all cost standpoints) that connection to the City of Lynden was the most economical solution. However, water availability associated with legal rights may ultimately render the most economical alternative solution to be infeasible. The report supplies additional details regarding the cost estimates and findings.
August 2009 A-4

Nutrient Innovations Task Group Report Appendix A
Nitrate from Fertilizer Cooperative with Waste Lagoon Contaminates City’s Water Supply: Chippewa Falls, WI
Topic Case study illustrating the cost of protection from and treatment of nitrates.
Problem High nitrate levels in a well that provided approximately 60 percent of the city’s water.
Impacts The City of Chippewa Falls, which is located in rural northwestern Chippewa County, receives 100 percent of its drinking water from groundwater. Local geology consists of deep outwash deposits, which are fairly permeable and allow contaminants to easily reach groundwater.
Solutions The solution started with the development of a watershed management plan that was coordinated with some neighboring towns. In response to a recommendation that came out of the watershed plan, the city developed a proactive wellhead protection plan, and later added a new well and nitrate removal system. Furthermore, the city filed a lawsuit against a fertilizer cooperative that was determined to be a major nitrate source. The known costs associated with these efforts totaled $2,596,700 from the following expenditures:
Cost Component
$40,000 Expenditure to prepare a wellhead protection plan. This funding came from grants from the Wisconsin DNR as well as $8,000 from the City of Chippewa Falls.
$160,700 Expenditure for ongoing groundwater monitoring studies conducted over the course of ten years. This was funded by the City.
Unknown A consultant had previously delineated and mapped recharge areas, and time of travel zones for city wells.
$115,000 A consultant had previously delineated and mapped recharge areas, and time of travel zones for city wells.
$2.2 million Expenditure to install a nitrate removal system in the east well-field after nitrate levels failed to decrease. This cost customers $170 each.
$81,000 Annual expenditure for chemicals, labor, and maintenance.
Unknown
A lawsuit was filed against a local fertilizer cooperative. After three years of litigation, the city opted for a monetary settlement as continuing with the case would have cost the city too much and was unlikely to recover the entire costs of cleanup, monitoring and new well construction, much less result in additional compensation.
For more information http://www.uwsp.edu/cnr/landcenter/groundwater/casestudies/ChippewaFallsWHP.pdf
August 2009 A-5

Nutrient Innovations Task Group Report Appendix A
Nitrate in City Wells Addressed by Wellhead Ordinance and Cropping Agreement: City of Waupaca, WI
Topic Case study illustrating the social non-monetary costs of a nutrient problem.
Problem Approximately 55% of Waupaca County is agricultural land which often use nitrogen based fertilizers; and this has resulted in a decrease in water quality. In some wells, the city was still struggling with nitrate levels close to ten parts per million (ppm) (the Maximum Contaminant Level for drinking water) during the early to mid 1990s.
Impacts Some of the City of Waupaca’s wells are located in rural areas outside of the city near agricultural land.
Solution The city adopted a wellhead protection ordinance in 1992 and at the advice of the wellhead protection commission, 24 monitoring wells were installed around the two most productive wells.
Cropping agreements were made to reward farmers for growing crops that require less nitrogen fertilizer. These voluntary agreements have had a positive effect on groundwater while allowing farmers to continue their livelihood. Even though nitrates are still a concern, the city is now well within compliance of standards. The cropping agreements are ongoing and take less time to monitor now that they have been implemented. More farmers have become interested in cropping agreements as they see their neighbors participating; and some of these farmers will likely enroll in cropping agreements in the future.
For more information http://www.uwsp.edu/cnr/landcenter/groundwater/casestudies/Waupacacroppingagreement.pdf
August 2009 A-6

Nutrient Innovations Task Group Report Appendix B
Appendix B: Nutrient Innovations - Review and Analysis of Existing Tools
August 2009 B-1

A
ugust 2009 B-2
N
utrient Innovations Task Group Report
Appendix B
Tools Effectiveness in Reducing
Nutrients Limitations Stand alone or rely on other
tools Implications/Costs/ Resources Overall
Usefulness I. Tools for Point Sources and Non-Point Sources Water Quality Standards (WQS)
Water quality standards define the goals for a waterbody but do not, by themselves, result in a reduction. Narrative nutrient criteria are widely used but are not easily applied. A numeric nutrient criterionwould provide a tangible water quality goal against which other programs can tailor pollution controls.
(1) One numeric criterion may not be applied uniformly across the Nation. (2) Additional analysis and site specific monitoring data are needed to develop numeric nutrient limits. (3) WQSs adoption process may be quite lengthy, especially due to lack of scientific basis for establishing effects-based numeric criterion for pollutants like nutrients that do not exhibit threshold response.
WQSs are not a stand alone tool. For reductions to occur, the WQSs need to be implemented through NPDES permit limits, TMDLs, Watershed Plans, etc. WQS do however provide the ideal framework within which to integrateprograms and approaches to insure that WQS goals are met.
The costs will vary depending on the site specific analysis conducted to develop criteria. The use of ecoregional values could minimize significant additional costs for WQS development. Ecoregional criteria based on the statistical methodology in EPA guidance may not be scientifically defensible. Maintaining those criteria in order to maintain/support designated uses is not currently possible (most waters already above criterion). Site-specific criteria require criteria for secondary impacts, e.g. DO, Chlorophyll a, etc.
Moderate
Total MaximumDaily Loads (TMDLs)
TMDLs provide loading limits for point and nonpoint sources that, if implemented will achieve WQSs. Nutrient TMDLs have been developed using existing narrative criteria, but the availability of numeric nutrient criteria would likely facilitate the TMDL process. Expression of criteria in terms not conducive to assessing consistency under a range of flows will make TMDL development difficult since both wet and dry conditions must be considered.
(1) Approaches to translate narrative criteria into TMDL endpoints are not applied consistently. (2) Wasteload allocations have to be implemented through permit limits. (3) Nonpoint source reductions are not enforceable. (4) Adoption of TMDL likely to lead to difficulties in NPDES based on reasonable assurance problems with NPS bringing PS allocations to levels that are not reasonable or fair.
TMDLs provide loading limits for point and nonpoint sources that, if implemented will achieve WQSs. The TMDL, by itself, does not result in implementation of controls. It relies on NPDES permits to implement point source controls and mostly on voluntary programs to implement nonpoint source controls. Developing WLAs for NPDES regulated stormwater leads to issues with permitting these intermittent wet weather sources as well.
Nutrient TMDLs, particularly those for tidal waters, may require complex models (which also need more monitoring data). Staff would also need to have training and access to these models. Large scale models (such as Long Island Sound, Mississippi basin, Chesapeake) provide ample opportunity for debate over input/output and who is responsible for what, etc.
Point Sources – High Non-Point Sources - Low
SRFs Provides funding to achieve nutrient removal.
In many states, funds nutrient removal for municipal point sources only. Limited by amount of funding available.
Does not effectuate nutrient removal by itself; relies on permit requirements to force nutrient removal and a local government entity to seek a loan for a nutrient removal project.
Nutrient reduction projects must compete with other WQ projects such as CSO, SSO and I&I for available funding.
Low

A
ugust 2009 B-3
N
utrient Innovations Task Group Report
Appendix B
Tools Effectiveness in Reducing
Nutrients Limitations Stand alone or rely on other
tools Implications/Costs/ Resources Overall
Usefulness Water quality trading
Provides cost-effective reductions in nutrient loading, on balance, within a watershed.
May work best for reducing downstream effects of nutrients. Relative location of, for example, non-point source reductions to the location of a point source discharg e may influence how effective the "trade" is in improving local water quality. If the trade is between non-point sources and point sources, need to have non-point sources willing to implement controls.
Need to have a target load or waterquality standard in order to generate "credits" or have some idea of how many pounds are available for trading in a particular watershed. Usually implemented through a NPDES permit. If the trade is between non-point sourcesand point sources, need to have non-point sources willing to implement controls.
May be political issues to deal wit h about point sources being the only sources that can be forced to trade. There needs to be a state trading program established and studies of control technology/BMP effectiveness and costs, all of which take additional resources to run. Probably need to have a cost-share program, which again requires resources to capitalize, staff resources to administer and voluntary action by non-point sources.
Moderate
Load reductiontargets/optimalloading
Provides a land use or watershed specific target for nutrient reductio n that doesn't rely on WQS or TMDL.
Implementation is most reliable for point sources, because reductions can be mandated through NPDES. Although development of reduction targets or optimal loading may occur through a stakeholder process, there is still not a tool for reliable reductions from non-point sources.
Implementation for point sources isthrough the NPDES permit. Implementation of reductions for non-point sources relies on voluntary action.
Could get cost-effective reductions from point sources but states still challenged with getting reliable reductions from non-point sources.
Moderate
II. Tools for Point Sources National Pollutant Discharge and Elimination System (NPDES) Permits
NPDES permits have been developed for nutrient dischargers. NPDES permit limits are enforceable and effective in achieving controls for point sources. Watershed permittin g approaches have been applied to addressing the nutrient problem at a broader scale.
(1) Does not directly address nonpoint source contributions. (2) Water quality trading markets are not widely available, particularly with nonpoint sources. (3) Rapid nutrient reduction requires that permits actually get issued when they expir e and dischargers comply with permit limits. Limit of technology mandates, such as can occur via the TMDL route, can cause multiple years' delay before permits are effective due to appeals and extended compliance schedules.
Stand alone for point source controls. May rely on water quality trading to address nonpoint source reductions.
Costs of nutrient reductions could be very high depending on the control s that are put in place to achieve the limits on the permit. In the case of POTWs the costs of controls may impact the rates paid for water use by the community. Costs for infrastructure improvements to provide tre atment also impact on available funds to deal with other WQ issues (CSO, SSO, I&I, basic repairs to infrastructure, urban stormwater).
High

A
ugust 2009 B-4
N
utrient Innovations Task Group Report
Appendix B
Tools Effectiveness in Reducing
Nutrients Limitations Stand alone or rely on other
tools Implications/Costs/ Resources Overall
Usefulness Wastewater utility tools
Treatment technologies are available to remove P and N compounds.
EPA’s recent evaluation of nutrient treatment technologies suggest that even with state-of-the-art treatment, many facilities may not be able to comply with likely nutrient WQBELs. Many discharges’ concentrations currently may be one order of magnitude higher than expected criteria. Nutrient removal to approach WQBELs will require substantial modifications to POTWs. Facility upgrades will be expensive and SRF funding may be overburdened by the number of facilities undergoing simultaneous upgrades. WQBELs may be unrealistically restrictive due to TMDL/NPDES rules that force limit of technology on PS because NPS implementation not reasonably assured. Inability to consider cost/benefit makes implementing permits unacceptable to regulated community.
Stand alone tool but in watersheds dominated by nonpoint sources of nutrients, installation of treatment technologies by POTWs will not get the watersheds back in attainment without significant reductions in NPS loadings.
Many POTWs are claiming that they are unfairly being targeted for additional nutrient controls while NPS of nutrients are given a pass. Nutrient removal to approach WQBELs will require substantial modifications to POTWs. Facility upgrades needed to attain water quality standards will cost money and will be needed by many point source dischargers over a short period of time (5-10 years). SRF funding may be overburdened by the number of facilities undergoing simultaneous upgrades. Compliance will be an issue because many facilities may not be able to comply with nutrient WQBELs even if they install state-of-the-art treatment. POTWs are also asking for other compounding factors to be considered (e.g., increases in energy use, footprint, sludge production, greenhouse gas emissions) when evaluating the costs/benefits of nutrient treatment technology upgrades.
High
State effluent limits
Very effective in getting reductions from point sources.
Does not address non-point sources. Implemented through NPDES permit.
Good tool for addressing nutrient pollution in a watershed dominated by point sources. Across the board, even-handed and predictable for point sources. May b e costly and burdensome for municipalities, depending on technology required to meet the limit.
High
Federal technology requirements
Very effective in getting across the board reductions from point sources.
Does not address non-point sources. Implemented through NPDES permit.
Good tool for addressing nutrient pollution from point sources. Across the board, even-handed and predictable for point sources. May be costly and burdensome for municipalities, depending on technology required.
High

A
ugust 2009 B-5
N
utrient Innovations Task Group Report
Appendix B
Tools Effectiveness in Reducing
Nutrients Limitations Stand alone or rely on other
tools Implications/Costs/ Resources Overall
Usefulness III. Tools for Non-Point Sources CWA Section 319 (Nonpoint Source Management Program)
Under section 319, State, Territories, and Indian Tribes receive grant money which support a wide variety of activities including technical assistance, financial assistance, education, training, technology transfer, demonstration projects, and monitoring to assess the success of specific nonpoint source implementation projects. The program relies on watershed plans as a primary tool. Effectiveness will depend on the comprehensiveness of the plan, the management of the grant funds and how completely the plan is implemented.
(1) As a voluntary program, it relies on the commitment of watershed groups and other stakeholders to implement and maintain controls. (2) Depends on the availability of grant funds. (3) May need to increase availability of resources and training on various BMPs.
Stand alone for nonpoint source controls
The implementation of controls depends on availability of grant funds and voluntary action.
Moderate
Phosphate bans Phosphate bans (e.g., detergents ) have been effective at the State level. Local ordinances have been used effectively to require use of low P or no-P fertilizer in residential areas.
(1) Bans don't address agricultural applications of fertilizer. (2) Bans need to be comprehensive to be effective, e.g., restrict commercial applicators, have P-free alternatives available, and educate self-applicators. (3) Phosphate bans don't impact other nutrients (e.g., nitrogen). (4) Phosphate bans typically work best at State level--difficult to implement at the local level as shoppers purchase products outside of their immediate area.
States may need to review their authorities for implementing a phosphate ban. This may requir e legislative action in many States. Likely to involve other State agencies (e.g., commerce) due to regulating a product. Education and enforcement is required.
States implementing a phosphate ban would have costs for legislative actions, education, outreach, and enforcement. Costs for fertilizer ordinance adoption and enforcement borne for the most part by local units of government. State and Federal agencies may need to develop model ordinances, conduct education and outreach, and to try to develop incentives (or requirements) to get local units of government to enact appropriate ordinances.
High
Optimization of agricultural fertilizer application
Optimizing the amount and timing of fertilizer application to the needs of the crop and soil can be very effective in reducing nutrient loading in watersheds where over application of fertilizer is a main contributor
Relies on education of crop producers on how to optimize, and on their voluntary action to do so (unless required by a Nutrient Management Plan pursuant to a CAFO permit).
Variable--nutrient management plans can be voluntary or can be required under a CAFO permit or state law/regulation
Recent high fertilizer prices have driven producers to implement optimization. If manure or biosolids are the fertilizer source, optimization may result in less demand and therefore a need to dispose of these materials, i.e., an increased cost to the generator.
High

A
ugust 2009 B-6
N
utrient Innovations Task Group Report
Appendix B
Tools Effectiveness in Reducing
Nutrients Limitations Stand alone or rely on other
tools Implications/Costs/ Resources Overall
Usefulness Food, Conservation, and Energy Act of 2008 (2008 Farm Bill)
The Farm Bill includes funding for avariety of conservation programs, including the Environmental Quality Incentives Program (EQUIP). The program offers financial and technical help to assist eligible participants install or implement structural and management practices on eligible agricultural land. Effectiveness will depend on the willingness of farmers t o implement voluntary nutrient controls. Agriculture has been identified as a primary source of nutrients in many areas of the country; this program could help achieve the reductions needed in those areas.
(1) Dependent on the willingness of farmers to install and maintain controls that will reduce nutrients and the willingness of State Technical Committees/county offices to distribute funds for nutrient controls. (2) Relies on availability of funds. (3) Though the controls implemented through this program may reduce nutrients, the main focus of the program is not the improvement of water quality. (4) Funding cannot be targeted to watersheds with highest nutrient pollution loading.
Stand alone for nonpoint source controls.
The program is managed by the U S Department of Agriculture.
Low
Local planning & zoning
Local ordinances can be use d effectively to regulate release rates and stormwater volumes, and to protect/preserve areas where stormwater can infiltrate. Huge opportunity to encourage o r mandate the use of BMPs includinglow impact development (LID) practices on new development. Most jurisdictions have erosion and sedimentation requirements that should help with P by reducing particulates. Also local ordinances can be very effective in maintaining buffers around wetlands and watercourses that help with nutrientreductions.
(1) Local ordinances will typically not address the concentrations of nutrients in discharges. (2) Local politics may sometimes result in local requirements that are not overly stringent. (3) Some areas
where there are nutrient contributions may be outside the jurisdiction of municipalities (i.e., unincorporated areas). (4) Municipalities need education/motivation to implement better land use controls including reasons not related to WQ such as transportation benefits, sustainable
communities, etc.
Stand alone but education and enforcement is required.
Costs for ordinance adoption and enforcement borne for the most part by local units of government. State and Federal agencies may need to develop model ordinances, conduct education and outreach, and to try to develop incentives (or requirements) to get local units of government to enact appropriate ordinances. Municipalities may need to amend their local ordinances to remove barriers to use of LID or BMPs.
Low

A
ugust 2009 B-7
N
utrient Innovations Task Group Report
Appendix B
Tools Effectiveness in Reducing
Nutrients Limitations Stand alone or rely on other
tools Implications/Costs/ Resources Overall
Usefulness Development requirements for runoff
Local requirements can be enacted to prevent flooding (e.g., detention basins) in order to reduce the volume of water hitting a sewer system during a rain event. Low impact development ordinances (e.g., bioswales, artificial wetlands, rain gardens, etc.) can be very effective at reducing the volume of runoff and absorbing/retaining nutrients. States can reinforce requirements through incorporating them into general NPDES permits for construction stormwater.
Requirements t o control/reduce flooding can be effective in moderating flow/volume but are not as effective in nutrient removal.
Stand alone but education and enforcement is required.
Costs for ordinance adoption and enforcement borne for the most part by local units of government. State and Federal agencies may need to develop model ordinances, conduct education and outreach, and to try to develop incentives (or requirements) to get local units of government to enact appropriate ordinances. Municipalities may need to amend their local ordinances to remove barriers to use of LID (in many cases developers need to get variances to incorporate LID practices).
Low
Watershed plans Watershed groups can receive incremental Section 319 funds to develop watershed plans. Although there is no formal requirement for EPA to approve watershed plans, the plans must address nine required elements if they are developed in support of a section 319-funded project. These watershed plans are good vehicles to build stakeholder/ local involvement and to direct 319 funds to the most beneficial implementation projects.
Watershed plans are not self-implementing; they need funds (e.g., 319 grants) and committed voluntary action to implement.
Need other programs/funds to implement the plans.
Local groups can be very enthusiastic about protecting/restoring their watershed but can get frustrated by the bureaucratic process and limited funds available to get plans implemented.
Low

A
ugust 2009 B-8
N
utrient Innovations Task Group Report
Appendix B
Tools Effectiveness in Reducing
Nutrients Limitations Stand alone or rely on other
tools Implications/Costs/ Resources Overall
Usefulness IV. Tools for Other CWA Section 401 Certification
Under 401, States/Tribes can review and approve, condition, or deny all Federal permits or licenses that might result in a discharge to State/Tribal waters. Major Federal actions subject to 401 are Section 402 and 404 permits (in nondelegated States), FERC hydropower licenses, and Rivers and Harbors Act Section 9 and 10 permits. Through 401 certification, States/Tribes can address associated chemical, physical and biological impacts (e.g., DO levels, turbidity, inundation of habitat, stream volumes/fluctuations, filling of habitat, loss of aquatic species as a result of habitat alterations, etc.). States/Tribes could also look at the impacts of the action on narrative and numeric nutrient criteria. States/Tribes can negotiate with developers who need a 401 cert for a stream crossing or small wetland fill to incorporate mitigating measures into the site design t o reduce environmental impact (bigger setbacks from sensitive habitats, fewer lots, better storm water BMPs, etc).
(1) Limited to any permit or license issued by a federal agency for any activity that may result in a discharge into waters of the state/tribe. (2) A large project often requires an extended period of time for certification because they are complex and require significant state/tribal involvement. (3) Denials based on potential exceedances of narrative criteria may be mor e difficult to document and more difficult to defend if challenged vs. numeric criteria. (4) Nutrient-control related conditions included with certifications most likely to be focused on no net increase instead of overall net reduction. (5) Recent decisions on the scope of 401 review may make mitigating measures for wetlands more difficult.
Stand alone but rely on a State's orTribe's water quality standards.
Political pressure to get some of these projects through. State/Federal resources limited in terms of reviewing all of these potential 401 certification projects.
Low
Drinking water utility tools
Treatment technologies are available to remove nitrate/nitrite i n drinking water (ion exchange, reverse osmosis). These can remove other nutrients.
Removing the nutrients from drinking water is more costly and less efficient than preventing or reducing nutrients from entering the source water in the first place.
Nitrate treatment can be stand alone. Reduction of levels in the source water is attempted as another barrier.
Installation of nitrate treatment is expensive. Unless levels in the source water can be reduced or a new source of water found, there is no choice but to install treatment.
High

N
utrient Innovations Task Group Report
Appendix B
A
ugust 2009 B-9
Tools Effectiveness in Reducing
Nutrients Limitations Stand alone or rely on other
tools Implications/Costs/ Resources Overall
Usefulness Dam relicensing/ removal
FERC relicensing is subject to NEPA although most projects involve environmental assessments (EAs) rather than EISs. Planned projects are supposed to minimize damage to the environment and incorporate requirements to reduce environmental impacts. Nutrient removal might play out on a site-specific basis but isn't the biggest issue associated with relicensing. In some cases, operational rules might enhance a reservoir's capacity as a summer nutrient sink/winter nutrient source. Manipulation of flushing rates might be helpful but certainly won’t be a big part of any nutrient solution. Dam removal will move the nutrient load downstream and will likely bring a nutrient impaired reservoir back to attainment.
Re-licensing: Different criteria in different states; safety, rather than water quality is primary goal. Issues involving sedimentation, flow, stagnant pools, low dissolved oxygen, heavy metals, and habitat alterations/scouring tend to be issues looked at under relicensing. Nutrients might be considered secondarily.
Stand alone but the direct linkage to nutrient reduction is a stretch.
Relicensing of dams is often controversial, very time consuming, political, and a lengthy process.
Low


Nutrient Innovations Task Group Report Appendix C
Appendix C: Review and Analysis of Alternative Tools
Table C-1. Review and Analysis of Alternative Tools................................................................C-2 Recommendations for New Tools to Reduce Nutrient Loadings .............................................C-6
August 2009 C-1

A
ugust 2009 C-2
N
utrient Innovations Task Group Report
Appendix C
Table C-1. Review and Analysis of Alternative Tools
Type
Governmental Level of Im
plementation:
Federal/State/Local
TOOLS
Threshold Criteria Balancing Criteria Scale of Implementation Means of Im
plementation
[L egislative, Regulatory, Non-Regulatory, Incentive]
Effectiveness [3= High, 2= Medium, 1= Low]
Degree of Accountability for Environm
ental Improvem
ent [3= High, 2= Medium, 1= Low]
Technical Feasibility [3=Excellent, 2=Fair, 1=Poor]
Stakeholder Acceptance [3= High, 2= Medium, 1= Low]
Cost 1 > $2M,2 >$1M - <$2M, 3< $1M
(relative to the avg NPS Grant)
Scale of Implem
entation [National, Regional, State,
Watershed]
PS F Detergent Phosphate Ban 2 3 3 2 2 S W L / R
NPS/PS All Protection of Natural Nutrient Sinks 2 2 2 2 2 N S W R
PS F Expand NPDES Permit Post Construction Requirements 2 2 3 2 2 S W L / R
PS/ NPS F Comprehensive CAFO Regulation 2 2 3 2 2 S W R
PS/NPS F NPDES Stormwater Regulation to of Smaller Communities 2 2 2 2 2 S W R
PS/ NPS F Market Based Nutrient Reduction Land Use Incentives 2 2 2 2 2 S W I
PS F Control Onsite Wastewater Treatment Systems Discharge 2 2 2 2 2 S W R
PS/NPS F Implement Large-Scale Watershed TMDL (e.g., Mississippi River Basin) 2 2 2 2 1 N R S W L / R / I
NPS All Nutrient Load Reduction Strategy 1 1 2 2 3 N R S W NR
NPS/PS S/L Pilot Studies 1 1 2 2 2 N S W I

A
ugust 2009 C-3
N
utrient Innovations Task Group Report
Appendix C
Type
Governmental Level of Im
plementation:
Federal/State/Local
TOOLS
Threshold Criteria Balancing Criteria Scale of Implementation Means of Im
plementation
[L egislative, Regulatory, Non-Regulatory, Incentive]
Effectiveness [3= High, 2= Medium, 1= Low]
Degree of Accountability for Environm
ental Improvem
ent [3= High, 2= Medium, 1= Low]
Technical Feasibility [3=Excellent, 2=Fair, 1=Poor]
Stakeholder Acceptance [3= High, 2= Medium, 1= Low]
Cost 1 > $2M,2 >$1M - <$2M, 3< $1M
(relative to the avg NPS Grant)
Scale of Implem
entation [National, Regional, State,
Watershed]
NPS/PS S/L Volunteer Monitoring 1 1 2 2 3 S W NR / I
NPS F NPS Regulation 3 3 2 1 1 N S R
PS S/L Issue Nutrient Limit Permits 2 3 3 2 2 N S L/ R
PS/ NPS F Federally Required State WQS Numeric Nutrient Water Quality
Criteria 2 2 3 2 2 N S L / R
PS F Update Secondary Nutrient Treatment Requirements 2 3 3 2 2 N S L / R
NPS F
Adoption of a Monitoring Paradigm/Watershed Action Level for
fertilizer application based on the Atrazine example for pesticides
registration
2 2 2 2 2 N S R
PS/NPS F Green Labeling 2 2 3 3 3 N S I
PS F Develop Nutrient Numeric Criteria-Permit Limits Guidance 2 2 2 2 3 N S I
NPS S/L State Established Nutrient Ceiling for Listings 2 2 2 2 3 N S I

A
ugust 2009 C-4
N
utrient Innovations Task Group Report
Appendix C
Type
Governmental Level of Im
plementation:
Federal/State/Local
TOOLS
Threshold Criteria Balancing Criteria Scale of Implementation Means of Im
plementation
[L egislative, Regulatory, Non-Regulatory, Incentive]
Effectiveness [3= High, 2= Medium, 1= Low]
Degree of Accountability for Environm
ental Improvem
ent [3= High, 2= Medium, 1= Low]
Technical Feasibility [3=Excellent, 2=Fair, 1=Poor]
Stakeholder Acceptance [3= High, 2= Medium, 1= Low]
Cost 1 > $2M,2 >$1M - <$2M, 3< $1M
(relative to the avg NPS Grant)
Scale of Implem
entation [National, Regional, State,
Watershed]
NPS S/L Project Implementation Plan Tracking 1 1 2 2 3 N S I
NPS F TSCA required reduction of
phosphorus in detergent and water solubility of fertilizer
2 3 3 2 2 N I
PS/NPS F Control Air Deposition of Nitrogen 2 2 2 2 1 N R
PS/NPS F TRI for Nutrient Releases 2 2 3 2 2 N R
NPS F SIP Process 2 3 2 2 2 N R
NPS/PS S/L Regulate PS Treatment and Post NPS BMP Application Loading 2 2 2 2 2 N L/ R
NPS S/L Capping 2 2 2 2 2 N R
PS F Cap PS at current (2010) load 2 2 3 2 2 N R
NPS F MS4-type regs 2 2 2 1 2 N R
NPS F Cap Non-Point Source at Current Load 2 2 2 1 2 N R
NPS F Corporate Stewardship Program 2 2 3 3 2 N I
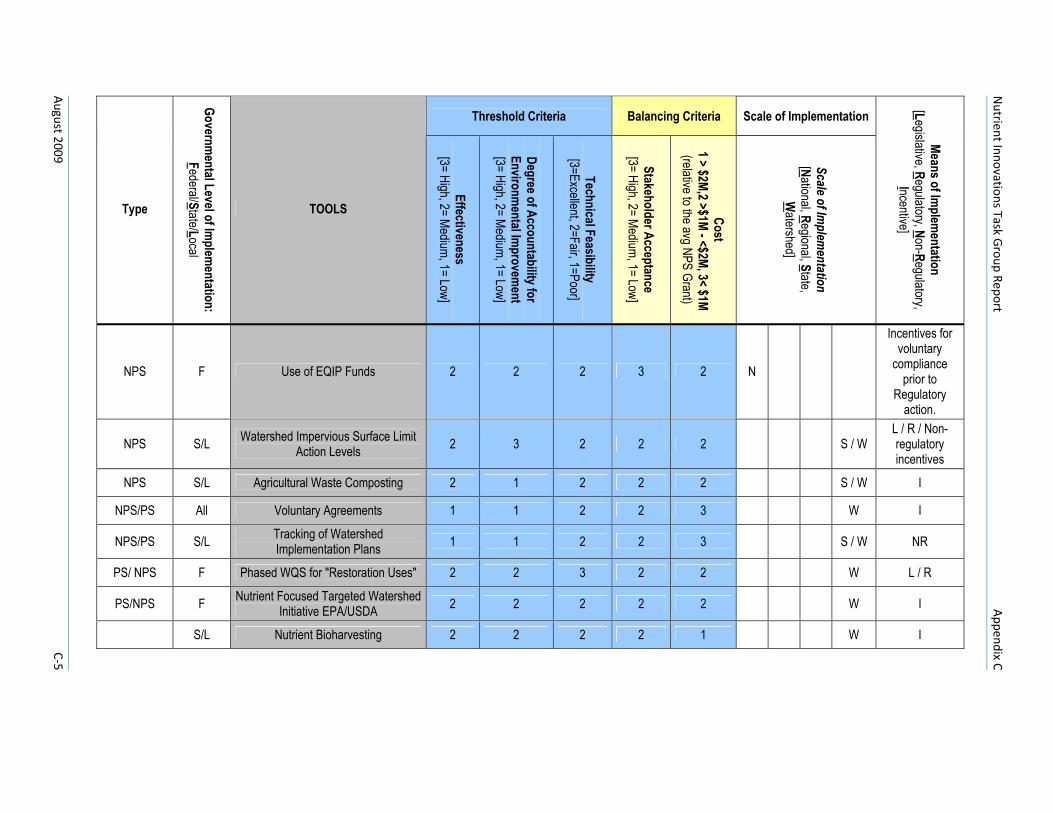
N
utrient Innovations Task Group Report
Appendix C
A
ugust 2009 C-5
Type
Governmental Level of Im
plementation:
Federal/State/Local
TOOLS
Threshold Criteria Balancing Criteria Scale of Implementation Means of Im
plementation
[L egislative, Regulatory, Non-Regulatory, Incentive]
Effectiveness [3= High, 2= Medium, 1= Low]
Degree of Accountability for Environm
ental Improvem
ent [3= High, 2= Medium, 1= Low]
Technical Feasibility [3=Excellent, 2=Fair, 1=Poor]
Stakeholder Acceptance [3= High, 2= Medium, 1= Low]
Cost 1 > $2M,2 >$1M - <$2M, 3< $1M
(relative to the avg NPS Grant)
Scale of Implem
entation [National, Regional, State,
Watershed]
NPS F Use of EQIP Funds 2 2 2 3 2 N
Incentives for voluntary
compliance prior to
Regulatory action.
NPS S/L Watershed Impervious Surface Limit Action Levels 2 3 2 2 2 S / W
L / R / Non-regulatory incentives
NPS S/L Agricultural Waste Composting 2 1 2 2 2 S / W I
NPS/PS All Voluntary Agreements 1 1 2 2 3 W I
NPS/PS S/L Tracking of Watershed Implementation Plans 1 1 2 2 3 S / W NR
PS/ NPS F Phased WQS for "Restoration Uses" 2 2 3 2 2 W L / R
PS/NPS F Nutrient Focused Targeted Watershed Initiative EPA/USDA 2 2 2 2 2 W I
S/L Nutrient Bioharvesting 2 2 2 2 1 W I

Nutrient Innovations Task Group Report Appendix C
Recommendations for New Tools to Reduce Nutrient Loadings
The members of the Nutrient Innovations Task group who identified and evaluated potential new tools to address the increasing nutrient problem in our nation’s waters included senior managers from water programs in EPA headquarters, EPA regions, and 7 states. Nearly 40 new tools were identified, discussed and evaluated. Tools such as tracking watershed implementation plans, encouraging voluntary monitoring, capping phosphorus discharges, regulating nonpoint source discharges, and many others were considered by a subset of EPA and state senior managers. Some tools depended on statutory or regulatory changes and some depended on the creation of new programs. The appendix to this report contains the full list of tools that were considered.
To identify the tools that held the most promise to reduce nutrient loadings into our nation’s waters, the managers ranked the tools based on overall effectiveness, degree of accountability for environmental improvement, and technical feasibility. The managers also took into account public acceptance and cost. The managers relied on their experience in implementing water programs and qualitatively ranked these tools based on their best professional judgment. We recommend the 5 highest ranked tools in terms of overall effectiveness for further evaluation to determine how they might best be structured for purposes of implementation. A broader discussion among stakeholders towards that end is warranted and encouraged. We see these recommendations as the first step in engaging in such a discussion about what we can and need to do differently to be more successful in abating the increase in nutrient loadings to our waters and start on the path of significant reductions. Current regulatory and incentive-based to-0ols and approaches are not yielding the results needed to protect water quality.
The tools that were most highly ranked as having the most promise to reduce nutrient loadings and therefore judged to have the highest overall effectiveness were the following:
Type Tools
Scale of Implementation Point Source Non-point
Source National State
Regulatory
Nonpoint Source Regulation: Seek legislative change(s) to authorize regulation of nonpoint source pollution to require nonpoint sources to achieve water quality targets and/or technology-based performance standards.
√ √ √
Regulatory
Establish technology treatment requirements for nutrients and thereby establish technology based limits for NPDES point sources that discharge nutrients to waters—update secondary treatment requirements.
√ √ √
Source Reduction
Detergent Phosphate Ban √ √
Regulatory Federally Promulgate Numeric Nutrient Water Quality Criteria/Standards √ √ √
Incentive-based Green Labeling √ √ √ √
August 2009 C-6

Nutrient Innovations Task Group Report Appendix C
It is fair to point out that the recommendation to seek to regulate nonpoint sources with a similar rigor to that of point sources was judged to be the most effective tool in reduci ng nutrient loadings to our nation’s waters since it is broadly recognized that nonpoint sources contribute the bulk of the nutrient loadings to waters and those loadings have been the most difficult to control and reduce. It is also important to point out that while Green Labeling did not rank in the top five for overall effectiveness, in the category of incentive-based tools it did rank highest in terms of overall effectiveness. Corporate stewardship was also a new tool that was ranked highly in terms of overall effectiveness in the incentive-based category. When presenting our recommendations, the workgroup considered it important to provide a mix of tool types: regulatory, source reduction, and incentive-based. Finally, one prominent tool that is included in both the existing tools table and the new tools table in the appendix is water quality trading. Many on the workgroup commented that water quality trading is an important tool that has not yet been fully realized to yield the results in nutrient reductions that are needed. It is a tool that could be bolstered and made to work better. Its success depends on the creation of markets for nutrient trading. Certainty in regulatory requirements and establishment of clear numeric targets for nutrients provide the necessary framework for water quality trading to work. The recommended tools to regulate nonpoint sources and establish numeric criteria for nutrients would potentially expedite the use of water quality trading.
August 2009 C-7


D.
Nutrient Innovations Task Group Report Appendix D
Appendix D: Accountability Fact Sheets
Numeric Nutrient Criteria........................................................................................................ D-2 Maryland BayStat Program...................................................................................................... D-5 Florida’s Impaired Waters Rule ............................................................................................... D-7 Economic Incentives and Disincentives................................................................................. D-11 Green and Eco-Labeling of Farm Products (Based on Farming Methods) ............................ D-15 Voluntary Agreements with Private Sector ........................................................................... D-18 The Massachusetts Wetlands Protection Act........................................................................ D-20 Toxic Release Inventory......................................................................................................... D-23 Pinto Creek Decision.............................................................................................................. D-26 Virginia Watershed-based Permit ......................................................................................... D-29 Strengthening Reasonable Assurance for TMDLs.................................................................. D-32 Connecticut Nitrogen Credit Exchange Program................................................................... D-34 Dutch Nutrient Trading System ............................................................................................. D-37 Maryland Policy for Nutrient Cap Management and Trading ............................................... D-40 Ohio Water Quality Trading................................................................................................... D-43 Pennsylvania Nutrient Trading Program ............................................................................... D-45 California Nonpoint Source (NPS) Program........................................................................... D-49 Iowa Onsite Wastewater Loan Program................................................................................ D-52 North Carolina Community Conservation Assistance Program (CCAP)................................. D-55 Wisconsin’s Priority Watershed and Priority Lake Program.................................................. D-58 CAFO/AFO Nutrient Management......................................................................................... D-61 California Agricultural Water Quality Grant Program ........................................................... D-65 Delaware’s Nutrient Management Program ......................................................................... D-68 Iowa Livestock Water Quality Facilities Program .................................................................. D-71 Kansas Clean Water Farms—River Friendly Farms Project ................................................... D-74 North Carolina Agriculture Cost Share Program (ACSP)........................................................ D-77 Ohio Agriculture Pollution Abatement Program ................................................................... D-80 Virginia Agricultural Stewardship Act .................................................................................... D-82 Wisconsin Nonpoint Source Performance Standards and Prohibitions ................................ D-85 Clean Air Act: State Implementation Plans ........................................................................... D-89
August 2009 D-1

Nutrient Innovations Task Group Report Appendix D
Numeric Nutrient Criteria
Overview
This accountability method is based on the Clean Water Act, which requires states to adopt water quality standards. Numeric nutrient criteria employ ecoregional or site-specific water quality standards that utilize criteria for one or several key nutrient parameters to protect aquatic and recreational designated uses from nutrient inputs.
Description
Many states are in the process of developing numeric nutrient criteria. Other states (e.g., Minnesota, Virginia, Washington) have already approved numeric nutrient criteria for types of waterbodies, such as lakes and reservoirs on a regional basis. Some states have developed site-specific criteria for a specific waterbody or criteria based on supporting a particular designated use. Criteria development is generally employing recommendations from EPA’s ecoregional nutrient criteria guidance documents, developing criteria that focus on one or a combination of the following parameters: TN, TP, chlorophyll-a, and turbidity (Secchi disc depth). The principal focus of numeric criteria development has been on lakes and reservoirs, with efforts to reduce nutrient inputs into streams resulting in facility specific effluent limitations.
Assessment of How the Approach is Working
Minnesota currently has two groups of numeric nutrient criteria, one for designated lake trout lakes in all ecoregions, and one for trout lakes (with no resident lake trout) in all ecoregions. Criteria exist for total phosphorus, chlorophyll a, and Secchi disc depth. Class 2a lakes and reservoirs (both lake trout and non-lake trout waterbodies) are also subject to narrative nutrient standards (MPCA 2008). The Minnesota Pollution Control Agency (MPCA) has drafted eutrophication criteria to replace these existing standards. The new standards have been developed for a particular lake or reservoir designated use (classes 2A, 2B, 2a, and 2b) and are specific to one of four ecoregions in Minnesota (Heiskary and Wilson 2004).
Virginia has developed site-specific numeric nutrient criteria for concentrations of chlorophyll a and TP to protect aquatic life and recreational designated uses in lakes and reservoirs. Additional listings are made when a new reservoir is constructed or recent data availability warrants development of nutrient criteria for a particular waterbody. The TP criteria are only applicable if the lake or reservoir has received algaecide treatments during the monitoring and assessment period (April 1 through October 31). Sampling is conducted in the lacustrine portion of the lake at a depth of one meter or less over the 7 month monitoring period and distributed in a manner to be representative of the whole waterbody. If monitoring reveals that the applicable criteria are exceeded, the waterbody is listed as impaired and Virginia’s State Water Control Board will consult with the Department of Game and Inland Fisheries to determine the health of the waterbody’s fishery and the status of designated uses. If the numeric nutrient criteria of a lake or reservoir does not provide for the attainment and maintenance of water quality standards of downstream waters, then the nutrient criteria may be modified on a site-specific basis to ensure protection of water quality standards of downstream waters (VSWCB 2007).
August 2009 D-2

Nutrient Innovations Task Group Report Appendix D
Washington has developed ecoregion specific numeric nutrient criteria that vary according to a lake or reservoir’s trophic state (i.e. oligotrophic, mesotrophic, or eutrophic). Each ecoregion has a particular action value for epilimnetic TP, a trigger value that when exceeded by a waterbody within that ecoregion will initiate further regulatory action. If monitoring of a lake or reservoir reveals a TP value below the relevant action value, the trophic status of the waterbody is determined via epilimnetic sampling, and the TP criterion is set at or below the upper limit of the TP range for that trophic state. On the other hand, if monitoring reveals TP values in excess of the action value, then a lake-specific study is conducted. Lake-specific studies are site-specific and tailored to the particular source of the impairment, whether it be from phytoplankton blooms, toxic phytoplankton, or excessive aquatic plants. A lake-specific study may quantify the following measures: total phosphorus, total nitrogen, chlorophyll a, dissolved oxygen in the hypolimnion in thermally stratified waterbodies, pH, hardness, or other measures of the physiochemical state of the waterbody being studied. If upon further investigation it is determined that the designated uses of that water body are not impaired by the elevated TP concentration, then a new site-specific phosphorus concentration is set at the existing TP concentration. If the study reveals impairment to designated uses, then new criteria must be established that is protective of existing uses. Lake-specific nutrient criteria are considered during water quality standards rule makings and adoption by rule formally establishes the criteria for the lake (WDE 2006).
Summary of Strengths and Weaknesses
Strengths Ecoregional and site-specific numeric nutrient criteria tailored to the ambient
physiochemical state of a waterbody given its geographical position Numeric nutrient criteria provide a definitive standard by which degradation caused by
nutrients can be assessed, and the degree of degradation ascertained Numeric nutrient criteria are more prescriptive than narrative criteria that are open to
interpretation due to their vaguely descriptive nature Exceedances of criteria result in impairment listings and subsequent action by the
regulatory and/or permitting authority to address the impairment, which can impact downstream waters as well as initiate a watershed scale effort to reduce loadings, such as a TMDL
Numeric nutrient criteria that employ several key parameters conducive to establishing the trophic status of a waterbody ensure a more rigorous assessment
Criteria exceedances are tied to a regulatory mechanism to address impairments
Weaknesses Only a limited number of states currently have numeric nutrient criteria, and the degree
of programmatic and regulatory development amongst those states varies greatly Most states have focused on lakes and reservoirs when developing numeric nutrient
criteria since these systems serve as nutrient pools; streams and rivers rarely have numeric nutrient standards despite the impact nutrient inputs can have on these waterbodies and how these waterbodies serve as conduits of nutrient delivery; factors such as frequency and duration need to be considered when determining which waterbodies need numeric nutrient standards
August 2009 D-3

Nutrient Innovations Task Group Report Appendix D
States have been slow in developing numeric nutrient criteria for coastal waters and estuaries, which have inherent difficulties as efforts may require regional considerations and interstate cooperation
States are developing numeric standards with only one to two indicators of nutrient degradation
Difficult to ensure nonpoint source reductions Regulations can be contentious
References
Heiskary, S., and B. Wilson. 2004. Minnesota’s Lake Nutria Criteria Development: Emphasis on Fisheries and Ecology. Minnesota Pollution Control Agency, St. Paul, MN.
MPCA. 2008. Chapter 7050: Water Quality Standards for Protection of Waters of the State. Minnesota Pollution Control Agency, St. Paul, MN.
VSWCB. 2007. 9 VAC 25-260: Virginia Water Quality Standards. Virginia State Water Control Board, Richmond, VA.
WDE. 2006. Chapter 173-201A WAC: Water Quality Standards for Surface Waters of the State of Washington. Washington Department of Ecology, Olympia, WA.
August 2009 D-4

Nutrient Innovations Task Group Report Appendix D
Maryland BayStat Program
Overview
This accountability method is based on an executive order issued by Maryland Governor Martin O’Malley and coordinates state agencies and stakeholders within the State of Maryland. BayStat is tracking progress of the State of Maryland in its efforts to clean-up the Chesapeake Bay (O’Malley 2007).
Description
BayStat is a state initiative started by Maryland Governor Martin O’Malley with an executive order on February 14, 2007. The goal of BayStat is to coordinate Maryland’s efforts to clean-up the Chesapeake Bay and more effectively measure progress of state initiatives to clean-up the Chesapeake Bay. The efforts of the State’s Departments of Agriculture, Environment, Natural Resources, and Planning as well as the University of Maryland are tracked and coordinated to more accurately and specifically measure progress. Information and statistics gathered because of BayStat inform policymakers and provide accountability of the state agencies to ensure that efforts to clean-up the Chesapeake Bay are targeted and efficient (Nunley 2007).
Assessment of How the Approach is Working
The BayStat program utilizes a number of pre-existing indicators developed by U.S. EPA’s Chesapeake Bay Program to evaluate the bay’s health, protection, and restoration efforts (Cadogan 2006). Indicators that are tracked include water quality data, nutrient and sediment loads, biotic integrity, fisheries data, and protected land status. The BayStat program also incorporates the basin-specific tributary strategies for the 36 major basins in the bay watershed developed as part of the Chesapeake 2000 agreement.
This data is used to more effectively target its efforts and develop more effective strategies. BayStat helps to coordinate state efforts with efforts of other stakeholders like other State governments and Federal government agencies (Nunley 2007). Members of the BayStat team meet with Governor O’Malley monthly to assess progress and determine what is working and what is not working.
In addition to its role in improving efficacy and providing accountability of state agencies, BayStat functions as a tool for informing the public on the current causes of the poor health of the Chesapeake Bay and the progress towards improving the health of the bay. The BayStat team releases monthly newsletters and provides interactive progress tracking data on its website available to the public. Since BayStat was started recently, February 2007, the effectiveness of the program relies on the BayStat team being able to revise their approach towards improving the health of the Bay using all of the gathered data. At this time the BayStat program has been fully implemented to allow for agency accountability (O’Malley 2007).
August 2009 D-5

Nutrient Innovations Task Group Report Appendix D
Summary of Strengths and Weaknesses
Strengths Makes coordinated efforts by state agencies both within Maryland and with other states
possible and much more likely to be effective Provides an integrated approach to measuring overall progress in improving the health
of the Chesapeake Bay Provides the ability to evaluate whether one seemingly unrelated program has an effect
on other conservation practices or restoration programs Could function as an effective state repository of information that could be compiled at
the federal level (e.g., each state’s BayStat program (or equivalent) could share information and techniques to increase effectiveness)
If fully implemented, BayStat should act as a mechanism for increasing agency accountability by both public pressure and changes by the Governor’s office
No legislation is needed for this approach to be implemented and tracking progress as a tool to encourage more action is less contentious than other approaches
Weaknesses The BayStat program attempts to address a problem that is bigger than the jurisdiction
of the stakeholders involved; a similar program at the federal level could coordinate all stakeholders
Limited regulatory authority to target specific sources of nutrients The program is supposed to provide public accountability about specific projects or
agencies that are performing well at cleaning up the bay or not performing well, but this information is currently not readily available and may indicate that the program is not yet fully implemented
While simple statistical summaries of impairments and pollutant reduction activities are easily understood, there is no measure of effectiveness to indicate the contribution of a pollutant reduction effort to cleaning up the bay
BayStat tracks what is being done to address the Bay’s water quality issues, but does not thoroughly address the sources of nutrient pollution (e.g., responsible parties)
References
Cadogan, M. 2006. New Ideas to Improve the Chesapeake Bay: BayStat. http://omalley.3cdn.net/1857d3b7f96ee13e1f_02m6bhe5j.pdf. Accessed February, 2009.
Nunley, K. 2007. Bringing the Bay’s Health into Focus. Maryland Department of Natural Resources, Office of Communications, Annapolis, MD. http://www.baystat.maryland.gov/documents/baystat.pdf. Accessed February, 2009.
O’Malley, M. 2007. Executive Order 01.01.2007.02: BayStat. Office of Governor, Annapolis, MD. http://www.baystat.maryland.gov/documents/01.07.02Baystat.pdf. Accessed February, 2009.
August 2009 D-6

Nutrient Innovations Task Group Report Appendix D
Florida’s Impaired Waters Rule
Overview
This accountability method is based on a Rule (F.A.C. 62-303) issued by the Florida Department of Environmental Protection (FDEP) to revise its methodology for identifying impaired waters and issuing TMDLs. Florida’s Impaired Waters Rule (IWR) brings many nonpoint source polluters under a regulatory framework for the first time. The IWR holds nonpoint sources partly responsible for causing impaired waters and requires the implementation of Best Management Practices (BMPs).
Description
In the late 1990’s Florida was under pressure from environmental groups, EPA, and regulated industries to better identify impaired waters and establish TMDLs. At the time, Florida, like most states, had only recently begun pursuing the TMDL program as a tool to improve water quality. Just prior to a consent decree being reached with EPA to establish TMDLs for waters on its 303(d) list, the Florida Legislature passed the Watershed Restoration Act, which allowed FDEP to revise its methodology for identifying impaired waters and developing TMDLs (Norgart 2004). Shortly thereafter the FDEP adopted chapter 62-303, Florida Administrative Code, the Identification of Impaired Waters (IWR) Rule to establish a methodology for identifying impaired waters and to subsequently develop TMDLs for those waters (Florida Administrative Code 2001).
According to the IWR, waters in Florida are assessed to see if they meet Florida water quality standards (Id., §403.021). Those waters determined by FDEP to not meet water quality standards for a specific pollutant are listed as impaired on the verified 303(d) list. The impairment could be due to point source pollutants, nonpoint source pollutants, or both. The State of Florida also creates a “planning list” of those waters that might be impaired but need more data to confirm or deny the status.
Once a waterbody is listed as impaired, a TMDL is developed for that waterbody. The TMDL includes an analysis of the load allocation of all sources of the pollutant to the waterbody and “reasonable and equitable allocations of the total maximum daily load between or among point and nonpoint sources” (Id., §403.067(6)(b)) (Florida Statutes, 2008). After the TMDL is issued, the FDEP coordinates with a group of stakeholders to develop a Basin Management Action Plan (BMAP) to implement the TMDL. Under the BMAP, a number of point and nonpoint sources of pollution are regulated:
NPDES permits may be reopened to add conditions to meet the load allocation specified in the TMDL.
NPDES permits regulating stormwater are required to implement “best management practices or other management measures…to the maximum extent practicable” (Id., §403.067(7)2.b).
Other state, regional, or locally permitted (non-NPDES) nonagricultural dischargers are required to undertake “pollutant reduction actions” to the “maximum extent practicable” (Id., §403.067(7)2.f).
All other unpermitted nonpoint dischargers included in a BMAP must demonstrate compliance by either implementing best management practices (BMPs) or conducting
August 2009 D-7

Nutrient Innovations Task Group Report Appendix D
water quality monitoring (Id., §403.067(7)2.g). These dischargers include agricultural dischargers and any other dischargers that are identified during the TMDL and BMAP processes as significant sources of nonpoint pollution to the impaired waterbody.
Nonpoint sources are also provided additional incentives to implement management measures and flexibility in meeting its requirements under a BMAP (Hamann 2008). When a nonpoint source implements BMPs, compliance with water quality standards is presumed and additional measures cannot be “require by permit, enforcement action, or otherwise” (Id., §403.067(7)2.i). However FDEP can still amend the BMAP if improvements in water quality are not seen that could add additional requirements. Flexibility is provided to nonpoint sources by the water quality credit trading program. A discharger (point source) required to provide a reduction in load can purchase water quality credits from another discharger identified in the BMAP and allow for the reduction in load to be consolidated to one source (Id., §403.067(8)). Water quality credit trading can provide cost savings and efficiency gains. Assessment of How the Approach is Working For many years Florida has been aggressively pursuing the regulation of nonpoint source pollutants. Florida was the first state in the country to require treatment of stormwater from all new development with its comprehensive stormwater permitting program in 1982. The stormwater rule is a technology-based program which requires a stormwater management system and BMPs to reduce stormwater pollutants for new development (FDEP 2008). In addition to this rule, Florida regulates stormwater with a variety of other programs regulated by the FDEP, water management districts, and local governments (Hamann 2008). In 1987, Congress reauthorized the Clean Water Act and designated certain stormwater sources as “point sources” thereby requiring NPDES permits (Wu et al. 2003). In response to increased complexity, FDEP is developing a unified state stormwater rule to provide more uniform regulations. The nonpoint source pollution requirements of the BMAP are another tool that Florida uses to further reduce nonpoint source pollution in a more targeted manner. The BMP requirement allows for a reduction of nutrient runoff to waters for which water quality testing has shown are in the highest need for clean-up. Since the IWR rule was issued the courts have upheld that a waterbody with no point source pollutants can be listed as impaired. In 2002, the Ninth Circuit court in Pronsolino v. Nastri determined that EPA was correct in identifying a waterbody as impaired even though it was polluted by only nonpoint sources (Norgart 2004). Despite the progressive efforts in Florida to target nonpoint source pollution and its contributions to nutrient impairment, water quality degradation from nutrient impairment remains a significant challenge. According to the 2008 Florida Integrated Report, approximately 1,000 miles of rivers and streams, 350,000 acres of lakes, and 900 square miles of estuaries are impaired for nutrients in Florida (FDEP 2008). In January 2009, EPA issued a determination under Clean Water Act section 303(c)(4)(B) that numeric nutrient criteria are necessary to meet CWA requirements. Numeric nutrient criteria should speed up the TMDL process and allow for more widespread application of the BMAP program (Grumbles 2009).
August 2009 D-8

Nutrient Innovations Task Group Report Appendix D
Summary of Strengths and Weaknesses Strengths
Provides a regulatory mechanism to require BMPs for nonpoint source pollutants on waters that have already been prioritized as the most impaired waters for that pollutant in Florida.
Allows for flexible options to meet nonpoint source regulatory requirements and incentives for implementing the BMPs.
The BMAP BMP mechanism is not the only tool to regulate nonpoint source pollutants in Florida; it is effective as a targeted measure.
Weaknesses
While FDEP claims to assess all of its waterbodies, a large portion of the waterbodies remain in limbo because sufficient water quality data is not available to determine impairment status.
Targeting nonpoint sources of pollution to impaired waters could be seen as an inequitable restriction on only certain polluters, while other nonpoint polluters are not being regulated.
Could be a contentious mechanism for regulating nonpoint source pollutants and provisions of Florida’s IWR have been challenged in court.
References FDEP. 2008. Integrated Water Quality Assessment for Florida: 2008 305(b) Report and 303(d) List Update. Florida Department of Environmental Protection, Division of Environmental Assessment and Restoration, Tallahassee, FL. http://www.dep.state.fl.us/water/docs/2008_Integrated_Report.pdf. Accessed February, 2009. Florida Statutes. 2008. §403.067: Establishment and implementation of total maximum daily loads. http://www.leg.state.fl.us/Statutes/index.cfm?App_mode=Display_Statute&Search_String=&URL=Ch0403/SEC067.HTM&Title=->2008->Ch0403->Section%20067#0403.067. Accessed February, 2009. Grumbles, B. 2009. Determination that New or Revised Nutrient Water Quality Standards are Necessary for Florida. http://www.epa.gov/waterscience/standards/rules/fl-determination20090114.pdf. Accessed February, 2009. Hamann, R. 2008. Managing Nutrient Inputs to Florida Springs: The Legal Framework. http://www.waterinstitute.ufl.edu/research/projects/downloads/p001-Ch7_SpringsNutrients.pdf. Accessed February, 2009. Florida Administrative Code. 2001. Chapter 62-303: Identification of Impaired Surface Waters. http://www.dep.state.fl.us/legal/Rules/shared/62-303/62-303.pdf. Accessed February, 2009. Norgart, C. 2004. Florida’s impaired waters rule: is there a “method” to the madness? Journal of Land Use. 19(2):347–376.
August 2009 D-9

Nutrient Innovations Task Group Report Appendix D
Wu, T., A. Baniukiewicz, and D. Gilbert. 2003. Nutrient Total Maximum Daily Load For Lake Wauberg Outlet, Alachua County, Florida. Florida Department of Environmental Protection, Watershed Assessment Section, Tallahassee, FL. http://www.dep.state.fl.us/water/tmdl/docs/tmdls/final/gp1/lake_wauberg_nut_tmdl.pdf. Accessed February, 2009.
August 2009 D-10

Nutrient Innovations Task Group Report Appendix D
Economic Incentives and Disincentives
Overview
This accountability method is based on a variety of options available to policymakers using economics to limit nonpoint source pollution. Methods summarized include public and private grants and funding, credit and trading programs, purchasing and transferring of development rights, and voluntary or enforced certifications.
Description
A number of economic incentives and disincentives are available to policyholders to limit nonpoint source pollution. Public or private grants and funding will never be enough to fully fund all watershed restoration projects and nonpoint source pollution control strategies. As a result innovative incentive programs need to be used to drive down costs and to most efficiently use the funding that is available. Methods available include public and private grants and funding, credit and trading programs, purchasing and transferring of development rights, and voluntary or enforced certifications.
Grant money and public funding is available from a large number of private and public entities to limit nonpoint source pollution either directly or indirectly. Federal funds are available through programs like EPA’s Clean Water Act (CWA) section 319 program or USDA’s Environmental Quality Incentives Program (EQIP) to directly fund the implementation of best management practices (BMPs). States also have funds available such as the Clean Ohio Fund or Pennsylvania’s Growing Greener Program. Prominent case studies using direct money payments to reduce nonpoint source pollution include New York’s Agricultural Environmental Management (AEM) Program, West Virginia’s North Fork Project, and Utah’s Water Quality Project Assistance Program (WQPAP). New York’s AEM Program provides farmers with technical and financial assistance in developing BMPs using 319 program funds and additional state funds (USEPA 2002a). The North Fork project in West Virginia worked to solve water quality problems in the headwaters of the Potomac River. BMPs to limit nonpoint source pollution included riparian buffers, streambank fencing, and developing alternative livestock watering and feeding strategies. This project included 319 funding and Flood Control Act (PL-534) funding (USEPA 2007). Utah’s WQPAP program provides low interest loans through the state revolving loan program to nonpoint source reduction practices such as agricultural runoff control and streambank restoration (Utah Administrative Code 2009).
Some municipalities and state governments use innovative credit trading programs to fund nonpoint source pollution reductions. These programs can save money while allowing the groups that can most efficiently reduce nutrient or sediment pollution to take action. Examples of these programs include stormwater rate credits in Jefferson County, Kentucky, nonpoint source education incentives in Griffin, Georgia, water quality trading programs, and cap and trade air emissions regulations. In Jefferson County, Kentucky the stormwater utility charges a stormwater utility fee based on the square footage of impervious surface on a property. Credits are offered to property owners that decrease stormwater runoff from the property using retention or detention facilities. For example if the customer reduces stormwater runoff from their property by 30%, the utility would effectively treat the impervious surface area as 30% less square footage (IUPUI undated b). Griffin, Georgia also has a stormwater utility that charges a
August 2009 D-11

Nutrient Innovations Task Group Report Appendix D
stormwater utility fee and has a similar credit for peak flow reduction. In addition, public and private schools are given up to a 50% reduction in stormwater fees if the school participates in teaching a “Water Wise” curriculum to their students (IUPUI undated a). Water quality trading programs like the program in Florida (See Florida’s Impaired Waters Rules F.A.C. 62-303), allow identified dischargers to a waterbody with a TMDL to trade loading credits. For instance, a treatment plant can be paid to reduce even more than its allocated load by a nonpoint source polluter that would cost more to implement BMPs themselves (Florida Statutes 2008). The cap and trade market created as part of air pollution regulations under the Clean Air Act has long been lauded as an efficient approach to pollution regulation. Cap and trade programs work well when the source and quantity of an emission is transparent and able to be linked to a responsible party. Linking nonpoint source pollutants and quantifying the contribution on a large-scale has been challenging.
Another way to preserve land and its natural nonpoint source pollution control function is fee simple acquisition. Land or development rights can be purchased or donated by state and local governments and private groups that have become land stewards to prevent future development, but this can be very costly. A promising solution to this funding problem has been transfer of development rights (TDR) systems. Instead of buying the development right, by setting up a TDR system, a market is created for development rights and one area is designated as a receiving area and the other a sending area. When a developer wants to develop in a receiving area at a higher density than the current zoning they can purchase development rights from the sending area which effectively places that property under a form of conservation easement. Therefore the developer pays to preserve land elsewhere in order to develop an area more densely (USEPA 1993). A TDR system promotes smart growth and reduces the impact of development on nonpoint source pollution. Prominent successful examples of effective TDR systems include Montgomery County, Maryland, The New Jersey Pinelands, and the Tahoe Regional Planning Agency (Preutz 1999).
Voluntary programs that use a certification and/or public pressure to encourage proper nonpoint source pollutant control strategies are also an important economic tool. Products with an environmental certification can increasingly be sold for at higher value than equivalent products without a certification. Examples of these programs include South Carolina’s Forestry BMP Program and Clean Marina Programs. South Carolina runs a voluntary BMP compliance program that uses pressure from timber purchasers and the public as a mechanism for increasing BMP compliance (USEPA 2002b). Several states have instituted Clean Marinas Programs that call for voluntary adoption of BMPs at marinas to minimize impact on water quality. These states offer recognition or certification to those marinas that adopt the appropriate BMPs, for instance, in Maryland marinas, boatyards, and yacht clubs that adopt enough BMPs receive a “Maryland Clean Marinas” certificate and other associated recognition (USEPA 2007).
Assessment of How the Approach is Working
Grants and public funding work well to reduce nonpoint source pollution but are limited in their quantity. In addition, grants are often short-term funds that can be useful as seed money for a program but can be difficult to maintain over the long-term. Credit trading such as water quality trading or stormwater incentives has great potential for increased use, but often requires enabling legislation or regulatory requirements to setup a credit system. TDR systems have
August 2009 D-12
Nutrient Innovations Task Group Report Appendix D
shown success in certain markets but require a sophisticated and coordinated local government to get it started and maintain the TDR. In addition, TDR systems tend to be focused in wealthy areas and areas where demand for development is great. For every example of a successful TDR system, many examples of unsuccessful TDR systems or systems with very limited success exist. Voluntary programs such as recognition or certifications can be very effective in certain arenas and very cost effective, but they certainly will not work for every type of nonpoint source pollutant in every market.
Summary of Strengths and Weaknesses
Strengths Incentives or disincentives (other than just paying for pollution reduction) have the
potential for high efficiency gains and cost savings Increased public pressure and perception will be a driver for polluters to participate in
certifications and implement BMPs Existing regulations have many options for efficiency gains using market driven
techniques such as water quality trading or credit exchanges Little if any legislation is required to implement these approaches and they are often
less contentious than regulatory approaches
Weaknesses Public participation and involvement in incentive programs, like TDRs or certifications, is
vital for success and sometimes very difficult to achieve Some programs, such as TDR systems, would not be effective if scaled up to a regional
or national level Incentives or disincentives are often not backed up with a consequence through a
regulation or other enforcement mechanism Overall nonpoint source reduction goals are often not included in these incentive
approaches
References
Florida Statutes. 2008. §403.067, Establishment and implementation of total maximum daily loads. http://www.leg.state.fl.us/Statutes/index.cfm?App_mode=Display_Statute&Search_String=&UR L=Ch0403/SEC067.HTM&Title=->2008->Ch0403->Section%20067#0403.067 Accessed February, 2009.
IUPUI. Undated a. Stormwater Management Financing Case Study, Griffin, GA. Indiana University-Purdue University Indianapolis, Center for Urban Policy and the Environment. http://stormwaterfinance.urbancenter.iupui.edu/PDFs/GriffinGeorgia.pdf Accessed February, 2009.
IUPUI. Undated b. Stormwater Management Financing Case Study: Louisville-Jefferson County, Kentucky. Indiana University-Purdue University Indianapolis, Center for Urban Policy and the Environment. http://stormwaterfinance.urbancenter.iupui.edu/PDFs/MSDlouky.pdf Accessed February, 2009.
August 2009 D-13

Nutrient Innovations Task Group Report Appendix D
Preutz, R. 1999. Transfer of Development Rights Update. APA National Planning Conference. http://www.design.asu.edu/apa/proceedings99/PRUETZ/PRUETZ.HTM Accessed February, 2009.
USEPA. 2009. The North Fork Project: Farmers’ Cooperation Leads to Proposed Delisting of Degraded River. U.S. Environmental Protection Agency, Office of Water, Washington DC. http://www.epa.gov/owow/nps/Section319III/WV.htm Accessed February, 2009.
USEPA. 2007. Statewide Clean Marina Programs: BMPs, Recognition, and Outreach Help Protect Coastal Resources. U.S. Environmental Protection Agency, Office of Water, Washington DC. http://www.epa.gov/owow/nps/Section319III/innov_marina.htm Accessed February, 2009.
USEPA. 2002a. New York’s Agricultural Environmental Management Program: Incentive-based Program Helps Farmers Meet Tough Standards. U.S. Environmental Protection Agency, Office of Water, Washington DC. http://www.epa.gov/owow/nps/Section319III/innov_ny.htm Accessed February, 2009.
USEPA. 2002b. South Carolina Forestry BMP Compliance Program: Proactive Strategy Raises BMP Compliance Rate. U.S. Environmental Protection Agency, Office of Water, Washington DC. http://www.epa.gov/owow/nps/Section319III/innov_sc.htm Accessed February, 2009.
USEPA. 1993. Guidance Specifying Management Measures for Sources of Nonpoint Pollution in Coastal Waters, Chapter 4: Watershed Protection Management Measure. EPA 840-B-92-002. U.S. Environmental Protection Agency, Office of Water, Washington DC. http://www.epa.gov/owow/nps/MMGI/Chapter4/ch4-2b.html Accessed February, 2009.
Utah Administrative Code. 2009. Rule R317-101: Utah Wastewater Project Assistance Program. Department of Administrative Services, Division of Administrative Rules, Salt Lake City, UT. http://www.rules.utah.gov/publicat/code/r317/r317-101.htm Accessed February, 2009.
August 2009 D-14

Nutrient Innovations Task Group Report Appendix D
Green and Eco-Labeling of Farm Products (Based on Farming Methods)
Overview
The accountability method of green and eco-labeling of farm products is voluntary and based on the potential for increased consumer acceptance of environmentally friendly products and reimbursement for costs of certification.
Description
The Organic Foods Production Act (OFPA) of 1990, adopted as part of the 1990 Farm Bill, requires the United States Department of Agriculture (USDA) to develop national standards for organically produced agricultural products to assure consumers that agricultural products marketed as organic meet consistent, uniform standards (USEPA 2007). USDA promulgated final rules that implemented this legislation in October 2002, which required all growers and handlers who labeled their products as organic to be certified by a state or private agency accredited under the uniform standards developed by USDA. The national organic standards address methods, practices, and substances used in producing and handling crops, livestock and processed agricultural products (Kremen et al. 2004).
USDA's Agricultural Marketing Service implemented a National Organic Program in 2002 as a way to support organic farmers and processors and provide consumer assurance. USDA harmonized the differing standards among dozens of state and private certification organizations that had emerged by the late 1990s, and continues to update rules on organic production and processing. The steps to become a certified organic operation include picking an organic certifier, following national organic standards, keeping records of practices and materials used, and having an annual inspection (USDA 2007; USDA 2009).
The USDA Natural Resources Conservation Service (NRCS) helps organic farmers through programs such as the Agricultural Management Assistance Program, Conservation Technical Assistance Program, and the Environmental Quality Incentives Program. The Agricultural Management Assistance Program, established under the Agricultural Risk Protection Act of 2000 and amended under the 2002 Farm Act, provides financial assistance for conserving practices, such as those used in organic farming, under 3- to 10-year contracts. The program focuses on producers in 15 states where participation in the Federal Crop Insurance Program has historically been low (USDA 2008b). Organically grown crops help reduce soil erosion, enhance water supplies, improve water quality, increase wildlife habitat, and reduce damages from floods and other natural disasters (USDA 2007). Although the Federal Government does not currently offer support for transitioning to organic agriculture, technical assistance is becoming more available (USDA 2007).
Increasingly, timber harvesters are seeking green certifications like those provided by the Forest Stewardship Council (FSC) or South Carolina’s Forestry BMP Program. These certification programs have requirements for sustainable timber harvesting practices like BMPs to reduce erosion. Forest certifications improve the price and markets that are available to timber harvesters, while reducing nonpoint source pollution associated with logging operations. The South Carolina Forestry Commission (SCFC) provides voluntary courtesy BMP inspections to forest managers. Active forestry operations are identified by regular flights over priority
August 2009 D-15

Nutrient Innovations Task Group Report Appendix D
watersheds, voluntary notification, and response to complaints. Forestry BMP specialists provide site-specific BMP recommendations during the initial inspection and then a final inspection is performed after logging is complete to see if the BMPs are implemented. The list of loggers that pass compliance and those that do not is given to the state and to timber product purchasers. Compliance with the voluntary BMP measures has shown a significant increase since the inspection program began (South 2002).
Assessment of How the Approach is Working
Organic farming has been one of the fastest growing segments of U.S. agriculture for over a decade. By the time USDA implemented national organic standards in 2002, certified organic farmland had doubled between 1990 and 2002 from 1 million acres to 2 million acres. By 2005, the acres doubled again to 4 million acres. California remains the leading state in certified organic cropland, with over 220,000 acres, mostly for fruit and vegetable production. Other top states for certified organic cropland include North Dakota, Montana, Minnesota, Wisconsin, Texas, and Idaho. Only a small percentage of the top U.S. field crops—corn (0.2 percent), soybeans (0.2 percent), and wheat (0.5 percent)—were grown under certified organic farming systems. On the other hand, organic carrots (6 percent of U.S. carrot acreage), organic lettuce (4 percent), organic apples (3 percent) and other fruit and vegetable crops were more commonly organic grown in 2005 (USDA 2008a). Some other examples of voluntary approaches that were relatively successful are Dolphin-Safe tuna labeling and Energy Star. Dolphin-Safe tuna labeling was brought on by consumer pressure, while Energy Star is led by the government to help consumers choose energy-efficient products to save money and energy.
Summary of Strengths and Weaknesses
Strengths Reduction in non-point source pollution such as nutrients, sediments, and pesticides Reduction in erosion and overall runoff Promotion of conservation of water resources (nonrenewable resources) Lowering of costs and increased farm income In relation to nutrients programs, this voluntary approach would save farmers fertilizer
costs and a non-regulatory program would be less contentious
Weaknesses Eco-labeling is voluntary and has little regulatory oversight Little incentive to switch to organic if crops need to be distributed widely due to market
pressure Limited mechanisms to reward farmers for switching to organic Farmers must risk high managerial costs and shifting to a new way of farming Little awareness and education for the consumers to support organic farmers Lack of marketing and infrastructure, and no direct payment method to the farmers Require a market mechanism or educational outreach program to encourage consumers
to select goods produced by methods that reduce the amount of nutrients entering our waters
August 2009 D-16

Nutrient Innovations Task Group Report Appendix D
References
Kremen, A., C. Greene, and J. Hanson. 2004. Organic Produce, Price Premiums, and Eco-Labeling in the US Farmers’ Markets. VGS-301-01. U.S. Department of Agriculture, Washington, DC. http://www.ams.usda.gov/AMSv1.0/getfile?dDocName=STELDEV3002983. Accessed February 16, 2009.
USDA. 2009. National Organic Program. U.S. Department of Agriculture, Economic Research Service, Washington, DC. http://www.ams.usda.gov/AMSv1.0/ams.fetchTemplateData.do?template=TemplateA&navID= NationalOrganicProgram&leftNav=NationalOrganicProgram&page=NOPNationalOrganicProgra mHome&acct=nop. Accessed February, 2009.
USDA. 2008a. Organic Production. U.S. Department of Agriculture, Economic Research Service, Washington, DC. http://www.ers.usda.gov/data/Organic. Accessed February, 2009.
USDA. 2008b. Farm and Commodity Policy: Glossary. U.S. Department of Agriculture, Economic Research Service, Washington, DC. http://www.ers.usda.gov/briefing/Farmpolicy/glossary.htm. Accessed February, 2009.
USDA. 2007. Organic Agriculture: Organic Certification—Steps and Links. U.S. Department of Agriculture, Economic Research Service, Washington, DC. http://www.ers.usda.gov/Briefing/Organic/Certification.htm. Accessed February, 2009.
USEPA. 2007. Organic Farming. U.S. Environmental Protection Agency, Washington, DC. http://www.epa.gov/oecaagct/torg.html. Accessed February, 2009.
USEPA. 2002. South Carolina Forestry BMP Compliance Program: Proactive Strategy Raises BMP Compliance Rate. U.S. Environmental Protection Agency, Office of Water, Washington, DC. http://www.epa.gov/owow/nps/Section319III/innov_sc.htm Accessed February, 2009.
August 2009 D-17
Nutrient Innovations Task Group Report Appendix D
Voluntary Agreements with Private Sector
Overview
This accountability method is based on the Water Stewardship Program, a non-profit organization with the goal to reduce nutrient loadings to waters of the U.S. from the food services industry. The program employs Continuous Improvement Programs (CIPs), Corporate Social Responsibility Initiatives (CSRs), and integrated regional efforts to set targeted reduction goals for nutrient releases to waters of the U.S.
Description
Water Stewardship Program, Incorporated, is a non-profit organization dedicated to strengthening voluntary industrial efforts to reduce nutrient inputs to waters of the U.S. by improving ties with government and third party entities to provide scientific and expert advice, and open venues of funding. The program’s ultimate goal is to reduce nutrient pollution to allow the restoration of economically critical functions of water resources. The program has focused on reducing nutrient losses from agricultural production areas to 40% of a predefined baseline and optimizing nutrient inputs to reduce production costs and offset the cost of mitigation measures. The program is overseen by the Water Stewardship Council, which is comprised of representatives from the food services industry, government agencies, and non-government organizations. The Council will also be a forum by which to share findings from CIPs, and discuss programmatic needs and direct future efforts (Water Stewardship Program 2008).
Assessment of How the Approach is Working
The Water Stewardship Program has focused largely on improved accountability using CSRs, which ensure a high level of corporate staff responsibility due to the need to deliver measurable results and the fact that annual CSR reports will be distributed to shareholders. The program also uses CIPs, which are developed by the industry participants in concert with third party professionals recruited and trained by the Water Stewardship Program. CIPs outline conservation choices and measurable practices and innovations to be employed by the industry. The industry’s success in meeting the goals of the CIP is verified biennially by project scientists, and for those failing to meet the predefined goals, a remedial plan is developed to clearly define how the industry can meet the goals of its CIP in the future. The following elements are assessed during the periodic reviews: (1) remedial efforts to achieve targets; (2) the implementation and documentation of improvements; and (3) the successful communication of efforts and improvements. The program also aids the food services industry in procuring governmental agency and independent (i.e. private foundations) expenditure incentives, by leveraging substantial financial contributions from these sources (Water Stewardship Program 2008).
The initial focus of the Water Stewardship program will be on the production level, but the program plans to target the entire food chain, including processors, distributors, and wholesale buyers. Efforts are being piloted in the Chesapeake Bay, Illinois River, and Minnesota River watersheds. One initial effort of the program is the development of nutrient budgets for mid-Atlantic states, specifically Maryland, Pennsylvania, Virginia, and West Virginia. The program is coordinating efforts from land grant universities within each state to develop nitrogen and phosphorus budgets for cropland down to a watershed level. This effort is part of the interstate
August 2009 D-18

Nutrient Innovations Task Group Report Appendix D
and interagency program to mitigate nutrient impacts on the Chesapeake Bay by achieving reductions of 40% as compared to inputs in 1985 (Mid-Atlantic Regional Water Program 2005).
Summary of Strengths and Weaknesses
Strengths Aids the food services industry with procuring funds to reduce nutrient inputs to waters
of the U.S. Coordinates private sector efforts with those of government agencies and other
stakeholders Holds industry accountable via the use CSRs and biennial reviews of the progress made
toward meeting the goals of the CIP Provides access by the industry to government and third party professionals whose
expertise can be called on to help industry achieve nutrient pollution reductions Provides logistical and economic incentive for industry to voluntarily take measures to
mitigate nutrient impacts on waters of the U.S. Use of third party review ensures an independent unbiased review of the success of a
CIP in meeting its goals Non regulatory, which is less contentious and there is no need for new legislation
Weaknesses Program is a new effort, industry participation and program success cannot yet be
gauged The voluntary nature of the program means it lacks regulatory backing to ensure
industrial compliance with the goals of the CIP Program incentives may be too little to entice significant commitments from the food
services industry Unclear as to how certain elements of the program will be funded, specifically the
acquisition and training of project scientists and assessment teams to conduct CIP reviews
The use of CSRs and other measures of accountability may make the industry reluctant to participate
No public accountability Unclear as to which stakeholders are notified when an industry fails to meet its goals
References
Water Stewardship Incorporated. 2008. Water Stewardship: Improving Water Quality, Sustaining Agriculture. http://corporatewaterstewardship.org. Accessed February, 2009.
Mid-Atlantic Regional Water Program. 2005. Nutrient Budgets for Mid-Atlantic States. http://www.mawaterquality.org/. Accessed February, 2009.
August 2009 D-19

Nutrient Innovations Task Group Report Appendix D
The Massachusetts Wetlands Protection Act
Overview
The Massachusetts Wetlands Protection Act1 (the Act) protects wetlands and related public interests (e.g., flood control, prevention of pollution and storm damage, protection of public and private water supplies, groundwater supply, fisheries, land containing shellfish, and wildlife habitat). Under the Act, the state protects these public interests by requiring a careful review of any activity that would “remove, fill, dredge or alter any bank, riverfront area, fresh water wetland, coastal wetland, beach, dune, flat, marsh, meadow, or swamp bordering on the ocean or on any estuary (a broad mouth of a river into which the tide flows), creek, river, stream, pond, or lake, or any land under said waters or any land subject to tidal action, coastal storm flowage, or flooding” (MADEP undated a; MADEP undated b).
Description
The Act is implemented and administered at several jurisdictional levels. Local conservation commissions (the commission),2 consisting of a volunteer board of three to seven members selected by the city council, are responsible for implementation of the Act. At the state level, the Massachusetts Department of Environmental Protection (MADEP) oversees the administration of the law, provides technical training to local commissions, and hears appeals of decisions made by the commissions (MADEP undated a).
The Act is carried out in the following steps (Berkshire Environmental Action Team undated; MADEP undated a):
1) Any party concerned about the impact of a proposed project may file a Request for Determination of Applicability (RDA) to MADEP.
2) Upon receiving an RDA, the commission must schedule a public meeting within 21 days to review the facts and determine whether a project permit will be necessary. The commission should make a site visit before the meeting to prepare for their evaluation of the proposed work. Once a determination is made, the commission will report the decision to MADEP.
3) If a proposed project requires a permit, the party undertaking the activity must file a Notice of Intent (NOI) with both the commission and MADEP, and pay an application fee. The NOI requires a plan that describes the details of the proposed project, buffer zones, and methods that will be taken to prevent degradation.
4) After receiving the NOI, the commission must schedule a public hearing within 21 days after advertising it. The commission should review the NOI and supporting material to prepare for the evaluation of the proposed project.
5) The commission reviews the information and will determine one of the following: a. The applicant needs more information before the commission can reach a
decision. b. There is sufficient information, and the commission will issue a permit. c. There is sufficient information and the commission will deny a permit.
1 Massachusetts General Laws (MGL) Chapter 131, Section 40. 2 Formed under MGL Chapter 40: Section 8C. Conservation commission; establishment; powers and duties.
August 2009 D-20

Nutrient Innovations Task Group Report Appendix D
6) The decision can be appealed by the applicant, MADEP, or third parties (specified under the law) during a 10-day appeal period.
7) Upon issuing a permit, the commission will issue an Order of Conditions if there are certain conditions necessary to prevent endangering nearby wetlands.
This regulation works in parallel with the Inland and Coastal Wetlands Restrictions Acts,3 under which permanent restriction orders have been placed on selected wetlands in over 50 communities. The Inland and Coastal Wetlands Restrictions Acts provide additional protection for selected wetlands by prohibiting certain activities in advance of any work being proposed (MADEP undated a).
Assessment of How the Approach is Working
There is little publicly available information on how the program is working. The Act does provide a mechanism for oversight by both local entities and the state. This mechanism also includes a way for concerned parties to participate in a public process to protect state waters. However, because the Act only provides a minimum level of protection, over 100 communities have local wetlands protection bylaws (e.g., zoning) that provide additional regulatory oversight and protection to wetland resources (MADEP undated a).
Summary of Strengths and Weaknesses
Strengths This regulatory method of state oversight, implementation by local agencies, and
involving the public, may be a good example of transparent implementation of a regulation.
Weaknesses The issuance of the permit is dependent on the local commissions, which means the
commission may need people with specific skill sets to understand the full breadth of impacts of a proposed project.
There is little publicly available information on how much oversight of approved projects exists (e.g., whether an agency assesses a project after it is finished to see its actual impacts).
It may be difficult to standardize the reasoning behind the issuing/denying of a permit if there are multiple commissions that do the decision-making within the state.
References
Berkshire Environmental Action Team. Undated. The Massachusetts Wetlands Protection Act: Understanding the Regulatory Process. http://www.thebeatnews.org/LearningCenter/Regulations/WetlandsProtectionAct/Intro.html. Accessed April, 2009.
3 MGL Chapter 131, Section 40A and MGL Chapter 130, Section 105
August 2009 D-21

Nutrient Innovations Task Group Report Appendix D
MADEP. Undated a. Protecting Wetlands in Massachusetts. Massachusetts Department of Environmental Protection, Boston, MA. http://www.mass.gov/dep/water/resources/protwet.htm. Accessed April, 2009.
MADEP. Undated b. The General Laws of Massachusetts: Chapter 131, Section 40: Removal, fill, dredging or altering of land bordering waters (Wetlands Protection Act). Massachusetts Department of Environmental Protection, Boston, MA. http://www.mass.gov/legis/laws/mgl/131-40.htm. Accessed April, 2009.
August 2009 D-22

Nutrient Innovations Task Group Report Appendix D
Toxic Release Inventory
Overview
This accountability method creates an inventory of the releases of toxic chemical from industrial and federal sites from data collected based on a reporting requirement. The program relies on the public, academic institutions, and other organizations to review the data and convey what is acceptable and unacceptable.
Description
Following several U.S. chemical accidents, Congress passed the Emergency Planning and Community Right-to-Know Act (EPCRA) as a part of the Superfund reauthorization in 1986 (USEPA 2009a). EPCRA’s mandate is twofold: (a) to promote contingency planning for chemical emergencies and (b) to provide the public with previously unavailable information about toxic and hazardous chemicals in their communities. Section 313 of EPCRA created the Toxics Release Inventory (TRI), requiring federal facilities and companies in manufacturing to report specified quantities of certain chemicals released from their facilities. In 1990, Congress passed the Pollution Prevention Act (PPA), requiring facilities to report to the TRI quantities of toxic chemicals managed in waste and the pollution prevention activities they undertake. In 1998, the public gained access to data from additional industrial sectors. Other industries now required to report under EPCRA and the PPA include metal mining, coal mining, coal and oil burning electrical utilities, hazardous waste treatment and disposal facilities, chemicals distributors, petroleum bulk plants terminals, and solvent recycling operations (USEPA 2003).
EPA compiles the TRI data each year and makes it available through several data access tools, including TRI Explorer (http://www.epa.gov/triexplorer) and Envirofacts (http://www.epa.gov/enviro) (USEPA 2009b; USEPA 2008b). Other organizations make the data available through their own data access tools, including Unison Institute, which supports "RTKNet" (http://www.rtknet.org) and Environmental Defense, which developed "Scorecard" (http://www.scorecard.org). Armed with TRI data, communities have more power to hold companies accountable and make informed decisions about how toxic chemicals are to be managed. The data often spurs companies to focus on their chemical management practices since they are being measured and made public. In addition, the data serves as a rough indicator of environmental progress over time (USEPA 2008a).
Assessment of How the Approach is Working
The availability of TRI data to the public is a useful resource for many organizations (USEPA 2003):
Communities use TRI data to begin dialogues with local facilities and to encourage them to reduce their emissions, develop pollution prevention plans, and improve safety measures.
Public interest groups, government, academicians, and others use TRI data to educate the public about toxic chemical emissions and potential risk.
August 2009 D-23

Nutrient Innovations Task Group Report Appendix D
Industry uses TRI data to identify pollution prevention opportunities, set goals for toxic chemical release reductions, and demonstrate its commitment to and progress in reducing emissions.
Federal, state, and local governments use TRI data to set priorities and allocate environmental protection resources to the most pressing problems.
Regulators use TRI data to set permit limits, measure compliance, and target enforcement activities.
Public interest groups use TRI data to demonstrate the need for new environmental regulations or improved implementation and enforcement of existing regulations.
Investment analysts use TRI data to provide recommendations to clients seeking to make environmentally sound investments.
Governments use TRI data to assess or modify taxes and fees based on toxic emissions or overall environmental performance.
Insurance companies use TRI data as one indication of potential environmental liabilities.
Consultants and others use TRI data to identify business opportunities, such as marketing pollution prevention and control technologies to TRI reporting facilities.
The key driving factor of this program is for EPA to collect data and populate a user-friendly, easily accessible database the public can view. Once data is updated, the public is informed and they then have the means to promote direct dialogue with a facility/industry (USEPA 2008d; USEPA, 2009c). Facilities/ industries must change their operations to reduce releases voluntarily, with no direct incentive (e.g., government funding). This method of providing data may be a first step to promoting further understanding among the public about nutrient problems in the United States. For example, reports on agriculture could include the type and amount of fertilizers used on individual farms per year or tons of animal manure produced annually. POTWs could be required to report annual nitrogen and phosphorous loads. Urban areas could report estimates of nitrogen and phosphorous in stormwater discharges annually. In addition, EPA may need guided educational programs.
Summary of Strengths and Weaknesses
Strengths Easy access to a user-friendly TRI database (USEPA 2008c) Readily available information results in more opportunities to inform the public of
current conditions and for citizens and organizations to begin direct dialogue with a facility/industry of concern
With reporting requirements in place, national organizations can conduct risk screening and risk assessments, and initiate discussions with a facility/industry
TRI data convinced some facility managers of the need for an Environmental Management System, which ultimately can help reduce costs and become a public relations and marketing tool
Weaknesses The program relies heavily on public participation after providing data; unless the public
speaks out, there is little incentive for facilities/industries to change “business-as-usual” on their own
August 2009 D-24
Nutrient Innovations Task Group Report Appendix D
Even if a case is made that a facility is a problem, any changes are voluntary, thus there is little incentive for change due to the lack of funding support and regulatory oversight
For nutrients using a TRI approach may need legislation and can be contentious if involved with agricultural fertilizer application
References
USEPA. 2009a. Emergency Planning and Community Right-To-Know Act (EPCRA). U.S. Environmental Protection Agency, Washington, DC. http://www.epa.gov/agriculture/lcra.html#Emergency%20Planning%20and%20Notification. Accessed February, 2009.
USEPA. 2009b. TRI Explorer. U.S. Environmental Protection Agency, Toxics Release Inventory Program, Washington, DC. http://www.epa.gov/triexplorer. Accessed February, 2009.
USEPA. 2009c. Toxics Release Inventory Program. U.S. Environmental Protection Agency, Toxics Release Inventory Program, Washington, DC. http://www.epa.gov/tri. Accessed February, 2009.
USEPA. 2008a. What is the Toxics Release Inventory (TRI) Program. U.S. Environmental Protection Agency, Toxics Release Inventory Program, Washington, DC. http://www.epa.gov/tri/triprogram/whatis.htm. Accessed February, 2009.
USEPA. 2008b. Envirofacts Data Warehouse. U.S. Environmental Protection Agency, Washington, DC. http://www.epa.gov/enviro. Accessed February, 2009.
USEPA. 2008c. Get TRI Data. U.S. Environmental Protection Agency, Toxics Release Inventory Program, Washington, DC. http://www.epa.gov/tri/tridata/index.htm#pdr. Accessed February, 2009.
USEPA. 2008d. How EPA Obtains TRI Data. U.S. Environmental Protection Agency, Toxics Release Inventory Program, Washington, DC. http://www.epa.gov/tri/triprogram/bussinesscycle/busprocess.html. Accessed February, 2009.
USEPA. 2003. How Are the Toxics Release Inventory Data Used? EPA-260-R-002-004. U.S. Environmental Protection Agency, Office of Information Analysis and Access, Washington, DC. http://www.epa.gov/tri/guide_docs/pdf/2003/2003_datausepaper.pdf. Accessed February, 2009.
August 2009 D-25

Nutrient Innovations Task Group Report Appendix D
Pinto Creek Decision
Overview
This accountability method is based on a Ninth Circuit court decision interpreting part of the NPDES program. Limits for new dischargers on impaired waters must be factored into permitting decisions.
Description
Carlota Copper Company proposed to construct and operate an open-pit copper mine and processing facility near Miami, Arizona. At the time, Pinto Creek (a nearby waterbody) was listed on the 303(d) list as impaired because of non-attainment of copper water quality standards. In 1996 Carlota applied for an NPDES permit because they would be discharging pollutants into Pinto Creek. EPA published an initial draft permit in 1998 and later a revised permit in July 2000 (with two new provisions). Petitioners filed for review of the permit and associated NEPA documents one month later. In response, EPA withdrew portions of the NPDES permit and prepared a supplemental environmental assessment analyzing the two new permit conditions. EPA also completed a TMDL for Pinto Creek in 2001. EPA reissued the permit in February 2002 (Friends of Pinto Creek v. United States Environmental Protection Agency, 504 F.3d 1007 (9th Cir. 2007)).
In response to the new permit, petitioners filed an appeal on April 1, 2002 to challenge EPA’s issuance of the permit. The Appeals Board upheld the permit on September 30, 2004, and EPA issued a final NPDES permit (Friends of Pinto Creek 2007). The Petitioners later filed for review in the Ninth Circuit, which vacated the permit because “there [we]re no plans or compliance schedules to bring the Pinto Creek segment ‘into compliance with applicable water quality standards’.” The Court held that issuance of the permit was inconsistent with 40 CFR 122.4(i), an NPDES regulation. (Brief for the Federal Respondent in Opposition to Certiorari, 2008). According to the Court, section 122.4 states that no permit may be issued (Friends of Pinto Creek 2007):
(i) To a new source or a new discharger if the discharge from its construction or operation will cause or contribute to the violation of water quality standards. The owner or operator of a new source or new discharger proposing to discharge into a water segment which does not meet applicable water quality standards or is not expected to meet those standards . . . and for which the State or interstate agency has performed a pollutants load allocation for the pollutant to be discharged, must demonstrate, before the close of the public comment period, that:
1) There are sufficient remaining pollutant load allocations to allow for the discharge; and
2) The existing dischargers into that segment are subject to compliance schedules designed to bring the segment into compliance with applicable water quality standards.
August 2009 D-26

Nutrient Innovations Task Group Report Appendix D
On March 7, 2008, Carlota’s petition for a rehearing was denied. On June 4, 2008 Carlota sought Supreme Court review of the Ninth Circuit Court of Appeals Decision (Brief for Federal Respondent in Opposition to Certiorari 2008), but the Supreme Court denied the petition in January 2009 (Sierra Club 2009).
Compliance schedules in general are schedules of “remedial measures included in a permit or an enforcement order, including a sequence of interim requirements (for example, actions, operations, or milestone events) that lead to compliance with the CWA and regulations” (USEPA 1996). Typically a compliance schedule should only be long enough for dischargers to attain compliance, so they move towards compliance and demonstrate progress throughout the schedule. When a compliance schedule is longer than 1 year, interim dates/milestones are typically included in the permit (to show progress towards attaining compliance with the effluent limitations/requirements).
According to Karl Blankenship, the editor of the Bay Journal, the Pinto Creek case has the potential to prohibit various permits under CWA jurisdiction, including permits for stormwater systems, large animal feedlots, and construction sites greater than one acre in size. In addition, the ruling is in effect for 11 states in the Ninth Circuit and could set a precedent for other decisions throughout the country. As interpreted by the Ninth Circuit, EPA could use the Pinto Creek case to gain leverage to force cleanup of waters throughout the United States. An attorney with the Chesapeake Bay Foundation stated that the ruling could even strengthen the Foundation’s claim in a different lawsuit that EPA has not exercised its full authority to clean up the Chesapeake Bay. Some dischargers in the Bay watershed have already objected to nutrient discharge limits in their permits and want to increase discharges (Blankenship 2009). The Task Group understands that EPA is currently reviewing and evaluating the implications of the Ninth Circuit decision.
Assessment of How the Approach is Working
The Supreme Court denied the petition in January of 2009; no NPDES permit has been issued to Carlota Copper Company.
Summary of Strengths and Weaknesses
Strengths A new discharger will not be allowed under 122.4(i) if the discharge will cause or
contribute to violation of WQS Compliance schedules for existing point sources not already meeting their applicable
WQBELs are required when a new discharger proposes discharging to a water segment that does not meet applicable WQS
Compliance schedules provide milestones/accountability for bringing a discharger into compliance with the rele vant WQBEL
Weaknesses No flexibility in compliance schedules There could be unintended consequences associated with this type of approach; for
example, the ruling could create incentives for lower density development to avoid applying for permits such as stormwater or construction and development
August 2009 D-27

Nutrient Innovations Task Group Report Appendix D
References
Blankenship, K. 2009. Top Court Won’t Review Ban on New Discharges to Polluted Waters. Friends of Pinto Creek. http://savepintocreek.blogspot.com. Accessed February, 2009.
Brief for Federal Respondent in Opposition to Certiorari: Carlota Copper Company, Petitioner v. Friends of Pinto Creek, et al., No. 07- 1524 in the Supreme Court of the United States (writ for certiorari filed June 4, 2008). http://www.usdoj.gov/osg/briefs/2008/0responses/2007-1524.resp.html. Accessed February, 2009.
Friends of Pinto Creek v. United States Environmental Protection Agency, 504 F.3d 1007 (9th Cir. 2007). http://www.ca9.uscourts.gov/datastore/opinions/2007/10/03/0570785.pdf. Accessed February, 2009.
Sierra Club. 2009. Big Win for Clean Water: Supreme Court Refuses to Review Case That Struck Down Open Pit Copper Mine Permit. http://arizona.sierraclub.org/pr_and_alerts/pr_and_alerts_2009/alert_01-12-09.asp. Accessed February, 2009.
USEPA. 1996. U.S. EPA NPDES Permit Writers’ Manual. EPA-833-B-96-003. U.S. Environmental Protection Agency, Office of Water, Washington, D.C. http://www.epa.gov/npdes/pubs/owm0243.pdf. Accessed February, 2009.
August 2009 D-28

Nutrient Innovations Task Group Report Appendix D
Virginia Watershed-based Permit
Overview
This accountability measure is based on state regulation to establish watershed level effluent loading limits for nitrogen and phosphorus in a general NPDES permit. The permit limits for nitrogen and phosphorus are established in addition to other individual permit limits for a facility. Facilities may opt to have an individual permit for nitrogen and phosphorus in lieu of the general permit.
Description
In September 2006, the state adopted a general Virginia pollutant discharge elimination system (VPDES) watershed permit for total nitrogen and total phosphorous discharges for the Virginia tributaries to the Chesapeake Bay (9 VAC 25-820-10 et seq.). The general permit establishes annual effluent loading limits for nitrogen and phosphorus and caps the loads for the watershed. The general permit also establishes the conditions for exchanging credits and purchasing offsets. Existing facilities that have exceeded their allocation, or new/expanded facilities not assigned a waste load allocation can purchase offsets to meet limits (VA DEQ,undated). Only new facilities and those with expanding loads can trade with nonpoint sources to allow for expanded capacity in a watershed.
The permit covers facilities with individual VPDES permits that discharge or propose to discharge total nitrogen or total phosphorous to the Bay or its tributaries (9 VAC 25-820-20). Specifically, the criteria for coverage under the general permit are (USEPA 2007):
A significantly discharging facility: Existing facility that discharge 100,000 gallons or more per day (or an equivalent load) directly into tidal waters, or 500,000 gallons or more per day (or an equivalent load) directly into nontidal waters
New or expanding facility: A permitted facility that proposes to discharge 40,000 gallons or more per day (or an equivalent load) directly into tidal or nontidal waters as a result of that new construction
Important information about the general permit (VA DEQ undated):
Virginia’s general permit was effective January 1, 2007 and expires December 31, 2011. Authorization for all dischargers under this permit expires on the same day and will be
renewed on the same day. All facilities covered by the general permit are required to register by submitting a
registration statement (new or expanding facilities applying after the effective date must submit the registration statement with the application for an individual VPDES permit).
For total nitrogen and total phosphorous requirements, general permit requirements for each facility supersede any individual permit requirements.
Waste load allocations are assigned to each permitted facility, and allocations may be aggregated for owners of multiple facilities.
August 2009 D-29

Nutrient Innovations Task Group Report Appendix D
A compliance schedule is required for the combined waste load allocation for each tributary. Covered facilities must submit compliance plans, either individually or through the Nutrient Credit Exchange Association within nine months of the general permit’s effective date.
Permittees must submit monthly loading data on the date required in the facility’s individual permit.
Assessment of How the Approach is Working
This approach has allowed for a much more streamlined and efficient permitting process for the Virginia DEQ, allowing a few staff members to negotiate a single consolidated permit with 125 load limits and ten schedules of compliance over 15 months instead of having more than a dozen permit writers to negotiate 125 permits with 125 load limits and 125 compliance schedules over five years (USEPA 2007). In addition, the flexibility, cost-effectiveness, and collaboration-oriented approach of the program are anticipated to result in much quicker nutrient reductions than solely relying on technology upgrades (USEPA 2007). Due to the newness of the program, however, there is little information on how well the approach works in practice—no public information on the relative success of the project was readily available for this analysis.
Summary of Strengths and Weaknesses
Strengths Using a watershed based approach for the development of their general permit allowed
Virginia to help address problems with nitrogen and phosphorous in the Chesapeake Bay and its tributaries. The previous individual permits were not based on the same type of watershed analysis.
Exchanging and purchasing credits provides flexibility to facilities that cannot meet limits and rewards facilities that are meeting limits, while still ensuring the total amount of nitrogen and phosphorous in the watershed remains the same.
A general permit provides accountability through the waste load allocations set for each facility.
The trading component of the permit creates a mechanism for point sources to assist in the reduction of nonpoint source loads
Can get greater nonpoint source reductions if new or expanded point source dischargers are forced to reduce more than an equal amount of a nonpoint source load
Weaknesses Nonpoint source loads only lower to compensate for an increased load from point
sources The program is only for “significant dischargers,” as well as new and expanding
facilities— so not all sources are accountable (USEPA 2007). As of 2007, the nonpoint source trading alternative is still under development due to
issues related to estimating nonpoint source loading and BMP load reductions, inspection and monitoring of BMP installation, and enforceability (USEPA 2007).
August 2009 D-30

Nutrient Innovations Task Group Report Appendix D
References
VA DEQ. Undated. Fact Sheet: Issuance of a General VPDES Permit to Discharge to State Waters and State Certification under the State Water Control Law. Virginia Department of Environmental Quality, Richmond, VA. http://www.deq.virginia.gov/export/sites/default/vpdes/pdf/VAG72FactSheet2006.pdf. Accessed February, 2009.
Virginia State Water Control Board. 2006. 9 VAC 25-820-10 et seq. Virginia Water Quality Standards. Statutory Authority: § 62.1-44.15 3a of the Code of Virginia. Virginia State Water Control Board, Richmond, VA. http://www.deq.state.va.us/export/sites/default/vpdes/pdf/9VAC25-820-NutrientDischargesGP2007-Amd2008.pdf. Accessed July, 2009.
USEPA. 2007. Watershed-Based Permitting Case Study: Chesapeake Bay Watershed, Virginia. U.S. Environmental Protection Agency, Washington, DC. http://www.epa.gov/npdes/pubs/wq_casestudy_factsht13.pdf. Accessed July, 2009.
August 2009 D-31

Nutrient Innovations Task Group Report Appendix D
Strengthening Reasonable Assurance for TMDLs
Overview
This accountability method is based on reasonable assurances, which are part of TMDLs under the Clean Water Act (CWA). Reasonable assurances are the documentation of the acountability from states for meeting Total Maximum Daily Load (TMDL) load allocations for nonpoint sources.
Description
When a TMDL is developed for waters impaired by only point sources, NPDES permits provide reasonable assurance that the TMDLs’ wasteload allocations (WLA) will be implemented. In cases where a TMDL is developed for waters impaired by a combination of point and nonpoint sources (and the WLA is based on assumed reductions from nonpoint sources), EPA’s Guidance for Water Quality Decisions: The TMDL Process (1991) and policy memorandum “New Policies for Establishing and Implementing Total Maximum Daily Loads (TMDLs)” (Perciasepe 1997) maintain that the state provide reasonable assurances that the nonpoint source load allocations will be met. Although, EPA regions are encouraged to work with states to attain load allocations for waters impaired by nonpoint sources alone. However, EPA cannot disapprove a TMDL for nonpoint source-only impaired waters, which do not have a demonstration of reasonable assurance that nonpoint source load allocations will be achieved, because such a showing is not required by current regulations. (USEPA 2002).
Reasonable assurances can be non-regulatory, regulatory, or incentive-based and should be consistent with applicable laws and programs (Perciasepe 1997). Inclusion of reasonable assurance in TMDLs typically ranges from general description of the programs available to support load allocation implementation (e.g., CWA section 319 grant program) to detailed implementation plans documenting planned implementation activities, responsible parties, schedules, and funding estimates. The types of information included to provide reasonable assurance can reflect the agencies involved in implementation. For example, when local municipalities will be responsible for implementing load allocations, reasonable assurances might include descriptions of local ordinances or zoning regulations in addition to planned management practices. Alternatively, in areas with federally managed land, a memorandum of understanding between the responsible agency (e.g., U.S. Forest Service) and the state might be included to provide reasonable assurance.
In cases where a state has not developed a plan for achieving TMDL load allocations for nonpoint sources, the regions may take additional steps for encouraging states to do so. For example, Perciasepe (1997) recommends that the regions focus grant funding toward states that provide reasonable assurances that nonpoint source load allocations will actually be achieved. The grants may take the form of Performance Partnership grants or grants under CWA sections 104(b)(3), 106, 319, or 604(b) (Perciasepe 1997).
August 2009 D-32
Nutrient Innovations Task Group Report Appendix D
Assessment of How the Approach is Working
When the state provides reasonable assurance based on specific and planned implementation activities, this can be beneficial in reducing nutrients. However, when reasonable assurance is generic and not site-specific, it is probably less likely that that TMDL will be implemented.
Summary of Strengths and Weaknesses
Strengths To maintain NPDES permit limits based on the waste load (i.e., point source) allocation
in a combination point and nonpoint source TMDL, heightened accountability exists for achieving and maintaining the nonpoint source load allocation in the TMDL.
Places focus on implementation of TMDLs and related allocations, rather than just development
No new regulations required
Weaknesses Reasonable assurance is not the mechanism that provides regulatory nonpoint source
controls. Rather, reasonable assurance is the document of existing mechanisms to achieve nonpoint source controls.
Lack of reasonable assurance is not a basis for disapproving a nonpoint source only TMDL.
Development and review of a TMDL may be labor intensive depending on the level of reasonable assurance needed to demonstrate nonpoint source loads in the TMDL can be achieved and maintained.
Loads and reductions for differing watersheds are not the same (equity issue)
References
Perciasepe, R. 1997. New Policies for Establishing and Implementing Total Maximum Daily Loads (TMDLs). Memo from Robert Perciasepe, Assistant Administrator, U.S. Environmental Protection Agency, Washington, DC.
USEPA. 2002. Guidelines for Reviewing TMDLs under Existing Regulations Issued in 1992. U.S. Environmental Protection Agency, Washington, DC.
August 2009 D-33
Nutrient Innovations Task Group Report Appendix D
Connecticut Nitrogen Credit Exchange Program
Overview
In 2001, Connecticut and New York, together with EPA, developed a TMDL for Long Island Sound. One of Connecticut’s management strategies to reduce nitrogen was to develop a nitrogen trading program among 79 sewage treatment plants located throughout the state. Established in 2002, the Nitrogen Credit Exchange Program aims to reduce the nitrogen load from sewage treatment plants by 65 percent by 2014 (CTDEP undated). This program is driven by the Comprehensive Conservation and Management Plan (CCMP) for the Long Island Sound National Estuary Program, or the Long Island Sound Study (LISS), which calls for the reduction of total enriched nitrogen from point and nonpoint sources by 58.5 percent from the 1990 established base loads (CTDEP 2007).
Description
A key component of Connecticut’s Nitrogen Credit Exchange Program is a general permit for nitrogen that includes all participating publicly owned treatment works (POTWs). The general permit establishes annual nitrogen removal limits and sets monitoring and reporting protocols. Facilities that discharge less total nitrogen than the limit established in the general permit will be considered in compliance with the general permit and will be credited for the amount of nitrogen removed beyond the set limit. The Connecticut Department of Environmental Protection (DEP) will purchase all equivalent nitrogen credits generated by facilities that achieve compliance in this way (CTDEP 2003). Alternatively, facilities may achieve compliance by purchasing nitrogen credits from the state (CTDEP 2003).
The general permit accounts for the effects of geographical differences between POTWs with the establishment of attenuation or equalization ratios. These ratios give plants closer to the Sound an “economic incentive to upgrade their facilities and create nitrogen credits, and encourage distant plants to purchase credits” (USEPA 2007).
The Nitrogen Credit Exchange Program does not currently include nonpoint sources in its nitrogen trading program, though the enabling legislation includes provisions that allow the Nitrogen Credit Advisory Board (the regulatory body that oversees the general permit) to consider the “potential and viability of including other nitrogen sources” (CTDEP 2007). DEP conducted an evaluation of the potential for stormwater and nonpoint source trading and found that “the costs to generate a nitrogen credit far exceed those applicable to POTWs” (CTDEP 2007). Also, the difficulty of tracking and monitoring diffuse sources within Connecticut’s 169 municipalities create a number of accountability constraints (CTDEP 2007).
Despite these challenges, DEP will continue to explore the possibility of including nonpoint sources in the trading program, most likely as an incentive-based program rather than a free-market approach (CTDEP 2007). The benefits of including stormwater/nonpoint source trading may outweigh potential disadvantages, especially as the price of credits within the program continues to rise over time. “Connecticut and New York are also obligated to meet a stormwater and nonpoint source load allocation under the TMDL and are using Phase II (MS4) permitting programs, CWA section 319 nonpoint source programs, and CZARA Section 6217 coastal nonpoint source programs as the mechanisms to meet the load allocation” (CTDEP 2007). This
August 2009 D-34

Nutrient Innovations Task Group Report Appendix D
may provide further incentive for implementing a stormwater/nonpoint source trading component. Assessment of How the Approach is Working After five years of implementation, the program is well underway, and won EPA’s first Blue Ribbon Water Quality Trading Leadership Award in 2007 (CTDEP 2008). According to US EPA: Nearly $11.6 million in credits have been generated and sold, representing 5,533,686 credits for a net equalized nitrogen removal of 508,626 pounds. The total aggregate equalized load to the Sound has kept pace with Connecticut’s reduction goals. The price per pound of nitrogen discharged has ranged from $1.65 (in 2002) to $3.40 (in 2006), with an anticipated increase over the next ten years. The economic benefit is realized when considering that 46 municipalities have purchased credits totaling $11,523,094 (with the state of Connecticut contributing only $33,017 to the program) to pay 33 municipalities for the sewage treatment plant (STP) improvements that enable those plants to discharge nitrogen at levels below their permitted wasteload allocation (WLA) of nitrogen. This greatly helped toward the aggregate goals of nutrient reduction (USEPA 2007). Summary of Strengths and Weaknesses Strengths
The program provides an innovative approach to achieving water quality goals efficiently and economically (CTDEP 2008).
The program allows facilities facing higher pollutant control costs to “meet regulatory obligations by purchasing equivalent pollutant reductions (i.e., credits) from other sources that are discharging pollutants below their allotted limits and thus have credits to sell” (CTDEP 2008).
The program is expected to save the state between $200 million and $400 million in wastewater treatment construction costs over the alternative of implementing nitrogen removal projects at all 79 facilities listed in the general permit (CTDEP 2007).
Weaknesses
The Nitrogen Credit Exchange Program does not currently include a nonpoint source component.
References CTDEP. Undated. Nitrogen Control Program for Long Island Sound. Connecticut Department of Environmental Protection, Hartford, CT. http://www.ct.gov/dep/cwp/view.asp?A=2719&Q=325572 Accessed April, 2009. CTDEP. 2008. Sound Outlook: A Newsletter of the Connecticut Department of Environmental Protection. Connecticut Department of Environmental Protection, Hartford, CT. http://www.ct.gov/dep/lib/dep/long_island_sound/soundout/sound_outlook_ february_2008.pdf. Accessed February, 2009.
August 2009 D-35

Nutrient Innovations Task Group Report Appendix D
CTDEP. 2007. Connecticut’s Nitrogen Credit Exchange—An Incentive-based Water Quality Trading Program. Connecticut Department of Environmental Protection, Hartford, CT. http://www.ecos.org/files/2852_file_CT_Water_Quality_Trading_Summary_2007.doc. Accessed March, 2009; site no longer available.
CTDEP. 2003. Connecticut’s Nitrogen Control Program. Connecticut Department of Environmental Protection, Hartford, CT. http://www.envtn.org/docs/ct_fact_sheet.PDF Accessed March, 2009.
USEPA. 2007. Newsletter of the Long Island Sound Study. U.S. Environmental Protection Agency, Long Island Sound Office, Stamford, CT. http://www.longislandsoundstudy.net/pubs/news/fall07.nitrogen.htm. Accessed February, 2009.
August 2009 D-36

Nutrient Innovations Task Group Report Appendix D
Dutch Nutrient Trading System
Overview
Agricultural operations in the Netherlands function under manure management regulations established in response to a manure surplus from intensive livestock operations that experienced rapid growth in the 1960s and 1970s. Regulations include a nutrient trading program and other tools and programs to manage manure.
Description
The Dutch Nutrient Trading System was established as part of a suite of manure management policies. In 1984, the Interim Law for Restriction of Pig and Poultry Farms was passed to prohibit new livestock farms in specific regions and limit development in other areas (Wossink 2003). In 1987, the Manure Law and the Soil Protection Act were passed, replacing the Interim Law.
The Manure Law established a cap of 125 kilograms of phosphate per hectare of land from all animal sources (Wossink 2003). The difference between the farm’s actual manure production (reference amount) and the assessed acreage-based phosphate rights was used to determine which farms had a manure surplus and which had a manure deficit (Wossink 2003). A deficit farm could increase animal production on the basis of unused land-based manure production rights. For a manure surplus farm, such an increase in production capacity was possible only by buying additional land (Wossink 2003).
Between 1990 and 1998, phosphate limits for manure production were lowered in a series of stages and a subsidized infrastructure was set up for transporting manure from areas with manure surplus to areas with a deficit (Oenema 2004). This period also saw a shift in focus to nitrate in groundwater with the approval of the 1991 EU Nitrates Directive, which aims to reduce pollution caused by nitrogen from agricultural sources, including the potential pollution of groundwater (Oenema 2004).
In 1994, manure production rights became tradable and nutrient accounting became obligatory for both phosphate and nitrogen (Wossink 2003). For each farm, the difference between the land-based quota of 125 kilograms of phosphate per hectare and the farm’s reference amount was designated as tradable (Wossink 2003). Regulations for trading these non-land-based quotas were established to limit any increase in swine production (including animal type-based trading rules and geographical trading restrictions), which was perceived to be the source of the most serious environmental problems (Wossink 2003). Also, taxes were placed on nutrient surpluses above the allotted quotas and additional requirements for new buildings were announced with a goal of reducing ammonia emissions (Wossink 2003).
In 1998, policies moved away from quotas, and the Mineral Accounting System (MINAS) (a farm level record of all inputs and outputs of nitrogen and phosphate) and manure application limits based on nitrogen were implemented. MINAS set limits of nitrogen and phosphate that can be applied and taxes any surpluses over those limits (Oenema 2004). This change meant that a farm’s legal production capacity was no longer determined by the amount of quota but by its capacity for manure disposal—either by land application (on-site) or by hauling manure to a
August 2009 D-37

Nutrient Innovations Task Group Report Appendix D
crop farm in a deficient region (Wossink 2003). These limits have helped drive up the cost of manure disposal (Oenema 2004).
Assessment of How the Approach is Working
The effectiveness of the manure policies is uncertain. Monitoring programs show nitrogen and phosphate application limits have decreased surpluses and improved nitrogen and phosphate use efficiency by over 50 percent at the farm level within a 15-year period (Oenema 2004). In cattle and dairy farming, reduction in animal numbers can be completely ascribed to factors unrelated to the quota system. During the 15 year period, the quota system for swine and poultry seemed to prevent an increase in animal numbers. Overall, waste production likely would have been 5-10 percent higher without the quota system (Wossink 2003).
The economic costs and administrative burden of the program are quite high—especially for specialized livestock farmers and the government. In 1998 to 2000, dairy farms paid on average 1,000 to 2,000 euro and pig and poultry farms paid 4,000 to 5,000 euro on average (per farm) to account for nitrogen and phosphate surpluses at farm level (Oenema 2004). The administrative costs of the quota system (along with the related manure management policies) are about 44 million euro per year (as of 2003) (Wossink 2003).
Generally, the manure management policies have not been favorably received. The shift to nitrogen and phosphate application limits in the 1990s was met by massive protests from farmers, forcing union leaders to distance themselves publicly from the plan. Environmental organizations, stakeholders, and drinking water suppliers also had concerns about meeting environmental goals (Wossink 2003). In 1993, the Ministries of Agriculture and the Environment and the farmer’s union agreed that by 1998 the quota system would become obsolete and replaced by a nutrient accounting scheme at the farm level. Some questioned whether the quota system had to be introduced, and there was friction between farmers and the government (Wossink 2003).
The European Commission has not accepted MINAS as a suitable instrument for achieving the objectives of the EU Nitrate Directive. By the end of 1999, the European Commission brought the Netherlands government to court, which condemned the manure policy. The Netherlands must soon implement new regulations for nitrogen and phosphate compatible with the Nitrate Directive (Oenema 2004).
Summary of Strengths and Weaknesses
Strengths Increased economic costs for nutrient application (in the form of the levy’s
administrative and manure disposal costs) have encouraged farmers to become more efficient in their use of nitrogen and phosphate (especially in the case of animal nutrition), decreasing the average surpluses of nitrogen and phosphate by more than 50 percent in 15 years (Oenema 2004).
Manure quotas were established to account for differences in livestock type and geographical region to target intensive agricultural practices (such as swine and broiler production) in manure surplus areas.
The system encourages compliance with a tax penalty.
August 2009 D-38

Nutrient Innovations Task Group Report Appendix D
Weaknesses The initial quota over-allocated by 10-25% due to inaccurate data (Wossink 2003). Uncertainty in the stability and effectiveness of the policy affected quota market and
prices considerably (Wossink 2003). Many policy experts placed too much faith in technical solutions and ignored insights
provided by ex ante studies; misunderstanding the local agricultural economy weakened the policy (Wossink 2003).
The policy did not reflect the position of the swine industry as an exposed sector (an industry affected by foreign competition). This became a major bottleneck in the system (Wossink 2003).
Administration costs for the manure programs are high (about 44 million euro per year) and there might be little environmental benefit (Wossink 2003).
Many farmers (especially those raising pigs) were unconvinced of the environmental benefits of the policy and were reluctant to adopt the manure management measures. This sector was most affected by the fees and restrictions imposed by the policy (Wossink 2003).
References
Oenema, O. 2004. Governmental policies and measures regulating nitrogen and phosphorus from animal manure in European agriculture. Journal of Animal Science 82:E196–206. http://jas.fass.org/cgi/content/full/82/13_suppl/E196. Accessed April, 2009.
Wossink, A. 2003. The Dutch Nutrient Quota System: Past Experience and Lessons for the Future. Paper prepared for the OECD workshop on “The Ex-Post Evaluation of Tradeable Permit Regimes.” http://www.envtn.org/docs/Dutch_trading_text.pdf. Accessed March, 2009.
August 2009 D-39

Nutrient Innovations Task Group Report Appendix D
Maryland Policy for Nutrient Cap Management and Trading
Overview
Maryland’s Policy for Nutrient Cap Management and Trading is a voluntary program that allows for identifying and trading nutrient “credits” between point and nonpoint sources. It is designed to accommodate growth while maintaining nutrient caps (MDE 2008).
This trading program, which was developed to help Maryland meet nutrient reduction goals for Chesapeake Bay restoration and TMDL requirements, will be issued in three phases. Phase I (issued in March 2008) addresses trading among point sources, and Phase II (agricultural draft issued February 2009) addresses trading among point sources and nonpoint sources. There are also plans for Phase III, which will address trading among nonpoint sources (MDA and MDE 2008). This fact sheet focuses primarily on Phase II, trading between point and nonpoint sources.
Description
Phase II of the Policy for Nutrient Cap Management and Trading allows point sources to purchase nutrient credits from nonpoint sources. Anticipated buyers include new and expanding point sources that need to acquire credits to achieve their baselines once they have met their minimum requirements (MDE 2008).
Nutrient loads are calculated on a watershed scale. Geographical boundaries of trading are based on three large watersheds or “trading regions” that include the Potomac, Patuxent, and Eastern Shore and Western Shore tributary watersheds (including the Susquehanna watershed). Pollutant reductions will be calculated within these defined regions to ensure that baseline requirements are met (MDE 2008).
Key principles of Phase II include the following (MDA 2008):
1) Any generator of agricultural nonpoint source credits must first demonstrate that they have met the baseline water quality requirements of their watershed. These include the minimum level of nutrient reductions outlined in the Tributary Strategies of the applicable TMDL requirements.
2) Agricultural generators must be in compliance with all local, state, and federal laws, regulations, and programs. The credit generator and trade can not cause or contribute to water quality effects locally, downstream, or bay-wide.
3) Those portions of best management practices (BMPs) funded by federal or state cost share can not be used to generate credits during the life span of the project. However, credits derived from practices implemented with the sellers out of pocket share are eligible after the effective date.
4) The Agricultural Trading Program is not intended to accelerate the loss of productive farmland. Therefore, credits will not be generated under this policy for the purchase and idling of whole or substantial portions of farms to provide nutrient credits for use off site.
August 2009 D-40

Nutrient Innovations Task Group Report Appendix D
5) Trades must result in a net decrease in loads. A portion of the agricultural credits generated in a trade will be retired and used to achieve Tributary Strategies or TMDLs. The other portion becomes tradable credit.
6) An agricultural practice can only generate credits once it is installed or placed in operation.
“Tradable credits can be generated from any planned agronomic, land conversion, or structural practice that is shown to reduce nutrient loadings below the applicable baseline” (MDA 2008). These credits are determined using BMP efficiency rates, using the latest science and technical information (MDA 2008). The three categories of credit-generating practices include the following (MDA and MDE 2008):
1) BMPs with “approved” load reductions 2) BMPs requiring technical review 3) Other BMPs, practices, or innovative approaches
The Maryland Department of the Environment (MDE) intends to create a central trading registry to post, track, and market agricultural credits once certified (MDA 2008).
Assessment of How the Approach is Working
Very little information is currently available on the effectiveness of the program. This policy is still in its infancy and additional time is required to fully appreciate its effectiveness in managing nutrient loading in Maryland waters.
Summary of Strengths and Weaknesses
Strengths The Policy is designed so that trading is not available as a substitute for required
upgrades to waste water treatment plants (WWTP). Nutrient reductions achieved through these upgrades must be maintained regardless of nutrient trading activity (MDE 2008).
The Policy provides financial incentive for nonpoint sources to install and maintain BMPs to reduce nonpoint source pollution.
Phase II provides an alternate way for point sources to reduce nonpoint source pollution and meet reduction targets.
This program allows for continued growth despite fixed nutrient caps (MDE 2008).
Weaknesses Because the program is in its early stages, there is not enough information to determine
its effectiveness to control nutrients and maintain growth. The program is voluntary, especially for the agriculture community. Changes in agronomic practices (such as crops grown) may have an impact on the
effectiveness of the program.
August 2009 D-41

Nutrient Innovations Task Group Report Appendix D
References MDA. 2008. Maryland Policy for Nutrient Cap Management and Trading in Maryland’s Chesapeake Bay Watershed Phase II A: Guidelines for the Generation of Agricultural Nonpoint Nutrient Credits (DRAFT). Maryland Department of Agriculture, Annapolis, MD. http://www.mda.state.md.us/nutrad/docs/Phase%20II-A_Crdt%20Generation.pdf Accessed March, 2009. MDA and MDE. 2008. Maryland Trading Program Overview. Maryland Department of Agriculture and Maryland Department of the Environment, Annapolis, MD. http://mdnutrienttrading.org/docs/nutradingintro.pdf. Accessed February, 2009. MDE. 2008. Contemplated Nutrient Cap Management and Trading Policy. Maryland Department of the Environment, Annapolis, MD. http://www.mde.state.md.us/ResearchCenter/Publications/General/eMDE/vol3no6/ nutrientcap.asp. Accessed February, 2009.
August 2009 D-42

Nutrient Innovations Task Group Report Appendix D
Ohio Water Quality Trading
Overview
Ohio’s water quality trading rules include provisions for establishing a water quality trading program in Ohio. Water quality trading is a “voluntary program that allows National Pollutant Discharge Elimination System (NPDES) permit holders (point sources) to meet regulatory obligations by using pollutant reductions generated by another wastewater point source or nonpoint source” (OEPA 2007).
Description
Ohio’s water quality trading rules establish requirement that water quality trading activities can only happen with an approved water quality trading management plan (the rules set forth timelines and procedures for the submittal of water quality trading management plans for trading activities already in effect) (OAC 2007).
The goals of Ohio’s Water Quality Trading Rules include the following (Stuhlfauth 2008):
Facilitate watershed-based approaches to improving water quality. Improve water quality and minimize the costs of achieving and maintaining water
quality standards. Provide economic incentives for voluntary pollutant reductions from point and nonpoint
sources. Achieve additional environmental benefits beyond pollutant reductions, such as
restoring natural flow patterns, improving aquatic habitat, increasing the ability of streams to process certain pollutants, and creating stream buffers and shading.
The water quality trading rules are voluntary, so an NPDES permit holder will be affected by the rules only if the permittee decides to participate in a water quality trading program. Participating in a water quality trading program gives permit holders an alternate means of complying with permit limits that could result in cost savings when compared to installing additional treatment capabilities at the wastewater treatment plant. These water quality trading rules provide “an opportunity for point sources and nonpoint sources to work together in mitigating water quality impacts within their watershed” (OEPA 2007).
Current Water Quality Trading Activities in Ohio
Great Miami River Basin—This is a wastewater-scale program with the Miami Conservancy District acting as a third party broker. Wastewater treatment plants will participate by funding nonpoint source nutrient reduction projects in the Stillwater River sub-basin. There is an approved TMDL for the Stillwater basin. A TMDL for the Great Miami River mainstem is projected for 2013 (Stuhlfauth 2008).
Sugar Creek, Tuscarawas River Basin—The Alpine Cheese Company installed treatment for part of its required phosphorus reduction. They will fund nonpoint source projects to generate credits for the remainder of the reduction. The Holmes County Soil and Water Conservation District will act as third party broker. There is an approved TMDL for this area (Stuhlfauth 2008).
August 2009 D-43

Nutrient Innovations Task Group Report Appendix D
Upper Little Miami River Basin—Provisions that allow trading to meet Phase 2 phosphorus reductions are included in the NPDES permits of wastewater treatment plants. There is an approved TMDL for this area. Greene County may use a point source/point source trade and a point source/nonpoint source trade to achieve TMDL limits (Stuhlfauth 2008).
Assessment of How the Approach is Working
The water quality trading rules have only been in effect for a little over a year, so there has not been much time to develop a good understanding of how the program is functioning. The new rules, however, should make it easier for future development of water quality trading programs in Ohio, as the rules establish common procedures and regulations that can lead to a systematic and coordinated approach to water quality trading.
Summary of Strengths and Weaknesses
Strengths The water quality trading rules support the development of water quality trading
programs in Ohio and accommodate programs already in effect, stipulating timelines for existing programs to adjust to the new regulations (OAC 2007).
The rules accommodate the generation of credits from both point and nonpoint sources of pollution (OAC 2007).
The rules allow for a great deal of flexibility—each new program can establish its own baselines and trading ratios, for example, allowing for customization to different circumstances (OAC 2007).
The rules include provisions for establishing a public participation process, allowing for open participation in the planning process (OAC 2007).
Weaknesses Flexible rules may cause discrepancies in how trading is managed by different groups.
References
Stuhlfauth, G. 2008. Water Quality Trading In Ohio. Letter from Gary Stuhlfauth, Ohio Environmental Protection Agency, Division of Surface Water, Columbus, OH. http://www.conservationinformation.org/pdf/workshophandout2.pdf. Accessed March, 2009.
OAC. 2007. OAC Chapter 3745-5: Water Quality Trading. Ohio Administrative Code. http://www.epa.ohio.gov/portals/35/rules/05_all.pdf. Accessed March, 2009.
OEPA. 2007. Rules for Water Quality Trading, Ohio Administrative Code Chapter 3745-5. Ohio Environmental Protection Agency, Columbus, OH. http://www.epa.ohio.gov/LinkClick.aspx?fileticket=hljUnWqlNGw%3d&tabid=3518. Accessed March, 2009.
August 2009 D-44

Nutrient Innovations Task Group Report Appendix D
Pennsylvania Nutrient Trading Program
Overview
The voluntary Pennsylvania Nutrient Trading Program (the Program), modeled after the national emissions cap and trade programs, helps maintain and improve water quality using market mechanisms to reduce nutrients at lower costs. Trading can take place between any combination of eligible point sources, nonpoint sources, and third parties. Currently trading can only occur in the Susquehanna and Potomac River Watersheds, and only total nitrogen, total phosphorus, and total sediment reduction credits can be traded (PADEP 2008).
Description
In December 2006, the Pennsylvania Department of Environmental Protection (PADEP) issued the Final Trading of Nutrient and Sediment Reduction Credits—Policy and Guidelines, which provided guidance for the Program (Commonwealth of Pennsylvania 2008) The Program is a voluntary mechanism that is subordinate to applicable laws and regulations.4 It allows point and nonpoint sources that meet their environmental obligations to generate credits, which can then be traded to others who are in need of nutrient reduction credits. The trading program is operated through a joint effort between the Central Office and Department Regional Offices (PADEP 2006).
For a point source to generate and sell credits, a facility must operate below the discharge loading limits set in its National Pollution Discharge Elimination System (NPDES) permit. These “credits” can be purchased by another facility who cannot meet its discharge requirements (due to various reasons, including holding off upgrades to technology for a future date). Credits can also be generated by nonpoint source dischargers, such as farmers. To be eligible, a farmer implements one of 24 established best management practices (BMPs) that are calculated into credits (PADEP 2006; PADEP 2007).
The Program allows the trading of nitrogen, phosphorus, and sediment under the following principles: “(1) trades must involve comparable credits (e.g., nitrogen must be traded for nitrogen); (2) trades must be expressed as mass per unit time (e.g., pounds per year); (3) trades can occur only between eligible parties; and (4) credits generated by trading cannot be used to comply with existing technology-based effluent limits except as expressly authorized by federal regulations” (PADEP 2006).
The process for approving and tracking nutrient credits is as follows (PADEP 2006; PADEP 2008):
Certification Dischargers seeking credit approval will use pre-approved calculation methods to
calculate their credits. For nonpoint sources, PADEP expects that proposals will contain scientifically-recognized methods to demonstrate nutrient and sediment reductions.
Submittal of a proposal by the discharger.
4 Pennsylvania Clean Streams Law (35 P.S. §§ 691.1 –691.1001); Federal Water Pollution Control Act (33 U.S.C.A. §§ 1251 - 1387); 40 CFR Part 122; and 25 Pa Code Chapters 92, 93 and 96
August 2009 D-45

Nutrient Innovations Task Group Report Appendix D
Proposals will be reviewed by a panel of PADEP and selected experts for technical acceptability and consistency with the Program, policy, and legal requirements.
PADEP will make a determination, and if credits are approved, PADEP may include conditions that must be met before registration of a trade
Verification A Verification Plan is submitted by the discharger (annually) with documentation that
nutrient reduction activities have taken place. PADEP (or approved third parties) use a combination of record keeping, monitoring,
reporting, inspections (including site-visits), self-certifications, and compliance audits to ensure that the credit-generating obligations are being met.
Registration and Tracking Credits must be approved by PADEP and are registered before a trade can occur. PADEP
uses an online marketplace tool such as NutrietNet (http://pa.nutrientnet.org) to assist with the registration, tracking and application of credits. NutrientNet is an online application that includes estimation tools to calculate the amount of credits needed or generated by a particular practice, and where users can buy or sell credits.
PADEP register credits annually and provide credits with registry number for reporting and tracking purposes.
Assessment of How the Approach is Working
The trading program is a relatively new program, and its guidelines (Trading of Nutrient and Sediment Reduction Credits —Policy and Guidelines) were finalized in December 2006 (PADEP 2008). As of August 2008, 57 proposals have been submitted for review. Thirty two proposals have been approved for 702,892 nitrogen credits, 80,072 phosphorus credits, and 35,593 sediment credits (Reuters 2008). Although there are real-time updates of registered credits on NutrientNet, as well as on state Bulletins (e.g., Commonwealth of Pennsylvania 2008), which seem to be posted irregularly, there seems to be little publicly available information on program effectiveness, or whether any specific problems have been encountered. On its Web site, PADEP has posted some questions and comments that have been received about the program, such as a few from the Citizens Advisory Council (PADEP 2005).
Summary of Strengths and Weaknesses
Strengths Reduction of transaction costs through the use of NutrientNet (WRI 2007). NutrientNet allows PADEP to track projects, credits, and trades (WRI 2007). Standardized calculations of nonpoint source credits (WRI 2007). Market mechanisms create efficient and effective means of solving environmental
challenges. The Program creates flexibility to meet legal requirements, especially conducted on a
watershed basis. Public participation/oversight: NutrientNet allows market activity be seen by the public
(WRI 2007). The Program creates a monetary incentive for NPS nutrient reductions for dischargers.
August 2009 D-46

Nutrient Innovations Task Group Report Appendix D
Weaknesses Difficulty trading between point and nonpoint sources. It is easy to quantify and monitor
point sources; this is more difficult for nonpoint sources. No mandatory monitoring program: one reason the national emissions cap and trade
programs are successful is because all dischargers are obligated to reduce emissions while they are held accountable through monitoring. It is difficult to “measure” efforts when the program is voluntary.
Accuracy of nutrient reductions: there is no checking mechanism to see if the credits calculated through the model is accurate.
Equity issues for POTWs: POTWs have to meet required reductions and then apply for credits, while nonpoint sources do not have that initial requirement. This may not be equitable (PADEP 2005).
“Fairness” is difficult to determine in some cases. For instance, if the landowner has received public money (e.g., from the federal Farm Bill money) to implement BMPs then sells credits created by those BMPs, that farmer might have a financial advantage (PADEP 2005). There should be a guideline to prevent farmers from selling credits in addition to receiving public money.
Retiring of credits: There seems to be no formal, publicly available guideline to retire credits.
There is little publicly available information about the Program or Program results.
References
Commonwealth of Pennsylvania. 2008. Nutrient and Sediment Reduction Credit Trading Program; Nutrient Trading Program and NPDES Permits [38 Pa.B. 5502]. Pennsylvania Bulletin. http://www.pabulletin.com/secure/data/vol38/38-40/1808.html. Accessed March, 2009.
PADEP. 2008. Pennsylvania Nutrient Trading. Pennsylvania Department of Environmental Protection, Harrisburg, PA. http://www.dep.state.pa.us/river/Nutrient%20trading.htm. Accessed March, 2009.
PADEP. 2007. Fact Sheet: Nutrient Trading – Chesapeake Bay Watershed. Pennsylvania Department of Environmental Protection, Harrisburg, PA. http://www.dep.state.pa.us/river/Nutrient%20Trading_files/Trading%20Fact%20Sheet-%203900-FS-DEP4073.pdf. Accessed March, 2009.
PADEP. 2006. Final Trading of Nutrient and Sediment Reduction Credits – Policy and Guidelines. 392-0900-001. Pennsylvania Department of Environmental Protection, Harrisburg, PA. http://www.dep.state.pa.us/river/Nutrient%20Trading%20Documents/Additions%2012-29-2006/Final%20Policy%2012-28.pdf. Accessed March, 2009.
PADEP. 2005. Letter from Citizens Advisory Council dated November 18, 2005. Pennsylvania Department of Environmental Protection, Harrisburg, PA. http://www.depweb.state.pa.us/cac/cwp/view.asp?a=1329&q=484865. Accessed March, 2009.
August 2009 D-47

Nutrient Innovations Task Group Report Appendix D
Reuters. 2008. Pennsylvania’s Nutrient Trading Program Proving Viable, Cost-Effective Approach to Meeting Water Quality Goals. http://www.reuters.com/article/pressRelease/idUS172397+17-Sep-2008+PRN20080917. Accessed April, 2009.
WRI. 2007. Nutrient Net. World Resources Institute. http://www.nutrientnet.org. Accessed March, 2009.
August 2009 D-48

Nutrient Innovations Task Group Report Appendix D
California Nonpoint Source (NPS) Program
Overview
The California State Water Resources Control Board (SWRCB), the nine state Regional Water Quality Control Boards (RWQCBs), and the California Coastal Commission (CCC) are the lead state agencies for implementing the Nonpoint Source (NPS) Pollution Control Program through the Plan for California’s Nonpoint Source Pollution Control Program. The purpose of the NPS Pollution Control Program is to improve the state’s ability to effectively manage NPS pollution (SWRCB 2009).
Description
Under the California Porter-Cologne Water Quality Control Act, the NPS Pollution Control Program addresses both surface and ground water quality. The program achieves its goals through several means (SWRCB undated a):
Watershed-based approaches with management measures consisting of site-specific management practices.
Implementation and enforcement through California’s NPS Implementation and Enforcement Policy.
Public education and technical information through workshops on the most current management techniques.
Financial and technical assistance for projects and programs that address NPS pollution, land use, and watershed management.
Tracking, monitoring, and assessing the effectiveness of management measure implementation.
Funding sources for the NPS Pollution Control Program include California bond funds and Clean Water Act section 319 grant funds that support development and implementation of watershed management and total maximum daily load (TMDL) plans; implementation of management measures and practices; and education and technical assistance on NPS pollution problems and solutions (SWRCB undated a).
The NPS Pollution Control Program identified six categories of land use that contribute to NPS pollution—agriculture, forestry (silviculture), urban, marinas, hydromodification, and wetlands/riparian areas. The Program partners with more than 20 other state agencies that have programs in the six land use categories (SWRCB undated a).
NPS pollution control activities that fall under the NPS Pollution Control Program must meet the requirements of the following five key elements described in the Policy for Implementation and Enforcement of the NPS Pollution Control Program. Each activity must be endorsed or approved by the appropriate RWQCB and include the following (SWRCB undated b).
The purpose and a method to address NPS pollution control in a manner that achieves and maintains water quality objectives.
August 2009 D-49

Nutrient Innovations Task Group Report Appendix D
A description of the management practices (MPs) and other program elements, along with an evaluation program that ensures proper implementation and verification.
A time schedule and quantifiable milestones (as required by the RWQCB) Feedback mechanisms so that the RWQCB, dischargers, and the public can determine
whether the implementation program is achieving its stated purpose(s), or whether additional or different MPs or other actions are required.
Each RWQCB shall make clear, in advance, the potential consequences for failure to achieve an NPS implementation activity’s objectives, emphasizing that it is the responsibility of individual dischargers to take all necessary implementation actions to meet water quality requirements.
Overall NPS Pollution Control Program accountability is critical to reassure the public of the state’s commitment to deal with NPS pollution. The Nonpoint Source Program Strategy and Implementation Plan contains actions that will result in consistent and timely evaluation and reporting of the Program’s progress in effectively dealing with NPS pollution. This includes annual, biennial, and 5-year reporting cycles and the use of internet-based interactive information tools. There is also public participation through: (1) development of 5-year implementation plans; (2) tracking the implementation of and assessing effectiveness of management measures; (3) use of public reports; (4) expanded volunteer monitoring and education programs; (5) use of the internet; and (6) expansion of public outreach workshops (SWRCB 2000).
Assessment of How the Approach is Working
Annual, biennial, and 5-year progress reports on the Program, as well as a list and description of funded projects and its progress are posted on the internet on a regular basis, which helps the public assess whether the projects are working. More detail could be provided for each project on the SWRCB site.
Summary of Strengths and Weaknesses
Strengths Information is shared with the public. Regular online updates and lists of success stories
of the Program through reports and individual projects help keep the public informed about ongoing activities.
Weaknesses From available information, it is unclear whether projects have been successful or not,
and what would make them better.
References
SWRCB. 2000. Nonpoint Source Program Strategy and Implementation Plan, 1998-2013 (PROSIP). Volume 1. California State Water Resources Control Board, Sacramento, CA. http://www.coastal.ca.gov/nps/prosipv1.pdf. Accessed April, 2009.
August 2009 D-50
Nutrient Innovations Task Group Report Appendix D
SWRCB. 2009. Nonpoint Source (NPS) Pollution Control Program: The Plan for California’s Nonpoint Source Pollution Control Program (NPS Program Plan). California State Water Resources Control Board, Sacramento, CA. http://www.waterboards.ca.gov/water_issues/programs/nps/protecting.shtml. Accessed April, 2009.
SWRCB. Undated a. California’s Nonpoint Source (NPS) Program – Stopping Water Quality Degradation at its Source. California State Water Resources Control Board, Sacramento, CA. http://www.swrcb.ca.gov/water_issues/programs/nps/docs/marketing/nps_program_poster.pdf. Accessed April, 2009.
SWRCB. Undated b. Fact Sheet: Policy for the Implementation and Enforcement of the Nonpoint Source Pollution Control Program. California State Water Resources Control Board, Sacramento, CA. http://swrcb2.swrcb.ca.gov/water_issues/programs/nps/docs/npsfactsheet.pdf. Accessed April, 2009.
August 2009 D-51

Nutrient Innovations Task Group Report Appendix D
Iowa Onsite Wastewater Loan Program
Overview
The Onsite Wastewater Systems Assistance Program (OSWAP) offers low-interest loans through participating lenders to rural homeowners for replacement of inadequate or failing septic systems (IFA undated). OSWAP was created to help replace outdated septic systems that still dump untreated wastewater from household septic tanks to open ditches or underground tile lines that flow directly to streams, rivers, lakes, or fractured bedrock (Iowa DNR undated a).
Description
OSWAP is one of four financing programs through the Iowa Water Quality Loan Fund, the NPS fund of the Clean Water State Revolving Fund (CWSRF), which helps Iowans address NPS water quality problems (Iowa DNR undated b). The Iowa Department of Natural Resources (DNR) administers OSWAP in cooperation with County Sanitarians, and the Iowa Finance Authority (IFA) acting as the financial agent (IFA undated).
The program funds the replacement of outdated septic systems with approved onsite systems, which include both a septic tank and a secondary treatment system, such as a leachfield (Iowa DNR undated c). According to Iowa law, all septic systems must have a secondary wastewater treatment system following a septic tank (Iowa DNR undated a). All costs directly related to the repair, rehabilitation, or replacement of an onsite treatment system are eligible, including costs directly related to the design, permitting, and construction of the onsite wastewater system. Costs for removing existing structures, earth moving, and any land purchases directly related to proper wastewater treatment are also eligible. Ineligible costs include additional earthwork, reseeding, replanting, and maintenance or monitoring costs (IFA undated).
The following conditions must be met in order to obtain a grant (IFA undated; Iowa DNR undated d):
Homeowners must reside in a participating county listed on the Iowa DNR site. Homeowners begin the OSWAP loan process by obtaining a septic construction permit
from the County Sanitarian after a preliminary site evaluation and approval. An OSWAP approval form must be completed by the homeowner (loan recipient). Homeowners apply online for a loan through a participating lender. Loan amounts can
finance up to 100% of project costs starting at $2,000 and up, and the loan terms can be up to 10 years. The interest rate charged does not exceed 3%. Loan applicants must be credit-worthy and apply for a loan through participating lenders.
After the project has been completed, inspected, and certified by the County Sanitarian, DNR must approve the project and loan amount online and then IFA approves the loan.
As of August 2009, Iowa had made 892 loans in 78 counties for a total of $6.1 million (Iowa DNR undated a).
August 2009 D-52

Nutrient Innovations Task Group Report Appendix D
Assessment of How the Approach is Working
There is not a great deal of publicly available information on how the program is working. Based on the information available online, an estimated 100,000 septic systems in Iowa do not meet the standard. Funding is available for virtually all of the remaining substandard systems to be upgraded.
Summary of Strengths and Weaknesses
Strengths The Program is a source of low-cost financing available to landowners. This opportunity
is available specifically to assist and encourage landowners to address nonpoint source pollution of Iowa streams and lakes.
Applications are accepted any time of the year and turnaround time is quick (characteristic of CWSRF) (IDALS undated).
Quick loan processing and friendly loan repayment terms let borrowers implement projects done right away (characteristic of CWSRF) (IDALS undated).
Significant cost savings: interest rates are lower than those from other financing sources (characteristic of CWSRF) (IDALS undated).
Complements other funding sources: can be used to provide project share costs for other funding sources (characteristic of CWSRF) (IDALS undated).
Weaknesses There is little publicly available information about the program’s direct impacts on water
quality. Monitoring data before and after the implementation of the program may be one way to show that the program has been successful. Monitoring for septic system constituents alone is not financially feasible and monitoring for indicators is hampered by the agricultural nature of Iowa.
Enforcement issues: although it is Iowa’s state regulation that all septic systems must have a secondary wastewater treatment system following the septic tank, it is unclear how the state can enforce this regulation unless a homeowner knows that his septic system is failing and needs to be replaced.
Iowa has instituted a time of transfer septic system inspection program beginning July1, 2009. This new law requires every building with a septic system have that system inspected prior to the transfer of the deed. This has dramatically increased the number of sub-standard systems being repaired and also provided an effective new public information tool about what constitutes a legal septic system. Many homeowners have chosen to fix their sub-standard systems prior to selling their homes.
References
IDALS. Undated. Field Services Bureau: State Revolving Loan Fund. What is the Iowa Water Quality Loan Fund? Iowa Department of Agriculture and Land Stewardship, Field Services Bureau, Des Moines, IA. http://www.iowaagriculture.gov/FieldServices/waterQualityLoanFund.asp. Accessed March, 2009.
August 2009 D-53

Nutrient Innovations Task Group Report Appendix D
Iowa DNR. Undated a. Iowa’s Onsite Wastewater Loan Program. Iowa Department of Natural Resources, Des Moines, IA. http://www.iowadnr.gov/water/septic/program.html. Accessed March, 2009. Iowa DNR. Undated b. Iowa DNR State Revolving Fund. Iowa Department of Natural Resources, Des Moines, IA. http://www.iowadnr.gov/water/srf/index2.html. Accessed March, 2009. Iowa DNR. Undated c. Iowa DNR State Revolving Fund. Iowa Department of Natural Resources, Des Moines, IA. http://www.iowadnr.gov/water/srf/onsite.html. Accessed March, 2009. Iowa DNR. Undated d. The Onsite Wastewater Systems Assistance Program (OSWAP). Iowa Department of Natural Resources, Des Moines, IA. http://www.iowadnr.gov/water/septic/files/oswap.pdf. Accessed March, 2009. IFA. Undated. Onsite Wastewater Assistance Program (OSWAP). Iowa Finance Authority, Des Moines, IA. http://www.iowafinanceauthority.gov/en/water_quality_programs/onsite_wastewater assistance_program_oswap. Accessed March, 2009.
August 2009 D-54

Nutrient Innovations Task Group Report Appendix D
North Carolina Community Conservation Assistance Program (CCAP)
Overview
The Community Conservation Assistance Program (CCAP), patterned after the NC Agriculture Cost Share Program, is a voluntary, incentive-based program designed to improve water quality through the installation of various best management practices (BMPs) on urban, suburban, and rural lands that are not directly involved with agricultural production. The Agriculture Cost Share Program has a similar structure but only targets agricultural operations (NCDENR undated). The CCAP provides educational, technical, and financial assistance to landowners through local soil and water conservation districts (SWCDs) (NCDENR undated).
Description
Established in 2006, the CCAP is a grant funded program that enables local SWCDs to help landowners install practices to address erosion control, stormwater, flooding, drainage, stream restoration, and other land and water quality concerns (NCASWCD 2009). CCAP efforts focus on retrofitting stormwater BMPs on existing land uses; the program is not used to assist new development sites to meet state and federal stormwater mandates (Hunt et al. undated). Support can go to eligible landowners (e.g., homeowners, businesses, schools, parks, churches, and community groups) on sites that have been developed for a minimum of three years (NCDENR undated).
Applications for CCAP funding must be submitted to local soil and water conservation districts. They are then ranked based on local water quality priorities. If an applicant is deemed eligible, a conservation plan is prepared by local SWCDs for BMP installation (a landscaper may also prepare plans) (NCDENR undated).
The CCAP may provide funding of up to 75 percent cost share to eligible applicants to implement BMPs (up to $50,000) and funding to provide up to 50 percent cost share to local soil and water conservation districts for technical employees to assist with design and installation oversight and to administer the program locally (NCASWCD 2009).
Assessment of How the Approach is Working
The CCAP is intended to operate under the same guidance and accountability as the highly successful North Carolina Agriculture Cost Share Program and achieve the same success (Hunt et al. undated).
Since its inception in 2006, the CCAP has grown dramatically. In fiscal year 2007 the program was available in 17 districts. In fiscal year 2008, the program grew to include 40 districts. In fiscal year 2009 the CCAP is available in 65 districts (NCASWCD 2009). Additional funding was requested in 2009 to increase the budget by $3.4 million for program assistance and to add an additional position in the Division of Soil and Water Conservation offices to provide program support (NCASWCD 2009).
August 2009 D-55
Nutrient Innovations Task Group Report Appendix D
Summary of Strengths and Weaknesses
Strengths The CCAP encourages local governments, individual landowners, and businesses to
voluntarily incorporate stormwater BMPs by providing a source of funding and technical support (Hunt et al. undated).
In addition to providing significant water quality benefits, several of the approved practices (e.g., cistern rain gardens/bioretention areas) have the added benefit of enabling reuse of runoff from impervious surfaces or other desirable uses. Other practices increase infiltration of rainfall, thereby increasing the resiliency of water supplies (e.g., impervious surface conversion, permeable pavement) (NCASWCD 2009).
The presence of a statewide CCAP coordinator had helped the program’s development and growth throughout the state (NCASWCD 2009).
Projects are ranked and assessed based on water quality priorities. The CCAP addresses a lower profile source of nutrients.
Weaknesses At this time, not all districts are eligible for funding, though allocations have increased
each year since the programs inception (NCASWCD 2009). The program only applies to retrofits, and does not provide support for new
development (Hunt et al. undated). At this time, many of the eligible CCAP practices, such as stormwater wetlands and
impervious surface conversion to permeable pavement, require engineering designs that can not be met with the limited existing engineering resources in the Division of Soil and Water Conservation (NCASWCD 2009).
The program lacks a specific goal. The program does not address all sources within a sector. If an applicant sells property that contains a cost shared BMP during the maintenance
period (the specified minimum life of the practice), they are required to repay the state a pro-rated amount of the original cost or arrange for the buyer to assume the maintenance of the BMP (NCDENR 2007).
o Any conversion from the intended use of the BMP during the maintenance period will require the operator to repay the state a pro-rated amount of the original cost share payment.
o Damaged BMPs may or may not negate the cost share agreement (depends on circumstances).
References
Hunt, W.F., J.M. Hathaway, and R.A. Smith. Undated. Community Conservation Assistance Program: Stormwater Best Management Practice Design Manual. North Carolina State University, Raleigh, NC. http://www.enr.state.nc.us/DSWC/pages/2007_July_DSWC_Manual.pdf Accessed March, 2009
August 2009 D-56

Nutrient Innovations Task Group Report Appendix D
NCASWCD. 2009. Action to Increase Community Conservation Assistance Program’s Funding to $3.4 Million for Best Management Practices and 1 Position. North Carolina Association of Soil and Water Conservation Districts. http://www.ncaswcd.org/Legislative_Priorities/2009/CC%20Assistance%20Association.doc. Accessed March, 2009
NCDENR. Undated. Community Conservation Assistance Program. North Carolina Department of Environmental and Natural Resources, Division of Soil and Water Conservation, Raleigh, NC. http://www.enr.state.nc.us/DSWC/pages/ccap_program.html. Accessed March, 2009.
NCDENR. 2007. North Carolina CCAP Program Manual: Section III Policies Governing the North Carolina Community Conservation Assistance Program. North Carolina Department of Environmental and Natural Resources, Division of Soil and Water Conservation, Raleigh, NC. http://www.enr.state.nc.us/DSWC/pages/CCAPManualsection_III.pdf. Accessed April, 2009.
August 2009 D-57

Nutrient Innovations Task Group Report Appendix D
Wisconsin’s Priority Watershed and Priority Lake Program
Overview
The Priority Watershed and Priority Lake Program, outlined in Wisconsin Department of Natural Resources (WDNR) regulation chapter NR 120, Wisconsin Administrative Code, provides financial assistance to local governments in priority watersheds to address land management activities contributing to rural runoff. WDNR issues grants for implementing watershed and lake projects through a cost-share approach. Grantees use funds to reimburse costs to landowners for installing voluntary best management practices (BMPs) (WDNR undated a). The program is a joint effort of WDNR; the Department of Agriculture, Trade, and Consumer Protection (DATCP); the University of Wisconsin Extension (UWEX); counties (usually through Land Conservation Departments); municipalities; and lake districts with assistance from a variety of federal, state, and local agencies.
Description
The nonpoint source (NPS) priority watershed grant program provides funds to prevent or eliminate NPS water pollution in existing, designated priority watershed projects in Wisconsin. The program was originally designed to address both urban and rural runoff however, in the mid 1990s the Urban Nonpoint Source and Storm Water Management Grant Program was established to address urban runoff.
To select projects, the Wisconsin Land and Water Conservation Board developed watershed-ranking criteria by ranking streams, lakes, and groundwater separately (by watershed) by high, medium, or low priority (WDNR undated b).
Potential local sponsors in watersheds with high priority ranking were notified of watershed project eligibility and, if interested, they submitted an application to WDNR. Final designation of projects was granted by the Land and Water Conservation Board (WDNR undated c). Once a priority watershed was designated, funding was provided to support local staff and conduct extensive land use inventories and detailed water resources appraisals. Following the initial planning process, watershed plans were implemented locally, with WDNR providing up to 70 percent cost sharing for the installation of BMPs. Implementation of priority watershed plans generally occurs over a 10 to 12 year period (WDNR undated b).
Priority watershed/lake project goals focus on water quality improvements or protection from reductions in pollutant levels delivered to streams, rivers, and lakes. Each year, grantees submit reports to WDNR showing progress made towards meeting pollutant reduction goals in the watersheds/lakes. For a given project, information may be submitted as reductions in sediment or soil loss from uplands, streams, gullies, and phosphorus reductions from barnyards and croplands. Other projects focus on protecting shoreline and habitat in a watershed or lake (WDNR undated a). Some BMPs used in priority watershed projects include:
In cropped fields: contour strip cropping, changes in crop rotations, reduced tillage methods, nutrient management, and pesticide management.
August 2009 D-58

Nutrient Innovations Task Group Report Appendix D
In eroding or trampled stream banks: shaping and reseeding, fencing to restrict cattle access, alternate livestock watering locations, controlled grazing, and rip-rap.
In animal feedlots: upslope diversion berms, filter walls, and vegetated filter strips.
While the vast majority of practices installed within a watershed are done so on a voluntary basis, in 1993 a regulatory component was introduced. These regulations required the identification of critical sites within the watershed where BMP implementation was most necessary to achieve desired runoff reduction. During implementation, local project managers work closely with landowners that have sites that meet the critical site criteria in the watershed plan to obtain pollutant loading reductions. Operators had three years to accept cost-sharing to fix the problem or they were required to fund BMP implementation themselves. After three years, operators could be subject to enforcement (Holden 2009, personal communication).
Assessment of How the Approach is Working
As of 2007, 93 percent of the critical sites in the priority lake and watershed areas had been resolved with little need for enforcement (Holden 2009, personal communication). As of early 2009, the program has resulted in projects reaching 67 percent of its phosphorus reduction goals, 61 percent of its sediment reduction goals, and 74 percent of the streambank/shoreline sediment reduction goals (Holden 2009, personal communication). The program is currently closed to new applicants, however, and the program will end December 31, 2009 (WDNR undated c).
Summary of Strengths and Weaknesses
Strengths Program addressed both agricultural and urban NPS pollution (Holden 2009, personal
communication). Program took a targeted approach; projects were selected based on watershed priority
(with additional targeting of critical areas), maximizing effectiveness of state and federal dollars (Holden 2009, personal communication).
Program emphasized the development of partnerships, giving each project a broad stakeholder base and increasing potential sources for financial and technical assets.
Funding was provided to support local Land Conservation Department staff, strengthening local resources.
Program took a watershed approach, which was more comprehensive and efficient than a project-by-project deployment of money and staff (Holden 2009, personal communication).
Each project went through a lengthy planning process (2 years on average) that provided a detailed plan for future project implementation and building a knowledge base for subsequent efforts (Holden 2009, personal communication).
Project implementation occurred over 10 to 12 years, giving ample time for course correction and providing project continuity.
This program was largely voluntary and little enforcement was necessary to achieve watershed goals.
August 2009 D-59

Nutrient Innovations Task Group Report Appendix D
Weaknesses The program was very expensive, costing over $200 million for 86 projects (Holden
2009, personal communication). Early on, the program put too much emphasis on concrete structures (e.g., barnyards),
with limited public benefit. Little attention was given to cropland and streambank/lakeshore erosion control practices that are less costly and serve a greater public good but are harder to “sell” to a producer. This misplaced focus was partly due to the type of funding that could be used for hard practices (e.g., manure storage systems). Later in the project additional funding was allocated for “soft practices,” such as nutrient management and soil erosion control practices (Holden 2009, personal communication).
Before the critical site element was added, the voluntary approach allowed some of the worst sites to go untreated if landowners refused to cooperate (Holden 2009, personal communication).
Watersheds were often too large to be relevant to all landowners. People living far from targeted waterbodies felt less incentive to change. It also took a long time for changes to manifest and required high participation rates to see a difference in water quality (Holden 2009, personal communication).
The last watershed project was designated in 1995. The program will end December 31, 2009.
References
Holden, C. 2009, March 18. Email from Carol Holden, Runoff Management Section, Wisconsin Department of Natural Resources, to Tetra Tech, Inc.
WDNR. Undated a. Wisconsin’s Priority Watershed and Priority Lake Program. Wisconsin Department of Natural Resources, Madison, WI. http://dnr.wi.gov/runoff/watershed.htm. Accessed March, 2009.
WDNR. Undated b. Nonpoint Source Priority Watershed and Priority Lake Program Grant. Wisconsin Department of Natural Resources, Madison, WI. http://ua.dnr.wi.gov/org/caer/cfa/EF/NPS/pwatershed.html. Accessed March, 2009.
WDNR. Undated c. Priority Watershed Grant Program. Wisconsin Department of Natural Resources, Madison, WI. http://www.dnr.state.wi.us/org/caer/cfa/Bureau/NonpointSourcePriorityWatershed.pdf. Accessed March, 2009.
August 2009 D-60

Nutrient Innovations Task Group Report Appendix D
CAFO/AFO Nutrient Management
Overview
This accountability measure is based on regulatory mechanisms under the Clean Water Act for Concentrated Animal Feeding Operations (CAFOs) and state programs for smaller animal feeding operations (AFOs). Nutrient management plans (NMPs) provide the implementation mechanism in NPDES permits to ensure nutrients from CAFOs are not being discharged.
Description
CAFO facilities that discharge or propose to discharge are required to seek NPDES permit coverage. The most recent iteration of the national regulations for the permitting of CAFOs was signed on December 22, 2008. In determining if a facility is required to seek permit coverage, the facility’s owner/operator will assess the CAFO’s design, construction, operation, and maintenance to determine if the facility is discharging from or will discharge from its production area or land application area to waters of the U.S. Owner/operators are also given the voluntary option of certifying that the facility is a no discharge facility. Permitted or certified facilities are not liable under § 122.23(d)(1) duty to apply, and only permitted discharges (those authorized by a NPDES permit) or discharges defined as agricultural stormwater (precipitation-related discharges from facilities land application area) are allowed (USEPA 2008).
Those facilities seeking permit coverage must develop a Nutrient Management Plan (NMP), the terms of which must be incorporated into the NPDES permit, and thus subject to permitting authority review and public comment. Terms of the NMP to be incorporated into the NPDES permit ‘‘are the information, protocols, best management practices, and other conditions’’ necessary to meet the requirements of 40 CFR 122.42(e)(1), and in addition for large CAFOs the best management practices necessary to meet the requirements of 40 CFR 412.4(c) (USEPA 2008). Specifically, terms of the NMP would need to demonstrate the facility has the structural design capacity to meet the storage requirements imposed by the volume of manure, litter, and process wastewater generated from the facility. Those facilities applying manure, litter, and process wastewater must incorporate specifics regarding the fields available for land application, the rates of application, and the timing limitation for application (USEPA 2008).
Assessment of How the Approach is Working
Permitted CAFOs are required to submit annual reports detailing how the facility has achieved substantive compliance with the terms of the NMP. Annual reporting requirements include total amount of generated waste, amount of waste transferred, the facility’s total land application acreage, total acreage utilized, specific crops planted, yields for each field, the nitrogen and phosphorus content of all waste land applied, the total amount of waste applied to each field, and a summary of production area discharges (USEPA 2008).
The 2008 Final CAFO Rule estimated annual pollution reductions of 56 million pounds of phosphorus and 110 million pounds of nitrogen. EPA utilized Groundwater Loading Effects of Agricultural Management Systems (GLEAMS) model, which relies on information on soil characteristics and climate, along with characteristics of the applied manure and commercial
August 2009 D-61
Nutrient Innovations Task Group Report Appendix D
fertilizers, to estimate losses of nutrients in surface runoff, sediment, and ground water leachate (USEPA 2008).
Specific state programs vary, though all have one year from EPA’s 2008 Final CAFO Rule effective date of December 22, 2008, to revise their NPDES requirements to adopt the requirements of the 2008 Rule. States, such as New York, utilize inspectors for random and complaint-based CAFO investigations to determine compliance with state and federal water quality regulations, and to determine the adequacy of a facility’s waste management system (NYDAM 2003). Illinois develops statewide annual reports summarizing yearly activities of the state regarding CAFO enforcement and compliance. This information includes facility specifics, such as the number/type of animals, as well as waste management structures and regulatory violations. The reports may detail water pollution concerns, facility specific sources of water pollution, and measures taken by facilities to correct pollution sources (IEPA 2006).
California has achieved substantive compliance with its CAFO/AFO permitting program for dairy by utilizing the California Dairy Quality Assurance Program (CDQAP), which provides dairy operators training and technical assistance. To help offset programmatic costs, the state requires permitted facilities to pay a surcharge in support of the states’ Surface Water Ambient Monitoring Program (SWAMP), and pay an annual fee based on a facilities’ animal population that ranges from $200 to $4,000. California’s permitting program also includes groundwater monitoring provisions in some facilities’ permit conditions (CEPA 2007). Oregon’s CAFO/AFO permitting program has been in effect since the 1980’s, and currently is under the authority of the Oregon Department of Agriculture (ODA), which recently implemented a NPDES permitting program. Permitted facilities are inspected, on average, once a year to determine permit compliance, and any violations require the formulation of a compliance schedule. Facilities implementing a compliance schedule will often receive routine visits by state inspectors. Oregon also utilizes a complaint based inspection system, in which facilities with validated complaints will be inspected and any problems relating to the complaint rectified (ODA 2009).
Wisconsin’s Department of Natural Resources (WDNR) began regulating the handling, storage, and application of wastes form CAFOs/AFOs in 1984. All facilities with greater then 1,000 animal units are permited via Wisconsin Pollutant Discharge Elimination System (WPDES) Concentrated Animal Feeding Operation permits. Smaller facilities are not permitted, but like larger facilities, they are required to follow agricultural performance standards and the state’s four Manure Management Prohibitions. The state also utilizes complaint-based inspections to address water quality issues, with regulatory action being taken on any facilities found to be discharging. The state provides both technical and financial assistance (cost-share programs) to help facilities address water quality issues (WDNR 2008).
Summary of Strengths and Weaknesses
Strengths NMP approach is flexible to accommodate dynamic conditions associated with
agriculture. Annual reporting requirements ensure permitting authority oversight and public
involvement. Terms of the NMP are flexible to accommodate changing facility conditions but specific
enough to ensure adequate nutrient management.
August 2009 D-62

Nutrient Innovations Task Group Report Appendix D
Based on estimated annual nutrient reduction loads, program will achieve a significant reduction in the amount of nitrogen and phosphorous reaching U.S. waters.
Voluntary certification option allows CAFO facilities to certify they do not discharge via submission of a signed certification option after an objective assessment of the facility by the owner/operator.
States are able to modify CAFO permitting programs to satisfy state-specific needs and concerns.
Successful permitting of a traditionally nonpoint source industry via modified NPDES permitting.
Weaknesses Site-specific inspections are resource intensive. Legislative history has promoted confusion and atmosphere of inaction among states
and producers, as stakeholders await further litigation. No nationwide assessment of programmatic success or goals to judge water quality and
pollution reduction programmatic success; success seems measured more by administrative outcomes (number of facilities permitted) rather then environmental outcome-based performance.
Large degree of variability among states regarding enforcement and compliance actions, including frequency and reasons prompting facility inspections.
Receiving water monitoring is not explicitly required by the 2008 CAFO Final Rule; principal focus is to monitor land application (e.g., routine soil testing, determining nutrients in land-applied wastes).
References
CEPA. 2007. National Pollutant Discharge Elimination System (NPDES): Concentrated Animal Feeding Operations. California Environmental Protection Agency, State Water Resources Control Board, Sacramento, CA. http://www.waterboards.ca.gov/water_issues/programs/npdes/cafo.shtml. Accessed February, 2009.
IEPA. 2006. Illinois EPA Livestock Program 2006 Livestock Facility Investigation: Annual Report. Illinois Environmental Protection Agency, Bureau of Water, Division of Water Pollution Control, Peoria, IL.
NYDAM. 2003. State Helps Farmers Meet Water Quality Objectives: Partnerships, Certified Planners and AEM Contribute to New York's Success. New York Department of Agriculture and Markets, Albany, NY. http://www.agmkt.state.ny.us/ad/release.asp?ReleaseID=1270. Accessed February, 2009.
ODA. 2009. Confined Animal Feeding Operations. Oregon Department of Agriculture, Natural Resources Division, Salem, OR. http://www.oregon.gov/ODA/NRD/cafo_front.shtml. Accessed February, 2009.
USEPA. 2008. Revised National Pollutant Discharge Elimination System Permit Regulation and Effluent Limitations Guidelines for Concentrated Animal Feeding Operations in Response to the
August 2009 D-63

Nutrient Innovations Task Group Report Appendix D
Waterkeeper Decision. U.S. Environmental Protection Agency. Federal Register, Nov. 20, 2008, 73(225):70418.
WDNR. 2008. Concentrated Animal Feeding Operations. Wisconsin Department of Natural Resources, Madison, WI. http://www.dnr.state.wi.us/runoff/ag/cafo.htm. Accessed February, 2009.
August 2009 D-64

Nutrient Innovations Task Group Report Appendix D
California Agricultural Water Quality Grant Program
Overview
The Agricultural Water Quality Grant Program (AWQGP) provides grants to eligible recipients for projects that reduce or eliminate the discharge of nonpoint source pollution (NPS) to surface waters from agricultural lands (SWRCB 2007).
Description
The AWQGP is administered by the State Water Resources Control Board (SWRCB) and given to public agencies and non-profit organizations (SWRCB 2007). Funding sources for the AWQGP include state bond monies and Clean Water Act (CWA) section 319 funds listed below.
State Proposition 40 and 50: Coastal Protection Act of 2002 (Proposition 40) and Coastal and Beach Protection Act of 2002 (Proposition 50) were passed in 2002 by California voters. The propositions authorized the sale of bonds to finance a variety of resource programs, including the AWQGP. Under Proposition 40 and 50, grants are available for $11.4 million and $29.5 million, respectively, for agricultural water quality improvement through monitoring and implementation of NPS management measures and practices (SWRCB and RWQCB 2004).
State Proposition 84: Starting in fiscal year 2007–2008, $15 million has been allocated for AWQGP (DOF 2008).
Federal CWA Section 319: Under section 319, EPA provides funding to SWRCB to support implementing the Plan for California’s Nonpoint Source Pollution Control Program (NPS Program Plan). The SWRCB uses some of the section 319 funds to provide grants for NPS implementation projects. Approximately $5.5 million is available under this funding source (SWRCB and RWQCB 2004).
To further define and identify the source of water quality problems related to agriculture, the state uses funds outlined under Proposition 40 for surface water quality monitoring projects, referred to as Project Planning Monitoring. These projects must be used to develop a plan to implement appropriate management measures to address the identified water quality problem. Proposition 50 and section 319 monies are used to fund implementation projects that demonstrate immediate and long-term improvements to surface water quality (SWRCB and RWQCB 2004).
Proposals are evaluated in two stages. First, SWRCB and Regional Water Quality Control Board (RWQCB) staff review all proposals for completeness and eligibility, and then rank them for funding priority. Second, SWRCB request technical assistance for proposal review from agencies including RWQCB, USEPA, USGS, and external agencies5. All eligible proposals undergo a thorough review and ranking process by which the appropriate funding source is determined. All
5 The SWRCB requests technical assistance for proposal review from the state and federal agencies including: California Department of Pesticide Regulation; California Department of Water Resources; California Department of Food and Agriculture; UC Cooperative Extension; USEPA, United States Geological Survey; and United States Department of Agriculture.
August 2009 D-65
Nutrient Innovations Task Group Report Appendix D
projects must be consistent with the NPS Program Plan and either implement appropriate management measures or monitor water quality (SWRCB and RWQCB 2004).
Each implementation project must include a plan to evaluate project effectiveness, specific information as delineated in the proposal guidelines, and a plan to document results including water quality improvement. A monitoring plan and Quality Assurance Project Plan (QAPP) with associated schedules and budgets are required for all projects that include water quality monitoring. Qualified impartial experts must assist in developing and implementing the plan and certifying the results (SWRCB and RWQCB 2004). Plans are selected by the Project Selection Panel (consisting of one member from the agencies listed above) and must be approved by SWRCB before funds can be allocated.
Projects selected for funding under AWQGP are required to spend grant funds according to the approved project scope and budget. SWRCB requires progress reports (no less than quarterly) for all projects and conducts site visits during construction of each development project. Payment requests must include a certification by the grantee that each expense complies with requirements outlined in the grant agreement. Grantees must also submit supporting documentation for each expense, with reimbursements approved only for eligible expenses pursuant to program guidelines and contained within the approved project budget (SWRCB 2007).
SWRCB prepares and presents an annual project accounting report on projects under AWQGP to the Department of Finance (DOF) and DOF performs audits on select projects. SWRCB maintains a publicly accessible Web site listing all current projects by program, the funding source, and the timeframe for completion (SWRCB 2007).
All projects funded through AWQGP receive a close-out site visit conducted by SWRCB or RWQCB staff when a project has been completed. The purpose of the close-out site visit is to ensure all project components were completed according to program guidelines and the terms of the grant agreement, including project scope and budget. Grantees must submit a final report, which documents the outcomes of the project and summarizes all project data and expenditures. In accordance with all current laws and regulations that apply to the project, grantees must also submit documents summarizing total project costs and all additional funding sources. The SWRCB is enhancing its Web site to post final project reports (SWRCB 2007).
Assessment of How the Approach is Working
There is limited information available on the effectiveness of AWQGP. There seems to be little public information available on what projects were accepted, progress of those projects, the results, and final assessments. Therefore it is difficult to assess the implications for future NPS pollution reduction policies.
DOF conducted an audit on bond funds in An Audit of Bond Funds: State Water Resources Control Board Propositions 13, 40, and 50 (2008) to determine whether SWRCB awarded and expended bond funds that were consistent with applicable legal requirements and established criteria, and whether SWRCB had adequate project monitoring processes. DOF concluded that there is a lack of supporting documentation and that SWRCB does not always monitor the financial aspects of bond funded projects to ensure eligibility of project costs (DOF 2008).
August 2009 D-66

Nutrient Innovations Task Group Report Appendix D
However, it is not possible to draw specific conclusions about AWQGP from the DOF report. The report does not list specific projects audited, but rather highlights general trends. Summary of Strengths and Weaknesses Strengths
Specific grants geared towards finding a solution to the reduction of NPS pollution from agriculture may hold the key to future reduction.
Projects with this specific goal will not have to compete against other NPS pollution funds.
Project assessment at various stages will help determine the success of future projects. Weaknesses
There is little public information available on whether or not the project had been successful and how it can be improved.
It is unclear whether funds were actually used in compliance with project guidelines. There may be insufficient oversight by SWRCB.
References DOF. 2008. An Audit of Bond Funds: State Water Resources Control Board Propositions 13, 40, and 50. California Department of Finance, Sacramento, CA. http://www.dof.ca.gov/osae/audit_reports/documents/State%20Water%20Resources% 20Control%20Board%20-%20An%20Audit%20of%20Bond%20Funds,%20Propositions%2013, %2040%20&%2050,%20September%202008.pdf. Accessed March, 2009. SWRCB. 2007. Agricultural Water Quality Grants Program. California State Water Resources Control Board, Sacramento, CA. http://bondaccountability.resources.ca.gov/plevel1.aspx?id=6. Accessed March, 2009. SWRCB and RWQCB. 2004. Agricultural Water Quality Grant Program (AWQGP) Guidelines. California State Water Resources Control Board and Regional Water Quality Control Boards. http://www.waterboards.ca.gov/water_issues/programs/grants_loans/awqgp/docs/awqgpguidelines.pdf. Accessed March, 2009.
August 2009 D-67
Nutrient Innovations Task Group Report Appendix D
Delaware’s Nutrient Management Program
Overview
The Delaware Nutrient Management Program was established in June 1999 under the Delaware Nutrient Management Law to regulate activities involving the generation and application of nutrients and to protect water quality. The Delaware Nutrient Management Commission (DNMC) (also established by the Law) is responsible for directing the program and developing regulations pertaining to nutrient management, waste management for animal feeding operations (AFOs), and National Pollutant Discharge Elimination System (NPDES) permits for concentrated animal feeding operations (CAFOs) (DDA, n.d.).
Description
The Nutrient Management Program, as defined by the Nutrient Management Law, consists of the following (DE, 2009):
Certification of persons directly involved with generating or applying nutrients within Delaware.
Development and implementation of best management practices (BMPs) designed to improve water quality, optimize nutrient use, and maintain a profitable agricultural industry in the state.
Establishment of educational programs instructing on the use of BMPs.
Development of a method for certifying applicants by testing comprehension of BMPs.
Any other programs established by the Commission.
More specifically, the Nutrient Management Law states that all affected operations must have nutrient management plans in place by dates specified in the Law. Operations that generate manure, but do not land apply any nutrients, must develop an Animal Waste Management Plan (Hanson, 2002). In addition, at least one person from each operation must become certified by participating in approved classroom instruction (Hansen and Binford, 2004).
The Law affects two categories of people (Hanson, 2002):
1. Those who operate any animal feeding operation in excess of 8 animal units (8,000 pounds).
2. Those applying nutrients to land in excess of 10 acres as a component of a commercial venture.
In addition to farmers, commercial nutrient applicators (e.g., fertilizer companies), golf courses, school districts, lawn care companies, and landscaping firms must develop and implement nutrient management plans (Hanson, 2002).
The Delaware Department of Agriculture provides a suite of services as part of the Nutrient Management Program (DDA, n.d.):
Nutrient Management Relocation Program: This is a cost assistance program to assist in the transport of manure from areas of excess manure to areas in need.
August 2009 D‐68

Nutrient Innovations Task Group Report Appendix D
Delaware Manure Matching: This service provides names and contact information for manure providers, receivers, and manure brokers/transport agents.
Complaints and investigations: DDA staff members handle and resolve complaints related to manure management and general nutrient management practices.
Nutrient Management Planning Program: This is a cost assistance program for implementing nutrient management plans. Cost share is available at $5 per acre for a 3‐year plan. Funds are provided on a first‐come‐first‐serve basis.
Certification and Education: Individuals must be certified if they:
o Apply nutrients to 10 acres or greater. o Operate an animal feeding operation of 8 animal units or greater. o Apply nutrients to lands as a component of a commercial agriculture business in
exchange for a fee or service charge. o Advise or consult with persons as part of the development of a Nutrient
Management Plan.
Assessment of How the Approach is Working
By 2008, 92,157 tons of excess poultry litter was relocated to alternative use projects, 355,984 acres of nutrient applied farmland was managed under a current nutrient management plan with assistance from the program, 44 nutrient management compliance complaints had been resolved, and 12 farms were managed under an EPA CAFO permit administered by the program (UDaily, 2008). In addition, more than 2,600 individuals have attended nutrient management certification classes since 2001 (UDaily, 2008).
Summary of Strengths and Weaknesses
Strengths The Law applies to both agricultural and non‐agricultural lands.
The Law and regulations require certification. Certification requires continuing education to keep all certified generators, handlers, and consultants up‐to‐date with recent information and requirements.
The Law requires phosphorus limited nutrient management plans and application rates.
Local conservation district offices have certified planners that will write free plans (Hanson, 2002) and the Nutrient Management Program provides funding to farmers who hire private consultants.
Regulations require that all nutrient handlers maintain records of nutrient handling, storage, application, and disposition.
Regulations require that farmers submit an annual report to the Nutrient Management Program.
Weaknesses The program emphasizes education, there is little in the way of a regulatory component.
The program relies heavily on “professionalism, judgment and experience” of certified consultants to develop reasonable recommendations (Bill Rohrer, from Hanson, 2002). The plans are only as good as the certifiers and their certifications.
August 2009 D‐69

Nutrient Innovations Task Group Report Appendix D
References
DDA. No date. Nutrient Management. State of Delaware, Delaware Department of Agriculture. http://dda.delaware.gov/nutrients/index.shtml. Accessed March 27, 2009.
DE. 2009. Chapter 22: Subchapter III. State Nutrient Management Program. State of Delaware http://delcode.delaware.gov/title3/c022/sc03/index.shtml. Accessed March 27, 2009.
Hansen, D.J. and G.D. Binford. 2004. Nutrient Management Certification for Delaware: Developing a Water Quality Curriculum. J. Nat. Resour. 33:143‐146. http://www.jnrlse.org/pdf/2004/E04‐0016.pdf. Accessed March 27, 2009.
Hanson, S. 2002. Nutrient Management in Delaware. http://www.americanfarm.com/Signe%203‐01‐02.html. Accessed March 27, 2009.
Udaily. 2008. UD, state partners announce progress managing agricultural nutrients. UDaily. University of Delaware. April 30, 2008. http://www.udel.edu/PR/UDaily/2008/apr/nutrient043008.html. Accessed April 6, 2009.
August 2009 D‐70

Nutrient Innovations Task Group Report Appendix D
Iowa Livestock Water Quality Facilities Program
Overview
The Livestock Water Quality Facilities Program (the Program), started in 2006, offers low-interest loans through participating lenders to Iowa livestock producers for projects to prevent, minimize, or eliminate nonpoint source (NPS) pollution of Iowa’s rivers and streams from animal feeding operations (IFA undated).
Description
The Program is one of four financing programs through the Iowa Water Quality Loan Fund, the NPS fund of the Clean Water State Revolving Fund (CWSRF), which helps Iowans address NPS water quality problems (Iowa State University 2005; Iowa DNR undated). The Program is operated by the Division of Soil Conservation (DSC) and the Iowa Department of Natural Resources (DNR), with the Iowa Finance Authority (IFA) acting as the financial agent. Local Soil and Water Conservation Districts (SWCDs) help with Program implementation (IFA undated; Iowa DNR undated).
Loans funded under this program are available to livestock and poultry producers who are not required to have a National Pollutant Discharge Elimination System (NPDES) permit (Iowa DNR 2008). Types of eligible projects include lagoons, manure management structures, equipment6, vegetative filters, and development of manure management plans. Assistance is limited to existing facilities for animal feeding operations with less than 1,000 total animal units7 (IFA undated; Iowa State University 2008).
For riparian water protection practices, such as grass waterways, terraces, pasture or hayland planting, streamside forest buffers, and filter strips, the loan amounts can range from $5,000 to $50,000, with a loan term of up to 10 years. For manure management projects, developing manure management plans, and construction of manure management structures, the minimum loan amount is $10,000 with no maximum loan amount for a loan term up to 20 years (Iowa State University 2008).
The following process is used to allocate funds and monitor projects (IFA undated):
A landowner must receive project approval prior to receiving a loan from the local SWCD and complete the online loan application.
After the project has been completed, inspected, and certified by local Natural Resources Conservation Service (NRCS) staff, DSC approves the project and loan amount online.
IFA approves the application and provides funding to the borrower. The interest rate charged will not exceed 3% and borrowers can finance up to 100% of the project cost.
6 Due to high demand for the loans, DNR and IDALS reprioritized funding requests. Manure management equipment was funded when the Program started, but was not eligible after October 2008 (Iowa DNR, 2008). 7 1,000 animal units are equal to 1,000 beef cattle, 700 mature dairy cattle, or 2,500 finishing swine.
August 2009 D-71

Nutrient Innovations Task Group Report Appendix D
By 2008 109 projects had been funded, totaling more than $7 million. The average loan amount for the funded projects was $65,000 (Iowa State University 2008).
Assessment of How the Approach is Working
The Program has been so successful that livestock producers have requested nearly all of the $12 million allotted for this year in the first three months of the 2009 fiscal year. Due to the high demand for the loans, DNR and IDALS have prioritized funding requests, and since October 2008 no longer fund loans for manure management equipment. This change will leave more loan money for practices that offer more benefits to water quality (Iowa DNR 2008). One reason for the success of the program is producers’ willingness to address existing problems. However there seems to be little information publicly available, such as monitoring data, on direct impacts that the program has had.
Summary of Strengths and Weaknesses
Strengths The Program is a source of low-cost financing available to landowners. This opportunity
is available specifically to assist and encourage landowners to address NPS pollution of Iowa streams and lakes.
Applications are accepted any time of the year and turnaround time is quick (characteristic of the CWSRF) (IDALS undated).
Quick loan processing and friendly loan repayment terms let borrowers implement projects right away (characteristic of CWSRF) (IDALS undated).
Significant cost savings; interest rates are well below other financing sources (characteristic of CWSRF) (IDALS undated).
Complements other funding sources; can be used to provide project share costs for other funding sources (characteristic of CWSRF) (IDALS undated).
Weaknesses The program is so popular that the state has had to reprioritize funding. Manure
management equipment will no longer be funded under the program (Iowa DNR 2008). It is unclear what direct impacts the program has had on water quality. Monitoring data
before and after the implementation of the program may be one way to prove that the program has been successful.
References
IDALS. Undated. State Revolving Loan Fund. What is the Iowa Water Quality Loan Fund? Iowa Department of Agriculture and Land Stewardship, Field Services Bureau, Des Moines, IA. http://www.iowaagriculture.gov/FieldServices/waterQualityLoanFund.asp. Accessed March, 2009.
Iowa DNR. 2008. Success Leads to Change for Livestock Water Quality Loan Program, November 6, 2008. Iowa Department of Natural Resources, Des Moines, IA. http://www.iowadnr.gov/news/eco/08nov06eco.pdf. Accessed July, 2009.
August 2009 D-72

Nutrient Innovations Task Group Report Appendix D
Iowa DNR. Undated. Iowa DNR State Revolving Fund. Iowa Department of Natural Resources, Des Moines, IA. http://www.iowadnr.gov/water/srf/index2.html. Accessed March, 2009.
IFA. Undated. Livestock Water Quality Program. Iowa Finance Authority, Des Moines, IA. http://www.iowafinanceauthority.gov/en/water_quality_programs/livestock_water_quality_pr ogram. Accessed March, 2009.
Iowa State University. 2008. Livestock Water Quality Loan Program. Iowa State University, Iowa State University Extension, Ames, IA. http://www.extension.iastate.edu/Pages/communications/EPC/Su08/livestockwqloan.html. Accessed March, 2009.
Iowa State University. 2005. New Water Quality Loan Program for Livestock Producers. Iowa State University, Iowa State University Extension, Ames, IA. http://www.extension.iastate.edu/Pages/communications/EPC/Spring05/wqloan.html. Accessed March, 2009.
August 2009 D-73

Nutrient Innovations Task Group Report Appendix D
Kansas Clean Water Farms—River Friendly Farms Project
Overview
The Clean Water Farms Project (CWFP) was initiated in 1995 by the Kansas Rural Center (KRC). With the 2001 use of the River Friendly Farm Environmental Assessment, CWFP became the Clean Water Farm—River Friendly Farm Project (CWF-RFFP) (KRC 2007a). CWF-RFFP helps farmers and ranchers in Kansas adopt land management practices to address water quality issues involving nonpoint source (NPS) pollution (Kansas University 2007).
Eligible practices include planning and implementing extended legume-based crop rotations; use of cover crops, buffer strips, riparian filter strips, field grass filter strips, and stream bank stabilization efforts; livestock management systems that reduce confinement feeding and potential pollution; livestock waste management systems that limit potential pollution from feedlots, wintering, feeding, and storage; high residue cropping systems; conversion to no-till or minimum till with a planned crop rotation; household wastewater systems (e.g., septics); and construction of fuel containment structures (KRC 2007a).
Description
The KRC is a non-profit research, education, and advocacy organization, working to promote an environmentally sound, economically viable, and sustainable system of agriculture (French et al. 2001). Since 1995, with funding from EPA Clean Water Act section 319 NPS funds through the Kansas Department of Health and Environment (KDHE), KRC has been able to offer cost-share and planning assistance to Kansas farmers and ranchers willing to adopt clean water farming practices in vulnerable watersheds (KRC 2007b).
Since 2001, the CWF-RFFP has included the use of the River Friendly Farm Environmental Assessment. The River Friendly Farm Environmental assessment consists of a notebook with questions to help farmers assess and score the status of soil conservation, nutrient management, pest management, and livestock waste utilization on their farms. Most farmers can complete the assessment within a day and a half, using information they already have from conservation plans, aerial maps, and field and yield data (KRC 2007a).The project assessments and costs share demonstrations have been incorporated in the state’s Watershed Restoration and Protection Strategy (WRAPS) since 2005.
For farmers or ranchers to receive a grant through CWF-RFFP the following steps are taken (KRC 2007a):
Participating farmers complete the environmental self-assessment for their farms with assistance from KRC staff. The farmer develops an action plan to protect or improve water quality on the farm. Farmers who complete the assessment and develop an approved action plan are eligible for a $250 incentive payment.
With an approved action plan, farmers and ranchers are eligible to apply for up to $5,000 in cost-share funds to implement their plan, which can be used in conjunction with state and federal cost- share programs.
August 2009 D-74

Nutrient Innovations Task Group Report Appendix D
To be eligible for the incentive payment or cost share program, participants must operate or own a farm or ranch within a WRAPS watershed or high priority total maximum daily load (TMDL) watershed area.
A CWF-RFFP advisory team will review the action plans and cost share applications for approval. CWF-RFFP staff will work with individual farmers through all phases of the project: completing the assessment; developing the action plan; identifying possible solutions; and monitoring progress.
Cost-share recipients must match the requested cost share funds with an equal value of labor, machinery or land use, and/or purchased materials.
At the completion of the project, a final accounting of expenditures and contributed resources is required. If funded at the full $5,000 limit, the project is considered a “demonstration project” and the participant will be asked to host a farm tour or share information through workshops or other outreach methods.
KRC monitors the completion of the BMPs and final payments of cost-share dollars are not made until the projects are verified.
Assessment of How the Approach is Working
By September 2001, KRC had provided nearly $150,000 in cost-share funds to 35 farmers and ranchers through the CWRF. These farms and ranches were located in 20 counties and covered over 24,000 acres within eight of the 12 major river basins in the state. The size of the participating farms ranged from 60 acres to over 5,000 acres, and covered a wide range of operations and management styles (French et al. 2001).
By 2005, there had been over 80 on-farm demonstrations, farm tours, workshops, and feature stories in the media. Through these KRC has brought good examples or models of clean water farming practices to hundreds of other farmers and ranchers (KRC 2007b).
Summary of Strengths and Weaknesses
Strengths Better defined farm goals and a clear plan for achieving those goals (KRC 2007a). Farmer control over the process; assessment of information remains confidential (KRC
2007a). Improved conservation management, which translates into money saved (KRC 2007a). Improved position for qualifying for cost-share funds from a variety of sources (KRC
2007a). Better position to comply with (or avoid) future environmental regulation (KRC 2007a). Incentive for farmers to implement these management practices.
Weaknesses Marketing of the program: not all farmers or ranchers know about this program. KRC does not measure the load reductions, or impacts of the installed BMPs. KRC
provides the information (acres, feet, livestock units involved, etc.) to the KDHE to calculate the benefits.
August 2009 D-75

Nutrient Innovations Task Group Report Appendix D
References
French, L., E. Reznicek, D. Teske, and M. Fund. 2001. Working for Clean Water and Thriving Farms: Farm Profiles from the Clean Water Farms Project. http://www.kansasruralcenter.org/cwfp/intro.pdf. Accessed March, 2009.
KRC. 2007a. Clean Water Farms Project. Kansas Rural Center. http://www.kansasruralcenter.org/CWFP.htm. Accessed March, 2009.
KRC. 2007b. Projects of the Kansas Rural Center: Water Quality Projects. Kansas Rural Center. http://www.kansasruralcenter.org/projects.html. Accessed March, 2009.
Kansas University. 2007. CPCB Research and Current Projects: Validation of the Clean Water Farms Project. Kansas University, Central Plains Center for BioAssessment, Lawrence, KS. http://www.cpcb.ku.edu/research/html/cleanwater.htm. Accessed March, 2009.
August 2009 D-76

Nutrient Innovations Task Group Report Appendix D
North Carolina Agriculture Cost Share Program (ACSP)
Overview
North Carolina’s Agriculture Cost Share Program (ACSP) is a voluntary program designed to protect water quality by installing best management practices (BMPs) on agricultural lands. The program is supported by “financial incentives, technical and educational assistance, research, and regulatory programs provided to farmers by local soil and water conservation districts” (NCDENR undated).
Description
The ACSP was established in 1984 in response to nutrient enrichment concerns in two Piedmont lakes. The program originally included 16 counties in the watersheds of Jordan Lake, Falls Lake, and the Chowan River Basin, but was expanded to all 100 counties in North Carolina in 1990 (Williams 2007).
The ACSP provides landowners and renters of existing agricultural operations (in operation for more than three years) with cost-sharing funds and technical design assistance. Farmers submit applications for the program with their local soil and water conservation districts. Applications are accepted and reviewed on a rolling basis, and ranked based on county resource concerns (NCDENR undated).
Farmers receive up to 75 percent of the pre-determined average cost of installed BMPs (up to $75,000/year) used to protect water quality in streams adjoining their agricultural lands (NCDENR undated). Farmers may supply the remaining balance through a financial contribution, existing materials, or labor (CCSWCD undated). The ACSP also provides up to 50 percent cost share for technical positions in the districts (districts must match with local funds) (Williams 2007).
Approved BMPs include vegetative, structural, or management systems that can improve the efficiency of agricultural operations and reduce the potential for polluting surface and groundwater (NSWCD undated). Installation of the BMP must be accomplished within 3 program years, beginning with the program year in which the cost share contract was approved (NCDENR 2007). Also, BMPs must be maintained for ten years and are subject to random checks by Division staff and the District personnel. Farmers who fail to keep their BMPs in proper working order are subject to repaying some or all of the original cost share funds (NCDENR 2007).
Overview of Program Responsibilities (Williams 2007) The North Carolina Soil and Water Conservation Commission sets program requirements
and allocates funds to districts. Local soil and water conservation districts establish local priorities, solicit and rank
applications, prepare/approve conservation plans and contracts and submit them for state approval, oversee and assist practice implementation, certify installation according to standards, conduct maintenance spot checks, and enforce contracts.
The North Carolina Division of Soil and Water Conservation is responsible for the overall program development and administration, and approval of contracts and payments.
August 2009 D-77

Nutrient Innovations Task Group Report Appendix D
Natural Resources Conservation Service supplies technical standards, design and job approval authority, and advice technical aspects.
The North Carolina Cooperative Extension Service researches and develops new practices and develops tools to quantify benefits.
Annual funding for the program is $5.24 million for financial assistance (monies paid directly to farmers for BMP installation) and $2.45 million for technical assistance (monies allotted to Soil and Water Conservation Districts to fund new positions or support program implementation) (as of 2007) (Williams 2007).
Assessment of How the Approach is Working
In 2007, $8.2 million was allocated for 1,412 contracts. Prominent BMPs include poultry litter storage structures, livestock exclusion and alternate watering systems, cropland conversions to grass and trees, cover crop incentives, and mortality management systems (Williams 2007).
By the end of 2007, nearly $143 million had been expended through 48,000 contracts, nearly 1,000 miles of livestock exclusion fencing has been installed, over 2,000 waste management systems have been installed, over 600,000 acres have been converted to conversion tillage or long term no till, 17,000 acres of riparian buffer have been installed, and 128,000 acres of sensitive cropland have been converted to permanent vegetation or wildlife cover (Williams 2007).
From 1998 to 2007, more than 6.8 million tons of soils have been saved annually, nitrogen losses were reduced by more than 19 million pounds, and phosphorus losses were reduced by more than 5 million pounds (Williams 2007).
Summary of Strengths and Weaknesses
Strengths By providing funding for technical employees in the districts, ACSP provides technical
support for planning and installation, which builds district capabilities (Williams 2007). The program helps build resources for districts to respond to water quality needs. Infrastructure developed for this program can be used for other programs (nearly 20
different special programs use ACSP infrastructure) (Williams 2007). ACSP provides a ready source of non-federal match funds for federal grants, which
encourages districts to apply for grants (Williams 2007). Projects are prioritized based on watershed needs.
Weaknesses The program lacks a strong evaluation aspect, limiting the potential for future analysis
and correction. The program is not universally applied because it is voluntary. The only stated goal of the program is to “reduce the input of agricultural nonpoint
source pollution,” there are no specific reduction goals (NCDENR, 2007). No publicly available information was found regarding numeric targets.
August 2009 D-78

Nutrient Innovations Task Group Report Appendix D
References
CCSWCD. Undated. NC Agriculture Cost Share Program. Cumberland County Soil & Water Conservation District, Fayetteville, NC. http://www.co.cumberland.nc.us/soil_water/programs/agriculture_cost_share.asp. Accessed March, 2009.
NCDENR. Undated. Agriculture Cost Share Program. North Carolina Department of Environment and Natural Resources, Division of Soil & Water Conservation, Raleigh, NC. http://www.enr.state.nc.us/DSWC/pages/agcostshareprogram.html. Accessed March, 2009.
NCDENR. 2007. Objectives of the North Carolina Agriculture Cost Share Program for Nonpoint Source Pollution Control. North Carolina Department of Environment and Natural Resources, Raleigh, NC. http://www.enr.state.nc.us/dswc/pages/SECTION1.doc. Accessed April, 2009.
NSWCD. Undated. North Carolina Agriculture Cost Share Program. Nash Soil & Water Conservation District, Nashville, NC. http://www.nswc.co.nash.nc.us/AgCostShare.htm. Accessed March, 2009; site no longer available.
Williams, D.B. 2007. North Carolina Agriculture Cost Share Program. North Carolina Department of Environment and Natural Resources, North Carolina Division of Soil and Water Conservation, Raleigh, NC. http://www.nascanet.org/Upload/Resource_Center/Field_Staff_Session_2007/Cost_Share_and _Grants/North_Carolina_Cost_Share_Program/North_Carolina_Cost_Share_Program_2007.pdf. Accessed March, 2009.
August 2009 D-79

Nutrient Innovations Task Group Report Appendix D
Ohio Agriculture Pollution Abatement Program
Overview
Ohio’s Agriculture Pollution Abatement Program (APAP) provides farmers with cost share assistance to develop and implement best management practices (BMPs). This voluntary program provides agricultural producers with state funds to alleviate associated financial burdens (ODNR undated).
Description
APAP was created in 1979 and is used by Ohio Department of Natural Resources, Division of Soils and Water Conservation (ODNR-DSWC) and Soil and Water Conservation Districts (SWCDs) to reach out to farmers to promote the wise use of BMPs and help resolve pollution problems to prevent pollution on many small and medium sized agricultural farms (OLEPTF 2008).
ODNR-DSWC administers APAP, and it is implemented locally by all 88 soil and water conservation districts. Depending on the BMP installed, the program offers three levels of funding caps: high ($15,000), medium ($10,000), and low ($5,000) (ODNR undated).
If other public funds are involved in cost sharing to establish eligible BMPs, state funds can only be used to the extent that the combined allocation of public funds amount to no more than 75% of the cost of establishing the BMPs, or not more than $15,000 per person per year, whichever is smaller (OAC 2005a). However, the $15,000 maximum in public funds per person per year limit may be waived by majority vote of the Ohio Soil and Water Conservation Commission (OAC 2005a).
Restrictions on use of cost share funds include the following (OAC 2005a):
Eligible practices which, through natural causes have lost their effectiveness, will qualify for further financial assistance. However, cost share monies will not be awarded to reestablish previously installed practices that have deteriorated due to operator negligence or mismanagement.
Surface mined lands and oil and gas well drilling areas must have been reclaimed and be in active agricultural production or silvicultural uses as determined by the district to be eligible for cost sharing on needed conservation practices.
Cost share funds may only be used for those practices necessary to control agricultural pollution as determined by the district with the approval of the chief of the division of soil and water conservation.
Cost share funds will be available only to owners with a current operation and management plan.
All practices must meet the standards and specifications listed in the Ohio NRCS Field Office Technical Guide. If the Field Office Technical Guide does not apply, practices must meet standards and specifications approved by the chief of the division of soil and water conservation (OAC 2005a). Farmers wanting to know more about the program should contact their local SWCD for more information.
August 2009 D-80
Nutrient Innovations Task Group Report Appendix D
Assessment of How the Approach is Working
APAP is now entering its 30th year. Little publicly available information is available, however, on whether water quality improvements have been realized and how many agricultural operations have benefitted from the program.
Summary of Strengths and Weaknesses
Strengths The program provides valuable monetary assistance for BMP implementation for
agricultural operations (ODNR undated).
Weaknesses This is a voluntary program and does not include enforcement provisions that allow the
state to take action against an agricultural operation unless a complaint is submitted by a third party (DSWC, other agencies, or private citizens). One potential method for enforcement or penalty: if any person fails to comply with an order of the chief (of SWCD, OHDNR) they are guilty of a misdemeanor of the first degree. Action can also be taken if a person is found to have created some sort of danger to public health (OAC 2005b).
There are no goals for water quality or load reduction. The program does not address all sources of NPS nutrients.
References
OAC. 2005a. 1501:15-5-13 Agricultural pollution abatement cost sharing. Ohio Administrative Code. http://codes.ohio.gov/oac/1501:15-5-13. Accessed March, 2009.
OAC. 2005b. 1501:15-5-16 Chief's orders. Ohio Administrative Code. http://codes.ohio.gov/oac/1501%3A15-5. Accessed April, 2009.
ODNR. Undated. What is the Agriculture Pollution Abatement Program? Ohio Department of Natural Resources, Division of Soil and Water Conservation, Columbus, OH. http://www.ohiodnr.com/H_Nav2/ProgramsProjects/AGPollutionAbatementProgram/tabid/885 6/Default.aspx. Accessed March, 2009.
OLEPTF. 2008. Task Force Meeting Minutes. Ohio Lake Erie Phosphorus Task Force. http://www.epa.ohio.gov/portals/35/lakeerie/ptaskforce/Nov4_2008Minutes.pdf Accessed March, 2009.
August 2009 D-81
Nutrient Innovations Task Group Report Appendix D
Virginia Agricultural Stewardship Act
Overview
This accountability method is based on a regulation in Virginia, which allows the state to address water pollution concerns, including nutrients, posed by agricultural operations by utilizing a complaint-based system that affords voluntary compliance, with regulatory action available to the state in the event of continued noncompliance.
Description
In response to increased public concerns for a clean environment, Virginia’s agricultural leadership sought a way of addressing agricultural water pollution that was different from previous approaches used with other industries, such as manufacturers. Most manufacturing plants must obtain permits and follow strict rules of operation. The agricultural community desired a different approach that did not rely on permits and strict operating rules, but took into account the wide variety of farming practices used in Virginia.
The state’s Agricultural Stewardship Act (ASA) offers a positive approach to addressing pollution involving agricultural operations. The ASA provides procedures by which individual agricultural producers can be alerted to areas of their operations that may be causing water pollution. Rather than developing regulations with strict rules governing every type of farming practice, the ASA looks at each farm individually (VDACS 2004).
Assessment of How the Approach is Working
The procedures under the ASA are initiated when a complaint is made to the Commissioner of the Virginia Department of Agriculture and Consumer Services (VDACS). The Commissioner must accept those complaints alleging that a specific agricultural activity is causing or will cause water pollution. After the Commissioner receives a complaint warranting further investigation, the local soil and water conservation district (District) is contacted to determine whether the District wishes to investigate the complaint. If the District does not wish to investigate the complaint, the Commissioner will conduct an investigation. The purpose of the investigation is to determine whether the agricultural activity that initiated the complaint is causing or will cause water pollution. If no causative effect is found from the activity in question, the Commissioner will dismiss the complaint (VDACS 2004).
If the agricultural activity is causing or will cause water pollution, the owner/operator of the agricultural facility is given an opportunity to correct the problem. The owner/operator is tasked with the development of an agricultural stewardship plan that contains “stewardship measures” (i.e. best management practices), corrective measures to address the source of the water pollution or mitigate its impact on surface waters, as well as an implementation schedule (VDACS 2004). The District reviews the owner/operator’s plan and makes recommendations to the Commissioner. If the Commissioner approves the plan, VDACS requests the owner/operator to implement the plan within 18 months (VDACS 2008).
If the owner/operator fails to implement stewardship measures after a plan is approved, enforcement action under the ASA is taken against the owner/operator in the form of levied
August 2009 D-82

Nutrient Innovations Task Group Report Appendix D
fines. In some cases, the ASA investigation will not produce sufficient evidence to support the conclusion that the agricultural activity in question is causing or will cause pollution. In those cases, the investigator will determine if the owner/operator is receptive to voluntarily implementing best management practices that will prevent future complaints (VDACS 2004).
The ASA also requires that the Commissioner develop and distribute an annual summarization of all ASA cases received and processed. The Virginia Agricultural Stewardship Act Annual Report includes an analysis of official complaints (those warranting further investigation) that categorizes complaints based on agricultural activity, the pollutant type responsible for the complaint (nutrients, sediments, and toxins), and the results each investigation grouped into founded, unfounded, dismissed, and carryover. The annual report also highlights the educational efforts undertaken by VDACS over the pervious year (VDACS 2007)
Summary of Strengths and Weaknesses
Strengths Effective complaint based regulatory scheme of nonpoint agriculture Effective means of enforcement via fines Achieves program accountability via the Virginia Agricultural Stewardship Act Annual
Report Transparent and simplistic process allows for quick action on agricultural pollutant
sources and adequate remediation to address the problems Efficient use of state resources achieved via initial screening of complaints to determine
those that warrant further action Holds nonpoint sources accountable
Weaknesses Investigative responsibilities of the Commissioner and Districts is not well defined,
which may create confusion and lend to programmatic hurdles The annual report does not include any information concerning programmatic successes
in terms of pollution reduction, instead success seems to be focused on administrative outputs, such as the number of complaints addressed
The voluntary aspect of the ASA should offer the producer some incentive other then avoiding further complaints, which could be expert advice and logistical and economic support
There are no goals or benchmarks for total nutrient reductions Not all sources are held responsible for reducing loads, just those with a complaint Equitability issue arises from the fact that those farms around higher population areas
have an increased chance of being cited No quantification of loading or reductions
August 2009 D-83

Nutrient Innovations Task Group Report Appendix D
References
VDACS. 2008. Agricultural Stewardship. Virginia Department of Agriculture and Consumer Services, Richmond, VA.. http://www.vdacs.virginia.gov/stewardship/index.shtml. Accessed February, 2009.
VDACS. 2007. Virginia Agricultural Stewardship Act Annual Report: April 1, 2006 – March 31, 2007. Virginia Department of Agriculture and Consumer Services, Richmond, VA.
VDACS. 2004. Virginia Agricultural Stewardship Act Guidelines: A Positive Approach. Virginia Department of Agriculture and Consumer Services, Richmond, VA.
August 2009 D-84

Nutrient Innovations Task Group Report Appendix D
Wisconsin Nonpoint Source Performance Standards and Prohibitions
Overview
The Wisconsin Department of Natural Resources (WDNR), in conjunction with the Department of Agriculture, Trade, and Consumer Protection (DATCP), manages legislation regulating nonpoint source (NPS) pollution from agricultural and urban areas. WDNR administers regulation NR 151 (in effect since October 2002), which contains agricultural cropland and livestock performance standards, manure management prohibitions, and non-agricultural performance standards for construction site erosion control, post-construction stormwater runoff and runoff from established urban areas (Holden 2009, personal communication). DATCP administers regulation ATCP 50, which outlines the technical standards required to implement the agricultural performance standards (including manure management prohibitions) in NR 151. Performance standards for non-agricultural construction/post-construction, developed urban areas (including turf management) are administered through NR 216, Storm Water Discharge Permits. Both the WDNR and DATCP administer state cost share programs to help farmers achieve compliance with the agricultural standards and prohibitions. WDNR administers cost share programs to assist urban municipalities in meeting non-agricultural performance standards.
Description
Agricultural Standards All cropland and livestock operations in Wisconsin, regardless of size, must abide by the agricultural performance standards and manure management prohibitions established in NR 151. These include:
Cropland Performance Standards o Reduce cropland soil erosion to meet tolerable soil loss (T) o Manage nutrient applications of fertilizer and manure to meet crop needs and
reduce delivery of nutrients to waters of the state Livestock Performance Standards
o Construct manure storage facilities to accepted standards o Properly close abandoned manure storage facilities o Abandon, upgrade or replace failing or leaking manure storage facilities o Divert clean water around feedlots in water quality management areas (300 feet
from streams, 1,000 feet from lakes and in areas susceptible to groundwater contamination)
o Manure Management Prohibitions No overflow of manure storage structure No unconfined manure stacks in Water Quality Management Areas No direct runoff from feedlots or stored manure to waters of the state No unlimited livestock access to waters of the state such that adequate
sod cover is not maintained
ATCP 50, the companion regulation to NR 151, identifies the technical standards that can be used to comply with the agricultural performance standards set in NR 151. Many of the technical standards offered in ATCP 50 cross-reference NRCS technical standards.
August 2009 D-85

Nutrient Innovations Task Group Report Appendix D
Most agricultural performance standards and prohibitions became effective on October 1, 2002. Some exceptions were:
Standards for new cropland went into effect October 1, 2003. Nutrient management standards for areas draining to outstanding, exceptional or
impaired resource waters, or in source water protection areas, went into effect on January 1, 2005.
Nutrient management standards for areas draining to all other waters went into effect on January 1, 2008.
Compliance with agricultural performance standards and prohibitions for cropland practices and livestock facilities in place prior to the effective date of the standard can only be required if a bona fide cost share offer is made to the landowner or operator. This is true whether the compliance requirement is imposed by a state agency under NR 151 or by a local governmental unit under local ordinance. This offer must be 70% (90% in cases of economic hardship) of the actual installation cost of required best management practices. Eligible best management practices are set forth in cost-share programs administered by DATCP (ATCP 50) and DNR (NR 153). Funding for the offer can be from any source (federal, state, local private nonprofit). If an offer is refused by the farmer, compliance can be required regardless of any future cost-share offer. In some cases, cross-compliance requirements impose compliance with NR 151 standards and prohibitions regardless of any additional cost sharing. This is the case for farmers that collect farmland preservation tax credits, obtain a livestock siting permit or are required to hold a WPDES permit for their livestock operation. Once compliance is documented, it must be maintained by the landowner and all future landowners, heirs and assign, regardless of future cost sharing.
Urban Standards NR 151 contains performance standards for construction site erosion, post construction runoff from new construction and runoff from established urban areas. Construction sites must reduce delivery of eroded sediment by 80%. Post-construction runoff from new development must be managed to maintain pre-development peak flow discharges, maintain 60 – 90% of the pre-development infiltration volume, protect riparian areas and control runoff from fueling and maintenance areas. In addition, established urban areas are required to reduce total suspended solids on a municipality-wide basis by 20% (as compared to no controls) by March 10, 2008 and by 40% by March 10, 2013. These standards are implemented primarily through the WPDES storm water permits for construction sites and municipal separate storm sewer systems. In addition, there are additional developed area standards that apply to permitted and non-permitted municipalities alike provided they are incorporated and have a population density of at least 1,000/square mile. This requires primarily housekeeping practices and nutrient management for larger (over 5 acres) turf areas.
No cost share requirements apply to non-agricultural construction/post-construction, developed urban area, or turf management performance standards (Holden 2009, personal communication).
August 2009 D-86

Nutrient Innovations Task Group Report Appendix D
Assessment of How the Approach is Working
The state provides some funding to DNR and DATCP as pass-through funding to pay for best management practices (BMPs), staff, and technical support. For 2007, DNR provided $2.3 million for BMPs and $1 million for urban NPS planning (money for urban BMP construction was not available that year, but $2.4 million was provided in 2006). DATCP provided $9.3 million in staffing and support to county land conservation departments (who implemented the agricultural performance standards and other programs) and $4.9 million in cost sharing. The 30 percent local share is often provided by federal sources and a few county cost share programs and nongovernmental organizations. DNR also passed through $0.9 million in Clean Water Act section 319 funds. NRCS provided $17 million through the Environmental Quality Incentives Program (EQIP) and $0.5 million for the Conservation Reserve Enhancement Program (CREP) (Holden 2009, personal communication).
WDNR is in the process of revising NR 151. Propositions include new agricultural performance standards and modification of several agricultural and non-agricultural performance standards (Holden 2009, personal communication).
Summary of Strengths and Weaknesses
Strengths Program addresses both agricultural and non-agricultural NPS (Holden 2009, personal
communication). Program sets a minimum level of expected nutrient management measures and
provides a consistent framework for implementing agricultural BMPs (Holden 2009, personal communication).
Provides cost-share options to support initial implementation of standards. The concept of “once in compliance, always in compliance,” means that the state only
pays once for a BMP and does not have to further cost share practices that come out of compliance (Holden 2009, personal communication).
Regulatory component provides a structure by which the worst sites can be targeted for remediation (Holden 2009, personal communication).
Program gives local governments authority to enact ordinances to enforce performance standards at the local level. This increases local regulatory authority and reduces the burden on the state (Holden 2009, personal communication).
Following the adoption of NR 151, several state NPS program partners worked together to develop a detailed implementation strategy that provides additional guidelines for complying with the standards. This approach supports implementation of the performance standards.
Weaknesses There is often a delay in the availability of cost share funds and staff time is often spent
organizing and directing project resources. This can hamper regulatory enforcement of standards, as cost sharing must be offered to a producer before an agricultural performance standard can be enforced (Holden 2009, personal communication).
Some city leaders have protested the structure of the cost share system. Cost sharing is not required for enforcement of non-agricultural practices, which some believe to be
August 2009 D-87

Nutrient Innovations Task Group Report Appendix D
unfair. The decision to create different enforcement rules was done to protect farmers who cannot pass on their costs like those in the non-agricultural sector (municipalities, construction companies, etc.) (Holden 2009, personal communication).
The program lacks planning and evaluation components, which makes it difficult to connect performance standards to water quality improvements (Holden 2009, personal communication).
The existing suite of performance standards is not as strong as DNR originally proposed (a result of modifications required to get the legislation passed) (Holden 2009, personal communication).
References
Holden, C. 2009, March 18. Email from Carol Holden, Runoff Management Section, Wisconsin Department of Natural Resources, to Tetra Tech, Inc.
August 2009 D-88

Nutrient Innovations Task Group Report Appendix D
Clean Air Act: State Implementation Plans
Overview
The accountability method for the Clean Air Act state implementation plans (SIPs) is based on mandatory reporting and EPA’s regulatory authority to impose sanctions on states who do not comply.
Description
The Clean Air Act (CAA), last amended in 1990, is the comprehensive federal law that regulates air emissions from stationary and mobile sources. The CAA authorizes EPA to establish National Ambient Air Quality Standards (NAAQS) to protect public health and public welfare and to regulate emissions of hazardous air pollutants (USEPA 2009). The CAA also requires states to submit state implementation plans (SIPs) to EPA which provide for implementation, maintenance, and enforcement of the NAAQS established (carbon monoxide, lead, nitrogen dioxides, ozone, particulate matter and sulfur dioxide) (USEPA 2008b; USEPA 2008e).
Only one SIP exists for each state, and revisions are necessary when new federal or state requirements are enacted, when new data improves modeling techniques, when a specific area’s attainment status changes, or when an area fails to reach attainment. Revisions are usually prepared for a specific area and include an assessment of the problem and measures to fix it (TCEQ 2008).
The contents of a typical SIP fall into several categories (USEPA 2008a):
1) State-adopted control measures which consists of either rules/regulations or source-specific requirements (e.g., orders and consent decrees)
2) State-submitted comprehensive air quality plans (e.g., attainment plans, maintenance plans, rate of progress plans, transportation control plans) demonstrating how state regulatory and source-specific controls, in conjunction with federal programs, will bring and/or keep air quality in compliance with federal air quality standards
3) State- submitted "non-regulatory" requirements (e.g., emission inventories, small business compliance assistance programs, statutes demonstrating legal authority, monitoring networks, etc.)
4) Additional requirements promulgated by EPA (in the absence of a commensurate State provision) to satisfy a mandatory requirements
Each SIP revision submitted by the state must undergo reasonable notice and public hearing at the state level, and SIPs submitted to EPA to attain or maintain the NAAQS must include enforceable emission limitations and other control measures, schedules and timetables for compliance. EPA evaluates submitted SIPs to determine if they meet the CAA's requirements. If a SIP meets the Act's requirements, EPA will approve the SIP. EPA's notice of approval is published in the Federal Register and the approval is then codified in the Code of Federal Regulations (USEPA 2008b).
The enforcement of the SIP is a state responsibility. However, after the regulation is federally approved, EPA is authorized to take enforcement action against violators. Citizens are also
August 2009 D-89

Nutrient Innovations Task Group Report Appendix D
offered legal recourse to address violations as described in Section 304 of the CAA (USEPA 2008a).
Under the CAA, EPA is required to impose highway fund and other sanctions if they find that a state has failed to submit a required SIP or revision, if they disapprove a required SIP or revision, or if they find that a requirement of an approved SIP is not being implemented (USDOT 2008).
Assessment of How the Approach is Working
Prior to 1990, it was difficult for EPA to penalize violators of the CAA because courts were the only mechanisms for even minor violations. The 1990 Amendments strengthened EPA's power to enforce the CAA by increasing the range of civil and criminal sanctions available. When EPA finds that a violation has occurred, the agency can issue an order requiring the violator to comply, issue an administrative penalty, or bring a civil judicial action (USEPA 2008c).
The threat of sanctions is a powerful tool that Congress gave EPA to encourage state compliance with the CAA's objectives. EPA has formally notified the states of its intent to use sanctions 855 times since 1990. The actual imposing of sanctions, which cannot occur until 18 months after formal notification, is a relatively rare event. EPA imposed sanctions 14 times since 1990, and the only sanction currently in effect is for one small area in Montana (McCarthy 1997).
Examples of EPA action
Clark County, Las Vegas: In August 1999, EPA found that Clark County missed a deadline to submit their SIP, which was in May 1999. The finding started an 18-month Clean Air Act “sanction clock,” where it would have imposed more stringent permit requirements for industrial sources and limitations on the county’s federal highway funds after 24 months. EPA determined that the SIP was complete in September 2000, which stopped the sanctions from applying. In July 2004, EPA finalized its approval of the SIP revisions for the attainment of carbon monoxide NAAQS, and in May 2005, EPA made the final decision that the area meets air quality standards for carbon monoxide (USEPA 2008d).
Maricopa County, Arizona: In June 2007, EPA found that the Phoenix metropolitan area failed to attain particulate matter NAAQS by the December 2006 deadline. This required a SIP revision by December 2007, which provides for annual reductions of particulate matter of more than 5% per year of emissions until the NAAQS is attained. The County developed a plan to reduce emissions by 5% each year until NAAQS is attained, and submitted revised SIP to EPA in December 2007 (MCAQD undated).
The strength of this program is that when a state fails to submit a SIP, or depending on the contents of the SIP, the EPA can enforce sanctions. The direct linkage between failing to meet air quality standards and not providing highway funds helps EPA implement air quality standards. For water quality and nutrients, finding a direct leverage item may be important. If agriculture and urban development are penalized for not promoting best management practices, it may help reduce nonpoint source pollution.
August 2009 D-90

Nutrient Innovations Task Group Report Appendix D
Summary of Strengths and Weaknesses
Strengths Provides EPA with the legal tools to implement the submittal of SIPs, and impose
sanctions if states do not comply (has regulatory teeth) Creates a strong negative incentive for states to comply Provides access for communities to get access to the document and file suits if
necessary (because SIPs are mandatory)
Weaknesses EPA is responsible for many administrative tasks, such as tracking SIP due dates for each
state. EPA needs to evaluate the SIPs and respond to the states with their decision within a set
timeframe. Communication between the states and EPA is imperative.
References
MCAQD. Undated. State Implementation Plan. Maricopa County Air Quality Department, Phoenix, AZ. http://www.maricopa.gov/aq/divisions/planning_analysis/state_implementation_plan.aspx. Accessed February, 2009.
McCarthy, J.E. 1997. Highway Fund Sanctions for Clean Air Act Violations. 97-959 ENR. Congressional Research Service, Environment and Natural Resources Policy Division, Washington, DC. https://www.policyarchive.org/bitstream/handle/10207/490/97-959_19971022.pdf?sequence=1. Accessed February, 2009.
TCEQ. 2008. SIP: Introduction to the Texas State Implementation Plan (SIP). Texas Commission on Environmental Quality, Austin, TX. http://www.tceq.state.tx.us/implementation/air/sip/sipintro.html. Accessed February, 2009.
USDOT. 2008. Highway Sanctions. U.S. Department of Transportation, Federal Highway Administration, Washington DC. http://www.fhwa.dot.gov/environment/sanction.htm. Accessed February, 2009.
USEPA. 2009. Summary of the Clean Air Act. U.S. Environmental Protection Agency, Washington, DC. http://www.epa.gov/regulations/laws/caa.html. Accessed February, 2009.
USEPA. 2008a. What is a State Implementation Plan? U.S. Environmental Protection Agency, Office of Air and Radiation, Washington, DC. http://www.epa.gov/reg3artd/airregulations/sips/sipdetail.htm. Accessed February, 2009.
USEPA. 2008b. General SIP Requirements. U.S. Environmental Protection Agency, Region 8, Denver, CO. http://www.epa.gov/region8/air/sipreq.html. Accessed February, 2009.
August 2009 D-91

Nutrient Innovations Task Group Report Appendix D
USEPA. 2008c. Permits and Enforcement. U.S. Environmental Protection Agency, Office of Air and Radiation, Washington, DC. http://www.epa.gov/air/caa/peg/permits.html. Accessed February, 2009.
USEPA. 2008d. Las Vegas (Clark County) Particulate Matter Pollution. U.S. Environmental Protection Agency, Region 9, San Francisco, CA. http://www.epa.gov/region09/air/vegasco/index.html. Accessed February, 2009.
USEPA. 2008e. National Ambient Air Quality Standards. U.S. Environmental Protection Agency, Office of Air and Radiation, Washington, DC. http://www.epa.gov/air/criteria.html. Accessed February, 2009.
August 2009 D-92

