the hong kong polytechnic university mpf member … · fidelity worldwide investment. 2 ... mpf...
TRANSCRIPT

The Hong Kong Polytechnic University
MPF Member Briefing
September 2015
Fidelity Worldwide Investment

2
Fidelity Retirement Master Trust (“FRMT”)
Please note:
• You should consider your own risk tolerance level and financial circumstances before making any investment choices. When, in your selection of funds, you are in doubt as to whether a certain fund is suitable for you (including whether it is consistent with your investment objectives), you should seek financial and/or professional advice and choose the fund(s) most suitable for you taking into account your circumstances.
• The MPF Conservative Fund under the Fidelity Retirement Master Trust does not guarantee the repayment of capital.
• You should not invest based on this document alone and should read the Principal Brochure of Fidelity Retirement Master Trust for further information.
• Fidelity SaveEasy Funds are not savings deposits and involve investment risks and this product may not be suitable for everyone. Investors should also consider factors other than age and review their own investment objectives.

3
1
2 Investment performance
3 Market outlook
Contents
Fidelity Retirement Master Trust
4 Fidelity member services

4
Fidelity Retirement Master Trust
5
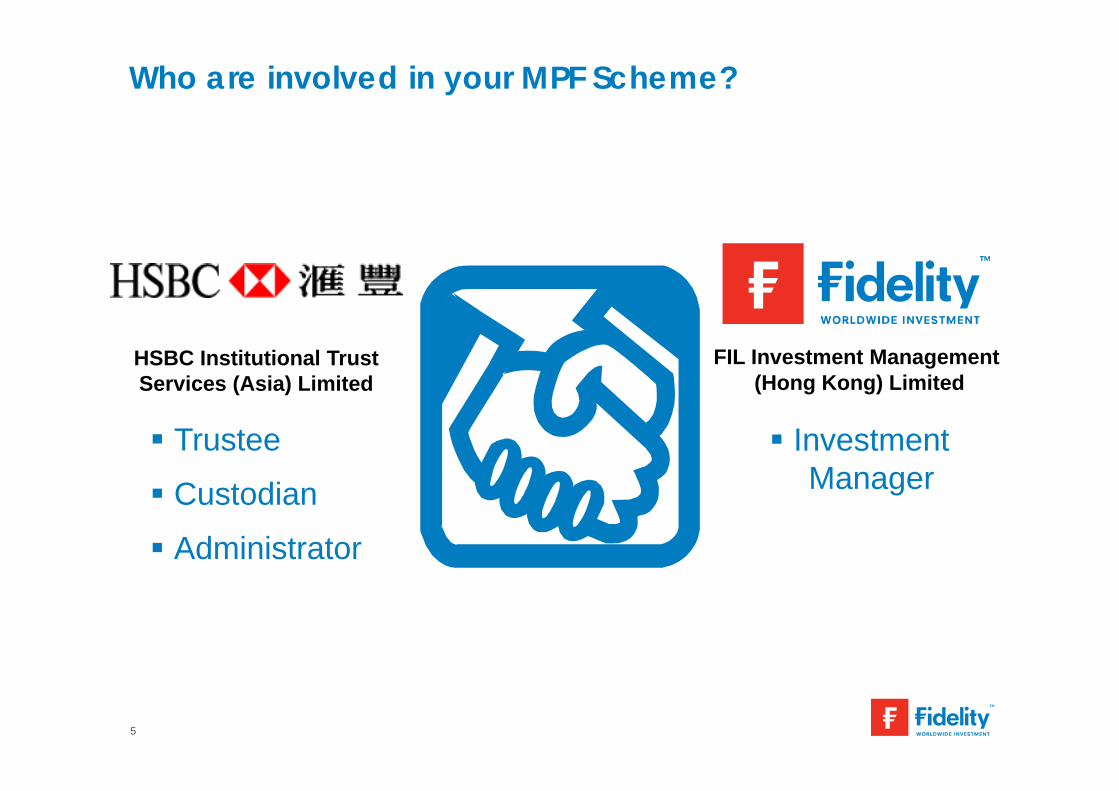
Who are involved in your MPF Scheme?
FIL Investment Management (Hong Kong) Limited
HSBC Institutional Trust Services (Asia) Limited
Trustee
Custodian
Administrator
Investment Manager

6
Fidelity Retirement Master Trust16 choices to cater for your risk appetite

Equi
ty A
lloca
tion
0%
10%
20%
30%
40%
50%
60%
70%
80%
90%
100%
32 27 22 17 12 7 2 0Years to Retirement
TRANSITION
Getting Started
Preparingto Retire
Ret
irem
ent
Accumulating Savings
The Fidelity SaveEasy Funds Asset Rolldown Chart above provides a simple method for investors to view the indicative asset allocation for the various SaveEasy Funds also the shift in the risk/return profile over the duration of the particular SaveEasy Fund.Investors are reminded that this is an indicative rolldown and that any particular given point in the time actual portfolios may at times vary considerably from the shown above as market, political, structural, economic and other conditions change.
SaveEasy Funds
Equity Bond CashFund Asset Allocation
35%
55%
10%
7

8
Investment performance

9
Calendar year performance – FRMT2010(%)
2011(%)
2012(%)
2013(%)
2014(%)
Index Tracking Funds
Fidelity Hong Kong Tracker Fund - - - 7.36* 3.97
Equity Funds
Hong Kong Equity Fund 10.40 -22.31 20.65 7.70 3.07
Asia Pacific Equity Fund 11.88 -16.86 20.85 3.92 4.09
Global Equity Fund 12.09 -10.91 16.59 24.93 4.47
Lifecycle Funds
Growth Fund 10.95 -14.52 16.74 17.23 1.52
Balanced Fund 9.47 -10.61 14.15 12.72 1.45
Stable Growth Fund 8.12 -6.52 11.50 8.60 1.45
Capital Stable Fund 6.30 -2.65 8.54 4.56 1.22
Bond and Money Market Funds
Hong Kong Bond Fund 3.55 5.00 3.96 -3.36 3.93
World Bond Fund 4.49 5.08 5.26 -2.20 2.15
MPF Conservative Fund 0.01 0.00 0.00 0.00 0.00
SaveEasy Funds
Fidelity SaveEasy 2040 Fund 11.70 -15.76 18.24 17.72 1.57
Fidelity SaveEasy 2035 Fund 11.55 -15.84 18.10 17.62 1.55
Fidelity SaveEasy 2030 Fund 11.38 -15.72 17.86 17.84 1.47
Fidelity SaveEasy 2025 Fund 11.11 -15.35 17.57 17.54 1.54
Fidelity SaveEasy 2020 Fund 10.68 -14.73 16.93 16.52 1.58* Since launch date to the end of launch yearFees and charges of MPF conservative funds can be deducted from either (i) the assets of the fund or (ii) members’ account by way of unit deduction. MPF Conservative Fund under the Fidelity Retirement Master Trust uses method (i) and, therefore, its unit prices / NAV / fund performance have incorporated the impact of fees and charges.Source: Fidelity Worldwide Investment, net of fees, in HKD

10
FRMT performance vs median(as at 31 Aug 2015)
YTD(%)
3 Months(%)
1 Year(%)
3 Years(% p.a.)
5 Years(% p.a.)
10 Years(% p.a.)
Indexing Tracking Funds
Fidelity Hong Kong Tracker Fund Fund -6.61 -19.77 -10.42 - - -
Median -6.36 -19.77 -10.30 - - -
Equity Funds
Hong Kong Equity Fund Fund -7.44 -21.76 -9.05 5.98 2.15 7.22
Median -7.75 -22.22 -9.50 5.40 2.32 7.08
Asia Pacific Equity Fund Fund -9.99 -16.83 -15.75 3.28 2.94 -
Median -5.96 -12.62 -12.53 2.93 2.48 -
Global Equity Fund Fund -2.08 -7.61 -3.81 10.57 9.98 4.69
Median -2.67 -8.04 -5.37 9.18 9.08 3.77
Lifecycle Funds
Growth Fund Fund -3.20 -12.56 -5.84 7.95 6.15 6.04
Median -4.31 -12.56 -7.77 5.78 5.17 4.65
Balanced Fund Fund -3.12 -10.14 -5.67 6.06 5.08 5.45
Median -3.65 -10.16 -7.14 4.39 4.48 4.59
Stable Growth Fund Fund -3.18 -7.63 -5.72 4.15 3.99 4.78
Median -3.47 -7.55 -6.41 2.74 3.03 3.98
Capital Stable Fund Fund -3.19 -5.07 -5.65 2.19 2.71 3.87
Median -3.18 -4.84 -5.72 0.87 1.77 3.14
Blue highlights represent funds that are in line with or outperform median.Source: Morningstar, net of fees, in HKD

11
FRMT performance vs median(as at 31 Aug 2015)
YTD(%)
3 Months(%)
1 Year(%)
3 Years(% p.a.)
5 Years(% p.a.)
10 Years(% p.a.)
Bond and Money Markets Funds
Hong Kong Bond Fund Fund 0.65 -1.04 1.34 0.66 1.52 2.59
Median 1.10 -0.57 1.39 0.29 0.66 2.01
World Bond Fund Fund -3.37 -0.63 -5.66 -0.60 1.09 2.33
Median -3.46 -1.05 -5.65 -1.74 0.22 2.27
MPF Conservative Fund* Fund 0.00 0.00 0.00 0.00 0.00 0.67
Median 0.03 0.00 0.09 0.11 0.06 0.77
SaveEasy Funds
Fidelity SaveEasy 2040 Fund Fund -3.19 -13.26 -5.96 8.41 6.45 -
Median - - - - - -
Fidelity SaveEasy 2035 Fund Fund -3.36 -13.30 -6.06 8.27 6.34 -
Median - - - - - -
Fidelity SaveEasy 2030 Fund Fund -3.36 -13.19 -6.13 8.24 6.31 -
Median - - - - - -
Fidelity SaveEasy 2025 Fund Fund -3.29 -12.90 -6.00 8.16 6.28 -
Median - - - - - -
Fidelity SaveEasy 2020 Fund Fund -2.77 -11.73 -5.43 7.91 6.11 -
Median - - - - - -
Blue highlights represent funds that are in line with or outperform median; yellow highlights represent funds with no relevant median for comparison purpose.* Fees and charges of MPF conservative funds can be deducted from either (i) the assets of the fund or (ii) members’ account by way of unit deduction. MPF Conservative Fund under the Fidelity Retirement Master Trust uses method (i) and, therefore, its unit prices / NAV / fund performance have incorporated the impact of fees and charges.Source: Morningstar, net of fees, in HKD

STRICTLY FOR [insert company name]MANAGEMENT INFORMATION ONLY
Fidelity Retirement Master TrustRecognized for outstanding performance
The above awards are for reference only, it is not indicative of the actual performance of the constituent funds.The third party mark appearing in this material is the property of the respective owner and not by Fidelity.~ The awards only represent MPF Ratings’ assessment standard (for details, please visit: mpfratings.com.hk/media/award). The results are based on the investment and performance, fees and charges and assessment of administration services of an MPF scheme (with at least 3 years track record) as of 31 Dec 2014.* The awards only represent Morningstar’s Best MPF Scheme Award Methodology (for details, please visit: awards.morningstar.com). The results are based on the quantitative and qualitative assessment of an MPF scheme as of 31 Dec 2014. The quantitative assessment is based on 1-year, 3-year and 5-year risk-adjusted returns of each constituent fund. The qualitative assessment is based on product diversity, transparency and disclosure, and investor experience of each MPF scheme from 1 Jan 2014 to 31 Dec 2014.Source: Fidelity Worldwide Investment HM15-0308
MORNINGSTAR BEST MPF SCHEME AWARD*
~ ~

13
Market outlook

14
Where to invest – Emerging Markets or Developed Markets?
Weak Oil Price
Improving Global
EconomyStrong
USD
Monetary Policy
Divergence

China – More easing measures are needed to turn around the economic slowdown
Source: Markit, latest data point July 2015
China Manufacturing PMI RMB Depreciation
Continuous quantitative easingto stimulate economic growth
15
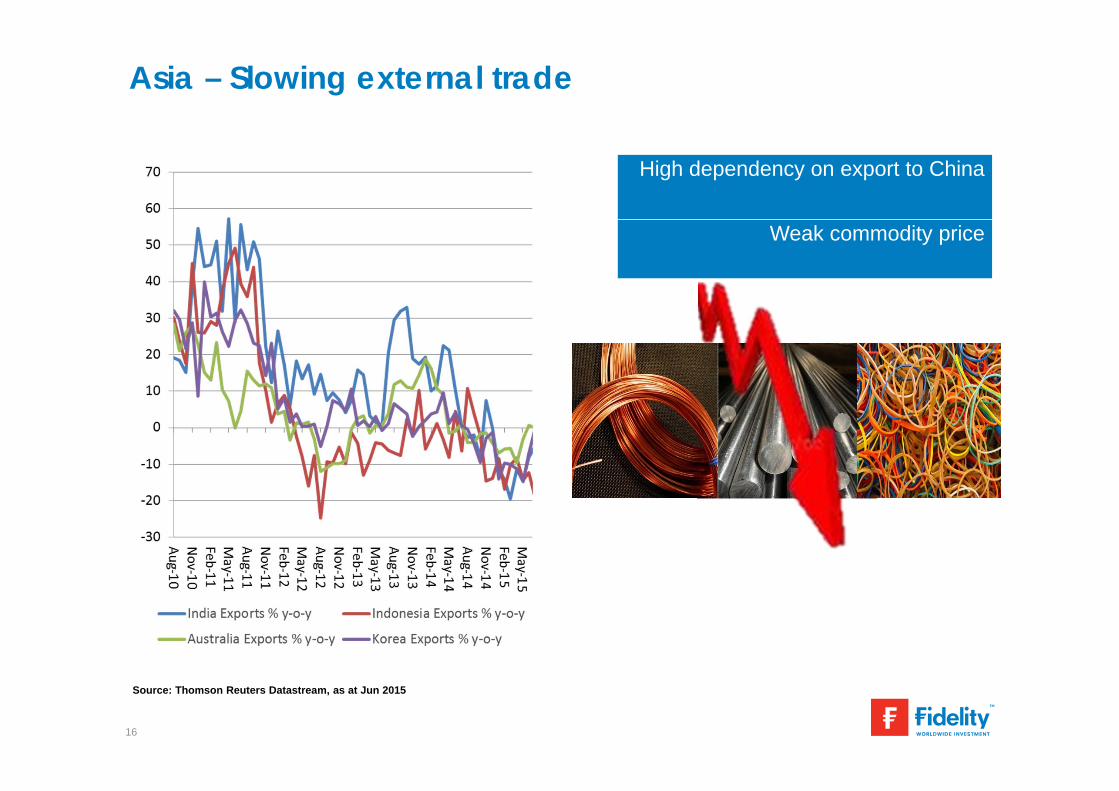
Asia – Slowing external trade
16
Source: Thomson Reuters Datastream, as at Jun 2015
High dependency on export to China
Weak commodity price

US – Broadening recovery supported by wage increase while strong USD add uncertainty
17
Source: Thomson Reuters Datastream, as at July 2015
Companies planning to raise wagesUnemployment rate fall to the level of 5.3%
Weak commodity prices benefit consumers
Source: U.S. Bureau of Economic Analysis, as at July 2015

Japan – Weaker yen should provide a boost
18
Weak yen boosts export competitiveness
New corporate governance code increases shareholder focus
Source: Thomson Reuters Datastream, as at May 2015
External trade position

Europe – Leading indicators point to a turnaround
19
-30%
-20%
-10%
0%
10%
20%
30%
40%
50%
-2%
0%
2%
4%
6%
8%
10%
12%
Jan-99Jan-00Jan-01Jan-02Jan-03Jan-04Jan-05Jan-06Jan-07Jan-08Jan-09Jan-10Jan-11Jan-12Jan-13Jan-14Jan-15
EMU M1 %6mom (brought forward by 6m)EMU PMI composite %6mom (rhs)
(LHS)(RHS)
Sources: JP Morgan May 2015
Eurozone money growth vs. PMIAccommodative monetary policy
Weak euro boosts export competitiveness
Major European countries are better prepared for a Greek crisis

Market outlook(as at Aug 2015)
20
Hong Kong
N. America
Europe
Japan
Asia Pacific
Positive
Neutral
Negative
Source: Fidelity Worldwide Investment

21
Fidelity member services

Fidelity Website – www.fidelity.com.hk
Fidelity Investor Hotline – (852) 2629 2629 24-hour Interactive Voice Response System
Member Service Hotline Centre– Monday – Friday , 9am to 6pm– Saturday,9am to 1pm
Fidelity Investor Centre Level 21, Two Pacific Place, 88 Queensway, Admiralty, Hong Kong
Monday – Friday, 9am to 6pm (by appointment)
Please contact us
22

23
Fidelity mobile website
Visit www.fidelity.com.hk on your smartphone

24
Appendix
25
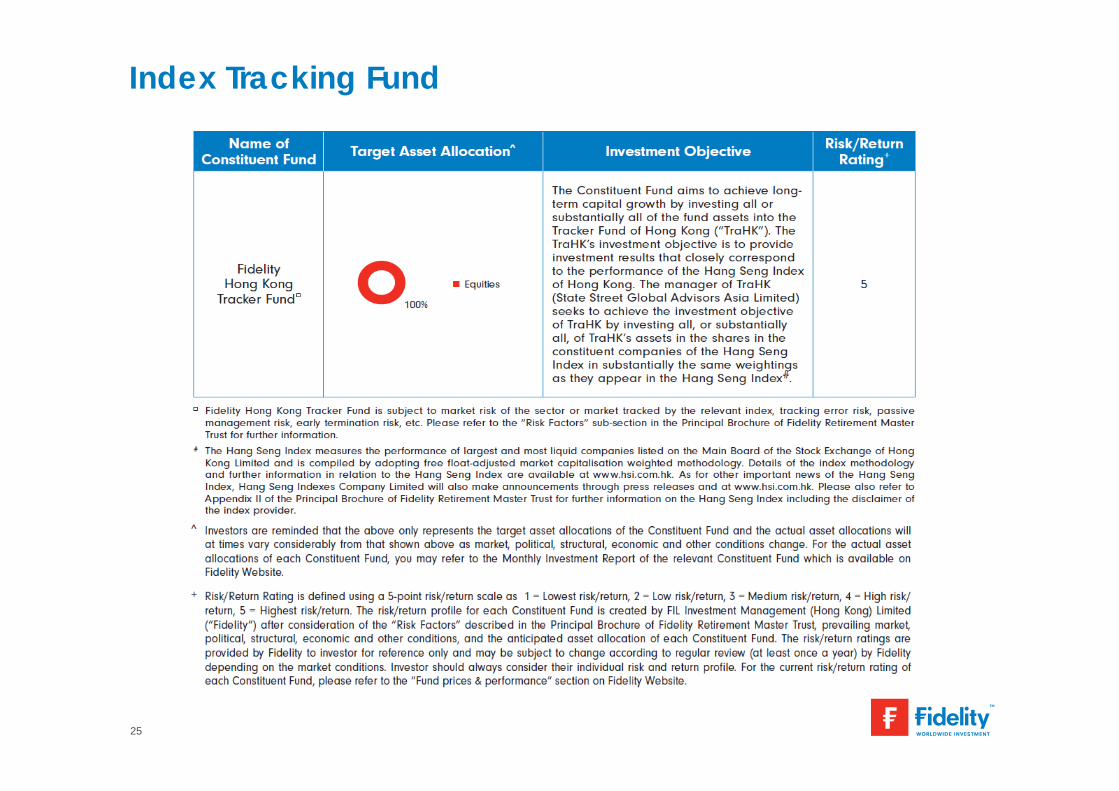
Index Tracking Fund

26
SaveEasy Funds

27
Equity Funds

28
Lifecycle Funds

29
Lifecycle Funds

30
Bond and Money Market Funds

31
Important information - FRMT
This document has been requested by you and prepared by Fidelity for you in Hong Kong only for informational purposes and may not bereproduced or circulated without written consent from Fidelity. FIL Limited and its subsidiaries are commonly referred to as Fidelity or FidelityWorldwide Investment.
Fidelity only gives information about its products and services. Any person considering an investment should seek independent advice on thesuitability or otherwise of the particular investment.
Investment involves risks. Past performance is not indicative of future performance. Please refer to the Principal Brochure of Fidelity RetirementMaster Trust for further information including the risk factors.
Fees and charges of MPF conservative funds can be deducted from either (i) the assets of the fund or (ii) members' account by way of unitdeduction. MPF Conservative Fund under the Fidelity Retirement Master Trust uses method (i) and, therefore, its unit prices / NAV / fundperformance have incorporated the impact of fees and charges.
The On-going Costs Illustrations (for all Constituent Funds of the Master Trust except for the MPF Conservative Fund) that illustrate the on-goingcosts on contributions to Constituent Funds of the Master Trust and the Illustrative Example (for the MPF Conservative Fund) are distributed withthe Principal Brochure. Before making any investment decisions concerning MPF investments, you should ensure that you have the latest versionof these documents which can be obtained from the Trustee or the Investment Manager at their addresses stated in the Principal Brochure.
Fidelity, Fidelity Worldwide Investment, the Fidelity Worldwide Investment logo and F symbol are trademarks of FIL Limited. This material is issuedby FIL Investment Management (Hong Kong) Limited and it has not been reviewed by the Securities and Futures Commission.