the hologram in my hand: how effective is interactive ...bbach/hololens/bach2018holostudy.pdf ·...
TRANSCRIPT
The Hologram in My Hand:How Effective is Interactive Exploration of 3D Visualizations
in Immersive Tangible Augmented Reality?
Benjamin Bach, Ronell Sicat, Johanna Beyer, Maxime Cordeil, Hanspeter Pfister
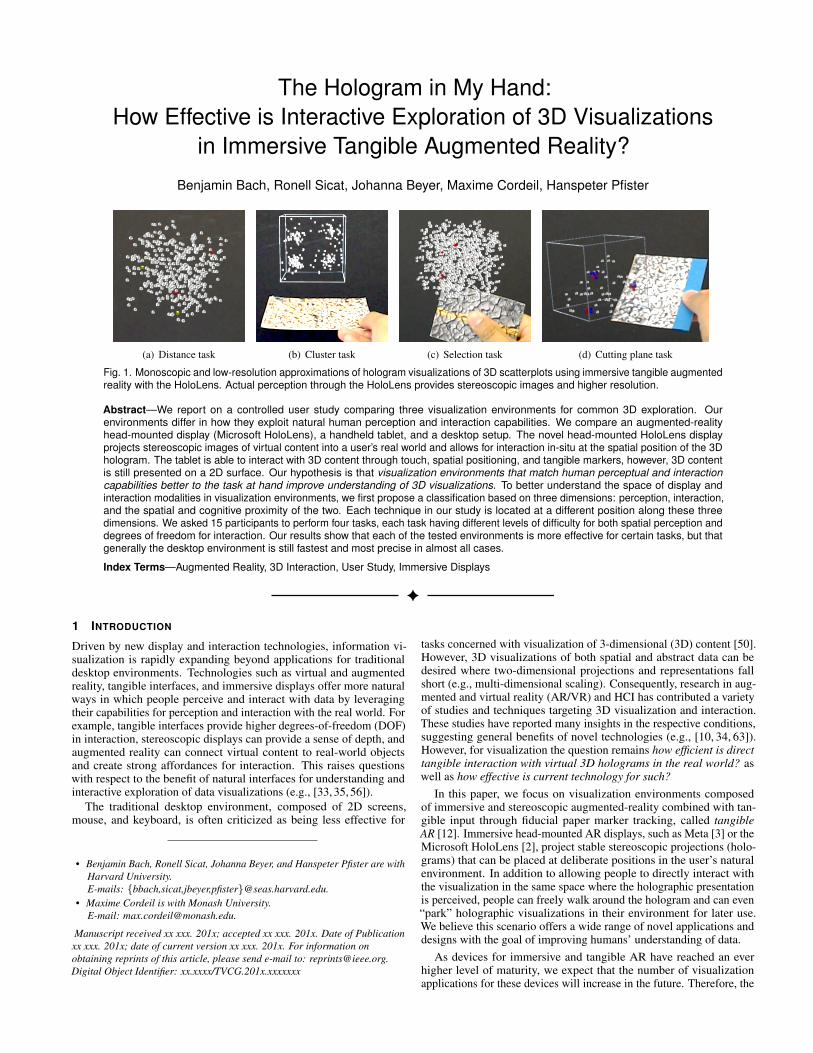
(a) Distance task (b) Cluster task (c) Selection task (d) Cutting plane task
Fig. 1. Monoscopic and low-resolution approximations of hologram visualizations of 3D scatterplots using immersive tangible augmentedreality with the HoloLens. Actual perception through the HoloLens provides stereoscopic images and higher resolution.
Abstract—We report on a controlled user study comparing three visualization environments for common 3D exploration. Ourenvironments differ in how they exploit natural human perception and interaction capabilities. We compare an augmented-realityhead-mounted display (Microsoft HoloLens), a handheld tablet, and a desktop setup. The novel head-mounted HoloLens displayprojects stereoscopic images of virtual content into a user’s real world and allows for interaction in-situ at the spatial position of the 3Dhologram. The tablet is able to interact with 3D content through touch, spatial positioning, and tangible markers, however, 3D contentis still presented on a 2D surface. Our hypothesis is that visualization environments that match human perceptual and interactioncapabilities better to the task at hand improve understanding of 3D visualizations. To better understand the space of display andinteraction modalities in visualization environments, we first propose a classification based on three dimensions: perception, interaction,and the spatial and cognitive proximity of the two. Each technique in our study is located at a different position along these threedimensions. We asked 15 participants to perform four tasks, each task having different levels of difficulty for both spatial perception anddegrees of freedom for interaction. Our results show that each of the tested environments is more effective for certain tasks, but thatgenerally the desktop environment is still fastest and most precise in almost all cases.
Index Terms—Augmented Reality, 3D Interaction, User Study, Immersive Displays
1 INTRODUCTION
Driven by new display and interaction technologies, information vi-sualization is rapidly expanding beyond applications for traditionaldesktop environments. Technologies such as virtual and augmentedreality, tangible interfaces, and immersive displays offer more naturalways in which people perceive and interact with data by leveragingtheir capabilities for perception and interaction with the real world. Forexample, tangible interfaces provide higher degrees-of-freedom (DOF)in interaction, stereoscopic displays can provide a sense of depth, andaugmented reality can connect virtual content to real-world objectsand create strong affordances for interaction. This raises questionswith respect to the benefit of natural interfaces for understanding andinteractive exploration of data visualizations (e.g., [33, 35, 56]).
The traditional desktop environment, composed of 2D screens,mouse, and keyboard, is often criticized as being less effective for
• Benjamin Bach, Ronell Sicat, Johanna Beyer, and Hanspeter Pfister are withHarvard University.E-mails: {bbach,sicat,jbeyer,pfister}@seas.harvard.edu.
• Maxime Cordeil is with Monash University.E-mail: [email protected].
Manuscript received xx xxx. 201x; accepted xx xxx. 201x. Date of Publicationxx xxx. 201x; date of current version xx xxx. 201x. For information onobtaining reprints of this article, please send e-mail to: [email protected] Object Identifier: xx.xxxx/TVCG.201x.xxxxxxx
tasks concerned with visualization of 3-dimensional (3D) content [50].However, 3D visualizations of both spatial and abstract data can bedesired where two-dimensional projections and representations fallshort (e.g., multi-dimensional scaling). Consequently, research in aug-mented and virtual reality (AR/VR) and HCI has contributed a varietyof studies and techniques targeting 3D visualization and interaction.These studies have reported many insights in the respective conditions,suggesting general benefits of novel technologies (e.g., [10, 34, 63]).However, for visualization the question remains how efficient is directtangible interaction with virtual 3D holograms in the real world? aswell as how effective is current technology for such?
In this paper, we focus on visualization environments composedof immersive and stereoscopic augmented-reality combined with tan-gible input through fiducial paper marker tracking, called tangibleAR [12]. Immersive head-mounted AR displays, such as Meta [3] or theMicrosoft HoloLens [2], project stable stereoscopic projections (holo-grams) that can be placed at deliberate positions in the user’s naturalenvironment. In addition to allowing people to directly interact withthe visualization in the same space where the holographic presentationis perceived, people can freely walk around the hologram and can even“park” holographic visualizations in their environment for later use.We believe this scenario offers a wide range of novel applications anddesigns with the goal of improving humans’ understanding of data.
As devices for immersive and tangible AR have reached an everhigher level of maturity, we expect that the number of visualizationapplications for these devices will increase in the future. Therefore, the
purpose of our study is to provide researchers and practitioners withsome initial evidence about how visualization environments for im-mersive tangible AR (HoloLens with tangible markers, ImmersiveAR)and traditional AR on a handheld tablet (TabletAR) compare to thetraditional desktop environment (Desktop).
To that end, we focus on three of the most prominent aspects ofvisualization environments and are interested in their combined effects:(i) stereoscopic perception, (ii) degrees of freedom for interaction,and (iii) proximity of the respective physical spaces for perception andinteraction [49]. In each environment, we investigate four representativevisualization and interaction tasks that vary in the degree to which theyrely on perception and interaction: (1) estimate spatial distance betweenpoints, (2) count clusters, (3) select visual elements, and (4) orient acutting plane (Fig. 1). As for the visualization, we chose to study 3Dpoint clouds as they are similar to a variety of 3D visualizations (e.g.,3D scatterplots, space-time cubes), their respective visual patterns (e.g.,clusters, outliers, trends, density), as well as common visualizationchallenges in 3D (e.g., occlusion, perspective distortion).
Our results show good performance for immersive tangible AR fortasks that can be solved through spatial perception and interactionswith a high degree of freedom. We also observed a slight improvementin performance due to training for the ImmersiveAR environment overseveral days. However, overall the desktop environment offered supe-rior precision, speed, and familiarity across most tasks. One possibleinterpretation of these results is to strive for a tighter integration ofdifferent visualization environments in order to support a wider rangeof tasks and interactions. While technical performance and precision ofimmersive technologies, such as the HoloLens, will likely improve overthe next years, our results point to general trends and current drawbacksand serve as a timely reference point.
2 RELATED WORK
3D visualizations have been found useful for inherently spatial data inmany applications in biomedicine, science, and engineering. Using 3Dvisualizations for displaying abstract data has historically been a con-troversial topic [34,50] but some exploration tasks for high-dimensionaldata have been found to increase cognitive effort if only sets of 2Dprojections were provided [53, 61]. Overall, the landscape of scientificand abstract 3D visualizations is very rich [13] including 3D scatter-plots [1, 22, 40], 3D multi-dimensional scalings (MDS) [39, 40], andspace-time cubes [8, 28].Perception of 3D visualizationsThe effectiveness of 3D visualizations has been extensively eval-uated on different display technologies such as 2D (monoscopic)displays [48, 59], stereo-displays [5, 62], stereo-displays with head-tracking [16], data physicalizations [34], and immersive virtual realityenvironments [23,63]. Two surveys [41,42] of studies from different do-mains conclude that 3D stereoscopic displays increase task performanceby 60% on average. For example, understanding relative positions wasfound to be better supported on 2D screens, while shape understand-ing is supported better by respective 3D projections (on 2D screens).Also, 3D visualizations have been found most useful for classificationtasks, and in cases where manipulation (interaction) was required. Onthe other hand, 25% of the reviewed studies found no benefit of 3Dstereoscopic displays over 2D projections and suggest that kinetic depth(i.e., a 3D impression through motion-parallax) is more important forstereoscopic perception [60] than actual stereovision. That means thatmovement, e.g., through rotation of a 3D visualization on a screen, isenough to improve the perception of a 3D model.Interaction with 3D VisualizationsInteraction is required in cases where visualizations become dense andfor tasks requiring a lot of exploration. Interactive exploration for 3Dvisualization can include camera rotation, visual-access lenses [20],the placement of cutting planes [15, 24], as well as selection [65] andbrushing [54]. Due to its higher spatial dimensionality, interaction with3D content may require higher degrees of freedom (DOF) for view andvisualization manipulation (i.e., along the three spatial dimensions andthree spatial angles).
Mid-air gesture interaction [17] and tangible user interfaces(TUIs) [26, 30] are examples that both provide higher DOFs for in-teraction. Furthermore, through sensing the position of one’s limbsthrough interaction (proprioception) these interfaces can provide in-formation about space, positions, and distances [47]. In addition togesture interactions [17], TUIs employ physical objects and allow a1-to-1 mapping of physical interaction devices and virtual objects.
TUIs also allow control of multiple DOF simultaneously [66] andhave been found to be more effective for interaction with 3D contentcompared to touch interaction on a tablet or a mouse [11, 43]. Forexample, Hinckley explored tangible cutting planes that a user couldmove freely in space and whose rotation and position would be propa-gated to the visualization system on a screen [29]. Jackson presenteda tangible interface for querying vectors in 3D vector fields [32] andCordeil et al. [18] list further examples of tangible interfaces for 3Dvisualization. These examples include sophisticated technical devicessuch as dynamic tangible and physical barcharts [57], a Cubic Mousefor pointing tasks in 3D space [27], and Paper Lenses for exploring vol-ume data through a spatially tracked sheet of cardboard and subsequentprojection of virtual content onto the cardboard’s surface [52].
General drawbacks of TUIs are fatigue and the need for extra phys-ical objects [11], as well as the possible lack of coordination [66].Moreover, TUIs coupled with 2D screens do not mean an automaticimprovement in task efficiency. Besancon et al. [11] evaluated the effi-ciency for three interaction modalities on monoscopic screens: mouse,touch, and a tangible device for 3D docking tasks (rotation, translation,scaling of objects) and found that precise and well-known interactionwith a mouse is outperforming TUIs. However, their study did notinclude any 3D visualization-specific exploration tasks.
One general problem of using TUIs in the context of 3D visualizationmay be the relative spatial distance between perceived interaction (i.e.,fingers on the device) and the perceived output (i.e., visualization onthe screen); in other words, the distance between the interaction spaceand the perception space may be too large [25, 49].
Augmented Reality for Interactive VisualizationAugmented reality means the blending of virtual content into the realworld [46] and has been used to couple tangible interfaces with virtualprojections. Tangible AR [12] combines AR displays with tangibleinput modalities, most commonly based on vision-based fiducial markertracking [67]. Fiducial markers are visual patterns, typically printed onpaper, whose 3D position and orientation with respect to a camera areeasily detected and tracked via vision-based techniques (e.g., [4]).
For displaying data in augmented reality, 3D scatterplots [21, 44]and 3D graphs [51] have been implemented using fiducial markersfor visualization placement and pointing. Tangible markers have alsobeen used to simulate specialized tools, e.g., a virtual cutting plane thatallows neurologists to explore 3D representations of the brain [58] andhave been found faster than mouse and touch interaction [31]. Whileallowing for a high DOF and technically direct interaction with virtualcontent, in all these cases the virtual content is shown on the tabletscreen while the interaction happens “behind” the screen, requiringcognitive mapping between interaction and perception [49].
Immersive Environments for Interactive VisualizationImmersion, such as through virtual reality, eventually is able to closethe gap between perception and interaction space. While the sole effectof immersion, i.e., being surrounded by virtual content through a largefield of view, has been both found useful [9, 23] and questioned [43],environments that immerse the user into a virtual world are able to fullyintegrate action and perception space. Immersive environments havebeen used extensively to visualize 3D content, e.g., for 3D networkvisualization [19]. Interaction in virtual reality is often difficult, as realworld objects (e.g., the users’ hands) either need to be shown as video-overlays or re-modeled as completely virtual content [23, 45, 64]. AR,on the other hand, does not suffer from the missing visual feedback.
Headmounted displays for AR, such as the Microsoft HoloLens [2]or Meta [3], combine the best of both worlds: immersive stereoscopyas in VR and access to the real world, including desktop computers,
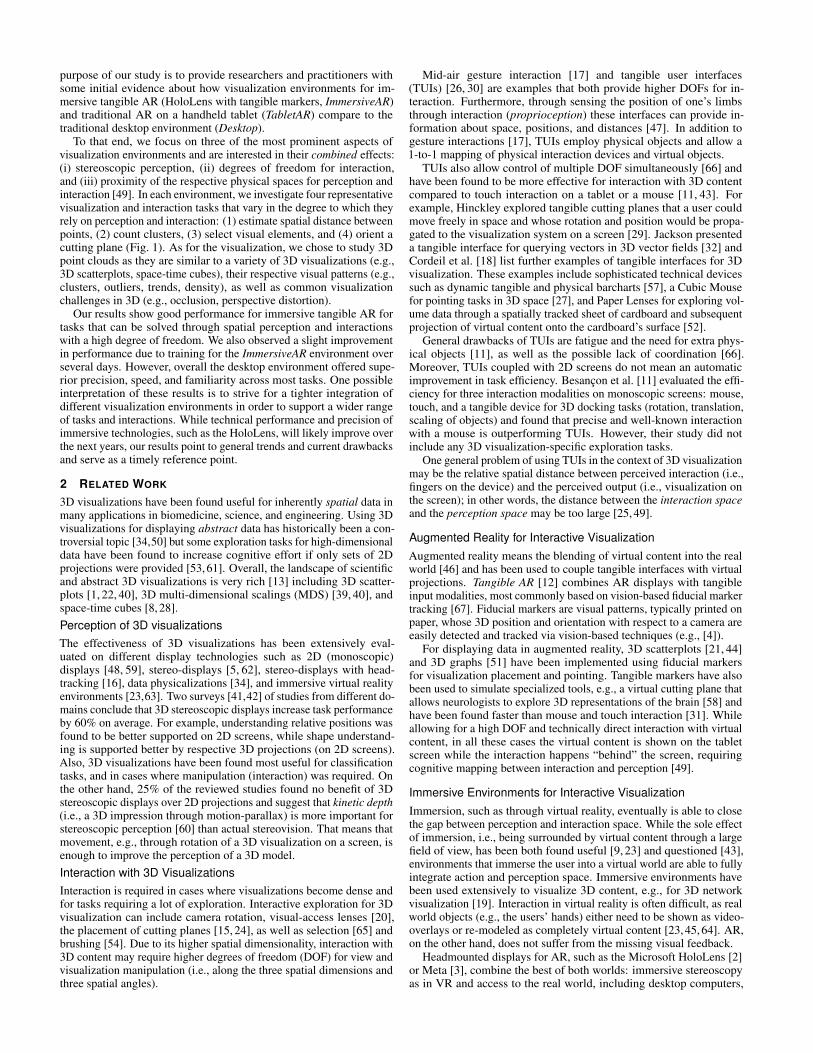
PerceptionStereoscopy
ProximitySpatial Proximity
InteractionDegrees-of-freedom
high
low
HoloLens +tangible markers
AR Tablet +tangible markers
Standard desktop
Fig. 2. Classification of the three visualization environments used in ourstudy for perception, interaction, and proximity.
mobile devices, pen and paper, collaborators, large displays, and dataphysicalizations. The concept has been described as immersive AR [55]or—if used with tangible markers—tangible AR [12]. Belcher et al. [10]reported that stereoscopic AR is in fact more accurate but slower thana monoscopic display condition. Other than rotation, no interactioncapabilities were tested in that study.
To the best of our knowledge, no study has directly investigated thecombined effects of immersive tangible AR, i.e., immersive augmentedreality displays coupled with tangible markers, for interactive 3D vi-sualization. Many conditions have been tested individually in order toisolate the respective effects (e.g., mono vs. stereo displays, mouse vs.TUI). However, each combination of display and interaction techniquecreates a unique visualization environment and specific combinationsof factors may perform better than others, independent of the respectivefactors in isolation. Our evaluation study aims to address this gap.
3 STUDY RATIONALE
We are interested in the benefits of an immersed tangible experiencewith 3D visualizations which promise to better match how humansperceive and interact with the real world. To that end we compare theHoloLens with tangible input (immersive tangible AR) to other visual-ization environments. While there are many conceptual and technicaldifferences across visualization environments (e.g., resolution, field-of-view/screen size, physicality), we focus on the following three mainaspects: 3D perception (perception), high-degrees-of-freedom for tan-gible interaction (interaction), and the spatial proximity of perceptionand interaction (embodiment). These aspects represent characteristicsthat we consider to have a major influence on task performance for 3Dvisualization. Figure 2 shows each aspect as a dimension ranging fromlow to high and locates the respective visualization environments thatwe tested: traditional desktop, and tangible AR with HoloLens andtablet.
Stereoscopy (perception): The HoloLens enables a stable percep-tion of a stereoscopic image. Users can freely move the hologram ormove themselves around the hologram. Hence the ability to perceive3D content is higher than with a desktop environment or tablet whichprovide only a flat screen without a stereoscopic image.
Degrees-of-freedom (interaction): The HoloLens allows the track-ing of position and orientation of tangible fiducial markers, similar toAR on a tablet or mobile phone. This allows markers to become tangi-ble tools and enables a high degree of freedom for interaction comparedto a desktop environment equipped with mouse and keyboard.
Proximity (embodiment): Proximity means the extent to whichinteraction movements and interaction effects (rotation, movement,selection, etc.) are colocated and coordinated visually and in space [18].The HoloLens allows users to “touch” the data by reaching with theirhand inside the hologram. Given the right tracking technology, thisallows direct manipulation of the hologram. In order to perform thesame manipulations in a desktop environment, the user is constrained tomouse movement in two directions, while coordinating the movementof the mouse cursor on the screen with the movement of the handapproximately half a meter away from the screen.
Low and high values along each of these dimensions are highlyapproximative and do not imply lower or higher human task perfor-mance. However, the placement of an environment helps us formulatehypotheses about its suitability for a specific 3D visualization task andits expected performance. Moreover, we can describe additional visu-alization environments or their variations for a structured evaluation.
Factor Desktop TabletAR ImmersiveARPerception
Stereoscopic × × XScreen Size 10.8” 10.8” approx. 11”Resolution 1268×720 1268×720 1268×720
Immersiveness low medium highInteraction
Body movement × X XVis. movement X X X
Tangibility × X XDOF 2 2+6 6
ProximityInteraction Space 2D 2D+3D 3DPerception Space 2D 2D 3DSpatial Proximity far medium identity
SubjectiveFamiliarity high medium low
Physical Effort low medium high
Table 1. Environment configurations as used in the study.
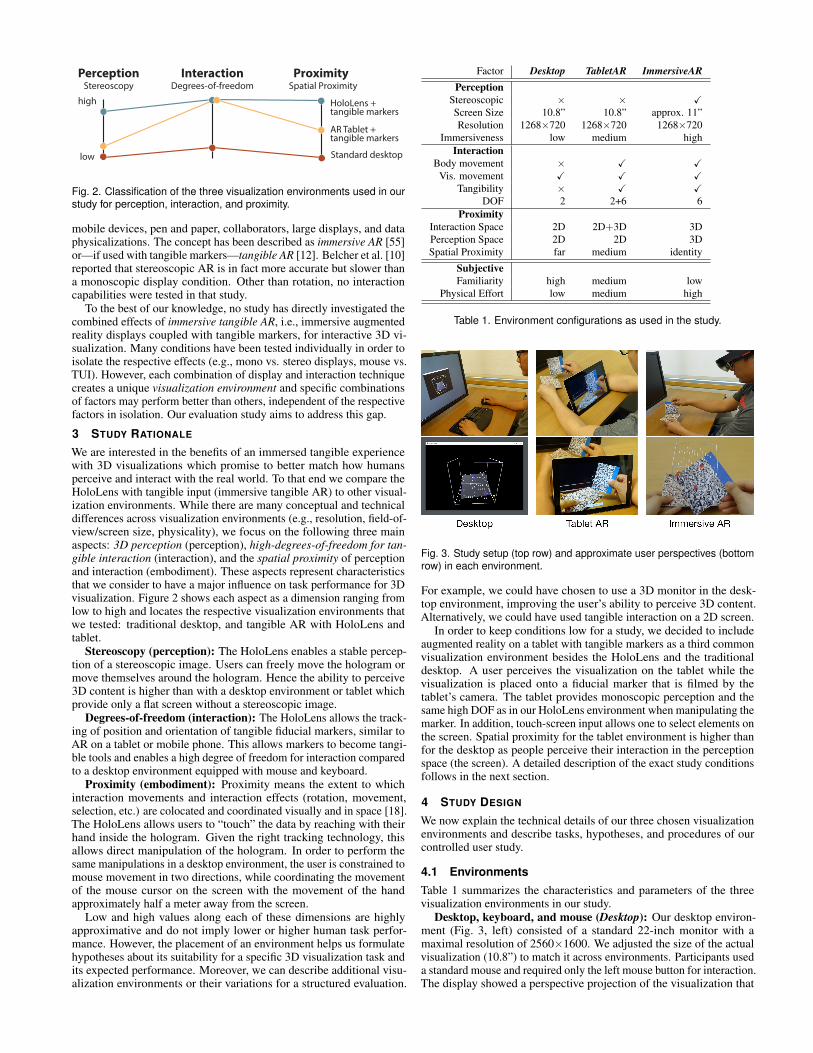
Fig. 3. Study setup (top row) and approximate user perspectives (bottomrow) in each environment.
For example, we could have chosen to use a 3D monitor in the desk-top environment, improving the user’s ability to perceive 3D content.Alternatively, we could have used tangible interaction on a 2D screen.
In order to keep conditions low for a study, we decided to includeaugmented reality on a tablet with tangible markers as a third commonvisualization environment besides the HoloLens and the traditionaldesktop. A user perceives the visualization on the tablet while thevisualization is placed onto a fiducial marker that is filmed by thetablet’s camera. The tablet provides monoscopic perception and thesame high DOF as in our HoloLens environment when manipulating themarker. In addition, touch-screen input allows one to select elements onthe screen. Spatial proximity for the tablet environment is higher thanfor the desktop as people perceive their interaction in the perceptionspace (the screen). A detailed description of the exact study conditionsfollows in the next section.
4 STUDY DESIGN
We now explain the technical details of our three chosen visualizationenvironments and describe tasks, hypotheses, and procedures of ourcontrolled user study.
4.1 EnvironmentsTable 1 summarizes the characteristics and parameters of the threevisualization environments in our study.
Desktop, keyboard, and mouse (Desktop): Our desktop environ-ment (Fig. 3, left) consisted of a standard 22-inch monitor with amaximal resolution of 2560×1600. We adjusted the size of the actualvisualization (10.8”) to match it across environments. Participants useda standard mouse and required only the left mouse button for interaction.The display showed a perspective projection of the visualization that
could be rotated by dragging the mouse. We describe task-dependentmouse interactions in Sect. 4.3. Participants sat at a normal desk underthe same lighting conditions as in the other conditions.
Tablet and markers (TabletAR): This environment (Fig. 3, cen-ter) featured a handheld tablet (Microsoft Surface 3) with a maximalresolution of 1920×1280 and a 10.8” 2D display. The tablet displayshowed the real-time video stream of the 8-Megapixel rear camera,filming a 9cm × 9cm cardboard with fiducial markers, used to ren-der the visualization. Moving and rotating the cardboard propagatedthese interactions to the visualization. Markers were tracked using theVuforia toolkit [4] and their recommended marker patterns. For othertask-dependent interactions, e.g., element selection or cutting planeposition, participants used special markers glued onto cardboard andrepresenting tangible interaction tools (Sect. 4.3). In this setup, thevisualization, user’s hands, and tools, appeared to be behind the tablet.The built-in stand of the tablet allowed for bi-manual manipulation ofthe interaction tools.
Participants were seated at a table but were free to stand up andmove if they preferred. We decided against requiring participants tostrictly stay seated during the study and instead recorded the preferreduser strategies (sitting, standing, moving around, etc.) for each task.
HoloLens and markers (ImmersiveAR): This environment (Fig. 3,right) consisted of Microsoft’s HoloLens for binocular display of thevisualization and the same tangible marker tools as in the TabletARenvironment. For triggering and menu interaction, participants usedthe HoloLens clicker, which they held comfortably in their dominanthand together with the interaction tool. The clicker has a flexiblestrap so that it can be worn on any finger, allowing participants togrip and hold other tools. The HoloLens shows the content on twohigh-definition (1268×720) see-through displays and weighs about579 grams, according to Microsoft’s website. It is equipped withinertial measurement units, tracking cameras, stereo microphones, andone HD color camera on the front that we used for marker tracking.The HoloLens continuously tracks its environment and updating theenvironmental mesh. This helps in keeping holograms extremelystable in place and allowed participants to walk around the holograms.Similar to the TabletAR condition, users could sit at a table or stand upand lock the hologram anywhere in mid-air in the room.
Across all environments we controlled for the actual size and res-olution of the visualization. On the desktop the application windowwas set to have the same size (10.8 inches) as the tablet and all envi-ronments showed the visualization in the same resolution (1268×720).The field-of-view of the HoloLens appears relatively small but resultsin approximately the same diagonal size as the tablet at the distance ofa comfortable arm length from the hologram. Its display resolution wasthe same as the TabletAR and Desktop.
Marker images (e.g., see Fig 3 middle and right) were recommendedby the Vuforia toolkit and taken from Vuforia’s website. We tried differ-ent and less complex images but tracking performance was significantlyreduced. Unfortunately, the 2D figures in this paper do not representthe proper conditions as seen in stereovision, in which we did not findthe marker images to reduce perception of the hologram.
4.2 MeasuresFor all trials we recorded task completion time (time) and error (error).The timer started when the visualization had finished loading for eachtrial and stopped as soon as the participant hit one of the trigger keys(space-bar (Desktop), answer-button (TabletAR), or clicker (Immer-siveAR)). Participants were instructed to press the trigger key as soonas they knew the answer, stopping the task timer. After selecting theanswer from a menu, the menu disappeared, then the next visualizationappeared and the timer restarted.
4.3 Tasks and DataWe selected a set of four tasks representative of the exploration of 3Dvisualizations and balancing how much stereoscopic perception anddirect interaction was required. To keep the number of conditions andthe effort for learning low, we decided on a single and representative
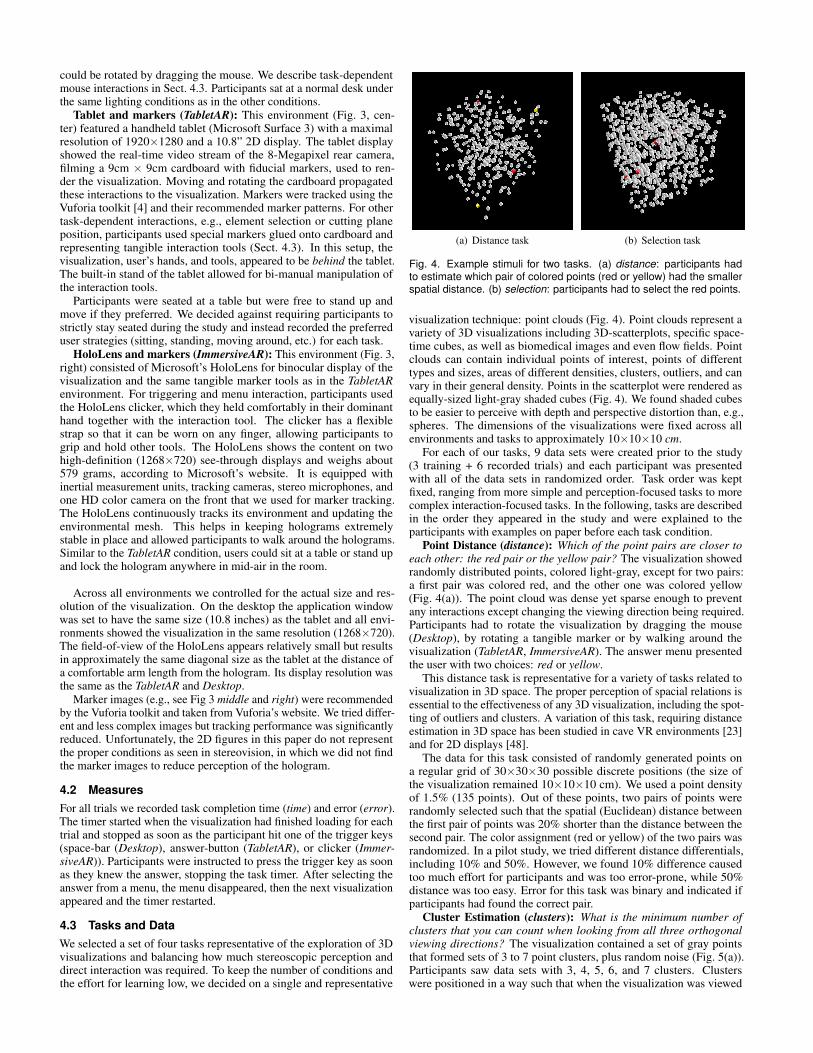
(a) Distance task (b) Selection task
Fig. 4. Example stimuli for two tasks. (a) distance: participants hadto estimate which pair of colored points (red or yellow) had the smallerspatial distance. (b) selection: participants had to select the red points.
visualization technique: point clouds (Fig. 4). Point clouds represent avariety of 3D visualizations including 3D-scatterplots, specific space-time cubes, as well as biomedical images and even flow fields. Pointclouds can contain individual points of interest, points of differenttypes and sizes, areas of different densities, clusters, outliers, and canvary in their general density. Points in the scatterplot were rendered asequally-sized light-gray shaded cubes (Fig. 4). We found shaded cubesto be easier to perceive with depth and perspective distortion than, e.g.,spheres. The dimensions of the visualizations were fixed across allenvironments and tasks to approximately 10×10×10 cm.
For each of our tasks, 9 data sets were created prior to the study(3 training + 6 recorded trials) and each participant was presentedwith all of the data sets in randomized order. Task order was keptfixed, ranging from more simple and perception-focused tasks to morecomplex interaction-focused tasks. In the following, tasks are describedin the order they appeared in the study and were explained to theparticipants with examples on paper before each task condition.
Point Distance (distance): Which of the point pairs are closer toeach other: the red pair or the yellow pair? The visualization showedrandomly distributed points, colored light-gray, except for two pairs:a first pair was colored red, and the other one was colored yellow(Fig. 4(a)). The point cloud was dense yet sparse enough to preventany interactions except changing the viewing direction being required.Participants had to rotate the visualization by dragging the mouse(Desktop), by rotating a tangible marker or by walking around thevisualization (TabletAR, ImmersiveAR). The answer menu presentedthe user with two choices: red or yellow.
This distance task is representative for a variety of tasks related tovisualization in 3D space. The proper perception of spacial relations isessential to the effectiveness of any 3D visualization, including the spot-ting of outliers and clusters. A variation of this task, requiring distanceestimation in 3D space has been studied in cave VR environments [23]and for 2D displays [48].
The data for this task consisted of randomly generated points ona regular grid of 30×30×30 possible discrete positions (the size ofthe visualization remained 10×10×10 cm). We used a point densityof 1.5% (135 points). Out of these points, two pairs of points wererandomly selected such that the spatial (Euclidean) distance betweenthe first pair of points was 20% shorter than the distance between thesecond pair. The color assignment (red or yellow) of the two pairs wasrandomized. In a pilot study, we tried different distance differentials,including 10% and 50%. However, we found 10% difference causedtoo much effort for participants and was too error-prone, while 50%distance was too easy. Error for this task was binary and indicated ifparticipants had found the correct pair.
Cluster Estimation (clusters): What is the minimum number ofclusters that you can count when looking from all three orthogonalviewing directions? The visualization contained a set of gray pointsthat formed sets of 3 to 7 point clusters, plus random noise (Fig. 5(a)).Participants saw data sets with 3, 4, 5, 6, and 7 clusters. Clusterswere positioned in a way such that when the visualization was viewed
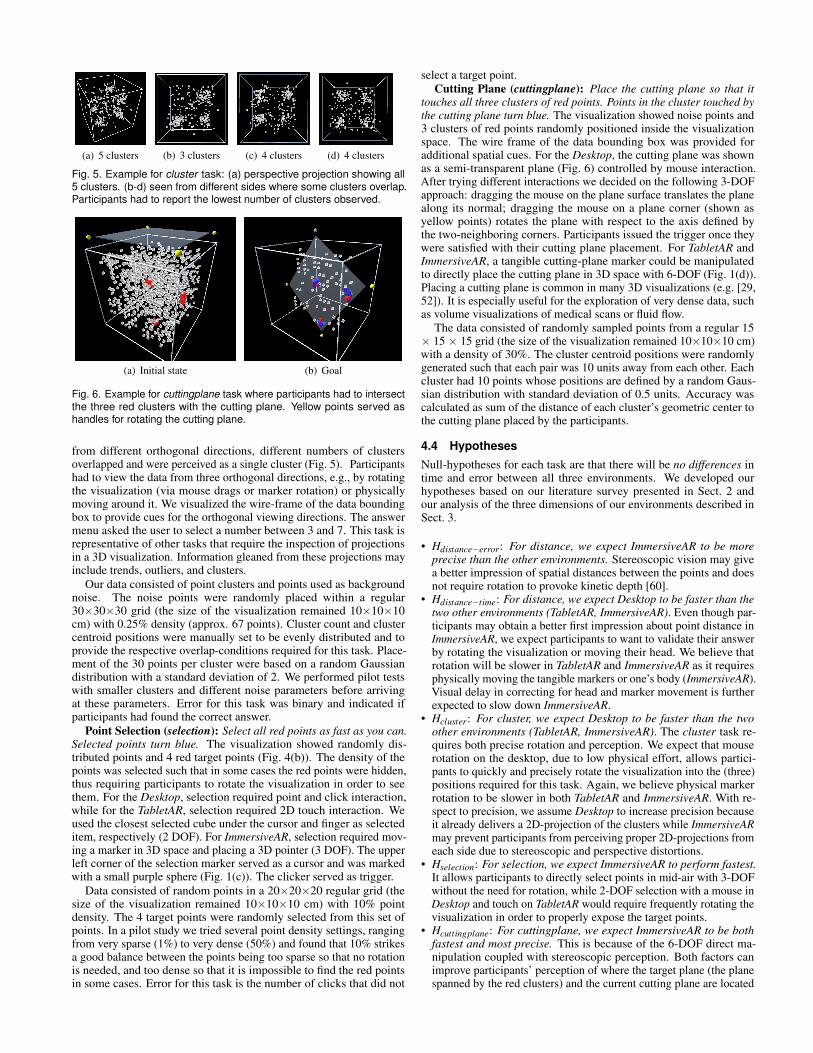
(a) 5 clusters (b) 3 clusters (c) 4 clusters (d) 4 clusters
Fig. 5. Example for cluster task: (a) perspective projection showing all5 clusters. (b-d) seen from different sides where some clusters overlap.Participants had to report the lowest number of clusters observed.
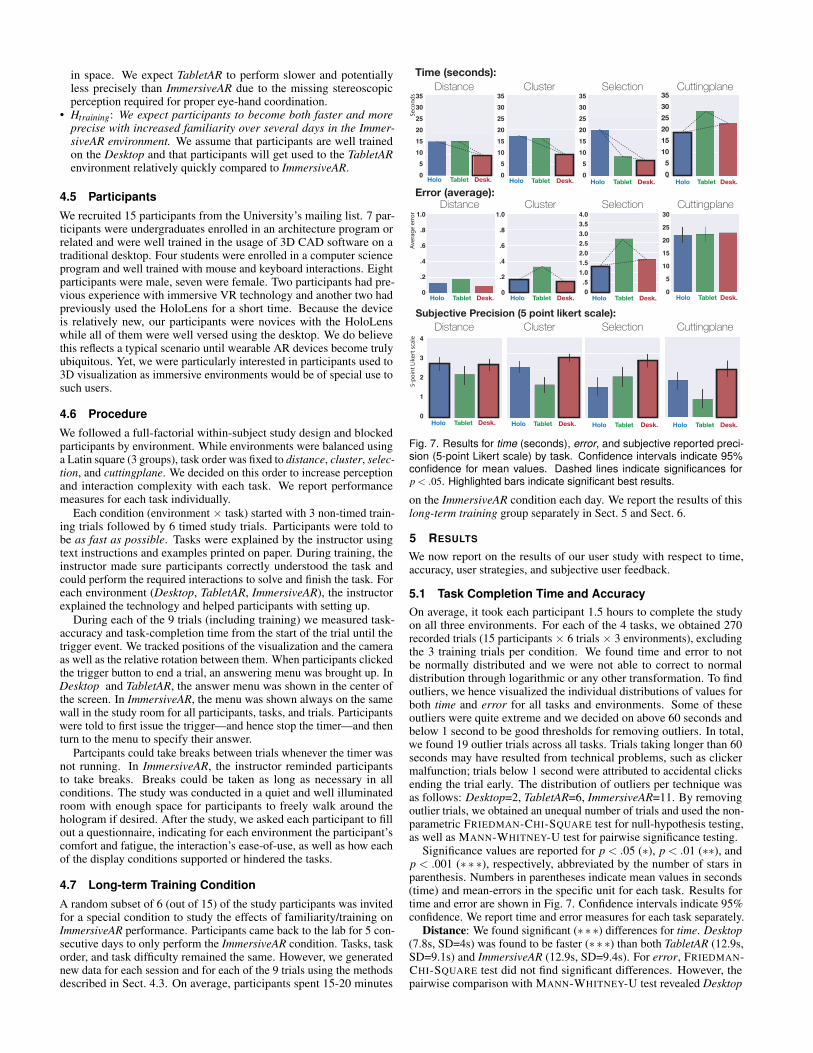
(a) Initial state (b) Goal
Fig. 6. Example for cuttingplane task where participants had to intersectthe three red clusters with the cutting plane. Yellow points served ashandles for rotating the cutting plane.
from different orthogonal directions, different numbers of clustersoverlapped and were perceived as a single cluster (Fig. 5). Participantshad to view the data from three orthogonal directions, e.g., by rotatingthe visualization (via mouse drags or marker rotation) or physicallymoving around it. We visualized the wire-frame of the data boundingbox to provide cues for the orthogonal viewing directions. The answermenu asked the user to select a number between 3 and 7. This task isrepresentative of other tasks that require the inspection of projectionsin a 3D visualization. Information gleaned from these projections mayinclude trends, outliers, and clusters.
Our data consisted of point clusters and points used as backgroundnoise. The noise points were randomly placed within a regular30×30×30 grid (the size of the visualization remained 10×10×10cm) with 0.25% density (approx. 67 points). Cluster count and clustercentroid positions were manually set to be evenly distributed and toprovide the respective overlap-conditions required for this task. Place-ment of the 30 points per cluster were based on a random Gaussiandistribution with a standard deviation of 2. We performed pilot testswith smaller clusters and different noise parameters before arrivingat these parameters. Error for this task was binary and indicated ifparticipants had found the correct answer.
Point Selection (selection): Select all red points as fast as you can.Selected points turn blue. The visualization showed randomly dis-tributed points and 4 red target points (Fig. 4(b)). The density of thepoints was selected such that in some cases the red points were hidden,thus requiring participants to rotate the visualization in order to seethem. For the Desktop, selection required point and click interaction,while for the TabletAR, selection required 2D touch interaction. Weused the closest selected cube under the cursor and finger as selecteditem, respectively (2 DOF). For ImmersiveAR, selection required mov-ing a marker in 3D space and placing a 3D pointer (3 DOF). The upperleft corner of the selection marker served as a cursor and was markedwith a small purple sphere (Fig. 1(c)). The clicker served as trigger.
Data consisted of random points in a 20×20×20 regular grid (thesize of the visualization remained 10×10×10 cm) with 10% pointdensity. The 4 target points were randomly selected from this set ofpoints. In a pilot study we tried several point density settings, rangingfrom very sparse (1%) to very dense (50%) and found that 10% strikesa good balance between the points being too sparse so that no rotationis needed, and too dense so that it is impossible to find the red pointsin some cases. Error for this task is the number of clicks that did not
select a target point.Cutting Plane (cuttingplane): Place the cutting plane so that it
touches all three clusters of red points. Points in the cluster touched bythe cutting plane turn blue. The visualization showed noise points and3 clusters of red points randomly positioned inside the visualizationspace. The wire frame of the data bounding box was provided foradditional spatial cues. For the Desktop, the cutting plane was shownas a semi-transparent plane (Fig. 6) controlled by mouse interaction.After trying different interactions we decided on the following 3-DOFapproach: dragging the mouse on the plane surface translates the planealong its normal; dragging the mouse on a plane corner (shown asyellow points) rotates the plane with respect to the axis defined bythe two-neighboring corners. Participants issued the trigger once theywere satisfied with their cutting plane placement. For TabletAR andImmersiveAR, a tangible cutting-plane marker could be manipulatedto directly place the cutting plane in 3D space with 6-DOF (Fig. 1(d)).Placing a cutting plane is common in many 3D visualizations (e.g. [29,52]). It is especially useful for the exploration of very dense data, suchas volume visualizations of medical scans or fluid flow.
The data consisted of randomly sampled points from a regular 15× 15 × 15 grid (the size of the visualization remained 10×10×10 cm)with a density of 30%. The cluster centroid positions were randomlygenerated such that each pair was 10 units away from each other. Eachcluster had 10 points whose positions are defined by a random Gaus-sian distribution with standard deviation of 0.5 units. Accuracy wascalculated as sum of the distance of each cluster’s geometric center tothe cutting plane placed by the participants.
4.4 HypothesesNull-hypotheses for each task are that there will be no differences intime and error between all three environments. We developed ourhypotheses based on our literature survey presented in Sect. 2 andour analysis of the three dimensions of our environments described inSect. 3.
• Hdistance−error: For distance, we expect ImmersiveAR to be moreprecise than the other environments. Stereoscopic vision may givea better impression of spatial distances between the points and doesnot require rotation to provoke kinetic depth [60].
• Hdistance−time: For distance, we expect Desktop to be faster than thetwo other environments (TabletAR, ImmersiveAR). Even though par-ticipants may obtain a better first impression about point distance inImmersiveAR, we expect participants to want to validate their answerby rotating the visualization or moving their head. We believe thatrotation will be slower in TabletAR and ImmersiveAR as it requiresphysically moving the tangible markers or one’s body (ImmersiveAR).Visual delay in correcting for head and marker movement is furtherexpected to slow down ImmersiveAR.
• Hcluster: For cluster, we expect Desktop to be faster than the twoother environments (TabletAR, ImmersiveAR). The cluster task re-quires both precise rotation and perception. We expect that mouserotation on the desktop, due to low physical effort, allows partici-pants to quickly and precisely rotate the visualization into the (three)positions required for this task. Again, we believe physical markerrotation to be slower in both TabletAR and ImmersiveAR. With re-spect to precision, we assume Desktop to increase precision becauseit already delivers a 2D-projection of the clusters while ImmersiveARmay prevent participants from perceiving proper 2D-projections fromeach side due to stereoscopic and perspective distortions.
• Hselection: For selection, we expect ImmersiveAR to perform fastest.It allows participants to directly select points in mid-air with 3-DOFwithout the need for rotation, while 2-DOF selection with a mouse inDesktop and touch on TabletAR would require frequently rotating thevisualization in order to properly expose the target points.
• Hcuttingplane: For cuttingplane, we expect ImmersiveAR to be bothfastest and most precise. This is because of the 6-DOF direct ma-nipulation coupled with stereoscopic perception. Both factors canimprove participants’ perception of where the target plane (the planespanned by the red clusters) and the current cutting plane are located
in space. We expect TabletAR to perform slower and potentiallyless precisely than ImmersiveAR due to the missing stereoscopicperception required for proper eye-hand coordination.
• Htraining: We expect participants to become both faster and moreprecise with increased familiarity over several days in the Immer-siveAR environment. We assume that participants are well trainedon the Desktop and that participants will get used to the TabletARenvironment relatively quickly compared to ImmersiveAR.
4.5 Participants
We recruited 15 participants from the University’s mailing list. 7 par-ticipants were undergraduates enrolled in an architecture program orrelated and were well trained in the usage of 3D CAD software on atraditional desktop. Four students were enrolled in a computer scienceprogram and well trained with mouse and keyboard interactions. Eightparticipants were male, seven were female. Two participants had pre-vious experience with immersive VR technology and another two hadpreviously used the HoloLens for a short time. Because the deviceis relatively new, our participants were novices with the HoloLenswhile all of them were well versed using the desktop. We do believethis reflects a typical scenario until wearable AR devices become trulyubiquitous. Yet, we were particularly interested in participants used to3D visualization as immersive environments would be of special use tosuch users.
4.6 Procedure
We followed a full-factorial within-subject study design and blockedparticipants by environment. While environments were balanced usinga Latin square (3 groups), task order was fixed to distance, cluster, selec-tion, and cuttingplane. We decided on this order to increase perceptionand interaction complexity with each task. We report performancemeasures for each task individually.
Each condition (environment × task) started with 3 non-timed train-ing trials followed by 6 timed study trials. Participants were told tobe as fast as possible. Tasks were explained by the instructor usingtext instructions and examples printed on paper. During training, theinstructor made sure participants correctly understood the task andcould perform the required interactions to solve and finish the task. Foreach environment (Desktop, TabletAR, ImmersiveAR), the instructorexplained the technology and helped participants with setting up.
During each of the 9 trials (including training) we measured task-accuracy and task-completion time from the start of the trial until thetrigger event. We tracked positions of the visualization and the cameraas well as the relative rotation between them. When participants clickedthe trigger button to end a trial, an answering menu was brought up. InDesktop and TabletAR, the answer menu was shown in the center ofthe screen. In ImmersiveAR, the menu was shown always on the samewall in the study room for all participants, tasks, and trials. Participantswere told to first issue the trigger—and hence stop the timer—and thenturn to the menu to specify their answer.
Partcipants could take breaks between trials whenever the timer wasnot running. In ImmersiveAR, the instructor reminded participantsto take breaks. Breaks could be taken as long as necessary in allconditions. The study was conducted in a quiet and well illuminatedroom with enough space for participants to freely walk around thehologram if desired. After the study, we asked each participant to fillout a questionnaire, indicating for each environment the participant’scomfort and fatigue, the interaction’s ease-of-use, as well as how eachof the display conditions supported or hindered the tasks.
4.7 Long-term Training Condition
A random subset of 6 (out of 15) of the study participants was invitedfor a special condition to study the effects of familiarity/training onImmersiveAR performance. Participants came back to the lab for 5 con-secutive days to only perform the ImmersiveAR condition. Tasks, taskorder, and task difficulty remained the same. However, we generatednew data for each session and for each of the 9 trials using the methodsdescribed in Sect. 4.3. On average, participants spent 15-20 minutes
4
3
2
1
0Holo Tablet Desk.Holo Tablet Desk. Holo Tablet Desk. Holo Tablet Desk.
Distance Cluster Selection Cuttingplane
353025201510
50
1.0
.8
.6
.4
.2
0
4.03.53.02.52.01.51.0
.50
30
25
20
15
10
5
0
1.0
.8
.6
.4
.2
0
Time (seconds):
Error (average):Distance Cluster Selection Cuttingplane
Holo Tablet Desk.Holo Tablet Desk. Holo Tablet Desk. Holo Tablet Desk.
Distance Cluster Selection Cuttingplane
Holo Tablet Desk.Holo Tablet Desk. Holo Tablet Desk. Holo Tablet Desk.
353025201510
50
353025201510
50
353025201510
50
Subjective Precision (5 point likert scale):
35302520151050
5-po
int L
iker
t sca
leAv
erag
e er
ror
Seco
nds
Fig. 7. Results for time (seconds), error, and subjective reported preci-sion (5-point Likert scale) by task. Confidence intervals indicate 95%confidence for mean values. Dashed lines indicate significances forp < .05. Highlighted bars indicate significant best results.
on the ImmersiveAR condition each day. We report the results of thislong-term training group separately in Sect. 5 and Sect. 6.
5 RESULTS
We now report on the results of our user study with respect to time,accuracy, user strategies, and subjective user feedback.
5.1 Task Completion Time and AccuracyOn average, it took each participant 1.5 hours to complete the studyon all three environments. For each of the 4 tasks, we obtained 270recorded trials (15 participants × 6 trials × 3 environments), excludingthe 3 training trials per condition. We found time and error to notbe normally distributed and we were not able to correct to normaldistribution through logarithmic or any other transformation. To findoutliers, we hence visualized the individual distributions of values forboth time and error for all tasks and environments. Some of theseoutliers were quite extreme and we decided on above 60 seconds andbelow 1 second to be good thresholds for removing outliers. In total,we found 19 outlier trials across all tasks. Trials taking longer than 60seconds may have resulted from technical problems, such as clickermalfunction; trials below 1 second were attributed to accidental clicksending the trial early. The distribution of outliers per technique wasas follows: Desktop=2, TabletAR=6, ImmersiveAR=11. By removingoutlier trials, we obtained an unequal number of trials and used the non-parametric FRIEDMAN-CHI-SQUARE test for null-hypothesis testing,as well as MANN-WHITNEY-U test for pairwise significance testing.
Significance values are reported for p < .05 (∗), p < .01 (∗∗), andp < .001 (∗ ∗ ∗), respectively, abbreviated by the number of stars inparenthesis. Numbers in parentheses indicate mean values in seconds(time) and mean-errors in the specific unit for each task. Results fortime and error are shown in Fig. 7. Confidence intervals indicate 95%confidence. We report time and error measures for each task separately.
Distance: We found significant (∗∗∗) differences for time. Desktop(7.8s, SD=4s) was found to be faster (∗∗∗) than both TabletAR (12.9s,SD=9.1s) and ImmersiveAR (12.9s, SD=9.4s). For error, FRIEDMAN-CHI-SQUARE test did not find significant differences. However, thepairwise comparison with MANN-WHITNEY-U test revealed Desktop
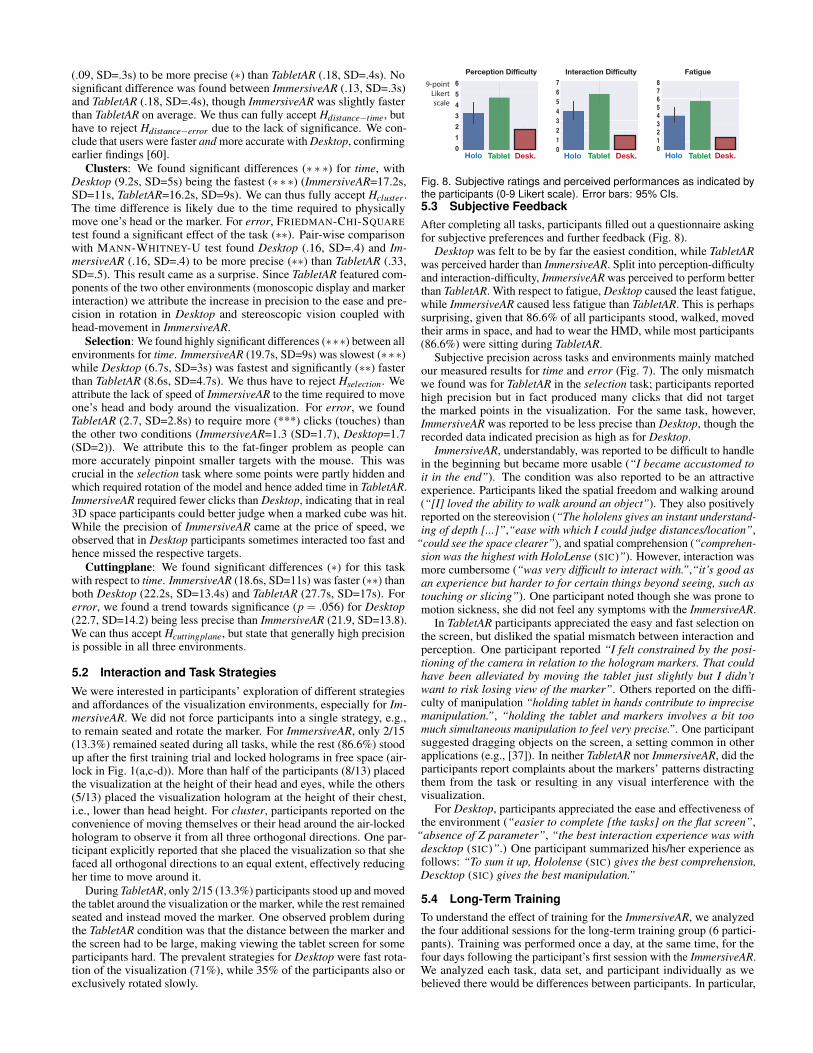
(.09, SD=.3s) to be more precise (∗) than TabletAR (.18, SD=.4s). Nosignificant difference was found between ImmersiveAR (.13, SD=.3s)and TabletAR (.18, SD=.4s), though ImmersiveAR was slightly fasterthan TabletAR on average. We thus can fully accept Hdistance−time, buthave to reject Hdistance−error due to the lack of significance. We con-clude that users were faster and more accurate with Desktop, confirmingearlier findings [60].
Clusters: We found significant differences (∗ ∗ ∗) for time, withDesktop (9.2s, SD=5s) being the fastest (∗∗∗) (ImmersiveAR=17.2s,SD=11s, TabletAR=16.2s, SD=9s). We can thus fully accept Hcluster.The time difference is likely due to the time required to physicallymove one’s head or the marker. For error, FRIEDMAN-CHI-SQUAREtest found a significant effect of the task (∗∗). Pair-wise comparisonwith MANN-WHITNEY-U test found Desktop (.16, SD=.4) and Im-mersiveAR (.16, SD=.4) to be more precise (∗∗) than TabletAR (.33,SD=.5). This result came as a surprise. Since TabletAR featured com-ponents of the two other environments (monoscopic display and markerinteraction) we attribute the increase in precision to the ease and pre-cision in rotation in Desktop and stereoscopic vision coupled withhead-movement in ImmersiveAR.
Selection: We found highly significant differences (∗∗∗) between allenvironments for time. ImmersiveAR (19.7s, SD=9s) was slowest (∗∗∗)while Desktop (6.7s, SD=3s) was fastest and significantly (∗∗) fasterthan TabletAR (8.6s, SD=4.7s). We thus have to reject Hselection. Weattribute the lack of speed of ImmersiveAR to the time required to moveone’s head and body around the visualization. For error, we foundTabletAR (2.7, SD=2.8s) to require more (***) clicks (touches) thanthe other two conditions (ImmersiveAR=1.3 (SD=1.7), Desktop=1.7(SD=2)). We attribute this to the fat-finger problem as people canmore accurately pinpoint smaller targets with the mouse. This wascrucial in the selection task where some points were partly hidden andwhich required rotation of the model and hence added time in TabletAR.ImmersiveAR required fewer clicks than Desktop, indicating that in real3D space participants could better judge when a marked cube was hit.While the precision of ImmersiveAR came at the price of speed, weobserved that in Desktop participants sometimes interacted too fast andhence missed the respective targets.
Cuttingplane: We found significant differences (∗) for this taskwith respect to time. ImmersiveAR (18.6s, SD=11s) was faster (∗∗) thanboth Desktop (22.2s, SD=13.4s) and TabletAR (27.7s, SD=17s). Forerror, we found a trend towards significance (p = .056) for Desktop(22.7, SD=14.2) being less precise than ImmersiveAR (21.9, SD=13.8).We can thus accept Hcuttingplane, but state that generally high precisionis possible in all three environments.
5.2 Interaction and Task StrategiesWe were interested in participants’ exploration of different strategiesand affordances of the visualization environments, especially for Im-mersiveAR. We did not force participants into a single strategy, e.g.,to remain seated and rotate the marker. For ImmersiveAR, only 2/15(13.3%) remained seated during all tasks, while the rest (86.6%) stoodup after the first training trial and locked holograms in free space (air-lock in Fig. 1(a,c-d)). More than half of the participants (8/13) placedthe visualization at the height of their head and eyes, while the others(5/13) placed the visualization hologram at the height of their chest,i.e., lower than head height. For cluster, participants reported on theconvenience of moving themselves or their head around the air-lockedhologram to observe it from all three orthogonal directions. One par-ticipant explicitly reported that she placed the visualization so that shefaced all orthogonal directions to an equal extent, effectively reducingher time to move around it.
During TabletAR, only 2/15 (13.3%) participants stood up and movedthe tablet around the visualization or the marker, while the rest remainedseated and instead moved the marker. One observed problem duringthe TabletAR condition was that the distance between the marker andthe screen had to be large, making viewing the tablet screen for someparticipants hard. The prevalent strategies for Desktop were fast rota-tion of the visualization (71%), while 35% of the participants also orexclusively rotated slowly.
Perception Difficulty Interaction Difficulty Fatigue
Holo Tablet Desk.Holo Tablet Desk. Holo Tablet Desk.
876543210
76543210
6543210
9-point Likert scale
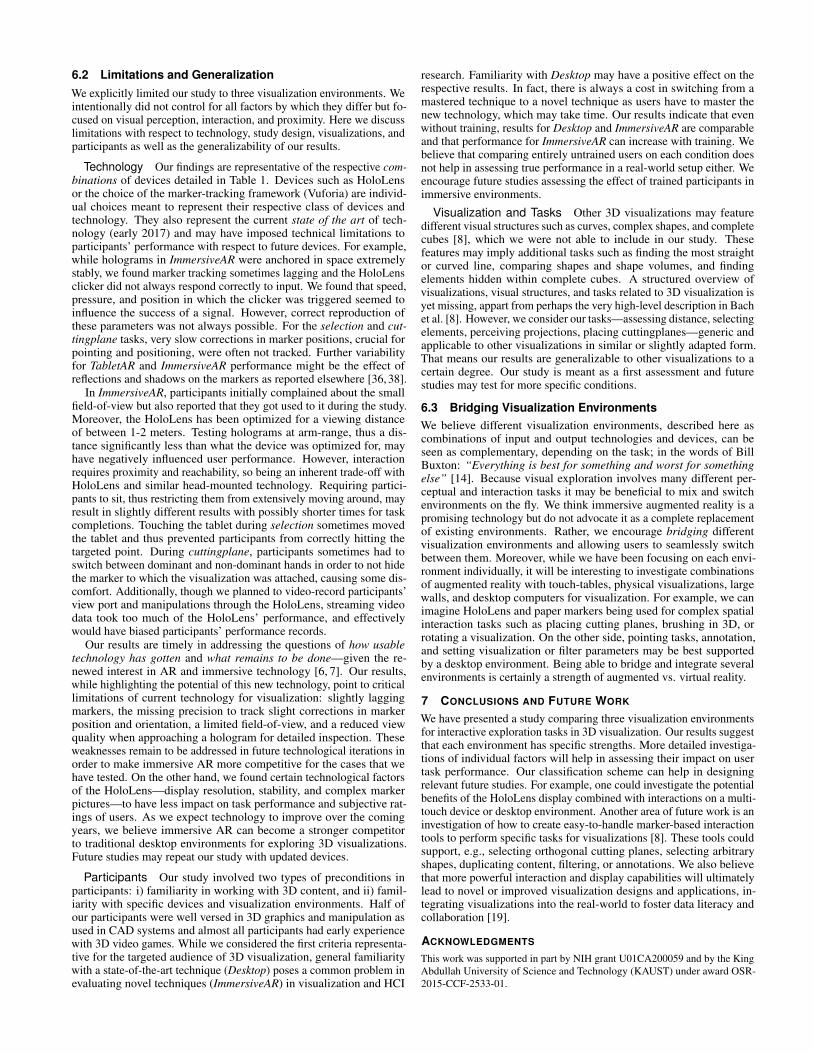
Fig. 8. Subjective ratings and perceived performances as indicated bythe participants (0-9 Likert scale). Error bars: 95% CIs.5.3 Subjective FeedbackAfter completing all tasks, participants filled out a questionnaire askingfor subjective preferences and further feedback (Fig. 8).
Desktop was felt to be by far the easiest condition, while TabletARwas perceived harder than ImmersiveAR. Split into perception-difficultyand interaction-difficulty, ImmersiveAR was perceived to perform betterthan TabletAR. With respect to fatigue, Desktop caused the least fatigue,while ImmersiveAR caused less fatigue than TabletAR. This is perhapssurprising, given that 86.6% of all participants stood, walked, movedtheir arms in space, and had to wear the HMD, while most participants(86.6%) were sitting during TabletAR.
Subjective precision across tasks and environments mainly matchedour measured results for time and error (Fig. 7). The only mismatchwe found was for TabletAR in the selection task; participants reportedhigh precision but in fact produced many clicks that did not targetthe marked points in the visualization. For the same task, however,ImmersiveAR was reported to be less precise than Desktop, though therecorded data indicated precision as high as for Desktop.
ImmersiveAR, understandably, was reported to be difficult to handlein the beginning but became more usable (“I became accustomed toit in the end”). The condition was also reported to be an attractiveexperience. Participants liked the spatial freedom and walking around(“[I] loved the ability to walk around an object”). They also positivelyreported on the stereovision (“The hololens gives an instant understand-ing of depth [...]”,“ease with which I could judge distances/location”,
“could see the space clearer”), and spatial comprehension (“comprehen-sion was the highest with HoloLense (SIC)”). However, interaction wasmore cumbersome (“was very difficult to interact with.”,“it’s good asan experience but harder to for certain things beyond seeing, such astouching or slicing”). One participant noted though she was prone tomotion sickness, she did not feel any symptoms with the ImmersiveAR.
In TabletAR participants appreciated the easy and fast selection onthe screen, but disliked the spatial mismatch between interaction andperception. One participant reported “I felt constrained by the posi-tioning of the camera in relation to the hologram markers. That couldhave been alleviated by moving the tablet just slightly but I didn’twant to risk losing view of the marker”. Others reported on the diffi-culty of manipulation “holding tablet in hands contribute to imprecisemanipulation.”, “holding the tablet and markers involves a bit toomuch simultaneous manipulation to feel very precise.”. One participantsuggested dragging objects on the screen, a setting common in otherapplications (e.g., [37]). In neither TabletAR nor ImmersiveAR, did theparticipants report complaints about the markers’ patterns distractingthem from the task or resulting in any visual interference with thevisualization.
For Desktop, participants appreciated the ease and effectiveness ofthe environment (“easier to complete [the tasks] on the flat screen”,
“absence of Z parameter”, “the best interaction experience was withdescktop (SIC)”.) One participant summarized his/her experience asfollows: “To sum it up, Hololense (SIC) gives the best comprehension,Descktop (SIC) gives the best manipulation.”
5.4 Long-Term TrainingTo understand the effect of training for the ImmersiveAR, we analyzedthe four additional sessions for the long-term training group (6 partici-pants). Training was performed once a day, at the same time, for thefour days following the participant’s first session with the ImmersiveAR.We analyzed each task, data set, and participant individually as webelieved there would be differences between participants. In particular,

Participants
Time
(sec
onds
)
Participants Participants Participants1st session 5th (last) session Hololens avg. 1st session Desktop avg. 1st session
Fig. 9. Change in time with training for each participant (horizontal axes).Blue vertical bars indicate performance in the 1st session, while greenvertical bars indicate performance in the 5th (last) session. Blue andred horizontal bars indicate mean and 95% CIs in the initial study forImmersiveAR and Desktop, respectively.
some participants were quite fast in their first session and had littleroom to improve. In our analysis we excluded trials that took longerthan 60 and less than 1 seconds. Results for time are shown in Fig. 9.
For time in each training trial (participant × trial × task), we cal-culated the linear polynomial fit over all sessions 1-5. Slopes wereaveraged across all trials for the same task and participant, resulting in6 measures per task. Significance values were calculated between theresults of the first session and the 5th (last) session. For time, out of the24 measures (6 participants × 4 tasks), 22 showed a decrease in taskcompletion time, 9 of which showed a significant decrease (p < .05)between their first and their last session. For error, we did not find anysignificant change in precision for any task.
We can partially accept Htraining, though we think external con-ditions, such as personal performance and fatigue in the respectivesessions may have caused participants to vary in their performance,and 5 sessions may be too few to obtain an effect. We also checkedfor difficulties that may have been introduced by specific data sets forspecific days, but we did not find any evidence of such a variation.Subjective feedback from the training group showed that all partici-pants rated their subjective improvement in time between 8 and 9 on a9-point Likert scale. For precision, ratings varied between 6 and 8 onthe same scale. The highest subjective increase was reported during theselection and cuttingplane tasks, which are the tasks that required themost interaction with markers. Our statistical results confirm this trend(Figure 9-selection). Participants reported a possible source of decreasein task-completion time could be their improved motor-control overtime, as they learned to interact and navigate in 3D space. We alsofound a decrease in time for distance which may suggest that partici-pants got used to perception with the HoloLens. Finally, all participantshighly agreed they would further improve with more training.
After the training, we asked each of the 6 training participants againto rate all three environments on a 5-point Likert scale between “veryinappropriate” and “very appropriate” for our set of tasks. Other thanin the condition without training, participants rated the ImmersiveAR asappropriate as the Desktop. The TabletAR was rated worst. We see thisas a positive sign that people can improve quickly with the HoloLensthough being very novel to most participants, requiring very differentmotor actions, interactions, and strategies as on the desktop.
6 DISCUSSION
6.1 Study FindingsWe set out to find answers to the question “How effective is interactiveexploration of 3D visualizations in augmented reality?”. The shortanswer is that direct interaction with 3D holographic visualizationsthrough tangible markers improves time and accuracy for tasks thatrequire coordination between perception and interaction. We foundImmersiveAR to outperform the other two visualization environmentsfor tasks with high requirements for manipulation (selection (error),cuttingplane (time)). Across all tasks, ImmersiveAR was at least asprecise as Desktop, despite the fact that only 2 participants (out of15) had ever used the HoloLens before, and despite the quite newperception experience of the HoloLens provides. TabletAR led to themost errors in our study. Below, we report on finer grained findingsfrom our study.
Immersive tangible AR is best for highly interactive tasks re-quiring detailed manipulation: We believe the low values for timeand error resulted from the combination of conditions in the Immer-siveAR which matched both the spatiality of the visualization (3D), andthe spatiality and high degrees of freedom of the interaction (3D with 6-DOF). The spatial proximity between input and output may have helpedparticipants to coordinate interaction and perception. For cuttingplane,participants had a marker and head movement to rotate the view andanother marker to orient the clipping plane, whereas for Desktop bothview rotation and clipping plane orientation were performed with themouse. As for cuttingplane, our findings partially confirm previousstudies where TUIs have been found to be fastest for a similar task on amonoscopic screen and where interaction with a mouse has been foundto be slowest [11].
Training can lead to further improvement in ImmersiveAR: Im-mersiveAR led to generally slow performance across most tasks, whichwe attribute to a variety of reasons: i) participants preferred to activelymove around the visualization that they had air-locked; ii) participantstook extra time to explore holograms and verify their answers; iii)participants were new to the device, requiring time to adapt to theperception and motion-blur in fast head movements; and iv) technicaldelays in rendering and marker tracking, as well as occasional unrespon-siveness of the clicker device. With respect to i and iii, our training data(Fig. 9) shows that some improvement is possible as people learn tocoordinate perception and interaction for pointing in space. It may alsobe possible to gain time by more efficiently combining visualizationand head movements as well as more training.
Proximity of perception and interaction spaces is important formanipulation tasks: We were surprised to find that the TabletAR en-vironment led to the worst performance on almost all tasks, for bothtime and error. Our TabletAR actually was supposed to combine thebest of two worlds: high DOF tangible interfaces with precise and fastinteractions on a 2D touch screen. We believe the problems are due tolow proximity between interaction and perception spaces, the mismatchbetween the two spaces’ dimensionality (3D for interaction, 2D for per-ception), as well as the resulting visual offset and perspective mismatchbetween i) where the perceived outputs (hands, tools, visualization)appear (away from the hands), and ii) where they actually are (at thehands) (Fig. 3, bottom-center). However, the distance between thetablet and hands had to be large such that the pose was comfortable forparticipants. Subjective feedback largely reflected these conjectures.
Immersive environments afford engaging body motion: We ob-served that almost all participants preferred to stand while performingtasks with the ImmersiveAR and included their bodies into their naviga-tion strategies. While this would be expected to increase fatigue, we didnot find fatigue to be a problem during the approximately 40 minutesduration of the ImmersiveAR conditions. Instead, we conjecture thatthe ability to move can be an engaging experience compared to theotherwise passive sitting for Desktop environments.
Desktop performed generally well: The traditional desktop envi-ronment overall led to good performance on all tasks. Beyond familiar-ity, we attribute the good performance to an appropriate match of the2D interaction space (the mouse on the table) and the 2D perception(the monoscopic screen), combined with the effect of kinetic depth [48].Another reason might be that the desktop requires minimal effort tointeract with (e.g., small finger and hand movements, versus largerphysical movements) and that people are well trained with mouse inter-actions on a desktop. We highlight that our participants were mainlyyoung architecture students, spending much time interacting with CADsoftware, and may have had early access to 3D video games.
Performance in immersive environments may depend more onindividual differences: Some participants subjectively reported onhigher precision when using ImmersiveAR for perception but not forinteraction, while others stated the inverse. More than in traditionaldesktop environments, we believe immersive environments, such asImmersiveAR, increase personal variability in objective and subjectiveperformance. For instance, they may benefit individuals differently orto varying extents, depending on the individual’s abilities of spatialunderstanding and hand-eye coordination in general.
6.2 Limitations and GeneralizationWe explicitly limited our study to three visualization environments. Weintentionally did not control for all factors by which they differ but fo-cused on visual perception, interaction, and proximity. Here we discusslimitations with respect to technology, study design, visualizations, andparticipants as well as the generalizability of our results.
Technology Our findings are representative of the respective com-binations of devices detailed in Table 1. Devices such as HoloLensor the choice of the marker-tracking framework (Vuforia) are individ-ual choices meant to represent their respective class of devices andtechnology. They also represent the current state of the art of tech-nology (early 2017) and may have imposed technical limitations toparticipants’ performance with respect to future devices. For example,while holograms in ImmersiveAR were anchored in space extremelystably, we found marker tracking sometimes lagging and the HoloLensclicker did not always respond correctly to input. We found that speed,pressure, and position in which the clicker was triggered seemed toinfluence the success of a signal. However, correct reproduction ofthese parameters was not always possible. For the selection and cut-tingplane tasks, very slow corrections in marker positions, crucial forpointing and positioning, were often not tracked. Further variabilityfor TabletAR and ImmersiveAR performance might be the effect ofreflections and shadows on the markers as reported elsewhere [36, 38].
In ImmersiveAR, participants initially complained about the smallfield-of-view but also reported that they got used to it during the study.Moreover, the HoloLens has been optimized for a viewing distanceof between 1-2 meters. Testing holograms at arm-range, thus a dis-tance significantly less than what the device was optimized for, mayhave negatively influenced user performance. However, interactionrequires proximity and reachability, so being an inherent trade-off withHoloLens and similar head-mounted technology. Requiring partici-pants to sit, thus restricting them from extensively moving around, mayresult in slightly different results with possibly shorter times for taskcompletions. Touching the tablet during selection sometimes movedthe tablet and thus prevented participants from correctly hitting thetargeted point. During cuttingplane, participants sometimes had toswitch between dominant and non-dominant hands in order to not hidethe marker to which the visualization was attached, causing some dis-comfort. Additionally, though we planned to video-record participants’view port and manipulations through the HoloLens, streaming videodata took too much of the HoloLens’ performance, and effectivelywould have biased participants’ performance records.
Our results are timely in addressing the questions of how usabletechnology has gotten and what remains to be done—given the re-newed interest in AR and immersive technology [6, 7]. Our results,while highlighting the potential of this new technology, point to criticallimitations of current technology for visualization: slightly laggingmarkers, the missing precision to track slight corrections in markerposition and orientation, a limited field-of-view, and a reduced viewquality when approaching a hologram for detailed inspection. Theseweaknesses remain to be addressed in future technological iterations inorder to make immersive AR more competitive for the cases that wehave tested. On the other hand, we found certain technological factorsof the HoloLens—display resolution, stability, and complex markerpictures—to have less impact on task performance and subjective rat-ings of users. As we expect technology to improve over the comingyears, we believe immersive AR can become a stronger competitorto traditional desktop environments for exploring 3D visualizations.Future studies may repeat our study with updated devices.
Participants Our study involved two types of preconditions inparticipants: i) familiarity in working with 3D content, and ii) famil-iarity with specific devices and visualization environments. Half ofour participants were well versed in 3D graphics and manipulation asused in CAD systems and almost all participants had early experiencewith 3D video games. While we considered the first criteria representa-tive for the targeted audience of 3D visualization, general familiaritywith a state-of-the-art technique (Desktop) poses a common problem inevaluating novel techniques (ImmersiveAR) in visualization and HCI
research. Familiarity with Desktop may have a positive effect on therespective results. In fact, there is always a cost in switching from amastered technique to a novel technique as users have to master thenew technology, which may take time. Our results indicate that evenwithout training, results for Desktop and ImmersiveAR are comparableand that performance for ImmersiveAR can increase with training. Webelieve that comparing entirely untrained users on each condition doesnot help in assessing true performance in a real-world setup either. Weencourage future studies assessing the effect of trained participants inimmersive environments.
Visualization and Tasks Other 3D visualizations may featuredifferent visual structures such as curves, complex shapes, and completecubes [8], which we were not able to include in our study. Thesefeatures may imply additional tasks such as finding the most straightor curved line, comparing shapes and shape volumes, and findingelements hidden within complete cubes. A structured overview ofvisualizations, visual structures, and tasks related to 3D visualization isyet missing, appart from perhaps the very high-level description in Bachet al. [8]. However, we consider our tasks—assessing distance, selectingelements, perceiving projections, placing cuttingplanes—generic andapplicable to other visualizations in similar or slightly adapted form.That means our results are generalizable to other visualizations to acertain degree. Our study is meant as a first assessment and futurestudies may test for more specific conditions.
6.3 Bridging Visualization EnvironmentsWe believe different visualization environments, described here ascombinations of input and output technologies and devices, can beseen as complementary, depending on the task; in the words of BillBuxton: “Everything is best for something and worst for somethingelse” [14]. Because visual exploration involves many different per-ceptual and interaction tasks it may be beneficial to mix and switchenvironments on the fly. We think immersive augmented reality is apromising technology but do not advocate it as a complete replacementof existing environments. Rather, we encourage bridging differentvisualization environments and allowing users to seamlessly switchbetween them. Moreover, while we have been focusing on each envi-ronment individually, it will be interesting to investigate combinationsof augmented reality with touch-tables, physical visualizations, largewalls, and desktop computers for visualization. For example, we canimagine HoloLens and paper markers being used for complex spatialinteraction tasks such as placing cutting planes, brushing in 3D, orrotating a visualization. On the other side, pointing tasks, annotation,and setting visualization or filter parameters may be best supportedby a desktop environment. Being able to bridge and integrate severalenvironments is certainly a strength of augmented vs. virtual reality.
7 CONCLUSIONS AND FUTURE WORK
We have presented a study comparing three visualization environmentsfor interactive exploration tasks in 3D visualization. Our results suggestthat each environment has specific strengths. More detailed investiga-tions of individual factors will help in assessing their impact on usertask performance. Our classification scheme can help in designingrelevant future studies. For example, one could investigate the potentialbenefits of the HoloLens display combined with interactions on a multi-touch device or desktop environment. Another area of future work is aninvestigation of how to create easy-to-handle marker-based interactiontools to perform specific tasks for visualizations [8]. These tools couldsupport, e.g., selecting orthogonal cutting planes, selecting arbitraryshapes, duplicating content, filtering, or annotations. We also believethat more powerful interaction and display capabilities will ultimatelylead to novel or improved visualization designs and applications, in-tegrating visualizations into the real-world to foster data literacy andcollaboration [19].
ACKNOWLEDGMENTS
This work was supported in part by NIH grant U01CA200059 and by the KingAbdullah University of Science and Technology (KAUST) under award OSR-2015-CCF-2533-01.
REFERENCES
[1] Matplotlib. online:http://matplotlib.org/mpl_toolkits/mplot3d/tutorial.html. last checked: March 2, 2017.
[2] Hololens. online:https://www.microsoft.com/microsoft-hololens/en-us, 2017. [last visited: March 24,2017].
[3] Metavision. online:https://www.metavision.com, 2017. [last visited:March 24, 2017].
[4] Vuforia. online:https://www.vuforia.com, 2017. [last visited: March24, 2017].
[5] B. Alper, T. Hollerer, J. Kuchera-Morin, and A. Forbes. Stereoscopichighlighting: 2d graph visualization on stereo displays. IEEE Transactionson Visualization and Computer Graphics (TVCG), 17(12):2325–2333,2011.
[6] B. Bach, M. Cordeil, T. Dwyer, B. Lee, B. Saket, A. Endert, C. Collins, andS. Carpendale. Immersive analytics: Exploring future visualization andinteraction technologies for data analytics. IEEE VIS, Accepted Workshop,2017.
[7] B. Bach, R. Dachselt, S. Carpendale, T. Dwyer, C. Collins, and B. Lee.Immersive analytics: Exploring future interaction and visualization tech-nologies for data analytics. In Proceedings of the 2016 ACM on InteractiveSurfaces and Spaces, ISS ’16, pp. 529–533. ACM, New York, NY, USA,2016. doi: 10.1145/2992154.2996365
[8] B. Bach, P. Dragicevic, D. Archambault, C. Hurter, and S. Carpendale.A descriptive framework for temporal data visualizations based on gen-eralized space-time cubes. In Computer Graphics Forum. Wiley OnlineLibrary, 2016.
[9] A. Barrie, B. Cassell, and M. Cooper. Benefits of immersion for viewing3d data. 2005.
[10] D. Belcher, M. Billinghurst, S. Hayes, and R. Stiles. Using augmentedreality for visualizing complex graphs in three dimensions. In Proceedingsof IEEE and ACM Mixed and Augmented Reality, pp. 84–93. IEEE, 2003.
[11] L. Besancon, P. Issartel, M. Ammi, and T. Isenberg. Mouse, tactile, andtangible input for 3d manipulation. In Proceedings of the ACM Conferenceon Human Factors in Computing Systems (CHI), 2017.
[12] M. Billinghurst, H. Kato, and I. Poupyrev. Tangible augmented reality.Proceedings of ACM SIGGRAPH ASIA, 7, 2008.
[13] R. Brath. 3d infovis is here to stay: Deal with it. In IEEE VIS InternationalWorkshop on 3DVis, pp. 25–31. IEEE, 2014.
[14] B. Buxton. Multi-touch systems that i have known and loved. online:http://www.billbuxton.com/multitouchOverview.html, 2007. [last vis-ited: March 31, 2017].
[15] S. T. Carpendale, D. J. Cowperthwaite, M. Tigges, A. Fall, and F. D.Fracchia. The Tardis: A Visual Exploration Environment for LandscapeDynamics. In Proceedings of Conference on Visual Data Exploration andAnalysis, number 3643, pp. 110–119, 1999.
[16] J. Chen, H. Cai, A. P. Auchus, and D. H. Laidlaw. Effects of stereo andscreen size on the legibility of three-dimensional streamtube visualization.IEEE Transactions on Visualization and Computer Graphics (TVCG),18(12):2130–2139, 2012.
[17] S. Clarke, N. Dass, and D. H. P. Chau. Naturalmotion: Exploring gesturecontrols for visualizing time-evolving graphs. Proceedings of IEEE VIS(poster session), 2016.
[18] M. Cordeil, B. Bach, Y. Li, E. Wilson, and T. Dwyer. A design spacefor spatio-coordinated interaction devices for immersive information visu-alisations. In Proceedings of the IEEE Pacific Visualization Symposium(PacificVis), 2017.
[19] M. Cordeil, T. Dwyer, K. Klein, B. Laha, K. Marriott, and B. H. Thomas.Immersive collaborative analysis of network connectivity: Cave-style orhead-mounted display? IEEE Transactions on Visualization and ComputerGraphics, 23(1):441–450, 2017.
[20] D. J. Cowperthwaite, M. S. T. Carpendale, and F. D. Fracchia. Visualaccess for 3D data. In Proceedings on ACM Conference on Human Factorsin Computing Systems (CHI), pp. 175–176, 1996.
[21] R. M. C. do Carmo, B. S. Meiguins, A. S. G. Meiguins, S. C. V. Pinheiro,L. H. Almeida, and P. I. A. Godinho. Coordinated and multiple viewsin augmented reality environment. In Proceedings of IEEE InformationVisualization (IV’07), pp. 156–162. IEEE, 2007.
[22] N. Elmqvist, P. Dragicevic, and J.-D. Fekete. Rolling the dice: Multidi-mensional visual exploration using scatterplot matrix navigation. IEEETransactions on Visualization and Computer Graphics, 14(6):1539–1148,2008.
[23] R. Etemadpour, E. Monson, and L. Linsen. The effect of stereoscopicimmersive environments on projection-based multi-dimensional data visu-alization. In Proceedings of Information Visualization (IV), pp. 389–397,2013.
[24] S. Fels, E. Lee, and K. Mase. Techniques for interactive video cubism(poster session). In Proceedings of ACM Conference on Multimedia, pp.368–370. ACM, 2000.
[25] K. P. Fishkin. A taxonomy for and analysis of tangible interfaces. Personaland Ubiquitous Computing, 8(5):347–358, 2004.
[26] G. W. Fitzmaurice, H. Ishii, and W. A. Buxton. Bricks: laying the foun-dations for graspable user interfaces. In Proceedings of the SIGCHIConference on Human Factors in Computing Systems (CHI), pp. 442–449.ACM Press/Addison-Wesley Publishing Co., 1995.
[27] B. Frohlich and J. Plate. The cubic mouse: a new device for three-dimensional input. In Proceedings of the SIGCHI Conference on HumanFactors in Computing Systems (CHI), pp. 526–531. ACM, 2000.
[28] T. Hagerstraand. What about people in regional science? Papers inregional science, 24(1):7–24, 1970.
[29] K. Hinckley, R. Pausch, J. C. Goble, and N. F. Kassell. Passive real-worldinterface props for neurosurgical visualization. In Proceedings of theSIGCHI Conference on Human Factors in Computing Systems (CHI), pp.452–458. ACM, 1994.
[30] H. Ishii and B. Ullmer. Tangible bits: towards seamless interfaces betweenpeople, bits and atoms. In Proceedings of the ACM SIGCHI Conference onHuman Factors in Computing Systems (CHI), pp. 234–241. ACM, 1997.
[31] P. Issartel, F. Gueniat, and M. Ammi. Slicing techniques for handheld aug-mented reality. In Proceedings of IEEE Symposium on 3D User Interfaces(3DUI), pp. 39–42. IEEE, 2014.
[32] B. Jackson, T. Y. Lau, D. Schroeder, K. C. Toussaint, and D. F. Keefe. Alightweight tangible 3d interface for interactive visualization of thin fiberstructures. IEEE Transactions on Visualization and Computer Graphics(TVCG), 19(12):2802–2809, 2013.
[33] Y. Jansen and P. Dragicevic. An interaction model for visualizationsbeyond the desktop. IEEE Transactions on Visualization and ComputerGraphics (TVCG), 19(12):2396–2405, 2013.
[34] Y. Jansen, P. Dragicevic, and J.-D. Fekete. Evaluating the efficiency ofphysical visualizations. In Proceedings of the SIGCHI Conference onHuman Factors in Computing Systems (CHI), pp. 2593–2602. ACM, 2013.
[35] D. F. Keefe and T. Isenberg. Reimagining the scientific visualizationinteraction paradigm. Computer, 46(5):51–57, 2013.
[36] E. Kruijff, J. E. Swan, and S. Feiner. Perceptual issues in augmentedreality revisited. In Proceedings of IEEE International Symposium onMixed and Augmented Reality (ISMAR), pp. 3–12. IEEE, 2010.
[37] D. Lopez, L. Oehlberg, C. Doger, and T. Isenberg. Towards An Under-standing of Mobile Touch Navigation in a Stereoscopic Viewing Envi-ronment for 3d Data Exploration. IEEE Transactions on Visualizationand Computer Graphics (TVCG), 22(5):1616–1629, May 2016. doi: 10.1109/TVCG.2015.2440233
[38] M. Luboschik, P. Berger, and O. Staadt. On spatial perception issues inaugmented reality based immersive analytics. In Proceedings of the 2016ACM Companion on Interactive Surfaces and Spaces, pp. 47–53. ACM,2016.
[39] L. v. d. Maaten and G. Hinton. Visualizing data using t-sne. Journal ofMachine Learning Research, 9(Nov):2579–2605, 2008.
[40] MATLAB. version 7.10.0 (R2010a). The MathWorks Inc., Natick, Mas-sachusetts, 2010.
[41] J. P. McIntire, P. R. Havig, and E. E. Geiselman. What is 3d good for?a review of human performance on stereoscopic 3d displays. In SPIEdefense, security, and sensing, pp. 83830X–83830X. International Societyfor Optics and Photonics, 2012.
[42] J. P. McIntire and K. K. Liggett. The (possible) utility of stereoscopic 3ddisplays for information visualization: The good, the bad, and the ugly. InIEEE VIS International Workshop on 3DVis (3DVis), pp. 1–9. IEEE, 2014.
[43] R. P. McMahan, D. Gorton, J. Gresock, W. McConnell, and D. A. Bowman.Separating the effects of level of immersion and 3d interaction techniques.In Proceedings of the ACM symposium on Virtual reality software andtechnology, pp. 108–111. ACM, 2006.
[44] B. S. Meiguins, R. C. do Carmo, A. S. Goncalves, P. I. A. Godinho, andM. de Brito Garcia. Using augmented reality for multidimensional datavisualization. In Proceedings of Conference on Information Visualization(IV), pp. 529–534. IEEE, 2006.
[45] P. J. Metzger. Adding reality to the virtual. In Proceedings of IEEE VirtualReality Annual International Symposium, pp. 7–13, Sep 1993. doi: 10.
1109/VRAIS.1993.380805[46] P. Milgram and F. Kishino. A taxonomy of mixed reality visual displays.
IEICE Transactions on Information and Systems, 77(12):1321–1329, 1994.[47] M. R. Mine, F. P. Brooks Jr, and C. H. Sequin. Moving objects in space:
exploiting proprioception in virtual-environment interaction. In Proceed-ings of Conference on Computer graphics and Interactive Techniques, pp.19–26. ACM Press/Addison-Wesley Publishing Co., 1997.
[48] T. Sando, M. Tory, and P. Irani. Effects of animation, user-controlledinteractions, and multiple static views in understanding 3d structures. InProceedings of the 6th Symposium on Applied Perception in Graphics andVisualization, pp. 69–76. ACM, 2009.
[49] E. Sharlin, B. Watson, Y. Kitamura, F. Kishino, and Y. Itoh. On tan-gible user interfaces, humans and spatiality. Personal and UbiquitousComputing, 8(5):338–346, 2004.
[50] B. Shneiderman. Why not make interfaces better than 3d reality? IEEEComputer Graphics and Applications, 23(6):12–15, 2003.
[51] H. Slay, M. Phillips, R. Vernik, and B. Thomas. Interaction modes foraugmented reality visualization. In Proceedings of Asia-Pacific Symposiumon Information Visualisation (APVis), pp. 71–75. Australian ComputerSociety, Inc., Darlinghurst, Australia, Australia, 2001.
[52] M. Spindler and R. Dachselt. Paperlens: advanced magic lens interactionabove the tabletop. In Proceedings of the ACM International Conferenceon Interactive Tabletops and Surfaces (ITS), p. 7. ACM, 2009.
[53] M. St. John, M. B. Cowen, H. S. Smallman, and H. M. Oonk. The use of2d and 3d displays for shape-understanding versus relative-position tasks.Human Factors, 43(1):79–98, 2001.
[54] R. Stenholt and C. B. Madsen. Poster: Brush, lasso, or magic wand?picking the right tool for large-scale multiple object selection tasks. InProceedings of IEEE Symposium on 3D User Interfaces (3DUI), pp. 163–164, March 2012. doi: 10.1109/3DUI.2012.6184212
[55] W. Steptoe, S. Julier, and A. Steed. Presence and discernability in conven-tional and non-photorealistic immersive augmented reality. In Proceedingsof IEEE International Symposium on Mixed and Augmented Reality (IS-MAR), pp. 213–218. IEEE, 2014.
[56] I. E. Sutherland. The ultimate display. Multimedia: From Wagner tovirtual reality, 1965.
[57] F. Taher, J. Hardy, A. Karnik, C. Weichel, Y. Jansen, K. Hornbæk, andJ. Alexander. Exploring interactions with physically dynamic bar charts.In Proceedings of ACM Conference on Human Factors in ComputingSystems (CHI), pp. 3237–3246. ACM, 2015.
[58] T. Tawara and K. Ono. A framework for volume segmentation and visual-ization using augmented reality. In Proceedings of IEEE Symposium on3D User Interfaces (3DUI), pp. 121–122. IEEE, 2010.
[59] M. Tory, A. E. Kirkpatrick, M. S. Atkins, and T. Moller. Visualization taskperformance with 2d, 3d, and combination displays. IEEE Transactionson Visualization and Computer Graphics (TVCG), 12(1):2–13, 2006.
[60] B. W. Van Schooten, E. M. Van Dijk, E. Zudilova-Seinstra, A. Suinesi-aputra, and J. H. Reiber. The effect of stereoscopy and motion cues on3d interpretation task performance. In Proceedings of the InternationalConference on Advanced Visual Interfaces (AVI), pp. 167–170. ACM,2010.
[61] B. Wang and K. Mueller. Does 3d really make sense for visual clusteranalysis? yes! In IEEE VIS International Workshop on 3DVis (3DVis), pp.37–44. IEEE, 2014.
[62] C. Ware and G. Franck. Evaluating stereo and motion cues for visualizinginformation nets in three dimensions. ACM Transactions on Graphics(TOG), 15(2):121–140, 1996.
[63] C. Ware and P. Mitchell. Visualizing graphs in three dimensions. ACMTransactions on Applied Perception (TAP), 5(1):2, 2008.
[64] Y. Yokokohji, R. L. Hollis, and T. Kanade. What you can see is what youcan feel—development of a visual/haptic interface to virtual environment.In Proceedings of the IEEE 1996 Virtual Reality Annual InternationalSymposium, pp. 46–53, 265, Mar 1996. doi: 10.1109/VRAIS.1996.490509
[65] L. Yu, K. Efstathiou, P. Isenberg, and T. Isenberg. Cast: Effective andefficient user interaction for context-aware selection in 3d particle clouds.IEEE Transactions on Visualization and Computer Graphics, 22(1):886–895, 2016.
[66] S. Zhai and P. Milgram. Quantifying coordination in multiple DOF move-ment and its application to evaluating 6 DOF input devices. In Proceedingsof SIGCHI Conference on Human Factors in Computing Systems, pp. 320–327. ACM Press/Addison-Wesley Publishing Co., 1998.
[67] F. Zhou, H. B.-L. Duh, and M. Billinghurst. Trends in augmented realitytracking, interaction and display: A review of ten years of ISMAR. In Pro-
ceedings of IEEE/ACM International Symposium on Mixed and AugmentedReality (ISMAR), pp. 193–202. IEEE Computer Society, Washington, DC,USA, 2008. doi: 10.1109/ISMAR.2008.4637362