the history behind census geography
TRANSCRIPT

The History Behind
Census Geography
Michael Ratcliffe
Geography Division
US Census Bureau
Kentucky State Data Center
Affiliate Meeting
August 5, 2016

Today’s Presentation…
• A brief look at the history behind some of
the Census Bureau’s geographic areas.
• Focus on:
– History behind census geographic areas.
– Changes to census geographic area concepts
and criteria in response to changing
settlement patterns and data user needs.
Census Geography: The Long View
• The Census Bureau’s geographic areas reflect
the variety of ways in which Americans have
organized the settlement landscape.
• 1790-1890, census geography was largely
limited to a small number of types of legal areas.
• The history of changing census geography has
largely been one of increasing types and
numbers of statistical geographic areas.
3

Changes to Census Geography
• Over the past century, the number and types of
census geographic areas, and the criteria used
to define areas, have changed in response to:
– Changes in technology (i.e., GIS, databases)
providing for more efficient exchange, collection,
management, and dissemination of data.
– Changes in user needs and expectations.
– Improvements in spatial resolution of data.
– Changes in theoretical approaches to interpreting and
understanding geographic concepts.
4

Census Geography: Key Dates
• Late-19th Century: introduction of small statistical areas, such as
enumeration districts, sanitary districts. Tabulation of data by city
ward.
• 1910: Introduction of census tracts (8 cities).
• 1910 – 1940: Industrial districts, metropolitan districts.
• 1930: Census tract coverage expanded to 10 additional large cities.
• 1940: block-level data for cities of 50,000 or more population.
Unincorporated communities supplementary report.
• 1950: Introduction of standard metropolitan areas, urbanized areas,
census designated places (CDPs), census county divisions (CCDs).
• 1990: Nationwide coverage for blocks; census tracts/block
numbering areas.
• 2000: ZIP Code Tabulation Areas (ZCTAs), urban clusters,
micropolitan statistical areas. Census tracts nationwide.
5

WESTWARD MIGRATION OF
AMERICAN POLITICAL
GEOGRAPHY:
COUNTIES AND
COUNTY SUBDIVISIONS
6

Chesapeake Counties and New England Towns…
and a Middle Path in the Mid-Atlantic
• Our basic units of local political geography
largely stem from three colonial hearths:
– The Chesapeake Region of Maryland and Virginia
– New England
– Pennsylvania
• The political landscape in the Chesapeake formed
around counties.
• In New England, the basic unit of local government was
the town/township.
• In Pennsylvania, we see a mix of counties, cities, and
townships.
7

• As Americans moved west, they tended to take
their political geography preferences with them
8 Source: Donald W. Meinig. 1993. The Shaping of America:
Continental America, 1800-1865. Yale University Press.
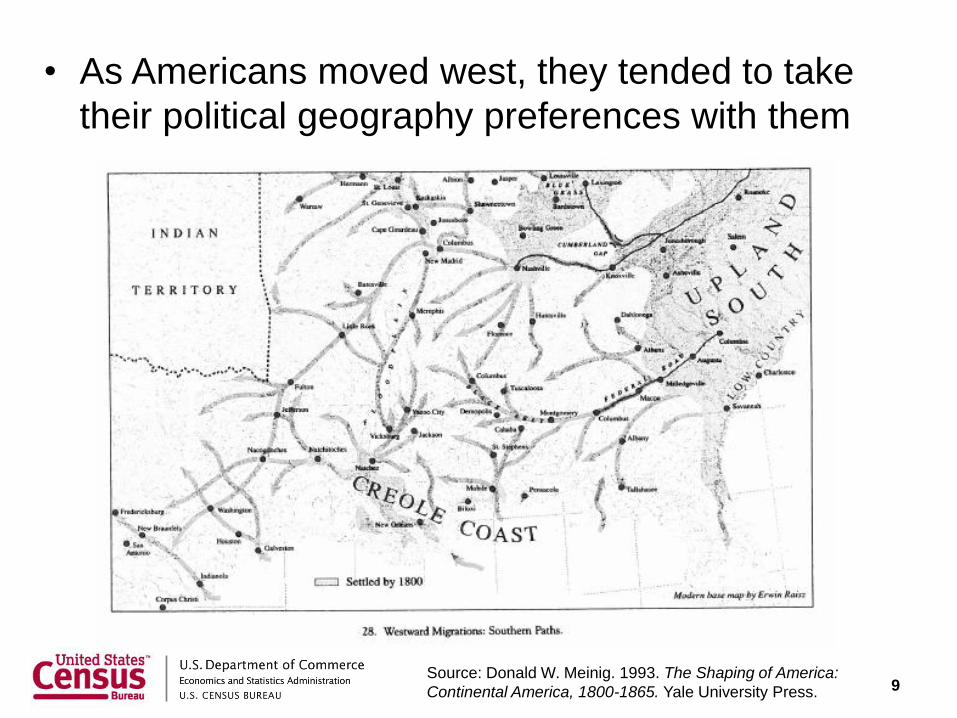
• As Americans moved west, they tended to take
their political geography preferences with them
9 Source: Donald W. Meinig. 1993. The Shaping of America:
Continental America, 1800-1865. Yale University Press.

10

Illinois County Subdivisions
• Non-governmental precincts are found in 17
counties, mostly in the southern half of the state.
11

FILLING IN THE GAPS:
CENSUS DESIGNATED PLACES
12

13

Unincorporated/Census Designated Places
• 1940: Supplementary report for unincorporated places.
Must have population of at least 500.
• 1950: unincorporated places defined only outside
urbanized areas. Must have a population of at least
1,000.
• 1960 through 1990: defined inside urbanized areas, with
the minimum population threshold declining from 10,000
to 5,000, then to 2,500 during this period. Outside
urbanized areas, population of at least 1,000.
• 2000 to present: no minimum population threshold.
14

Census Designated Places
15
In states in which communities tend not
to incorporate as cities, towns, or
villages, CDPs are critical for providing
place-level data.

16
Census 2000:
Minimum population
requirements for
Census Designated
Places were
eliminated to support
identification of
colonias and other
small, unincorporated
communities to
improve access to
data about
demographic
characteristics.

Starr County, TX Colonia/CDPs
17
Mikes CDP/colonia

STANDARDIZING “PLACE” IN
CENSUS BUREAU PRODUCTS
18

Standardizing the Definition of Place in
Census Bureau Products
Why does this matter?
• Local and regional perceptions of what is a
place do not always match the Census Bureau’s
definition.
• Definitions differ across Census Bureau
tabulation programs and products.
• Differences cause challenges to data users
when integrating Census Bureau data.
19
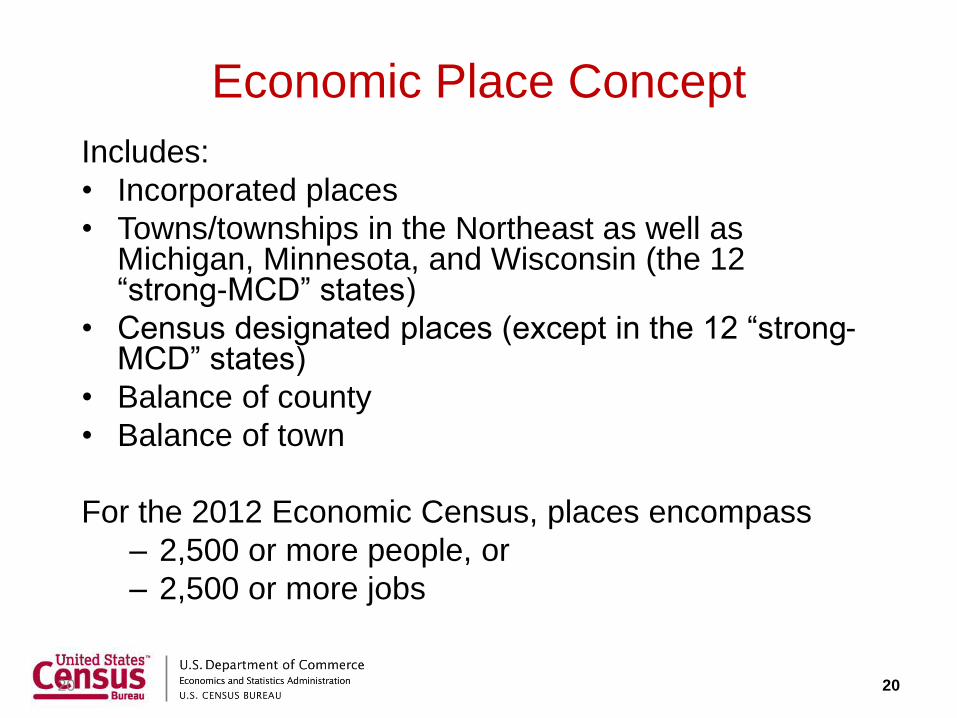
Economic Place Concept
Includes:
• Incorporated places
• Towns/townships in the Northeast as well as Michigan, Minnesota, and Wisconsin (the 12 “strong-MCD” states)
• Census designated places (except in the 12 “strong-MCD” states)
• Balance of county
• Balance of town
For the 2012 Economic Census, places encompass
– 2,500 or more people, or
– 2,500 or more jobs
20 20
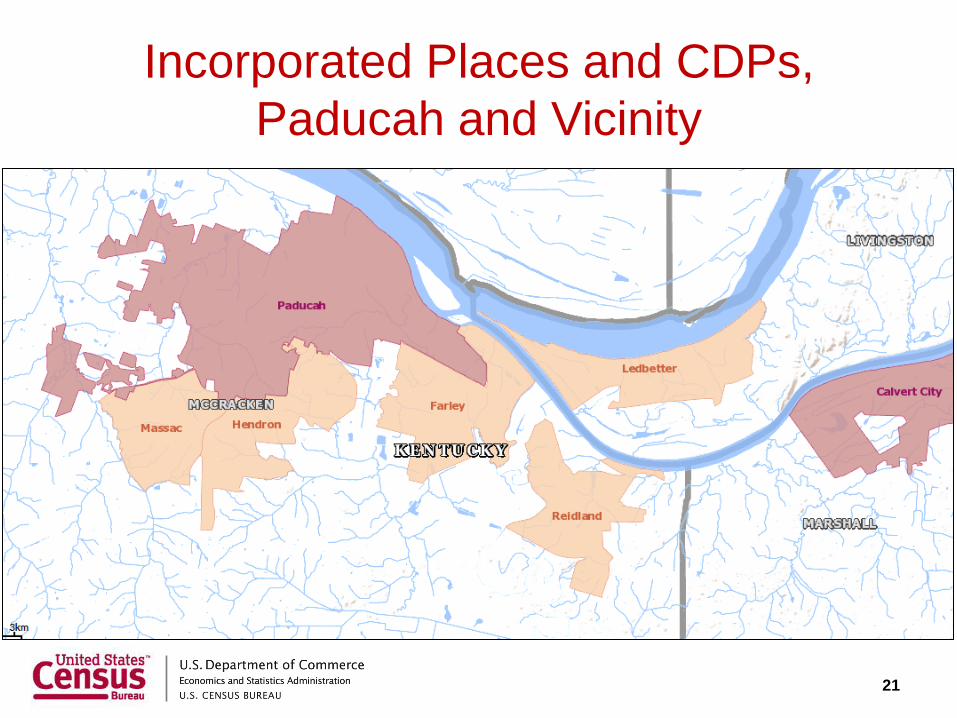
Incorporated Places and CDPs,
Paducah and Vicinity
21

22
Economic Census Places,
McCracken County
23
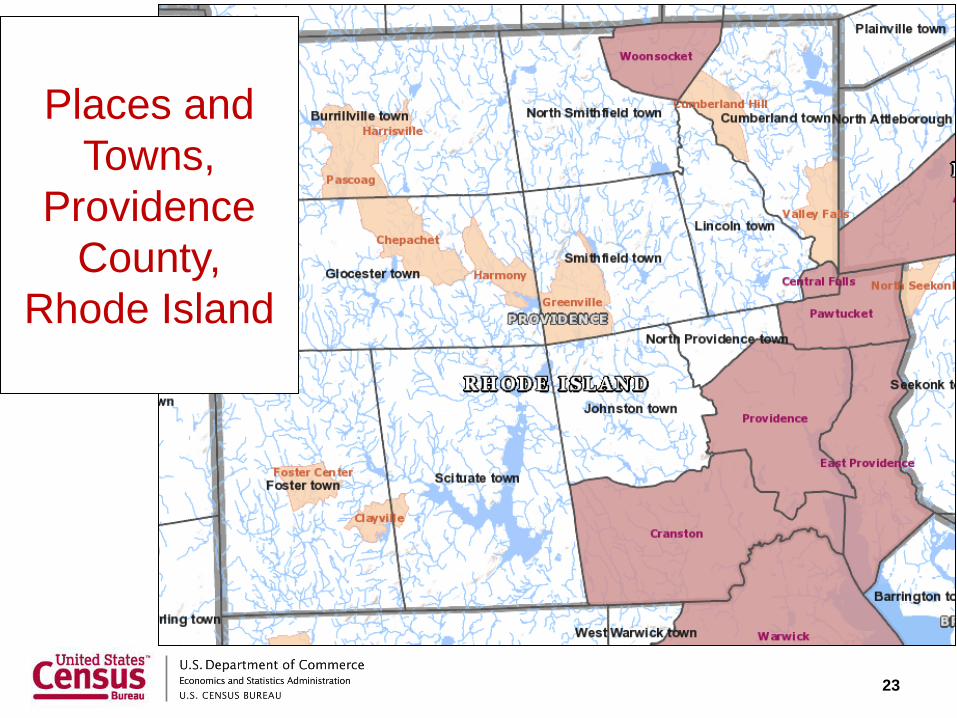
Places and
Towns,
Providence
County,
Rhode Island

24 24
Economic Census Places,
Providence County, Rhode Island

URBAN AND METROPOLITAN AREAS:
DEFINING THE STRUCTURAL
AND FUNCTIONAL LANDSCAPE
25

Urban/Rural and Metropolitan
• The history of urban/rural and metropolitan
classifications has been one of response to:
– Changes to settlement patterns in and around cities;
i.e., increasing suburbanization.
– Changes in theoretical approaches to interpreting and
understanding the growth of urban areas.
– Improved technology (i.e., GIS, digital databases)
making it easier to manage large amounts of data.
– Increased spatial resolution of statistical and
geospatial data.
26

1790 1800 1810 1820 1830 1840 1850 1860 1870 1880 1890 1900 1910 1920 1930 1940 1950 1960 1970 1980 1990 2000 2010
Percent Urban 5.1 6.1 7.3 7.2 8.8 10.8 15.4 19.8 25.7 28.2 35.1 39.6 45.6 51.2 56.1 56.5 64.0 69.9 73.6 73.7 75.2 79.0 80.7
0
10
20
30
40
50
60
70
80
90
Urban Population as a Percentage of Total US Population, 1790-2010
27
1910: 2,500 threshold adopted.
1950: urbanized areas of 50,000+ adopted.
2000: urban clusters of 2,500-49,999 adopted.

Industrial Districts (1905) and
Metropolitan Districts (1910-1940)

29
• Adoption of concept to
account for increased
suburban growth
around large cities.
• Adherence to place
boundaries.
• Delineated
manually/interactively.
• Delineation built from
previous decade’s
boundary.
Urbanized Areas, 1950-1990

Urban Area Criteria Changes, 1960-1990
30
1960 Census: Twin central
cities totaling 50,000 or more
persons. 1970 Census: “Extended cities” split
between urban and rural components.
Rural portions of
Oklahoma City

• Urban clusters adopted, extending the urbanized area concept to smaller places.
• Place boundaries not considered when delineating areas.
• Automated delineation to improve efficiency and consistency.
31
Changes to the Urban Area Concept and
Criteria for Census 2000
31


Metropolitan Areas: 1950-2013
• Though the names have changed, the concept
remained (essentially) the same:
– Standard Metropolitan Areas
– Standard Metropolitan Statistical Areas, Standard
Consolidated Statistical Areas
– Metropolitan Statistical Areas, Consolidated
Metropolitan Statistical Areas, Primary Metropolitan
Statistical Areas
– Metropolitan and Micropolitan Statistical Areas,
Combined Statistical Areas, Metropolitan Divisions
33

Standard Metropolitan Areas: 1950
34

Metropolitan and Micropolitan
Statistical Areas: 2013
35

Concluding Thoughts
• Census Bureau geography reflects the variety of
geographic areas that exist and vary across the
nation.
• This variety has some basis in historical
settlement patterns, but also reflects changing
perceptions and data user needs.
• Understanding the history behind Census
Bureau geography helps us to understand the
reasons for the variety, and adds richness to
statistical data.
36

Questions? Comments?
Contact information:
Michael Ratcliffe
Geography Division
U.S. Census Bureau
37 37