the heterogeneous impact of pension income on elderly living ...ftp.iza.org/dp9116.pdf · the...
TRANSCRIPT
DI
SC
US
SI
ON
P
AP
ER
S
ER
IE
S
Forschungsinstitut zur Zukunft der ArbeitInstitute for the Study of Labor
The Heterogeneous Impact of Pension Incomeon Elderly Living Arrangements:Evidence from China’s New Rural Pension Scheme
IZA DP No. 9116
June 2015
Lingguo ChengHong LiuYe ZhangZhong Zhao

The Heterogeneous Impact of Pension Income on Elderly Living Arrangements: Evidence from China’s New Rural Pension Scheme
Lingguo Cheng
Shanghai University of Finance and Economics
Hong Liu Central University of Finance and Economics
Ye Zhang
Nanjing University
Zhong Zhao Renmin University of China and IZA
Discussion Paper No. 9116 June 2015
IZA
P.O. Box 7240 53072 Bonn
Germany
Phone: +49-228-3894-0 Fax: +49-228-3894-180
E-mail: [email protected]
Any opinions expressed here are those of the author(s) and not those of IZA. Research published in this series may include views on policy, but the institute itself takes no institutional policy positions. The IZA research network is committed to the IZA Guiding Principles of Research Integrity. The Institute for the Study of Labor (IZA) in Bonn is a local and virtual international research center and a place of communication between science, politics and business. IZA is an independent nonprofit organization supported by Deutsche Post Foundation. The center is associated with the University of Bonn and offers a stimulating research environment through its international network, workshops and conferences, data service, project support, research visits and doctoral program. IZA engages in (i) original and internationally competitive research in all fields of labor economics, (ii) development of policy concepts, and (iii) dissemination of research results and concepts to the interested public. IZA Discussion Papers often represent preliminary work and are circulated to encourage discussion. Citation of such a paper should account for its provisional character. A revised version may be available directly from the author.

IZA Discussion Paper No. 9116 June 2015
ABSTRACT
The Heterogeneous Impact of Pension Income on Elderly Living Arrangements:
Evidence from China’s New Rural Pension Scheme* This paper investigates the impact of pension income on living arrangements of the elderly. Taking advantage of a unique opportunity due to the recent establishment and expansion of the social pension system in rural China, we explicitly address the endogeneity of pension status and income through a fixed-effect model with instrumental variable approach by exploiting exogenous time variation in the program implementation at county level. We find an overall positive effect of pension income on independent living as well as considerable heterogeneity. The elderly with easy access to their adult children, possessing higher financial capacity, in less long-term care and psychological need, and having more education are more likely to live independently after receiving pension income. Our results confirm that independent living is a normal good, but highlight that living arrangement is multidimensional in rural China. JEL Classification: J12, H55, I38 Keywords: pension income, living arrangements, heterogeneity, China Corresponding author: Hong Liu Central University of Finance and Economics 39 Xueyuan Nan Road Beijing 100081 China E-mail: [email protected]
* We would like to express appreciation for comments from seminar participants at Central University of Finance and Economics and Renmin University of China. This study was supported by NIH R01 grant (5R01-AG023627), the Natural Science Foundation of China (Grant No. 71110107025, No. 71173227, No. 71203244, and No. 71233001), the National Social Science Fund of China (Grant No. 13CJY028), Program for New Century Excellent Talents in University (Grant No. NCET-12-0993), and Training Program for Major Fundamental Research of Central University of Finance and Economics (Grant No. 14ZZD001).

3
1. Introduction
As a result of declines in fertility and mortality, population aging is becoming a
major public policy concern for transition and developing countries, which have been
lacking strong formal social support systems. Many developing countries are
currently attempting to initiate or to expand social pension programs in order to
improve the well-being of the growing elderly population.
China has the largest elderly population in the world. According to the most
recent census, in 2010 there were 178 million people aged over 60 and 119 million
over 65, accounting for 13.3% and 8.9% of total population in China, respectively;
about 60 percent of them live in rural areas. Despite China’s high economic growth
during the past three decades, the rural elderly remain poorer and more vulnerable
than the urban elderly, due to the large rural-urban disparity, low savings, lack of
pension support, and heavy reliance on family support (Cai et al., 2012). The
estimated poverty rate for rural elderly was around 20 percent in 2006, much higher
than that for urban elderly in China (Cai et al., 2009; Park et al., 2012).
To improve the welfare of the rural elderly, in 2009 the Chinese government
launched the New Rural Pension Scheme (NRPS) in China. It was first implemented
in 320 pilot rural counties in 2009, was then expanded to 838 counties (approximately
40% of all rural counties) in 2010, and covered nearly all rural counties by 2012.1 By
the end of 2011, about 89 million rural elderly had received pension payments under
the NRPS. In this paper, we examine the effect of NRPS participation and pension
income from the NRPS on living arrangements of the Chinese elderly.
Living arrangements have long been regarded as a key dimension of quality of
life and an important indicator of long-term care demand in old age (Pezzin et al.,
1996; Hoerger et al., 1996; Dostie and Léger, 2005; Bethencourt and Ríos-Rull, 2009).
This importance has led to a growing body of research on the effect of income or
social security payments on living arrangements of the elderly. The existing empirical
literatures, primarily focusing on developed countries, have mixed results. Studies on
1 China has 2,856 county-level administrative areas, and among them, 2,003 are rural counties. The
rests are county-level districts under the jurisdiction of municipalities, which are mainly urban areas.

4
the United States show constantly that the increase in pension income has led to a rise
in independent living by the elderly, suggesting that independence is a normal good
(Costa, 1997 and 1999; McGarry and Schoeni, 2000; Engelhardt et al., 2005). In
contrast, using a sample of Italian parents aged 37 to 74, Manacorda and Moretti
(2006) find that higher levels of parental income increase the probability of
cohabitation, implying that coresidence is a normal good for Italian parents. There are
few studies on developing countries; one exception is Edmonds et al. (2005). They
show that in South Africa pension income has not increased the likelihood of black
elderly women’s independent living, but resulted in changes in household
composition.
Living arrangement is even more important in rural China: traditionally living
with adult children is the primary mechanism through which the elderly obtain care
and support (Benjamin et al., 2000). However, the increasing mass rural-to-urban
migration and shrinking family size inevitably have eroded the foundation of the
Chinese traditional intergenerational support system. For example, data from the
China Health and Nutrition Survey show that the share of rural elderly living with
adult children has dropped from nearly 70 percent in 1991 to just over 40 percent in
2006 (Cai et al., 2012).
Two recent studies have explored the elderly living arrangement in China, but
find different results. Meng and Luo (2008) find that increases in pension income
significantly raise the probability that the elderly will be independent, though their
estimated income effect is much lower than those found in the United States. However,
this study is on urban Chinese elderly. Lei et al. (2013) show that Chinese rural
elderly with higher income are more likely to live with or live near their adult children.
Neither study takes account of the endogeneity of pension participation and pension
income. Such endogeneity could be important, and is likely to arise from reverse
causality or unobserved heterogeneity, such as preference and unobserved lifetime
earnings, correlated with pension status/income as well as with living arrangement.
Using panel data from the Chinese Longitudinal Healthy Longevity Survey, this
study makes several contributions. First, taking advantage of a unique opportunity due

5
to the recent establishment and expansion of the NRPS, we address the endogeneity of
pension income by applying a fixed-effect model with instrumental variable
correction by exploiting exogenous time variation in the NRPS implementation at the
county level as our instrumental variable.
Second, Manacorda and Moretti (2006) suggest that parents may have different
preferences for living arrangement across countries, which may help explain different
findings for different countries in the literature. Our study highlights the
multidimensionality of living arrangement and explicitly investigates the
heterogeneity of the income effect on elderly living arrangements. Four possible
aspects of heterogeneity are explored: geographic proximity of adult children,
financial capacity, long-term care needs, and privacy concerns of the elderly. This is
the main distinction of our paper from the existing literature.
We find that both the NRPS enrollment status and pension income have
significantly increased the likelihood that the elderly live independently, suggesting
that independent living is a normal good in rural China. Moreover, we find
considerable heterogeneous effects. Our results show that the positive income effects
of the NRPS are concentrated among the elderly with easy access to their adult
children, better financial status, more education, and less long-term care and
psychological needs. These findings provide evidence that independent living has
multiple dimensions in China, and help to reconcile mixed findings in the literature.
Last but not least, there are few studies on the impact of the NRPS in rural China,
mainly because it started only a few years ago, and the proper data is limited. This
paper is one of the few studies to evaluate the impact of the NRPS on the welfare of
the elderly in rural China. There is wide concern that the income from the NRPS may
be too little to provide basic protection against poverty in old age. Our study sheds
light on this issue and adds to the limited literature on the evaluation of social pension
programs in developing and transition countries (Kakwani and Kalanidhi, 2005;
Palacios and Oleksiy, 2006; Barrientos, 2009). Given that many countries are
becoming aging societies, our study has important policy relevancy to other countries
as well.

6
The remainder of the paper is organized as follows. Section 2 provides
background on the NRPS in China. Section 3 presents a simple conceptual framework,
which allows us to conceptualize heterogeneous income effects on elderly living
arrangements. Section 4 outlines our estimation strategy. In section 5 we describe the
data and variables used in the analysis. Section 6 gives the main results, including
validating the assumptions of our empirical strategy. Section 7 deals with panel
attrition. Section 8 concludes the paper.
2. Rural Pension System in China
During the 1950s through the 1970s, in view of its urban-oriented development
strategy and state-owned economy, China’s first formal pension scheme mainly
covered urban workers, while the rural residents could only depend on their land and
families for old-age support (Shi, 2006). In the 1990s, the government attempted to
establish some form of rural pension insurance on a pilot basis in some well-off
counties, which was financed primarily by individual contributions. Partly due to
inadequate subsidies from the government, this pilot pension scheme had inadequate
funding, and collapsed in most pilot areas (Li, 2007).
It was estimated that over 90 percent of the 100 million elderly living in rural
areas did not have any pension coverage in 2007 (Shen and Williamson, 2010).
Meanwhile, the traditional family support to the rural elderly has faced great
challenges due to the reduced family size associated with the family planning policy
since the late 1970s and the increase of rural-to-urban migration since the late 1980s
(Giles et al., 2010).
In order to provide a basic social safety net for rural residents, in 2009 the
Chinese government launched a nationwide project known as the New Rural Pension
Scheme (NRPS). The scheme began as a pilot in 320 rural counties (about 15 percent
of all rural counties), selected by central and provincial governments. In 2010, 518
new counties were added for the second batch of the pilot. The scheme was expanded
to 1,902 counties by 2011 and to nationwide by 2,012.
The NRPS is a voluntary social pension program consisting of a basic pension

7
and an individual pension account. All rural residents aged 16 or above who are not in
school and not enrolled in an urban pension scheme are eligible to participate.
Different from the previous pilot one, the NRPS is financed by a combination of
individual contributions and subsidies shared between central and local governments.
Financial support from rural collectives is encouraged but not mandated. Central
government bears the full cost of the non-contributory element for the relatively poor
central and western regions, and half the cost for eastern regions. Individual
contributions, ranging from 100 to 500 Chinese yuan per year at the choice of the
enrollee,2 and a partial matched contribution by central or local governments, which
is at least 30 Chinese yuan per year and is larger for larger individual contributions,
are paid into individual accounts and accumulated at a one-year deposit interest rate.
The NRPS is currently pooling at the county level, and is targeted at pooling at the
provincial level when feasible.
Participants who have contributed for 15 years will be eligible for a pension at
age 60. Those aged 45–59 can contribute during their working lives or pay a lump
sum to cover any shortfall in the vesting period of 15 years of contribution. At the
time the program is introduced, despite paying no contribution to the NRPS, those
older people aged 60 and over can directly receive the basic pension benefit as long as
their adult children participate in the program.3
The NRPS benefits include a basic flat rate pension and a monthly payment from
the individual account. The monthly payment from the individual account is equal to
the accumulated amount in the individual account divided by 139.4 The level of the
basic flat rate pension varies across regions, with a minimum value of 55 Chinese
yuan per month, which is financed mainly by the central government. Local
governments are encouraged to make additional contributions at their discretion. For
example, the basic pension benefit of rural residents in Beijing was about 280 Chinese
2 1 US dollar is about 6.2 Chinese yuan.
3 In practice, the requirement for the participation of the children has been dropped gradually in many
areas. In some areas, the elderly aged 60 and over are also allowed to pay a lump sum to cover shortfall
on vesting contributions, which may or may not be subsidized, depending on local policies. 4 As the life expectancy in 2009 was 71.5 years in China, the average duration of benefits is 11.5 years,
or 139 months, for a 60-year old individual.

8
yuan per month in the starting year, due to additional contributions from local
government. However, in some regions, the old people only receive a basic monthly
pension of 55 Chinese yuan, which equals 13.9 percent of the 2008 average per capita
net income in rural China.5 Moreover, 55 Chinese yuan per month is close to the
2008 poverty threshold set at 783 Chinese yuan per year by the Chinese government
(Shen and Williamson, 2010), and is about 27.5 percent of the average monthly living
expenses among Chinese rural elderly (Zhang and Tang, 2008). Thus, the basic
pension benefit of the NRPS is not adequate to maintain a minimum living standard,
but can only help to pay for the basic necessities.
3. Conceptual Framework
The goal of our analysis is to examine the effect of the NRPS status and pension
income on elderly living arrangement; particularly we pay attention to the
heterogeneous income effects among the rural elderly and channels behind these
heterogeneous effects.
In a standard collective decision-making model, the elderly parents and adult
children jointly determine the elderly living arrangement (Hoerger et al., 1996).
However, as we cannot observe the behavior of adult children, we model the decision
of the elderly as a choice between living independently and cohabiting with adult
children.6 For each type of living arrangement, we assume a separate utility function,
which depends on consumption, autonomy, health care, household services, housing,
interaction with children, etc. Following Costa (1997), we think of the elderly as
solving a utility maximization problem in two stages. First, for each type of living
arrangement, the elderly choose the optimal bundle of goods and services ( ),
yielding an indirect utility. Second, the elderly choose the living arrangement which
yields higher indirect utility.
Let and be the indirect utility functions
corresponding to independent living and coresidence, respectively, as denoted by the 5 The replacement rate from the NRPS is lower than those in most OECD countries, which range from
20 to 40 percent and have a cross-country average of around 30 percent (Cai et al., 2012). 6 We do not consider the choice to live in a nursing home, because it is rare in rural China.

9
superscripts ( and ), where indicates the price of the bundle; Y is income, which
may include both the income of the elderly and the income of their adult children in
an altruistic model, or just the income of the elderly in an exchange model (Cox, 1987;
Costa, 1997); Z represents a vector of exogenous variables affecting preferences, i.e.,
taste shifters such as education, health, age, and marital status. The elderly will decide
to live independently if
(1)
An increase in pension income may expand the budget constraint of the elderly,
and affects the optimal choice for the living arrangement. Such changes in elderly
living arrangement associated with income may reveal their preferences towards
independence or coresidence (Edmonds et al., 2005). If independent living is normal,
an increase in pension income will lead to an increase in the demand for independent
living.
Besides the income effect, other factors can also influence the living arrangement
as well as the relationship between income and living arrangement. The elderly may
benefit from intergenerational coresidence through reduced unit living costs, more
efficient informal care provided by adult children, and increased emotional comfort;
while living independently is associated with a gain of privacy and increased
independence. The tradeoff between independence and coresidence is subject to many
factors, such as proximity to their adult children, financial capacity, long-term care
needs, and the privacy preference of the elderly. Therefore, based on equation (1), we
hypothesize that the pension effects may operate in a heterogeneous manner. We
consider four possible sources of heterogeneity.
The first source is access to their adult children. Adult children are the main
providers of unpaid informal care and household services for the elderly in addition to
themselves and their spouses. When the elderly and informal caregivers live in the
same household, the shadow price of informal caregiving time is lower due to reduced
travel costs; unit living costs are also reduced due to economies of scale (i.e.,
). The price vector for independent living is not fixed, but is a function

10
of the elderly’s access to their adult children, e.g., the geographic proximity of their
adult children. The closer adult children are, the smaller the price vector is. When
pension income is small, as in the case of the NRPS, the decision of the elderly to live
independently might be more sensitive when they have adult children living nearby.
The second source is financial capacity and financial concern. The most
preferred bundle of goods and services, denoted by , can be purchased in the market,
provided by adult children, or provided by the elderly themselves and their spouses.
As pension income rises, the elderly will replace less costly alternatives with
higher-priced ones. For example, the elderly may transfer resources to adult children
for more goods and services otherwise provided by themselves, leading to an increase
in cohabitation; or they may substitute away from goods or services provided by
themselves or adult children, choosing market alternatives, which may be associated
with an increase in independent living. As pension income of the elderly increases,
which income effect is dominant may depend on the family’s initial financial
resources ( ).
The third source is long-term care needs, mainly based on the physical and
mental health status of the elderly (included in ). Because China’s long-term care
system is underdeveloped, especially in rural areas, most long-term care is provided
informally by unpaid spouses, adult children, or hired help. The elderly with more
need for informal care will gain more utility from coresidence. As the income of the
elderly increases, potential substitutions among these three sources of informal care
(spouse, adult children, and hired help) lead to different choices of optimal
consumption bundle and optimal living arrangement. Thus, the income effect on the
elderly living arrangement may vary with health status and marital status (related to
the source of informal care).
The last source is the preference for privacy, also included in . People have a
desire for privacy and autonomy, other things being equal (Ermisch, 1981; Hoerger et
al., 1996; Engelhardt et al., 2005). Elderly living in an intergenerational household
may not only lose their autonomy to some degree in their choice of consumption
bundles, but also suffer a loss of privacy due to limited living space. We hypothesize

11
that the more educated the elderly are, the stronger is their preference for privacy and
autonomy.
4. Empirical Strategy
To investigate the impact of pension income from the NRPS on living
arrangements of the elderly, we estimate the following model using two-wave panel
data:
(2)
where i and t index individuals and year, respectively. denotes the living
arrangement choice of the elderly i in period t. has two measures: one is
an indicator variable for whether the elderly i participated in the NRPS at time t, and
the other is a continuous variable measuring pension benefits the elderly i received at
time t. The vector contains observed household and individual characteristics,
while represents an unobserved household or individual characteristic that is fixed
across t. is a wave effect. Finally, is a disturbance term.
The coefficient of is our main interest. However, pension income
from the NRPS can be endogenous, since the enrollment in the NRPS is voluntary,
and the OLS estimates may suffer from selection bias. The rural elderly in our sample
(aged 65 to 84 years) can directly receive basic pension benefits without contributing,
conditional on the enrollment of their adult children, and may be allowed to pay a
lump sum to cover shortfalls in vesting contributions in some places. The pensioners
and non-pensioners may differ in their adult children’s unobserved behavior,
household preference, family ideology, etc.
For example, the elderly’s living arrangements may be determined partly by
migration decisions of their adult children, which are unobserved in our data. In
particular, when the migration probability of the adult children is high, it will be
natural to observe a high proportion of independent living and a low take-up rate of
the NRPS by the elderly, due to the low motivation of their adult children to enroll in

12
a local pension program. Moreover, filial piety has been a central value of traditional
Chinese culture and has continued to help maintain family care for the elderly despite
substantial economic development and social change. Adult children with strong
belief in filial piety may be more likely to enroll their parents in the NRPS;
meanwhile, they may tend to live with their parents to provide family support. In both
scenarios, the OLS estimate will underestimate the income effect on independent
living because of bias from omitted variables.
We deal with the endogeneity of in the following ways. First, we
control for a rich set of individual and household characteristics, including family
financial resources, characteristics of children, health, and demographic variables. A
wave dummy is also included to control for any non-parametric change of elderly
living arrangement through time. Second, we control for time-invariant unobserved
heterogeneity at the county (program), household, and individual levels, using fixed
effects (FE) specifications. Third, we use instrumental variable techniques to estimate
the FE model and to correct for the remaining bias due to time-variant unobservables.
Thus, our main empirical strategy is FE with instrumental variable correction
(FE-IV).
We use the exogenous time variation of the NRPS implementation at the county
level as the instrument for the individual’s enrollment status and pension income. A
continuous variable is created to measure the length of program duration in a county
at time of survey. The underlying idea is that the timing of starting the NRPS at the
county level was mainly decided by the central and provincial governments, and
should be uncorrelated with an individual’s choice of living arrangement and his
unobserved characteristics. As the NRPS currently operates on a local basis, only
registered rural residents in the project counties are eligible for the program, so
migration for the NRPS is not an issue. Thus, individual pension status and pension
income should be highly correlated with the introduction and the duration of the
NRPS at the county level. In fact, measured in wave 2011/12, the NRPS enrollment
rate among the rural elderly was 39 percent, 20 percent, and 11 percent for counties
starting the NRPS in 2009, 2010, and 2011 in our sample, respectively. Though we

13
have only one instrument and the model is just identified, we conduct several
empirical checks on the validity of the identification assumptions of our FE-IV model
in section 6.
5. Data and Variables
5.1 The Chinese Longitudinal Healthy Longevity Survey
Our data come from the Chinese Longitudinal Healthy Longevity Survey
(CLHLS) administered by the Center for Healthy Aging and Development Studies at
Peking University and co-sponsored by the National Institute on Aging of the United
States. This survey was first conducted in 1998 with a focus on the oldest-old, aged
80 and above. The follow-up waves, with replacement sample for deceased elderly,
were conducted in 2000, 2002, 2005, 2008/09, and 2011/12.7 Beginning in 2002,
younger elderly aged 65–79 have been added to the survey. The CLHLS randomly
selected half of the counties and cities in 22 of the 31 provinces in China.8 The
survey combines an in-house interview and a basic physical examination. It contains
extensive information on individual and household characteristics: living
arrangements, social and family support, socioeconomic conditions, health status,
disability measurement, demographic variables, etc. The CLHLS is a high-quality
data set with low non-response rate. Full details of the sampling design, response rates,
and data quality assessment are described in Zeng et al. (2001), Zeng and Gu (2008),
and Gu (2008).
In this study, we mainly use the two most recent waves of the CLHLS data
(2008/09 and 2011/12) and focus on the sample of the young-old (65–74) and the
middle-old (75–84) in rural China.9 We exclude approximately 2.7 percent of
respondents with missing values for pension status, 14.8 percent of respondents who
7 The CLHLS was conducted from May 2008 through April 2009 for wave 2008/09, and from July
2011 through September 2012 for wave 2011/12. 8 The sample provinces include 7 eastern provinces, 3 northeastern provinces, 8 central provinces, and
4 western provinces, which host approximately 85% of China’s total population. 9 We do not include the oldest-old sample in the main analysis, because the oldest-old population is not
the focus of the existing literature (besides, there are few oldest-old observations in many studies), and
their living arrangement may be dictated by health care need instead of economic concerns. Thus, we
only use the oldest-old sample as an additional check for the channel of long-term care needs
underlying the income effects on elderly living arrangement in section 6.4.

14
had a retirement pension, private pension, or other social pension during the period
2008/09–2011/12, and less than 1 percent of respondents residing in elderly centers or
nursing homes. These restrictions result in a sample of 2,627 rural respondents who
(or whose close family members) had been interviewed in wave 2008/09. Of these,
485 respondents (18.5 percent) died before the 2011/12 survey, and 316 (12 percent)
were lost to follow-up (we return to the attrition issues in Section 7). The remaining
1,826 respondents form the main sample for our analysis. This has given us a
balanced panel of 3,652 person-year observations in 535 counties.
5.2 Dependent variable
Following the previous literature, we define dependent variables measuring
whether the respondent is living independently or with others. Based on the
residential setting and household composition of the respondents, we consider the
elderly living alone or living with a spouse to be living independently; we also treat
the elderly who live with parents/in-laws or with children under age 1510
as living
independently. Reference persons living in an extended family, such as living with
adult children, siblings, relatives, or other adults, are defined as coresidents.11
Figure 1 presents the change of living arrangement of rural elderly based on the
CLHLS data from 1998 to 2011/12 with adjustment of the sampling weights.
Consistent with the literature (Cai et al., 2012), independent living among rural
elderly had increased for the young-old (age 65–74), the middle-old (age 75–84), and
the oldest-old (age 85 and above). Over half of the rural elderly aged 65–84 lived
independently in wave 2011/12. As age increases, the elderly were more likely to
reside with adult children or others.
-----Figure 1-------
5.3 The NRPS status and individual pension income
10
Among those we classify as independent living, 1 person-year observations (0.03 percent of the
study sample) lived with parents/in-laws, and 19 person-year observations (0.52 percent of the study
sample) lived with children under age 15. 11
We exclude institutionalized individuals because they account for less than 1 percent of the study
sample. The results are very similar when we include them, no matter whether they are classified as
living with others or as living independently.

15
The key independent variables include a dichotomous measure indicating
individual participation in the NRPS and a continuous variable measuring the NRPS
benefit. The CLHLS did not gather the information on the NRPS at the individual or
county levels directly, but asked the respondents whether they were covered by a
retirement pension, social pension, or private pension in waves 2008/09 and 2011/12.
As the NRPS was implemented in rural areas beginning in 2009, those respondents
who reported no social pension in wave 2008/09 but having social pension in wave
2011/12 are considered as the NRPS pensioners. In wave 2011/12, 419 respondents
(about 23 percent) participated in the NRPS, and received an average 130 Chinese
yuan pension income per month.
We use an instrumental variable approach to address the endogeneity of pension
income associated with the NRPS enrollment decision. Since we know the exact
location information for the sample counties, combined with the lists of the NRPS
pilot counties authorized by China’s central and provincial governments in 2009 and
2010, we are able to determine whether and when each sample county in the CLHLS
implemented the NRPS. Among the 535 sample counties, 77 (14 percent) belong to
the first-wave pilot counties that implemented the program in 2009; 127 (24 percent)
belong to the second-wave pilot counties in 2010;12
and the remaining 331 counties
were gradually exposed to the program in 2011. Thus, we construct a continuous
variable measuring the duration of NRPS implementation at county level at time of
survey, using interview dates of the respondents from the CLHLS and dates of
program initiation from the pilot lists.13
By this construction, this instrument is
exogenous and independent of other factors that affect the living arrangement of the
elderly at the individual and the household level.
5.4 Other explanatory variables and descriptive statistics
We control for other factors that may affect the living arrangement of the elderly,
such as family financial resources, characteristics of the children, health, and 12
The exposed rates are consistent with national data, which were 15% in 2009 and 26% in 2010. 13
We do not know the exact dates of program initiation for each county. As the government made
announcements about the first two waves of pilots on 31st September 2009 and 30th September 2010,
respectively, we assume that it was October 2009 for the first pilot counties, October 2010 for the
second pilot counties. The third wave of pilots rolled out in July 2011.

16
socio-demographic variables of the elderly.
To investigate the impact of kin availability on independent living, we include
the number of adult children alive at interview.
For the elderly, we include two binary variables to measure their financial
resources: one indicator for financial independence, and another indicator for
homeownership.
Health variables include instrumented activities of daily living (IADL) and
cognitive functions. The survey questions about IADL and cognitive functions are
based on an international standard questionnaire adapted to the Chinese culture and
social context with careful pilot testing (Zeng et al., 2002). Specifically, we use a
binary variable indicating whether the respondent can finish eight daily activities
without assistance, including visiting the neighbors, doing shopping, cooking a meal,
washing clothes, walking continuously for 1 kilometer, lifting a weight of 5 kilograms,
continuously crouching and standing up three times, and taking public transportation.
It is coded 1 if no restriction in these activities was reported and 0 otherwise.
Following the literature (Crum et al., 1993; Folstein et al., 1975), we use the
Mini-Mental State Examination (MMSE) to detect cognitive impairment of the elderly.
The MMSE in the CLHLS includes five dimensions: orientation, reaction, calculation,
recall, and language, with a total score ranging from 0 to 30. A score of 24 and lower
indicates some degree of cognitive impairment.
Other variables of the elderly include years of schooling, occupational category
before age 60 (1 = had a white-collar job, i.e., professional, managerial, or
administrative), age, age squared, gender, ethnicity (1 = Han Chinese; 0 = ethnic
minorities),14
and marital status (1 = married).
-----Table 1-------
In Table 1, among the comparison group who had no pension in either wave, the
proportion living independently declined from 55 percent in wave 2008/09 to 50.9
14
Han Chinese is the majority ethnic group in China, and accounts for more than 90% of the total
population.

17
percent in wave 2011/12, partly due to aging. However, the percentage of the NRPS
pensioners who lived independently has increased slightly, from 51.8 percent to 52.7
percent, during the study period.
Standard t-tests indicate that there was no significant difference in living
arrangement and individual/household characteristics between the pensioners and
non-pensioners in wave 2008/09, except that the pensioners were more likely to be
Han Chinese, and to have a white-collar job before age 60. In addition, in wave
2011/12 the elderly pensioners were more likely to have better health status in terms
of IADL.
6. Main Results
6.1 First stage of the FE-IV model
As noted above, we estimate equation (2) and address the endogeneity of the
NRPS enrollment and pension income using the FE-IV approach.
Table 2 shows the first-stage results from the OLS estimation using
cross-sectional data from wave 2011/12 (columns (1) and (3)) as well as the FE
estimation using the panel sample (columns (2) and (4)). Robust standard errors are
clustered at the individual level.
-----Table 2-------
For all specifications, the coefficients of the NRPS duration at county level are
positive and significant at the 1 percent level. This suggests strong correlations
between the program duration and individual pension status and income, with a partial
F-statistic over 390 in the FE estimations. For one more month of implementation, the
likelihood that an elderly person participates in the NRPS increases by 2.1 percentage
points, and the individual pension incomes increase by 9.4 percent.
Moreover, we find that the elderly who were younger were more likely to enroll
in the NRPS. The OLS estimates show that health status and being Han Chinese are
both positively associated with pension income from the NRPS.
6.2 Results for the whole sample
Table 3 reports our results for the whole sample. Column (1) presents the FE

18
estimate of the intent-to-treat effect of the NRPS. A half-year duration of the NRPS
implementation increases the probability of independent living significantly, by 2.4
percentage points.
In columns (2) and (4), the FE results without instrumenting show that overall,
both the NRPS enrollment and pension income have positive but insignificant effects
on the probability of living independently for the rural elderly. After correcting for the
endogeneity bias using the FE-IV approach, the estimates of the NRPS enrollment in
column (3) and pension income in column (5) are both positive and significant at the
1% level, and of larger magnitude than the FE estimates.15
This shows that
participation in the NRPS has significantly increased the likelihood of the pensioners
living independently, by 17.8 percentage points. The coefficient on the log pension
income is 0.041, implying that a 100 percent increase in the monthly pension income
of the elderly raises the likelihood of independent living by 4.1 percentage points.
Consistent with our discussion in section 4, the downward bias is substantial in the FE
estimates that fail to address the endogeneity of the NRPS status and pension income.
Our findings are consistent with previous literatures on the United States (e.g.,
Engelhardt et al., 2005; Costa, 1997 and 1999) or urban China (Meng and Luo, 2008),
suggesting that independent living is a normal good in rural China.
To facilitate the comparison between our results and the ones in the literature, we
obtain an elasticity of coresidence with respect to pension income of −0.087
(=[−0.041]/[1−0.528]) for rural elderly when evaluated at the sample mean. This is
larger than those of Meng and Luo (2008); they find an elasticity of −0.018 to −0.037
for urban elderly in China. The difference may not reflect that the rural elderly
respond more elastically to pension income in their living arrangement decisions, but
instead result from the downward bias in the estimates of Meng and Luo (2008),
which does not address the endogeneity problem.
Moreover, our estimated elasticity of coresidence with respect to pensions is
15
Our FE-IV estimate of the coefficient β1 identifies the average causal effect of pension income for a
subgroup of compliers, viz., those rural elderly who are induced by the NRPS implementation to
change their pension status or pension income. Thus, we interpret the FE-IV estimate as a local average
treatment effect of pension income (Imbens and Angrist, 1994).

19
much lower than those found in the literature on the United States, e.g., an elasticity
of −0.77 in Costa (1997), and an elasticity of −0.4 in Engelhardt et al. (2005). One
explanation is that the pension income and the replacement rate from the NRPS are
very low compared to social security in the United States. The other potential
explanation is that living arrangement is multidimensional in China, and we will
discuss that in detail in a later subsection.
6.3 Validity of the Identification Assumption
To establish the causal relationship, our key identification assumption is that the
implementation timing of the NRPS at the county level is independent of the
time-varying factors in the error term of equation (2). This is a plausible assumption,
since the selection of pilot counties and the exact time of program initiation are both
beyond the control of individuals. However, there are still possibilities that the pilot
and non-pilot counties differ in some unobserved and time-varying characteristics
other than the NRPS, which are correlated with living arrangement of the elderly.
Thus we assess the validity of our empirical strategy in two ways.
First, in order for our FE-IV approach to be valid, this would require that
changes in elderly living arrangement should not be systematically related to other
time-varying omitted factors. For example, pilot and non-pilot counties may be
different with respect to return migration after the global financial crisis in 2008, or to
formal elderly care systems. To check this, we use the retired sample that has
retirement pensions. Since the retired sample was not ineligible for the NRPS but
shared the same county-level heterogeneity with our main study sample, we expect
that the NRPS program at county level would not have any effects on them. In
columns (1) and (2) of Table 4, the results show that the estimates are statistically
insignificant for the retired sample in both OLS and FE regressions. This falsification
test suggests that there is no other unobserved county-level heterogeneity that has
been changing over this study period and also associated with elderly living
arrangement in rural China.
-----Table 4-------
Second, it could also be the case that the rural elderly population targeted by the

20
NRPS in the pilot counties has had different living-arrangement dynamics from those
in the non-pilot counties before the introduction of the NRPS. To test for this, we
examine whether the elderly study sample in the 2009–2010 pilot counties and
non-pilot counties had different living arrangements before the NRPS, which started
in 2009. In column (3) of Table 4, the OLS estimates based on the 2008/09 data are
insignificant and have the wrong signs. In column (4), we carry out a placebo test and
assume that the (nonexistent) NRPS had been introduced in pilot counties during
2005–2008, and obtain the FE estimates of the NRPS effects using the 2005 and
2008/09 waves of data. The results also show no significant differences in living
arrangement between the elderly in pilot and non-pilot counties during the two waves
2005 and 2008/09.
Moreover, in Table 2, our IV passes the weak instrument test with high
significance level. Although we have to admit that the validity of the identification
assumption is fundamentally untestable, the above two experiments as well as the
institutional setup of the NRPS implementation provide strong evidence for the
validity of our FE-IV approach.
6.4 Heterogeneous Effects and Channels
Given the high degree of heterogeneity within the elderly rural population in
China, to understand better the linkage between pension and living arrangement, it
may not be sufficient to look only at the overall living arrangement pattern. Following
our conceptual framework, we investigate different mechanisms underlying the
decisions about elderly living arrangements by looking at heterogeneous effects with
respect to proximity of the adult children, financial capacity, long-term care needs,
and privacy concerns of the elderly. To do so, we divide the sample into different
subgroups according to the baseline characteristics. Each cell in Table 5 represents a
different regression and reports the parameter estimate for individual NRPS
enrollment (in columns (1) and (2)) or pension income (in columns (3) and (4)).
-----Table 5-------
Cai et al. (2012) show that more than half of the rural elderly who lived
independently had one or more adult children residing in the same village in 2003.

21
Therefore, in Panel 1, we examine the differential effects of pension income with
respect to the presence of adult children living nearby in the baseline wave.16
The
rationale is that the decision of the elderly to live independently might be more
sensitive to the pension income when they have easy access to their adult children.
Focusing on the elderly with their adult children in the same village, we find that the
results are stronger than those in Table 3; the FE-IV estimates on the NRPS
enrollment and pension income are 0.213 and 0.049, both significant at the 1% level
and of larger magnitude than the estimates for the whole sample. As a further check,
we also report the results for the elderly without nonresident adult children in the
same village. Consistent with our priors, the estimated coefficients on the NRPS
enrollment or pension income are either insignificant or only marginally significant in
FE-IV estimations.
Taken together, the findings in Panel 1 of Table 5 show that access to adult
children is an important factor for the elderly living arrangement. Most of the income
effect from the NRPS on the independence of rural elderly was concentrated among
those with adult children still residing in the same village. Our overall findings about
the increase in independent living among the pensioners in Table 3 do not necessarily
represent a collapse of family-based support for them, since the children in the same
village can still provide care for their parents (Lei et al., 2013).
In Panels 2 and 3, we examine subgroups by economic independence and
homeownership of the elderly. Both the FE estimates and the FE-IV estimates indicate
an insignificant effect of pension income on living arrangements for the elderly
without economic independence or having no homeownership. However, for the
elderly who are economically independent or own their homes, we find significant
positive effects, and the estimates imply that the elasticity of coresidence with respect
to pension income is around −0.15. A possible explanation is that due to the low level
of pension benefits, the rural elderly can hardly rely on the NRPS income alone to
16
In Panel 1, we divide the sample into two groups: with or without non-resident adult children in the
same village, based on the information in wave 2008/09. It should be noted that both groups include
those elderly with shared living arrangement in 2008/09, so the sum of sample sizes for the two groups
is bigger than our full sample size.

22
meet their preference of living arrangement. In situations where the elderly have more
financial capacity, additional income from the NRPS will be more likely to induce
them to live independently. Our finding provides evidence for the S-shaped
relationship between independent living and income suggested in the literature
(Michael et al., 1980; Costa, 1997), implying that the impact of an income rise on
independent living may be small at low income levels, become sizable at higher
income, and then decrease again. Our results belong to the first two parts of the
S-shaped relationship.
Panel 4 shows the estimates by education group. For the educated elderly, the
estimates indicate a significant increase in the likelihood of independent living, and
the implied elasticity of coresidence to pension income is −0.186. In contrast, we find
an insignificant effect for the illiterate elderly. This finding is consistent with
McGarry and Schoeni (2000), but appears inconsistent with Engelhardt et al. (2005),
which finds that the positive effect of social security on independent living is
concentrated among the lower-educated elderly in the United States. However, this
should not be surprising. One possible explanation is that more educated people may
have a stronger preference for privacy and autonomy, and thus display higher
sensitivity of independent living arrangement to pension income. Another explanation
is that the elderly population in rural China has much lower education level than those
in the United States. Over half of the elderly sample had no education (defined as
being illiterate in our study), while those with a high school education or less account
for about 48 percent of the sample, classified as the less educated elderly by
Engelhardt et al. (2005).
Panels 5 and 6 investigate the channel of long-term care needs by examining
whether pension income has differential effects for the elderly by marital and health
status. In Panel 5, the FE-IV results suggest that neither the NRPS enrollment nor the
amount of pension benefits has significant effects on the likelihood of living
independently for the widowed, while both have positive and significant effects for
the married couples. We posit that married couples may be less reliant on adult
children for informal care and social interaction than the widowed, and thus be more

23
likely to live independently. This finding is inconsistent with the literature on the
United States (Engelhardt et al., 2005; Costa, 1997). Those authors suggest that
compared to married couples, widowed elderly have limited income sources, and their
decisions with respect to living independently are more sensitive to pension income.
Now we turn to the estimates based on health status in Panel 6. For the group
with no IADL limitation, the FE-IV estimates are positive and significant at the 1%
level. Thus, for the elderly with no old-age disability, the likelihood of living
independently has increased due to the NRPS take-up, and the estimated elasticity of
coresidence to monthly pension benefits is −0.135. However, among those with IADL
limitation, we find that the estimates are negative and statistically insignificant,
indicating no effect for the elderly with old-age disability.
The two different patterns reflect that the two channels of privacy concern and
long-term care needs, through which the NRPS may affect elderly independent living,
work in opposite directions. As there is no publicly provided home care in rural China,
health status of the elderly is an important determinant of which of these two
channels is likely to dominate.
As a further check, we also estimate the effect of pension income separately for
the oldest-old (age 85 and above), the oldest-old without IADL limitation, and the
oldest-old with IADL limitation.
In Table A2, we find that the estimates on the NRPS enrollment and pension
income are all negative and statistically insignificant for the full sample of the
oldest-old.
For the oldest-old without IADL limitation, the estimates are positive, but
insignificant and economically small. This finding is different from that in Panel 6 in
Table 5, suggesting that the income effect of the NRPS on privacy may be offset by its
income effect on support and care from adult children, especially for those with high
health needs. For those oldest-old with IADL limitation, the FE estimate shows a
significant (at the 10 percent level) negative effect of pension income on the
probability of independent living. It confirms our argument that while the dominant
motive is to meet long-term care needs, the elderly may be more likely to choose

24
coresidence as income increases.
7. Panel Attrition
A typical concern when using panel data is the attrition bias. As illustrated in the
data section, given the age and frailty of the sample, 18.5 percent of the baseline
sample died between surveys, and 12 percent were lost to follow-up in the 2011/12
survey. If attrition is not random, potential bias will arise.
Since the CLHLS collected some information, including social pension status, on
the deceased persons before their death by interviewing a close family member of
theirs in the 2011/12 survey, we can estimate the effects of the NRPS enrollment and
pension income on living arrangement of the deceased sample. The NRPS take-up
rate among the deceased sample in their last year of life was around 8.3 percent,
which is much lower than that among the survivors. In Table 6, we report the OLS
and IV estimates of equation (2) for the deceased sample. After controlling for
individual characteristics and regional effects in wave 2008 as well as in their last
year of life, we find that neither the NRPS enrollment nor pension income has a
significant effect for the deceased sample.
-----Table 6-------
We additionally address the concern of potential attrition bias due to loss of
follow-up in two ways. First, we test for selective attrition due to observables by
investigating whether those lost to follow-up (i.e., attritors) differ in baseline outcome
and characteristics from the follow-up sample (i.e., non-attritors). At first look, the
descriptive statistics in Appendix Table A3 shows that the attritors are more likely to
live independently than the non-attritors, and the two groups differ in several
observed individual characteristics, such as age, homeownership, number of living
children, and health status.
To formally test for attrition bias due to observables, we follow Becketti et al.
(1988) and Ding and Lehrer (2010), and regress the baseline living arrangement on
baseline individual characteristics and their interactions with a binary indicator for
attrition, using the full sample of wave 2008/09:

25
0 1 2 3i i i i i iY Attrition Attrition X X u (3)
where is an indicator for loss to follow-up in wave 2011/12, and all other
variables are defined as before. If and are jointly significant, selection on
observables would be a problem. As shown in Table 7, we find that the estimated
coefficients of the attrition indicator and its interaction terms are both individually and
jointly insignificant. It implies that the attritors are not systematically different from
the non-attritors in terms of their baseline characteristics and behavioral relationship,
and suggests that attrition due to observables can be safely ignored.17
Moreover, in the FE framework of our main analysis, we also mitigate the concern
regarding attrition due to unobservables that are time-invariant.
8. Conclusion
This paper has examined the impact of pension income from the NRPS on living
arrangement of the elderly aged 65 to 84 in rural China. Taking advantage of the time
variation of the NRPS implementation at county level, we employ the FE-IV
approach to identify the causal effect of pension income, and conduct several
empirical tests to check the validity of our identification assumptions.
The overall results suggest that the NRPS enrollment or pension income has
significantly increased independent living of the rural elderly, suggesting that
independent living is normal in China. A 100% increase in pension income would lead
to a 4.1 percentage point increase in the likelihood of independent living, with an
implied income elasticity of coresidence at −0.087. This finding is striking, given the
traditional norms regarding intergenerational coresidence in rural China and limited
income from the NRPS. It highlights the important contribution of the rising income
to the remarkable decline in coresidence with their adult children by both urban and
rural elderly in China during the past three decades (Zeng and Wang, 2003; Benjamin
et al., 2000; Palmer and Deng, 2008; Cai et al., 2012).
17
Gu (2008) state that the proportion lost to follow-up between waves of the CLHLS is low relative to
those of some panel surveys of older persons conducted in Western countries (e.g., Mihelic and
Crimmins, 1997).

26
Further, we explore several mechanisms behind the impact of pension income on
elderly living arrangement. In particular, we investigate the effect heterogeneity
across a range of important observed characteristics, such as access to their adult
children, financial status, education level, marital status, and health of the elderly.
These heterogeneity findings provide evidence that independent living has multiple
dimensions in China, and help to reconcile mixed findings in the literature.
We find that the positive income effects on independent living are concentrated
among the elderly with easy access to their adult children, while there are modest or
no effects for those without adult children living nearby. It suggests that the increase
in independence among the pensioners does not represent a collapse of the
family-based support tradition in rural China, since the nearby children can still easily
provide informal care (Lei et al., 2013).
Our study finds that there is a significant positive effect of pension income for
the elderly with economic independence or homeownership, but not for those without
economic independence or homeownership. It indicates that financial capacity is an
important factor behind the causal link between pension income and elderly living
arrangement in China.
We also show that the educated elderly are more likely to live independently
after they receive the NRPS income, while that is not the case for the illiterate elderly.
We interpret this finding as evidence that privacy is a valued good, and educated
people have stronger privacy preference.
Besides the privacy preference documented in the literature, our research
suggests that long-term care need is another important dimension of elderly living
arrangement. The results show that pension income positively and significantly
increases the probability of independent living for the married elderly or those with
better health status, but not for the widowed elderly or those with worse health status.
This reflects the fact that family members, especially adult children, are the main
providers of informal long-term care for the elderly in rural China.
Though our results do not speak directly to whether the NRPS would improve
the welfare of the elderly or not through living arrangement, our study is an important

27
step to such welfare evaluation. Despite general belief that intergenerational
coresidence may provide old-age security for the elderly, the existing serious studies
have produced mixed results. For example, Kochar (2000) shows that parents can
benefit from coresidence by reducing labor supply, while Johar and Maruyama (2014)
find that coresidence has a negative effect on health outcome of the elderly. More
work should investigate this issue further, and the heterogeneity highlighted in this
paper is probably one of the reasons for the mixed results.
Moreover, our findings provide important policy information on the development
of elderly care systems and social pension programs in China as well as in other
developing countries.
References
Barrientos, Armando. 2009. “Social Pensions in Low-Income Countries.” In Closing
the Coverage Gap: The Role of Social Pensions and Other Retirement Income
Transfers, ed. Robert Holzmann, David Robalino, and Noriyuki Takayama, 73–84.
Washington, DC: The World Bank.
Becketti, Sean, William Gould, Lee Lillard, and Finis Welch. 1988. “The Panel Study
of Income Dynamics after Fourteen Years: An Evaluation.” Journal of Labor
Economics 6(4):472–92.
Benjamin, Dwayne, Loren Brandt, and Scott Rozelle. 2000. “Aging, Well-being, and
Social Security in Rural Northern China.” Population and Development
Review 26:89–116.
Bethencourt Carlos, and José-Víctor Ríos-Rull. 2009. “On the Living Arrangements
of Elderly Widows.” International Economic Review 50(3):773–801.
Cai, Fang, John Giles, and Dewen Wang. 2009. “The Well-being of China’s Rural
Elderly.” Background Paper for East Asia Social Protection Team. Washington
DC: World Bank.
Cai, Fang, John Giles, Philip O'Keefe, and Dewen Wang. 2012. The Elderly and Old
Age Support in Rural China: Challenges and Prospects. Washington DC: World

28
Bank.
Costa, Dora L. 1997. “Displacing the Family: Union Army Pensions and Elderly
Living Arrangements.” Journal of Political Economy 105(6):1269–92.
Costa, Dora L. 1999. “A House of Her Own: Old Age Assistance and the Living
Arrangements of Older Nonmarried Women.” Journal of Public Economics
72(1):39–59.
Cox, Donald. 1987. “Motives for Private Income Transfers.” Journal of Political
Economy 95(3):508–46.
Crum, Rosa M., James C. Anthony, Susan S. Bassett, and Marshal F. Folstein. 1993.
“Population-Based Norms for the Mini-Mental State Examination by Age and
Educational Level.” The Journal of the American Medical Association
269(18):2386–91.
Ding, Weili, and Steven F. Lehrer. 2010. “Estimating Treatment Effects from
Contaminated Multiperiod Education Experiments: The Dynamic Impacts of
Class Size Reductions.” The Review of Economics and Statistics 92(1): 31–42.
Dostie, Benoit, and Pierre Thomas Léger. 2005. “The Living Arrangement Dynamics
of Sick, Elderly Individuals.” Journal of Human Resources 40(4):989–1014.
Edmonds, Eric V., Kristin Mammen, Douglas L. Miller. 2005. “Rearranging the
Family? Income Support and Elderly Living Arrangements in a Low Income
Country.” Journal of Human Resources, 40(1): 186–207.
Engelhardt, Gary V., Jonathan Gruber, and Cynthia D. Perry. 2005. “Social Security
and Elderly Living Arrangements: Evidence from the Social Security Notch.”
The Journal of Human Resources 40(2): 354–72.
Ermisch, John F. 1981. "An Economic Theory of Household Formation: Theory and
Evidence from the General Household Survey." Scottish Journal of Political
Economy 28(1): 1–19.
Folstein, Marshal F., Susan E. Folstein, and Paul R. McHugh. 1975. “Mini-Mental
State: A Practical Method for Grading the Cognitive State of Patients for the
Clinician.” Journal of Psychiatric Research 12(3):189–98.
Giles, John, Dewen Wang, and Changbao Zhao. 2010. “Can China’s Rural Elderly

29
Count on Support from Adult Children? Implications of Rural-to-Urban
Migration.” Journal of Population Ageing 3 (3–4): 183–204.
Gu, Danan. 2008. “General Data Quality Assessment of the CLHLS.” In Healthy
Longevity in China, ed. Zeng Yi, Dudley L. Poston, Denese Ashbaugh Vlosky
and Danan Gu, 39-60. Dordrecht, the Neitherlands: Springer.
Hoerger, Thomas J, Gabriel A. Picone, and Frank A. Sloan. 1996. “Public Subsidies,
Private Provision of Care and Living Arrangements of the Elderly.” The Review
of Economics and Statistics 78(3): 428–40.
Imbens, Guido W., and Joshua D. Angrist. 1994. “Identification and Estimation of
Local Average Treatment Effects.” Econometrica 62(2):467–75.
Johar, Meliyanni, and Shiko Maruyama. 2014. “Does Coresidence Improve an Elderly
Parent’s Health?” Journal of Applied Econometrics 29(6): 965–83.
Kakwani, Nanak, and Kalanidhi Subbarao. 2005. “Aging and Poverty in Africa and
the Role of Social Pensions.” Social Protection Discussion Paper 521. Washington,
DC: The World Bank.
Kochar, Anjini. 2000. “Parental benefits from intergenerational coresidence:
empirical evidence from rural Pakistan.” Journal of Political Economy 108(6):
1184–1209.
Lei, Xiaoyan, John Strauss, Meng Tian, and Yaohui Zhao. 2013. “Living Arrangement
of the Elderly in China: Evidence from the CHARLS National Baseline.” Texas
A&M University. Unpublished.
Li, Bingqin. 2007. ‘‘Pension reform in China – who are left out?’’ In New
Perspectives on China and Aging, ed. Ian G. Cook and Jason Powell, 29–48.
New York: NOVA Science Publishers.
Little, Roderick J. A., and Donald B. Rubin. 1987. Statistical Analysis with Missing
Data. New York: John Wiley & Sons.
Manacorda, Marco, and Enrico Moretti. 2006. “Why Do Most Italian Youths Live
with Their Parents? Intergenerational Transfers and Household Structure.”
Journal of the European Economic Association, 4(4): 800–29.

30
McGarry, Kathleen, and Robert F. Schoeni. 2000. “Social Security, Economic Growth,
and the Rise in Elderly Widows’ Independence in the Twentieth Century.”
Demography 37(2): 221–36.
Meng, Xin, and Chuliang Luo. 2008. “What Determines Living Arrangements of the
Elderly in Urban China.” In Inequality and Public Policy in China, ed. Björn A.
Gustafsson, Shi Li and Terry Sicular, 267–86. Cambridge: Cambridge University
Press.
Michael, Robert T., Victor R. Fuchs, and Sharon R. Scott. 1980. ‘‘Changes in the
Propensity to Live Alone, 1950–1976.’’ Demography 17(1): 39–56.
Mihelic, Adrienne H., and Eileen M. Crimmins. 1997. “Loss to Follow-up in a
Sample of Americans 70 Years of Age and Older: The LSOA 1984–1990.” The
Journals of Gerontology Series B: Psychological Sciences and Social Sciences
52B(1): S37–48.
Palacios, Robert, and Oleksiy Sluchynsky. 2006. “Social Pensions Part I: Their Role
in the Overall Pension System.” Social Protection Discussion Paper 36237.
Washington, DC: World Bank.
Palmer, E., and Q Deng. 2008. “What Has Economic Transition Meant for the
Well-being of the Elderly in China.” In Inequality and Public Policy in China, ed.
Björn A. Gustafsson, Shi Li and Terry Sicular, 182–203. Cambridge: Cambridge
University Press.
Park, Albert, Yan Shen, John Strauss, and Yaohui Zhao. 2012. “Relying on Whom?
Poverty and Consumption Financing of China’s Elderly.” In Aging in Asia
Findings from New and Emerging Data Initiatives, ed. James P. Smith and Malay
Majmundar, Washington DC: National Academies Press.
Pezzin, Liliana E., Peter Kemper, and James Reschovsky. 1996. “Does Publicly
Provided Home Care Substitute for Family Care? Experimental Evidence with
Endogenous Living Arrangements. ” The Journal of Human Resources 31(3):
650–76.
Shen, Ce, and John B. Williamson. 2010. “China’s New Rural Pension Scheme: Can it
be Improved?” International Journal of Sociology and Social Policy 30(5/6):

31
239–50.
Shi, Shih-Jiunn. 2006. “Left to Market and Family – Again? Ideas and the
Development of the Rural Pension Policy in China.’’ Social Policy and
Administration 40(7):791–806.
Zeng, Yi, James W. Vaupel, Zhengyu Xiao, Chunyuan Zhang, and Yuzhi Liu. 2001.
“The Healthy Longevity Survey and the Active Life Expectancy of the Oldest
Old in China.’’ Population: An English Selection 13(1): 95–116.
Zeng, Yi, James W. Vaupel, Zhengyu Xiao, Chunyuan Zhang, and Yuzhi Liu. 2002.
“Sociodemographic and Health Profiles of the Oldest Old in China.’’ Population
and Development Review 28(2): 251–73.
Zeng, Yi. 2008. “Reliability of Age Reporting Among the Chinese Oldestold in the
CLHLS Data Sets.” In Healthy Longevity in China: Demographic,
Socioeconomic, and Psychological Dimensions, edited by Zeng Yi, Dudley L.
Poston, Denese Ashbaugh Vlosky, and Danan Gu, 61–78. Dordrecht, the
Netherlands: Springer Netherlands.
Zeng, Yi, and Zhenglian Wang. 2003. “Dynamics of Family and Elderly Living
Arrangements in China: New Lessons Learned from the 2000 census.” China
Review 3(2): 95–119.
Zhang, Wenjuan, and Dan Tang. 2008. “The New Rural Social Pension Insurance
Programme of Baoji City.” Gerontology Research Institute of Renmin University.
Unpublished.

32
Figure 1
Fraction of Elderly Living Independently in Rural China (adjusted for sampling weight)
Source: the CLHLS from 1998 to 2011/12.
0
0.1
0.2
0.3
0.4
0.5
0.6
1998 2000 2002 2004 2006 2008 2010 2012
65-74 75-84 85+

33
Table 1 Descriptive Statistics
Full sample
Wave 2008/09 (pre-reform) Wave 2011/12 (post-reform)
Treated Control Treated Control
Sample Size 3652 419 1407 419 1407
Independent living 0.528 0.518 0.550 0.527 0.509
(0.499) (0.500) (0.498) (0.500) (0.500)
Monthly pension income (yuan) 12.575 0.000 0.000 129.735* 0.000
(68.608) (0.000) (0.000) (182.881) (0.000)
Age 74.773 73.494 73.148 76.604 76.235
(5.159) (4.957) (4.908) (4.927) (4.924)
Male 0.489 0.506 0.483 0.506 0.483
(0.500) (0.501) (0.500) (0.501) (0.500)
Han 0.919 0.964*** 0.906 0.964*** 0.906
(0.273) (0.186) (0.293) (0.186) (0.293)
Married 0.569 0.599 0.595 0.570 0.533
(0.495) (0.491) (0.491) (0.496) (0.499)
Years of schooling 2.170 2.284 2.190 2.193 2.102
(2.886) (2.822) (2.923) (2.828) (2.883)
Economically independent 0.324 0.394 0.371 0.251 0.277
(0.468) (0.489) (0.483) (0.434) (0.448)
Owns an apartment 0.581 0.654 0.633 0.531 0.523
(0.493) (0.476) (0.482) (0.500) (0.500)
Had a white-collar job before age 60 0.016 0.026* 0.014 0.026* 0.014
(0.127) (0.160) (0.116) (0.160) (0.116)
Number of living children 4.280 4.341 4.278 4.295 4.259
(1.607) (1.574) (1.622) (1.566) (1.617)
No IADL limitation 0.619 0.714 0.697 0.575* 0.526
(0.486) (0.453) (0.460) (0.495) (0.500)
MMSE score 26.389 26.790 26.923 26.005 25.851
(5.169) (4.873) (4.427) (5.811) (5.659)
Program duration in the county
(months)
4.400 0.000 0.000 16.341*** 6.553
(7.915) (0.000) (0.000) (9.943) (7.810)
Note: t-test was applied for pairwise comparisons of the treated and control groups in each wave. *** p<0.01, **
p<0.05, * p<0.1.

34
Table 2 Estimation for the NRPS Enrollment Decision and Pension Income
Dependent variable Enrollment in the NRPS ln (pension income)
OLS using wave
2011/12
FE using panel
2008/09–2011/12
OLS using
wave 2011/12
FE using panel
2008/09–20011/12
(1) (2) (3) (4)
Program duration in the
county (months)
0.024*** 0.021*** 0.112*** 0.094***
(0.001) (0.001) (0.006) (0.005)
Age –0.008 –0.104* –0.196 –0.460**
(0.060) (0.053) (0.258) (0.228)
Age squared/100 0.007 0.054* 0.132 0.140
(0.039) (0.030) (0.169) (0.130)
Married 0.012 0.035 0.019 0.158
(0.020) (0.024) (0.090) (0.101)
Number of living children 0.003 –0.029 0.014 –0.092
(0.006) (0.026) (0.024) (0.100)
Economically independent –0.019 –0.018 –0.039 –0.069
(0.022) (0.016) (0.102) (0.070)
Owns an apartment 0.003 0.012 –0.009 0.059
(0.019) (0.015) (0.083) (0.065)
No IADL limitation 0.037* 0.004 0.171** 0.041
(0.019) (0.016) (0.085) (0.071)
MMSE score –0.001 –0.001 –0.001 –0.002
(0.002) (0.001) (0.006) (0.006)
Male 0.002 0.003
(0.020) (0.089)
Han 0.035 0.152*
(0.025) (0.088)
Had a white-collar job before
age 60
0.056 0.249
(0.088) (0.435)
Years of Schooling 0.001 0.008
(0.003) (0.016)
Wave 2011 0.124 0.856**
(0.082) (0.338)
Constant –0.271 4.848* 4.555 26.459**
(2.284) (2.630) (9.837) (11.165)
Province dummies Yes -- Yes --
Weak instrument test F=324.68*** F=429.71*** F=322.61*** F=394.80***
R-squared 0.341 0.389 0.365 0.381
Number of observations 1,554 3,580 1,498 3,511
Note: Robust standard error are reported in parentheses in columns (1) and (3), and clustered-robust standard
errors are reported in columns (2) and (4);* p<0.10, ** p<0.05, *** p<0.01.

35
Table 3 Effect of the NRPS on Independent Living for the Rural Elderly
Dependent variable: Independent living
FE FE FE-IV FE FE-IV
(1) (2) (3) (4) (5)
Program duration in the county
(months)
0.004***
(0.001)
NRPS enrollment 0.028 0.178***
(0.030) (0.069)
ln (pension income) 0.001 0.041***
(0.007) (0.016)
Age 0.189*** 0.205*** 0.207*** 0.226*** 0.227***
(0.072) (0.072) (0.072) (0.074) (0.075)
Age squared/100 −0.137*** –0.141*** –0.146*** –0.152*** –0.155***
(0.041) (0.041) (0.041) (0.042) (0.043)
Married 0.123*** 0.126*** 0.117*** 0.129*** 0.119***
(0.038) (0.038) (0.038) (0.038) (0.039)
Number of living children –0.014 –0.016 –0.009 –0.015 –0.009
(0.035) (0.035) (0.035) (0.036) (0.036)
Economically independent 0.011 0.009 0.014 0.012 0.018
(0.024) (0.024) (0.024) (0.025) (0.025)
Owns an apartment 0.194*** 0.190*** 0.192*** 0.190*** 0.192***
(0.024) (0.024) (0.024) (0.025) (0.025)
No IADL limitation 0.021 0.023 0.020 0.023 0.019
(0.021) (0.021) (0.021) (0.022) (0.022)
MMSE score 0.007*** 0.008*** 0.007*** 0.007*** 0.007***
(0.002) (0.002) (0.002) (0.002) (0.002)
Wave 2011 0.031 0.023 0.008 0.011 –0.016
(0.111) (0.111) (0.111) (0.116) (0.115)
Constant –6.240* –7.248** –8.184**
(3.532) (3.525) (3.658)
R-squared 0.078 0.075 0.061 0.076 0.058
Number of observations 3,556 3,556 3,520 3,489 3,386
Note: Clustered-robust standard errors are reported in parentheses;* p<0.10, ** p<0.05, *** p<0.01.

36
Table 4 Tests of the Validity of the Identification Assumption
Dependent variable: Independent living
Retired sample with other types of
social pension
Target sample before the
introduction of NRPS
2011/12 2008/09–2011/12 2008/09 2005–2008/09
OLS FE OLS FE
(1) (2) (3) (4)
Program duration in the
county
0.001 0.001
(0.001) (0.001)
Indicator of 2009–2010 pilot
counties
−0.019 –0.033
(0.021) (0.023)
Age 0.168 0.050 0.127*** 0.120*
(0.163) (0.132) (0.042) (0.064)
Age squared/100 –0.107 –0.067 –0.080*** –0.094**
(0.107) (0.079) (0.028) (0.038)
Married 0.171*** 0.043 0.155*** 0.140***
(0.054) (0.080) (0.018) (0.034)
Number of living children 0.006 0.012 0.025*** 0.017
(0.018) (0.037) (0.005) (0.012)
Economically independent 0.001 0.059 0.023 0.063***
(0.054) (0.041) (0.020) (0.023)
Owns an apartment 0.296*** 0.182*** 0.338*** 0.206***
(0.054) (0.044) (0.018) (0.022)
No IADL limitation –0.150*** –0.105** 0.027 0.029
(0.055) (0.047) (0.018) (0.021)
MMSE score 0.001 0.017*** –0.001 0.001
(0.006) (0.005) (0.001) (0.002)
Male –0.031 –0.001
(0.061) (0.018)
Han 0.121 0.154***
(0.162) (0.031)
Had a white-collar job before
age 60
0.066 –0.086
(0.077) (0.054)
Years of Schooling 0.002 –0.006*
(0.008) (0.003)
Wave 2011 0.162 0.135*
(0.193) (0.081)
Constant –6.289 –0.122 –5.068*** –3.599
(6.227) (6.281) (1.562) (2.934)
Province dummies Yes -- Yes --
R-squared 0.265 0.076 0.211 0.101
Observations 398 948 3,260 3,912
Note: Robust standard error are reported in parenthesis of column (1) and (3), and clustered-robust standard errors
are reported in columns (2) and (4); * p<0.10, ** p<0.05, *** p<0.01.

37
Table 5 Effects of the NRPS on Independent Living by Population Groups
Estimate on NRPS enrollment Estimate on ln(pension income) [mean]
Data FE FE-IV FE FE-IV
(1) (2) (3) (4) (5)
Panel 1. Subsamples by Presence of Nearby Children
Has children living nearby 0.052 0.213*** 0.007 0.049*** [0.479]
(0.032) (0.067) (0.008) (0.015)
Number of observations 3,159 3,126 3,098 3,004
Has no children living nearby 0.025 0.124 0.004 0.033* [0.144]
(0.037) (0.079) (0.009) (0.018)
Number of observations 1,923 1,908 1,885 1,832
Panel 2. Subsamples by Economic Independence
Economically independent 0.024 0.309*** –0.002 0.065*** [0.582]
(0.049) (0.114) (0.011) (0.025)
Number of observations 1,337 1,322 1,317 1,282
Economically dependent 0.026 0.068 0.001 0.017 [0.519]
(0.038) (0.086) (0.009) (0.020)
Number of observations 2,219 2,198 2,172 2,104
Panel 3. Subsamples by Homeownership
House owner
0.024 0.240** 0.002 0.050** [0.667]
(0.037) (0.096) (0.009) (0.021)
Number of observations 2,262 2,236 2,220 2,152
Not house owner 0.026 0.091 –0.002 0.026 [0.325]
(0.050) (0.093) (0.012) (0.022)
Number of observations 1,294 1,284 1,269 1,234
Panel 4. Subsamples by Education
Educated 0.055 0.380*** 0.007 0.085*** [0.543]
(0.044) (0.105) (0.011) (0.024)
Number of observations 1,702 1,682 1,668 1,614
Illiterate 0.004 –0.005 –0.005 0.000 [0.543]
(0.040) (0.094) (0.010) (0.022)
Number of observations 1,848 1,832 1,815 1,766
Panel 5. Subsamples by Marital Status
Married
0.006 0.201** –0.005 0.044** [0.618]
(0.039) (0.099) (0.009) (0.022)
Number of observations 2,151 2,132 2,113 2,056
Widowed 0.061 0.143 0.008 0.034 [0.432]
(0.047) (0.090) (0.011) (0.021)
Number of observations 1,405 1,388 1,376 1,330
Panel 6. Subsamples by Health Status
No IADL limitation 0.032 0.266*** 0.003 0.060*** [0.556]
(0.037) (0.083) (0.009) (0.018)
Number of observations 2,493 2,470 2,448 2,380
Have IADL limitation −0.001 –0.018 –0.011 –0.007 [0.512]
(0.049) (0.122) (0.012) (0.029)
Number of observations 1,063 1,050 1,041 1,006
Note:
(a) Cluster-robust standard errors are reported in parentheses; * p<0.10, ** p<0.05, *** p<0.01.
(b) Other control variables include age; age squared/100; marital status; number of living children; indicators of
being economically independent, owning an apartment, and no IADL limitation; MMSE score; and a wave
dummy.
(c) Baseline sample means of independent living for each subgroup are reported in the square brackets.

38
Table 6 Effect of the NRPS on Independent Living for the Deceased Sample
Dependent variable: Independent living
OLS 2SLS OLS 2SLS (1) (2) (3) (4)
NRPS enrollment in last year of life −0.039 0.213
(0.077) (0.422)
ln (pension income) in last year of life –0.004 0.042
(0.017) (0.099)
Age in last year of life 0.090 0.080 0.095 0.090
(0.139) (0.134) (0.139) (0.133)
Age squared/100 –0.061 –0.053 –0.064 –0.059
(0.089) (0.086) (0.089) (0.085)
Married in last year of life 0.207*** 0.206*** 0.209*** 0.210***
(0.050) (0.049) (0.050) (0.049)
Economically independent in last year
of life 0.138* 0.125 0.134* 0.121
(0.080) (0.082) (0.080) (0.084)
No ADL limitation in last year of life 0.087 0.090* 0.085 0.087
(0.054) (0.053) (0.054) (0.053)
MMSE score in wave 2008 –0.001 –0.001 –0.001 –0.001
(0.003) (0.003) (0.003) (0.003)
Number of living children in wave 2008 0.011 0.011 0.011 0.010
(0.013) (0.012) (0.013) (0.013)
Owns an apartment in wave 2008 0.146*** 0.148*** 0.148*** 0.151***
(0.050) (0.049) (0.050) (0.049)
Male 0.019 0.009 0.018 0.013
(0.050) (0.052) (0.050) (0.050) Han 0.139 0.139 0.139 0.141
(0.090) (0.086) (0.090) (0.086) Had a white-collar job before age 60 0.073 0.093 0.071 0.087
(0.170) (0.165) (0.170) (0.165) Years of schooling –0.011 –0.010 –0.012 –0.011
(0.010) (0.010) (0.010) (0.010) Constant –3.533 –3.374 –3.758 –3.767
(5.417) (5.196) (5.404) (5.157) Province dummies Yes Yes Yes Yes
R-squared 0.195 0.177 0.194 0.180 Number of observations 467 467 465 465
Note: Robust standard errors are reported in parentheses; * p<0.10, ** p<0.05, *** p<0.01.

39
Table 7 Difference between the Attrited and Non-Attrited Samples
Dependent variable: Independent living
Variables Coef. Robust S.E.
Age 0.007 (0.006)
Male −0.073 (0.064)
Han 0.589*** (0.123)
Married 0.402*** (0.064)
Years of schooling –0.022* (0.012)
Economically independent 0.019 (0.070)
Owns an apartment 0.777*** (0.063)
Had a white-collar job before age 60 –0.170 (0.215)
Number of living children 0.077*** (0.019)
No IADL limitation 0.064 (0.068)
MMSE score 0.000 (0.006)
Constant –1.996*** (0.644)
Attrition (loss to follow-up) –0.262 (1.777)
Attrition × age 0.010 (0.018)
Attrition × male 0.022 (0.203)
Attrition × Han 0.156 (0.417)
Attrition × married –0.052 (0.195)
Attrition × years of schooling –0.011 (0.041)
Attrition × log (household income per capita) 0.108 (0.223)
Attrition × economically independent 0.494** (0.215)
Attrition × owns an apartment 0.285 (0.749)
Attrition × had a white-collar job before age 60 –0.059 (0.060)
Attrition × number of living children 0.090 (0.201)
Attrition × no IADL limitation –0.021 (0.017)
Attrition × MMSE score 0.007 (0.006)
Attrition × province Dummies Yes
Province dummies Yes
Observations 2,568
F-statistic for test on the joint effect of attrition on:
constant and coefficient estimates F= 34.50 P= 0.304
all coefficient estimates but no constant F=32.11 P= 0.363
constant only F= 0.02 P=0.883
Note: Robust standard errors are reported in parentheses; * p<0.10, ** p<0.05, *** p<0.01.

40
APPENDIX
Table A1 Number of respondents
Main analysis Number
Excluded
Number
remaining
CLHLS 2008 16552
Restrict to rural respondents aged 65–84 13341 3211
Exclude respondents with missing values for social pension 88 3123
Exclude respondents with any other types of social pension 476 2647
Exclude respondents residing in elderly centers or nursing homes 20 2627
Respondents lost to follow-up in 2011/12 survey
316
Respondents deceased before 2011/12 survey
485
Participated in NRPS
40 (8.25%)
Did not participate in NRPS
445 (91.75%)
Respondents reinterviewed in 2011/12 survey
1826
Participated in NRPS 419 (22.95%)
Did not participate in NRPS 1407 (77.05%)

41
Table A2 Effect of the NRPS on Independent Living for the Oldest-Old
Dependent variable: NRPS enrollment Pension income
Data FE FE-IV FE FE-IV [mean]
(1) (2) (4) (5) (6)
The oldest-old (age 85 and above) –0.022 –0.036 –0.008 –0.011 [0.304]
(0.023) (0.055) (0.005) (0.012)
Number of observations 3,599 3,542 3,533 3,410
The oldest-old with no IADL limitation 0.018 0.003 0.005 0.009 [0.440]
(0.063) (0.145) (0.015) (0.031)
Number of observations 539 532 533 520
The oldest-old with IADL limitation –0.029 –0.048 –0.011* –0.017 [0.280]
(0.025) (0.059) (0.006) (0.013)
Number of observations 3,060 3,010 3,000 2,890
Note:
(a) Cluster-robust standard errors are reported in parentheses; * p<0.10, ** p<0.05, *** p<0.01.
(b) Other control variables include age; age squared/100; marital status; number of living children; indicators of
being economically independent, owning an apartment, and no IADL limitation; MMSE score; and a wave
dummy.
(c) Baseline sample means of independent living for each subgroup are reported in square brackets.
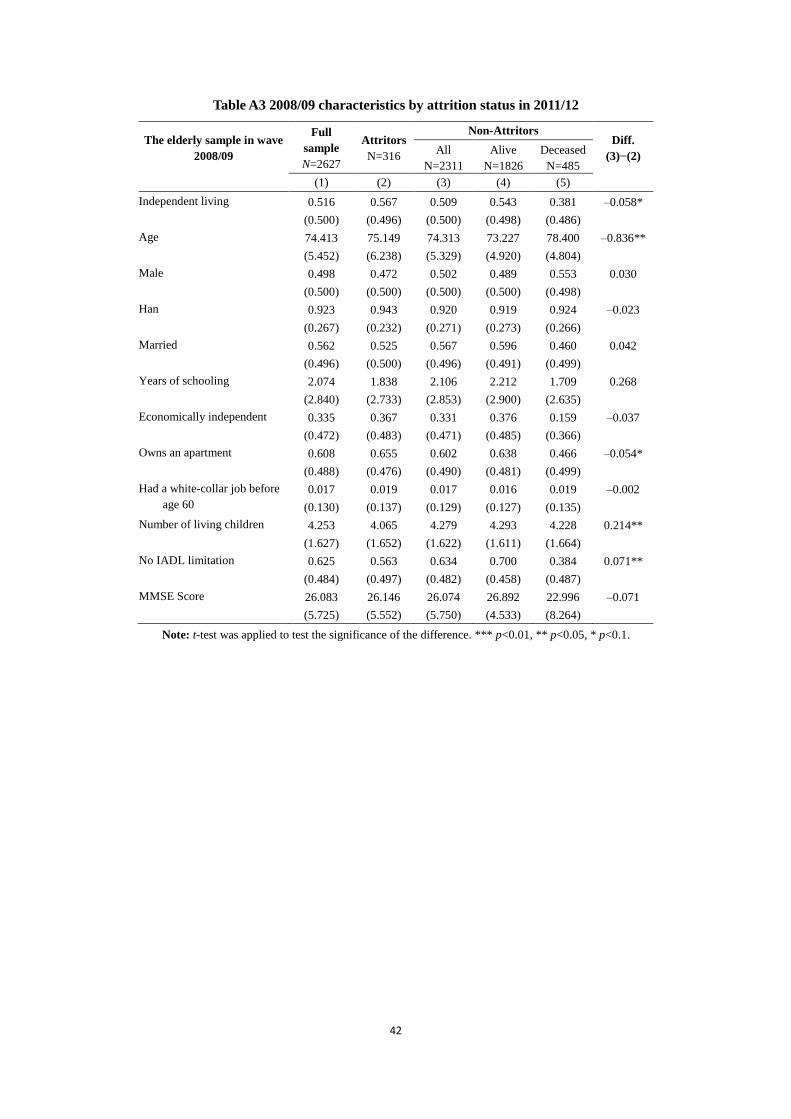
42
Table A3 2008/09 characteristics by attrition status in 2011/12
The elderly sample in wave
2008/09
Full
sample
N=2627
Attritors
N=316
Non-Attritors Diff.
(3)−(2) All
N=2311
Alive
N=1826
Deceased
N=485
(1) (2) (3) (4) (5)
Independent living 0.516 0.567 0.509 0.543 0.381 –0.058*
(0.500) (0.496) (0.500) (0.498) (0.486)
Age 74.413 75.149 74.313 73.227 78.400 –0.836**
(5.452) (6.238) (5.329) (4.920) (4.804)
Male 0.498 0.472 0.502 0.489 0.553 0.030
(0.500) (0.500) (0.500) (0.500) (0.498)
Han 0.923 0.943 0.920 0.919 0.924 –0.023
(0.267) (0.232) (0.271) (0.273) (0.266)
Married 0.562 0.525 0.567 0.596 0.460 0.042
(0.496) (0.500) (0.496) (0.491) (0.499)
Years of schooling 2.074 1.838 2.106 2.212 1.709 0.268
(2.840) (2.733) (2.853) (2.900) (2.635)
Economically independent 0.335 0.367 0.331 0.376 0.159 –0.037
(0.472) (0.483) (0.471) (0.485) (0.366)
Owns an apartment 0.608 0.655 0.602 0.638 0.466 –0.054*
(0.488) (0.476) (0.490) (0.481) (0.499)
Had a white-collar job before
age 60
0.017 0.019 0.017 0.016 0.019 –0.002
(0.130) (0.137) (0.129) (0.127) (0.135)
Number of living children 4.253 4.065 4.279 4.293 4.228 0.214**
(1.627) (1.652) (1.622) (1.611) (1.664)
No IADL limitation 0.625 0.563 0.634 0.700 0.384 0.071**
(0.484) (0.497) (0.482) (0.458) (0.487)
MMSE Score 26.083 26.146 26.074 26.892 22.996 –0.071
(5.725) (5.552) (5.750) (4.533) (8.264)
Note: t-test was applied to test the significance of the difference. *** p<0.01, ** p<0.05, * p<0.1.