the hartford financial services group principles, or gaap. information regarding these non-gaap and...
TRANSCRIPT

The Hartford Financial Services Group, Inc.
The Hartford Financial Services Group
Always thinking ahead.
Ramani AyerChairman and Chief Executive OfficerFebruary 14, 2006
2006 Merrill Lynch Insurance Investor Conference
The Hartford Financial Services Group, Inc.
Safe Harbor StatementCertain statements made in this presentation should be considered forward-looking statements as defined in the Private Securities Litigation Reform Act of 1995. These include statements about The Hartford’s future results of operations. We caution investors that these forward-looking statements are not guarantees of future performance, and actual results may differ materially. Investors should consider the important risks and uncertainties that may cause actual results to differ, including those discussed in The Hartford’s earnings press release issued on January 26, 2006, Form 8-K filed on January 26, 2006, Quarterly Report on Form 10-Q filed for the quarter ended September 30, 2005, Annual Report on Form 10-K filed for the year ended December 31, 2004 and other filings we make with the Securities and Exchange Commission. We assume no obligation to update this presentation, which speaks as of today’s date.
The discussion in this presentation of The Hartford’s financial performance includes financial measures that are not derived from generally accepted accounting principles, or GAAP. Information regarding these non-GAAP and other financial measures is provided in the Investor Financial Supplement for the fourth quarter of 2005, and in the Investor Relations section of The Hartford’s website at www.thehartford.com.
2

The Hartford Financial Services Group, Inc.
The Hartford had record net income in 2005 and an ROE over 15%
3
($ in million; except per share amounts)
Year EndedDec-04 Dec-05
Net income 2,115$ 2,281$ 8%Net income per diluted share 7.12 7.46 5%
Core earnings 1,972 2,249 14%Core earnings per diluted share 6.64 7.36 11%
Book value per share (excluding AOCI) 43.55 50.44 16%Net income ROE 16.3% 15.4%
% Change

The Hartford Financial Services Group, Inc.
$507
$1,000
-$91
$2,281$2,115
2001 2002 2003 2004 2005
Net Income ($ Millions)
45% CAGR
3
$37.77 $36.67
$43.55
$50.44
$34.54
2001 2002 2003 2004 2005
Book Value Per Share (Excluding AOCI)
10% CAGR
4
Strong earnings have driven double digit growth in book value per share

The Hartford Financial Services Group, Inc.
Shareholder total returns over the past one, three and five years have surpassed the S&P 500
Total Annualized Return as of 2/10/06
1 Year 3 Year 5 Year
The Hartford (HIG)
S&P 500
11.4% 32.4% 6.7%
7.1% 17.0% 1.1%
5
50%
100%
150%
Feb-01 Aug-01 Feb-02 Aug-02 Feb-03 Aug-03 Jan-04 Jul-04 Jan-05 Jul-05 Jan-06
The Hartford S&P
The Hartford and S&P Change From 2/10/01 – 2/10/06
The Hartford Financial Services Group, Inc.
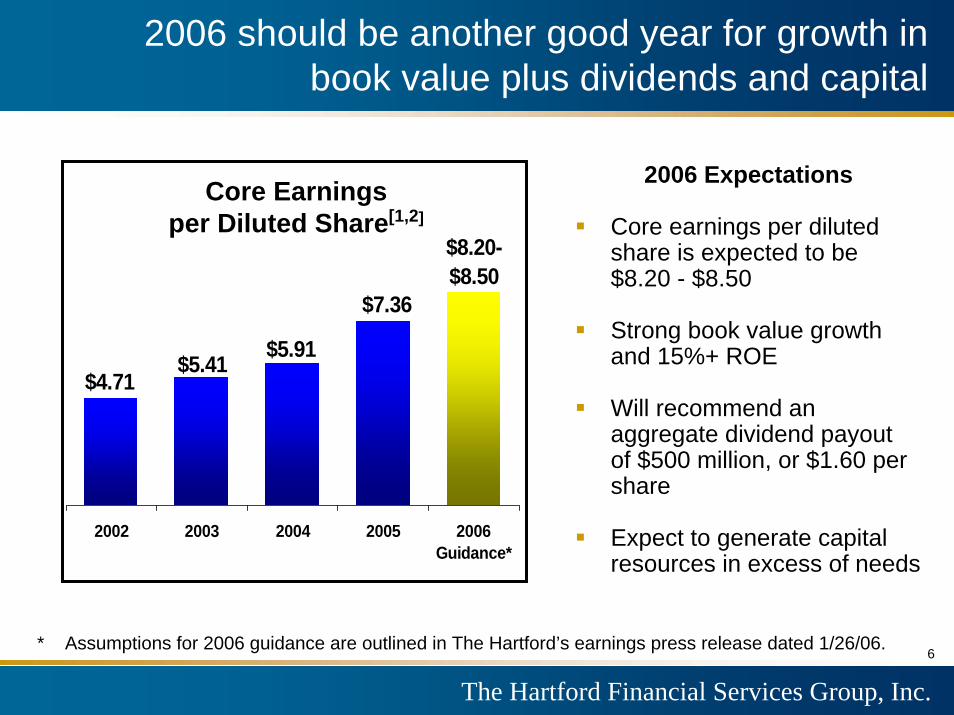
2006 should be another good year for growth in book value plus dividends and capital
$8.20-$8.50
$7.36
$5.91$5.41$4.71
2002 2003 2004 2005 2006Guidance*
Core Earnings per Diluted Share[1,2]
* Assumptions for 2006 guidance are outlined in The Hartford’s earnings press release dated 1/26/06.
2006 Expectations
Core earnings per diluted share is expected to be $8.20 - $8.50
Strong book value growth and 15%+ ROE
Will recommend an aggregate dividend payout of $500 million, or $1.60 per share
Expect to generate capital resources in excess of needs
6

The Hartford Financial Services Group, Inc.
The Hartford has a balanced, growing portfolio of insurance and investment businesses
3
$6.8$7.8
$8.9$10.0 $10.5
2001 2002 2003 2004 2005
P&C Net Written Premiums Ongoing Operations
($ Billions)
12% CAGR
7
$168 $165
$210$249
$277
2001 2002 2003 2004 2005
Assets Under Management Life Operations
($ Billions)
13% CAGR

The Hartford Financial Services Group, Inc.
Institutional Solutions7%
$88M
Individual Life13%
$166M
Retail Products46%
$622M
Retirement Plans6%
$75M
Group Benefits21%
$272M
* Pie chart excludes $112 million of loss in Other
International7%
$96M
2005 Life Core Earnings$1.2 billion*
The Hartford’s life earnings base is becoming more diversified
8
The Hartford Financial Services Group, Inc.
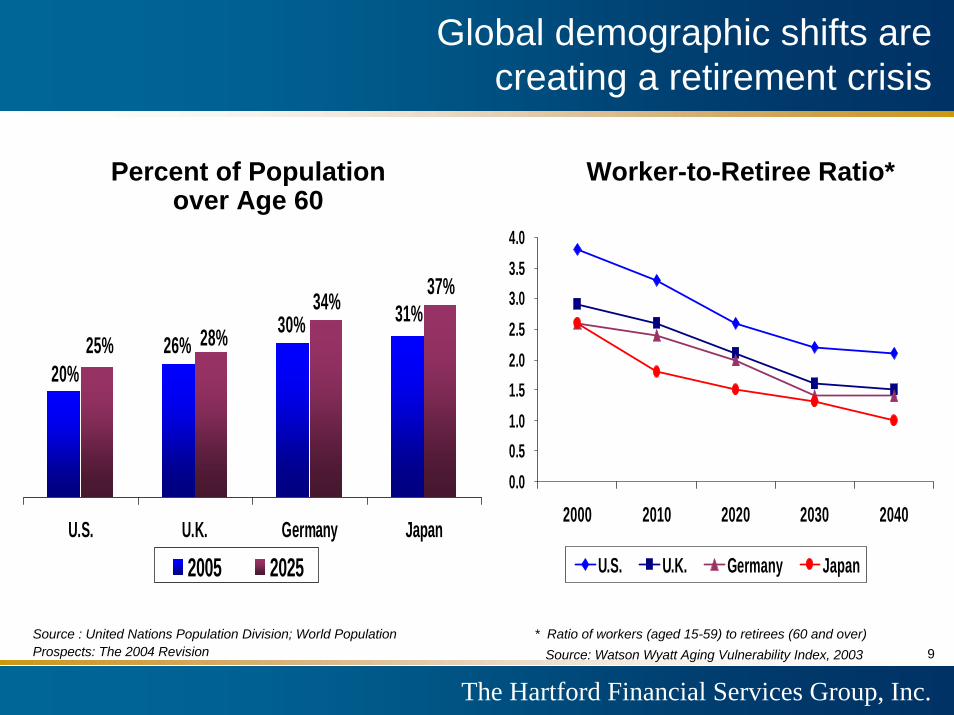
31%30%26%
20%25% 28%
34% 37%
U.S. U.K. Germany Japan
2005 2025
0.00.51.01.52.02.53.03.54.0
2000 2010 2020 2030 2040
U.S. U.K. Germany Japan
Percent of Population over Age 60
Worker-to-Retiree Ratio*
Global demographic shifts are creating a retirement crisis
Source : United Nations Population Division; World Population Prospects: The 2004 Revision 9
* Ratio of workers (aged 15-59) to retirees (60 and over)Source: Watson Wyatt Aging Vulnerability Index, 2003
The Hartford Financial Services Group, Inc.
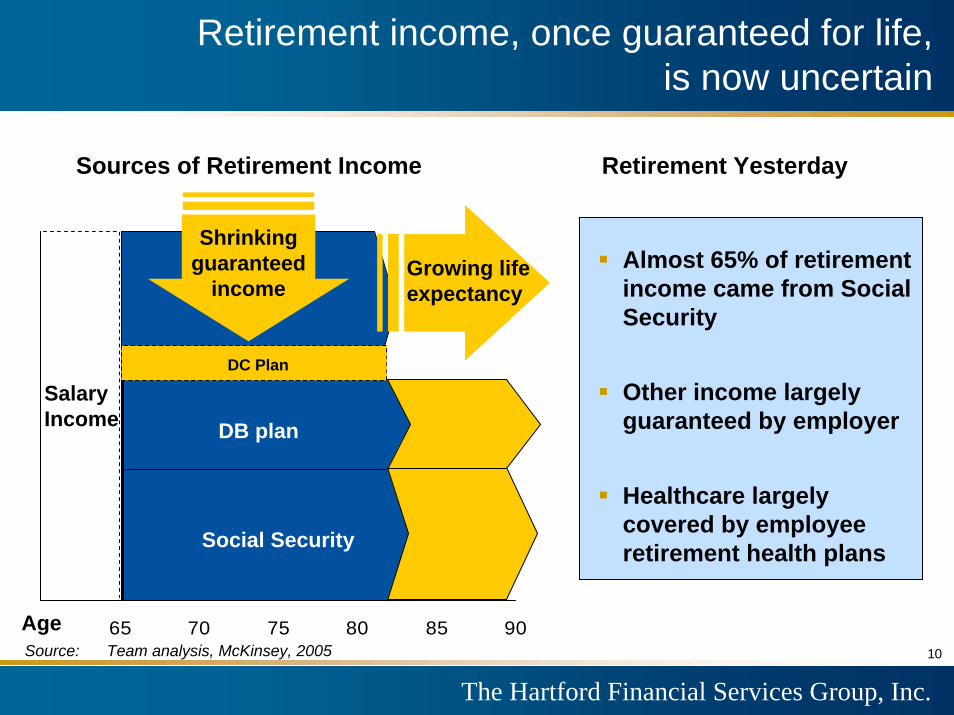
60 65 70 75 80 85 90
DB plan
Social security
Shrinking guaranteed
income
Source: Team analysis, McKinsey, 2005
Retirement income, once guaranteed for life, is now uncertain
Almost 65% of retirement income came from Social Security
Other income largely guaranteed by employer
Healthcare largely covered by employee retirement health plans
Retirement Yesterday Sources of Retirement Income
DB plan
Social security
DB plan
Social Security
Growing lifeexpectancy
Salary Income
Age
DC Plan
10
The Hartford Financial Services Group, Inc.
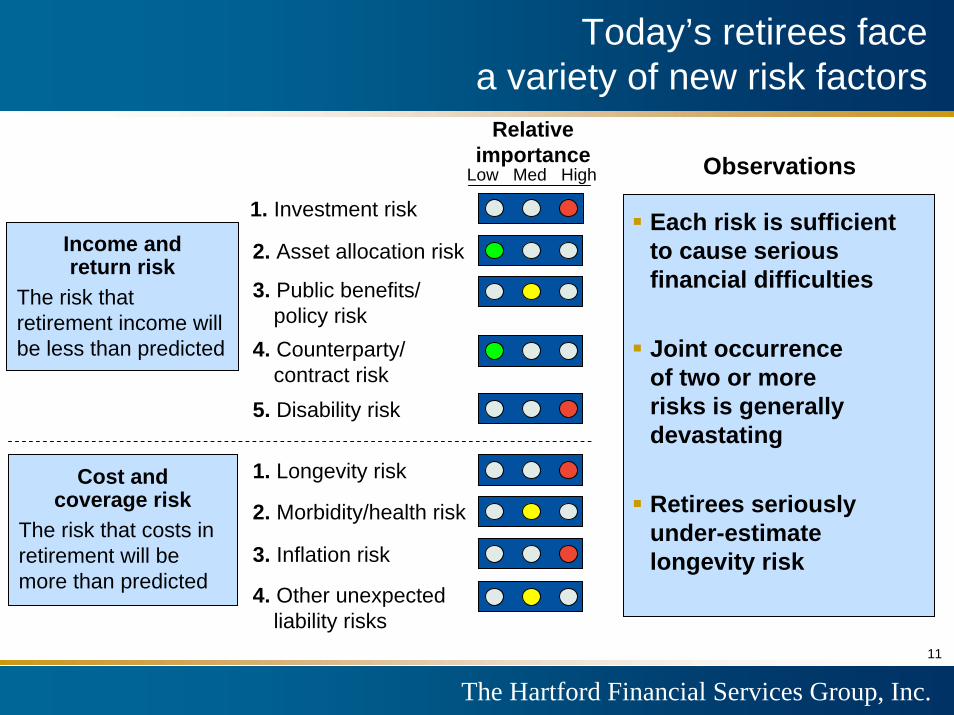
Today’s retirees facea variety of new risk factors
Income and return risk
The risk that retirement income will be less than predicted
Cost and coverage risk
The risk that costs in retirement will be more than predicted
1. Investment risk
Relativeimportance
2. Asset allocation risk
3. Public benefits/policy risk
4. Counterparty/contract risk
5. Disability risk
1. Longevity risk
2. Morbidity/health risk
3. Inflation risk
4. Other unexpected liability risks
ObservationsLow Med High
Each risk is sufficient to cause serious financial difficulties
Joint occurrence of two or more risks is generally devastating
Retirees seriously under-estimate longevity risk
11

The Hartford Financial Services Group, Inc.
Probability of Survival at Age 65
To Age: Male FemaleOne
Member of a
Couple80 71% 71% 94%85 53% 65% 84%90 34% 44% 63%95 17% 23% 36%
100 6% 9% 14%
And a growing need for longevity protection
Based on Society of Actuaries Annuity 2000 Mortality Tables
A male, age 65, has a one-in-three chance of living to age 90
A female, age 65, has a one-in-three chance of living to age 93
One member of a married couple, each age 65, has a one-in-three chance of living to age 96
12
Remarkable Longevity
The Hartford Financial Services Group, Inc.
The Hartford is well positioned for the global retirement market
Maintain a leadership position in U.S. variable annuities
Expand market share in other retirement savings products
Provide new lifetime income products
Expand retirement products in Japan and the U.K.
The Hartford Retirement Strategy
13

The Hartford Financial Services Group, Inc.
Hartford Life Annuity Operating Expenses
Hartford Life Annuity Operating Expenses
Operating Expenses Per Account
$105 billion of assets under management will drive earnings
Product innovation will focus on balancing customer value with prudent risk management
New lifetime income feature is gaining traction
Recognized leader in hedging and risk management
Leverage our low cost position to strengthen competitive advantage in market place
14
We will continue to be a leaderin U.S. variable annuities
$105$100
$64
$87$75
2001 2002 2003 2004 2005
The Hartford’s Variable Annuity Assets Under Management
($ in Billions)
The Hartford Financial Services Group, Inc.
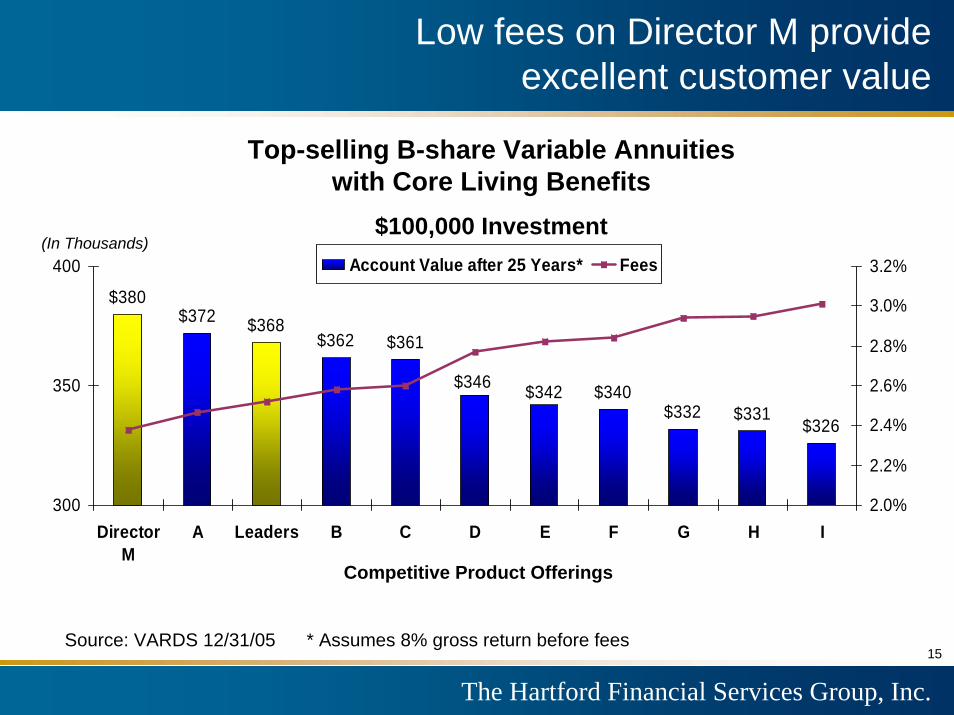
Low fees on Director M provideexcellent customer value
$380$372 $368
$362 $361
$340$332 $331
$326
$342$346
300
350
400
DirectorM
A Leaders B C D E F G H I2.0%
2.2%
2.4%
2.6%
2.8%
3.0%
3.2%Account Value after 25 Years* Fees(In Thousands)
Top-selling B-share Variable Annuities with Core Living Benefits
$100,000 Investment
Competitive Product Offerings
Source: VARDS 12/31/05 * Assumes 8% gross return before fees15

The Hartford Financial Services Group, Inc.
The Hartford’s 401(k) plans havesignificant growth potential
$595$1,400
Mid - Large Plans
(over 1,000 lives)
The Hartford TargetsMicro and Small-Mid
Size Plans(up to 1000 lives)
401(k) Industry Assets Under Management: $2.0 Trillion
Source: LIMRA International “The 401(k) scorecard”
Key Growth Strategies
Leverage our relationships with financial advisors to reach the advisor-sold market
PLANCO wholesaling80 Retirement Plans Specialists
Expand products for small-mid sized plan market
Provide broad investment choices with 60 money managers
Drive persistency with award-winning service
16
The Hartford Financial Services Group, Inc.
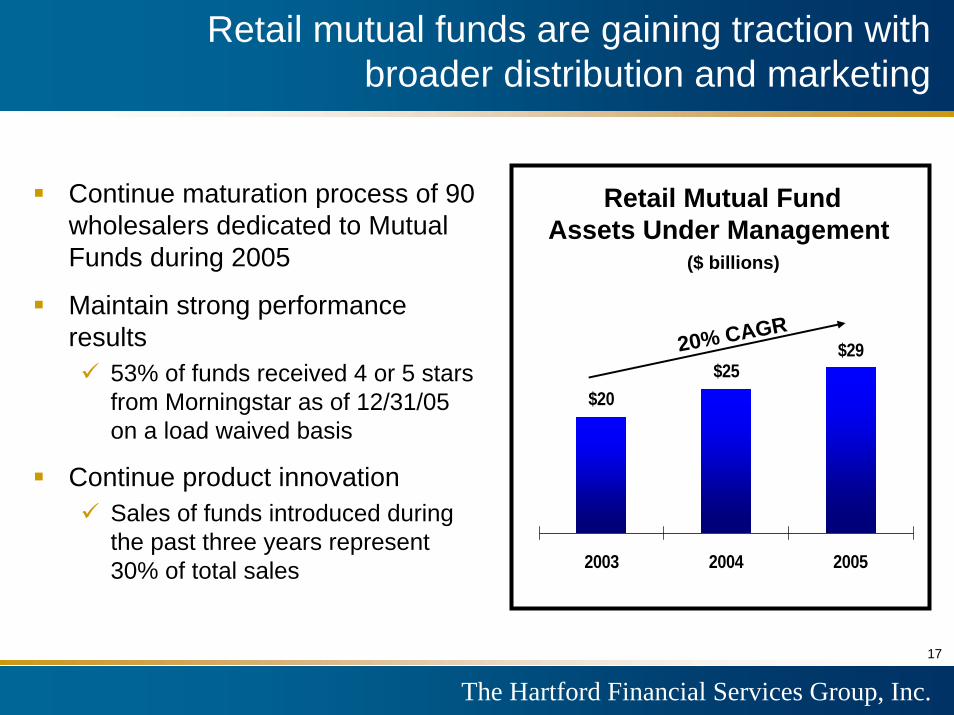
Retail mutual funds are gaining traction with broader distribution and marketing
Continue maturation process of 90 wholesalers dedicated to Mutual Funds during 2005
Maintain strong performance results
53% of funds received 4 or 5 stars from Morningstar as of 12/31/05 on a load waived basis
Continue product innovationSales of funds introduced during the past three years represent 30% of total sales
Retail Mutual Fund Assets Under Management
$20$25
$29
2003 2004 2005
($ billions)
20% CAGR
17

The Hartford Financial Services Group, Inc.
The Hartford has longevity protection products under development
Sources of Retirement IncomeNeed for new sources of retirement income
New products (e.g., longevity protection)
Extension of existing products (e.g., variable annuity with lifetime income, GMWB)
Full use of existing products in retirement context (e.g., annuitization of deferred annuities)
DC Plan Systematic Withdrawals
Non-Qualified Portfolio WithdrawalsIncluding Insurance Payments
Salary Income
DB Plan
Social Security
60 65 70 75 80 85 90
Lifetime Income Products
LongevityProtectionSolutions
Age
18
The Hartford Financial Services Group, Inc.
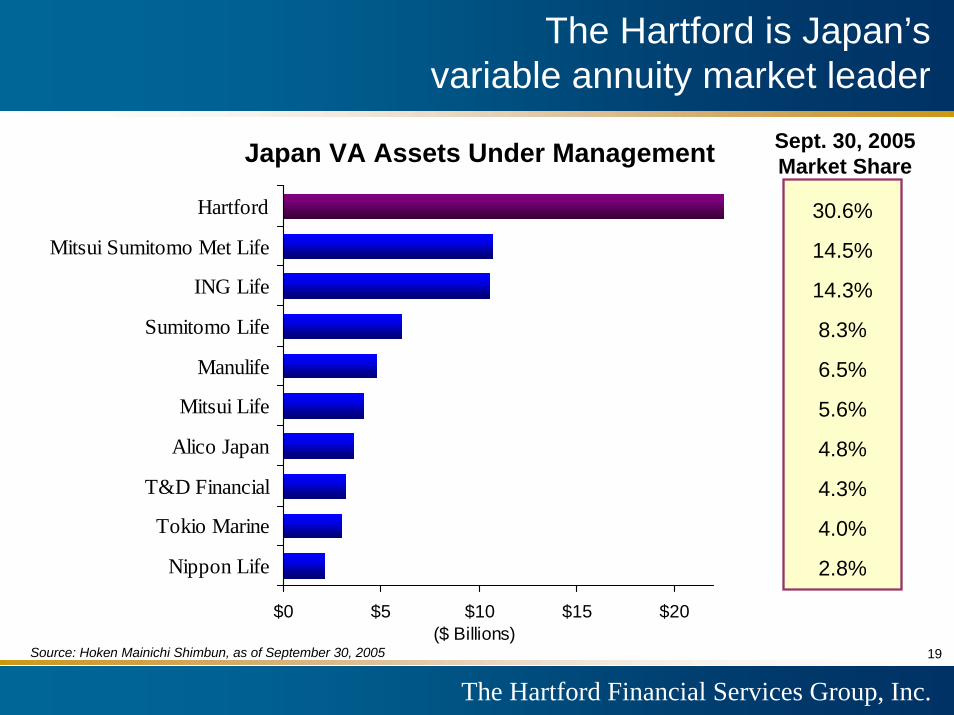
The Hartford is Japan’s variable annuity market leader
$0 $5 $10 $15 $20
Nippon Life
Tokio Marine
T&D Financial
Alico Japan
Mitsui Life
Manulife
Sumitomo Life
ING Life
Mitsui Sumitomo Met Life
Hartford
($ Billions)Source: Hoken Mainichi Shimbun, as of September 30, 2005
Sept. 30, 2005Market ShareJapan VA Assets Under Management
30.6%
14.5%
14.3%
8.3%
6.5%
5.6%
4.8%
4.3%
4.0%
2.8%
19

The Hartford Financial Services Group, Inc.
The total variable annuity industry is poised to growAs of 9/30/05, total industry assets under management were $74 billionTotal variable annuity assets may grow to $250-$400 billion by the end of the decade
New variable annuity product (Adagio V3) provides current income and new fund options
Increase penetration with existing distributors and expand distribution
Leverage variable annuity momentum into other accumulation and retirement products
We have tremendous opportunity to grow in Japan
20

The Hartford Financial Services Group, Inc. 21
The Hartford’s life business is well positioned for 2007 and beyond
Retirement solutions present significant growth opportunities inthe U.S. and Japan
Variable annuitiesMutual funds401(k)New longevity and income products
Scale and risk management allows us to offer products with excellent customer value, at acceptable risk
Strong growth outlooks in group benefits and individual life will drive earnings and diversification

The Hartford Financial Services Group, Inc.
The property and casualty industry is facing stronger headwinds
$329
$379$404
$423
$321
$150
$250
$350
$450
2001 2002 2003 2004 9/30/05 YTD80
90
100
110
120
Net Written Premium Statutory Combined Ratio
Industry Net Written Premium and Combined Ratio
Sources: A.M. Best, I.I.I., I.S.O.
$4.6
$26.5
$5.9
$12.9
$27.5
$55.3
$-
$10
$20
$30
$40
$50
$60
2000 2001 2002 2003 2004 2005
Industry Catastrophe Losses
(In Billions) (In Billions)
22
The Hartford Financial Services Group, Inc.
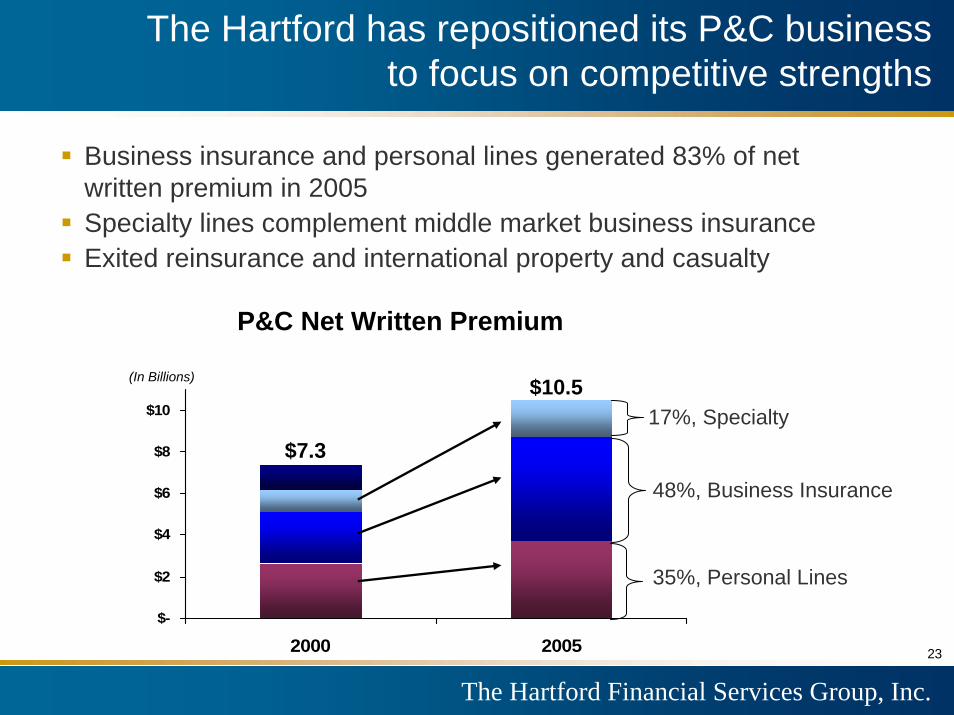
$-
$2
$4
$6
$8
$10
2000 2005
$7.3
$10.5(In Billions)
P&C Net Written Premium
Business insurance and personal lines generated 83% of net written premium in 2005 Specialty lines complement middle market business insuranceExited reinsurance and international property and casualty
17%, Specialty
48%, Business Insurance
35%, Personal Lines
The Hartford has repositioned its P&C business to focus on competitive strengths
23
The Hartford Financial Services Group, Inc.
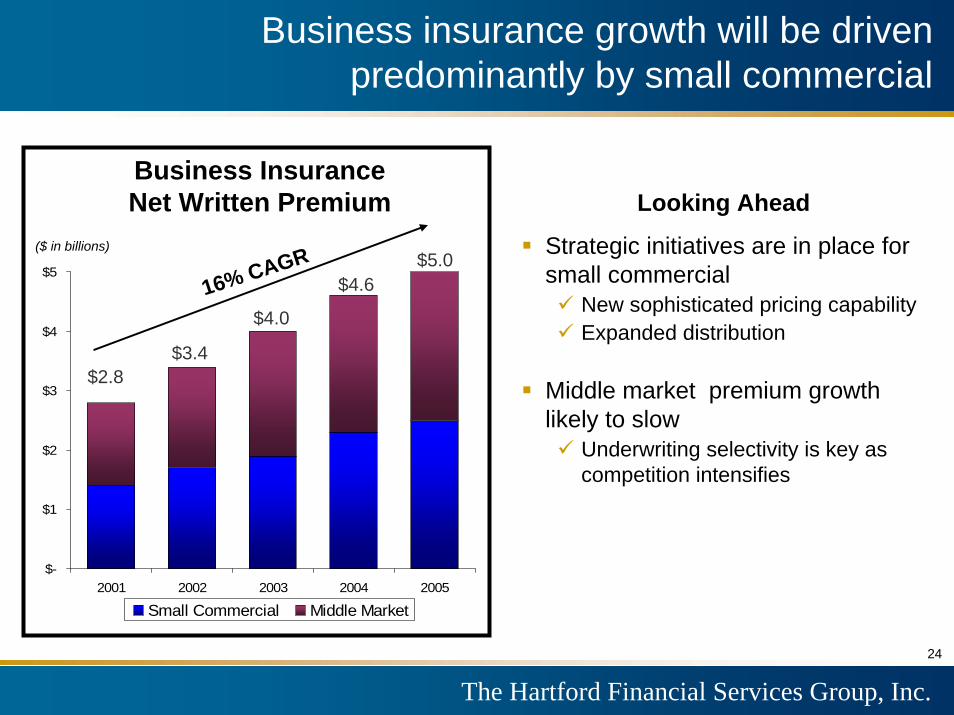
$-
$1
$2
$3
$4
$5
2001 2002 2003 2004 2005
Small Commercial Middle Market
($ in billions)
Looking Ahead
Strategic initiatives are in place for small commercial
New sophisticated pricing capabilityExpanded distribution
Middle market premium growth likely to slow
Underwriting selectivity is key as competition intensifies
Business Insurance Net Written Premium
Business insurance growth will be driven predominantly by small commercial
16% CAGR
$2.8$3.4
$4.0
$4.6$5.0
24

The Hartford Financial Services Group, Inc.
$0
$1
$2
$3
$4
2001 2002 2003 2004 2005
AARP Agency
Personal Lines Agency and AARPNet Written Premium
9% CAGR($ in billions)
In personal lines, product, distribution and technology provide growth opportunities
Looking Ahead
AARP growth will be fueled by aging boomers and new marketing
Dimensions auto and home granular pricing will target profitable new customers
Award-winning service supports customer retention
Investments in agency technology make it easy to offer The Hartford
Increased agency appointments and sales reps will drive quotes
$2.4$2.7 $2.9
$3.1$3.4
25
The Hartford Financial Services Group, Inc.
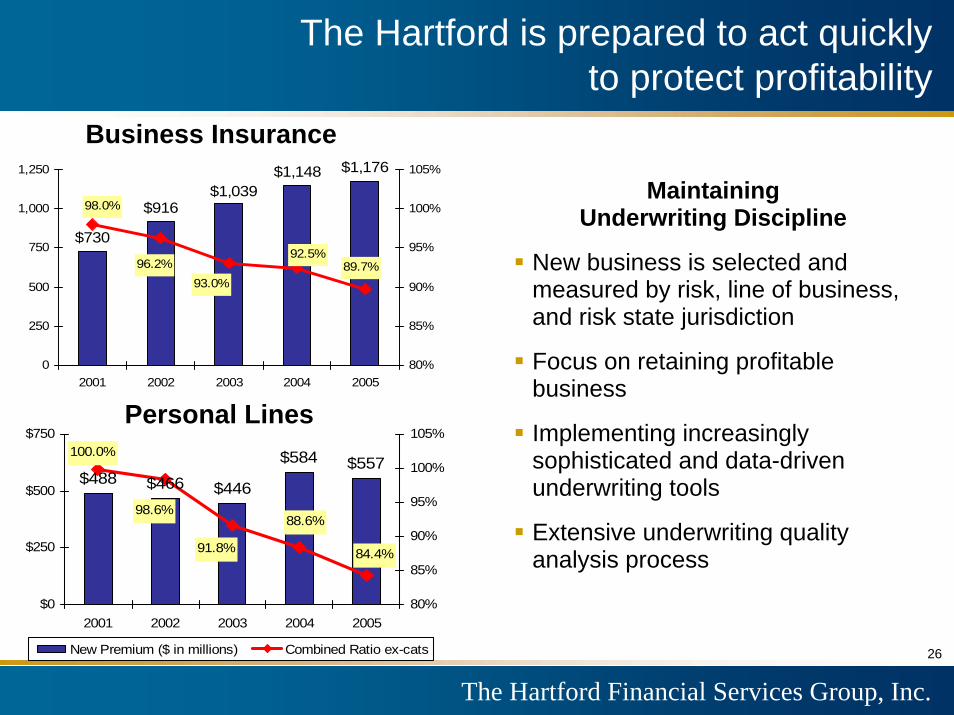
$730
$1,148 $1,176
$916$1,039
89.7%
98.0%
96.2%93.0%
92.5%
0
250
500
750
1,000
1,250
2001 2002 2003 2004 200580%
85%
90%
95%
100%
105%
Business Insurance
Personal Lines
Maintaining Underwriting Discipline
New business is selected and measured by risk, line of business, and risk state jurisdiction
Focus on retaining profitable business
Implementing increasingly sophisticated and data-driven underwriting tools
Extensive underwriting quality analysis process
The Hartford is prepared to act quickly to protect profitability
$488 $466 $446
$584 $557
84.4%
88.6%
100.0%
98.6%
91.8%
$0
$250
$500
$750
2001 2002 2003 2004 200580%
85%
90%
95%
100%
105%
New Premium ($ in millions) Combined Ratio ex-cats 26
The Hartford Financial Services Group, Inc.
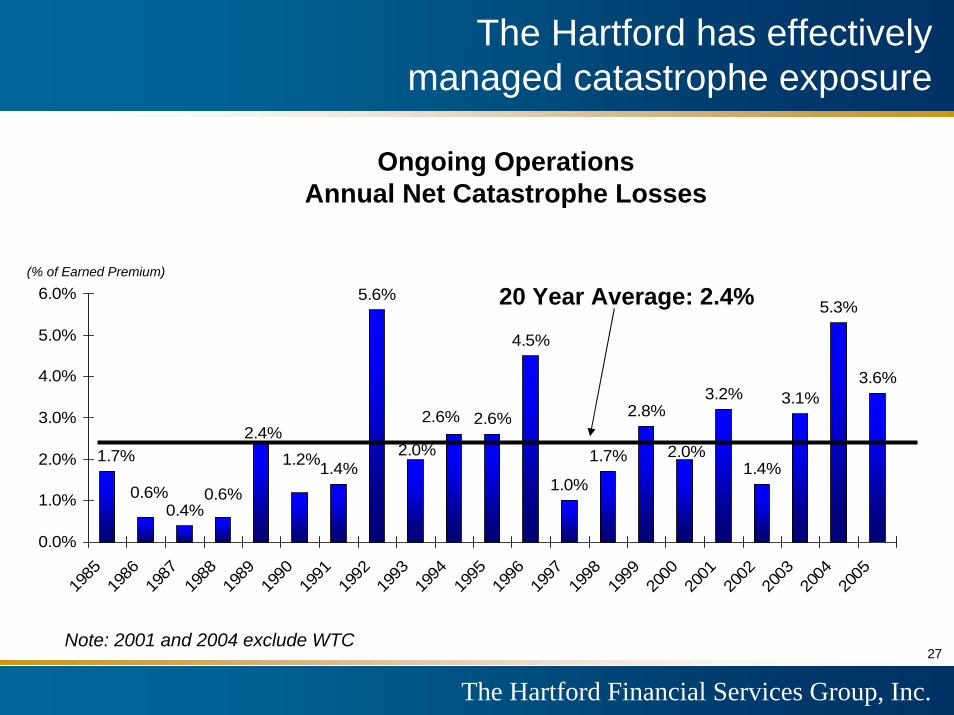
0.4%
1.4%
5.6%
2.6%
4.5%
1.0%
1.7%
2.8%3.2%
1.4%
3.1%
5.3%
3.6%
2.4%2.0%2.0%
2.6%
0.6% 0.6%
1.7% 1.2%
0.0%
1.0%
2.0%
3.0%
4.0%
5.0%
6.0%
1985
1986
1987
1988
1989
1990
1991
1992
1993
1994
1995
1996
1997
1998
1999
2000
2001
2002
2003
2004
2005
(% of Earned Premium)
Ongoing Operations Annual Net Catastrophe Losses
Note: 2001 and 2004 exclude WTC
20 Year Average: 2.4%
The Hartford has effectively managed catastrophe exposure
27

The Hartford Financial Services Group, Inc.
At year-end 2005, The Hartford had a capital margin of $1 billion in excess of rating agency minimums
$500 million in additional capital will likely be generated in 2006
Our primary goal is to deploy that capital to invest in growth at 13% to 15% returns
Alternatively, we will return capital to shareholders
Financial Leverage Excluding AOCI [3]
EnterpriseGoal
Low 20’s
20.0%
23.5%
28.1%29.5%
31.9%
15%
20%
25%
30%
35%
2001 2002 2003 2004 2005
A strong capital position provides capacity for opportunities and protection for unforeseen events
28
The Hartford Financial Services Group, Inc. 38
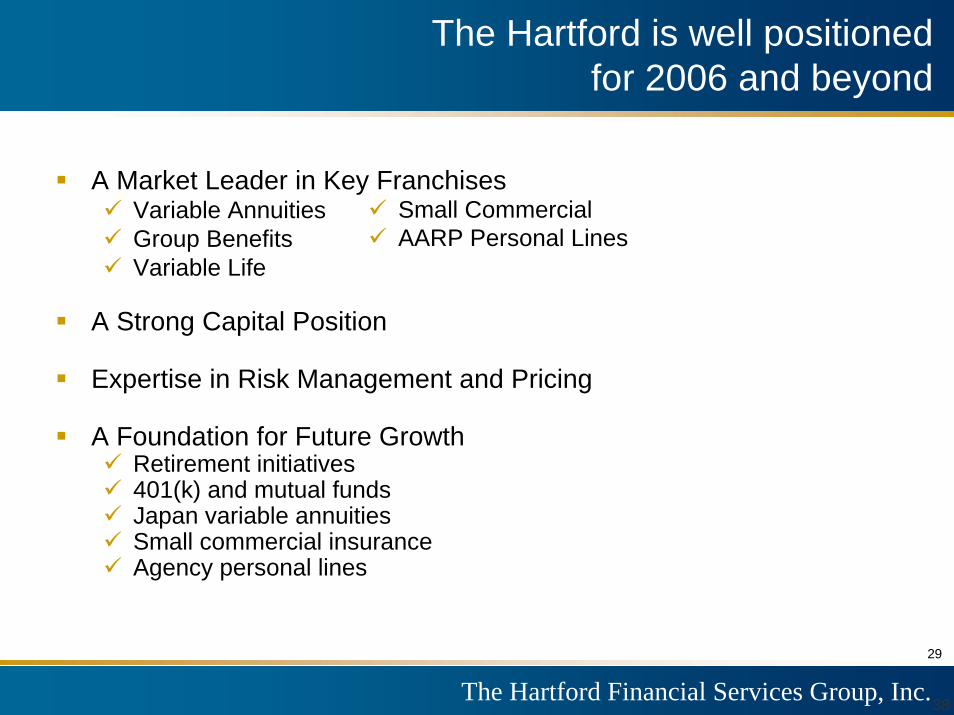
The Hartford is well positioned for 2006 and beyond
A Market Leader in Key FranchisesVariable Annuities Group BenefitsVariable Life
A Strong Capital Position
Expertise in Risk Management and Pricing
A Foundation for Future Growth Retirement initiatives401(k) and mutual funds Japan variable annuitiesSmall commercial insuranceAgency personal lines
Small Commercial AARP Personal Lines
29

The Hartford Financial Services Group, Inc.
Always Thinking Ahead.

The Hartford Financial Services Group, Inc.
[1] In order to provide a consistent basis of comparison, this chart excludes tax benefits of $76, $30 and $216 for 2002-2004, Bancorp Services litigation charges of $11 and $40 in 2002 and 2003, and the asbestos reserve addition of $1,701 and severance charges of $27 in 2003.
[2] The Hartford uses the non-GAAP financial measure core earnings as an important measure of the Company's operating performance. The Company believes the measure core earnings provides investors with a valuable measure of the performance of the Company's ongoing businesses because core earnings excludes the cumulative effect of accounting changes and the effect of all realized gains and losses (net of tax and the effects of deferred policy acquisition costs) that tend to be highly variable from period to period based on capital market conditions. Core earnings includes net realized gains and losses such as net periodic settlements on credit derivatives and net periodic settlements on the Japan fixed annuity cross-currency swap because these net realized gains and losses are directly related to an offsetting item included in the income statement such as net investment income. Net income is the most directly comparable GAAP measure. A reconciliation of net income to core earnings for the periods presented herein is set forth on page C-8 of our Investor Financial Supplement. Core earnings per share is calculated based on a non-GAAP financial measure. Net income per share is the most directly comparable GAAP measure. A reconciliation of net income per share to core earnings per share for the periods presented herein is set forth on page C-8 of our Investor Financial Supplement.
[3] Includes 75% equity credit on the equity units. 2003 excludes the impact of the CNA transaction.
F-1
Footnotes($ in millions)