the hammersmith & fulham poverty and worklessness ... · the hammersmith & fulham poverty...
TRANSCRIPT
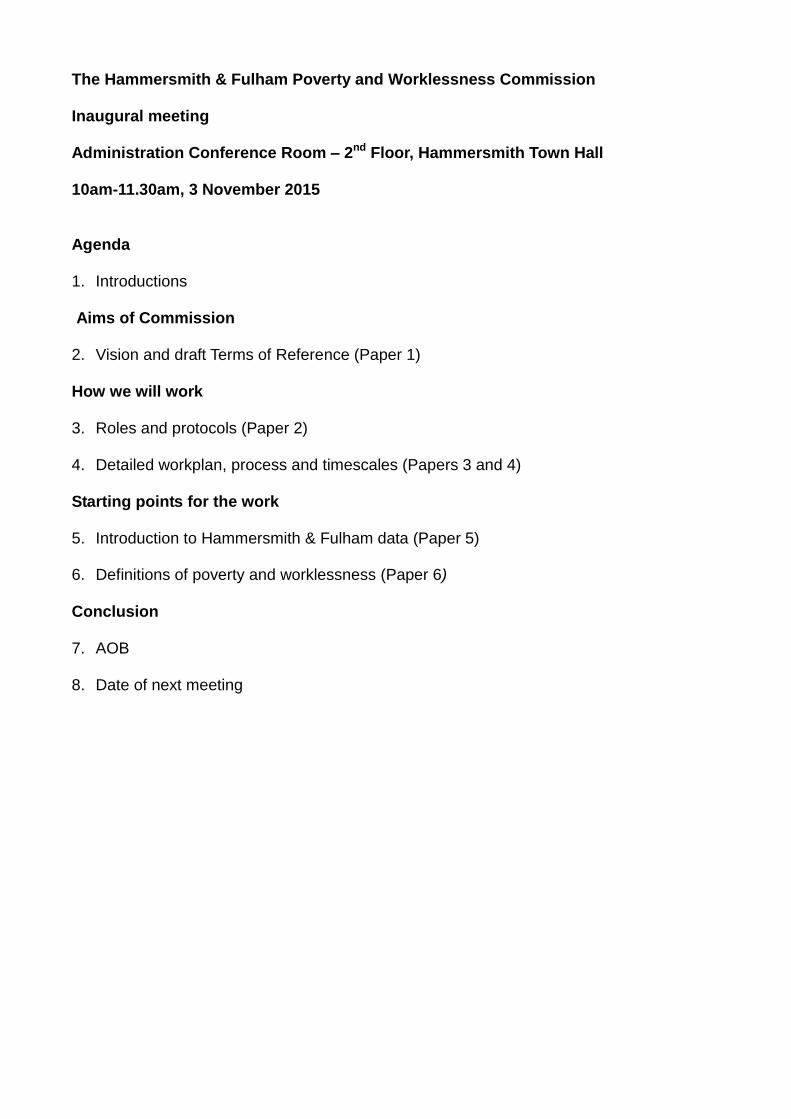
The Hammersmith & Fulham Poverty and Worklessness Commission Inaugural meeting Administration Conference Room – 2nd Floor, Hammersmith Town Hall 10am-11.30am, 3 November 2015 Agenda 1. Introductions Aims of Commission
2. Vision and draft Terms of Reference (Paper 1)
How we will work 3. Roles and protocols (Paper 2) 4. Detailed workplan, process and timescales (Papers 3 and 4) Starting points for the work 5. Introduction to Hammersmith & Fulham data (Paper 5) 6. Definitions of poverty and worklessness (Paper 6) Conclusion 7. AOB 8. Date of next meeting

Paper 1
The Hammersmith & Fulham Poverty and Worklessness Commission Vision The London Borough of Hammersmith & Fulham is located in a relatively wealthy part of one of the richest cities in the world. It supports a high level of employment and enterprise, is home to several multinational companies and soon will host a world-class university. Yet, within the borough, entrenched pockets of poverty and worklessness still exist that, to date and despite multiple interventions over the years, have proved intractable. The Hammersmith & Fulham Poverty and Worklessness Commission will: 1. Aim to identify the factors underpinning the continuing prevalence of both poverty and
worklessness in the borough. In doing so, it will draw upon the perspectives of local people living in, or on the edge of poverty and/or worklessness, as well as professionals, leading experts and best practice from elsewhere in the UK and around the world.
2. Formulate recommendations for interventions and/or service redesign, to deliver better outcomes for local people living in, or on the edge of, poverty and/or worklessness, and increase economic, employment and other opportunities for all.
3. Make proposals to national policy makers for freedoms, flexibilities and funding where necessary to implement these longer-term, in so doing helping central government to deliver on its agenda of encouraging self-reliance in society while saving public funds.
Terms of reference The Commission will:
Define poverty and worklessness in relation to Hammersmith & Fulham through, inter alia, a thorough review of available data and intelligence
Oversee a review of the available literature on poverty and worklessness, drawing on studies and commissions from elsewhere in the UK and internationally
Steer research with local people and groups identified as living in poverty and/or worklessness, to identify i) the factors that prolong each state and ii) the support and interventions that could increase access to economic, employment and other opportunities, helping them to leave poverty and/or worklessness
Call for written evidence from leading experts, policy makers and practitioners and explore this through a series of thematic oral hearings
Make recommendations to regional and national policy makers that will help people leave poverty and/or worklessness and widen access to economic and employment opportunities
Propose interventions and potentially service redesigns for implementation locally, or more widely, that will help people to leave poverty and/or worklessness and promote self-reliance
Make the case, where appropriate, to regional and national policy makers to provide freedoms, flexibilities and funding for programme(s) to tackle poverty and worklessness in Hammersmith & Fulham and beyond, to be evaluated in the medium and longer term
The Commission will meet at least every two months, supported by reference groups meeting as required and by working groups as appropriate. – ENDS – LBHF-DVD: Policy-TC; 23 October 2015

Paper 2
The Hammersmith & Fulham Poverty and Worklessness Commission Roles and protocols 1 Background This document outlines the various roles undertaken by members of the Poverty and Worklessness Commission and others who will participate in or support its work. It is a dynamic document that complements the Terms of Reference and the Workplan and will evolve as the work of the Commission takes shape. 2 Governance 2.1 The Commission The Poverty and Worklessness Commission (“the Commission”) will meet at least every two months and potentially more often as its work dictates. The first meeting is on 3 November 2015 and the next meeting will, subject to confirmation by the Commission, be scheduled for mid-January 2016. Subsequent meeting dates are to be determined. 2.2 Reference Groups The Officer Reference Group (ORG) will meet in tandem with Commission meetings and more often as required in order to interleave with the Commission’s work and provide wider support to it in relevant departments across the council. The first meeting of the ORG is anticipated to take place in mid- to late-November following the inaugural Commission meeting on 3 November. Other reference groups will be developed as desired by the Commission. These could potentially include, but are not limited to, the following:
A partner reference group, drawn from professionals working in national and local agencies that work with people living in or on the edge of poverty and/or worklessness. Examples include Jobcentre Plus, the Department for Work and Pensions, the Metropolitan Police, local NHS trusts and GPs or the H&F Clinical Commissioning Group.
A client reference group, drawn from people living in or on the edge of poverty and/or worklessness. This group may individually participate in whatever research exercises the Commission requires to be undertaken.
A Third Sector reference group, drawn from community and voluntary organisations working with people living in poverty and/or worklessness and who are not themselves represented on the Commission.
3 Individual roles 3.1 Chair of the Commission The Chair of the Commission is Christina Smyth. She will be responsible for:
recruiting Commissioners and consultants
chairing Commission meetings
co-ordinating the work of the Commission, and

Paper 2
directing the Programme Manager to marshal whatever resources are required within the Council to support it.
3.2 Commissioners Commissioners will be responsible for strategic direction of the Commission’s work and, where appropriate, for leading particular workstreams or work items within it. They will be invited to attend all meetings of the Commission, including the oral evidence hearings, and to contribute to the production and approval of the draft and final reports. 3.3 Consultants The creation of the consultant role means that the Commission will be able to draw on a wide pool of expertise beyond that held by the Commissioners, the secretariat, reference group members and the wider pool of council officers. Consultants will be retained by the Commission to offer their services ad hoc according to their specific expertise or interests. They will operate on a task-and-finish basis and will not be expected to remain with the Commission for the duration of its work. Consultants will be recruited by the Chair of the Commission and others as directed by the Chair. 3.4 Sponsor The Council’s sponsor for the Commission is the Cabinet Member for Social Inclusion, Cllr Sue Fennimore. She will attend meetings of the Commission as an observer and will liaise with the Leader of the Council and other Cabinet members on behalf of the Commission as requested by the Chair. 3.5 Programme Manager The Programme Manager is Tom Conniffe. He will
co-ordinate meetings of the Commission and Officer Reference Group
take direction from the Chair and Commission in developing and managing the detailed workplan
identify and recruit officers to sit on the ORG and liaise with the wider officer corps as the work of the Commission develops
manage the Secretariat, interns and other resources to deliver specific work items
oversee the production of the draft and final reports of the Commission 3.6 Secretariat The Secretariat is composed of the Programme Manager and officers from the Policy & Strategy team and the Insight & Analytics team as required. The Secretariat will:
Manage specific workstreams and produce specific work items under the direction of the Chair and Programme Manager
Guide interns to deliver specific work items as above
Organise events and exercises in conjunction with the Programme Manager
Support the Commission, Officer Reference Group and any other groups established under the auspices of the Commission as required

Paper 2
3.7 Officer Reference Group members (see 2.2) Officer Reference Group members will represent their departments on the ORG. They will be expected to attend ORG meetings or nominate substitute attendees in the event that they are unable to attend meetings. They will be asked to:
contribute their expertise, knowledge and contacts to assist the Commission in its work
liaise with colleagues within and outside their departments and teams regarding the Commission and its work
co-ordinate colleagues to deliver specific work items requested by the Commission They will also be asked to sit on task-and-finish groups as required by the Commission and can expect to report back on participation in the Commission’s work to the Sponsor at her monthly Cabinet Member Boards. The roles of members of other Reference Groups will be determined in line with demand. 4 Protocols 4.1 Information sharing A secure password-protected SharePoint platform for hosting documents and links relating to the work of the Commission is being sought but is not available at the time of launch. As an interim measure, a webpage will be set up on the council’s website at www.lbhf.gov.uk to hold the terms of reference, minutes of Commission meetings and any other documentation relating to the Commission and its work. In line with the Council’s positions on transparency and resident involvement in policy formulation, it is envisaged that this page will be accessible to all visitors to the Council’s website. Commissioners are therefore asked to consent to their details being published online in documentation relating to the Commission and its work. Any Commissioner who does not consent to this is requested to contact Christina Smyth in writing within one week of the initial Commission meeting, or one week of their appointment if they are not in place at this time. – ENDS – LBHF-DVD: Policy-TC; 23 October 2015
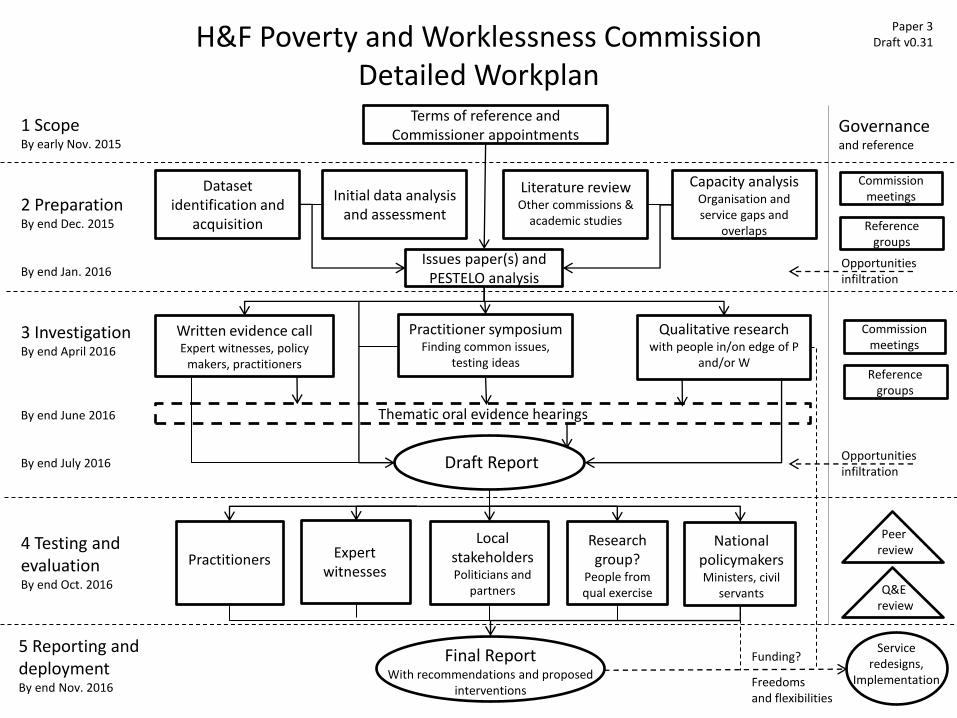
H&F Poverty and Worklessness Commission Detailed Workplan
5 Reporting and deployment By end Nov. 2016
3 Investigation By end April 2016 By end June 2016 By end July 2016
Draft Report
Written evidence call Expert witnesses, policy
makers, practitioners
Practitioners Expert witnesses
Local stakeholders Politicians and
partners
Research group?
People from qual exercise
National policymakers Ministers, civil
servants
Thematic oral evidence hearings
4 Testing and evaluation By end Oct. 2016
Issues paper(s) and PESTELO analysis
Terms of reference and Commissioner appointments
1 Scope By early Nov. 2015
2 Preparation By end Dec. 2015 By end Jan. 2016
Dataset identification and
acquisition
Initial data analysis and assessment
Capacity analysis Organisation and service gaps and
overlaps
Literature review Other commissions &
academic studies
Practitioner symposium Finding common issues,
testing ideas
Qualitative research with people in/on edge of P
and/or W
Final Report With recommendations and proposed
interventions
Service redesigns,
Implementation Freedoms and flexibilities
Paper 3 Draft v0.31
Governance and reference
Peer review
Opportunities infiltration
Opportunities infiltration
Commission meetings
Reference groups
Commission meetings
Reference groups
Q&E review
Funding?
Paper 4
The Hammersmith & Fulham Poverty and Worklessness Commission Process and timescale The work of the Commission is currently envisaged to take place in five phases: 1. Scope 2. Preparation 3. Investigation 4. Testing and evaluation 5. Reporting and deployment Taking each in turn: 1. Scope – to early November 2015 In this introductory phase 1, the Terms of Reference will be refined and Commissioners identified and recruited. This phase of work will conclude once the Terms of Reference and the Commission’s membership have both been agreed by internal sponsors and stakeholders and the Commission has met for the first time. The initial meeting of the Commission will take place on 3 November 2015. 2. Preparation – from November to the end of January 2016 Phase 2 splits into two parts. In the first part, four interlinked but discrete pieces are proposed:
data identification and, where possible, acquisition
initial data analysis and assessment, focusing on H&F in particular but drawing on the regional and national contexts as required
literature review, considering the findings from academic studies and other similar commissions
capacity analysis, looking at where gaps and overlaps lie in the current coverage of organisations and services in H&F – and more widely, if relevant
It is anticipated that this first part will be completed by the end of December 2015. The second part of phase 2, to follow on directly, involves the production of one or more issues papers to capture the learning from the first part. Integral to this will be the production of a PESTELO analysis (political, economic, social, technological, environmental, legal and organisational), which will provide a structured assessment of the spread and nature of poverty and worklessness in H&F and of the external factors influencing them. Phase 2 is programmed to complete by the end of January 2016. 3. Investigation Phase 3 consists of three parts, culminating in the production of a draft report. In the first part, three discrete pieces of work are proposed to understand the issues from the perspectives of target audiences and to identify, in their view, what could be done to
Paper 4
improve the response and support available from organisations including statutory and voluntary agencies:
qualitative research with people in, and on the edge of, poverty and/or worklessness
a practitioner symposium, with professionals from the local authority, public and voluntary sectors, to find common issues and discuss potential solutions and interventions
call for written evidence from expert witnesses, policy makers and practitioners This part is anticipated to complete by the end of April 2016. The second part of phase 3 will draw together the emerging evidence and interrogate it in a series of between four and six thematic oral evidence hearings. These are likely to be arranged with a focus on the primary determinants of poverty and worklessness identified in phase 2. Up to two months will be allowed for the oral evidence hearings to take place, which should provide sufficient time between hearings for Commissioners to prepare and reflect on additional insight. The final part of phase 3, which is programmed to complete at the end of July 2016, is the production of the Commission’s draft report. 4. Testing and evaluation Phase 4, testing and evaluation, is currently envisaged to take around three months to conclude, to allow internal sponsors and stakeholders sufficient time to reflect on the structure and findings of the draft report and to initiate conversations with target audiences, especially but not limited to national and regional policy makers. Alongside this, it is proposed to appoint a panel of practitioners and expert witnesses to conduct a peer review. In the absence of a fuller evaluation, which can only be carried out in the longer term, a peer review can critique the process and draft report while both are “live” and inform the structure and recommendations of the final report prior to its conclusion. Phase 4 should be complete by the end of October 2016. 5. Reporting and deployment Phase 5, reporting and deployment, is timed for a month but it is anticipated that this timescale refers only to the production and launch of the Commission’s final report. This is currently envisaged for the end of November 2016. Thereafter, any recommendations proposed by the Commission that are adopted by the Council and/or its partners, and can be implemented locally without further approvals, will be deployed as and when appropriate. Further, proposals may be made to national policy makers in order to secure freedoms, flexibilities and potentially funding for implementing interventions and/or service redesign, with the aim of helping central government to deliver on its agenda of encouraging self-reliance in society while saving public funds. Conversations on such proposals may continue between sponsors and national policy makers after the launch of the final report to try and formalise these, in order to implement them from 2017 onwards.

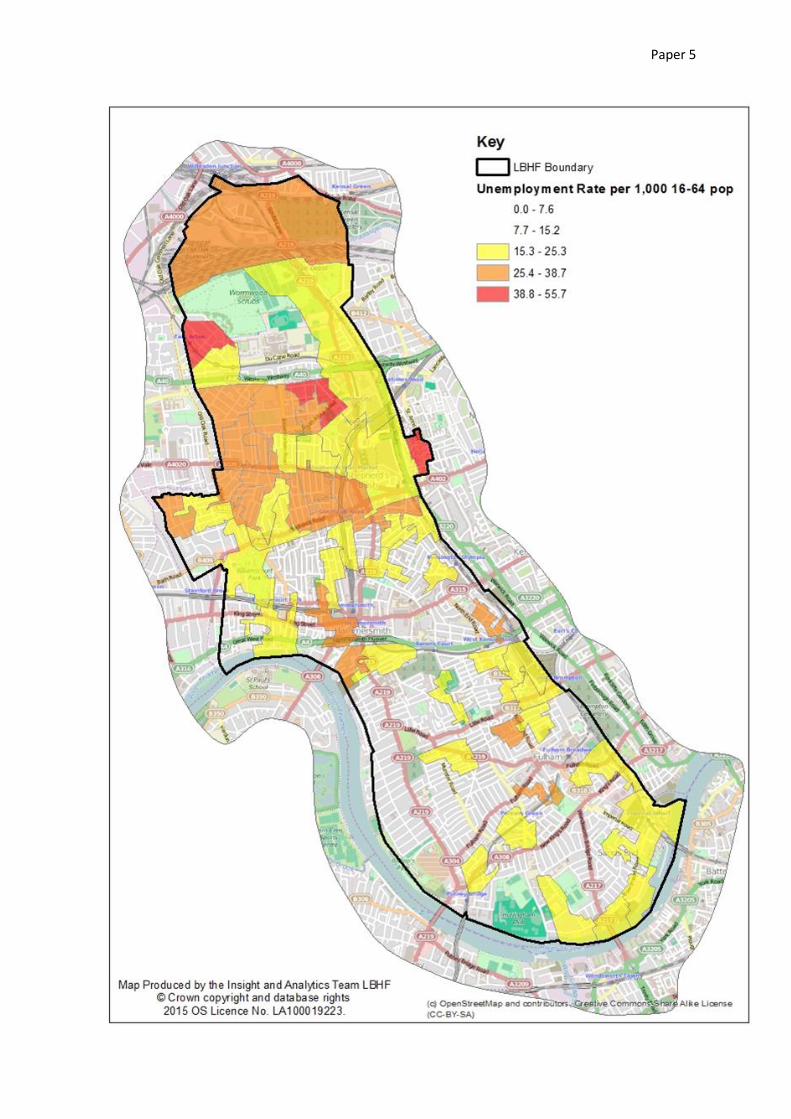
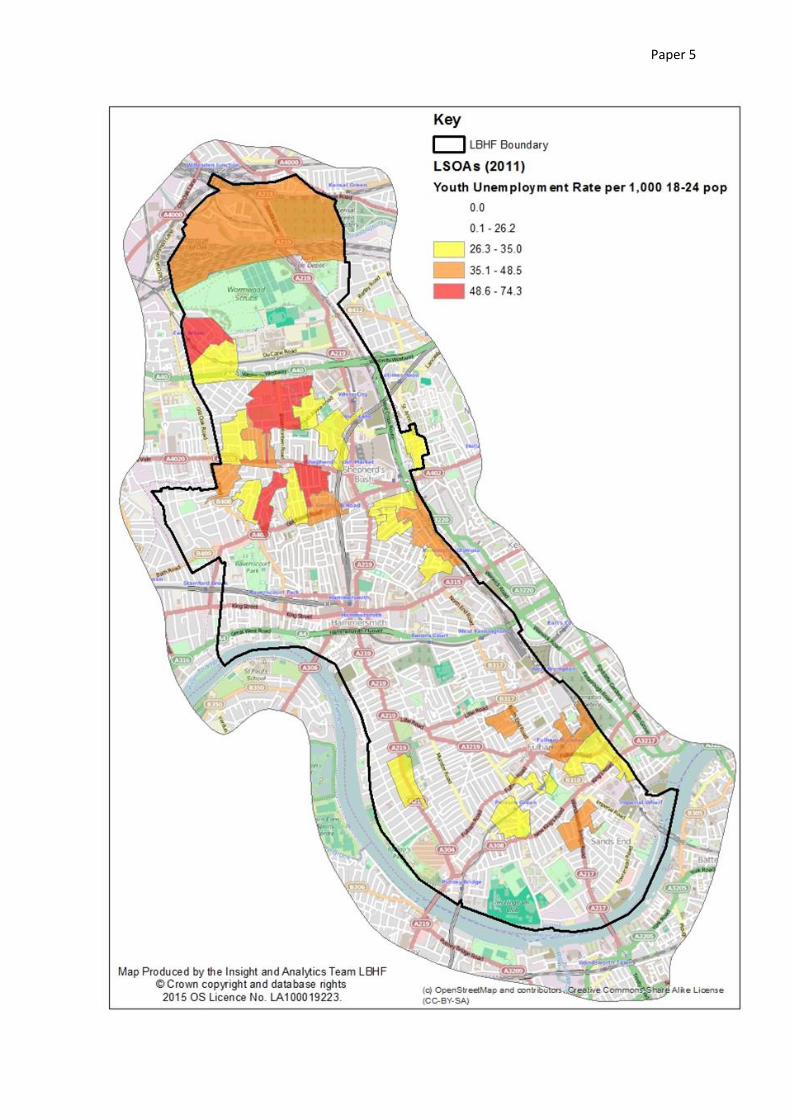
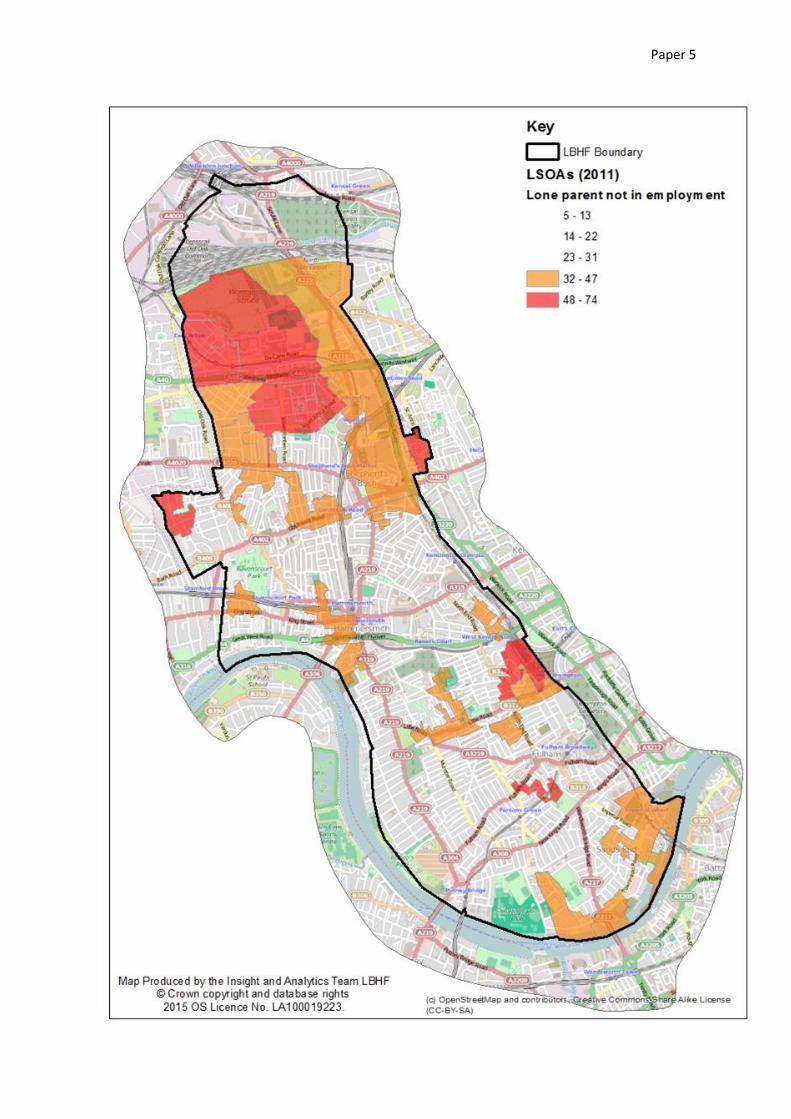
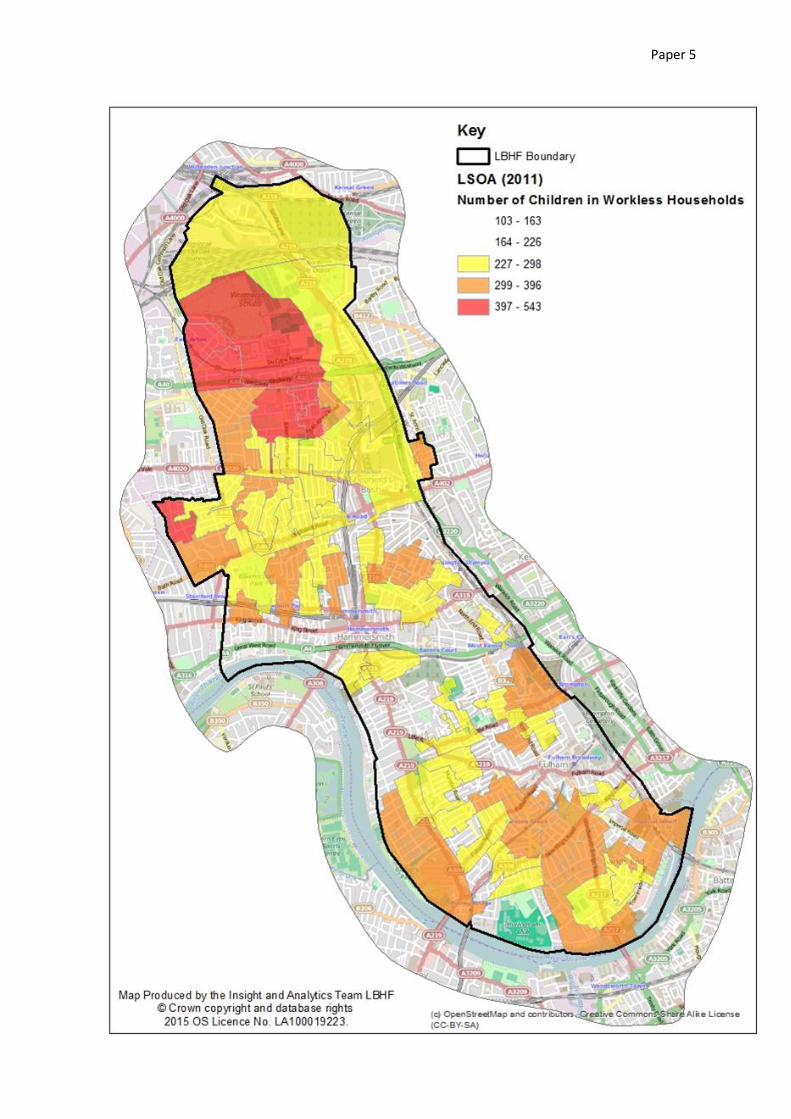
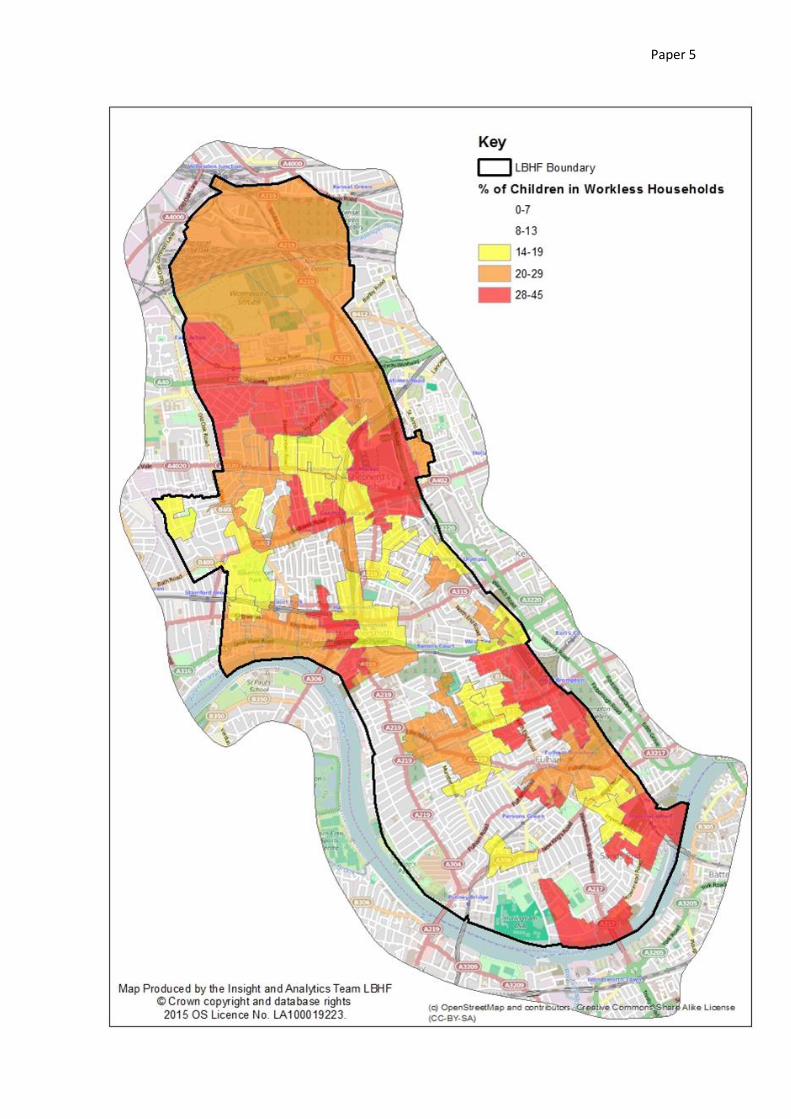
The Hammersmith & Fulham Poverty and Worklessness Commission Paper 5 – Introduction to Hammersmith & Fulham data
a. The Indices of Deprivation 2015 - Hammersmith & Fulham
b. Background maps
Performance and Information Team (FCS, LBHF) 5th
October 2015
The Indices of Deprivation 2015:
Hammersmith and Fulham Briefing
Executive Summary
At a borough level, Hammersmith & Fulham has been measured as less deprived
than in 2010 and 2007.
Average Score – H&F is measured 92nd
most deprived local authority in England
compared to previous measure of 55th
most deprived (59th
in 2007).
Average Rank – H&F is measured 76th
most deprived local authority in England,
compared to previous measure of 31st
most deprived (38th
in 2007).
The lowest ranks are on Living Environment Domain (7th
most deprived in England),
Crime (39th
most deprived), Income (75th
most deprived) and Barriers to Housing and
Services measure (79th
most deprived) out of 326 local authorities in England.
The Borough is not as deprived in the Education, Skills and Training Deprivation (20th
least deprived in England) and Employment Deprivation Domains (180th
least
deprived).
H&F has 8 LSOAs within the 10% most deprived nationally compared to 4 LSOAs in
2010, and 17 LSOAs within 10-20% most deprived (25 in 2010). Conversely, there are
now 11 LSOAs in the 30% least deprived neighbourhoods nationally (1 in 2010).
7% (12,538) of H&F’s population live in the most deprived decile of neighbourhoods
and further 15% (26,424) in the second most deprived decile. 24% (24,012) of the
population are income deprived (in the 20% most deprived) while 15% (19,380) of
the working-age adults are employment deprived (in the 20% most deprived).
Introduction
The following briefing paper outlines an initial summary of the Indices of Deprivation
2015 (ID 2015) from Department for Communities and Local Government published
on 30th
September 2015. As the ID 2007 and 2010, ID 2015 is measured at Lower-
layer Super Output Area (LSOA).
These statistics are a measure of relative deprivation, not affluence, and to recognise
that not every person in a highly deprived area will themselves be deprived.
Likewise, there will be some deprived people living in the least deprived areas.
What are Indices of Deprivation?
Deprivation Indices identify areas of multiple deprivation at the small area level. The
ID 2015 consist of three separate but related indices used by government and other
bodies to identify areas where disadvantage is concentrated, in order to build
programmes or allocate resources appropriately.
Performance and Information Team (FCS, LBHF) 5th
October 2015
The first and main one is the Index of Multiple Deprivation (IMD). This combines 37
indicators into seven distinct domains:
• Income
• Employment
• Education, Skills and Training
• Health Deprivation and Disability
• Crime
• Barriers to Housing and Services
• Living Environment
These seven domains are combined to calculate a single score for each small area in
the country. The deciles are calculated by ranking the 32,844 LSOAs in England from
most deprived to least deprived and dividing them into 10 equal groups.
Two supplementary indices are also available - the Income Deprivation Affecting
Children Index (IDACI) and the Income Deprivation Affecting Older People Index
(IDAOPI).
How the ID 2015 differ from the ID 2010
The Indices of Deprivation 2015 have been produced using the same approach,
structure and methodology used to create the previous Indices of Deprivation 2010
(and the 2007 and 2004 versions).
A modest number of changes to indicators have been implemented since the Indices
of Deprivation 2010. Notably, these changes include broadening the indicator on
housing affordability to include the private rental sector in addition to the owner-
occupied sector and producing the indicator at LSOA level (not district wide), and
two new indicators on claimants of Carer’s Allowance and English language
proficiency.
Deprivation measures across London
25 of the London boroughs rank among the 50 most deprived local authorities in
England on at least one summary measure of the Index of Multiple Deprivation 2015.
London has a very high proportion of small areas among the 20% most deprived in
the country, with over 23% falling into this range (25% in 2010).
London still has a relatively high proportion of areas among the those ranked highest
on the Income Deprivation Affecting Children Index with 14% of London areas
counted among the top 10% in England, down 9 percentage points from 2010 Index.
London has only 15 output areas among the most deprived in the country in terms of
education, skills and training deprivation, at 0.3% among the top 10% in the country.
Tower Hamlets, Hackney, Barking and Dagenham, Newham and Islington again rank
as the most deprived in London and among the top 25 most deprived LAs in England.

Performance and Information Team (FCS, LBHF) 5th
October 2015
Table 1: Rank of the Most Deprived London Boroughs, IMD 2015
* Describes the overall position of people in the district
** Summarises the district as a whole, taking into account the ranks of the deprived and less deprived LSOAs
Deprivation in London is widespread, but not as dense as it was. The map below
shows how the new Index of Multiple Deprivation (IMD) ranks the areas within
London – the darker shades are the most deprived.
Map 1: Deprivation in London
Score* Rank** Score* Rank**
Tower Hamlets 10 6 Ealing 99 87
Hackney 11 2 Kensington and Chelsea 104 99
Barking and Dagenham 12 3 Hounslow 117 86
Newham 23 8 Redbridge 138 119
Islington 24 13 Wandsworth 158 147
Haringey 30 21 Hillingdon 162 153
Waltham Forest 35 15 Havering 167 166
Southwark 40 23 Barnet 172 157
Lambeth 44 22 Bexley 191 195
Lewisham 48 26 Bromley 208 220
Westminster 57 43 Merton 213 212
Enfield 64 53 Sutton 215 217
Brent 68 39 Harrow 219 213
Greenwich 78 50 City of London 231 226
Camden 84 69 Kingston upon Thames 278 278
Hammersmith and Fulham 92 76 Richmond upon Thames 294 296
Croydon 96 91
BoroughRank of Average
BoroughRank of Average

Performance and Information Team (FCS, LBHF) 5th
October 2015
Local Authority Level Measurement
The ID 2015 provides measurements of deprivation for the 326 districts in England.
There are several measures of deprivation at district level and the ranks for H&F are
as follows:
• Average Score – 92nd
most deprived
• Average Rank – 76th
most deprived
• Extent – 99th
most deprived
• Concentration – 129th
most deprived
• LSOAs in most deprived 10% – 111th
most deprived
• Living Environment Score – 7th
most deprived
• Crime Score – 39th
most deprived
• Income Score – 75th
most deprived
• Housing and Services Score – 79th
most deprived
• Health and Disability Score – 99th
most deprived
The first two are the most commonly used measures.
Average Score – H&F is measured as less deprived than in 2010, 92nd
most deprived
compared to previous measure of 55th
most deprived local authority in England (59th
in 2007).
Average Rank - H&F is measured as less deprived than in 2010, 76th
most deprived
compared to previous measure of 31st
most deprived local authority in England (38th
in 2007).
There are two supplementary indices - Income Deprivation affecting Children Index
(IDACI) level for H&F is 37th
most deprived and Income Deprivation Affecting Older
People Index (IDAOPI) level is 17th
most deprived in the country.
Neighbourhood Level Measurement
There are 113 Lower-layer Super Output Areas (LSOAs) in H&F, each comprising
approximately 1,550 residents or 700 households. Deprivation measures are
provided for each LSOA.
ID 2015 measures are currently not provided at ward level - on average each ward in
H&F has 7 LSOAs.
The IMD 2015 was constructed by combining the seven transformed domain scores,
using the following weights:
• Income (22.5%)
• Employment (22.5%)
• Education, skills and training (13.5%)
• Health deprivation and disability (13.5%)
• Crime (9.3%)
• Barriers to Housing and Services (9.3%)
• Living Environment (9.3%)

Performance and Information Team (FCS, LBHF) 5th
October 2015
Each of the 32,844 LSOAs across England has a deprivation measurement from the
IMD (and for each of the domains).
H&F has 8 LSOAs within the 10% most deprived nationally compared to 4 LSOAs in
2010, and 17 LSOAs within 10-20% most deprived (25 in 2010). Conversely, there are
now 11 LSOAs in the 30% least deprived neighbourhoods nationally (1 in 2010).
7% (12,538) of H&F’s population live in the most deprived decile of neighbourhoods
and further 15% (26,424) in the second most deprived decile.
H&F has just over 22% of its LSOAs ranked among the most deprived 20% in England
(27% in 2010). Further 14% are areas that fall within the 20-30% most deprived.
Table 2: H&F LSOAs by the Most Deprived 10% National Bands, 2010 and 2015
Just over 7% of LSOAs (eight LSOAs) in the Borough are ranked in the 10% most
deprived LSOAs nationally. They consist largely of public sector estates: Clem Attlee,
Edward Woods, White City, Wormholt, Charecroft and Ashcroft Square (see Map 2).
Some 15% of LSOAs in H&F are ranked in the next band, 10-20% most deprived.
These areas are mostly in the north of the Borough but also in parts of Hammersmith
and north Fulham.
Number % of LSOAs Number % of LSOAs
0% - 9.9% 4 4 8 7
10% - 19.9% 25 23 17 15
20% - 29.9% 25 23 16 14
30% - 39.9% 24 22 16 14
40% - 49.9% 12 11 19 17
50% - 59.9% 9 8 13 12
60% - 69.9% 11 10 13 12
70% - 79.9% 1 1 8 7
80% - 89.9% 0 0 3 3
90% - 100% 0 0 0 0
TOTAL 111 100 113 100
Rank as
Percentiles
Overall IMD 2010 Overall IMD 2015

Performance and Information Team (FCS, LBHF) 5th
October 2015
Map 2: The top 3 Most Deprived 10% National bands by LSOAs in H&F
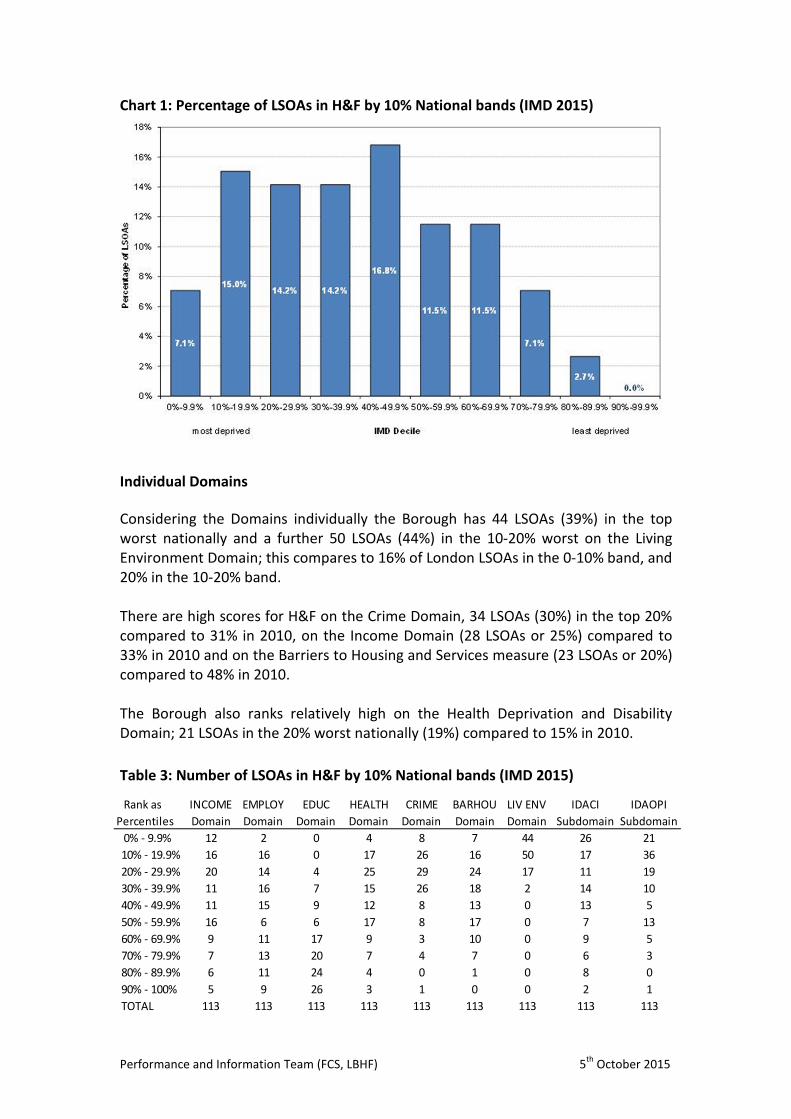
Chart 1 shows the distribution of LSOAs within the national categorisation of the
rankings on the overall IMD. The Borough has a greater number of LSOAs on the left-
hand side (most deprived) of the graph, showing that its deprivation is more spatially
concentrated than the country as a whole.
Clem Attlee
Ashcroft Square
Charecroft
Edward Woods
White City
Wormholt
Performance and Information Team (FCS, LBHF) 5th
October 2015
Chart 1: Percentage of LSOAs in H&F by 10% National bands (IMD 2015)
Individual Domains
Considering the Domains individually the Borough has 44 LSOAs (39%) in the top
worst nationally and a further 50 LSOAs (44%) in the 10-20% worst on the Living
Environment Domain; this compares to 16% of London LSOAs in the 0-10% band, and
20% in the 10-20% band.
There are high scores for H&F on the Crime Domain, 34 LSOAs (30%) in the top 20%
compared to 31% in 2010, on the Income Domain (28 LSOAs or 25%) compared to
33% in 2010 and on the Barriers to Housing and Services measure (23 LSOAs or 20%)
compared to 48% in 2010.
The Borough also ranks relatively high on the Health Deprivation and Disability
Domain; 21 LSOAs in the 20% worst nationally (19%) compared to 15% in 2010.
Table 3: Number of LSOAs in H&F by 10% National bands (IMD 2015)
Rank as
Percentiles
INCOME
Domain
EMPLOY
Domain
EDUC
Domain
HEALTH
Domain
CRIME
Domain
BARHOU
Domain
LIV ENV
Domain
IDACI
Subdomain
IDAOPI
Subdomain
0% - 9.9% 12 2 0 4 8 7 44 26 21
10% - 19.9% 16 16 0 17 26 16 50 17 36
20% - 29.9% 20 14 4 25 29 24 17 11 19
30% - 39.9% 11 16 7 15 26 18 2 14 10
40% - 49.9% 11 15 9 12 8 13 0 13 5
50% - 59.9% 16 6 6 17 8 17 0 7 13
60% - 69.9% 9 11 17 9 3 10 0 9 5
70% - 79.9% 7 13 20 7 4 7 0 6 3
80% - 89.9% 6 11 24 4 0 1 0 8 0
90% - 100% 5 9 26 3 1 0 0 2 1
TOTAL 113 113 113 113 113 113 113 113 113

Performance and Information Team (FCS, LBHF) 5th
October 2015
The Borough is not as deprived in the Education, Skills and Training Deprivation (no
LSOAs in the 20% worst nationally) and Employment Deprivation Domain (18 LSOAs
in the 20% worst nationally).
Income Deprivation Domain - this measures the proportion of the population
experiencing deprivation relating to low income. The definition of low income used
includes both those people that are out-of-work, and those that are in work but who
have low earnings (and who satisfy the respective means tests) (see Appendix 1 Map
1).
• 12 LSOAs (11% of the borough) in the 10% most deprived nationally (15
LSOAs in 2010)
• 28 LSOAs (25% of the borough) in the 20% most deprived nationally (37
LSOAs in 2010)
24% (24,012) of the population are income deprived (in the 20% most deprived
nationally). But in the two least deprived deciles of this deprivation domain, 10%
(17,280) of people are income deprived.
Sub Domain – Income Deprivation affecting Children Index (IDACI) – this measures
the proportion of all children aged 0 to 15 living in income deprived families. The
levels of child poverty are much higher in London than any other region. For H&F the
levels are similar to the 2010 measurement (see Appendix 1 Map 2).
• 26 LSOAs (23% of the borough) in the 10% most deprived nationally (34
LSOAs in 2010)
• 43 LSOAs (38% of the borough) in the 20% most deprived nationally (54
LSOAs in 2010)
Over 43% (12,965) of children aged 0 to 15 live in income deprived families (in the
20% most deprived nationally).
Sub Domain – Income Deprivation Affecting Older People Index (IDAOPI) - this
measures the proportion of residents aged 60 and over who experience income
deprivation (see Appendix 1 Map 3).
• 21 LSOAs (19% of the borough) in the 10% most deprived nationally (13
LSOAs in 2010)
• 57 LSOAs (50% of the borough) in the 20% most deprived nationally (35
LSOAs in 2010)
Over 49% (8,337) of older people aged 65+ are income deprived (in the 20% most
deprived nationally).
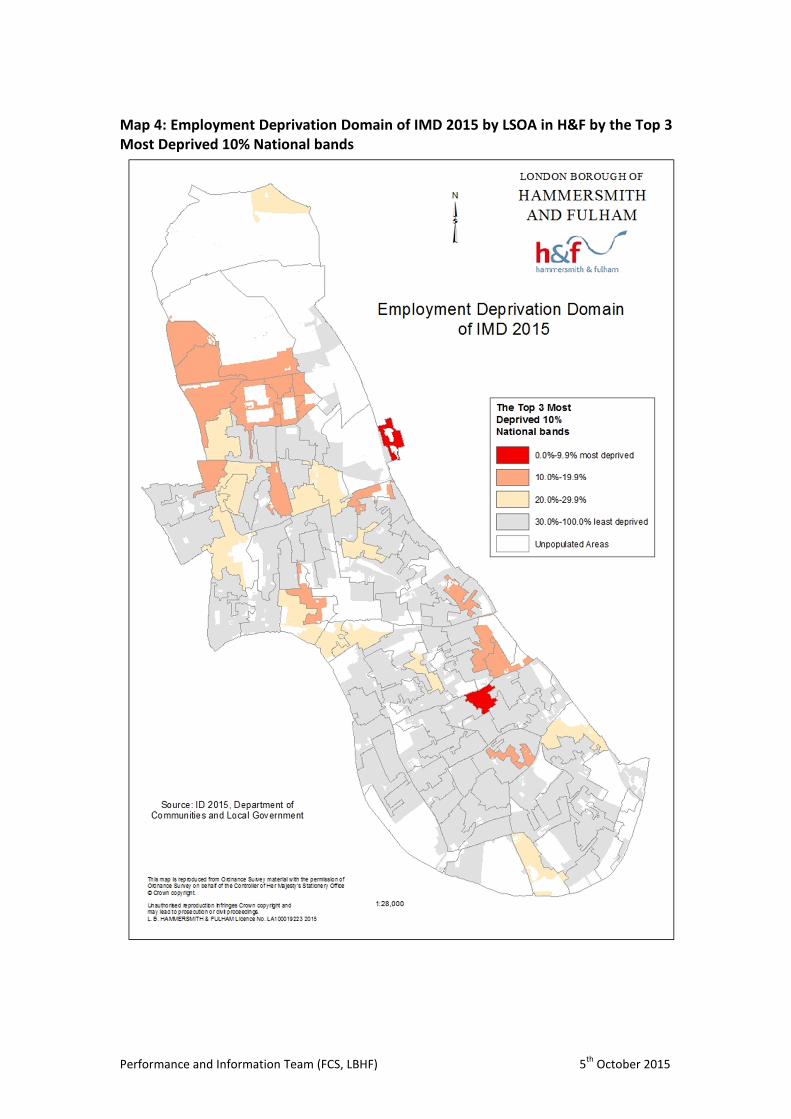
Employment Deprivation Domain - this measures the proportion of the working age
population in an area involuntarily excluded from the labour market. This includes
people who would like to work but are unable to do so due to unemployment,
sickness or disability, or caring responsibilities (see Appendix 1 Map 4).
• 2 LSOAs (2% of the borough) in the 10% most deprived nationally (6 in 2010)
• 18 LSOAs (16% of the borough) in the 20% most deprived nationally (23
LSOAs in 2010)
Performance and Information Team (FCS, LBHF) 5th
October 2015
15% (19,380) of the working-age adults are employment deprived (in the 20% most
deprived nationally). In the two least deprived deciles of this deprivation domain,
17% (22,711) of adults are employment deprived.
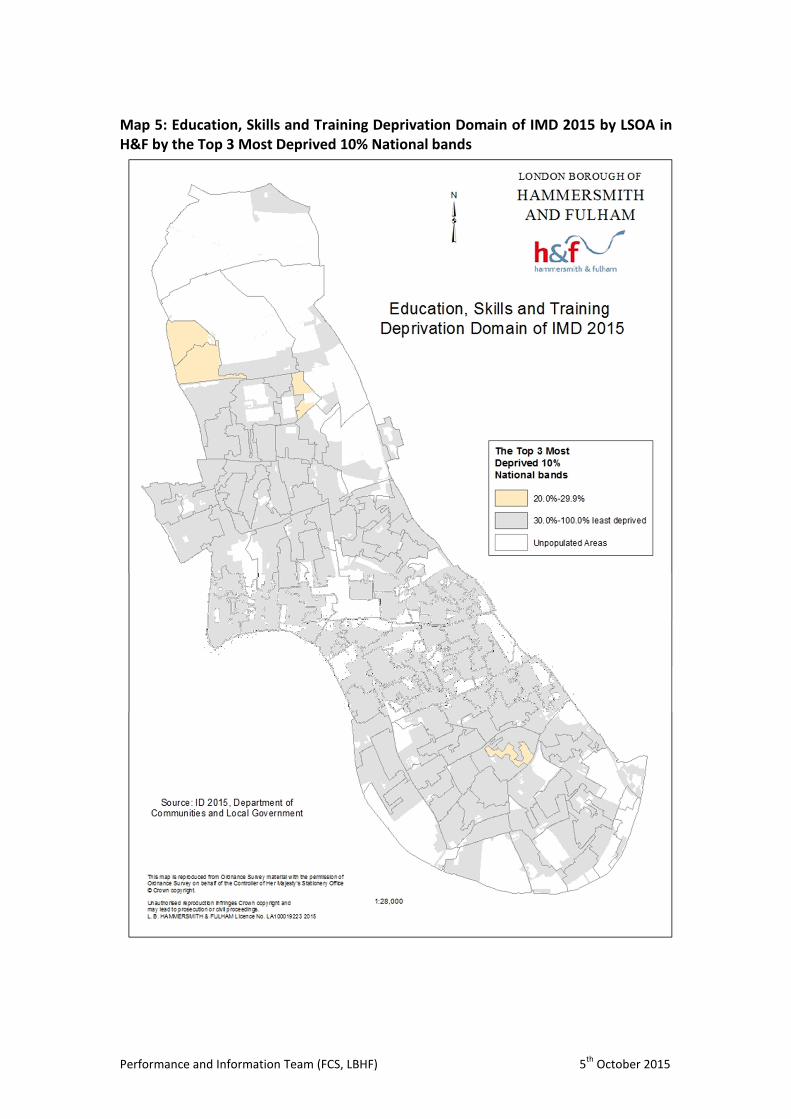
Education, Skills and Training Deprivation Domain - this measures the lack of
attainment and skills in the local population. The indicators fall into two sub-
domains: one relating to children and young people and one relating to adult skills
(see Appendix 1 Map 5).
There are no H&F LSOAs in the 20% most deprived on this domain (none in 2010). 2
LSOAs are in the 20% most deprived on the children and young people sub-domain
and 2 LSOA on the adult skills sub-domain.
Health Deprivation and Disability Domain – this measures the risk of premature
death and the impairment of quality of life through poor physical or mental health.
The domain measures morbidity, disability and premature mortality but not aspects
of behaviour or environment that may be predictive of future health deprivation
(see Appendix 1 Map 6).
• 4 LSOAs (4% of the borough) in the 10% most deprived nationally (3 in 2010)
• 21 LSOAs (19% of the borough) in the 20% most deprived nationally (17
LSOAs in 2010)
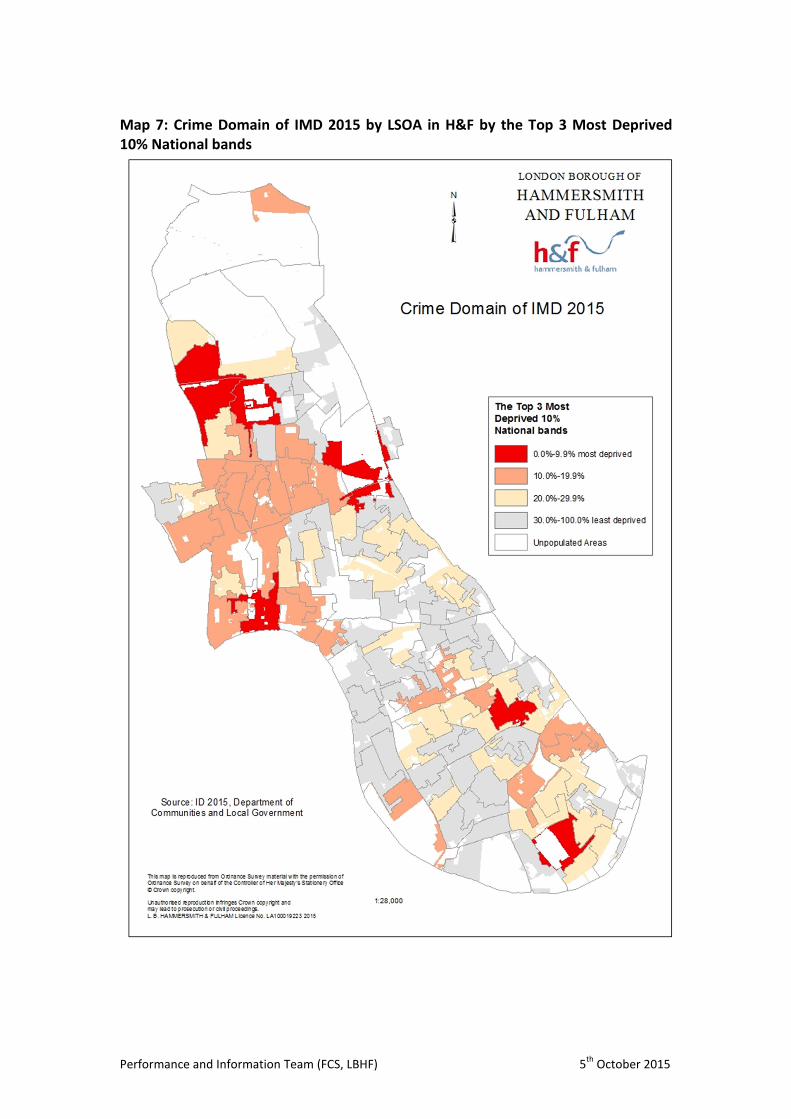
Crime Domain - this measures the risk of personal and material victimisation at local
level (see Appendix 1 Map 7).
• 8 LSOAs (7% of the borough) in the 10% most deprived nationally (7 in 2010)
• 34 LSOAs (30% of the borough) in the 20% most deprived nationally (34
LSOAs in 2010)
Barriers to Housing and Services Domain - separate measures for barriers to
housing and the geographical distance to key local services are included in the same
domain. Densely populated urban areas have high scores on the housing measure
and low scores on the key local services measure (see Appendix 1 Map 8).
• 7 LSOAs (6% of the borough) in the 10% most deprived nationally (6 in 2010)
• 23 LSOAs (20% of the borough) in the 20% most deprived nationally (53
LSOAs in 2010)
Living Environment Deprivation Domain - this measures housing stock condition, air
quality and road traffic accidents involving pedestrians and cyclists (see Appendix 1
Map 9).
• 44 LSOAs (39% of the borough) in the 10% most deprived nationally (55
LSOAs in 2010)
• 94 LSOAs (83% of the borough) in the 20% most deprived nationally (95
LSOAs in 2010)
The results shown in Tables 1-8 (Appendix 2) show the proportion of the population
living in neighbourhoods grouped into deciles of each of the Deprivation Domains.

Performance and Information Team (FCS, LBHF) 5th
October 2015
APPENDIX 1
Map 1: Income Deprivation Domain of IMD 2015 by LSOA in H&F by the Top 3 Most
Deprived 10% National bands

Performance and Information Team (FCS, LBHF) 5th
October 2015
Map 2: Income Deprivation Affecting Children Index (IDACI) of IMD 2015 by LSOA
in H&F by the Top 3 Most Deprived 10% National bands

Performance and Information Team (FCS, LBHF) 5th
October 2015
Map 3: Income Deprivation Affecting Older People Index (IDAOPI) of IMD 2015 by
LSOA in H&F by the Top 3 Most Deprived 10% National bands
Performance and Information Team (FCS, LBHF) 5th
October 2015
Map 4: Employment Deprivation Domain of IMD 2015 by LSOA in H&F by the Top 3
Most Deprived 10% National bands
Performance and Information Team (FCS, LBHF) 5th
October 2015
Map 5: Education, Skills and Training Deprivation Domain of IMD 2015 by LSOA in
H&F by the Top 3 Most Deprived 10% National bands

Performance and Information Team (FCS, LBHF) 5th
October 2015
Map 6: Health Deprivation and Disability Domain of IMD 2015 by LSOA in H&F by
the Top 3 Most Deprived 10% National bands
Performance and Information Team (FCS, LBHF) 5th
October 2015
Map 7: Crime Domain of IMD 2015 by LSOA in H&F by the Top 3 Most Deprived
10% National bands

Performance and Information Team (FCS, LBHF) 5th
October 2015
Map 8: Barriers to Housing and Services Domain of IMD 2015 by LSOA in H&F by
the Top 3 Most Deprived 10% National bands

Performance and Information Team (FCS, LBHF) 5th
October 2015
Map 9: Living Environment Deprivation Domain of IMD 2015 by LSOA in H&F by the
Top 3 Most Deprived 10% National bands

Performance and Information Team (FCS, LBHF) 5th
October 2015
APPENDIX 2
Table 1: Proportion of the H&F’s population living in neighbourhoods grouped into
deciles of the overall deprivation by broad age groups
Table 2: Proportion of the H&F’s population living in neighbourhoods grouped into
deciles of the Income Deprivation Domain by broad age groups
Table 3: Proportion of the H&F’s population living in neighbourhoods grouped into
deciles of the Employment Deprivation Domain by broad age groups
aged 0-15 aged 16-64 aged 65+ All ages Households
0% - 9.9% 9.5 6.4 7.3 7.0 6.7
10% - 19.9% 17.7 14.2 13.7 14.7 14.0
20% - 29.9% 13.4 14.9 16.5 14.8 14.9
30% - 39.9% 13.4 14.3 14.8 14.2 14.5
40% - 49.9% 14.7 17.8 14.5 17.0 17.9
50% - 59.9% 10.2 11.7 12.1 11.5 11.8
60% - 69.9% 11.1 11.6 10.3 11.4 11.3
70% - 79.9% 7.6 6.9 7.0 7.0 6.4
80% - 89.9% 2.4 2.3 3.9 2.5 2.6
90% - 100% 0.0 0.0 0.0 0.0 0.0
Deprivation
Deciles
Overall IMD 2015 (% of population)
aged 0-15 aged 16-64 aged 65+ All ages Households
0% - 9.9% 15.4 9.8 10.5 10.8 9.7
10% - 19.9% 15.0 12.8 13.2 13.2 13.0
20% - 29.9% 17.8 18.6 20.8 18.6 18.9
30% - 39.9% 9.0 10.3 9.5 10.0 10.2
40% - 49.9% 7.9 10.4 9.9 10.0 10.5
50% - 59.9% 11.5 14.6 12.7 13.9 14.7
60% - 69.9% 7.5 7.9 6.9 7.7 8.0
70% - 79.9% 5.9 6.2 6.0 6.1 5.8
80% - 89.9% 6.1 5.4 5.7 5.5 5.0
90% - 100% 3.9 4.1 4.7 4.1 4.2
Deprivation
Deciles
Income Deprivation 2015 (% of population)
aged 0-15 aged 16-64 aged 65+ All ages Households
0% - 9.9% 2.2 1.5 1.9 1.6 1.8
10% - 19.9% 18.9 13.1 14.2 14.2 12.9
20% - 29.9% 11.8 11.9 13.4 12.1 12.1
30% - 39.9% 14.0 14.9 14.6 14.7 14.6
40% - 49.9% 13.4 14.0 13.9 13.9 14.5
50% - 59.9% 4.1 5.9 3.9 5.4 5.9
60% - 69.9% 8.1 10.3 9.2 9.8 10.3
70% - 79.9% 10.0 11.2 11.2 11.0 11.2
80% - 89.9% 9.8 9.2 9.5 9.3 9.0
90% - 100% 7.7 7.9 8.3 7.9 7.7
Deprivation
Deciles
Employment Deprivation 2015 (% of population)

Performance and Information Team (FCS, LBHF) 5th
October 2015
Table 4: Proportion of the H&F’s population living in neighbourhoods grouped into
deciles of the Education, Skills and Training Domain by broad age groups
Table 5: Proportion of the H&F’s population living in neighbourhoods grouped into
deciles of the Health Deprivation and Disability Domain by broad age groups
Table 6: Proportion of the H&F’s population living in neighbourhoods grouped into
deciles of the Crime Deprivation Domain by broad age groups
aged 0-15 aged 16-64 aged 65+ All ages Households
0% - 9.9% 0.0 0.0 0.0 0.0 0.0
10% - 19.9% 0.0 0.0 0.0 0.0 0.0
20% - 29.9% 5.1 3.2 3.5 3.6 3.1
30% - 39.9% 7.9 5.5 6.1 5.9 5.5
40% - 49.9% 9.3 7.9 8.7 8.2 7.2
50% - 59.9% 5.6 5.2 5.3 5.3 5.4
60% - 69.9% 14.2 14.9 14.5 14.7 15.4
70% - 79.9% 16.2 17.9 19.5 17.8 18.4
80% - 89.9% 19.5 23.2 17.8 22.1 22.4
90% - 100% 22.2 22.2 24.6 22.4 22.5
Deprivation
Deciles
Education, Skills & Training Domain 2015 (% of population)
aged 0-15 aged 16-64 aged 65+ All ages Households
0% - 9.9% 4.9 3.1 3.1 3.4 3.4
10% - 19.9% 14.4 14.9 16.3 14.9 15.3
20% - 29.9% 24.1 21.4 22.1 21.9 21.5
30% - 39.9% 11.9 14.4 13.6 13.9 13.8
40% - 49.9% 9.3 10.7 10.0 10.4 10.9
50% - 59.9% 14.5 16.2 13.3 15.7 15.9
60% - 69.9% 7.1 7.6 7.4 7.5 7.6
70% - 79.9% 6.8 6.4 6.7 6.5 6.1
80% - 89.9% 4.4 3.0 4.1 3.4 3.0
90% - 100% 2.7 2.3 3.3 2.5 2.4
Deprivation
Deciles
Health Deprivation and Disability 2015 (% of population)
aged 0-15 aged 16-64 aged 65+ All ages Households
0% - 9.9% 8.4 7.4 8.0 7.6 7.2
10% - 19.9% 22.4 22.0 24.3 22.3 22.4
20% - 29.9% 26.9 24.6 23.9 24.9 24.9
30% - 39.9% 21.8 23.1 22.8 22.9 22.8
40% - 49.9% 6.9 7.4 6.7 7.3 7.4
50% - 59.9% 7.3 8.5 7.3 8.2 8.1
60% - 69.9% 2.9 2.8 3.2 2.8 3.0
70% - 79.9% 2.9 3.4 2.3 3.2 3.5
80% - 89.9% 0.0 0.0 0.0 0.0 0.0
90% - 100% 0.4 0.7 1.5 0.8 0.8
Deprivation
Deciles
Crime Deprivation Domain 2015 (% of population)
Performance and Information Team (FCS, LBHF) 5th
October 2015
Table 7: Proportion of the H&F’s population living in neighbourhoods grouped into
deciles of the Barriers to Housing and Services Domain by broad age groups
Table 8: Proportion of the H&F’s population living in neighbourhoods grouped into
deciles of the Living Environment Domain by broad age groups
All of the data files and supporting documents are available on the DCLG website at:
https://www.gov.uk/government/statistics/english-indices-of-deprivation-2015
Milan Ognjenovic, Principal Performance & Information Officer (FCS, LBHF)
aged 0-15 aged 16-64 aged 65+ All ages Households
0% - 9.9% 7.9 6.0 6.0 6.3 6.2
10% - 19.9% 15.9 13.2 12.3 13.6 13.4
20% - 29.9% 20.1 22.4 21.0 21.9 21.5
30% - 39.9% 15.1 15.9 18.1 16.0 17.2
40% - 49.9% 9.8 12.2 11.6 11.8 11.9
50% - 59.9% 14.9 15.2 15.1 15.1 14.9
60% - 69.9% 9.4 8.5 9.9 8.8 8.5
70% - 79.9% 6.0 5.7 5.3 5.7 5.6
80% - 89.9% 0.8 0.7 0.9 0.8 0.8
90% - 100% 0.0 0.0 0.0 0.0 0.0
Deprivation
Deciles
Barriers to Housing and Services 2015 (% of population)
aged 0-15 aged 16-64 aged 65+ All ages Households
0% - 9.9% 34.0 40.3 36.6 38.9 40.9
10% - 19.9% 44.6 42.7 46.9 43.4 43.1
20% - 29.9% 19.1 15.3 14.2 15.9 14.4
30% - 39.9% 2.2 1.6 2.3 1.8 1.7
40% - 49.9% 0.0 0.0 0.0 0.0 0.0
50% - 59.9% 0.0 0.0 0.0 0.0 0.0
60% - 69.9% 0.0 0.0 0.0 0.0 0.0
70% - 79.9% 0.0 0.0 0.0 0.0 0.0
80% - 89.9% 0.0 0.0 0.0 0.0 0.0
90% - 100% 0.0 0.0 0.0 0.0 0.0
Deprivation
Deciles
Living Environment Domain 2015 (% of population)

Paper 5

Paper 5

Paper 5

Paper 5
Paper 5
Paper 5

Paper 5
Paper 5

Paper 5

Paper 5
Paper 5
Paper 5

Paper 6
1
Poverty and Worklessness Commission
Initial report findings: defining poverty and worklessness
Absolute vs. relative poverty
The debate on the definition of poverty begins with the distinction between absolute and
relative poverty. The Resolution Foundation offer the following definitions:
Absolute poverty: establishes an income threshold at a given point in time and then fixes it (raising it with inflation each year). Relative poverty: sets a threshold that relates to a contemporary measure of society’s resources each year – contextualising poverty relative to current ‘norms’ of income.
(Resolution Foundation, 2015)
Absolute poverty is defined in terms of survival and subsistence, based largely on the
capacity to maintain the physical ability to work and raise a family. Relative poverty can be
broadly defined as lacking socially acceptable standards of living, which varies between
societies. Relative poverty is generally deemed by academia and policy-makers to be a
more reliable approach to capture people’s lived experience of poverty and worklessness.
Defining poverty
Income poverty
The traditional and most common measure of relative poverty in the UK and the European
Union use 60 per cent of median income as the poverty threshold, below which people are
deemed to be living in relative poverty.

Paper 6
2
While this allows for easy comparisons across time and between different countries, it is
widely criticised as being an arbitrary measure that only takes into account one factor of
deprivation, excluding other sources of finances as well as the effects of debt and level of
service provision. As an indirect measure of living standards, it creates an incomplete picture
of the true nature of poverty in people’s lives, and is under increasing scrutiny with rising
levels of inequity.
Levels of deprivation
While income poverty assesses an individual’s economic capability, levels of deprivation
capture poverty levels by looking at how people live, including indicators such as access to
key services, and participation in society. The perception of what can be defined as
deprivation affects key labour market public policies, such as the minimum wage and the
Living Wage.
Different methods attempt to capture and measure levels of deprivation; the Living
Standards approach considers aspects of poverty that would better reflect people’s quality
of life, including capital assets, level of public service provision, employee benefits and
disposable income. Consensual methods, pioneered in 1983 by the study Breadline
Britain, uses a qualitative approach to determine the public’s perception of minimum needs
whilst taking into account lifestyle choices. This approach has been developed over the
years by five surveys in 1983, 1990, 1999, 2002 and 2012 to account for the public’s
changing perceptions of minimum standards of living.
Defining worklessness
Definitions of worklessness vary. Often it is used describe all people who are not employed.
A 2011 DWP report undertaken by the Oxford Institute of Social Policy defines worklessness
as being those ‘involuntarily excluded from the labour market and in receipt of certain
benefits’, and uses the following five population segments; job seekers, those in incapacity
benefits, lone parents, carers and ‘others’ – a mixed group all claiming out-of-work benefits
(OISP, 2011). The expanded segment definitions include caveats of the types of benefits
these groups are receiving, and calculates a rate of worklessness using the number of
workless people divided by the working-age population in that area (men aged 16 to 64
inclusive and women aged 16 to 59 inclusive) (OISP, 2011).
The ONS uses ‘worklessness’ to differ from unemployment as it implies a longer-term status
of not being in work. It correlates worklessness with deprivation, and acknowledges that it’s
difficult to define. The distinction the ONS makes between shorter-term unemployed
populations and longer-term economically inactive populations, :
Unemployed population: people who are without a job, want a job, have actively sought
work in the last four weeks and are available to start work in the next two weeks or are out of
work, have found a job and are waiting to start it in the next two weeks.
Economically inactive population (worklessness): those without a job who have not
actively sought work in the last four weeks, and/or are not available to start work in the next
two weeks (ONS, 2009).

Paper 6
3
The notion of a ‘culture’ of worklessness, behavioural policy and intergenerational
worklessness will be scrutinised by the Commission. Initial findings have generated research
from the Joseph Rowntree Foundation in 2012, which found that there is far more myth in
the policy problem of intergenerational worklessness than reality. Worklessness spanning
across three generations was extremely hard to locate, and a ‘culture of worklessness’ was
not substantiated in evidence; people involved in the study were committed to the value of
work, wanted a job and parents wanted their children to do better than they had (JRF, 2012).
Depending on the outcome of the commission findings, there might be different
recommendations for different populations of people out of work.
Poverty and worklessness: the relationship
Poverty and worklessness have a cyclical relationship, and have clear correlation. The
complexity is in distinguishing between causes and symptoms of poverty and worklessness,
which will inform what to look for in analysing existing levels in Hammersmith and Fulham,
and informing action and intervention to reduce them. Associated factors include skills,
political freedoms, health (including mental health) and housing.
A 2010 study on recurrent poverty by the Joseph Rowntree Foundation used the policy
phrase ‘low pay, no pay cycle’ to describe how ‘once poor, people will suffer poverty
repeatedly’ (JRF, 2010). The study looked at income poverty, financial strain and material
deprivation using longitudinal data over a 15 year period and found that certain groups were
prone to recurrent poverty; those with limited education; skilled manual and lower skilled
workers; single parents and unemployed and economically inactive people (Ibid).
The study also stressed the importance of the ‘quality of employment’, rather than the mere
status of being employed, and training and good employment conditions were seen as
integral to providing this quality. A job on the ‘periphery of the labour market’ which was
‘temporary or unstable’ did not adequately protect people from poverty. Changes in family
composition, such as a new baby or a divorce, access to childcare and changes in the
labour market have a high impact on poverty levels.
Public policy, including topical aspects such as benefits, tax credits and public services also have significant impact on poverty and worklessness. Child poverty is also commonly used as an indicator of poverty levels. The most recent research from the Resolution Foundation released in October 2015 has estimated that 200,000 children (predominantly from working households) will fall into poverty in 2016, coinciding with increasingly less ambitious targets on tackling child poverty levels. This research also estimated that the cuts to working age benefits will increase levels of poverty amongst those in working households (Resolution Foundation, 2015). An emerging conclusion across the data and literature is that poverty is increasingly experienced by people who are in work: ‘the focus on worklessness removes any focus on working poverty – despite two in every three poor children living in working households’. (Resolution Foundation, 2015) In order to effectively and thoroughly address levels of poverty, attention will need to focus on populations experiencing poverty and worklessness simultaneously, and those experiencing poverty in work. A focus on those exclusively out of work will not capture poverty experienced by the growing segment of the working poor.