the growth of modern business enterprises in the twentieth century
TRANSCRIPT

The Growth of Modern Business Enterprises in the Twentieth Century
Sukkoo Kim
Washington University in St. Louis and
NBER
March 1999
Research assistance from Jennifer Loughman and Jessica Mikecz, financial assistance from the John M. Olin Foundation, and comments from Alex Field and an anonymous referee are gratefully acknowledged.
2
ABSTRACT
This paper uses the census bureau’s Enterprise Statistics to document the growth of the modern
multiunit firm in the American economy. The data show that, although the great majority of
American business enterprises operated as traditional single-unit firms, a small number of
modern multiunit firms exerted a significant influence on the American economy. By the second
half of the twentieth century, these multiunit firms accounted for over half of all employees. In
addition, the paper uses a unique Federal Trade Commission data on retail chain stores, as well
as data from the Enterprise Statistics, to examine the rise of multiunit firms in distribution and in
production. These data sources suggest that economies in marketing rather than those of scale
and scope explain the rise of the modern multiunit business enterprise.
3
I. INTRODUCTION
The analysis of the origins of the modern multiunit firm by the business historian, Alfred
Chandler, has significantly influenced the work of historians and economic historians.1 In The
Visible Hand (1977), Chandler argued that the modern multiunit firm replaced the traditional
single-unit firm when administrative rather than market coordination became more efficient.
According to Chandler, for most of the eighteenth and the early nineteenth centuries, when the
processes of distribution and production of goods were based on traditional sources of energy
such as man, animal, and wind power, the market mechanism remained efficient. However, in
the middle of the nineteenth century, when firms began using coal, and as the speed and volume
of goods moving from production to distribution increased, the managers of multiunit enterprises
became more efficient at coordinating the distribution and production of goods in the economy.
Chandler argued that the first modern business enterprises appeared in the railroad and
telegraph industries for technological as well as organizational reasons. The steam engine, which
replaced horses, increased the speed of locomotives significantly. However, the greater speed of
throughput came with a potential hazard. Since most trains ran on single tracks, the railroads
were subject to accidents unless the trains ran at very low speeds or unless the traffic schedules
were centrally coordinated and monitored. The integration in one firm of station agents,
conductors, locomotive engineers, shop foremen, and the master of transportation allowed the
trains to achieve speed with safety. The efficient running of the various operating units also
necessitated collecting and interpreting a constant flow of information concerning their
efficiency. To evaluate and monitor the performance of the geographically dispersed operations
of multiunit firms, the managers of the railroads invented most of the modern accounting and
4
statistical practices.
The rise of modern business enterprise in the railroad and telegraphs, which led to the
establishment of the necessary infrastructure in transportation and communication, set the stage
for the rise of modern business enterprise in mass distribution and in mass production. According
to Chandler, the transformation came quickly in the mass distribution sector since the revolutions
in transportation and communication made possible the speedy flow of goods through the
economy. Morever, the products distributed by the wholesalers and retailers were in traditional
labor intensive and technologically simple industries. In the mass production sector, the
revolution came more slowly since it required further technological and organizational
innovations. In many industries, advances in basic production technologies, often intensive in
capital and energy, were necessary to achieve the high-speed of throughput. Finally, the
revolution culminated with the integration of mass production and mass distribution as the
modern industrial firms integrated forward into distribution and backward into raw materials.
In The Visible Hand (1977), Chandler presents a narrative history of the rise of the
modern business enterprise and, in concert with his more recent work, Scale and Scope (1990),
provides an analysis of the sources of modern economic growth. According to Chandler, modern
economic growth is based upon high volume production technology which takes advantage of
economies of scale (or throughput) and scope. However, in order to realize these economies,
Chandler argued that it was necessary for firms to vertically integrate forward into distribution to
ensure sales of sufficient volume and to vertically integrate backward into raw materials to
ensure a constant flow of inputs. In the modern economy, the pace of economic growth was
ultimately set by hierarchy of middle managers who coordinated and monitored the activities of
5
the modern multiunit firms.
Yet, despite the elegant narrative framework of The Visible Hand and despite the use of
numerous anecdotal evidence, answers to many basic questions concerning the rise of the
modern business firm and its contribution to modern economic growth remain largely
unsubstantiated by systematic evidence. For example, how important is the modern multiunit
firm in the American economy? In which sectors of the economy are the multiunit firms most
important? What are the sizes and structures of multiunit firms? Do multiunit firms achieve their
sizes by operating larger plants or do they achieve their sizes by acquiring more establishments?
If multiunit firms are vertically integrated, what is the extent of their industrial diversification?
While Chandler provides answers to many of these questions, the results are based on a small
sample of large multiunit enterprises and on relatively limited information.
This paper uses the census bureau’s Enterprise Statistics to document the extent to which
distribution and production are organized by modern multiunit firms in the American economy.
In order to assess the economic importance of modern business enterprises, it is necessary to
establish the extent to which economic activity is organized in multiunit versus traditional single-
unit firms. The paper also uses data on retail multiunit firms collected by the Federal Trade
Commission and the Enterprise Statistics data to examine the rise of mass distribution and mass
production firms. In order to determine the economic contribution of multiunit firms to the
modern economy, it is also necessary to compare the costs and benefits of organizing economic
activities in multiunit firms as compared with that of single-unit firms. However, the magnitude
of the benefits of organizing economic activities in multiunit firms as compared with single-unit
firms is determined by the sources of the economic efficiency of multiunit firms and these
6
sources, in turn, depend critically upon the causes of the rise of modern multiunit firms.
The data show that, although the great majority of American business enterprises
operated as traditional single-unit firms, a small number of modern multiunit firms exerted a
significant influence on the American economy. By the second half of the twentieth century,
these multiunit firms accounted for over half of all employees. However, the importance of
multiunit firms varied widely across industries. The data also suggest that the multiunit firms
emerged in the various industries to take advantage of multiunit economies in marketing and
research and development. Thus, contrary to claims made by Chandler, the contribution of
modern multiunit firms on economic growth are likely to hinge on the magnitude of economies
of marketing rather than those of scale and scope.
The paper is organized as follows. Section II documents the general characteristics of
American business enterprises. Section III investigates the causes of the rise of multiunit firms in
mass distribution and mass production. The section also examines the contribution of modern
multiunit firms to economic growth. Finally, section IV concludes with a summary.
II. THE GENERAL CHARACTERISTICS OF THE AMERICAN BUSINESS ENTERPRISE
This section uses the census bureau’s Enterprise Statistics to document the growth of
modern multiunit firms in the major sectors of the economy.2 Using the Enterprise Statistics, it is
possible to determine the extent to which modern multiunit firms have penetrated the American
economy in the twentieth century. In addition, the data source provides significant information
concerning the general characteristics of single-unit and multiunit firms such as the industry
clustering of multiunit activity, the firm sizes of single-unit and multiunit firms, the number of

7
plants owned by multiunit firms, industry specialization ratios, and the size and composition of
the central administrative organizations of multiunit firms. This data on the general
characteristics of firms provide important clues to the rise of the modern business enterprise.
The Enterprise Statistics’ definition of a company or a firm consists of all operating
establishments, such as factories, mines, stores, sales offices, etc., including any administrative
or auxiliary activities, such as central offices, central warehouses, research and development
laboratories, and other supporting services, which were reported as being under common
ownership or control.3 Each company or firm is classified into an industry category which differs
slightly from that of the 3-digit Standard Industrial Classification system. Over time, the
industrial coverage of the Enterprise Statistics has increased slightly. In 1958, there were 135
industry categories which covered mining, wholesale trade, retail trade, manufacturing,
warehousing, and select service industries; in 1987, there were 146 industry categories which
also included the construction and transportation industries.4
The Extent of Single-unit and Multiunit Firms
In the second half of the twentieth century, most business firms in the United States were
traditional single-unit rather than modern multiunit enterprises. Table 1 shows that in 1958,
single-unit firms accounted for 97.1 percent of all firms or 3.06 million of the 3.15 million firms
in the sample of the Enterprise Statistics. In 1987, 3.71 million of 3.88 million or 95.7% of firms
were of the single-unit type. However, a small number of large multiunit firms exerted
considerable influence on the American economy. By the second half of the twentieth century,
the modern multiunit firms employed a majority of the labor force. In 1958, the 91,323 multiunit
firms which represented a mere 2.9 percent of all firms accounted for 53.8 percent of the 31
8
million employees. The importance of multiunit firms in terms of employment increased slightly
over time. In 1987, the 166,546 multiunit firms which represented 4.3% of all firms accounted
for 55.5 percent of the 68.1 million employees.
The importance of multiunit firm activity differed considerably across, and often within,
the broad sectors of the economy. In 1958, multiunit activity was most significant in
manufacturing and in mining, moderately significant in retail trade, and insignificant in services
and in wholesale trade. Table 1 shows that multiunit manufacturing firms accounted for nearly
70 percent of employees in their sector; mining firms, 57 percent; retail trade firms, 40 percent;
and multiunit services and wholesale trade firms, less than 30 percent.5 It also shows that, except
for the mining sector, the importance of multiunit firms rose over time. The growth was only
modest in the manufacturing sector but quite significant in retail trade, wholesale trade and
services. By 1987, approximately 60 percent of employees worked in multiunit firms in the retail
sector and over 40 percent in the wholesale trade and service sectors.
In many sectors, the differences in the importance of multiunit activity in industries
within these major sectors were just as significant. In minerals, multiunit activity was
significantly above that sector’s average for metal mining in 1958 and 1987 and for coal mining
in 1987. In retail trade, general merchandise was significantly above the industry average for
both years whereas food and apparel became above industry average in 1987. In the
manufacturing sector, tobacco, chemicals, petroleum, primary metals, electrical, transportation,
and instruments industries were significantly above that sector’s average for both years. Finally,
in services, multiunit employment in the motion pictures industry was significantly higher than
other service industries for both years.

9
The Industrial Distribution of Firms
The importance of multiunit firms in the overall economy increased only marginally over
the second half of the twentieth century even though, in many industries, its importance
increased significantly. The moderate growth in the importance of the multiunit firm is
accounted for by a shift in the industrial distribution of firms away from manufacturing to
wholesale trade, retail trade, and other service industries. In 1958, manufacturing firms led all
sectors in terms of employment with 55.8 percent; however, by 1987, their share fell to 39.5
percent as shares in wholesale trade, retail trade, and services increased from 42.3 to 59.7
percent.6 Since multiunit activity is relatively more important in manufacturing than in these
service industries, the changes in the industrial distribution of firms placed downward pressure of
the importance of multiunit firms in the overall economy. However, this pressure was mitigated
by the growth in the importance of multiunit activity in the various service industries.
TABLE 1 ABOUT HERE
The Sizes of Firms
The few multiunit firms exerted disproportionate influence on the American economy
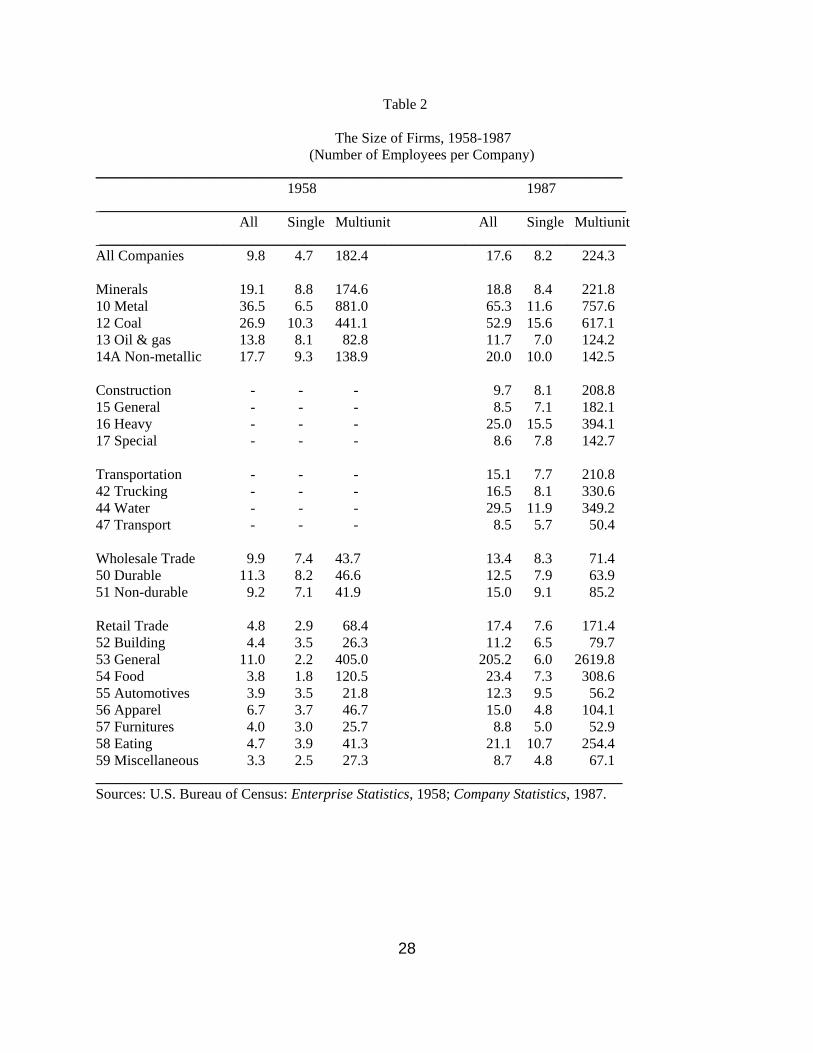
because they were considerably larger than the traditional single-unit firms. Table 2 shows that
in 1958, the size of multiunit firms was 182.4 employees per worker as compared to only 4.7 for
single-unit firms. The predominance of small single-unit firms, especially in retail trade and
services, was responsible for the low overall average. In these two industries, the single-unit
firms averaged fewer than 3 workers per firm. In wholesale trade and minerals, the size of single-

10
unit firms was slightly larger at 8 workers and in manufacturing, the figure was 22. In
comparison, the size of multiunit firms was significantly larger than single-unit firms in all
industries. The average size of multiunit firms in wholesale trade, retail trade and services ranged
between 40 and 70 workers; the size of multiunit firms in the mineral and manufacturing
industries was 175 and 1,000 employees, respectively.
The sizes of both single-unit and multiunit firms increased between 1958 and 1987, but
the disparity in their sizes remained the same. Although the size of single-unit firms almost
doubled from 4.7 to 8.2, it remained significantly smaller than that of multiunit firms which
increased to 224 workers. Table 2 shows that the increase in the firm sizes of single-unit firms
was primarily due to their growth in retail trade and services, whereas, in multiunit firms, the
increase was due to growth in minerals, wholesale trade, retail trade, and services. On the other
hand, the sizes of manufacturing firms of both types decreased over this period.
TABLE 2 ABOUT HERE
Multiunit firms were significantly larger than single-unit firms because they owned many
establishments. Table 3 shows that the multiunit firms, on average, owned between three to ten
establishments in 1958 and 1987. However, in some industries, such as in general merchandise
retail and in tobacco and petroleum manufacturing, the number was much higher. Firms in these
industries owned and operated anywhere between 40 to 70 establishments. The multiunit firms
were also larger than single-unit firms because they operated significantly larger establishments
or plants than single-unit firms. Tables 2 and 3 show that in general plant sizes of multiunit firms

11
were 8 or 9 times larger than those of single-unit firms.
TABLE 3 ABOUT HERE
The Structure of Firms by Employment Size Classes
The study of firms by size classes shows that employment is clustered in two different
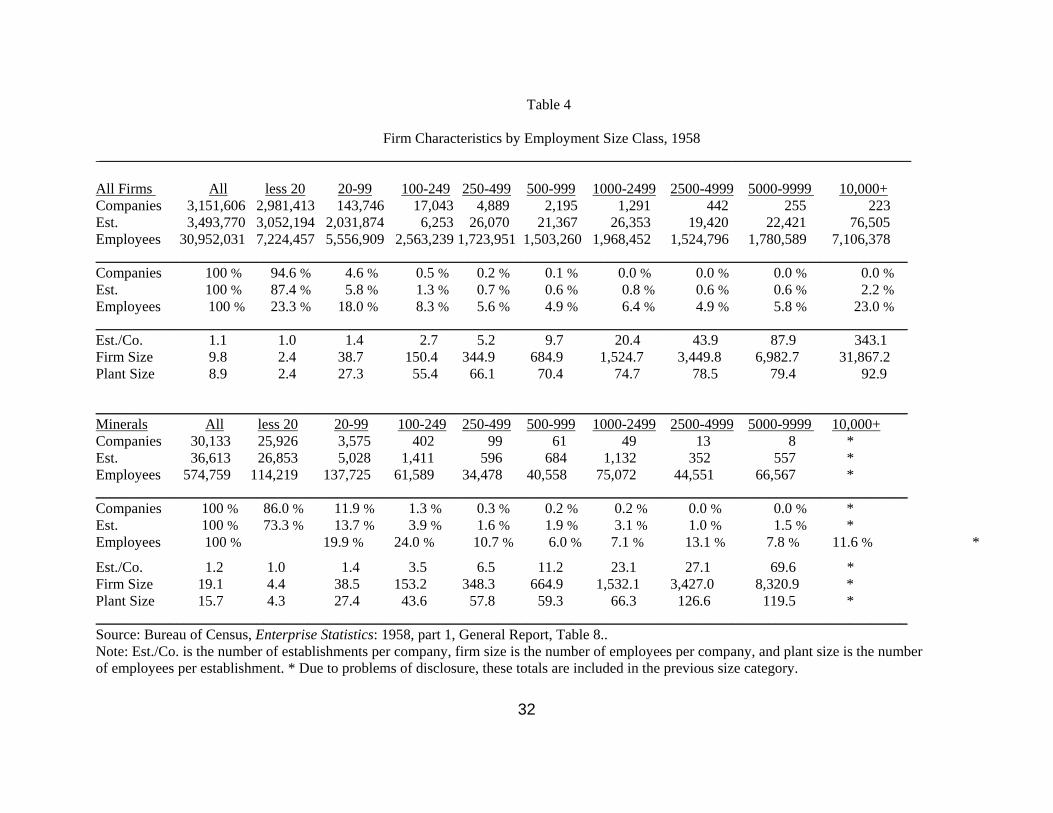
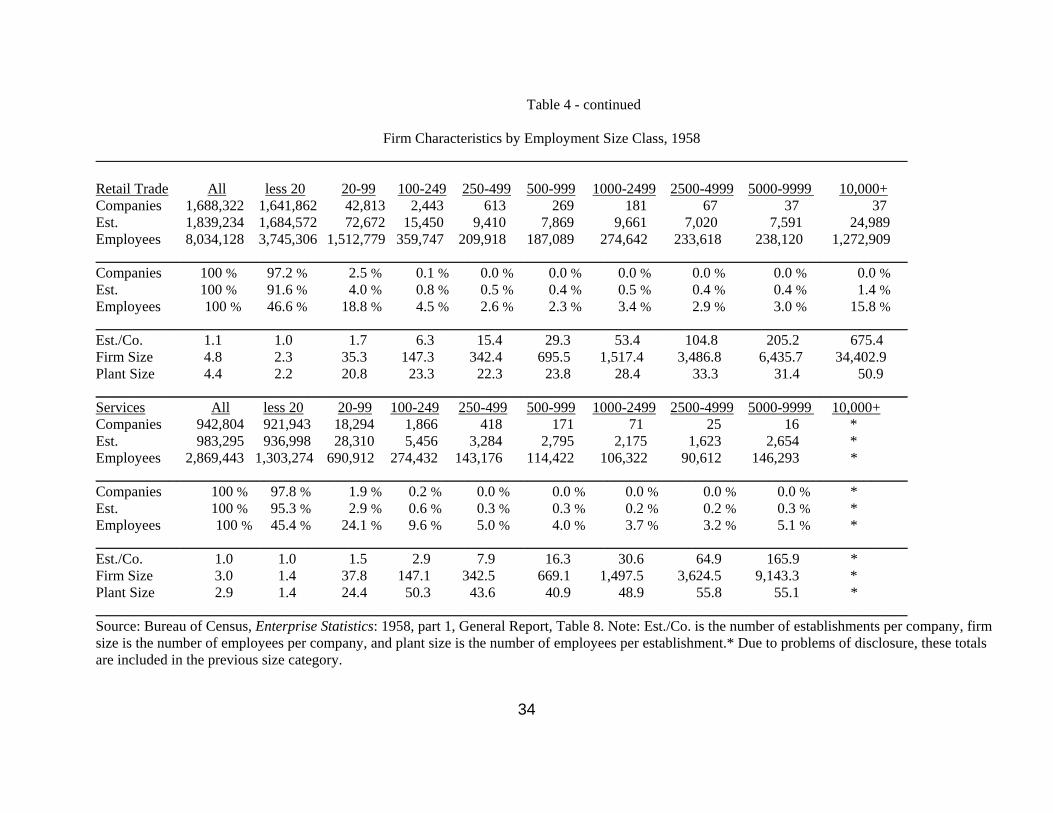
classes located at the opposite ends of the spectrum.7 Table 4 shows that in 1958, the 2.98
million firms whose sizes were fewer than 20 workers accounted for 23 percent of the total
whereas the 223 firms whose firm sizes were greater than 10,000 also accounted for 23 percent.
Similarly, in 1987, the 3.47 million firms in the smallest employment category accounted for 23
percent of employment whereas the 484 firms in the largest category accounted for 25 percent.
Thus, the handful of the very largest enterprises representing a tiny fraction of all firms
accounted for nearly a quarter of all employment in the United States.
A closer examination of firms in different size classes by industries show that there were
distinct patterns across industries. Table 4 shows that small firms dominated the wholesale trade
and the select service industries in 1958. In these two industries, the firms, whose sizes were
fewer than 20, accounted for over 40 percent of activity whereas the firms in the largest category
accounted for less than 5 percent. The data in table 4 show that the disproportionate influence of
the very largest firms occurs mainly in manufacturing and, to a much lesser extent, in retail trade.
In manufacturing, the small firms, whose sizes were fewer than 20 workers, accounted for only 7
percent of employment whereas the 181 firms, whose sizes were 10,000 and greater, accounted
for over 33 percent. In retail trade, the firms in the smallest-sized category accounted for half of

12
total retail employment; however, the 37 firms in the largest-sized category also accounted for
close to 16 percent of retail trade workers. In the minerals industry, the share of employment was
distributed evenly across the nine different size classes.
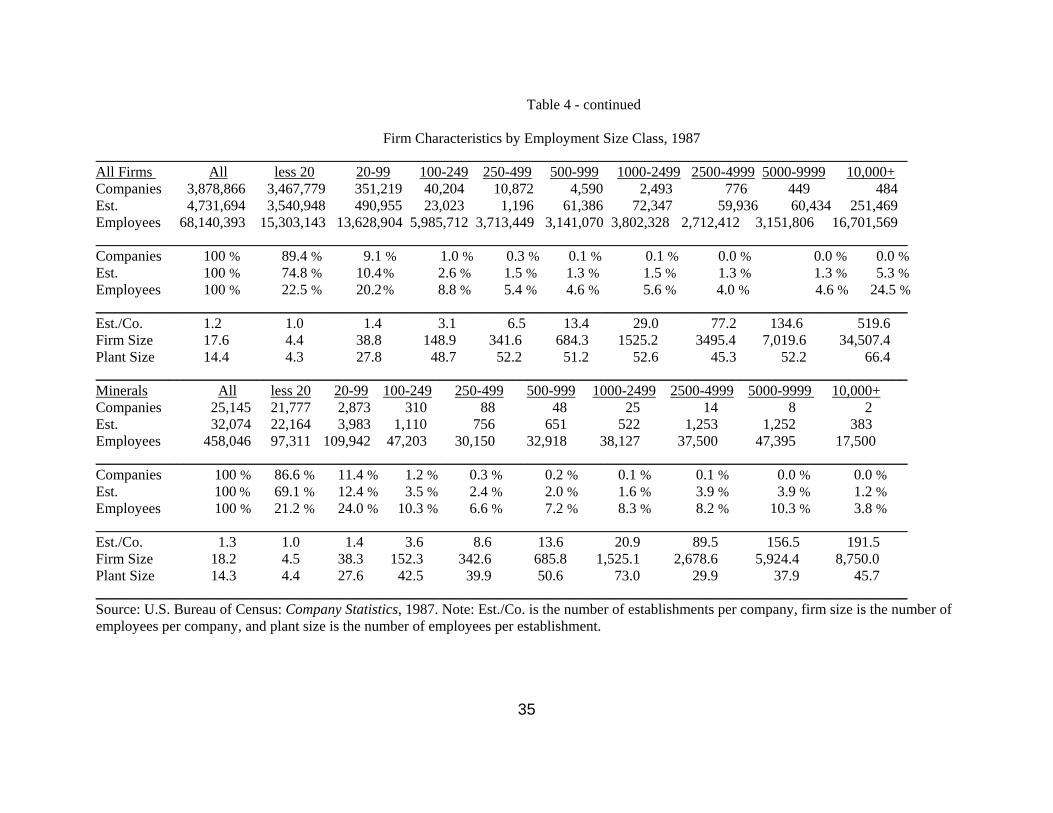
The importance of firms in the largest employment category, 10,000 and greater, became
more significant over the second half of the twentieth century. In 1987, the firms in this largest-
sized category not only became more important in manufacturing and retail trade, but also made
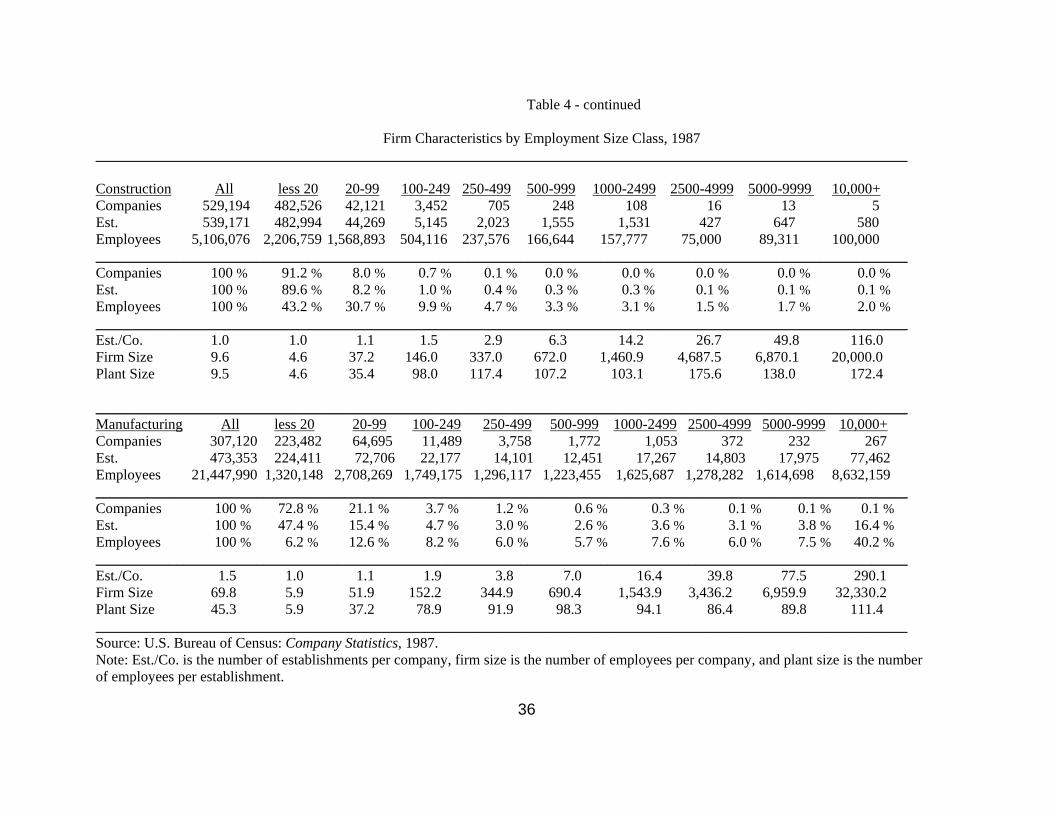
inroads into other sectors of the economy. Table 4 shows that in 1987, in manufacturing, the 267
firms whose sizes were greater than 10,000 accounted for 40 percent of total employment. In
retail trade, the importance of firms in this category increased significantly as 117 firms
accounted for 29 percent of employment. In transportation, a mere 11 firms accounted for 20
percent of employment; in services, the 72 firms in this category employed 12 percent of this
sector’s employment.
TABLE 4 ABOUT HERE
The Central Administrative Organizations and Auxiliaries of Multiunit Firms
Modern multiunit firms employed a majority of the labor force by the second half of the
twentieth century. However, the benefits to organizing distribution and production in multiunit
firms did not come without costs. Unlike traditional single-unit firms, multiunit firms required a
class of managers who monitored and coordinated the activities of numerous establishments
which were often located in different regions. In 1958, 0.8 million or 4.53% of multiunit
employees worked in central administrative organizations (CAOs); in 1987, 1.9 million or 5.02%
13
of multiunit employees worked in CAOs.8 In 1958, the salary cost of CAOs was $6.8 billion or
1.85% of the national income; in 1987, it was $90.5 billion or 2.47%. The data also indicate that
managerial intensity of firms rose with firm size and with the number of establishments.9 Thus,
the costs of monitoring and coordinating activities increased not only as firms became larger but
also as firms acquired more establishments. In addition, managerial intensity in minerals, retail
trade, and manufacturing were significantly greater than in the other services industries.
III. THE RISE OF MODERN BUSINESS ENTERPRISES
This section investigates the causes of the rise of modern multiunit firms in distribution
and in production and examines the social savings of multiunit firms.10 First, in order to examine
the rise of mass distribution firms, this section exploits a unique but rich data set on retail chain
stores or retail multiunit firms compiled by the Federal Trade Commission (FTC) in the early
1930s. As a part of the Senate inquiry into the chain store system of marketing and distribution,
the FTC collected extensive information on chain store operations for 1928 and other years.
Second, in order to examine the rise of mass production firms, this section utilizes data from the
Enterprise Statistics. Finally, the section suggests some estimates concerning the contribution of
multiunit firms to modern economic growth.
The Rise of Mass Distribution Firms
The FTC sample of firms consists of 1727 retail chains in 26 lines of retail businesses.
These retail chains operated 66,246 stores and sold more than $5 billion worth of merchandise
and represented about one-half of all stores and sales operated by chains in 1928. The FTC data
on 26 lines of businesses can be categorized into 12 major classes: food, drug, tobacco, variety,

14
apparel, dry goods, dry goods and apparel, department store, general merchandise, furniture,
musical instruments, and hardware. The FTC did not collect data on retail firms in some
industries such as gasoline filling stations and automobile accessories. Although, due to reporting
irregularities, the sample of firms differs by the types of information provided, the FTC reports
provide extremely valuable data on retail chains. The information on chains includes volume of
sales, number of stores, state distribution, sources of merchandise, backward integration into
manufacturing and wholesale trade, advertising, use of private brands, and pricing policies
(among others). In addition, the statistical information is often augmented by useful survey
questionnaires.
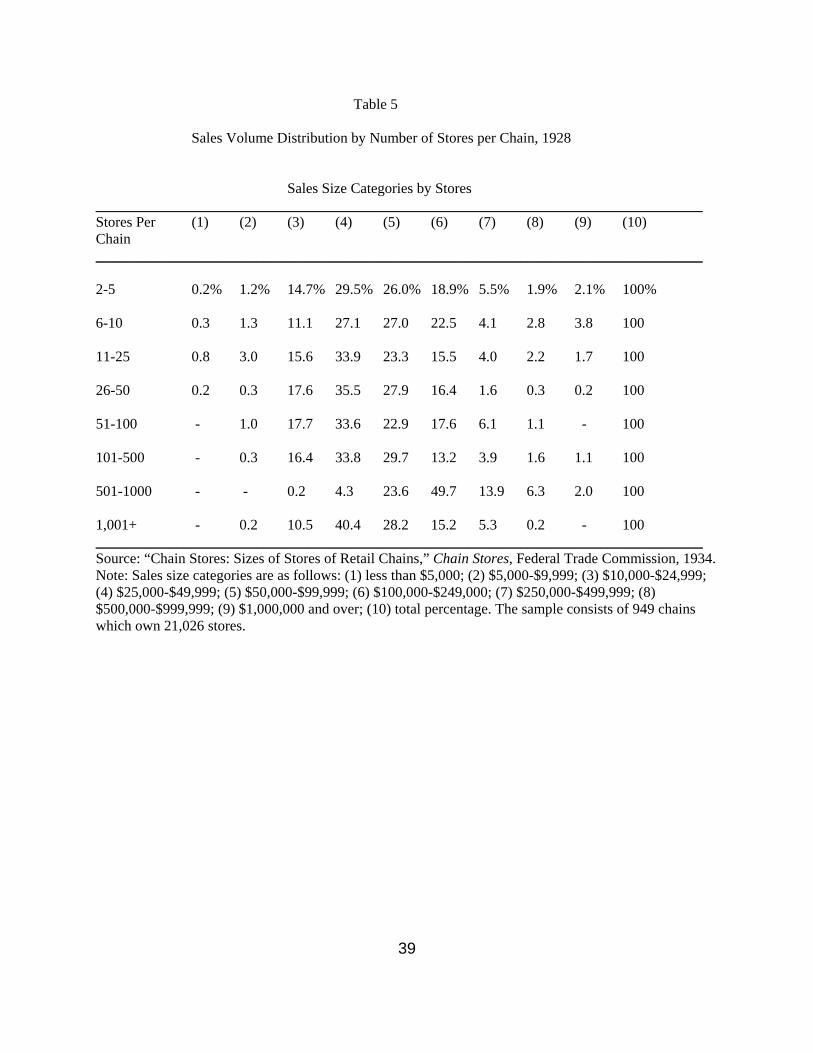
The analysis of the FTC data on chain stores suggests that the rise of multiunit firms in
the retail industry are unlikely to be explained by economies in sales.11 The data on store sales
volume by chain sizes presented in Table 5 suggest that chain stores which owned more stores
did not necessarily operate stores with higher sales volumes. Table 5 shows that across almost all
size classes of chains, the majority of stores were concentrated in sales volumes of between
$25,000 to $99,000. In fact, the chains which owned only 6 to 10 stores had a higher percentage
of stores doing volumes of business above $500,000 than chains which owned over 1,001 stores.
Table 5 shows that chains which had 2-5 stores and 6-10 stores had 4% and 6.6% of stores doing
sales volumes of over $500,000 as compared to no stores for chains which owned over 1,001
stores. Thus, the evidence suggests that the advantage of retail chain stores did not necessarily
come from large sales volume per retail unit.12
TABLE 5 ABOUT HERE

15
The FTC data provide a variety of evidence in support of the hypothesis that the rise of
multiunit firms in the retail industry is due to economies in advertising and in transactions. The
data suggest that the rise of retail chains coincided with urbanization in the early twentieth
century because urban density provided significant economies in advertising.13 The data indicate
that while urban density expanded the size of retail markets for some stores, the expansion was
limited for those in most lines of businesses. In the early twentieth century, the size of retail
markets was limited by the transportation and household technologies available to consumers.
Thus, most retail stores, except the department stores, remained relatively small. However, for
retail stores that horizontally integrated into a chain, urban newspapers presented significant
opportunities to economize on advertising.
Indeed, the FTC data on advertising expenditures suggest that there were significant
economies in advertising for multiunit retail firms.14 The data presented in Table 6 show that
while large chains spent significantly greater amounts in advertising, the expenditures per store
or expenditures as a percentage of sales were both significantly lower for these large chains. In
1928, the smaller chains, those owning 2-5 stores and 6-10 stores, spent on average $19,444 and
$45,051 respectively, whereas the larger chains, those owning 501-1,000 and more than 1,001
stores, spent $225,000 and $1,425,000 respectively. However, the advertising outlay per store for
chains in the two smallest size categories was $6,000 as compared to less than $400 for chains in
the two largest size categories. The data also show that the ratio of advertising expenditures to
sales fell almost monotonically by chain size. While firms which owned 2-5 stores spent 3.57%
of their sales on advertising, the figure was only 0.67% for firms which owned more than 1,001

16
stores.15
TABLE 6 ABOUT HERE
There are many reasons for advertising. However, one of the most important goals of
advertising by chains in the early twentieth century was to develop a reputation for their private
brands or trademarks. While some products developed a national brand recognition through
direct advertisement by manufacturers, many did not. In these non-nationally branded items from
manufacturers, especially when the quality of goods could not be easily inspected in the stores,
the establishment of a private brand by chains often signaled a certain level of quality. For
example, A&P, the largest grocery and meat chain, reported:
In many types of merchandise which we handle, the consuming public has gradually reached a point where it prefers to order or buy on the basis of brand or trade names. This has probably been accentuated by large expenditures in advertising of trade names; it is probably due also to the greater ease to the customer in making his wants known and being sure of getting the same thing every time he uses that certain trade name or brand. When he wants a certain article, he knows that if he calls for it by that name he will get it; conversely, if he calls for an article under that brand he knows what he will get.16
The FTC data on retail chains suggest that the advertising expenditures made by large
multiunit firms were focused on establishing a reputation of the chain through the development
of private brands. The FTC data on the use of private brands by chains indicate that about a
quarter of 1,660 chains in the sample owned private brands. However, as expected, the chains
which owned private brands were large; the 412 chains which owned private brands accounted
for over 75 percent of sales and stores.17 The data also indicate that the ownership of brands was
positively correlated with chain size. The rate of ownership of private brands rose steadily from
17
14% for stores which operated 2-5 stores to 90% for chains which operated more than 1,001
stores.18 Thus, the data suggest that the economies in advertising by multiunit retail firms were
largely achieved by establishing reputations for their private brands.
The extent of backward integration into manufacturing by retail chains was relatively
limited.19 However, when retailers integrated backward into manufacturing, the evidence
suggests that they did so to ensure a consistent quality that was necessary for establishing a
chain’s private brand reputation.20 There is little evidence that retail chain stores integrated
backward into manufacturing in order to exploit economies of scale or stock turn. The reason
most often reported by chains for manufacturing some of their products was quality control. For
example, confectionary chains in the early twentieth century were almost always integrated into
manufacturing because their products were highly perishable and could not be sold over a great
distance. For similar reasons, grocery chains manufactured many items such as coffee, tea,
mayonnaise, and bread. Certainly, manufacturing these items in these retail stores was helpful in
maintaining consistent quality, but it probably came at the cost of achieving economies in the
scale of production or in the distribution of these goods.
The data on the sources of merchandise indicate that retail chains, unlike the independent
single-unit firms, purchased most of their goods directly from manufacturers and growers. The
FTC report found that the chains purchased 75.5% of their merchandise from manufacturers, 7%
from growers, 7.3% from brokers and commission men, 7.9% from wholesalers and jobbers, and
2.3% from other sources.21 The data in Table 7 also show that the percentage of direct purchase
from manufacturers and growers also increased with the size of the chain for five broad
categories of businesses. As the importance of private brands increased, a direct relationship with

18
the manufacturer rather than the indirect one with the wholesaler is likely to have lowered the
cost of ensuring a consistent quality of their private brands. In addition, a study by Hoffman
(1940) suggests that the chain store system saved significant labor cost by reducing duplication
in labor.22
TABLE 7 ABOUT HERE
The Rise of Mass Production Firms
The Enterprise Statistics data shed considerable light on the causes of the rise of mass
production firms. The evidence provides little support for Chandler’s claim that it was necessary
for modern multiunit firms to vertically integrate forward into distribution and backward into
raw materials in order to take advantage of economies of scale. Rather, the evidence suggests
that multiunit firms in production, like those in distribution, arose to take advantage of
economies in marketing. Whereas the multiunit retail firms integrated backward into wholesale
distribution, the multiunit manufacturing firms integrated forward into wholesale distribution to
take advantage of economies in marketing. However, multiunit manufacturing firms did not
integrate backward into raw materials, nor conglomerately, since multiunit firms did not arise to
take advantage of economies of scale or economies of scope.
There is little evidence that multiunit firms grew by vertically integrating backward into
raw materials or by integrating conglomerately. The data from the Enterprise Statistics indicate
that most American business enterprises in distribution and production specialized in one kind of
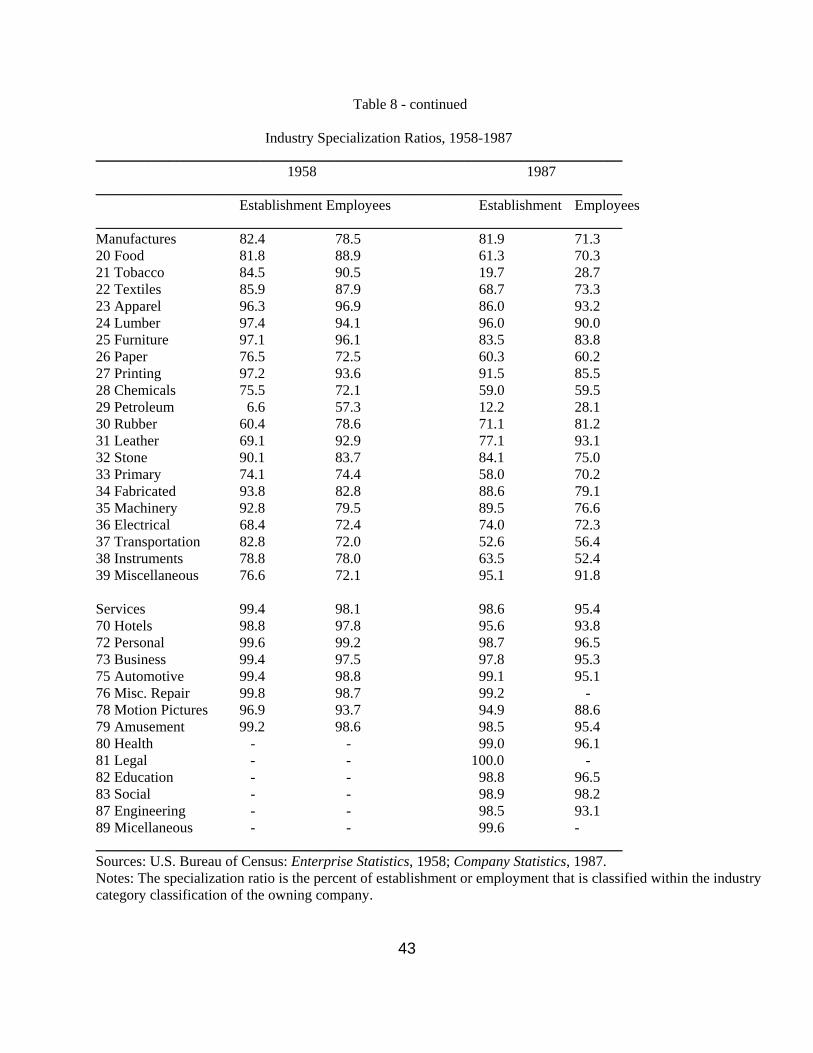
business activity. The data in Table 8 show that, in both 1958 and 1987, more than 95 percent of

19
establishments and 87 percent of employment were classified in a single 3-digit enterprise
industry.23 Among the industries which were extremely specialized were wholesale trade, retail
trade, construction, transportation and services. In these industries, more than 90 percent of
employment was engaged in the firm’s primary industry category. The minerals industry was
close behind with more than 85 percent. Even in the manufacturing sector, the only sector to
exhibit some industrial diversification, more than 70 percent of employment was categorized in a
single industry. However, the level of diversification varied widely within manufacturing. A few
industries exhibited a considerable level of diversification. For example, in 1958, only 57.3
percent of workers in the petroleum industry were engaged in their primary industry and in 1987,
only 28.7 percent of workers in the tobacco industry were categorized in their primary industry.
TABLE 8 ABOUT HERE
The Enterprise Statistics also provides a more detailed list of other industry activities in
1958. In addition to the aggregate firm specialization ratio, the Enterprise Statistics reports data
on firms’ activities in each of the 135 industries. According to this data, only 13 of 91 industries
in manufacturing employed more than 30 percent of their employees in vertical or unrelated
industries. Table 9 examines in greater detail the extent of diversification in these 13 industries.
A closer examination of the data indicate that if horizontal integration is measured by two-digit
rather than three-digit industries, the level of diversification falls sharply for firms in three
industries: pulp paper and board, engines and turbines, and aircraft engines and propellers. For
most firms that are diversified, vertical or unrelated employment occurred in other

20
manufacturing rather than in non-manufacturing industries. The major exceptions were the
integrated petroleum industry which employed 25 percent of its employment in the mineral and
transportation industries and 17 percent in wholesale and retail trade, and the office machines
industry which employed 24 percent of its employment in wholesale and retail trade.
TABLE 9 ABOUT HERE
Although the Enterprise Statistics data in Table 3 indicate that plant sizes of multiunit
firms were significantly larger than that of single-unit firms, it is unlikely that this provides
evidence that multiunit firms arose to take advantage of economies of scale in production.
Rather, it is more likely firms with larger plants had more incentives to market their products
more widely. The data also indicate that the larger multiunit production firms increased their
sizes by operating many more establishments rather than operating plants of larger sizes which
suggests that they integrated horizontally to take advantage of economies in marketing. The data
in Table 4 show that the clear difference between firms whose sizes were 250-499 and those
whose sizes were 10,000 and greater was in their number of establishments. For example, in
1958, the data show that these medium-sized firms owned only 5 establishments as compared to
343 establishments for the very largest firms. The medium-sized firms operated smaller plants,
but their establishments were only a third smaller than those of the largest-sized firms.
Finally, Kim (1999b) provides additional evidence which suggests that multiunit
manufacturing firms arose to take advantage of economies in marketing rather than those of
R&D, scale and scope. He finds that multiunit firms integrated forward into distribution in order
21
to take advantage of economies in marketing. Since advertising, brand names, and reputation
could more easily be established for the selling of similar products, and since these proprietary
assets are difficult assets to transfer from one plant to another through the use of contracts, firms
organized as horizontal multiunit firms to take advantage of these economies.
Social Savings of Modern Business Enterprises
The economic benefits of organizing economic activities in modern multiunit firms
depend critically upon why they arose in the first place. For Chandler (1977, 1990), the modern
business enterprise arose to take advantage of economies of scale in distribution and in
production. Chandler argued that, in mass distribution firms, the economies of scale came from
speed not size. For example, mass retailers did not build larger stores; they increased their stock-
turn. In mass production firms, Chandler claimed that the economies of scale came from the
construction of larger plants. Thus, in principle, if Chandler’s hypothesis concerning the rise of
modern business enterprises is correct, then the contribution of multiunit firms to economic
growth can be calculated by estimating the benefits of increased stock-turn and increased plant-
size of mass distribution and mass production firms, respectively. While Chandler has made little
systematic attempt at estimating the social savings of multiunit firms, he suggests that the
benefits are substantial. In particular, Chandler (1990, 24-5; 1992, 82) has used the formation of
the Standard Oil trust to provide evidence for the importance of economies of scale.
Unfortunately, Chandler’s estimate of the benefits of economies of scale of the Standard
Oil trust is not only unreliable, the inference that these benefits can be generalized to capture the
overall benefits of modern multiunit firms is also likely to be wrong.24 Even if firms in some
industries benefitted from economies of scale, it is unlikely that these firms needed to organize as
22
multiunit firms to capture these economies. Rather, the analysis of this paper suggests that
modern multiunit firms in distribution and production arose to take advantage of economies in
marketing and research and development. While it is beyond the scope of this paper to provide a
systematic estimate of the benefits of these kinds of economies, the following case study of
benefits of marketing in the retail industry suggests some bounds on the magnitude of these
benefits.
The benefits of distributing goods through multiunit retail chain stores can be measured
by comparing the prices of identical items sold in retail chain and independent stores. The FTC,
between 1929 and 1931, collected information on identical grocery and drug store items sold on
the same day by chains and independents in four cities, Washington D.C., Cincinnati, Memphis
and Detroit. The data indicate that the chains were much more efficient at distributing grocery
and drug store items than the independent stores. The chain store prices of groceries as compared
to that of independent stores were 6.4%-10.47% lower whereas, for the drug store items, they
were lower by 17.48%-22.72%.25 Thus, the social savings of modern business enterprises in
some industries may be substantial. The overall contribution of multiunit enterprises, however
may depend critically upon whether single-unit and multiunit firms are goods substitutes. For
example, the relatively smaller price differential between chains and independents in groceries
compared to drug store products are likely to be accounted for by the fact that numerous
cooperatives arose in the former line of business. Evidence indicates that grocery cooperatives
captured much of the benefits of the multiunit marketing economies. Like the chains, grocery
cooperatives developed private brands and benefitted substantially from economies of
advertising.26

23
IV. CONCLUSION
The modern multiunit firms which arose in the late nineteenth century exerted a
significant influence on the American economy by the twentieth century. Although these firms
represented only a tiny fraction of all business enterprises, they accounted for more than half of
all employees by the second half of the twentieth century. The multiunit firm was most
predominant in manufacturing where it accounted for more than 70 percent of that sector’s
employment, but its influence broadened to include other industries such as retail trade,
transportation and services. However, the benefits to organizing production within a multiunit
firm also came with costs. The data indicate that the costs of monitoring and coordinating the
activities of employees in multiple establishments increased the managerial intensity of firms.
The evidence presented in this paper suggests that the modern multiunit business
enterprise arose to take advantage of economies in marketing rather than to take advantage of
economies of scale and scope. The data suggests that firms organized as multiunit firms in
industries where economies of marketing could be shared over many establishments. Since brand
names, trade marks and reputation are difficult assets to transfer from one plant to another
through the use of contracts, it was often optimal for plants which produced similar lines of
products to operate under a common ownership.
The historical development of the modern multiunit firm can also be re-interpreted using
economies of marketing rather than economies of scale and scope. Although the revolutions in
transportation and communications industries led to the development of an integrated national
goods market, the integration occurred in different stages. The wholesale trade firms became the
first modern business enterprises because these firms efficiently handled the distribution of

24
goods when consumers of final goods were dispersed in rural areas. Since costs of advertising in
rural markets were prohibitive, wholesale merchants with sales forces arose to market products
to rural consumers. In this period, the retail firms in rural areas found it more cost effective to
deal with wholesale merchants who provided them with sufficiently different lines of products
rather than to deal directly with manufacturers.
The importance of the multiunit form of organization in wholesale trade was rather short-
lived. As the population became increasingly urban, economies in marketing grew at the retail
level. As population density grew, direct advertising became an effective marketing device.27
However, as markets became increasing national and as manufacturers perceived significant
benefits to establishing brand names for their products, advertising agencies emerged to
coordinate the task of advertising. When advertising remained mostly a local affair, agencies,
such as N.W. Ayer & Son, provided valuable information concerning the potential value of
advertising in the various local newspapers around the country.28 Over time, the emergence of
the national media, such as magazines, radio and television, significantly lowered the costs of
establishing national brand names for manufacturers.
For Chandler, the rise of the multiunit firm marked a significant transition in the history
of the American economy. It signaled the coming of managerial capitalism where economic
growth is dependent upon the 'visible hand' of multiunit firms rather than the Smithian 'invisible
hand' of markets. However, while the evidence of the rapid displacement of single-unit firms by
multiunit firms in a cluster of industries may signal the relative efficiency of the latter
organizational form, it does not indicate the magnitude of the multiunit firm's superiority. The
magnitude of the economic importance of multiunit firms depends upon whether multiunit firms

25
and single-unit firms are reasonably good substitute means of organizing production. To the
extent that the two modes of organizing production are good substitutes, the importance of the
modern multiunit firm for economic growth may have been overstated. The obvious next step in
this research is to estimate the social savings of multiunit firms.

26
Table 1 The Extent of Multiunit Activity, 1958-1987 (Percent of Activities in Multiunit Firms) ________________________________________________________________________ 1958 1987 ________________________________________________________________________
Firms Est. Emp. Firms Est. Emp. ________________________________________________________________________ All Companies 2.9% 12.4% 53.8% 4.4% 21.6% 55.5% Minerals 6.2 22.8 56.7 4.9 25.4 57.3 10 Metal 3.4 21.4 82.9 7.2 54.3 83.4 12 Coal 3.8 23.6 63.1 6.2 45.8 72.4 13 Oil & gas 7.5 22.0 45.3 4.1 17.5 43.0 14A Non-metallic 6.5 24.1 51.2 7.5 32.2 53.7 Construction - - - 0.8 2.6 16.9 15 General - - - 0.8 2.5 17.0 16 Heavy - - - 2.5 10.8 39.8 17 Special - - - 0.6 1.8 9.8 Transportation - - - 3.6 18.2 50.9 42 Trucking - - - 2.6 17.0 52.2 44 Water - - - 5.2 24.7 61.9 47 Transport - - - 6.3 20.1 36.9 Wholesale Trade 6.7 19.3 29.8 8.1 24.5 43.1 50 Durable 8.0 21.9 33.3 8.3 24.7 42.3 51 Non-durable 6.1 18.1 27.9 7.8 24.1 44.2 Retail Trade 2.8 10.8 40.2 6.0 32.3 58.8 52 Building 3.7 11.6 22.0 6.4 25.2 45.8 53 General 2.2 14.4 80.3 7.6 78.6 97.3 54 Food 1.7 9.7 54.5 5.3 35.7 70.4 55 Automotives 2.5 7.5 13.8 6.0 24.5 27.5 56 Apparel 6.9 24.9 48.1 10.3 52.3 71.5 57 Furnitures 4.3 12.0 27.8 8.0 30.2 48.2 58 Eating 2.2 7.7 19.1 4.2 27.3 51.1 59 Miscellaneous 3.3 10.8 27.4 6.3 27.1 48.4 ________________________________________________________________________ Sources: U.S. Bureau of Census: Enterprise Statistics, 1958; Company Statistics, 1987.

27
Table 1 - continued The Extent of Multiunit Activity, 1958-1987 (Percent of Activities in Multiunit Firms) ________________________________________________________________________ 1958 1987 ________________________________________________________________________
Firms Est. Emp. Firms Est. Emp. ________________________________________________________________________ Manufactures 4.3% 32.0% 67.5% 6.2% 39.2% 76.2% 20 Food 6.6 39.3 63.3 11.7 63.1 82.5 21 Tobacco 12.0 62.4 90.3 26.1 95.1 99.3 22 Textiles 8.4 36.2 64.9 12.2 53.9 80.7 23 Apparel 3.1 11.7 31.1 5.1 26.5 52.3 24 Lumber 1.6 6.8 27.8 2.9 11.3 40.1 25 Furniture 3.1 12.0 33.9 5.3 29.9 63.8 26 Paper 9.9 47.0 77.3 13.4 65.3 85.6 27 Printing 2.3 9.3 43.2 3.1 20.7 62.6 28 Chemicals 8.8 53.1 88.4 12.6 68.1 90.8 29 Petroleum 16.0 96.9 97.3 19.1 94.4 97.2 30 Rubber 5.5 51.0 72.6 9.2 47.0 66.1 31 Leather 5.1 40.9 49.1 8.7 36.4 56.6 32 Stone 6.5 30.7 66.4 9.0 44.7 73.5 33 Primary 7.4 51.4 86.0 13.9 63.3 83.0 34 Fabricated 3.8 18.7 53.5 6.9 26.6 58.3 35 Machinery 3.4 24.9 68.2 5.0 26.5 69.8 36 Electrical 7.3 54.4 83.5 9.2 51.6 81.2 37 Transportation 6.0 39.9 89.0 7.9 63.4 94.1 38 Instruments 6.4 46.7 80.3 9.2 56.2 89.1 39 Miscellaneous 3.0 13.0 47.0 3.7 12.9 43.4 Services 1.7 5.7 27.5 3.2 12.4 40.3 70 Hotels 2.0 5.6 29.3 4.3 20.7 49.5 72 Personal 1.6 4.8 19.8 4.4 18.2 37.5 73 Business 2.1 8.3 40.2 3.8 16.9 48.3 75 Automotive 1.5 6.1 15.8 2.7 13.9 28.7 76 Misc. Repair 0.4 1.2 10.6 1.8 5.3 15.3 78 Motion Pictures 13.1 45.1 63.5 6.0 28.5 61.6 79 Amusement 1.7 4.3 13.1 3.2 11.1 31.8 80 Health - - - 3.0 9.3 37.5 81 Legal - - - 1.9 4.4 24.8 82 Education - - - 4.8 17.5 40.1 83 Social - - - 3.3 15.3 27.8 87 Engineering - - - 3.2 10.2 39.9 89 Micellaneous - - - 0.9 2.5 14.1 ________________________________________________________________________ Sources: U.S. Bureau of Census: Enterprise Statistics, 1958; Company Statistics, 1987.
28
Table 2 The Size of Firms, 1958-1987 (Number of Employees per Company) ________________________________________________________________________ 1958 1987 ________________________________________________________________________ All Single Multiunit All Single Multiunit ________________________________________________________________________ All Companies 9.8 4.7 182.4 17.6 8.2 224.3 Minerals 19.1 8.8 174.6 18.8 8.4 221.8 10 Metal 36.5 6.5 881.0 65.3 11.6 757.6 12 Coal 26.9 10.3 441.1 52.9 15.6 617.1 13 Oil & gas 13.8 8.1 82.8 11.7 7.0 124.2 14A Non-metallic 17.7 9.3 138.9 20.0 10.0 142.5 Construction - - - 9.7 8.1 208.8 15 General - - - 8.5 7.1 182.1 16 Heavy - - - 25.0 15.5 394.1 17 Special - - - 8.6 7.8 142.7 Transportation - - - 15.1 7.7 210.8 42 Trucking - - - 16.5 8.1 330.6 44 Water - - - 29.5 11.9 349.2 47 Transport - - - 8.5 5.7 50.4 Wholesale Trade 9.9 7.4 43.7 13.4 8.3 71.4 50 Durable 11.3 8.2 46.6 12.5 7.9 63.9 51 Non-durable 9.2 7.1 41.9 15.0 9.1 85.2 Retail Trade 4.8 2.9 68.4 17.4 7.6 171.4 52 Building 4.4 3.5 26.3 11.2 6.5 79.7 53 General 11.0 2.2 405.0 205.2 6.0 2619.8 54 Food 3.8 1.8 120.5 23.4 7.3 308.6 55 Automotives 3.9 3.5 21.8 12.3 9.5 56.2 56 Apparel 6.7 3.7 46.7 15.0 4.8 104.1 57 Furnitures 4.0 3.0 25.7 8.8 5.0 52.9 58 Eating 4.7 3.9 41.3 21.1 10.7 254.4 59 Miscellaneous 3.3 2.5 27.3 8.7 4.8 67.1 ________________________________________________________________________ Sources: U.S. Bureau of Census: Enterprise Statistics, 1958; Company Statistics, 1987.

29
Table 2 - continued The Size of Firms, 1958-1987 (Number of Employees per Company) ________________________________________________________________________ 1958 1987 ________________________________________________________________________ All Single Multiunit All Single Multiunit ________________________________________________________________________ Manufactures 64.0 21.8 1002.1 69.8 17.8 852.7 20 Food 54.1 21.3 520.9 118.1 23.3 832.0 21 Tobacco 298.2 32.9 2243.8 2210.7 19.6 8419.2 22 Textiles 145.4 55.7 1126.2 159.9 35.2 1056.3 23 Apparel 42.2 30.0 420.6 51.4 25.8 526.1 24 Lumber 15.3 11.2 271.2 20.3 12.5 280.0 25 Furniture 35.1 23.9 383.0 54.4 20.8 659.8 26 Paper 149.4 37.6 1172.0 193.6 32.2 1236.1 27 Printing 26.0 15.1 483.8 30.7 11.9 610.3 28 Chemicals 107.1 13.7 1073.0 155.8 16.4 1120.3 29 Petroleum 528.6 17.0 3212.4 428.4 15.0 2178.0 30 Rubber 100.1 29.1 1318.6 70.4 26.2 507.3 31 Leather 88.7 47.6 859.2 52.6 25.0 340.9 32 Stone 48.1 17.3 494.2 51.0 14.9 417.4 33 Primary 248.2 37.5 2885.9 163.7 32.3 975.6 34 Fabricated 46.6 22.5 656.3 43.7 19.6 369.7 35 Machinery 52.2 17.2 1060.7 44.3 14.1 615.6 36 Electrical 203.5 36.2 2336.5 127.2 26.3 1123.7 37 Transportation 340.8 39.8 5016.2 353.1 22.7 4190.1 38 Instruments 105.1 22.2 1309.6 165.3 19.9 1593.2 39 Miscellaneous 33.0 18.0 519.3 22.8 13.4 264.4 Services 3.0 2.2 49.9 10.8 6.7 135.9 70 Hotels 6.1 4.4 89.8 33.3 17.6 386.3 72 Personal 2.3 1.9 28.2 7.0 4.6 60.7 73 Business 5.6 3.4 107.3 20.1 10.8 257.5 75 Automotive 2.1 1.8 21.8 6.1 4.5 64.6 76 Misc. Repair 0.8 0.8 20.0 5.0 4.3 42.8 78 Motion Pictures 15.7 6.6 76.3 13.3 5.4 137.0 79 Amusement 3.6 3.2 26.9 12.8 9.0 128.3 80 Health - - - 9.5 6.1 117.3 81 Legal - - - 6.0 4.6 78.7 82 Education - - - 11.7 7.4 97.7 83 Social - - - 9.1 6.8 76.1 87 Engineering - - - 9.9 6.1 124.7 89 Micellaneous - - - 2.9 2.5 45.9 ________________________________________________________________________ Sources: U.S. Bureau of Census: Enterprise Statistics, 1958; Company Statistics, 1987.

30
Table 3 Multiunit Firms: Number of Establishments and Plantsizes, 1958-1987 ________________________________________________________________________ Number of Establishments Plantsizes of Owned by Multiunit Firms Multiunit Firms ________________________________________________________________________ 1958 1987 1958 1987 ________________________________________________________________________ All Companies 4.7 6.1 38.4 37.0 Minerals 7.7 6.7 39.0 33.3 10 Metal 7.7 15.3 114.9 49.4 12 Coal 3.5 12.7 57.0 48.4 13 Oil & gas 4.5 5.0 23.9 24.8 14A Non-metallic 4.5 5.8 30.5 24.5 Construction - 3.4 - 61.2 15 General - 3.2 - 57.3 16 Heavy - 4.7 - 84.3 17 Special - 3.0 - 47.7 Transportation - 5.9 - 35.9 42 Trucking - 7.7 - 43.1 44 Water - 5.9 - 59.0 47 Transport - 3.8 - 13.4 Wholesale Trade 3.2 3.7 13.2 19.3 50 Durable 3.4 3.6 14.6 17.5 51 Non-durable 3.3 3.8 12.4 22.6 Retail Trade 4.2 7.5 16.3 22.9 52 Building 3.5 4.9 7.6 16.3 53 General 7.5 44.4 53.9 59.0 54 Food 6.2 9.9 19.4 31.3 55 Automotives 3.2 5.0 6.9 11.1 56 Apparel 4.5 9.6 10.4 10.9 57 Furnitures 3.0 5.0 8.5 10.6 58 Eating 3.8 8.5 10.9 29.9 59 Miscellaneous 3.5 5.6 7.8 12.0 ________________________________________________________________________ Sources: Data for all industries, except manufacturing, are from U.S. Bureau of Census: Enterprise Statistics,1958; Company Statistics, 1987; Data for manufacturing are from Census of Manufactures: Type of Organizations, 1958, 1987.

31
Table 3 - continued ________________________________________________________________________ Multiunit Firms: Number of Establishments and Plantsizes, 1958-1987 ________________________________________________________________________ Number of Establishments Plantsizes of Owned by Multiunit Firms Multiunit Firms ________________________________________________________________________ 1958 1987 1958 1987 ________________________________________________________________________ Manufactures 10.5 9.7 240.7 177.7 20 Food 9.2 12.9 114.4 157.7 21 Tobacco 12.2 55.4 374.7 629.0 22 Textiles 6.2 8.4 327.8 278.9 23 Apparel 4.1 6.7 161.1 175.1 24 Lumber 4.6 4.2 91.6 92.6 25 Furniture 4.3 7.7 161.6 182.6 26 Paper 8.1 12.2 227.8 175.7 27 Printing 4.3 8.0 176.5 125.1 28 Chemicals 11.7 14.8 166.6 132.2 29 Petroleum 162.2 71.1 220.2 72.2 30 Rubber 17.8 8.8 321.1 130.5 31 Leather 13.0 6.0 246.7 178.1 32 Stone 6.4 8.2 110.3 69.8 33 Primary 13.3 10.6 534.3 231.2 34 Fabricated 5.8 4.9 200.4 126.1 35 Machinery 9.6 6.8 325.0 172.9 36 Electrical 15.2 10.5 484.8 293.7 37 Transportation 10.3 20.1 1126.6 662.4 38 Instruments 12.8 12.6 400.5 324.6 39 Miscellaneous 4.8 3.8 314.5 120.6 Services 3.6 4.3 14.0 31.6 70 Hotels 2.9 5.9 30.6 65.9 72 Personal 3.1 4.9 9.1 12.4 73 Business 4.3 5.2 25.2 49.6 75 Automotive 4.2 5.8 5.2 11.1 76 Misc. Repair 2.7 3.1 7.4 13.7 78 Motion Pictures 5.5 6.3 14.0 21.8 79 Amusement 2.6 3.8 10.5 33.4 80 Health - 3.3 - 35.7 81 Legal - 2.4 - 32.7 82 Education - 4.2 - 23.3 83 Social - 5.3 - 14.4 87 Engineering - 3.5 - 35.8 89 Micellaneous - 2.9 - 15.9 ________________________________________________________________________ Sources: Data for all industries, except manufacturing, are from U.S. Bureau of Census: Enterprise Statistics, 1958; Company Statistics, 1987; Data for manufacturing are from Census of Manufactures: Type of Organizations, 1958, 1987.
32
Table 4
Firm Characteristics by Employment Size Class, 1958 _______________________________________________________________________________________________________________ All Firms All less 20 20-99 100-249 250-499 500-999 1000-2499 2500-4999 5000-9999 10,000+ Companies 3,151,606 2,981,413 143,746 17,043 4,889 2,195 1,291 442 255 223 Est. 3,493,770 3,052,194 2,031,874 6,253 26,070 21,367 26,353 19,420 22,421 76,505 Employees 30,952,031 7,224,457 5,556,909 2,563,239 1,723,951 1,503,260 1,968,452 1,524,796 1,780,589 7,106,378 _______________________________________________________________________________________________________________ Companies 100 % 94.6 % 4.6 % 0.5 % 0.2 % 0.1 % 0.0 % 0.0 % 0.0 % 0.0 % Est. 100 % 87.4 % 5.8 % 1.3 % 0.7 % 0.6 % 0.8 % 0.6 % 0.6 % 2.2 % Employees 100 % 23.3 % 18.0 % 8.3 % 5.6 % 4.9 % 6.4 % 4.9 % 5.8 % 23.0 % _______________________________________________________________________________________________________________ Est./Co. 1.1 1.0 1.4 2.7 5.2 9.7 20.4 43.9 87.9 343.1 Firm Size 9.8 2.4 38.7 150.4 344.9 684.9 1,524.7 3,449.8 6,982.7 31,867.2 Plant Size 8.9 2.4 27.3 55.4 66.1 70.4 74.7 78.5 79.4 92.9 _______________________________________________________________________________________________________________ Minerals All less 20 20-99 100-249 250-499 500-999 1000-2499 2500-4999 5000-9999 10,000+ Companies 30,133 25,926 3,575 402 99 61 49 13 8 * Est. 36,613 26,853 5,028 1,411 596 684 1,132 352 557 * Employees 574,759 114,219 137,725 61,589 34,478 40,558 75,072 44,551 66,567 * _______________________________________________________________________________________________________________ Companies 100 % 86.0 % 11.9 % 1.3 % 0.3 % 0.2 % 0.2 % 0.0 % 0.0 % * Est. 100 % 73.3 % 13.7 % 3.9 % 1.6 % 1.9 % 3.1 % 1.0 % 1.5 % * Employees 100 % 19.9 % 24.0 % 10.7 % 6.0 % 7.1 % 13.1 % 7.8 % 11.6 % *
Est./Co. 1.2 1.0 1.4 3.5 6.5 11.2 23.1 27.1 69.6 * Firm Size 19.1 4.4 38.5 153.2 348.3 664.9 1,532.1 3,427.0 8,320.9 * Plant Size 15.7 4.3 27.4 43.6 57.8 59.3 66.3 126.6 119.5 * _______________________________________________________________________________________________________________ Source: Bureau of Census, Enterprise Statistics: 1958, part 1, General Report, Table 8.. Note: Est./Co. is the number of establishments per company, firm size is the number of employees per company, and plant size is the number of employees per establishment. * Due to problems of disclosure, these totals are included in the previous size category.

33
Table 4 - continued
Firm Characteristics by Employment Size Class, 1958 _______________________________________________________________________________________________________________ Manufacturing All less 20 20-99 100-249 250-499 500-999 1000-2499 2500-4999 5000-9999 10,000+ Companies 269,834 194,750 57,582 10,674 3,559 1,604 955 333 196 181 Est. 379,896 195,931 63,655 17,392 10,313 8,396 12,321 9,199 12,038 50,651 Employees 17,273 1,129 2,430 1,627 1,231 1,102 1,468 1,142 1,386 5,756 _______________________________________________________________________________________________________________ Companies 100 % 72.2 % 21.3 % 4.0 % 1.3 % 0.6 % 0.4 % 0.1 % 0.1 % 0.1 % Est. 100 % 51.6 % 16.8 % 4.6 % 2.7 % 2.2 % 3.2 % 2.4 % 3.2 % 13.3 % Employees 100 % 6.5 % 14.1 % 9.4 % 7.1 % 6.4 % 8.5 % 6.6 % 8.0 % 33.3 % _______________________________________________________________________________________________________________ Est./Co. 1.4 1.0 1.1 1.6 2.9 5.2 12.9 27.6 61.4 279.8 Firm Size 64.0 5.8 42.2 152.4 345.9 687.2 1,537.6 3,430.4 7,072.5 31,802.8 Plant Size 45.5 5.8 38.2 93.5 119.4 131.3 119.2 124.2 115.2 113.6 _______________________________________________________________________________________________________________ Wholesale Trade All less 20 20-99 100-249 250-499 500-999 1000-2499 2500-4999 5000-9999 Companies 213,054 190,506 20,555 1,577 290 121 * 5 * Est. 246,175 201,125 32,258 6,333 2,349 2,610 * 1,500 * Employees 2,100,808 899,948 750,210 228,508 98,759 98,783 * 24,600 * _______________________________________________________________________________________________________________ Companies 100 % 89.4 % 9.6 % 0.7 % 0.1 % 0.1 % * 0.0 % * Est. 100 % 81.7 % 13.1 % 2.6 % 1.0 % 1.1 % * 0.6 % * Employees 100 % 42.8 % 35.7 % 10.9 % 4.7 % 4.7 % * 1.2 % * _______________________________________________________________________________________________________________ Est./Co. 1.2 1.1 1.6 4.0 8.1 21.6 * 300.0 * Firm Size 9.9 4.7 36.5 144.9 340.5 816.4 * 4,920.0 * Plant Size 8.5 4.5 23.3 36.1 42.0 37.8 * 16.4 * _______________________________________________________________________________________________________________ Source: Bureau of Census, Enterprise Statistics: 1958, part 1, General Report, Table 8. Note: Est./Co. is the number of establishments per company, firm size is the number of employees per company, and plant size is the number of employees per establishment. * Due to problems of disclosure, these totals are included in the previous size category.
34
Table 4 - continued
Firm Characteristics by Employment Size Class, 1958 _______________________________________________________________________________________________________________ Retail Trade All less 20 20-99 100-249 250-499 500-999 1000-2499 2500-4999 5000-9999 10,000+ Companies 1,688,322 1,641,862 42,813 2,443 613 269 181 67 37 37 Est. 1,839,234 1,684,572 72,672 15,450 9,410 7,869 9,661 7,020 7,591 24,989 Employees 8,034,128 3,745,306 1,512,779 359,747 209,918 187,089 274,642 233,618 238,120 1,272,909 _______________________________________________________________________________________________________________ Companies 100 % 97.2 % 2.5 % 0.1 % 0.0 % 0.0 % 0.0 % 0.0 % 0.0 % 0.0 % Est. 100 % 91.6 % 4.0 % 0.8 % 0.5 % 0.4 % 0.5 % 0.4 % 0.4 % 1.4 % Employees 100 % 46.6 % 18.8 % 4.5 % 2.6 % 2.3 % 3.4 % 2.9 % 3.0 % 15.8 % _______________________________________________________________________________________________________________ Est./Co. 1.1 1.0 1.7 6.3 15.4 29.3 53.4 104.8 205.2 675.4 Firm Size 4.8 2.3 35.3 147.3 342.4 695.5 1,517.4 3,486.8 6,435.7 34,402.9 Plant Size 4.4 2.2 20.8 23.3 22.3 23.8 28.4 33.3 31.4 50.9 _______________________________________________________________________________________________________________ Services All less 20 20-99 100-249 250-499 500-999 1000-2499 2500-4999 5000-9999 10,000+ Companies 942,804 921,943 18,294 1,866 418 171 71 25 16 * Est. 983,295 936,998 28,310 5,456 3,284 2,795 2,175 1,623 2,654 * Employees 2,869,443 1,303,274 690,912 274,432 143,176 114,422 106,322 90,612 146,293 * _______________________________________________________________________________________________________________ Companies 100 % 97.8 % 1.9 % 0.2 % 0.0 % 0.0 % 0.0 % 0.0 % 0.0 % * Est. 100 % 95.3 % 2.9 % 0.6 % 0.3 % 0.3 % 0.2 % 0.2 % 0.3 % * Employees 100 % 45.4 % 24.1 % 9.6 % 5.0 % 4.0 % 3.7 % 3.2 % 5.1 % * _______________________________________________________________________________________________________________ Est./Co. 1.0 1.0 1.5 2.9 7.9 16.3 30.6 64.9 165.9 * Firm Size 3.0 1.4 37.8 147.1 342.5 669.1 1,497.5 3,624.5 9,143.3 * Plant Size 2.9 1.4 24.4 50.3 43.6 40.9 48.9 55.8 55.1 * _______________________________________________________________________________________________________________ Source: Bureau of Census, Enterprise Statistics: 1958, part 1, General Report, Table 8. Note: Est./Co. is the number of establishments per company, firm size is the number of employees per company, and plant size is the number of employees per establishment.* Due to problems of disclosure, these totals are included in the previous size category.
35
Table 4 - continued
Firm Characteristics by Employment Size Class, 1987 _______________________________________________________________________________________________________________ All Firms All less 20 20-99 100-249 250-499 500-999 1000-2499 2500-4999 5000-9999 10,000+ Companies 3,878,866 3,467,779 351,219 40,204 10,872 4,590 2,493 776 449 484 Est. 4,731,694 3,540,948 490,955 23,023 1,196 61,386 72,347 59,936 60,434 251,469 Employees 68,140,393 15,303,143 13,628,904 5,985,712 3,713,449 3,141,070 3,802,328 2,712,412 3,151,806 16,701,569 _______________________________________________________________________________________________________________ Companies 100 % 89.4 % 9.1 % 1.0 % 0.3 % 0.1 % 0.1 % 0.0 % 0.0 % 0.0 % Est. 100 % 74.8 % 10.4 % 2.6 % 1.5 % 1.3 % 1.5 % 1.3 % 1.3 % 5.3 % Employees 100 % 22.5 % 20.2 % 8.8 % 5.4 % 4.6 % 5.6 % 4.0 % 4.6 % 24.5 % _______________________________________________________________________________________________________________ Est./Co. 1.2 1.0 1.4 3.1 6.5 13.4 29.0 77.2 134.6 519.6 Firm Size 17.6 4.4 38.8 148.9 341.6 684.3 1525.2 3495.4 7,019.6 34,507.4 Plant Size 14.4 4.3 27.8 48.7 52.2 51.2 52.6 45.3 52.2 66.4 _______________________________________________________________________________________________________________ Minerals All less 20 20-99 100-249 250-499 500-999 1000-2499 2500-4999 5000-9999 10,000+ Companies 25,145 21,777 2,873 310 88 48 25 14 8 2 Est. 32,074 22,164 3,983 1,110 756 651 522 1,253 1,252 383 Employees 458,046 97,311 109,942 47,203 30,150 32,918 38,127 37,500 47,395 17,500 _______________________________________________________________________________________________________________ Companies 100 % 86.6 % 11.4 % 1.2 % 0.3 % 0.2 % 0.1 % 0.1 % 0.0 % 0.0 % Est. 100 % 69.1 % 12.4 % 3.5 % 2.4 % 2.0 % 1.6 % 3.9 % 3.9 % 1.2 % Employees 100 % 21.2 % 24.0 % 10.3 % 6.6 % 7.2 % 8.3 % 8.2 % 10.3 % 3.8 % _______________________________________________________________________________________________________________ Est./Co. 1.3 1.0 1.4 3.6 8.6 13.6 20.9 89.5 156.5 191.5 Firm Size 18.2 4.5 38.3 152.3 342.6 685.8 1,525.1 2,678.6 5,924.4 8,750.0 Plant Size 14.3 4.4 27.6 42.5 39.9 50.6 73.0 29.9 37.9 45.7 _______________________________________________________________________________________________________________ Source: U.S. Bureau of Census: Company Statistics, 1987. Note: Est./Co. is the number of establishments per company, firm size is the number of employees per company, and plant size is the number of employees per establishment.
36
Table 4 - continued
Firm Characteristics by Employment Size Class, 1987 _______________________________________________________________________________________________________________ Construction All less 20 20-99 100-249 250-499 500-999 1000-2499 2500-4999 5000-9999 10,000+ Companies 529,194 482,526 42,121 3,452 705 248 108 16 13 5 Est. 539,171 482,994 44,269 5,145 2,023 1,555 1,531 427 647 580 Employees 5,106,076 2,206,759 1,568,893 504,116 237,576 166,644 157,777 75,000 89,311 100,000 _______________________________________________________________________________________________________________ Companies 100 % 91.2 % 8.0 % 0.7 % 0.1 % 0.0 % 0.0 % 0.0 % 0.0 % 0.0 % Est. 100 % 89.6 % 8.2 % 1.0 % 0.4 % 0.3 % 0.3 % 0.1 % 0.1 % 0.1 % Employees 100 % 43.2 % 30.7 % 9.9 % 4.7 % 3.3 % 3.1 % 1.5 % 1.7 % 2.0 % _______________________________________________________________________________________________________________ Est./Co. 1.0 1.0 1.1 1.5 2.9 6.3 14.2 26.7 49.8 116.0 Firm Size 9.6 4.6 37.2 146.0 337.0 672.0 1,460.9 4,687.5 6,870.1 20,000.0 Plant Size 9.5 4.6 35.4 98.0 117.4 107.2 103.1 175.6 138.0 172.4 _______________________________________________________________________________________________________________ Manufacturing All less 20 20-99 100-249 250-499 500-999 1000-2499 2500-4999 5000-9999 10,000+ Companies 307,120 223,482 64,695 11,489 3,758 1,772 1,053 372 232 267 Est. 473,353 224,411 72,706 22,177 14,101 12,451 17,267 14,803 17,975 77,462 Employees 21,447,990 1,320,148 2,708,269 1,749,175 1,296,117 1,223,455 1,625,687 1,278,282 1,614,698 8,632,159 _______________________________________________________________________________________________________________ Companies 100 % 72.8 % 21.1 % 3.7 % 1.2 % 0.6 % 0.3 % 0.1 % 0.1 % 0.1 % Est. 100 % 47.4 % 15.4 % 4.7 % 3.0 % 2.6 % 3.6 % 3.1 % 3.8 % 16.4 % Employees 100 % 6.2 % 12.6 % 8.2 % 6.0 % 5.7 % 7.6 % 6.0 % 7.5 % 40.2 % _______________________________________________________________________________________________________________ Est./Co. 1.5 1.0 1.1 1.9 3.8 7.0 16.4 39.8 77.5 290.1 Firm Size 69.8 5.9 51.9 152.2 344.9 690.4 1,543.9 3,436.2 6,959.9 32,330.2 Plant Size 45.3 5.9 37.2 78.9 91.9 98.3 94.1 86.4 89.8 111.4 _______________________________________________________________________________________________________________ Source: U.S. Bureau of Census: Company Statistics, 1987. Note: Est./Co. is the number of establishments per company, firm size is the number of employees per company, and plant size is the number of employees per establishment.

37
Table 4 - continued
Firm Characteristics by Employment Size Class, 1987 _______________________________________________________________________________________________________________ Transportation All less 20 20-99 100-249 250-499 500-999 1000-2499 2500-4999 5000-9999 10,000+ Companies 125,355 112,611 11,046 1,165 297 127 65 21 12 11 Est. 147,611 114,424 14,927 3,779 2,110 1,965 2,291 2,234 1,283 4,598 Employees 1,891,399 466,952 423,051 171,505 100,725 88,746 94,443 78,800 83,610 383,567 _______________________________________________________________________________________________________________ Companies 100 % 89.8 % 8.8 % 0.9 % 0.2 % 0.1 % 0.1 % 0.0 % 0.0 % 0.0 % Est. 100 % 77.5 % 10.1 % 2.6 % 1.4 % 1.3 % 1.6 % 1.5 % 0.9 % 3.1 % Employees 100 % 24.7 % 22.4 % 9.1 % 5.3 % 4.7 % 5.0 % 4.2 % 4.4 % 20.3 % _______________________________________________________________________________________________________________ Est./Co. 1.2 1.0 1.4 3.2 7.1 15.5 35.2 106.4 106.9 418.0 Firm Size 15.1 4.1 38.3 147.2 339.1 698.8 1,453.0 3,752.4 6,967.5 34,869.7 Plant Size 12.8 4.1 28.3 45.4 47.7 45.2 41.2 35.3 65.2 83.4 _______________________________________________________________________________________________________________ Wholesale Trade All less 20 20-99 100-249 250-499 500-999 1000-2499 2500-4999 5000-9999 10,000+ Companies 354,676 307,321 42,297 3,761 844 268 131 34 10 10 Est. 431,869 318,872 70,629 16,473 7,858 5,901 5,167 3,356 1,135 2,478 Employees 4,756,294 1,576,839 1,603,321 554,553 282,276 184,232 205,856 116,223 67,227 165,767 _______________________________________________________________________________________________________________ Companies 100 % 86.6 % 11.9 % 1.1 % 0.2 % 0.1 % 0.0 % 0.0 % 0.0 % 0.0 % Est. 100 % 73.8 % 16.4 % 3.8 % 1.8 % 1.4 % 1.2 % 0.8 % 0.3 % 0.6 % Employees 100 % 33.2 % 33.7 % 11.7 % 5.9 % 3.9 % 4.3 % 2.4 % 1.4 % 3.5 % _______________________________________________________________________________________________________________ Est./Co. 1.2 1.0 1.7 4.4 9.3 22.0 39.4 98.7 113.5 247.8 Firm Size 13.4 5.1 37.9 147.4 334.5 687.4 1,571.4 3,418.3 6,722.7 16,576.7 Plant Size 11.0 4.9 22.7 33.7 35.9 31.2 39.8 34.6 59.2 66.9 _______________________________________________________________________________________________________________ Source: U.S. Bureau of Census: Company Statistics, 1987. Note: Est./Co. is the number of establishments per company, firm size is the number of employees per company, and plant size is the number of employees per establishment.

38
Table 4 - continued
Firm Characteristics by Employment Size Class, 1987 _______________________________________________________________________________________________________________ Retail Trade All less 20 20-99 100-249 250-499 500-999 1000-2499 2500-4999 5000-9999 10,000+ Companies 1,069,713 950,100 106,632 9,141 2,108 879 465 166 105 117 Est. 1,484,922 983,546 167,894 46,772 29,149 27,196 31,492 26,946 28,031 143,896 Employees 18,622,014 4,408,512 4,070,845 1,332,494 717,535 602,623 708,118 587,745 735,232 5,458,910 _______________________________________________________________________________________________________________ Companies 100 % 88.8 % 10.0 % 0.9 % 0.2 % 0.1 % 0.0 % 0.0 % 0.0 % 0.0 % Est. 100 % 66.2 % 11.3 % 3.1 % 2.0 % 1.8 % 2.1 % 1.8 % 1.9 % 9.7 % Employees 100 % 23.7 % 21.9 % 7.2 % 3.9 % 3.2 % 3.8 % 3.2 % 3.9 % 29.3 % _______________________________________________________________________________________________________________ Est./Co. 1.4 1.0 1.6 5.1 13.8 30.9 67.7 162.3 267.0 1,229.9 Firm Size 17.4 4.6 38.2 145.8 340.4 685.6 1,522.8 3,540.6 7,002.2 46,657.4 Plant Size 12.5 4.5 24.2 28.5 24.6 22.2 22.5 21.8 26.2 37.9 _______________________________________________________________________________________________________________ Services All less 20 20-99 100-249 250-499 500-999 1000-2499 2500-4999 5000-9999 10,000+ Companies 1,467,663 1,369,962 81,555 10,886 3,072 1,248 646 153 69 72 Est. 1,622,694 1,394,537 116,547 27,567 15,199 11,667 14,077 10,917 10,111 22,072 Employees 15,832,758 5,226,622 3,144,583 1,626,666 1,049,070 842,452 972,320 549,832 514,333 1,906,880 _______________________________________________________________________________________________________________ Companies 100 % 93.3 % 5.6 % 0.7 % 0.2 % 0.1 % 0.0 % 0.0 % 0.0 % 0.0 % Est. 100 % 85.9 % 7.2 % 1.7 % 0.9 % 0.7 % 0.9 % 0.7 % 0.6 % 1.4 % Employees 100 % 33.0 % 19.9 % 10.3 % 6.6 % 5.3 % 6.1 % 3.5 % 3.2 % 12.0 % _______________________________________________________________________________________________________________ Est./Co. 1.1 1.0 1.4 2.5 4.9 9.3 21.8 71.4 146.5 306.6 Firm Size 10.8 3.8 38.6 149.4 341.5 675.0 1,505.1 3,593.7 7,454.1 26,484.4 Plant Size 9.8 3.7 27.0 59.0 69.0 72.2 69.1 50.4 50.9 86.4 _______________________________________________________________________________________________________________ Source: U.S. Bureau of Census: Company Statistics, 1987. Note: Est./Co. is the number of establishments per company, firm size is the number of employees per company, and plant size is the number of employees per establishment.
39
Table 5 Sales Volume Distribution by Number of Stores per Chain, 1928 Sales Size Categories by Stores ___________________________________________________________________________________ Stores Per (1) (2) (3) (4) (5) (6) (7) (8) (9) (10) Chain ___________________________________________________________________________________ 2-5 0.2% 1.2% 14.7% 29.5% 26.0% 18.9% 5.5% 1.9% 2.1% 100% 6-10 0.3 1.3 11.1 27.1 27.0 22.5 4.1 2.8 3.8 100 11-25 0.8 3.0 15.6 33.9 23.3 15.5 4.0 2.2 1.7 100 26-50 0.2 0.3 17.6 35.5 27.9 16.4 1.6 0.3 0.2 100 51-100 - 1.0 17.7 33.6 22.9 17.6 6.1 1.1 - 100 101-500 - 0.3 16.4 33.8 29.7 13.2 3.9 1.6 1.1 100 501-1000 - - 0.2 4.3 23.6 49.7 13.9 6.3 2.0 100 1,001+ - 0.2 10.5 40.4 28.2 15.2 5.3 0.2 - 100 ___________________________________________________________________________________ Source: “Chain Stores: Sizes of Stores of Retail Chains,” Chain Stores, Federal Trade Commission, 1934. Note: Sales size categories are as follows: (1) less than $5,000; (2) $5,000-$9,999; (3) $10,000-$24,999; (4) $25,000-$49,999; (5) $50,000-$99,999; (6) $100,000-$249,000; (7) $250,000-$499,999; (8) $500,000-$999,999; (9) $1,000,000 and over; (10) total percentage. The sample consists of 949 chains which own 21,026 stores.

40
Table 6 Economies in Advertising for Multiunit Firms in Retail Trade, 1928 ___________________________________________________________________________________ Stores Per Chains Stores Sales Advertising Adv./Sales Chain ($ mil.) ($ mil.) (percent) ___________________________________________________________________________________ 2-5 792 2595 $433.1 $15.4 3.57% 6-10 293 2179 353.2 13.2 3.74 11-25 205 3248 258.1 6.7 2.58 26-50 97 3404 268.9 5.1 1.88 51-100 55 4052 236.9 3.9 1.63 101-500 48 10600 704.1 8.1 1.15 501-1000 8 4831 359.4 1.8 0.51 1,001+ 8 29030 1708.2 11.4 0.67 Total 1506 59939 4322.1 65.6 1.52 ___________________________________________________________________________________ Source: “Chain Store Advertising,” Chain Stores, Federal Trade Commission, 1934.

41
Table 7 Proportion of Merchandise Purchased from Manufacturers by Retail Chain Stores, 1928 ___________________________________________________________________________________ (A) (B) (C) (D) (E) Stores Per Dry Goods & Grocery Drug, Tob., Meat, Variety, Apparel, Dept. Store, Chain Gen Mer. Hard., Music Dry Goods Furniture ___________________________________________________________________________________ 2-5 29.4% 27.2% 39.5% 61.2% 83.8% 6-10 16.9 40.6 53.8 56.0 93.5 11-25 25.0 35.3 76.6 70.0 92.9 26-50 - 43.2 73.0 88.4 98.7 51-100 - 53.2 91.9 72.4 96.4 101-500 - 54.4 77.2 89.6 95.0 501-1000 - 38.9 95.2 90.0 - 1,001+ - 66.4 95.1 95.0 - ___________________________________________________________________________________ Source: “Sources of Chain-Store Merchandise,” Chain Stores, Federal Trade Commission, 1934.

42
Table 8 Industry Specialization Ratios, 1958-1987 ________________________________________________________________________ 1958 1987 ________________________________________________________________________ Establishment Employees Establishment Employees ________________________________________________________________________ All Companies 97.0% 88.3% 95.6% 87.6% Minerals 93.4 88.9 90.8 86.3 10 Metal 93.6 76.6 66.5 73.8 12 Coal 88.6 89.0 73.3 79.3 13 Oil & gas 95.5 92.1 95.8 92.6 14A Non-metallic 94.2 89.8 91.6 89.0 Construction - - 99.0 96.2 15 General - - 99.2 96.4 16 Heavy - - 94.3 88.5 17 Special - - 99.5 98.4 Transportation - - 97.7 96.2 42 Trucking - - 97.6 96.6 44 Water - - 91.7 - 47 Transport - - 99.2 - Wholesale Trade 95.5 96.0 95.3 92.4 50 Durable 96.8 96.6 96.5 94.2 51 Non-durable 94.9 95.6 93.2 89.8 Retail Trade 98.7 95.7 96.3 93.8 52 Building 98.7 97.8 98.0 96.3 53 General 97.1 88.2 63.5 83.4 54 Food 99.2 95.6 95.5 94.4 55 Automotives 98.9 98.6 96.9 96.9 56 Apparel 98.9 96.3 97.3 93.1 57 Furnitures 98.6 97.9 98.7 97.1 58 Eating 98.7 98.5 97.9 95.0 59 Miscellaneous 98.9 98.2 98.1 96.0 ________________________________________________________________________ Sources: U.S. Bureau of Census: Enterprise Statistics, 1958; Company Statistics, 1987. Notes: The specialization ratio is the percent of establishment or employment that is classified within the industry category classification of the owning company.
43
Table 8 - continued Industry Specialization Ratios, 1958-1987 ________________________________________________________________________ 1958 1987 ________________________________________________________________________ Establishment Employees Establishment Employees ________________________________________________________________________ Manufactures 82.4 78.5 81.9 71.3 20 Food 81.8 88.9 61.3 70.3 21 Tobacco 84.5 90.5 19.7 28.7 22 Textiles 85.9 87.9 68.7 73.3 23 Apparel 96.3 96.9 86.0 93.2 24 Lumber 97.4 94.1 96.0 90.0 25 Furniture 97.1 96.1 83.5 83.8 26 Paper 76.5 72.5 60.3 60.2 27 Printing 97.2 93.6 91.5 85.5 28 Chemicals 75.5 72.1 59.0 59.5 29 Petroleum 6.6 57.3 12.2 28.1 30 Rubber 60.4 78.6 71.1 81.2 31 Leather 69.1 92.9 77.1 93.1 32 Stone 90.1 83.7 84.1 75.0 33 Primary 74.1 74.4 58.0 70.2 34 Fabricated 93.8 82.8 88.6 79.1 35 Machinery 92.8 79.5 89.5 76.6 36 Electrical 68.4 72.4 74.0 72.3 37 Transportation 82.8 72.0 52.6 56.4 38 Instruments 78.8 78.0 63.5 52.4 39 Miscellaneous 76.6 72.1 95.1 91.8 Services 99.4 98.1 98.6 95.4 70 Hotels 98.8 97.8 95.6 93.8 72 Personal 99.6 99.2 98.7 96.5 73 Business 99.4 97.5 97.8 95.3 75 Automotive 99.4 98.8 99.1 95.1 76 Misc. Repair 99.8 98.7 99.2 - 78 Motion Pictures 96.9 93.7 94.9 88.6 79 Amusement 99.2 98.6 98.5 95.4 80 Health - - 99.0 96.1 81 Legal - - 100.0 - 82 Education - - 98.8 96.5 83 Social - - 98.9 98.2 87 Engineering - - 98.5 93.1 89 Micellaneous - - 99.6 - ________________________________________________________________________ Sources: U.S. Bureau of Census: Enterprise Statistics, 1958; Company Statistics, 1987. Notes: The specialization ratio is the percent of establishment or employment that is classified within the industry category classification of the owning company.

Table 9
Specialization and Diversification in U.S. Manufacturing, 1958 (Employment in Thousands)
_______________________________________________________________________________________________________________ 26A 28A 29A 30A 34A
Pulp, Paper, Board Basic Chemicals Integrated Petroleum Rubber Blast Furnace _______________________________________________________________________________________________________________ All Company 304.6 100.0% 516.9 100.0% 508.2 100.0% 298.3 100.0% 720.8 100.0% Primary 3-digit 177.4 58.2 285.3 55.2 0.0 0.0 209.3 70.2 474.2 65.8 Primary 2-digit 65.4 21.5 25.7 5.0 131.6 25.9 3.4 1.1 25.9 3.6 Other Mfg 34.8 11.4 98.9 19.1 17.6 3.5 44.0 14.7 95.7 13.3 Other Ind. 4.2 1.4 24.9 4.8 126.5 24.9 2.0 0.7 64.1 8.9 Warehouse 0.06 0.0 0.01 0.0 0.01 0.0 0.0 0.0 0.06 0.0 Wholesale- 5.3 1.8 1.8 0.3 86.4 17.0 17.7 5.9 11.1 1.5 Retail Sales 3.9 1.3 24.0 4.6 4.1 0.8 12.2 4.1 11.7 1.6 CAO 13.5 4.4 56.4 10.9 142.8 28.1 9.7 3.3 37.9 5.3 _______________________________________________________________________________________________________________
34A 35A 35G 36B 37A Metal Cans Engines and Turbines Office Machines Other Electric Motor Vehicles
_______________________________________________________________________________________________________________ All Company 107.3 100.0% 88.0 100.0% 251.3 100.0% 807.9 100.0% 938.1 100.0% Primary 3-digit 47.8 44.6 46.0 52.3 113.2 45.1 498.1 61.7 539.3 57.5 Primary 2-digit 6.4 5.9 21.4 24.3 6.3 2.5 48.5 6.0 39.1 4.2 Other Mfg 41.7 38.8 15.8 18.0 50.6 20.1 158.8 19.7 223.1 23.8 Other Ind. 0.2 0.2 0.03 0.0 5.7 2.3 13.6 1.7 16.9 1.8 Warehouse 0.0 0.0 0.0 0.0 0.0 0.0 0.0 0.0 0.06 0.0 Wholesale- 0.2 0.2 0.1 0.1 0.8 0.3 27.2 3.4 4.0 0.4 Retail Sales 2.9 2.7 3.7 4.2 60.6 24.1 26.4 3.3 46.1 4.9 CAO 8.2 7.6 0.9 1.0 14.2 5.6 35.3 4.4 69.6 7.4 _______________________________________________________________________________________________________________ Source: Bureau of Census, Enterprise Statistics: 1958, part 1, General Report, Table 6.

45
Table 9 - continued
Specialization and Diversification in U.S. Manufacturing, 1958 (Employment in Thousands)
___________________________________________________________________________________ 37B 37C 38C
Aircraft Aircraft Engines Photographic Equipment ___________________________________________________________________________________ All Company 461.9 100.0% 390.6 100.0% 85.9 100.0% Primary 3-digit 361.9 78.3 272.6 69.8 55.4 64.5 Primary 2-digit 19.8 4.3 25.0 6.4 1.1 1.3 Other Mfg 74.1 16.0 70.8 18.1 14.9 17.4 Other Ind. 3.6 0.8 4.5 1.1 4.6 5.4 Warehouse 0.0 0.0 0.0 0.0 0.0 0.0 Wholesale- 0.8 0.2 3.5 0.9 1.3 1.5 Retail Sales 0.06 0.0 1.1 0.3 5.0 5.8 CAO 1.8 0.4 13.1 3.4 3.6 4.2 ___________________________________________________________________________________ Source: Bureau of Census, Enterprise Statistics: 1958, part 1, General Report, Table 6.
NOTES
1. The literature is simply too vast to be reviewed here. For a review of the literature see Schmitz (1993). Also see Atack (1985), Lamoreaux (1985), Field (1987), Hounshell (1984), Hannah (1980, 1999), Williamson (1985), and the volumes edited by Temin (1991) and Lamoreaux and Raff (1995). For analysis concerning the rise of single-unit firms, see Sokoloff (1984a, 1984b) and Atack (1977).
2. A number of factors were responsible for the development of the Enterprise Statistics. When the census bureau began conducting censuses through mail instead of field enumeration, it found it more convenient to obtain individual establishment reports to central headquarters of firms and began collecting information on firms as a by-product. Moreover, as the scope of the censuses increased to cover wholesale trade, retail trade, and other select services, it became possible to construct information on firm activities in all sectors of the economy. The Enterprise Statistics began in 1954 when the advent of computers made it possible to coordinate the information contained in all the censuses and publish the data in a timely manner.
3. All other census publications, such as the Census of Manufactures, report information based on the establishment or plant: “An establishment, as defined by the 1958 Censuses, is an economic unit which produces or distributes goods or performs services. In most instances, an establishment is at a single physical location and is engaged in a type of activity for which there is an applicable industry or kind of business classification in the Standard Industrial Classification system... When more than one business is conducted at a single location, each business under separate ownership is regarded as a separate establishment for Census purposes. Also, in some cases, more than a single establishment is identified in a given location under one ownership. For example, in instances where a company conducts distinctly different lines of manufacturing activity in one location, it is considered for Census purposes to comprise more than one establishment, provided that the records of the business permit such a separation and the activities are substantial in size (Enterprise Statistics: 1958, General Report, Part 1, p.3).”
4. This section provides information on firms for 1958 and 1987. In 1958, the Enterprise Statistics covered 100 percent of activities in mining, manufacturing, wholesale trade and retail trade, 34 percent in services and 1 percent in transportation (warehousing); in 1987, the coverage increased to 100 percent of construction, 76 percent of services, and 29 percent of transportation and public utilities. Given the changes in the coverage of industries and changes in the definition of industries between 1958 and 1987, the comparisons over time must be interpreted with caution. The Enterprise Statistics’ out of scope industries, for which no separate information is reported, were agriculture, forestry, fisheries, communication, electric, gas, and a number of service industries. However, if a firm in one of the scope industries, such as a manufacturing firm, owns an establishment in an out of scope industry such as fisheries, the information is reported as part of the non-primary industry employment for the manufacturing firm. Thus, the Enterprise Statistics do not artificially limit the boundaries of firms to those industries that are in scope.
5. Using data from Thorp (1924) and Thorp et. al (1941), Kim (1999b) reports additional information on the extent of multiunit activity in manufacturing for 1919 and 1937. The data show that 7.4 percent and 15.4 percent of establishments were part of multiunit firms in 1919 and 1937 respectively. The data also show that over half of manufacturing employment was accounted for by multiunit firms in 1937.
6. This calculation corrects for the increase in the industrial coverage in 1987 by omitting construction, transportation, and a number of service industries.
7. The Enterprise Statistics provides information for nine different employment size classes: fewer than 20, 20-99, 100-259, 250-499, 500-999, 1,000-2,499, 5,000-9,999, and more than 10,000 employees.
8. The Enterprise Statistics reports information on the multiunit firms’ central administrative organizations which engaged in general administrative, supervisory, purchasing, accounting, and related management functions, and their auxiliaries such as research and development laboratories, warehouses, and other support services (repair shops and data processing). Between 1958 and 1987, employment in auxiliaries grew from 0.2 to 0.9 million employees. The data show that research and development auxiliaries were important for manufacturing whereas warehousing auxiliaries were important for the retail trade and wholesale trade industries.

47
9. The results of cross-sectional regressions of managerial intensity (central administrative employee per company) on firm size (employee per company) and number of establishments per firm indicate that these variables are highly statistically significant for 1958 and 1987.
10. In general, a theory of multiunit enterprises must explain two related phenomenon. First, the theory must explain why there is one or more plants operating in different localities. This issue is addressed in Kim (1995, 1998, 1999a, 1999c). Second, the theory must explain why firms own one or more establishments. This second issue is addressed in Kim (1999b) and in this paper. See Kim (1999b) for a more complete discussion on these issues.
11. Chandler (1977) argued that the economies of scale in retailing came from economies in stock-turn rather than sales. Typically, stock-turn is measured as sales divided by inventory. It is not clear how the stock-turn variable should be interpreted. One interpretation is that a rise in stock-turn indicates an increase in the turnover rate of goods. However, the inverse of stock-turn is the cost of holding inventory. Alternatively, a rise in stock-turn, as measured by sales divided by inventory, may be caused by a fall in inventory rather than by an actual increase in the turnover rate of goods. Unfortunately, the FTC report does not contain information on inventory. An examination of stock-turn by retail chain sizes in 1948, using data from the Census of Distribution, suggests that stock-turn rises with chain sizes. Thus, one of the benefits of organizing production in multiunit retail firms may come from economies in inventory.
12. The results reported in Table 5 hold for most kinds of retail businesses. See FTC’s Chain Stores: “Sizes of Stores of Retail Chains,” Appendix VI.
13. The FTC data on chain stores show a significant correlation between chain stores and urbanization. The regression of the number of chain stores per 100,000 inhabitants in states on the percent of urban population and percent of population filing federal income taxes suggests that the density of chain stores is significantly correlated with urbanization and purchasing power.
14. In 1928, the 1506 chains which reported total advertising expenditures spent over $65 million in all forms of advertising, an average of $43,552 per chain. The data on the 1030 chains which reported information on expenditures by different kinds of advertising, show that these chains spent 72.3% of the total in newspaper advertising, 14.1% in window and counter advertising, and 4.1% for pamphlet and dodger advertising; the remainder is accounted for by free goods, billboards, street car and bus, loss-leader, magazine, radio, direct mail, and other advertising.
15. The examination of the ratio of advertising expenditures to sales by chain sizes differed significantly for the different types of retail business. However, in a majority of these businesses, the ratio declined as chain sizes increased.
16. See p.4 in FTC’s Chain Stores: “Chain Store Private Brands.” The FTC analysis of 70 grocery and grocery meat chains operating over 30,000 stores in 1928 indicate that coffee was the most frequently reported commodity sold under private brand. Other items were flour, tea, mayonnaise, canned milk, and butter. The leading commodities sold under private brands in seven leading large chains were canned beans, catsup, coffee, canned corn, flour, jelly, canned peaches, canned peas, sandwich spreads, canned tomatoes, and tea. Of these chains, Kroger Grocery & Baking Co. and the Great Atlantic & Pacific Tea Co. led the use of private brands with 92 and 69 commodities; the remaining stores reported fewer than 40.
17. The FTC defined private brand as a commodity sold by the chain only through its own stores under its own distinctive mark of identification. However, since the chain store schedule did not contain a definition, the retail chains were given certain liberties in defining what constituted a private brand. For example, F. W. Woolworth included any commodity with a trade mark “W” as a private brand; however, others, like Sears, Roebuck & Co. included only those items that were registered trademark brands.
18. See Table 8 in FTC’s Chain Stores: “Chain Store Private Brands.”
48
19. The FTC report on chain store manufacturing show that 162 chains out of 1,068 reporting firms manufactured part of the goods sold by them in their stores in 1930. The retail sales of goods manufactured by these chains represented only 8.1% of total sales of all 1,068 reporting firms (see FTC’s Chain Stores: “Chain Store Manufacturing”).
20. The manufacturing chains were much more likely to own private brands than non-manufacturing chains. Of 1,044 chains, 80% of manufacturing chains owned private brands as compared to only 20% for non-manufacturing chains. In addition, based on a smaller sample of firms, the FTC reports that private brand sales for manufacturing chains were 34.1% whereas it was only 14.6% for non-manufacturing firms. One men’s shoe store chain reports its reason for manufacturing its shoes: “To supply our stores with a product of known uniformity and a standard merchandise conforming in every respect to the product advertised by us (see p.45 in FTC’s Chain Stores: “Chain Store Manufacturing”).
21. The 1396 chains which reported information on sources of merchandise accounted for 81.2% of stores and 76.5% of sales of the 1727 chains which provided reports to the FTC (see p.2-3 in FTC’s Chain Stores: “Sources of Chain Store Merchandise”).
22. Hoffman (1940) investigated the labor cost of distributing fresh fruits and vegetables in Philadelphia for the A&P chain and independents. Hoffman estimated that chain systems required half the labor hours to put a given volume of produce in stores as were required by the wholesale channels.
23. The level of industry specialization depends critically upon the definition of industries. In general, as industries are defined more finely, industry specialization will rise by definition. The Enterprise Statistics calculates the industry specialization ratio, or the percentage of activity engaged in the firm’s primary industry, using the 3-digit enterprise industrial classifications.
24. Using data from Williamson and Daum (1959) and Hidy and Hidy (1955), Chandler claimed that the average cost of a typical plant in the mid-1880's, with a daily charging capacity of 1,500-2,000, was 1.5 cents per gallon whereas in Standard Oil’s plants, each with daily capacities of 5,000-6,500, the cost was 0.534 cents per gallon. According to Chandler, the multiunit trust was able to exploit economies of scale by consolidating kerosene production in a few plants and by coordinating the flow of materials to these refineries. However, the reliability of the evidence on the cost advantages enjoyed by Standard Oil over its independent rivals is questionable. Williamson and Daum (1959, 483) derived their estimate of the average cost of refining for independent refineries from a Cleveland refiner who testified that the cost of refining 150,000 barrels a year was $70,000 a year. On the other hand, Standard Oil’s average cost of refining was derived from a report compiled for its Manufacturing Committee (Hidy and Hidy, 1955, 107). There are at least two potential problems with comparing these two cost measures. First, there is no reason to believe that the two estimates compare refining of identical products using identical inputs. For the cost estimate of the independent refinery, there is no mention of what type of crude was used to produce what types of petroleum products whereas, for Standard Oil, it was based on all the refineries and lubricating oil works in the combination. Given the tremendous variation in the type and quality of crude and in the resulting final products which existed at the time, it is quite possible that many independent firms produced higher quality products than Standard Oil. Second, there were significant variations in the refining capacity of Standard Oil’s plants and few achieved the daily charging capacity of the Bayonne plant which was estimated to be approximately 6,000-7,000 barrels a day. Finally, Granitz and Klein (1996) demonstrate that the decline in the price of kerosene was due to fall in the price of crude rather than due to economies of scale achieved by Standard Oil.
25. The FTC secured data from as many chains and independents in Washington DC, Cincinnati, Memphis and Detroit for as many products. For example, in Washington DC, prices for 274 items were collected from independents and chains. Since the independents and chains did not sell the same volume of goods on all items, the FTC also collected information on the store volumes of these products carried by independents and chains. The prices reported are the geometric averages of the figures weighted by chain and by independent volumes.
26. There were approximately 395 cooperative grocery chains in 1929. The FTC report provides information on
49
319 cooperative grocery chains with retail membership of 43,141 stores. In general, the cooperative headquarter coordinated developing private brands, homogenous stores and store signs and group advertising. In return, it received initiation and advertising fees from its stores (see FTC’s Chain Stores: “Cooperative Grocery Chains”).
27. See Emmet and Jeuck (1950), Hower (1946), Twyman (1954), Lebhar (1963), Pope (1983), Strasser (1989) and Tedlow (1996) among others.
28. The N.W. Ayer & Son advertising agency possessed valuable knowledge concerning the value of numerous local newspapers around the country for their various clients. For example, N.W. Ayer & Son’s Directory of Newspapers and Periodicals contained: “a list of all newspapers and periodicals published in the United States and Dominion of Canada, arranged alphabetically by towns in states grouped in geographic sections, giving counties in which the places are situated, with the population of each according to the United States and Canadien census, the political majority of each state and county in the United States at the last presidential election, and in connection with papers, the year of establishment, time of issue, politics, denomination, or general character, publisher’s price for the ten lines one month, etc. (Hower (1949, 83)).”
REFERENCES
Atack, J. 1977. “Returns to Scale in Antebellum United States Manufacturing.” Explorations in Economic History 14: 337-359.
_____. 1985. “Industrial Structure and the Emergence of the Modern Industrial Corporation.” Explorations in Economic History 22: 29-53. Chandler, A. 1977. The Visible Hand. Cambridge, MA: Belknap Press. _____. 1990. Scale and Scope. Cambridge, MA: Belknap Press. _____. 1992. “Organizational Capabilities and the Economic History of the Industrial Enterprise.” Journal of Economic Perspectives 6: 79-100. Emmet, B. and J. Jeuck. 1950. Catalogues and Counters: A History of Sears, Roebuck and
Company. Chicago, IL: University of Chicago Press. Federal Trade Commission. 1931-1934. Chain Stores. Volumes I-IV. Washington DC: GPO. Field, A. 1987. “Modern Business Enterprise as a Capital-Saving Innovation.” Journal of
Economic History 47: 473-485. Granitz, E. and B. Klein. 1996. “Monopolization by ‘Raising Rivals’ Costs’: The Standard Oil
Case.” Journal of Law and Economics 39: 1-47. Hannah, L. 1980. “Visible and Invisible Hands in Great Britain.” In Managerial Hierarchies.
Edited by A. Chandler and H. Daems. Cambridge, MA: Harvard University Press. _____. 1999. “Marshall’s ‘Trees’ and the Global ‘Forest’: were ‘Giant Redwoods’ Different?” In
Learning by Doing in Markets, Firms, and Countries. Edited by N. Lamoreaux, D. Raff, and P. Temin. Chicago, IL: University of Chicago Press.
Hidy, R. and M. Hidy. 1955. History of Standard Oil Company: Pioneering in Big Business 1882-1911. New York, NY: Harper & Brothers.
Hoffman, A.C. 1940. “Large Scale Organization in the Food Industries.” In Investigation of Concentration of Economic Power, TNEC, Monograph 35. Washington, DC: GPO.
Hounshell, D. 1984. From the American System to Mass Production, 1800-1932. Baltimore, MD: Johns Hopkins Press.
Hower, R. 1946. History of Macy’s of New York, 1858-1919. Cambridge, MA: Harvard

50
University Press.
_____. 1949. The History of an Advertising Agency. Cambridge, MA: Harvard University Press. Kim, S. 1995. "Expansion of Markets and the Geographic Distribution of Economic Activities:
The Trends in U.S. Regional Manufacturing Structure, 1860-1987." Quarterly Journal of Economics 110: 881-908.
_____. 1998. “Economic Integration and Convergence: U.S. Regions, 1840-1987.” Journal of Economic History 58: 659-683.
_____. 1999a. “Regions, Resources, and Economic Geography: The Sources of U.S. Regional Comparative Advantage, 1880-1987.” Regional Science and Urban Economics 29: 1-32.
_____. 1999b. “The Rise of Multiunit Firms in U.S. Manufacturing,” Explorations in Economic History, forthcoming. An earlier version of this paper is available as NBER working paper #6425.
_____, 1999c. “Urban Development in the United States, 1690-1990.” Mimeo. Lamoreaux, N. 1985. The Great Merger Movement in American Business, 1895-1904.
Cambridge, MA: Cambridge University Press. _____ and D. Raff. Editors. 1995. Coordination and Information. Chicago, IL: University of
Chicago Press. Lebhar, G. 1963. Chain Stores in America, 1859-1962. Clinton, MA: Colonial Press Inc. Pope, D. 1983. The Making of Modern Advertising. New York: NY: Basic Books. Schmitz, C. 1993. The Growth of Big Business in the United States and Western Europe, 1850- 1939. Cambridge: Cambridge University Press. Sokoloff, K. 1984a. “Investment in Fixed and Working Capital during Early Industrialization:
Evidence from U.S. Manufacturing Firms.” Journal of Economic History 44: 545-556. _____. 1984b. “Was the Transition from the Artisanal Shop to the Non-Mechanized Factory
Associated with Gains in Efficiency? Evidence from the U.S. Manufacturing Censuses of 1820 and 1850.” Explorations in Economic History 21: 351-382.
Strasser, S. 1989. Satisfaction Guaranteed. Washington, DC: Smithsonian Institution Press. Tedlow, R. 1996. New and Improved. Cambridge, MA: Harvard Business School Press. Temin, P. Editor. 1991. Inside the Business Enterprise. Chicago, IL: University of Chicago Press. Thorp. W. 1924. The Integration of Industrial Operation. Washington, DC: GPO. _____, W. Crowder, et. al. 1941. The Structure of Industry. Washington, DC: GPO. Twyman, R. 1954. History of Marshall Field & Co. Philadelphia, PA: University of
Pennsylvania Press. U.S. Bureau of the Census. 1948. Census of Business. Volume II: Retail Trade. Washington, DC:
GPO. _____. Various years. Enterprise Statistics. Washington, DC: GPO. _____. Various years. Census of Manufactures. Washington, DC: GPO. Williamson, H. and A. Daum. 1959. The American Petroleum Industry: The Age of Illumination
1859-1899. Evanston, IL: Northwestern University Press. Williamson, O. 1985. The Economic Institutions of Capitalism. New York, NY: Free Press.