the groundwater resources of the dockum aquifer in … · texas water development board report 359...
TRANSCRIPT

Texas Water Development Board
Report 359
The Groundwater Resources of the Dockum Aquifer in Texas
by Robert G. Bradley, P.G., and Sanjeev Kalaswad, Ph.D., P.G.
December 2003

Geoscientist Seal
The contents of this report (including figures and tables) document the work of theFollowing Licensed Texas Geoscientists:
Robert Bradley, P.G. No. 707
Robert Bradley prepared the original illustrations,data assimilation, and draft reports, all of whichwere subsequently modified and updated bySanjeev Kalaswad.
The seal appearing on this document was authorized onMay 19, 2009 by
@4~,-----/__RobertB~O
Sanjeev Kalaswad, P.G. No. 478
J
Sanjeev Kalaswad wrote the report, prepared theillustrations including the geological cross-sectionsand chemical plots, and helped develop the groundwaterestimates in the aquifer.
The seal appearing on this document was authorized onMay 19, 2009 by
/- ~/,-;rSanjeev Kalaswad
Report 359 - The Groundwater Resources of the Dockum Aquifer in Texas, 2003

iii
Texas Water Development Board
E. G. Rod Pittman, Chairman, Lufkin Thomas Weir Labatt III, Member, San Antonio
Jack Hunt, Vice Chairman, Houston Wales H. Madden, Member, Amarillo
Dario Vidal Guerra, Jr., Member, Edinburg William W. Meadows, Member, Fort Worth
J. Kevin Ward, Executive Administrator
Authorization for use or reproduction of any original material contained in this publication, i.e., not obtained from other sources, is freely granted. The Board would appreciate acknowledgment. The use of brand names in this publication does not indicate an endorsement by the Texas Water Development Board or the State of Texas.
Published and distributed by the
Texas Water Development Board P.O. Box 13231, Capitol Station
Austin, Texas 78711-3231
December 2003 Report 359
(Printed on recycled paper)

iv
This page intentionally blank.

v
Table of Contents 1.0 Executive Summary .............................................................................................................1 2.0 Introduction..........................................................................................................................2 3.0 Study Area ...........................................................................................................................2 3.1 Physiography............................................................................................................5 3.2 Climate.....................................................................................................................5 4.0 Geology................................................................................................................................8 4.1 Stratigraphy..............................................................................................................8 4.2 Depositional Environment .....................................................................................20 4.3 Structure.................................................................................................................23 5.0 Water Levels and Regional Groundwater Flow.................................................................23 5.1 Recharge ................................................................................................................28 5.2 Aquifer Properties..................................................................................................30 5.3 Chemical Quality ...................................................................................................34 5.4 Discharge ...............................................................................................................48 6.0 Estimate of Groundwater in the Dockum Aquifer.............................................................50 7.0 Summary and Conclusions ................................................................................................52 8.0 Acknowledgments..............................................................................................................53 9.0 References..........................................................................................................................54
List of Figures 2-1 Lateral extent of the study area and the Dockum Group in southwestern United States.....3 2-2 Areal extent of study area and the Dockum aquifer in Texas..............................................4 3-1 Historical annual precipitation.............................................................................................7 4-1 Index map of geologic cross sections ..................................................................................9 4-2 Geologic cross section A-A’..............................................................................................10 4-3 Geologic cross section B-B’ ..............................................................................................11 4-4 Geologic cross section C-C’ ..............................................................................................12 4-5 Geologic cross section D-D’..............................................................................................13 4-6 Geologic cross section E-E’...............................................................................................14 4-7 Geologic cross section F-F’ ...............................................................................................15 4-8 Geologic cross section G-G’..............................................................................................16 4-9 Geologic cross section H-H’..............................................................................................17 4-10 Geologic cross section I-I’ .................................................................................................18 4-11 Approximate elevation of the bottom of the Dockum Group ............................................21 4-12 Approximate elevation of the top of the Dockum Group ..................................................22 5-1 Approximate water-level elevations in the Dockum aquifer, 1981 through1996..............24 5-2 Selected hydrographs from the northern part of the study area .........................................25 5-3 Selected hydrographs from the central part of the study area............................................26 5-4 Selected hydrographs from the southern part of the study area.........................................27 5-5 Hypothetical regional flow paths of groundwater in the Dockum aquifer ........................29 5-6 Range of well yields in the Dockum aquifer by county.....................................................33 5-7 Distribution of total dissolved solids (TDS) in the Dockum aquifer, 1981 through 1996.36

vi
5-8 Concentrations of total dissolved solids (TDS) detected in Dockum aquifer water samples, 1981 through 1996 ..............................................................................................37
5-9 Range of hardness in groundwater samples obtained from the Dockum aquifer, 1981, through 1996 ......................................................................................................................38
5-10 Trilinear diagrams for the northern and central parts of the study area, and for areas overlying the Edwards Plateau region and the Pecos River valley....................................39
5-11 Range of sulfate ion concentrations in groundwater samples obtained from the Dockum aquifer,1981 through 1996.................................................................................................42
5-12 Percent sodium in groundwater samples obtained from the Dockum aquifer, 1981, through 1996 ......................................................................................................................44
5-13 Range of sodium adsorption ratio (SAR) values in groundwater samples from the Dockum aquifer, 1981 through 1996.................................................................................45
5-14 Residual sodium carbonate (RSC) values in groundwater samples obtained from the Dockum aquifer,1981 through 1996..................................................................................46
5-15 Salinity hazard for areas overlying the Dockum aquifer ...................................................47 5-16 Historical water use from the Dockum aquifer, 1994 through 2000 .................................49
List of Tables 3-1 Geologic Formations in the Texas Panhandle and West Texas and Their Water-Bearing
Characteristics......................................................................................................................6 4-1 Development of Upper Triassic Stratigraphic Nomenclature in Texas. ............................19 5-1 Summary of Dockum aquifer properties............................................................................31 5-2 Summary of Specific Capacities of Wells in the Dockum Aquifer... ................................34 5-3 Gross Alpha, Gross Beta, and Radium Isotope concentrations detected in groundwater
samples obtained from the Dockum aquifer, 1981 through 1996......................................40 5-4 Elements Detected at Concentrations above Their Maximum Contaminant Levels
(MCLs) in Groundwater Samples Collected from the Dockum Aquifer, 1981 through 1996....................................................................................................................................41
5-5 Estimated volume of water in the Dockum aquifer ...........................................................51
Appendix I List of wells with geophysical well logs used for the cross-sections in this report.. .........59
Appendix II Details of well yields in the Dockum aquifer.. ..................................................................62
Appendix III Details of specific capacity tests in the Dockum aquifer.. .................................................63
vii
Appendix IV Total dissolved solids in groundwater samples from the Dockum aquifer, 1981 through 1996. ....................................................................................................................66
Appendix V Major cations detected in groundwater samples collected from the Dockum aquifer, 1981 through 1996. ............................................................................................................67
Appendix VI Major anions detected in samples from the Dockum aquifer, 1981 through 1996. .....................................................................................................................69
Appendix VII Percent sodium, sodium adsorption ratio, residual sodium carbonate, boron, and hardness
values in groundwater samples from the Dockum aquifer, 1981 through 1996.. ..............71
Appendix VIII Areas in each county underlain by the Dockum aquifer with different total dissolved solid
concentrations. ...................................................................................................................73

viii
This page intentionally blank.

1
1.0 Executive Summary
The Dockum aquifer is a minor aquifer that underlies much of the Ogallala Formation in the Texas Panhandle and West Texas. Recoverable groundwater in the Dockum aquifer occurs within the many Upper Triassic sandstone and conglomerate beds that host the aquifer. The hydrogeologic properties of the aquifer vary widely. For example, well yields range from 0.5 to 2,500 gpm and transmissivity from 48 to 4,600 square feet per day. Generally, however, well yields and transmissivities are fairly low throughout much of the aquifer.
Precipitation recharges the aquifer where it is exposed at the land surface around the eastern and southern edges of the aquifer. The confined portions of the aquifer receive some recharge by leakage from overlying and underlying geologic units. We estimate that annual recharge to the aquifer is approximately 31,000 acre-feet. Discharge from the aquifer occurs from pumping wells, small springs, evapotranspiration and cross-formational flow.
Regional groundwater flow in the aquifer is generally to the east. Historical hydrographs of wells show that water levels in the northern and southern parts of the aquifer have declined in some areas and risen in others over the past 20 to 30 years. In the central part of the aquifer, water levels have generally risen over the same time period.
Groundwater in the Dockum aquifer is generally of poor quality. Water quality ranges from fresh in the outcrop areas to brine in the confined parts of the aquifer. It also tends to deteriorate with depth, and total dissolved solids (TDS) concentrations can exceed 60,000 mg/l in the deepest parts of the aquifer. Water in the Dockum aquifer is also typically hard with a mean hardness of about 470 mg/l. Radionuclides naturally derived from uranium minerals in the host rocks occur at concentrations above 5 pCi/l in widespread areas of the aquifer. Most counties in the study area also had at least one groundwater sample that contained sulfate or chloride at concentrations greater than the secondary standard of 250 mg/l. In contrast, fluoride concentrations were higher than the secondary standard in only a few samples collected from five counties. Much of the land overlying the Dockum aquifer is susceptible to salinity problems originating from the high concentrations of sodium in the groundwater. This problem is most prevalent over the confined areas of the aquifer and is less of a concern over the outcrops.
We estimate that the total amount of water in the entire Dockum aquifer in the study area is approximately 185 million acre-feet. Of this amount, approximately 109 million acre-feet contains TDS of less than 5,000 mg/l, about 27 million acre-feet between 5,000 and 10,000 mg/l, and 49 million acre-feet greater than 10,000 mg/l. However, not all of the water in the Dockum is readily available for withdrawal. In fact, measured aquifer parameters suggest that the aquifer can provide only small quantities of water. Furthermore, because the confined part of the aquifer (where water with the highest TDS concentrations is present) receives little recharge, any significant withdrawal of water from these areas will essentially mine or deplete the aquifer.

2
2.0 Introduction
The Upper Triassic Dockum Group extends over approximately 96,000 square miles in parts of Colorado, Kansas, Oklahoma, New Mexico and Texas (Figure 2-1). In Texas, sands of the Dockum Group produce small to moderate quantities of fresh to saline water and constitute the Dockum aquifer which is classified as a minor aquifer (Ashworth and Hopkins, 1995). As delineated by Ashworth and Hopkins (1995), the Dockum aquifer includes an area of the aquifer containing groundwater with less than 5,000 mg/l total dissolved solids (Figure 2-2). However, for the purposes of this report, we also include other areas of the aquifer that have total dissolved solids concentrations greater than 5,000 mg/l. In this report, the term “Dockum aquifer” is used loosely for all water-bearing strata of the Dockum Group regardless of their dissolved solids content.
Locally, the Dockum aquifer can be an important source of groundwater for irrigation, public supply, oil-field activity, livestock, and manufacturing. However, deep pumping depths, poor water quality, low yields, and declining water levels have discouraged its more widespread use. Nevertheless, the aquifer may become an important secondary source in the future, especially in areas where demand from the overlying Ogallala and Edwards-Trinity (Plateau) aquifers is high. It could also be considered for desalination in the future.
To date, only a few investigations have been conducted on the Dockum aquifer in Texas. One of the first regional studies was conducted by Gould (1907) in west Texas. Later, Galloway (1955) investigated Triassic artesian wells near Hereford, Texas, to evaluate the feasibility of obtaining water from similar types of wells in eastern New Mexico. Other studies of a local nature were conducted by Fink (1963) and Rayner (1965). Several county-level studies on the Dockum aquifer have also been conducted (see, for example, Garza and Wesselman, 1959; Ogilbee and others, 1962; Shamburger, 1967; White, 1971; Duffin, 1984; and Ashworth, 1986).
The aim of this study was to evaluate the groundwater resources of the Dockum aquifer (Figure 2-2). Specific goals of the investigation were to compile and evaluate existing geologic and hydrologic information on the area, determine the quality of groundwater in the Dockum aquifer, and estimate the approximate amount of groundwater in the aquifer. Much of the information presented in this report was obtained from previous literature and Texas Water Development Board (TWDB) records. We collected groundwater samples in 1995 and 1996 from all of the counties in the study area to assess the chemical quality of water in the aquifer.
3.0 Study Area
The study area (Figure 2-2) encompasses the total areal extent of the Dockum Group in Texas (approximately 42,000 square miles). The outcrop area of the Dockum Group is approximately 5,500 square miles, and extends as a north-south-trending belt paralleling the eastern escarpment of the Llano Estacado. The belt is narrow between Armstrong and Dickens counties in the north but broadens south of Dickens County to include most of Scurry and Mitchell counties.

3
Figure 2-1. Lateral extent of the Dockum Group in southwestern United States (modified from McKee and others, 1959; Bureau of Economic Geology, 1967, 1968, 1969, 1974, and 1983; McGowen and others, 1977).
Lateral extent of theDockum Group
Texas
Oklahoma
0 100 200 miles
ColoradoKansas
NewMexico

4
Figure 2-2. Areal extent of the study area and the Dockum aquifer in Texas.
ANDREWS
GAINES
YOAKUM
COCHRAN
BAILEY
PARMER
REEVES
LOVINGWINKLER ECTOR
WARD
PECOS
CROCKETT
TOM GREENREAGANIRION
UPTON
MIDLAND GLASSCOCK
STERLING COKE
DAWSON FISHER
NOLAN
KENTLYNNTERRY
HOWARD
HOCKLEY LUBBOCK
HALELAMB FLOYD MOTLEY
CROSBY
DICKENS
SWISHER
DEAF SMITHRANDALL
BRISCOE
CARSON
MOOREHARTLEY
DALLAM SHERMAN
POTTER
OLDHAM
ARM-STRONG
CASTRO
CRANE
MARTIN
GARZA
BORDEN
outcrop/unconfined
subcrop/confined
0 50 miles
limits of study area
5,000 mg/l TDS limit(downdip limit of aquiferas defined by Ashworthand Hopkins, 1995)

5
Within the study area, the Dockum aquifer is exposed along the Canadian River in the north, along the east edge of the Caprock Escarpment in the east, and in parts of Borden, Fisher, Garza, Howard, Kent, Mitchell, Nolan, and Scurry counties in the south. Other small exposures are found in Coke, Crane, Ector, Loving, Martin, Sterling, and Ward counties. Covered outliers of the Dockum aquifer are present in Hansford, Hutchinson, and Ochiltree counties.
The Dockum aquifer in the study area overlies Permian-age units and is in turn overlain by Jurassic rocks in the northwest corner of the Texas Panhandle, by Cretaceous sediments in the southern High Plains and Edwards Plateau, and by the Ogallala Formation in the northern High Plains (Table 3-1). In the southwest part of the study area, the aquifer is overlain by the Cenozoic Pecos Alluvium.
3.1 Physiography
Much of the study area lies within the High Plains section of the Great Plains physiographic province which extends from the Pecos River in the south to the latitude of the Great Bear Lake in Canada (Thornbury, 1965). The High Plains section in Texas is a vast, monotonous flat surface underlain primarily by Tertiary sediments. The eastern edge of the section is marked by a pronounced escarpment called the Caprock Escarpment.
Smaller parts of the study area in the south lie within the Pecos Valley and the Edwards Plateau sections of the Great Plains physiographic province. The Pecos Valley section, which lies southwest of the High Plains section, consists of a broad north-south-trending topographic depression underlain by highly soluble Cretaceous rocks. To its east lies the Edwards Plateau section, characterized by low relief (except along major stream channels) in the west and higher relief in the east. The Edwards Plateau is underlain by carbonate rocks of Cretaceous age. A small part of the study area east of the Caprock Escarpment falls within the Osage section of the Central Lowlands province and is underlain by mainly Pennsylvanian or Permian rocks.
Five major river basins drain the study area, including the basins of the Canadian and Red rivers, which drain eastward, and the basins of the Brazos, Colorado, and Pecos rivers, which drain toward the southeast. A significant part of the Dockum Group outcrop is drained by the Canadian and Colorado rivers and their tributaries.
3.2 Climate
The climate over much of the northern and central parts of the study area is of a continental steppe type and is characterized by large variations in daily temperatures, relatively low humidity, and infrequent rainfall events (Larkin and Bomar, 1983). Average annual precipitation in these areas ranges from about 21 inches in the eastern parts of the study area to about 17 inches in the western parts (Figure 3-1). Historically, mean annual precipitation has ranged from 13.89 inches in the southern part of the study area (Figure 3-1c) to 22.23 inches in the central part (Figure 3-1b). Three-fourths of the precipitation in these areas typically occurs between early spring and early fall. May and September are usually the rainiest months. Snowfall is an important source of precipitation in the winter. Temperatures often exceed 100° F in the summer and drop below freezing in the winter.

6
Table 3-1. Geologic Formations in the Texas Panhandle and West Texas and Their Water-Bearing Characteristics (modified from Knowles and others, 1984; Lehman, 1994a and 1994b).
System Series Group Formation Physical Characteristics
Water-bearing Characteristics
Quaternary Cenozoic Pecos Alluvium
Unconsolidated to partially consolidated sand, silt, gravel, clay, and caliche.
Yields small to large amounts of fresh to slightly saline water.
Tertiary Late
Miocene to Pliocene
Ogallala
Tan, yellow, and reddish-brown, silty to coarse-grained sand alternating with yellow to red silty clay and variable sized gravel.
Yields moderate to large amounts of water to well.
Washita
Massive, fine to coarse grained, white, gray, or yellowish gray limestone and thick, dark greenish gray, gray, or yellow marl.
Yields small to large amounts of water to wells and springs.
Kiamichi
Thinly laminated, sometimes sandy, gray to yellowish-brown shale with beds of thin, gray argillaceous limestone, and, thin, yellow limestone.
Yields small amounts of water locally to wells.
Edwards Light-gray to yellowish-gray, thick bedded to massive, fine- to coarse-grained limestone.
Yields small to large amounts of water to wells and springs.
Comanche Peak Light gray to yellowish-brown, irregularlybedded, argillaceous limestone, thin beds light-gray shale.
Yields small to large amounts of water to wells.
Cretaceous
Fred
eric
ksbu
rg
Walnut
Light-gray to yellowish-brown, fine to medium-grained, sandstone, thin bedded, gray to grayish-yellow, calcareous shale; and light gray to grayish-yellow, argillaceous limestone.
Not known to yield water to wells.
Trinity Antlers
White, gray, yellowish-brown to purple, fine to medium-grained, loosely cemented sandstone and conglomerate, with beds of siltstone and clay.
Yields small to moderate amounts of water to wells.
Morrison Variegated shale, sandstone, siltstone, and limestone.
Yields small amounts of fresh to slightly saline water. Jurassic
Exeter Light-colored sandstone. Yields small amounts of fresh to slightly saline water.
Cooper Canyon Reddish-brown to orange siltstone and mudstone with lenses of sandstone, and conglomerate.
Trujillo
Gray, brown, greenish-gray, fine to coarse-grained sandstone and sandy conglomerate with thin gray and red shale interbeds.
Tecovas Variegated, sometimes sandy mudstone with interbedded fine to medium-grained sandstones.
Triassic
Dockum
Santa Rosa Red to reddish-brown sandstone and conglomerate.
Yields small to large quantities of fresh to brine water to wells and springs.
Dewey Lake Red siltstone and shale. Not known to yield water to wells.
Ochoa Rustler Dolomite, anhydrite, sandstone,
conglomerate, and variegated shale.
Yields small to large amounts of slightly to moderately saline water.
Sandstone, shale, gypsum, anhydrite, dolomite, and selenite.
Yields small to large amounts of fresh to moderately saline water.
Permian
Guadalupe Undifferent-iated

7
Figure 3-1. Historical annual precipitation recorded at (a) Amarillo International Airport, (b) Crosbyton, and (c) Odessa.
ANDREWS
GAINES
YOAKUM
COCHRAN
BAILEY
PARMER
REEVES
LOVINGWINKLER ECTOR
WARD
PECOS
CROCKETT
TOM GREENREAGANIRION
UPTON
MIDLAND GLASSCOCK
STERLING COKE
DAWSON FISHER
NOLAN
KENTLYNNTERRY
HOWARD
HOCKLEY LUBBOCK
HALELAMB FLOYD MOTLEY
CROSBY
DICKENS
SWISHER
DEAF SMITHRANDALL
BRISCOE
CARSON
MOOREHARTLEY
DALLAM SHERMAN
POTTER
OLDHAM
ARM-STRONG
CASTRO
CRANE
MARTIN
GARZA
BORDEN
Odessa
05
101520253035404550
1950 1955 1960 1965 1970 1975 1980 1985 1990 1995 2000
Mean Precipitation = 13.89 in
05
101520253035404550
1950 1955 1960 1965 1970 1975 1980 1985 1990 1995 2000
Amarillo International Airport
05
101520253035404550
1950 1955 1960 1965 1970 1975 1980 1985 1990 1995 2000Year
Mean Precipitation = 19.71 in
(a)
(b)
(c)
Mean Precipitation = 22.23 in
Crosbyton
Year
Year

8
Evaporation in the northern and central parts of the study area is greatest in the summer months. The average annual evaporation potential for an open surface water body in Lubbock County is approximately three-and-half times the average annual precipitation (Knowles and others, 1984).
The southern part of the study area (Trans-Pecos) is semi-arid and is characterized by a wide range of temperatures, low rainfall, and high evaporation rates (Ashworth, 1990). Temperatures typically range from below freezing in winter to over 100° F during the summer. Average annual precipitation in the southern part of the study area ranges from 9 inches in the west to about 14 inches in the east with much of it occurring in April and October. Historical annual precipitation at the Odessa rain gage station has ranged from 6.2 inches to 30.8 inches (Figure 3-1c).
4.0 Geology
The Triassic sediments of the Dockum Group that form the Dockum aquifer consist of a series of alternating sandstones and shales (Cazeau, 1962). Individual sandstone units are light- to dark- or greenish-gray, buff and red, and range in thickness from a few feet to about 50 feet. They are often lens-shaped, partly conglomeratic, poorly sorted, friable, and micaceous. The red and maroon sandy shale units that separate the sandstones range in thickness from about 50 to 100 feet.
Recoverable groundwater in the Dockum aquifer is present within the many sandstone and conglomerate beds that occur throughout the sedimentary sequence. The coarse-grained deposits form the more porous and permeable water-bearing units of the Dockum Group, whereas the fine-grained sediments form impermeable aquitards in the group (Fallin, 1989). The more prolific parts of the aquifer are consequently developed in the lower and middle sections where the coarse-grained sediments predominate (Best Sandstone in Figure 4-1 through 4-10). Locally, any water-bearing sandstone within the Dockum Group is typically referred to as the Santa Rosa aquifer. In the Pecos River valley, the Dockum aquifer is usually known as the Allurosa aquifer (White, 1971).
The geologic setting of the Dockum Group, as well as information on aquifer properties, water levels, chemical quality of water in the aquifer, and recharge to and discharge from the aquifer are presented below.
4.1. Stratigraphy
Recent investigations of the Dockum Group have largely focused on stratigraphic nomenclature, and a fair amount of controversy has arisen over its rank as a group or formation (for an in-depth

9
Figure 4-1. Index map of geologic cross-sections.
0 50 miles
TEXASOKLAHOMA
F
E
C
B
A
D
G
HI
Lateral extent of theDockum Group

Figure 4-2 Geologic cross-section A-A’.
4,000
3,000
2,000
1,000
4,000
3,000
2,000
1,000
Permian Undifferentiated
Canadian River
Jurassic strata
Midland Basin Matador Arch Palo Duro Basin Bravo Dome Dalhart Basin
South North
Cretaceous strataOgallala Formation
Dockum Group
A
A’500
Miles
A A’

Figure 4-3. Geologic cross-section B-B’.
Moore
CountyCounty B’Hartley
UnionCounty TEXAS
QuayCounty
B
COLORADO
NEW MEXICO
EastWest
OKLAHOMA
0 10
Miles
B B’
NM28NM14 NM31
NM28Q1
Q26
B60
Q56
4,000
4,500
3,500
3,000
2,500 2,500
3,000
3,500
4,000
4,500
DockumGroup
DockumGroup
Cretaceous andJurassic strata
Permian Undifferentiated
Q1 - TCEQ assigned geophysical log number
NM14 - Geophysical log number assigned byMcGowen and others, 1977N

Figure 4-4. Geologic cross-section C-C’.
Randall County
Swisher County
Castro County
Deaf Smith County
Hereford
Tulia
C
C’
Oldham County
SoutheastNorthwest
C C’
Q190152902 Q14
Q15
Q13 1024204
Q8Q3 Q4
1126916
4,000
3,600
3,200
2,800
2,400
4,000
3,600
3,200
2,800
2,400
Miles
0 10
Q1 - TCEQ assigned geophysical log number
0752902 - TWDB state well number
DockumGroup
Q9
Permian Undifferentiated
N

Figure 4-5 Geologic cross-section D-D’.
?
D’
D
D D’Q2
Q6Q6
Q28Q18 Q43
Q37Q13 Q19
Q21 Q4 Q40Q1
Q6Q5 Q13
4,000
3,600
3,200
2,800
2,400
2,000
1,600
2,000
2,400
2,800
3,200
3,600
4,000
Permian Undifferentiated
Q1 - TCEQ assigned geophysical log number
0 10
Motley CountyFloyd CountyHale County
Abernathy
Floydada
MuleshoeLamb County
Bailey County
Littlefield
1,600
N
Miles
West East
Ogallala Formation
Dockum Group

Figure 4-6 Geologic cross-section E-E’.
E
E’
?
N
E
E’Q86
Q127 Q63Q82
Q262 Q35Q28
Q190 Q68 Q69
Q196Q107
Q15Q11
Q30Q16 Q5
Q1Q84
DockumGroup
Q1 - TCEQ assigned geophysical log number
Miles
0 10Permian Undifferentiated
Dickens CountyCrosbyton
Crosby County
Lubbock County
Ralls
Hockley County
LubbockLevelland
Cochran County
Morton
West East
Ogallala Formation
Dockum Group

Figure 4-7. Geologic cross-section F-F’.
FFN
FF’
Q134 Q302 Q57
Q297Q298
Q7 Q7Q1
Q31
Q161Q155
Q23 Q84 Q136Q59
Q74
Q397
Q337Q38
Q1 - TCEQ assigned geophysical log number
Permian Undifferentiated
DockumGroup
Garza County
Post
Lynn County
Tahoka
Terry County
Brownfield
Yoakum County
Plains
0 10
Miles
Q159
West East
Ogallala Formation
Dockum Group

Figure 4-8. Geologic cross-section G-G’.
G
G’
G G’
3,600 3,600
3,200
2,800
2,400
2,000
1,600
800
1,200Permian Undifferentiated
DockumGroup
Q569 Q113Q227 Q257
Q115Q96
Q86 Q89 Q39Q427 Q40 Q316
Q263Q159 Q9
Q661
Q1 - TCEQ assigned geophysical log number
Miles
0 10
Gaines County Dawson County
Semionole
Borden County
Lamesa
Scurry County
Snyder
4,0004,000
Q398
West East
Dockum Group
N

Figure 4-9. Geologic cross-section H-H’.
H’H
Q514
Q699 Q168
Q401
Q269Q227
Q998
Q1494 Q29Q282
Q81Q245
Q179 Q162 Q58Q6
Q501Q50
Q8
Q358
Q152Q60Q378
Q31
Q67Q13 Q214
3,600
3,200
2,800
2,400
2,000
1,600
1,200
800
Cretaceous strata
DockumGroup
3,600
2,800
3,200
2,400
2,000
1,600
1,200
800Permian Undifferentiated
Q1 - TCEQ assigned geophysical log number
2931919 - TWDB state well number
Miles
0 10
Andrews
Martin County
Stanton
Howard County
Big SpringMitchell County
Colorado City
Nolan County
Roscoe
Andrews County
Ogallala Formation
N
West East
HH’
Dockum Group

Figure 4-10. Geologic cross-section I-I’.
Permian Undifferentiated
?
I’
I
Southwest Northeast
I I’
Q79 Q67
Q651
Q142Q66
Q4Q597
Q1126Q299
Q743 Q532
Q462
Q532
Q321Q71
Q281
Q44Q466 Q10
Q88Q6
Q563
Q87Q231
Q402 Q79 Q24Q184
Q207
0 20
Miles
LovingCounty
WinklerCounty
Ector County
Midland County
Martin County Howard County
Mitchell County
Dockum Group
Q1 - TCEQ assigned geophysical log number
N

Table 4-1. Development of Upper Triassic Stratigraphic Nomenclature in Texas (modified from Lucas and Anderson, 1995; McGowen, and others, 1977, 1979).
Cummins (1890)
Gould (1907)
Adams (1929)
Adkins (1932)
Reeside and others (1957)
McGowen and others
(1977, 1979)
Lucas and Anderson
(1992, 1993, 1994, 1995)
Lehman (1994a, 1994b)
Not Recognized
Chinle Formation
Chinle Formation
Not Described
Chinle Formation
Bull Canyon Member
Cooper Canyon
Formation
Sandstone
Trujillo Formation
Trujillo Formation
Trujillo Formation
Santa Rosa Formation
Upper
Trujillo Member
Trujillo Sandstone
Tecovas Member
Red Clay Tecovas Formation
Tecovas Formation
Tecovas Formation Colorado
City Member
Tecovas Formation
Conglomerate
Doc
kum
Gro
up
Tecovas Formation
Doc
kum
Ser
ies
Santa Rosa
Sandstone
Camp Springs
Conglomerate
Camp Springs
Conglomerate
Camp Springs
Conglomerate
Doc
kum
Gro
up
Lower
Chi
nle
Gro
up
Doc
kum
For
mat
ion
Camp Springs Member
Doc
kum
Gro
up
Santa Rosa
Formation

20
discussion, see Lucas and Anderson, 1992, 1993, 1994; Lehman, 1994a, 1994b). Table 4-1 is a summary of the development of the stratigraphic nomenclature of the Dockum Group. Because our study is focused on groundwater resources, we have avoided the stratigraphic controversy and have retained the well established and widely accepted nomenclature of Dockum Group suggested by Lehman (1994a, 1994b) to describe the Triassic-age rocks.
Rocks of the Dockum Group are the only Triassic-age sediments exposed at the land surface in Texas. The formations within the Dockum Group (in ascending stratigraphic order) are: Santa Rosa Formation, Tecovas Formation, Trujillo Sandstone, and Cooper Canyon Formation (Lehman 1994a and 1994b in Table 4-1). Locally, the term “Santa Rosa” has been applied to the lower sandstone zones in the Dockum Group that may include all units of the Dockum Group except the upper mudstone. Traditionally, the base of the Dockum Group has been identified as a mudstone that is difficult to distinguish from older Permian sediments (McGowen and others, 1977, 1979; Granata, 1981). However, some older studies and more recent investigations describe the base of the Dockum Group as an extensive sandstone or conglomerate bed. The basal unit, called the Santa Rosa Formation, rests unconformably on Upper Permian red beds and can be as much as 130 feet thick (Lehman and others, 1992; Lehman, 1994a, 1994b; Riggs and others, 1996).
The Santa Rosa Formation is overlain by variegated mudstones and siltstones of the Tecovas Formation (Gould, 1907), which in turn is disconformably overlain by the 250-foot-thick Trujillo Formation composed of massive crossbedded sandstones and conglomerates (Lehman, 1994a, 1994b). The Trujillo Formation, exposed in some of the outcrop areas, has been mapped along the Canadian River (Bureau of Economic Geology, 1969, 1983).
Gould (1907) recognized an additional mudstone unit above the Trujillo Formation. The upper beds of this unit consist of reddish-brown to orange mudstone, along with some siltstone, sandstone and conglomerate and are now known as the Cooper Canyon Formation (Lehman and others, 1992). Previously, these beds were referred to as the Chinle Formation or the Chinle Equivalent (Table 4-1).
The subsurface mapping of individual beds within the Dockum Group has not been entirely successful. The apparent discontinuity of many beds in the subsurface has precluded an accurate correlation of outcrop units or the mapping of their exact subsurface extent (McGowen and others, 1977; Granata, 1981). Geologic cross-sections (Figure 4-1 through 4-10) illustrate the general stratigraphy of the Dockum Group in the study area. Appendix A contains a list of wells with geophysical logs that we used to construct the cross-sections. The approximate elevations of the base and top of the Dockum Group are shown in figure 4-11 and 4-12, respectively.
4.2 Depositional Environment
McGowen and others (1977, 1979) and Granata (1981) described the Dockum Group as a 2,000-foot-thick sequence of sediments that accumulated in fluvial, deltaic, and lacustrine environments within a closed continental basin. On the basis of paleocurrent analysis, Lucas and Anderson (1992) concluded that sediments of the Dockum Group were mainly fluvial in origin and that the siltstones and mudstones were deposited on floodplains, interfluves, and in small

21
Dalhart Basin
Legend
Figure 4-11. Approximate elevation of the bottom of the Dockum Group.

22
Figure 4-12. Approximate elevation of the top of the Dockum Group.

23
isolated ponds. The basin received sediments from all directions from the erosion of Paleozoic sedimentary source rocks exposed around the edges of the basin. Meandering, low-gradient streams traversed lowlands to the east and west, and higher gradient streams were present at the north and south ends of the basin.
On the basis of an analysis of detrital zircon grains in northwest Texas, Riggs and others (1996) suggested that early deposition of the Dockum Group (Santa Rosa Formation) was accomplished by a river system that flowed from Texas to Nevada during the Late Triassic.
4.3 Structure
The beds of the Dockum Group are essentially horizontal, with gentle dips toward the center of the structural basin whose axis trends approximately north-south. The dip varies considerably from location to location but is approximately 30 feet per mile (Rayner, 1965). Deposition of the Dockum Group sediments in the Triassic represents the final filling of a number of small adjoining, intracratonic basins that were active mainly in the Paleozoic (Granata, 1981). In Texas, these basins include the Midland basin in the south, the Palo Duro basin in the central region, and the Dalhart basin in the north (Figure 4-11, Fallin, 1989). The basins are separated by structural highs such as the Amarillo Uplift between the Dalhart and Palo Duro basins and the Matador Arch between the Palo Duro and Midland basins (Figure 4-11). The Central Basin Platform present at the southwest end of the Midland Basin separated the Midland Basin from the Delaware Basin to the west. The entire area over which the Dockum Group sediments were deposited has been referred to as the Dockum Basin (Granata, 1981).
The top of the Dockum Group is relatively flat (Figure 4-11) and reflects the final filling of the Dockum Basin and the effects of post-depositional erosion. The opening of the Gulf of Mexico in the Cenozoic tilted the entire region toward the southeast.
5.0 Water Levels and Regional Groundwater Flow
We used water-level information available in the TWDB database and from the USGS New Mexico district to construct an average water-level elevation map for the study area during the 1981 through 1996 time period (Figure 5-1). Water-level information from New Mexico was used primarily to constrain water-level contours in the Texas part of the Dockum aquifer. Groundwater flow in the Dockum aquifer is generally to the east and southeast (Figure 5-1). In Hartley and Oldham counties, groundwater flows locally toward the Canadian River. In Mitchell County, groundwater flows toward the Colorado River. Hydraulic gradients range from about 8 feet per mile in the central part of the aquifer to 37 feet per mile along the Canadian River. A relatively steep gradient of about 14 feet per mile is present in Cochran, Yoakum, and Gaines counties. The rate of groundwater flow ranges from about 0.002 feet per day in Terry County to 0.05 feet per day in Deaf Smith County. We determined these flow rates from hydraulic conductivities derived from aquifer tests, an assumed average aquifer porosity, and regional hydraulic gradients shown on water-level maps.
We also used the water-level information to construct hydrographs for 20 wells in the study area (Figure 5-2, 5-3, and 5-4). For convenience in discussing the hydrographs, we divided the study

24
Figure 5-1. Approximate water level elevations in the Dockum aquifer, 1981 through 1996.
*
****** ****
* ** * *
**
**
* ** * ***
** * ** ***** * ** * **** ** *
****** *
*
**
* ***
* ** ****
****
**
* * *** * * *
**
* ** ** ** *
**
****** *
*
*** ****** **
*******
**
*
***
******** ** * **
*
*
*
*
**
* *** ****
** *
************* ***
* **
** **
***
*
*
****************
** ** *** ***** ***
********* *
******** ******** ** ** *** ***
** *** ** *** ***
** ************ ** *** ***** **** ********
******* ****** ****
*********
** ** ** *****
*********** ****** ** *
** ****
DALLAM SHERMAN HANSFORD
HARTLEY HUTCHINSON
OLDHAM POTTER CARSON
DEAF SMITH RANDALL
PARMER CASTRO SWISHER BRISCOE
BAILEY LAMB HALE FLOYD MOTLEY
COCHRAN HOCKLEY CROSBYLUBBOCKDICKENS
YOAKUM TERRY LYNN GARZA KENT
GAINES DAWSON SCURRYBORDEN FISHER
ANDREWS MARTIN HOWARD MITCHELLNOLAN
WINKLER ECTOR MIDLAND GLASSCOCKSTERLING
COKELOVING
TOMGREEN
MOORE
ARMSTRONG
*
*
**
**
* *** * *
*********REEVESWARD
CRANE UPTON REAGANIRION
PECOSCROCKETT
Boundary of theDockum aquifer
Contour interval = 200 feetElevation in feet above sea level
Water level measurement*Water level depression
Legend
Miles
0 25 50

25
Figure 5-2. Selected hydrographs from the northern part of the study area.
area into three areas: a northern area (Figure 5-2), a central area (Figure 5-3), and a southern area (Figure 5-4).
Overall, the hydrographs show that water levels in many parts of the aquifer have fluctuated over time. The fluctuations were not uniform everywhere. For example, in the northern part of the study area, water levels in Moore, Potter, and Armstrong counties generally declined from 1981 through 1996. The largest recorded decline (110 feet) was in well 06-42-903 in Potter County (Figure 5-2). In other areas, the water level remained relatively stable (Deaf Smith County),
1930 1940 1950 1960 1970 1980 1990 2000
Well 10-01-601, Deaf Smith County(Depth 260-ft, Surface elevation 4,275 ft)
Year1930 1940 1950 1960 1970 1980 1990 2000
Well 07-16-211, Moore County(Depth 711-ft, Surface elevation 3,714 ft)
Well 07-42-901, Oldham County(Depth 250-ft, Surface elevation 4,138 ft)
Year
Year
Year
Year
Year
Well 11-25-502, Swisher County(Depth 1,000-ft, Surface elevation 3,622 ft)
Well 06-61-401, Armstrong County(Depth 268-ft, Surface elevation 3,446 ft)
Well 06-42-903, Potter County(Depth 240-ft, Surface elevation 3,582 ft)
1930 1940 1950 1960 1980 1990 2000
1930 1940 1950 1960 1970 1980 1990 2000
1930 1940 1950 1960 1980 1990 20001970
19701930 1940 1950 1960 1980 1990 20001970
3,300
3,320
3,340
3,360
3,380
3,400
3,420
3,400
3,420
3,440
3,460
3,480
3,500
3,860
3,880
3,900
3,920
3,940
3,960
3,980
4,000
4,020
4,040
4,060
4,080
4,100
4,120
3,140
3,160
3,180
3,200
3,220
3,240
3,260
3,220
3,240
3,260
3,280
3,300
3,320
3,340
3,380

26
Figure 5-3. Selected hydrographs from the central part of the study area.
declined slightly (Oldham County), or even rose (Swisher County).In the central part of the study area (Howard, Mitchell, Scurry, Nolan, Fisher, and Sterling counties) the hydrographs generally show an increase in water levels over much of the area (Figure 5-3). The largest increase (almost 45 feet) was recorded in well 29-27-601 in Fisher County (Figure 5-3). This well and others that had a rise in water level are located on or near the outcrop of the Dockum aquifer and reflect increased recharge, reduced pumpage, or both. The Sterling County hydrograph (well 28-64-901) is flat, suggesting that the aquifer was not being used much or that it was receiving recharge from the overlying Cretaceous aquifer. The drought of the late 1950s is clearly evident in the Nolan County hydrograph (Figure 5-3), which shows a fall in water level in the late 1960’s and early 1970’s presumably in response to increased pumpage from irrigation wells or decreased recharge
Well 28-40-602, Mitchell County(Depth 65-ft, Surface elevation 2,157 ft)
20001930 1940 1950 1960 1970 1980 1990 2000
Well 28-64-901, Sterling County(Depth 107-ft, Surface elevation 2,414 ft)
Well 29-44-109, Nolan County(Depth 300-ft, Surface elevation 2,316 ft)
Well 29-27-601, Fisher County(Depth 116-ft, Surface elevation 2,387 ft)
Well 28-24-904, Scurry County(Depth 80-ft, Surface elevation 2,302 ft)
Well 22-01-904, Motley County(Depth 86-ft, Surface elevation 2,670 ft)
Well 28-28-805, Howard County(Depth 139-ft, Surface elevation 2,685 ft)
2,080
2,100
2,120
2,140
2,160
2,180
2,200
2,300
2,320
2,340
2,360
2,380
2,400
2,420
2,220
2,240
2,260
2,280
2,300
2,320
2,340
2,280
2,300
2,320
2,340
2,360
2,380
2,400
2,200
2,220
2,240
2,260
2,280
2,300
2,320
2,540
2,560
2,580
2,600
2,620
2,640
2,660
2,520
2,540
2,560
2,580
2,600
2,620
2,640
1930 1940 1950 1960 1970 1980 1990 2000
1930 1940 1950 1960 1970 1980 1990 2000
1930 1940 1950 1960 1970 1980 1990 2000
1930 1940 1950 1960 1970 1980 1990 2000
1930 1940 1950 1960 1970 1980 1990 2000
1930 1940 1950 1960 1970 1980 1990 2000Year
Year
Year
Year
Year
Year
Year

27
Figure 5-4. Selected hydrographs from the southern part of the study area.
to the aquifer. Hydrographs of wells in the south part of the study area (Andrews, Ector, Upton, Loving, Reeves, Ward, and Winkler counties) show a variety of water-level fluctuations (Figure 5-4). Hydrographs of wells in Loving, Ector, and Reeves counties show a distinct decline in the water table, whereas that from Ward County shows relatively stable water levels or only small declines. The most significant water-level decline (almost 85 feet) occurred in well 28-39-401 in Ector County (Figure 5-4). This decline was most likely the result of pumping from a nearby municipal water-supply well.
20001930 1940 1950 1960 1970 1980 1990
1930 1940 1950 1960 1970 1980 1990
1930 1940 1950 1960 1970 1980 1990 2000
1930 1940 1950 1960 1970 1980 1990 2000
1930 1940 1950 1960 1970 1980 1990 2000
1930 1940 1950 1960 1970 1980 1990 2000
1930 1940 1950 1960 1970 1980 1990 2000
2000
Well 46-12-502, Loving County(Depth 327-ft, Surface elevation 2,883 ft)
Well 46-46-211, Reeves County(Depth 160-ft, Surface elevation 2,633 ft)
Well 45-55-702, Upton County(Depth 100-ft, Surface elevation 2,445 ft)
Well 45-19-101, Ector County(Depth 650-ft, Surface elevation 2,895 ft)
Well 27-50-201, Andrews County(Depth 800-ft, Surface elevation 3,330 ft)
Well 46-16-201, Winkler County(Depth 394-ft, Surface elevation 2,868 ft)
Well 46-31-702, Ward County(Depth 160-ft, Surface elevation 2,667 ft)
2,680
2,700
2,720
2,740
2,760
2,780
2,800
2,500
2,520
2,540
2,560
2,580
2,600
2,620
2,620
2,640
2,660
2,680
2,700
2,720
2,740
2,480
2,500
2,520
2,540
2,560
2,580
2,600
2,480
2,500
2,520
2,540
2,560
2,580
2,600
2,600
2,620
2,640
2,660
2,680
2,700
2,720
3,120
3,140
3,160
3,180
3,200
3,220
3,240
Year
Year
Year
Year
Year
Year
Year

28
Where overlain by younger formations, the Dockum aquifer is typically under confined conditions. Within the Dockum Group itself, mudstone units (especially the thick upper sequence within the center of the aquifer basin) also act as confining beds. The aquifer is partially confined in areas where the Dockum Group sediments are exposed at the surface. The aquifer is also partially confined in parts of the Pecos River valley (Loving, Reeves, Ward and Winkler counties) where Dockum Group sandstones are in contact with the Cenozoic Pecos Alluvium. Where exposed at land surface, the Dockum aquifer is typically under unconfined conditions.
5.1 Recharge
The Dockum aquifer is recharged by precipitation over areas where Dockum Group sediments are exposed at the land surface (Figure 2-2). Shamburger (1967) suggested that substantial recharge also occurred along stream channels and tributaries of several creeks, such as Champion Creek and the South Fork Champion Creek in Nolan County, where the basal conglomerate and sandstone units are exposed (Lucas and Anderson, 1993). Shamburger (1967) reported that one well in Nolan County was capable of producing 15 to 20 percent more water after sustained heavy runoff into the South Fork Champion Creek.
Groundwater in the confined parts of the Dockum aquifer in Texas most likely originated as precipitation that fell on outcrops in eastern New Mexico. This recharge ceased when the Pecos River and Canadian River valleys were incised during the Pleistocene between the present-day Dockum aquifer in Texas and the paleo-recharge areas to the west (Dutton and Simpkins, 1986; Figure 5-5).
Soils on the outcrop of the Dockum aquifer have a major effect on recharge to the aquifer. Soils that have formed on the outcrop of the Dockum Group sediments belong to hydrologic groups B, C, and D (soils that are classified on the basis of their water intake at the end of long-duration storms). A vast majority of the soils are included in Group B, which is characterized by moderate infiltration rates when saturated. Some soils on the outcrop belong to Group C which is characterized by slow infiltration rates when saturated. The Group D soils, which have the second-largest areal extent on the outcrop, are typically heavy clay soils exhibiting a high shrink-swell potential and a very slow infiltration rate when saturated. Areas that have Group B soils near subsurface sandstone units provide the greatest recharge potential to the aquifer.
The Dockum aquifer is also recharged by upward leakage from the underlying Permian rocks, although in the Palo Duro Basin the water movement is downward because the hydraulic head in the Dockum aquifer is almost 1,800 feet higher than it is in the underlying Permian brine aquifer (Bassett and others, 1981; Bentley, 1981; Wirojanagud and others, 1984; Orr and others, 1985).
Downward leakage into the Dockum aquifer occurs from the overlying Ogallala Formation, Cretaceous rocks, and Cenozoic Pecos Alluvium as a result of hydraulic-head differences between the aquifers (Dutton and Simpkins, 1986; Nativ and Gutierrez, 1988).
In parts of Crockett, Irion, Reagan, Sterling, Tom Green and Upton counties the Santa Rosa Sandstone is in hydrologic contact with the overlying Edwards-Trinity (Plateau) aquifer (Walker, 1979; Ashworth and Christian, 1989). Groundwater samples obtained from wells completed in the Dockum aquifer in Sterling County are dominated by calcium bicarbonate-type (Ca-HCO3)

Figure 5-5. Hypothetical regional flow paths of groundwater in the Dockum aquifer. Before hydrologic divides developed, groundwater flowed from an area in eastern New Mexico downdip into the confined portions of the aquifer in Texas (A and B). After divides formed by incision of rivers (C and D), groundwater flow into Texas from New Mexico was essentially cut off(modified from Gustavson and Finley, 1985; Dutton and Simpkins, 1986). Contours are in feet above mean sea level.
Late Tertiary
(A)
PortalesRiver
SimanolaRiver
Proto-CanadianRiver
(B)
10,000
5,000
0Permian confining layer
West East
New Mexico Texas
Recent
(C)
ColoradoRiver
BrazosRiver
Prairie Dog Town ForkRed River
CanadianRiver
(D)
10,000
5,000
0Permian confining layer
West East
New Mexico Texas
Pecos River
SeaLevel
Sea
LevelPermian confining layer
Permian confining layer
PecosRiver
Dockum Group
Dockum Group

30
water that is characteristic of groundwater in the Edwards-Trinity (Plateau) aquifer. The presence of CaHCO3 in Dockum groundwater suggests that there is some groundwater movement from the limestone-dominated Edwards-Trinity (Plateau) aquifer into the Dockum aquifer.
A combination of groundwater divides and thick, relatively impermeable mudstones (Cooper Canyon Formation) above the sandstone layers in the center of the basin prevents the aquifer from receiving direct recharge from surface precipitation. We estimate that the annual recharge to the entire aquifer is approximately 31,000 acre-feet. This estimate was derived for outcrops and other areas in contact with overlying aquifers.
5.2 Aquifer Properties
The properties of an aquifer are typically described using terms such as well yield, specific capacity, transmissivity, hydraulic conductivity and storativity (Driscoll, 1986). Well yield is defined as the volume of water discharged per unit time from a well either by pumping or from free flow. It is typically measured in gallons per minute (gpm). Specific capacity is the well yield per unit drawdown in the water level when the well is pumped. The specific capacity of a well, expressed as gallons of water per minute per foot of drawdown, can be a good indicator of the water-producing ability of an aquifer. Aquifers with high specific capacities are generally productive aquifers whereas those that have low specific capacities are not as productive.
Transmissivity is a term that describes the ease with which water can move through an aquifer. Transmissivity specifically describes the volume of water that will move through a vertical strip of the aquifer one unit wide, under a unit hydraulic gradient, for a unit time. Storativity (or storage coefficient) represents the volume of water released from or taken into storage per unit of aquifer storage area per unit change in head. The storativity of an unconfined aquifer corresponds to its specific yield which is the fraction of water that can be drained by gravity for a unit volume of aquifer. In confined aquifers, storativity is the result of compression of the aquifer and expansion of the confined water when pressure is reduced during pumping.
Table 5-1 is a compilation of Dockum aquifer properties from various sources including the TWDB Well Information/Ground Water Data database and published literature. Mean well yields by county ranged from 6 gpm in Howard County to 770 gpm in Moore County with individual yields ranging from 0.5 gpm in Mitchell County to 2,500 gpm in Winkler County (Table 5-1, Figure 5-6, and Appendix III).
Specific capacity tests performed on 86 wells completed in the Dockum aquifer indicate that mean specific capacities by county ranged from 0.14 gallons per minute per foot (gpm/ft) in Garza County to 25 gpm/ft in Reeves County (Table 5-2). The mean specific capacity from all tests was 3.84 gpm/ft. The highest specific capacity within a county ranged from 0.19 gpm/ft in Garza County to 37 gpm/ft in Reeves County (Table 5-2).
We also performed 21 pumping tests in nine counties to determine aquifer properties including transmissivity which was calculated using standard techniques (i.e., Theis, 1935; Cooper and Jacob, 1946). Transmissivity ranged from about 48 square feet per day (ft2/d) in Upton County to 4,600 ft2/d in Winkler County (Table 5-1). The mean transmissivity from all tests was

Table 5-1. Summary of Dockum aquifer properties.
Transmissivity
County TWDB Well
No. Test Date
Screened Interval(s) (feet bgs)
Yield (gpm) (gpd/ft) (ft2/d)
Storage Coefficient
Type of Test
Source of Data
12/01/1966 14,800 1,978 D 1 10-13-503 12/04/1966 683-944 1,400 10,700 1,430 -- R 1 Deaf Smith 10-14-202 01/16/1959 600-776 788 22,000 2,941 1.0 x 10⁻⁴ M 2,4
03/1963 7,900 1,056 4.5 x 10⁻⁵ D 8 29-34-709 11/05/1963 -- -- 7,000 936 5.5 x 10⁻⁵ D 8 03/1963 75 4,400 588 D 8 29-34-714 11/05/1963 -- 66 4,700 628 -- D 8
03/1963 7,700 1,029 6.5 x 10⁻⁵ D 8 03/1963 6,100 815 9.6 x 10⁻⁵ R 8 29-34-716 11/05/1963
-- -- 6,500 869 4.4 x 10⁻⁵ D 8
120-195 29-35-437A 11/21/1963 205-273 170 11,270 1,506 1.3 x 10⁻⁴ D 6,8
01/09/1964 5,856 783 4.4 x 10⁻⁴ D 7,9 29-35-712 01/10/1964 -- -- 7,760 1,037 4.4 x 10⁻⁴ R 7,9 29-35-713 01/09/1964 -- 245 3,680 492 -- D 8
Mitchell
29-43-403 -- -- 70 12,300 1,644 1.2 x 10⁻⁴ 6,8 200-282 Motley 22-01-201 10/26/1968 287-300 321 11,700 1,564 -- R 7,8
Potter 06-42-601 07/25/1958 140-170 -- 480 64 -- R 8 07/22/1970 440-450 8,000 1,069 D 8
500-510 520-530 Scurry 28-31-301 07/23/1970 545-555
608 5,900 789 -- R 8
NOTES: * = Open hole - Well numbers used in previous reports and subsequently renumbered: A. 29-35-106, B. D-291, C. D-293, E. D-299, F. D-279. - Types of tests: D = Drawdown, M = Average Value, R = Recovery, SD = Step Drawdown. - Sources of data: 1. Dutton and Simpkins, 1986; 2. Fink, 1963; 3. Garza and Wesselman, 1959; 4. Rayner, 1963; 5. Robotham et al., 1985; 6.
Shamburger, 1967; 7. Smith, 1973; 8. TWDB Central Records; 9. White, 1968. gpm = gallons per minute bgs = below ground surface gpd/ft = gallons per day per foot

1
Table 5-1. Summary of Dockum aquifer properties (continued).
Transmissivity
County TWDB Well
No. Test Date
Screened Interval (s) (feet bgs)
Yield (gpm) (gpd/ft) (ft2/d)
Storage Coefficient
Type of Test
Source of Data
07/24/1967 15,600 2,085 D Swisher 11-26-611 07/24/1967 620-820 2,000 28,800 3,850 -- SD 1
02/19/1985 1833-1853 1,533 D 1873-1893 27-05-204 02/19/1985 1903-1993
74.9 1,081 205 -- R 5
02/26/1985 1733-1793 866 D 1813-1833
Terry
27-05-205 02/26/1985 1853-1903 72.2 1,199 116 -- R 5
Upton 45-46-603 03/08/1966 428-490 36 360 48 -- D 9 04/27/1957 305 25,000 3,342 R 07/26/1957 -- 24,000 3,208 D 46-16-104B 07/27/1957
-- -- 24,000 3,208
-- R
3
07/26/1957 25,000 3,342 2.9 x 10⁻⁴ D 46-16-130C 07/27/1957 -- -- 24,000 3,208 2.5 x 10⁻⁴ R 3
46-16-201D 07/26/1957 265-364* 1,875 37,000 4,646 -- R 3 46-16-101E 08/18/1957 230-405* 1,200 12,000 1,604 -- R 3
08/17/1957 13,000 1,738 2.5 x 10⁻⁴ D
Winkler
46-16-120F 08/18/1957
274-700* -- 13,000 1,738 2.4 x 10⁻⁴ R
3
NOTES: * = Open hole - Well numbers used in previous reports and subsequently renumbered: A. 29-35-106, B. D-291, C. D-293, E. D-299, F. D-279. - Types of tests: D = Drawdown, M = Average Value, R = Recovery, SD = Step Drawdown. - Sources of data: 1. Dutton and Simpkins, 1986; 2. Fink, 1963; 3. Garza and Wesselman, 1959; 4. Rayner, 1963; 5. Robotham et al., 1985; 6.
Shamburger, 1967; 7. Smith, 1973; 8. TWDB Central Records; 9. White, 1968. gpm = gallons per minute bgs = below ground surface gpd/ft = gallons per day per foot

2
0
500
1,000
1,500
2,000
2,500
3,000
And
rew
s
Arm
stro
ng
Bor
den
Bris
coe
Cra
ne
Cro
sby
Daw
son
Dea
f Sm
ith
Dic
kens
Ect
or
Floy
d
Gai
nes
Gar
za
Har
tley
How
ard
Mid
land
Mitc
hell
Moo
re
Mot
ley
Nol
an
Old
ham
Pot
ter
Ran
dall
Rea
gan
Ree
ves
Scu
rry
Sw
ishe
r
Terr
y
Upt
on
War
d
Win
kler
County
Wel
l Yie
ld (g
pm)
Mean well yield
Range of well yields
Figure 5-6. Range of well yields in the Dockum aquifer by county.

34
Table 5-2. Summary of Specific Capacities of Wells in the Dockum Aquifer (from TWDB Reports).
Specific Capacity (gpm/ft)
County Maximum Minimum Mean Number of
Records Andrews 0.76 0.76 0.76 1
Armstrong 2.8 0.60 1.7 2 Borden 2.6 0.203 0.82 7 Crosby 2.3 1.8 2.0 2
Deaf Smith 12.4 0.02 8 3 Dickens 7.0 1.3 4.2 4 Gaines 0.579 0.442 0.511 2 Garza 0.19 0.055 0.14 3 Martin 0.42 0.42 0.42 1
Mitchell 3.6 0.30 1.2 14 Moore 11 7.7 9.5 2 Motley 8.2 1.8 5.5 3 Nolan 2.0 0.38 1.0 6
Oldham 3.5 0.3 2 7 Potter 0.78 0.78 0.78 1
Randall 9.00 4.32 6.66 2 Reeves 37 13 25 2 Scurry 6.1 0.33 2.8 18
Swisher 1.93 1.93 1.93 1 Upton 0.307 0.307 0.307 1
Winkler 17.1 .13 5.3 4 NOTE: gpm/ft = gallons per minute per foot
approximately 1,500 ft2/d. The Winkler County pumping test was performed on the City of Kermit’s municipal wells, which are completed in the Santa Rosa Formation that was described by Garza and Wesselman (1959) as a massive sandstone unit of limited areal extent. Storativity values ranged from 4.4 × 10⁻⁵ in Mitchell County to 2.9 × 10⁻⁴ in Winkler County (Table 5-1). The mean storativity from all aquifer tests conducted in the study area was 1.9 × 10⁻⁴. The low storativities suggest that the Dockum aquifer is confined to partly confined in the test areas. The above parameters suggest that the aquifer may not be able to provide large quantities of water.
5.3 Chemical Quality
Groundwater in the Dockum aquifer is generally of poor quality. Over most of the study area, it is characterized by decreasing quality with depth, mixed types of water, high concentrations of total dissolved solids (TDS) and other constituents that exceed secondary drinking water standards, and high sodium levels that may be damaging to irrigated land.

35
The chemical quality of water in the Dockum aquifer ranges from fresh (TDS of less than 1,000 mg/l) in outcrop areas that are present around the fringes of the aquifer to brine (TDS greater than 10,000 mg/l) in the confined parts of the aquifer (Figure 5-7). TDS concentrations also tend to increase with depth and range from 5,000 mg/l to more than 60,000 mg/l (Figure 5-8 and Appendix IV) in the deepest parts of the aquifer. Groundwater in the Dockum aquifer is also typically hard with hardness ranging from less than 25 mg/l in Swisher County to more than 3,600 mg/l in Reagan County (Figure 5-9 and Appendix VII). The mean hardness value for the entire study area is approximately 470 mg/l.
In the northern and northeastern counties of the study area, the groundwater is composed of mixed cations and HCO3
- type water (Figure 5-10a and 5-10b). In the central part of the study area (Andrews, Dawson, Gaines, Hockley, and Terry counties), the groundwater is dominated by Na+ + K+ and Cl- + SO4
2+ (Figure 5-10). The eastern outcrop area consists of Ca2+ + Mg2+ and mixed-anion-type water (Figure 5-10d). The seven groundwater samples that we collected from an area near the Edwards-Trinity (Plateau) aquifer in 1995 and 1996 do not show a characteristic signature (Figure 5-10e). Where overlain by the Cenozoic Pecos Alluvium, groundwater in the Dockum aquifer is characterized by Ca2+ + Mg2+ and SO4
2- + Cl- rich waters (Figure 5-10f). A more detailed listing of the major cations and anions detected in the groundwater samples is available in Appendices V and VI, respectively.
One of the primary contaminants of concern in the study area is nitrate. The maximum contaminant level (MCL) for nitrate (measured as nitrogen) is 10 mg/l. Groundwater samples obtained from the study area between 1981 and 1996 indicate that nitrate concentrations were higher than their MCL in counties where the Dockum aquifer is either exposed at the surface or is in hydrologic communication with an overlying aquifer such as the Cenozoic Pecos Alluvium or the Edwards-Trinity (Plateau) aquifer. In these areas, the likely sources of nitrate are livestock waste, agricultural fertilizers, and old cesspools.
The radiological constituents for which we tested groundwater samples included gross alpha, gross beta, radium-226, and radium-228 (Table 5-3). The MCL established by the EPA for gross-alpha particle activity limit is 15 picoCuries per liter (piC/l). The MCL for combined radium-226 and radium-228 is 5 piC/l. Some areas of the Dockum aquifer contained radium-226 and radium-228 in concentrations greater than 5 piC/l (Table 5-4). The occurrence of uranium minerals in the Dockum Group has been recognized for years (McGowen and others, 1977) and is the source of the high concentrations of radium-226 and radium-228 detected in groundwater samples. Radium-226 and radium-228 are daughter products of the various uranium decay series.
Other constituents that we tested for in the groundwater samples included antimony, arsenic, barium, beryllium, cadmium, chromium, lead, mercury, nickel, selenium, and thallium. The concentrations of arsenic, barium, chromium, and nickel were below their respective MCLs in all of the samples that were analyzed. However, the detection limit for some of the analyses was higher than the MCL. Therefore, it is possible that some elements could have been present at concentrations above their MCLs but were not detected because of the elevated detection limits. The concentrations of antimony, beryllium, cadmium, lead, mercury, selenium, and thallium exceeded their respective MCLs in several counties (Table 5-4).

36
Figure 5-7. Distribution of total dissolved solids (TDS) in the Dockum aquifer, 1981 through 1996 (TWDB, 1997)
>10,000 mg/l
TDS sample collected inaccordance with proceduresin TWDB UM-51 (1991)
TDS sample not collectedin accordance with proceduresin TWDB UM-51 (1991)
o
+
o
o
o
oo
o o
oo
o
o
oo
o ooo
oo
oo
ooo
ooo
o
o
o
o
o
ooo
o
o
oo
o
o
o
oooo
o
ooo
o
o
o
oo oo
o
o
o
oo
o oo o
o
o
o
ooo
o oo
oo
ooo
o
o
o
o
o
o o
oo
oo
o
o
o
oo
o
oo
o
o
o
o
o
o
o
ooo
oooo o
ooo
oo
oo
o
o
o oo
o
o
ooo
o
oo
o
o
o
o
ooo
o
o
o
o o
o
o
oo
o
o
o
o
o
o
oo
oo
o
ooo
oo o
o
o
o o
ooo oo
o
o
o
oo
o
o
ooo
o
oo
oo
ooo
o
o
o
o
oo o o
oo ooooooo
oo
oo
oo
ooooooooooooo
o
o
o
o
o
o
o
o
o
o
o
oo
o o
o
o
oo o
o
o
oo
o
oo
o
oo o
ooo
o
oo
o
oooooo
o
o
o
oo
o
o
o
o
o
o
o
o o
o
o
o
o
o
o
o
o
o
o
o
oo
oo
o
oooooooo
o
o
o
oo
+ +
++++++
+
+
++
+++
+
+++
+
+
+
+ +
+ +
+
+ ++++
+
++
+++
++++
+
+++
++++
+ +
+
+
+ +
+++
+
+
+
+
+ +
+++
+++
++++
++ +
++
++
+
++
+
+
+ +
+
+
+
++
++
+
+ + +
+
++
++
+
++
++
+
+
++
++
+ +
+
++ +
+
+
+
++++
++
++
+++
++
+
+
+
+ +
+
++
+
+
+
++
+
+
++
++
++ + ++
+
++
++
+ +
+
++
+++
+
+
+
++
+
+
+
+
+
+
+
++
+
+++
+
+
++
+ +
+
+
+
+
+
+
+
++
+
+
+
+
+
+
++
+
+
+
++
+
++
+
+
+
+
++
+
+
+
+
++ +
++
++
+
+
+
+
+
+
+
+
++
++
+
+
+ ++
+
+
+++
+
+
+
5,000 to 10,000 mg/l TDS
Limits of the study area
>10,000 mg/l TDS
<5,000 mg/l TDS

Figure 5-8. Concentrations of total dissolved solids (TDS) detected in the Dockum aquifer water samples 1981 through 1996.
0
10,000
20,000
30,000
40,000
50,000
60,000
70,000
80,000
And
rew
s
Arm
stro
ng
Bor
den
Bris
coe
Cra
ne
Cro
cket
t
Cro
sby
Daw
son
Dea
f Sm
ith
Dic
kens
Ect
or
Fish
er
Floy
d
Gai
nes
Gar
za
Gla
ssco
ck
Har
tley
Hoc
kley
How
ard
Ken
t
Lovi
ng
Mar
tin
Mitc
hell
Moo
re
Mot
ley
Nol
an
Old
ham
Pot
ter
Ran
dall
Ree
ves
Scu
rry
Ste
rling
Sw
ishe
r
Terr
y
War
d
Win
kler
Yoa
kum
County
Tota
l Dis
solv
ed S
olid
s (m
g/l)
Mean TDS
Range of TDS concentrations

Figure 5-9. Range of hardness in groundwater samples obtained from the Dockum aquifer, 1981through1996.
0
1,000
2,000
3,000
4,000
5,000
6,000
And
rew
s
Arm
stro
ng
Bor
den
Bris
coe
Cra
ne
Cro
cket
t
Cro
sby
Daw
son
Dea
f Sm
ith
Dic
kens
Ect
or
Fish
er
Floy
d
Gai
nes
Gar
za
Gla
ssco
ck
Har
tley
Hoc
kley
How
ard
Irion
Ken
t
Lovi
ng
Lubb
ock
Mar
tin
Mitc
hell
Moo
re
Mot
ley
Nol
an
Old
ham
Pot
ter
Ran
dall
Rea
gan
Ree
ves
Scu
rry
Ste
rling
Sw
ishe
r
Terr
y
Upt
on
War
d
Win
kler
Yoa
kum
County
Har
dnes
s (C
aCO
3), m
g/l
Mean hardness
Range of hardness

39
Figure 5-10. Trilinear diagrams for the northern (a, b) and central (c, d) parts of the study area, and for areas overlying the Edwards Plateau region (e) and Pecos River valley (f).
c.
e. f.
d.
b.a.
Ca Cl
Mg SO4

40
Table 5-3. Gross Alpha, Gross Beta, and Radium Isotope concentrations detected in groundwater samples obtained from the Dockum aquifer, 1981 through 1996.
Gross Alpha pCi/l Gross Beta pCi/l Radium-226 pCi/l Radium-228 pCi/lCounty No. of
samples Range No. of samples Range No. of
samples Range No. of samples Range
Andrews 9 <3 - 19 9 <4 - 16 9 0.2 - 6.1 9 <0.1 - 7Armstrong 7 <2 - 24 7 1 - 13 7 0.5 - 0.6 7 1 - 6 Borden 9 3 - <72 9 4.5 - 60 9 <0.2 - 3.1 9 <1 - 25 Briscoe 9 5.5 - 21 9 <3 -13 9 0.2 - 3.1 9 <1 - 4 Crane 3 9 - <13 3 <7 - <11 3 <0.6 - 6.8 3 1 - 5 Crockett 3 7 - 19 3 10 - 16 3 1.4 - 4.9 3 2 - 4 Crosby 2 9.1 - 12 2 9 - 9.3 2 <0.6 - 6.6 2 1 - 13 Dawson 5 7.3 - 29 5 <4 - 36 5 1.1 - 3.9 5 1.5 - 19Deaf Smith 12 <5 - 519 13 <3 - 183 13 <0.2 - 1.4 13 <1 - 4 Dickens 9 <2 - 28 10 4.7 - 12 10 0.2 - 0.6 10 <1 - 8 Ector 3 <6 - 23 3 <4 - 11 1 <0.6 1 3 Fisher 5 3.3 - 20 5 <4 - 18 2 0.2 - 0.9 2 <1 Floyd 7 <3 - 7.2 7 5 - 10 7 <0.2 - 0.5 7 <1 - 1.6Gaines 3 <13 - 81 3 <9 - 21 3 <0.6 -
11 93 <2 - <3
Garza 9 2.9 - 244 9 <4 - 193 9 1.4 - 59 9 <1 - 47 Glasscock 1 90 1 40 1 <0.6 1 3 Hartley 5 2 - 11 5 <3 - 8 5 <0.6 5 <1 - 5 Hockley 1 <197 1 <57 1 17.6 1 52 Howard 10 3 - 30 10 <3 -
3010 <0.6 - 3.4 10 <1 - 5
Irion 2 <4 - 20 2 <4 - 31 2 2 - 2.4 2 3.2 - 11Kent 4 3.5 -35 4 <4 - 23 4 <0.6 - 3.5 4 1.8 - 3 Loving 3 3 - 7 3 <3 - 5.4 3 0.3 - 0.7 3 1.1 - <2Mitchell 23 <2.2 - 50 23 <4 - 64 22 <0.2 - 8.4 22 <1 - 3.3Motley 10 <2 - 25 10 4 - 15 10 0.4 - 2.7 10 <1 - 3 Nolan 16 <2 - 27 16 <4 - 34 6 0.3 - 3 6 <1 Oldham 17 4 - 42 17 <3 - <30 17 <0.2 -
7 11 1117 <1 - 6
Potter 12 <4 -47 12 <3 - <12 12 <0.2 - 3.2 12 <1 - 4 Randall 4 10 - 42 4 7 - 30 3 <0.6 - 2 3 <3 - 5 Reagan 2 10 - 29 2 21 - 43 2 0.7 - 4 2 <1 - 8.2Reeves 5 4.8 - 13 5 <5 - 13 3 <0.2 3 <1 Scurry 28 3.6 - 43 28 <4 - 30 27 <0.2 - 7.3 27 <1 - 3.6Sterling 5 2.4 - 4.5 4 <4 4 0.4 - 8 3 <1 - 3 Swisher 3 <2 - <3 3 <3 - 10 3 <0.6 3 <2 - 5 Terry 1 <33 1 <23 1 4.6 1 9 Upton 2 14 - 25 2 24 - 28 2 0.2 - 3.3 2 <1 - 4.5Ward 8 <2 - 13 8 4 - 13 6 <0.2 6 <1 - 1.5Winkler 6 4 - 5.6 7 0.6 - 10 4 <0.2 - 5 <0.1 - 2
NOTE: pCi/l = pico Curies per liter

41
Table 5-4. Elements detected at concentrations above their maximum contaminant levels (MCLs) in groundwater samples collected from the Dockum aquifer, 1981 through 1996.
Concentration in micrograms per liter (mg/l) Antimony Beryllium Cadmium Lead Mercury Selenium Thallium
County 0.006 0.004 0.005 0.0015 0.002 0.05 0.002 Andrews --- --- --- --- --- 0.0588 --- Borden --- --- <0.01 <0.05 --- 0.0822 <0.005 Crane --- --- --- <0.05 0.0113 0.0565 <0.004 Crosby --- --- <0.01 --- --- --- --- Dawson <0.01 <0.005 <0.01 <0.05 --- 0.0992 <0.01 Deaf Smith
--- --- --- --- 0.0028 --- ---
Dickens --- --- <0.01 <0.05 --- --- --- Fisher --- --- <0.01 <0.05 --- 0.0507 --- Gaines --- --- --- --- --- 0.1121 <0.005 Garza <0.05 <12.5 0.025 <0.05 --- 0.093.7 <0.05 Glasscock <0.01 <0.005 --- --- --- 0.2406 <0.01 Hockley <0.05 --- 0.025 <0.05 --- --- <0.05 Howard --- --- <0.01 <0.05 --- 0.0833 --- Kent --- --- <0.01 <0.05 --- --- --- Loving --- --- <0.01 <0.05 --- 0.050 --- Mitchell --- --- <0.01 <0.05 --- 0.1031 --- Nolan --- --- <0.01 <0.05 --- --- --- Potter --- --- <0.01 <0.05 --- --- --- Randall --- --- --- <0.05 --- 0.0647 --- Reeves --- --- <0.01 <0.05 --- --- --- Scurry --- --- <0.01 <0.05 --- --- --- Sterling --- --- <0.01 <0.05 --- --- --- Terry <0.01 <0.005 <0.005 --- --- 0.1136 <0.01 Winkler --- --- <0.01 <0.05 --- --- --- Yoakum --- --- --- --- --- 4.9 ---
NOTES: The concentrations listed above are the highest concentrations detected in samples collected in each county. Only detected concentrations higher than the MCLs are listed in the table. The detection limit for some samples was greater than the MCL, and these results are also included in the table. Other elements that were analyzed but were not detected above their MCLs are arsenic, barium, chromium, and nickel. The MCL for lead is the action level as outlined in TAC 290.120. If a county is not listed above, then all constituents tested for in the groundwater samples obtained from that county were below their MCLs.

Figure 5-11. Range of sulfate ion concentrations in groundwater samples obtained from the Dockum aquifer, 1981through 1996.
0
1,000
2,000
3,000
4,000
5,000
6,000
And
rew
s
Arm
stro
ng
Bor
den
Bris
coe
Cra
ne
Cro
cket
t
Cro
sby
Daw
son
Dea
f Sm
ith
Dic
kens
Ect
or
Fish
er
Floy
d
Gai
nes
Gar
za
Gla
ssco
ck
Har
tley
Hoc
kley
How
ard
Ken
t
Lovi
ng
Mar
tin
Mitc
hell
Moo
re
Mot
ley
Nol
an
Old
ham
Pot
ter
Ran
dall
Rea
gan
Ree
ves
Scu
rry
Ste
rling
Sw
ishe
r
Terr
y
Upt
on
War
d
Win
kler
Yoa
kum
County
Sul
fate
Ion
Con
cent
ratio
n (m
g/l)
Mean sulfate ion concentration
Range of sulfate ion concentrations

43
We also analyzed the groundwater samples collected from the study area for TDS, fluoride, chloride, and sulfate. Groundwater in most counties contained TDS at concentrations higher than the secondary standard of 1,000 mg/l (Figure 5-8). TDS concentrations were below the secondary standard in samples collected from Armstrong, Floyd, Hartley, Moore, Motley, and Sterling counties. Most counties had at least one groundwater sample that contained sulfate (Figure 5-11) or chloride at concentrations higher than the secondary standard of 250 mg/l. These two constituents were the dominant anions over much of the study area.
Fluoride concentrations were higher than the secondary standard of 4.0 mg/l in only a few samples that were obtained from Briscoe, Dawson, Deaf Smith, Ector, and Scurry counties (Appendix V). The fluoride in the groundwater is derived from the fluorite grains that occur as heavy minerals in the Dockum sediments.
Sodium in groundwater is a constituent that has neither an MCL nor a secondary standard but that is still a concern where the water is used for irrigation purposes. If sodium exceeds 60 percent of the total cations in water, the water may be unsuitable for irrigation. To determine the hazard of sodium in groundwater, we calculated sodium adsorption ratio (SAR), residual sodium carbonate (RSC) and percent-sodium. In many counties the percent-sodium values were above 60 percent (Figure 5-12).
The potential effect of sodium on irrigated land can also be determined by SAR proposed in 1954 by the United States Salinity Laboratory (USSL, 1954). This indicator is calculated from
2MgCa
NaSAR+
= ,
where sodium, calcium, and magnesium concentrations are expressed in milliequivalents per liter (meq/l). SAR values lower than 10 suggest that sodium does not pose a threat to the irrigated land, whereas values higher than 18 typically result in excess sodium in the soils. In the central part of the Dockum aquifer, the SAR values of groundwater samples were generally higher than 18 (Figure 5-13).
Another indicator of sodium hazard is RSC. As calcium and magnesium precipitate out of the groundwater in the unsaturated zone and onto soils, the relative proportion of sodium in irrigation water increases. RSC is calculated by
RSC = (CO3 + HCO3) – (Ca + Mg)
or
RSC = 0.02 × (total alkalinity – hardness)
where carbonate, bicarbonate, calcium, and magnesium concentrations are expressed in meq/l. Water with RSC values greater than 2.5 meq/l is not suitable for irrigation (Figure 5-14).

1
Figure 5-12. Percent sodium in groundwater samples obtained from the Dockum aquifer, 1981 through 1996.
0
20
40
60
80
100A
ndre
ws
Arm
stro
ng
Bor
den
Bris
coe
Cra
ne
Cro
cket
t
Cro
sby
Daw
son
Dea
f Sm
ith
Dic
kens
Ect
or
Fish
er
Floy
d
Gai
nes
Gar
za
Gla
ssco
ck
Har
tley
Hoc
kley
How
ard
Irion
Ken
t
Lovi
ng
Lubb
ock
Mar
tin
Mitc
hell
Moo
re
Mot
ley
Nol
an
Old
ham
Pot
ter
Ran
dall
Rea
gan
Ree
ves
Scu
rry
Ste
rling
Sw
ishe
r
Terr
y
War
d
Win
kler
Yoa
kum
County
Per
cent
Sod
ium
Mean percent sodium
Range of percent sodium

2
Figure 5-13. Range of Sodium Adsorption Ratio (SAR) values in groundwater samples from the Dockum aquifer, 1981 through 1996.
0
50
100
150
200
250
300A
ndre
ws
Arm
stro
ng
Bor
den
Bris
coe
Cra
ne
Cro
cket
t
Cro
sby
Daw
son
Dea
f Sm
ith
Dic
kens
Ect
or
Fish
er
Floy
d
Gai
nes
Gar
za
Gla
ssco
ck
Har
tley
Hoc
kley
How
ard
Irion
Ken
t
Lovi
ng
Lubb
ock
Mar
tin
Mitc
hell
Moo
re
Mot
ley
Nol
an
Old
ham
Pot
ter
Ran
dall
Rea
gan
Ree
ves
Scu
rry
Ste
rling
Sw
ishe
r
Terr
y
Upt
on
War
d
Win
kler
Yoa
kum
County
Sod
ium
Ads
orpt
ion
Rat
io
Mean SAR
Range of SAR values

3
Figure 5-14. Residual Sodium Carbonate (RSC) values in groundwater samples obtained from the Dockum aquifer, 1981 through 1996.
0
2
4
6
8
10
12
14
16
18A
ndre
ws
Arm
stro
ng
Bor
den
Bris
coe
Cra
ne
Cro
cket
t
Cro
sby
Daw
son
Dea
f Sm
ith
Dic
kens
Ect
or
Fish
er
Floy
d
Gai
nes
Gar
za
Gla
ssco
ck
Har
tley
Hoc
kley
How
ard
Irion
Ken
t
Lovi
ng
Lubb
ock
Mar
tin
Mitc
hell
Moo
re
Mot
ley
Nol
an
Old
ham
Pot
ter
Ran
dall
Rea
gan
Ree
ves
Scu
rry
Ste
rling
Sw
ishe
r
Terr
y
Upt
on
War
d
Win
kler
Yoa
kum
County
Res
idua
l Sod
ium
Car
bona
te (m
e/l)
Mean RSC
Range of RSC l

47
Figure 5-15. Salinity hazard for areas overlying the Dockum aquifer.
o - RSC, SAR and Percent Sodium values exceed the maximum limit
+ - RSC, SAR and Percent Sodium values less than the maximum limit
(See text for an explanation of the maximumlimits for the three parameters)
Mile
60300
N
Legend
Salinity hazardarea
Study area limit.
+
+
+
++
+
+
+
+
+
+
+
+
+
+
+
+ +
+
+
+
+
+
+
+
+
+
+ ++
++
++
+
+
+
++
++
+
+
+
+
+
+
+
+
+
++
+
+
+
+
++
+
+ +
+
+ +
++
+
+++
+++
+
+ +
+
+ ++
+
+ +
+
+
+
++
+
++
+
+
+
+
+
+
+ +
+
+++
+
+
+
+
++
+
+
+
+
+
+
+
+
+
+
+
+
+
++
+
+
+
+++
++++
+
+
+
+
+
+
+
++
+
+
+
+
++
+ +
++
+ +
+
++
+
++
++ +
++
+
++
+
+
+
+
+
o
oo
oo
o
o
o
o
o
o
o
oo
oo
o
o
o
oo
o
o
o
o o ooooo o
o
o
o
o
oo
o
o
o
ooo ooo
o
o
oo
o
oo
oo
o
o
o
o
o
ooooo
oo
o
oo
o
o
o
o
oo
oo
o
o
o
o
o
o
o
++++
+
ooo
+
++++
++++++++++++++++
oo
++
+
++
+

48
Except for parts of the study area that overlie the aquifer where the Dockum sediments outcrop, much of the study area is susceptible to salinity hazard (Figure 5-15). More detailed information about percent sodium, SAR, and RSC values that were calculated for the study area is presented in Appendix VII.
Only three groundwater samples from the study area had boron concentrations of more than 3 mg/l (Appendix VII). The highest concentration (55.5 mg/l) was detected in a sample from a deep well in Yoakum County that is probably influenced by brine from underlying Permian rocks. Boron, an element that is essential for healthy plant growth, can be toxic to crops at high concentrations. The maximum range of boron concentration that crops can typically tolerate is between 0.67 and 3 mg/l (Scofield, 1936).
5.4 Discharge
Discharge of groundwater from the Dockum aquifer occurs due to pumping, small springs that contribute to stream baseflow in the outcrop (Brune, 1981), evapotranspiration, and cross-formational flow. Most current discharge occurs from the pumping of wells installed in the aquifer.
In the central part of the basin, wells are typically completed in the basal sandstone-dominated zone. However, many wells in the High Plains are completed in both the Dockum and in the overlying Ogallala aquifer. Such dual completion wells can be found in Armstrong, Briscoe, Carson, Crosby, Dallam, Deaf Smith, Floyd, Garza, Hale, Hartley, Hutchinson, Lamb, Moore, Oldham, Potter, Randall, Sherman, and Swisher counties. The primary reason for completing wells in both the Dockum and Ogallala aquifers is to increase well yield. Wells completed in the Edwards-Trinity (Plateau) and Dockum aquifers are present in Bailey, Ector, Hale, Irion, Reagan, Sterling, and Upton counties and in the Cretaceous outlier in Nolan County. In outcrop areas along the Canadian River (primarily in Oldham and Potter counties), wells are completed in both the Dockum and older Permian aquifers.
Irrigation and public-supply uses are limited to areas of the Dockum aquifer in which the water quality is acceptable (TDS generally less than 1,000 mg/l), depth to water is shallow, and a sufficient thickness of sandstone exists to make the aquifer productive. Past and present municipal users of Dockum aquifer water include the cities of Barstow, Canyon, Colorado City, Dickens, Happy, Hereford, Hermleigh, Kermit, Loraine, Pecos, and Snyder. The Colorado River Municipal Water Authority also uses water from this aquifer.
Figure 5-16 illustrates historical water use from the Dockum aquifer between 1994 and 2000. The estimated total pumpage increased from 40,035 acre-feet in 1994 to 50,682 acre-feet in 2000. Irrigation accounted for 58 percent of total water use in 1994 and 66 percent in 2000. While irrigation use increased during the 1994 to 2000 time period, municipal, manufacturing, mining, and livestock water use remained relatively constant (Figure 5-16).

Figure 5-16. Historical water use from the Dockum aquifer, 1994 through 2000.
0
5,000
10,000
15,000
20,000
25,000
30,000
35,000
40,000
1994 1995 1996 1997 1998 1999 2000
Year
Gro
undw
ater
Use
(acr
e-fe
et)
MunicipalManufacturingMiningIrrigationLivestock

50
6.0 Estimate of Groundwater in the Dockum Aquifer
The amount of water in an aquifer that is available for withdrawal can generally be determined by multiplying the saturated volume of the aquifer by its specific yield (the fraction of water that will drain from a saturated porous medium under the influence of gravity). However, estimating this volume for the Dockum aquifer is difficult. Interbedded mudstones, sandstones and other rock types; confined to partly confined conditions; and the very low recharge rates combine to make the aquifer a complex hydrologic system. We estimated the amount of water of different chemical quality (TDS) in the aquifer on a county-by-county basis using the procedure and assumptions outlined below.
For the purpose of representing the saturated volume of the aquifer, we selected the “Best Sandstone” unit (Figure 4-2 to 4-10) because it is the most productive and widely used portion of the aquifer. To estimate the volume of water of different TDS concentrations (<5,000 mg/l, 5,000 to 10,000 mg/l, and >10,000 mg/l) within the Dockum aquifer, we used the TDS map (Figure 5-7) to measure aquifer areas within a county ( Appendix VIII) and multiplied these areas by the average thickness of the Best Sandstone unit (125 feet). We determined the average thickness of the Best Sandstone unit from available geologic cross-sections (Figure 4-2 to 4-10). For specific yield of the Best Sandstone unit, we chose a value of 0.065 which is a weighted average derived by adding the minimum specific yields of fine-grained sandstone and silt (0.1 and 0.03, respectively; Johnson, 1967 as cited in Fetter, 1980) in a sandstone unit that is composed of 35 percent sand and 65 percent silt. The aquifer parameters used here are generalized and can be improved by using site-specific aquifer properties where available to produce more accurate volume estimates.
A total of 185 million acre-feet of water is present in the Dockum aquifer in Texas (Table 5-5). The total volume of water with TDS less than 5,000 mg/l is approximately 109 million acre-feet and that with TDS between 5,000 and 10,000 mg/l is about 27 million acre-feet. In parts of the aquifer where the water has very high TDS (>10,000 mg/l), we estimate the volume of water at approximately 49 million acre-feet.
The largest volume of water (>6 million acre-feet) of all TDS concentrations is present in Andrews, Dallam, Deaf Smith, Gaines, Hartley and Oldham counties. With the exception of Hartley County, these same counties also have the largest volume of water with TDS concentrations less than 5,000 mg/l. Bailey, Cochran, Hockley, Lamb, Lubbock, Lynn, and Terry counties contain the largest volume of water (>3,000 acre-feet) with TDS concentrations greater than 10,000 mg/l.
It must be reiterated that not all of the water estimated here is available for withdrawal. Aquifer properties determined during this study (Chapter 5.2) clearly suggest that well yields and transmissivities are low over much of the aquifer, and the aquifer is generally not productive. Furthermore, the chemical quality of water in the aquifer precludes its use for many purposes. Because the confined parts of the aquifer receive little recharge, water withdrawn from these areas will essentially mine or deplete the aquifer.
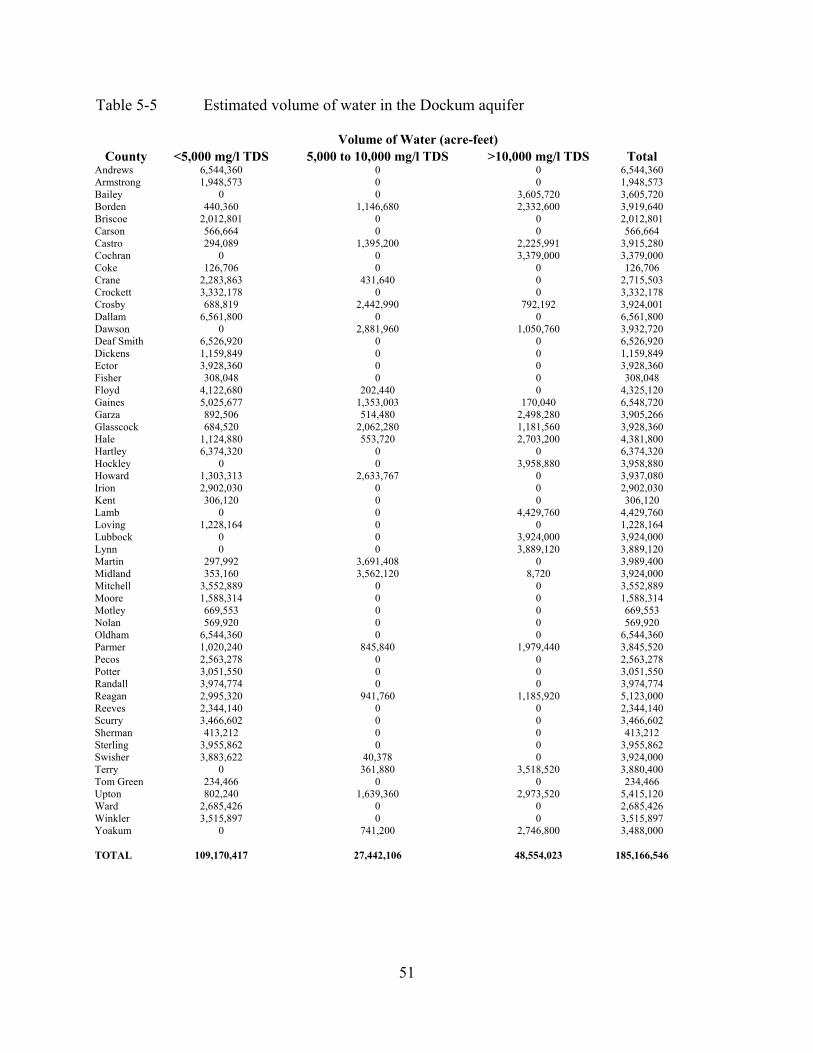
51
Table 5-5 Estimated volume of water in the Dockum aquifer
Volume of Water (acre-feet) County <5,000 mg/l TDS 5,000 to 10,000 mg/l TDS >10,000 mg/l TDS Total
Andrews 6,544,360 0 0 6,544,360 Armstrong 1,948,573 0 0 1,948,573 Bailey 0 0 3,605,720 3,605,720 Borden 440,360 1,146,680 2,332,600 3,919,640 Briscoe 2,012,801 0 0 2,012,801 Carson 566,664 0 0 566,664 Castro 294,089 1,395,200 2,225,991 3,915,280 Cochran 0 0 3,379,000 3,379,000 Coke 126,706 0 0 126,706 Crane 2,283,863 431,640 0 2,715,503 Crockett 3,332,178 0 0 3,332,178 Crosby 688,819 2,442,990 792,192 3,924,001 Dallam 6,561,800 0 0 6,561,800 Dawson 0 2,881,960 1,050,760 3,932,720 Deaf Smith 6,526,920 0 0 6,526,920 Dickens 1,159,849 0 0 1,159,849 Ector 3,928,360 0 0 3,928,360 Fisher 308,048 0 0 308,048 Floyd 4,122,680 202,440 0 4,325,120 Gaines 5,025,677 1,353,003 170,040 6,548,720 Garza 892,506 514,480 2,498,280 3,905,266 Glasscock 684,520 2,062,280 1,181,560 3,928,360 Hale 1,124,880 553,720 2,703,200 4,381,800 Hartley 6,374,320 0 0 6,374,320 Hockley 0 0 3,958,880 3,958,880 Howard 1,303,313 2,633,767 0 3,937,080 Irion 2,902,030 0 0 2,902,030 Kent 306,120 0 0 306,120 Lamb 0 0 4,429,760 4,429,760 Loving 1,228,164 0 0 1,228,164 Lubbock 0 0 3,924,000 3,924,000 Lynn 0 0 3,889,120 3,889,120 Martin 297,992 3,691,408 0 3,989,400 Midland 353,160 3,562,120 8,720 3,924,000 Mitchell 3,552,889 0 0 3,552,889 Moore 1,588,314 0 0 1,588,314 Motley 669,553 0 0 669,553 Nolan 569,920 0 0 569,920 Oldham 6,544,360 0 0 6,544,360 Parmer 1,020,240 845,840 1,979,440 3,845,520 Pecos 2,563,278 0 0 2,563,278 Potter 3,051,550 0 0 3,051,550 Randall 3,974,774 0 0 3,974,774 Reagan 2,995,320 941,760 1,185,920 5,123,000 Reeves 2,344,140 0 0 2,344,140 Scurry 3,466,602 0 0 3,466,602 Sherman 413,212 0 0 413,212 Sterling 3,955,862 0 0 3,955,862 Swisher 3,883,622 40,378 0 3,924,000 Terry 0 361,880 3,518,520 3,880,400 Tom Green 234,466 0 0 234,466 Upton 802,240 1,639,360 2,973,520 5,415,120 Ward 2,685,426 0 0 2,685,426 Winkler 3,515,897 0 0 3,515,897 Yoakum 0 741,200 2,746,800 3,488,000 TOTAL 109,170,417 27,442,106 48,554,023 185,166,546

52
7.0 Summary and Conclusions
Although not widely used at present, the Upper Triassic Dockum aquifer in the Texas Panhandle and West Texas could become an important source of groundwater in the future, especially in areas where there is high demand from the Ogallala and Edwards-Trinity (Plateau) aquifers. This report documents a comprehensive regional hydrogeologic study of the Dockum aquifer.
Recoverable groundwater in the Dockum aquifer occurs within the many sandstone and conglomerate beds that are present throughout the 2,000-foot-thick sedimentary sequence, but mainly in the lower sections of the sequence (Best Sandstone unit). The hydrogeologic properties of the aquifer vary widely. Well yields range from 0.5 gpm in Mitchell County to 2,500 gpm in Winkler County, and specific capacities from 0.19 gpm/ft (Garza County) to 37 gpm/ft (Reeves County). Transmissivity values range from about 48 ft2/day in Upton County to 4,600 ft2/day in Winkler County while storage coefficients range from 4.4 x 10⁻⁵ in Mitchell County to 2.9 x 10⁻⁴ in Winkler County.
Where exposed at the land surface, the Dockum aquifer is recharged by precipitation, and the confined portions by upward leakage from the underlying Permian rocks and downward leakage from the overlying Ogallala, Edwards-Trinity (Plateau) and Cenozoic Pecos Alluvium aquifers. We estimate that annual recharge to the aquifer is approximately 31,000 acre-feet. Discharge from the aquifer occurs from pumping wells and small springs, and through evapotranspiration and cross-formational flow.
Regional groundwater flow maps suggest that flow is generally to the east. Hydrographs of wells installed in the aquifer show that water levels have fluctuated variably over time in different parts of the aquifer. For example, in the northern and southern parts of the aquifer, water levels have both declined (by more than 80 feet) in some wells and risen in others over the past 20 to 30 years, while in the central part of the aquifer, they have generally risen over the same time period.
Groundwater in the Dockum aquifer is generally of poor quality. Water quality ranges from fresh in the outcrop areas, in the east, to brine in the confined western part of the aquifer. It also tends to deteriorate with depth, and TDS concentrations can exceed 60,000 mg/l in the deepest parts of the aquifer. Dockum aquifer water is also typically hard with a mean hardness of about 470 mg/l. A mixed-cation and HCO3
- type water characterizes groundwater in the northern and northeastern counties of the study area whereas in the counties in the central area the groundwater typically contains Na+, K+, Cl- and SO4
2- in the west and Ca2+, Mg2+ and mixed-anions in the east. Dockum groundwater from near the Edwards-Trinity (Plateau) aquifer is not characterized by a specific suite of chemical constituents, but where overlain by the Cenozoic Pecos Alluvium aquifer, contains Ca+2, Mg+2, SO4
2- and Cl- rich water.
Radium-226 and radium-228 were detected at concentrations greater than 5 pCi/l in samples collected from widespread areas of the aquifer. The source of the radionuclides in the groundwater is uranium that has long been known to be present in the Dockum sediments. Most counties in the study area also had at least one groundwater sample that contained sulfate or chloride at concentrations greater than the secondary standard of 250 mg/l. In contrast, fluoride

53
concentrations were higher than the secondary standard in only a few samples collected from Briscoe, Dawson, Deaf Smith, Ector, and Scurry counties.
Much of the area overlying the Dockum aquifer is susceptible to salinity problems originating from the high concentrations of sodium present in Dockum groundwater. This type of water is most prevalent in the confined portions of the aquifer, and salinity is less of a concern along the outcrop areas. High boron concentrations did not appear to be widespread, and only three samples contained boron at concentrations greater than 3 mg/l.
Estimating the total amount of usable groundwater in the Dockum aquifer is difficult because of the interbedded nature of the geologic units, the confined to partially confined conditions of the aquifer, and low recharge rates. We estimate that the total amount of water available in the entire Dockum aquifer in Texas is approximately 185 million acre-feet. Of this amount, approximately 109 million acre-feet contain TDS of less than 5,000 mg/l. However, not all of this water is readily available for withdrawal. In fact, the measured aquifer parameters suggest that the aquifer cannot provide large quantities of water. The confined parts of the aquifer receive little recharge, and any water withdrawn from these areas will essentially mine the aquifer.
8.0 Acknowledgements
We thank property owners in the study area for granting us access to their water wells to obtain water-level measurements, and water samples for chemical analysis. Field personnel of the TWDB’s Hydrologic Monitoring Section obtained the water levels and water samples reported in this study. Steve Hutton, Steve Gifford, Mark Hayes, Robert E. Mace, and Brent Christian assisted in preparing the illustrations for the report. The database was managed by John Derton, Frank Bilberry, and Paul McElhaney. Robert E. Mace, Bill Mullican, Richard Smith, and Shirley Wade reviewed the report and suggested changes that greatly improved its quality. Edward S. Angle edited and prepared the report for publication.

54
9.0 References
Adams, J. E., 1929, Triassic of West Texas: Bulletin of the American Association of Petroleum Geologists, v. 13, no. 8, p. 1045-1055.
Adkins, W. S., 1932, The Mesozoic systems in Texas: The University of Texas at Austin Bulletin 3232, p. 239-518.
Ashworth, J. B., 1986, Evaluation of the Santa Rosa aquifer in Glasscock County: Texas Water Development Board, Report LP-203, 26 p.
_______________________, 1990, Evaluation of groundwater resources in parts of Loving, Pecos, Reeves, Ward and Winkler counties, Texas: Texas Water Development Board, Report 317, 26 p.
Ashworth, J. B., and Christian, P. C., 1989, Evaluation of groundwater resources in parts of Midland, Reagan, and Upton Counties, Texas: Texas Water Development Board, Report 312, 52 p.
Ashworth, J.B., and Hopkins, J., 1995, Aquifers of Texas: Texas Water Development Board, Report 345, 69 p.
Bassett, R. L., Bentley, M. E., and Simpkins, W. W., 1981, Regional groundwater flow in the Panhandle of Texas—A conceptual model: in Gustavson, T. C., Bassett, R. L., Finley, R. J., Goldstein, A. G., and others, Geology and geohydrology of the Palo Duro Basin, Texas Panhandle; a report on the progress of nuclear waste isolation feasibility studies (1980): The University of Texas at Austin, Bureau of Economic Geology, Geological Circular 81-3, p. 102-107.
Bentley, M. E., 1981, Regional hydraulics of brine aquifers, Palo Duro and Dalhart Basins, Texas: in Gustavson, T. C., Bassett, R. L., Finley, R. J., Goldstein, A. G., and others, Geology and geohydrology of the Palo Duro Basin, Texas Panhandle; a report on the progress of nuclear waste isolation feasibility studies (1980): The University of Texas at Austin, Bureau of Economic Geology Geological Circular 81-3, p. 93-101.
Brune, G., 1981, Springs of Texas: Branch-Smith, Fort Worth, Texas, 566 p.
Bureau of Economic Geology, 1967, Geologic atlas of Texas, Lubbock sheet: The University of Texas at Austin, Bureau of Economic Geology, plate.
_______________________, 1968, Geologic atlas of Texas, Plainview sheet: The University of Texas at Austin, Bureau of Economic Geology, plate.
_______________________, 1969, Geologic atlas of Texas, Amarillo sheet: The University of Texas at Austin, Bureau of Economic Geology, plate.

55
_______________________, 1974, Geologic atlas of Texas, Big Spring sheet: The University of Texas at Austin, Bureau of Economic Geology, plate.
_______________________, 1983, Geologic atlas of Texas, Tucumcari sheet: The University of Texas at Austin, Bureau of Economic Geology, plate.
Cazeau, C, J., 1962, Upper Triassic deposits of West Texas and northeastern New Mexico: The University of North Carolina, Chapel Hill, North Carolina, Master’s thesis, 94 p.
Cooper, H. H., Jr., and Jacob, C. E., 1946, A generalized graphical method for evaluating formation constants and summarizing well field history: American Geophysical Union Transactions, v. 27, p. 526-534.
Cummins, W. F., 1890, The Permian of Texas and its overlying beds: Geological Survey of Texas, First Annual Report, p. 183-197.
Driscoll, F. G., 1986, Groundwater and wells, second edition: Johnson Division, St. Paul, Minnesota, 1,089 p.
Duffin, G. L., 1984, Groundwater conditions in the Triassic aquifer in Deaf Smith and Swisher counties: Texas Department of Water Resources, Report No. LP-196, 95 p.
Dutton, A. R., and Simpkins, W. W., 1986, Hydrogeochemistry and water resources of the Triassic Lower Dockum Group in the Texas Panhandle and Eastern New Mexico: The University of Texas at Austin, Bureau of Economic Geology, Report of Investigations No. 161, 51 p.
Fallin, J. A., 1989, Geohydrology of the Dockum Formation (late Triassic) under the High Plains of Texas: Texas Water Development Board, Unpublished Report.
Fetter, C. W., Jr., 1980, Applied hydrogeology: Charles E. Merrill Publishing Company, Columbus, Ohio, 488 p.
Fink, B. E., 1963, Groundwater geology of Triassic deposits in the northern part of the southern High Plains of Texas: High Plains Underground Water Conservation District No. 1, Report No. 163, 76 p.
Galloway, S. E., 1955, Feasibility report on the possibility of obtaining artesian irrigation water from the Triassic "red beds" Curry County, New Mexico: New Mexico State Engineer, miscellaneous report, not paginated.
Garza, S., and Wesselman, J. B., 1959, Geology and groundwater resources of Winkler County, Texas: Texas Board of Water Engineers, Bulletin No. 5916, 200 p.
Gould, C. N., 1906, The geology and water resources of the eastern portion of the Panhandle of Texas: United States Geological Survey, Water-Supply and Irrigation Paper No. 154, 64 p.

56
_________, 1907, The geology and water resources of the western portion of the Panhandle of Texas: United States Geological Survey, Water-Supply and Irrigation Paper No. 191, 70 p.
Granata, G. E., 1981, Regional sedimentation of the late Triassic Dockum Group, West Texas and eastern New Mexico: The University of Texas at Austin, Master's thesis, 199 p.
Gustavson, T. C., and Finley, R. J., 1985, Late Cenozoic geomorphic evolution of the Texas Panhandle and northeastern New Mexico – Case studies of structural controls on regional drainage development, The University of Texas at Austin, Bureau of Economic Geology, Report of Investigations No. 148, --- p.
Johns, D. A., 1989, Lithogenetic stratigraphy of the Triassic Dockum Formation, Palo Duro Basin, Texas: The University of Texas at Austin, Bureau of Economic Geology, Report of Investigations No. 182, 71 p.
Knowles, T., Nordstrom, P., and Klemt, W. B., 1984, Evaluating the groundwater resources of the High Plains of Texas, vol. 1: Texas Department of Water Resources, Report 288, 113 p.
Larkin, T. J., and Bomar, G. W., 1983, Climatic atlas of Texas: Texas Department of Water Resources, Report LP-192, 151 p.
Lehman, T. M., 1994a, The saga of the Dockum Group and the case of the Texas/New Mexico boundary fault: New Mexico Bureau of Mines and Mineral Resources, Bulletin No. 150, p. 37-51.
___________, 1994b, Save the Dockum Group!: West Texas Geological Society Bulletin, v. 34, No. 4., p. 5-10.
Lehman, T., Chatterjee, S., and Schnable, J., 1992, The Cooper Canyon Formation (late Triassic) of western Texas: The Texas Journal of Science, v. 44, no. 3, p. 349-355.
Lucas, S. G., and Anderson, O. J., 1992, Triassic stratigraphy and correlation, West Texas and eastern New Mexico: American Association of Petroleum Geologists, Southwest Section, Transactions, West Texas Geological Society Publication SWS 92-90, p. 201-207.
__________________________, 1993, Lithostratigraphy, sedimentation, and sequence stratigraphy of upper Triassic Dockum Formation, West Texas: American Association of Petroleum Geologists, Southwest Section Transactions, Fort Worth Geological Society, p. 55-65.
__________________________, 1994, The Camp Springs Member, base of the late Triassic Dockum Formation in West Texas: West Texas Geological Society Bulletin, v. 34, no. 2, p. 5-15.
__________________________, 1995, Dockum (Upper Triassic) stratigraphy and nomenclature: West Texas Geological Society Bulletin, v. 34, no. 7, p. 5-11.

57
McGowen, J. H., Granata, G. E., and Seni, S. J., 1977, Depositional systems, uranium occurrence and postulated groundwater history of the Triassic Dockum Group, Texas Panhandle–eastern New Mexico: The University of Texas at Austin, Bureau of Economic Geology, contract report prepared for the United States Geological Survey.
_____________________________________, 1979, Depositional framework of the Lower Dockum Group (Triassic) Texas Panhandle: The University of Texas at Austin, Bureau of Economic Geology, Report of Investigations No. 97, 60 p.
McKee, E. D., Oriel, S. S., Ketner, K. B., MacLachlan, M. E., Goldsmith, J. W., MacLachlan, J. C., and Mudge, M. R., 1959, Triassic System: U. S. Geological Survey, Miscellaneous Geological Investigation Map I-300.
Nativ, R., and Gutierrez, G. N., 1988, Hydrogeology and hydrochemistry of Cretaceous aquifers, Texas Panhandle and eastern New Mexico: The University of Texas at Austin, Bureau of Economic Geology, Geological Circular 88-3, 32 p.
Ogilbee, W., Wesselman, J. B., and Irelan, B., 1962, Geology and groundwater resources of Reeves County, Texas: Texas Water Commission, Bulletin 6214, v. 1, 193 p.
Orr, E. D., Kreitler, C. W., and Senger, R. K, 1985, Investigation of underpressuring in the deep-basin brine aquifer, Palo Duro Basin, Texas: The University of Texas at Austin, Bureau of Economic Geology, Geological Circular 85-1, 44 p.
Rayner, F. A., 1963, Pumping test of the V. J. Owens Santa Rosa irrigation wells, 10-16-802 and 10-14-202, Section 5, Block K-3, Deaf Smith County, Texas: Texas Water Commission, interoffice memo, 1 p.
___________, 1965, The ground-water supplies of the Southern High Plains: Unpublished paper presented at the Third Annual West Texas Water Conference, 23 p.
Reeside, J. B., Jr., Applin, P. L., Colbert, E. H., Gregory, J. T., Halley, H. D., Kummel, B., Lewis, P. J., Maldonado-Koerdell, M., McKee, E. D., McLaughlin, D. B., Muller, S. W., Reinemund, J. A., Rodgers, J., Sanders, J., Siberling, N. J., and Waage, K., 1957, Correlation of the Triassic formations of North America exclusive of Canada: Geologic Society of America Bulletin, v. 68, p. 1451-1514.
Riggs, N. R., Lehman, T. M., Gehrels, G. E., and Dickenson, W. R., 1996, Detrital zircon link between headwaters and terminus of the upper Triassic Chinle-Dockum paleoriver system: Science, v. 272, p. 97-100.
Robotham, H. B., Skrabacz, C. F., and Reed, J. A., 1985, Construction, development, testing and equipping with submersible pumps of two Santa Rosa supply wells in the Wellman oil field, Terry County, Texas: Report prepared for NRM Petroleum Corporation, Ed. L. Reed and Associates, Inc., Midland, Texas, 6 p.
Scofield, C. S., 1936, The salinity of irrigation water: Smithsonian Institution Annual Report, 1934-1935, p. 275-287.

58
Shamburger, V. M. Jr., 1967, Groundwater resources of Mitchell and western Nolan counties, Texas: Texas Water Development Board, Report 50, 175 p.
Smith, J. T., 1973, Groundwater resources of Motley and northeastern Floyd Counties, Texas: Texas Water Development Board Report 165, 66 p.
Texas Administrative Code, 1997, Title 30, Part 1, Chapter 290 (Public Drinking Water).
Texas Water Development Board, 1991, A field manual for ground-water sampling: TWDB User-Manual UM-51, Revised.
Texas Water Development Board, 1997, Groundwater database: Texas Water Development Board, Water Resources Planning Division.
Theis, C. V., 1935, The relation between the lowering of the piezometric surface and the rate and duration of discharge of a well using groundwater storage: American Geophysical Union Transactions, v. 16, p. 519-524.
Thornbury, W. D., 1965, Regional geomorphology of the United States: John Wiley & Sons, Inc., New York, 609 p.
United States Salinity Laboratory, 1954, Diagnosis and improvement of saline and alkali soils: United States Department of Agriculture, Agricultural Handbook No. 60, 160 p.
Walker, L. E., 1979, Occurrence, availability, and chemical quality of groundwater in the Edwards Plateau region of Texas: Texas Department of Water Resources Report 235, 336 p.
White, D. E., 1968, Water resources of Upton County, Texas: Texas Water Development Board, Report 78, 32 p.
_________, 1971, Water resources of Ward County, Texas: Texas Water Development Board, Report 125, 136 p.
Wirojanagud, P., Kreitler, C. W., and Smith, D. A., 1984, Numerical modeling of regional groundwater flow in the deep-basin brine aquifers of the Palo Duro Basin, Texas Panhandle: The University of Texas at Austin, Bureau of Economic Geology Open-File Report OF-WTWI-1984-8, 39 p

59
Appendix I
List of wells with geophysical well logs used for the cross-sections in this report.
County Q Number Operator Lease & Well
Number Date DrilledAndrews 29 Honolulu Oil Corp. Parker D-6 1957 81 Anderson -Prichard Oil Corp. Faskin J #1 1951 168 Mid-Cont. Petr. Corp. Un. 8 #8 1948 227 Stanolind O & G Co. Un B-EH #1 1948 245 The Texas Co. J.E. Mabee A #1 Tract 3 1948 269 Gulf Oil Corp. Tex. QQ#2 1948 282 James G. Brown & Assoc. Eastman #1 1962 401 Ashmun & Hilliard Un. #1-15A 1960 514 Great Western Drilling Co. Scratch Royalty #1 1958 699 Stanolind O & G Co. Chesley #1 1951 998 Midwest Oil Corp. J. L. Bennett #3 1954 1494 Mobil Oil Co. Elizabeth Armstrong #17 1962 Bailey 2 Phillips Petroleum Co. Stephens A #1 1951 6 Shell Oil Co. Nichols #1 1951 Borden 159 Shell Oil Co. Miller #1-A 1957 263 Shell Oil Co. W.T. Long #1 1951 316 Southland Royalty Co. J. Dorward #1 1956 Cochran 63 J.D. Baker M.E. Hancock No. 1 11/10/1956 82 Amerada Petr. Corp. Elma Slaughter No. 1 07/30/1958 86 Geochemical Surveys F.O. Masten "I" No. 1 06/15/1960 127 Shell Oil Co. Tanner-Enochs No. 1 01/16/1960 262 Pan American Pet. Corp. H.H. Kern "A" No. 1 06/10/1967 Crosby 1 Cities Service Oil Co. Jones "C" No. 1 1957 5 Humble Oil & Ref. Co R.N. Irvin #1 1953 84 Safari Drilling Co. Jordan #1 1973 Dawson 39 Amerada Petr. Corp. Dunlop Est. #1 1961 40 The Texas Co. Anna R. Nowell #1 1958 86 Blackwood & Nichols Co. Richards #1 1955 89 The Texas Co. B.E. Miller #1 1957 427 Texas Crude Berry #39 Deaf Smith 13 Hereford Salt Inc. No. 1 Sharp 14 Stone and Webster Engineering Corp. No. 1 J. Friemel 15 Stone and Webster Engineering Corp. No. 1 Detten Floyd 1 Poff-Brinsmere Krause #1 1952 5 Standard Oil Co. of Texas Minnie Adams #1 1952 6 Standard of Texas L.M. Daniels #1 1948 13 Kern Co. Land Co. W.J. Ross #1 1966 Gaines 96 McDaniel & Beecher Radford Groc. Co. #1 1947 113 Mobil Oil Co. H&J #2 1959 115 Kelley Bell Cornett #1 1957 227 Sinclair O&G Co. P.W. DuBose #2 1952 257 Luling Oil & Gas Co. et.al. Folk #1 1958 398 Blackwood Nichols Granberry 1-7 1953 Garza 38 R.L. Turley C.A. Bird #1-A 1954 337 Alamo Corp. Neff #1 1952 397 D.J. Stone Oil & Gas Operations Post Est. #5-1 1966

60
List of wells with geophysical well logs used for the cross-sections in this report.
County Q Number Operator Lease & Well Number Date
Drilled Hale 4 Chambers & Kennedy Hix #1 1961 19 Sinclair O & G Co. J.N. Teauge #1 1964 21 Western Drilling. Co. E.M. Jones #1 1954 40 Plymouth Oil Co. Daly & Hulburt 1958 Hockley 28 Stanolind Oil And Gas Co. W.J. Powell No. 1 08/19/1946 35 T&P Coal and Oil Co. Bailey No. 1 07/28/1947 107 Feldmont Oil Corp. C.M. Phillips No. 1 10/22/1957 190 G.P. Livermore Inc. Wells-Hassell No. 1 02/04/1951 196 Pierce and Dehlinger Humphries No. 1 10/20/1973 Howard 50 Glen H. McCarthy & S& W Drlg. Co. Doyle Vaughn #1 1953 60 Tidwell & Cowder J.F. Selers #1 1955 152 SunRay Oil Corp. R. Harper #1 1951 358 Gulf Oil Corp. Maedelle Roley #1 1960 378 Amerada Petroleum Corp. G.G. White #1 1969 501 R.S. Anderson Mullie Anderson #1 1955 Lamb 6 Cities Service Oil Co. Stanley #1 1960 13 Midwest Oil Co. Duane Moser #1 1957 18 Amerada Petroleum Corp. Mary Hagler #1 1957 28 L.C. Hewett Cunningham #1 1957 37 Big Spring Exploration. Co. Sybert #1 1960 43 Sharples Oil Corp. Sharples #1 1954 Lubbock 11 Leland Fikes J.W. Lemon #2 1956 15 James G. Brown & Assoc. Charles Lundell Est. #2 1956 16 Leland Fikes Ida S. Collins B#1 1957 30 Amerada Pet. Corp. Stribling #1 1948 68 Continental Oil Co. E.A. Marquis #1 1955 69 MFC Corp. J. Clark #1 1950 Lynn 59 Barnsdall Oil Co. B. Williams #1 1949 74 Dalton H. Cobb & Kern Co. Land Co. Camp & Norman #1 1961 94 McAlester Fuel Edwards #1 1949 136 Apache Corp. Franklin #1 1969 Martin 6 G.M. McGarr & G.T. Trusler Billington #1 1959 58 Sinclair Oil & Gas Co. -Dickenson #1 1951 162 Cities Service Oil Co. Orson #1 1953 179 Leland Davidson Guy Mabee #1 1965 Mitchell 8 Standard Oil Co. of Texas Z.F. Morrison #1 1955 13 Standard Oil Co.of Texas Foster #3B 1957 31 Kay Kimbell et. al. T.L. Holman #1 1956 67 R.S. Anderson Mobil #1 1962 214 Blue Danube Oil Co. May #1 1955 Oldham 19 Pan American Petroleum Co. No. 1 D. Whaley Scurry 9 Sun Oil Co. Randals # B-4 1956 661 Chevron Oil Co. Sacroc Unit #176-5 1975 Swisher 3 Frankfort Oil Co. No. 1 Bradford 4 H.L. Hunt Oil Co. No. 1 Bivins 8 Frankfort Oil Co. No. 1 Culton Terry 1 Coroco Drilling Co. Atlas Life #1 1952 7 Great Western Drilling Co. Brit Clare "C" #1 1960 23 Champlin Ref. Co. Linsley #1 1950

61
List of wells with geophysical well logs used for the cross-sections in this report.
County Q Number Operator Lease & Well Number Date
Drilled Terry 131 Bert Field Beckham #1 1955 155 Seaboard Oil Co. Hinson #1 159 Shell Oil Co. Loyce Floyd #1 1957 161 Gulf Oil Corp. T.L. Lowe #1 1951 Yoakum 7 Honolulu Oil Corp. Cobb #2 1950 57 Honolulu Oil Corp. Davis #2 1954 134 Amerada Pet. Corp. Weems #1 1952 297 The Texas Co. Fitzgerald #1 1953 298 Texaco Inc. Fitzgerald #1 1973 302 Sinclair Oil & Gas Co. R.N. McGinty #1 1952

62
Appendix II Details of well yields in the Dockum aquifer.
Well Yield (gpm) County
Mean Maximum Minimum
Number of Records
Andrews 87 173 32 35 Armstrong 15 0 1 17 Borden 105 260 10 16 Briscoe 331 600 25 4 Crane 23 55 1 6 Crosby 120 180 90 3 Dawson 59 140 19 16 Deaf Smith 653 1,000 3 17 Dickens 90 250 10 10 Ector 70 103 26 4 Floyd 38 400 2 12 Gaines 91 157 50.8 3 Garza 43 200 3 24 Hartley 130 500 1 4 Howard 6 20 1 4 Midland 89 133 35 3 Mitchell 161 1,100 0.5 358 Moore 770 940 630 3 Motley 102 800 2 44 Nolan 120 460 2 187 Oldham 242 955 1.5 24 Potter 32 80 5 16 Randall 397 900 5 26 Swisher 504 920 200 5 Reagan 61 116 17.5 3 Reeves 353 736 60 20 Scurry 179 1,100 6 108 Terry 207 645 37 4 Upton 21 90.5 1.2 21 Ward 139 625 5 7 Winkler 418 2,500 24 17

63
Appendix III Details of specific capacity tests in the Dockum aquifer.
County TWDB
Well Number
Discharge (gpm)
Drawdown (feet)
Duration of Test (hours)
Specific Capacity (gpm/ft.)
Andrews 2755403 152 200 24 0.76 Armstrong 0662203 12 20 3 0.60 0663402 34 12 8 2.8 Borden 2806601 150 280 6 0.535 2819601 130 639 4.5 0.203 2819602 125 254 6 0.492 2827301 125 248 6 0.504 2827302 125 160 6 0.781 2830601 160 244 6 0.655 2930602 260 100 8 2.6 Crosby 2339501 90 40 40 2.3 2339502 90 50 12 1.8 Deaf Smith 0750702 5 240 5 0.02 0752902 900 79 6.75 11 1014443 556 44.8 48 12.4 Dickens 2210829 250 40 2 6.3 2210830 175 25 2 7.0 2210831 100 75 6 1.3 2218103 75 35 3 2.1 Gaines 2706501 50.8 115 3 0.442 2706502 157 271 2 0.579 Garza 2345801 62 332 7 0.19 2354701 40 223 3 0.18 2362614 18 325 24 0.055 Martin 2755202 83 200 24 0.42 Mitchell 2840718 250 401 1 0.623 2840808 60 100 1 0.60 2926907 86 60 6 1.4 2934434 71 192 1 0.37 2934523 75 250 24 0.30 2934524 180 145 2 1.24 2934926 100 138 3 0.725 2935211 175 103 2 1.70 2935721 350 240 4 1.46 2942211 207 100 1 2.07 2942212 250 70 4 3.6 2942213 80 120 2 0.67

64
Details of specific capacity tests in the Dockum aquifer.
County TWDB
Well Number
Discharge (gpm)
Drawdown (feet)
Duration of Test (hours)
Specific Capacity (gpm/ft.)
Mitchell (cont.) 2942214 100 112 2 0.893 2942215 60 112 2 0.54 Moore 0716506 740 96 18 7.7 0716507 630 56 17 11 Motley 2201201 800 125 6 6.40 2210915 450 55 24 8.2 2936524 150 83 1 1.8 Nolan 2936525 75 80 3 0.94 2936824 75 200 3 0.38 2944211 91.3 110 2 0.830 2944505 130 113 24 1.15 2944707 60 30 1 2.0 2944708 100 115 3 0.87 Oldham 0730401 880 272 24 3.24 0738202 20 74 24 0.27 0738401 150 90 69 1.7 0738402 180 132 48 1.36 0738403 175 50 3 3.5 0738404 40 70 3 0.57 0738501 5 20 24 0.3 Potter 0642601 50 64 52 0.78 Randall 1101205 760 176 12 4.32 1101606 900 100 3 9.00 Reeves 4646217 400 30 12 13 4646602 736 20 213 37 Scurry 2815603 40 40 4 1.0 2823902 475 203 168 2.34 2824401 350 188 24 1.86 2824403 400 78 7 5.1 2824706 521 123 6 4.24 2824707 400 75 6 5.3 2824801 400 66 6 6.1 2824802 400 100 6 4.00 2824803 360 110 7 3.23 2909905 60 180 4 0.33 2917207 350 170 24 2.06 2917403 254 89 24 2.9 2917703 326 58 24 5.6 2918603 130 40 12 3.3

65
Details of specific capacity tests in the Dockum aquifer.
County TWDB
Well Number
Discharge (gpm)
Drawdown (feet)
Duration of Test (hours)
Specific Capacity (gpm/ft.)
Scurry 2918702 85 142 3 0.60 2919401 140 209 3 0.670 2925401 150 220 24 0.682 2925602 30 70 1 0.43 Swisher 1126612 600 311 24 1.93 Upton 4546603 36.4 118.4 3 0.307 Winkler 4608516 40 320 48 0.13 4616213 1,800 105 24 17.1 4616703 150 44 21 3.4 4616705 86 187 24 0.46

66
Appendix IV Total dissolved solids in groundwater samples from the Dockum aquifer, 1981 through 1996.
Total Dissolved Solids (mg/l) County
Mean Maximum Minimum Number of
Samples Andrews 2,939 3,540 2,252 25 Armstrong 390 551 280 11 Borden 10,000 69,170 588 14 Briscoe 700 2,397 360 11 Crane 4,040 6,316 1,443 3 Crockett 2,082 2,082 2,082 1 Crosby 712 1,528 351 4 Dawson 8,474 21,547 5,018 7 Deaf Smith 926 2,307 263 32 Dickens 824 2,302 303 16 Ector 2,932 5,665 1,688 4 Fisher 1,230 2,038 393 5 Floyd 345 389 307 9 Gaines 7,370 11,159 4,847 3 Garza 29,300 50,784 471 16 Glasscock 11,338 11,338 11,338 1 Hartley 323 553 212 7 Hockley 17,400 33,920 905 2 Howard 1,900 5,658 454 13 Kent 1,420 2,043 885 5 Loving 1,650 5,291 290 20 Martin 2,805 2,805 2,805 1 Mitchell 1,900 17,007 405 52 Moore 593 593 593 1 Motley 460 776 278 14 Nolan 632 1,951 273 28 Oldham 1,030 4,887 209 40 Potter 1,243 5,348 305 14 Randall 1,210 4,262 305 8 Reeves 1,180 2,911 513 5 Scurry 1,560 17,496 286 55 Sterling 282 361 249 5 Swisher 897 1,066 805 6 Terry 10,540 13,164 9,084 3 Ward 1,250 4,819 371 13 Winkler 473 1,408 206 22 Yoakum 9,454 9,675 9,232 2
NOTES: Reliable samples could not be obtained from Carson, Castro, Coke, Dallam, Hale, Irion, Midland, Parmer, Pecos, Reagan, Sherman, Tom Green and Upton counties.

Appendix V Major cations detected in groundwater samples collected from the Dockum aquifer, 1981 through 1996.
Sodium (mg/l) Potassium (mg/l) Calcium (mg/l) Magnesium (mg/l) County Mean Maximum Minimum Mean Maximum Minimum Mean Maximum Minimum Mean Maximum MinimumAndrews 1,070 1,754.97 778.9 6 11 3 16 23.62 9 9 30 3 Armstrong 124 124 12.36 6 7 3.02 39 57 10.59 28 39 6.39 Borden 3,430 24,696 178 13 59 2.3 210 1,601 32.22 71 456 10 Briscoe 200 1,023 40 7 10 1.86 50 77 11.08 27 37.33 6.93 Crane 790 1,374 393.5 19 26.4 14.09 336 500.2 65.36 152 278.9 36.88 Crockett 400 562.8 253.8 13 16.09 10.25 117 133.7 86.29 100 132.1 67.45 Crosby 140 374 21 9 9.63 8.6 51 70 40 41 67 27 Dawson 2,920 7,476 1,770 26 101 11 109 397 34 49 186 14 Deaf Smith 330 909 16.33 4 9.1 1.78 14 67.83 2 8 48.37 0.77 Dickens 120 334 21 6 8.3 3.12 118 211 52 35 144 15 Ector 1,000 1,767 680.9 7 8.86 6.34 40 120 7.29 35 119 4.56 Fisher 160 316 67 7 11.37 3.5 185 416.44 43 49 103 21 Floyd 40 50 21 6 8.5 4.18 50 68.12 36 24 35 15 Gaines 2,250 3,294 1,559 8 10.77 5.59 79 145.6 40.55 29 53.35 15.38 Garza 10,650 19,216 127 36 69 2.9 448 798 20 165 287 10 Glasscock 4,015 4,015 4,015 36 35.5 35.5 63 63.04 63.04 96 95.71 95.71 Hartley 60 207.2 14.9 4 5.31 1.83 29 43.66 4.23 20 29.37 2.58 Hockley 6,240 12,397 73 19 25.29 12 496 907.6 85 176 258.7 93 Howard 610 1,949 84 6 10 1 49 140 31 21 63 10 Irion 423.8 423.8 423.8 12.02 12.02 12.02 131.6 131.6 131.6 87.28 87.28 87.28 Kent 240 299 181 5 6 3.62 146 297.7 44 69 114.6 22 Loving 140 499 7.9 5 12 0.4 257 830 41 83 245 8.1 Martin 991 991 991 7 7 7 14 14 14 5 5 5 Mitchell 410 5,779 26 6 30 1.44 140 615 9 79 565 4 Moore 127 127 127 10 9.7 9.7 52 52.3 52.3 23 22.7 22.7 Motley 90 217 20 6 8.1 3.3 51 81 33 17 26.07 7 Nolan 60 263.12 14 5 13.59 1 114 309.5 50 30 112 2

Major Cations Detected in Groundwater Samples Collected from the Dockum Aquifer, 1981 through 1996.
Sodium (mg/l) Potassium (mg/l) Calcium (mg/l) Magnesium (mg/l) County Mean Maximum Minimum Mean Maximum Minimum Mean Maximum Minimum Mean Maximum Minimum
Oldham 320 1,781 19 4 10 1 34 101 1.8 17 45 0.12 Potter 220 952 16.99 6 18.86 1 114 566 2.4 65 525.2 1.26 Randall 370 1,240 20.1 5 16 1.32 36 158 3.31 26 106 2.01 Reeves 160 463 66.7 6 11.9 3.8 176 398 73 45 117 18.6 Scurry 380 6,132 18 6 15 1.42 124 416 1.7 41 150.16 0.57 Sterling 20 29.2 6.1 1 1.85 1 61 75.39 37.04 14 37.26 3.7 Swisher 340 396.5 303.1 2 2.91 2 4 5 3.58 2 2.26 1 Terry 3,350 4,006 2,965 14 14.39 14.39 144 231 97 51 70.24 41 Ward 130 381 6.1 4 7 2.14 210 940 62 56 230 5.9 Winkler 40 110.4 15 4 9.87 1.59 90 356 41 16 39 6.03 Yoakum 3,090 3,140 3,035 16 22.6 9 113 122 103 47 52 42

Appendix VI Major Anion Concentrations Detected in Samples from the Dockum Aquifer, 1981 through 1996.
Chloride (mg/l) Sulfate (mg/l) Bicarbonate (mg/l) Carbonate (mg/l)County Avg Min Max Avg Min Max Avg Min Max Avg Min Max Number of
Samples Andrews 572 302 868 994 764 1,309 512 378.31 596.75 6 0 16.8 25 Armstrong 28 13 45 46 9 91 293 248.95 423.46 1 0 7.2 11 Borden 4,177 34 38,022 1,821 44 4,273 428 113.49 578.44 1 0 8.4 14 Briscoe 99 20 387 159 44 723.2 337 257.49 436.88 0 0 0 11 Crane 1,060 224 1,849 1,528 483.1 2,333 233 123.25 433.22 0 0 0 3 Crockett 421 421 421 797 796.8 796.8 353 323.39 380.75 0 0 0 3 Crosby 70 17 170 160 26 516 398 303.87 567 2 0 8 4 Dawson 3,196 1,313 11,962 1,921 1,019 4,107 436 324.61 507.66 25 0 163.2 7 Deaf Smith 106 3 508 206 9 460.8 474 198.92 999.46 9 0 37.2 32 Dickens 160 20 410 167 27.9 819 324 229.43 390.51 0 0 0 16 Ector 795 339 1,900 769 196 1,525 549 380.75 706.58 1 0 2.4 4 Fisher 333 33 826 245 26 752 314 216 402.71 0 0 0 5 Floyd 22 16 41 25 19 34 282 253.83 313.63 0 0 3.6 9 Gaines 1,196 510 2,284 3,622 2,512 5,177 361 322.17 389.29 0 0 0 3 Garza 16,010 80 28,000 1,853 63 3,095 227 124 383.19 1 0 8 16 Glasscock 4,575 4,575 4,575 2,362 2,362 2,362 349 349.02 349.02 0 0 0 1 Hartley 19 14 40 46 23 107.5 224 84.2 336.82 6 0 30 7 Hockley 9,584 169 18,999 775 311 1,239 165 87.86 241.63 0 0 0 2 Howard 503 49 1,593 480 54 1,764 351 223 602.85 1 0 8 13 Irion - - - - - - 315 314.85 314.85 0 0 0 1 Loving 149 10 1,608 873 10 2,120 203 54.92 550.38 0 0 0 20 Martin 612 612 612 857 857 857 600 600.41 600.41 7 7.2 7.2 1 Mitchell 411 25 7,774 657 69 3,035 324 200.14 545.49 0 0 7.2 52 Moore 16 15.6 15.6 149 149.3 149.3 391 390.51 390.51 0 0 0 1

Major Anion Concentrations Detected in Samples from the Dockum Aquifer, 1981 through 1996.
Chloride (mg/l) Sulfate (mg/l) Bicarbonate (mg/l) Carbonate (mg/l) County Avg Min Max Avg Min Max Avg Min Max Avg Min Max Number
of Samples Motley 78 13 226 45 18 80.5 282 220.88 336.82 0 0 1.2 14 Nolan 108 17 479 128 15 494 276 202.58 385.63 0 0 0 28 Oldham 161 4 1,498 252 14.1 1,381 421 80.54 1,036.07 8 0 39.6 40 Potter 276 16 1,879 367 24.2 1,971 283 201.36 374.65 3 0 38.4 14 Randall 311 9 1,664 277 20.9 1,004 314 125.7 449.09 1 0 1.2 8 Reagan 474 221 914 986 804 1,230 274 211.12 338.04 0 0 0 3 Reeves 333 55 1,250 314 143 538 187 156.2 211.12 0 0 0 5 Scurry 547 14 9,339 259 13 1,312 306 186.71 621.16 1 0 28.8 55 Sterling 13 7 18 12 11 14 272 231.87 385.63 0 0 0 5 Swisher 89 65 116 205 172.5 269.8 487 456.41 558.92 6 1.2 12 6 Terry 2,101 1,546 3,177 4,694 4,212 5,514 362 275.8 407.6 0 0 0 3 Upton 440 216 663 978 586 1370 232 178.17 286.78 0 0 0 2 Ward 286 9 2,145 415 20 2,069 198 53.7 303.87 0 0 0 13 Winkler 90 6 465 113 18 350 157 100.07 256.27 0 0 0 22 Yoakum 1,260 1,232 1,288 4,700 4,570 4,830 374 348 399 0 0 0 2

Appendix VII Percent Sodium, Sodium Adsorption Ratio (SAR), Residual Sodium Carbonate (RSC), Boron, and Hardness Values in Groundwater Samples from the Dockum Aquifer, 1981 through 1996.
County Percent Sodium SAR RSC (me/l) Boron (mg/l) Hardness (as CaCO3) mg/l
No. of Samples Mean Max Min No. of
Samples Mean Max Min No. of Samples Mean Max Min No. of
Samples Mean Max Min No. of Samples Mean Max Min
Andrews 23 96 98 93 23 55.07 94.38 19.87 23 7.03 9.12 3.94 9 1.064 1.316 0.9102 23 76.13 175 34 Armstrong 6 38 82 11 6 1.8 7 0.36 7 1.1 3.89 0 6 0.237 0.511 0.1107 7 170 260 53 Borden 10 86 97 51 10 57.9 140.21 7.04 10 2.72 6.41 0 9 1.245 1.83 0.2683 11 998.36 5870 138Briscoe 7 53 95 27 7 10.12 31.73 1.14 7 1.29 5.44 0 5 0.819 2.184 0.2333 7 224.14 338 56 Crane 5 58 80 37 5 12 25.07 5.63 5 0.16 0.8 0 3 0.664 1.177 0.1284 5 1394.4 2263 317Crockett 3 54 62 48 2 6.55 9.04 4.97 3 0 0 0 3 1.286 1.374 1.177 3 704 881 495Crosby 3 40 64 15 3 3.51 7.67 0.57 3 0.35 0.56 0 2 0.3419 0.3838 0.3 3 322.67 452 256Dawson 9 91 98 58 9 62.5 116.41 6.74 9 3.05 7.49 0 4 1.109 1.657 0.58 9 278.1 649 50 Deaf Smith 19 88 98 40 19 28.2 64.89 1.8 20 7.5 15.32 0.25 10 1.041 3.193 0.0746 20 46.7 170 10 Dickens 8 36 82 17 7 1.92 4.03 0.61 7 0.01 0.08 0 9 0.306 0.59 0.0806 7 399.86 638 226Ector 4 96 98 93 5 43.66 56.01 27.36 5 7.09 10.96 0 3 1.14 1.433 0.7428 5 203 789 36 Fisher 6 39 52 20 6 2.94 4.44 1.87 6 0.27 1.59 0 6 0.408 0.63 0.1937 6 614.67 1288 199Floyd 6 24 31 15 6 1.02 1.35 0.6 6 0.15 0.39 0 3 0.1992 0.2458 0.1529 6 232.17 249 213Gaines 4 95 98 92 4 46.07 59.36 52.88 5 3.1 10.96 0 3 1.717 1.926 1.583 5 318.2 609 35 Garza 14 84 97 46 14 94.1 252.01 3.08 15 0.39 2.94 0 9 2.028 2.94 0.35 15 1731 3171 78 Glasscock 2 78 83 72 2 30.16 36.44 23.88 2 0 0 0 1 1.531 1.531 1.531 2 1673.5 1998 1349Hartley 5 39 95 14 5 3.89 19.59 0.46 5 1.1 5.38 0 5 0.428 1.669 0.0869 6 192 418 21 Hockley 2 55 89 21 2 47.4 93.47 1.3 2 0 0 0 1 1.539 1.539 1.539 2 1984.5 3375 594Howard 9 80 96 34 9 32 66.69 2.61 9 2.88 7 0 10 1.25413 2.17 0.3893 9 377.22 1526 123Irion 1 57 57 57 1 7.03 7 7 1 0 0 0 1 0.6261 0.6261 0.6261 1 694 694 694Kent 3 47 69 29 2 5.7 6.88 4.51 2 0.72 1.44 0 4 0.556 0.78 0.1549 2 526.5 830 223Loving 12 24 41 6 12 1.65 5.25 0.22 14 0 0 0 3 0.292 0.527 0.1361 14 1045.9 3078 159Lubbock 1 17 17 17 17 1.25 1.25 1.25 1 0 0 0 0 0 0 0 1 818 818 818Martin 1 97 97 97 1 57.86 57.86 57.86 1 8.97 8.97 8.97 0 0 0 0 1 55 55 55 Mitchell 41 48 99 7 41 10.9 67.41 0.65 41 0.75 8.16 0 31 0.486 2.1 0.05 41 566.7 2949 9 Moore 1 26 26 26 1 1.12 1.1 1.1 1 0 0 0 1 0.57 0.57 0.57 1 230 230 230

County Percent Sodium SAR RSC (me/l) Boron (mg/l) Hardness (as CaCO3) mg/l
Motley 10 39 68 18 10 2.3 6.26 0.62 10 0.62 1.52 0 10 0.27 0.45 0.0987 10 196.8 271 148Nolan 23 19 41 11 23 1.1 4.01 0.4 23 0.01 0.32 0 18 0.438 0.75 0.0911 23 418.83 999 210Oldham 33 63 99 16 34 20 109.54 0.68 34 4.46 14.96 0 10 0.66 2.712 0.0618 35 154 418 4 Potter 13 46 97 14 13 5.2 24.12 0.5 13 1.18 6.42 0 7 0.35 0.6695 0.1512 14 664.6 3472 11 Randall 6 72 96 20 6 18 31.99 0.72 6 3.2 6.81 0 5 1.84 3.361 0.176 6 222.3 842 27 Reagan 3 64 90 46 3 42.6 111.93 4.31 3 0 0 0 0 0 0 0 3 2100 3628 608Reeves 1 90 90 90 13 2.5 5.25 1.55 13 0 0 0 1 0.2277 0.2277 0.2277 13 758 1960 260Scurry 45 43 98 11 45 9.57 69.61 0.5 46 1.13 10.01 0 30 0.45 2.04 0.0814 46 528.8 1662 11 Sterling 5 14 24 2 5 0.51 0.89 0.05 5 0.67 1.92 0 6 0.119 0.15 0.055 5 196.8 257 115Swisher 5 97 98 97 5 35.56 44 30.69 5 7.87 8.89 7.22 3 0.89 1.037 0.7587 5 17.6 20 15 Terry 3 92 94 90 3 62.3 65.92 59.24 3 0 0 0 1 1.675 1.675 1.675 3 572.33 871 410Upton 0 0 0 0 7 12.4 43.26 2.94 7 0 0 0 0 0 0 0 7 1700 2218 943Ward 10 23 41 4 10 1.6 3.25 0.15 10 0 0 0 6 0.268 0.4032 0.1541 10 598 1831 263Winkler 17 25 46 9 17 1.2 6.61 0.61 20 0 0 0 7 0.227 0.3789 0.0609 20 361.6 1448 136Yoakum 1 93 93 93 1 63.68 63.68 63.68 1 0 0 0 1 55.5 55.5 55.5 1 429 429 429

73
Appendix VIII Areas in each County underlain by the Dockum Aquifer with Different TDS Consentrations.
Area of Aquifer (Acres) County <5,000 mg/l TDS 5,000 to 10,000 mg/l TDS >10,000 mg/l TDS Total Andrews 960,640 0 0 960,640
Armstrong 286,029 0 0 286,029 Bailey 0 0 529,280 529,280 Borden 64,640 168,320 342,400 575,360 Briscoe 295,457 0 0 295,457 Carson 83,180 0 0 83,180 Castro 43,169 204,800 326,751 574,720
Cochran 0 0 496,000 496,000 Coke 18,599 0 0 18,599 Crane 335,246 63,360 0 398,606
Crockett 489,127 0 0 489,127 Crosby 101,111 358,604 116,285 576,000 Dallam 963,200 0 0 963,200 Dawson 0 423,040 154,240 577,280
Deaf Smith 958,080 0 0 958,080 Dickens 170,253 0 0 170,253
Ector 576,640 0 0 576,640 Fisher 45,218 0 0 45,218 Floyd 605,164 29,716 0 634,880 Gaines 737,714 198,606 24,960 961,280 Garza 131,010 75,520 366,720 573,250
Glasscock 100,480 302,720 173,440 576,640 Hale 165,120 81,280 396,800 643,200
Hartley 935,680 0 0 935,680 Hockley 0 0 581,120 581,120 Howard 191,312 386,608 0 577,920
Irion 425,986 0 0 425,986 Kent 44,935 0 0 44,935 Lamb 0 0 650,240 650,240
Loving 180,281 0 0 180,281 Lubbock 0 0 576,000 576,000
Lynn 0 0 570,880 570,880 Martin 43,742 541,858 0 585,600
Midland 51,840 522,880 1,280 576,000 Mitchell 521,525 0 0 521,525 Moore 233,147 0 0 233,147 Motley 98,283 0 0 98,283 Nolan 83,658 0 0 83,658
Oldham 960,640 0 0 960,640 Parmer 149,760 124,160 290,560 564,480 Pecos 376,261 0 0 376,261 Potter 447,934 0 0 447,934
Randall 583,453 0 0 583,453 Reagan 439,680 138,240 174,080 752,000 Reeves 344,094 0 0 344,094 Scurry 508,859 0 0 508,859
Sherman 60,655 0 0 60,655 Sterling 580,677 0 0 580,677 Swisher 570,073 5,927 576,000
Terry 0 53,120 516,480 569,600 Tom Green 34,417 0 0 34,417
Upton 117,760 240,640 436,480 794,880 Ward 394,191 0 0 394,191
Winkler 516,095 0 0 516,095 Yoakum 0 108,800 403,200 512,000
16,025,015 4,028,199 7,127,196 27,180,410 NOTES: TDS-total dissolved solids.