the ground lease company corporate...
TRANSCRIPT

Safety, Income & Growth Inc.The Ground Lease Company
(NYSE: SAFE)
Corporate Presentation
March 2018

1Safety, Income & Growth Inc.The Ground Lease Company
Forward-Looking Statements and Other MattersThis release may contain forward-looking statements. All statements other than statements of historical fact are forward-looking statements. These forward-looking statements can be identified by the use of words such as “illustrative”, “representative”, “expect”, “plan”, “will”, “estimate”, “project”, “intend”, “believe”, and other similar expressions that do not relate to historical matters. These forward-looking statements reflect the Company’s current views about future events, and are subject to numerous known and unknown risks, uncertainties, assumptions and changes in circumstances that may cause Company’s actual results to differ significantly from those expressed in any forward-looking statement. The Company does not guarantee that the transactions and events described will happen as described (or that they will happen at all). The following factors, among others, could cause actual results and future events to differ materially from those set forth or contemplated in the forward-looking statements: market demand for ground lease capital; the Company’s ability to source new ground lease investments; risks that the rent adjustment clauses in the Company's leases will not adequately keep up with changes in market value and inflation; risks associated with certain tenant and industry concentrations in our initial portfolio; conflicts of interest and other risks associated with the Company's external management structure and its relationships with iStar and other significant investors; risks associated with using debt to fund the Company’s business activities (including changes in interest rates and/or credit spreads,and refinancing and interest rate risks); general risks affecting the real estate industry and local real estate markets (including, without limitation, the potential inability to enter into or renew ground leases at favorable rates, including with respect to contractual rate increases or participating rent); dependence on the creditworthiness of our tenants and their financial condition and operating performance; competition from other developers, owners and operators of real estate (including life insurance companies, pension funds, high net worth investors, sovereign wealth funds, mortgage REITs, private equity funds and separateaccounts); unknown liabilities acquired in connection with real estate; and risks associated with our failure to qualify for taxation as a REIT under the Internal Revenue Code of 1986, as amended. Please refer to the section entitled “Risk Factors” in our Prospectus, dated June 27, 2017, filed with the Securities and Exchange Commission (SEC) and please also see our CurrentReport on Form 8-K, filed with the SEC on February 15, 2018 for further discussion of these and other investment considerations.The Company expressly disclaims any responsibility to update or revise forward-looking statements, whether as a result of new information, future events or otherwise, except as required by law.
Investor Relations ContactJason Fooks
(212) [email protected]

2Safety, Income & Growth Inc.The Ground Lease Company
Corporate Snapshot
NYSE Ticker SAFE
Share Price (3/2/2018) $16.96
Book Value / Share $20.00
Dividend Yield (3/2/2018) 3.5%
PV of Portfolio Rent(1) $667MM
Value Bank(2) $989MM
Market Cap $309MM
Total Assets $675MM
Total Liabilities $315MM
Total Equity $330MMNote: As of 12/31/17 unless otherwise noted(1) See slide 40(2) See slide 41

3Safety, Income & Growth Inc.The Ground Lease Company
Overview of Opportunity First and only publicly-traded company to focus on ground lease (“GL”) investments
GLs generate attractive risk-adjusted returns, combining safety, growing inflation protected income and the potential for significant capital appreciation
Opportunity to reinvent industry and capitalize on misunderstood sectorNew approach to GLs will significantly expand market
Strong iStar partnershipLargest shareholder with a 39.9% ownershipDeeply aligned, subsidized management agreement Sizable ownership and support from sovereign wealth fund and CRE PE fund
Current stock price represents a deep discount to our view of intrinsic value of existing portfolio

4Safety, Income & Growth Inc.The Ground Lease Company
Company Overview

5Safety, Income & Growth Inc.The Ground Lease Company
What is a Ground Lease?
A ground lease, or GL, is the safest part of the commercial real estate capital structure. It generally represents ownership of the land underlying a commercial real estate property. The land is net leased on a long-term basis by the Landlord (SAFE) to a Tenant that owns and operates the real estate property.
Key points of GL structure:
Tenant takes possession of the land and beneficial ownership of the improvements on a “triple net” lease basis
Landlord (SAFE) collects ground rent payments, including contractual escalations and/or percentage rent payments during the lease term
At lease expiration, or upon a Tenant default, the land and all improvements thereon revert to the Landlord (SAFE)
1
2
3Ground Lease
Tenant
Landlord (SAFE)
Contractual ground rent payments with a building reversion at lease expiration
Beneficial ownership during lease term
1
2
3

6Safety, Income & Growth Inc.The Ground Lease Company
Typical GL Lease Terms
Lease Term Base term up to 99 years plus renewal options
Contractual Rent Escalators Fixed bumps, CPI-based increases, or revenue participations
Property Expenses No Landlord obligations
Capital Expenditures No Landlord obligations
Tenant Repair and Maintenance Tenant obligated to maintain the underlying property
Remedies Upon Tenant Default
Landlord (SAFE) entitled to terminate the lease, regain possession of the land and take ownership of the improvements
Reversion Right at Lease Expiration
Possession / ownership of the land and improvements thereon revert to Landlord (SAFE)

7Safety, Income & Growth Inc.The Ground Lease Company
Reinventing GLs for Today’s Market
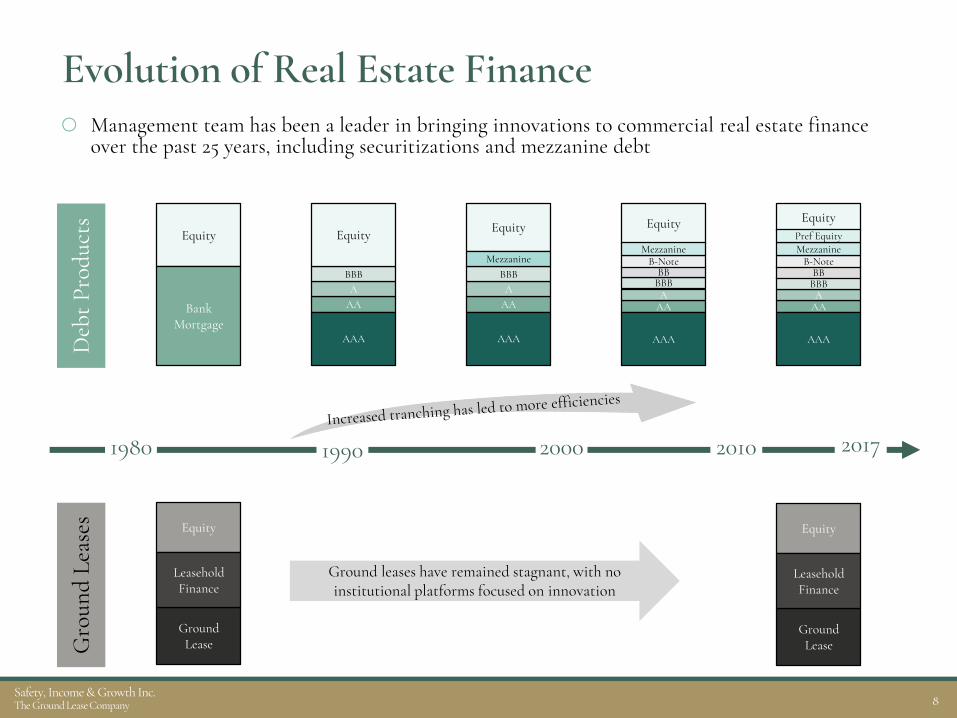
While debt products have become increasingly sophisticated and tranched to price more efficiently, GLs have been overlooked and GL structures have remained substantially unchanged
SAFE’s custom-tailored ground leases provide an attractive way for real estate investors and developers to source capital
Potential market opportunity is significant A modern, SAFE Ground Lease™, can be a part of any capital structure in the $7 trillion+ commercial real estate industryPipeline / customer engagement has been very positive
8Safety, Income & Growth Inc.The Ground Lease Company
Evolution of Real Estate Finance Management team has been a leader in bringing innovations to commercial real estate finance
over the past 25 years, including securitizations and mezzanine debt
Equity
BankMortgage
AAA
BBBBB
B-Note
Equity
AAA
Mezzanine
AAA
BBB
Equity
AAA
AAA
BBB
Equity
AAA
Mezzanine
AAA
BBBBB
B-Note
Equity
AAA
Mezzanine
1980 2017
Deb
t Pro
duct
sG
roun
d Le
ases Equity
Ground Lease
Leasehold Finance
1990 2000
Ground leases have remained stagnant, with no institutional platforms focused on innovation
2010
Pref Equity
Equity
Ground Lease
Leasehold Finance

9Safety, Income & Growth Inc.The Ground Lease Company
Auto Dealerships(2004)
iStar’s History of Inventive Investment Ideas
We have a history of innovative new ideas and understand how to educate the market and to achieve a tipping point.
Hotels post 9/11(2001)Net Lease
(1999)
Starwood Mezzanine, LPMezzanine Capital
(1993)
1990 1995 2000 2005 2010 2015 Current
Timber(2006)
Ground Leases(2017)Data centers post dot-
com crash (2002)
Movie Theaters(2004)
(1998)

10Safety, Income & Growth Inc.The Ground Lease Company
Safety:
GLs Represent a Senior Position in the Capital Structure
(1) Combined Property Value (“CPV”) is the combined value of the land, buildings and improvements relating to a commercial property, as if there were no GL in place at the property.(2) Figure reflects midpoint of SAFE’s targeted GL investment sizing of 30% – 45% of Combined Property Value.
Fee Simple Ownership
Asset Comparison
Tenant37.5% - 100% of CPV (1)
Ground Lease37.5% of CPV(1)(2)
(Last Dollar Exposure)
When compared to fee simple ownership of real estate, GLs occupy a more secure position
100% of CPV (1) (Last Dollar Exposure)
Highest Risk
Lowest Risk

11Safety, Income & Growth Inc.The Ground Lease Company
Safety:
GL Cash Flow Represents a Senior Priority Position
Note: $ in millions.
LowestPriority
Highest Priority
Illustrative P&L Statement for Hypothetical Commercial Real Estate Asset Under a Ground Lease
Ground rent paid to SAFE occupies a senior cash flow priority position
Cas
h Fl
ow P
rior
ity
Property Level Revenue $100
Property Level Expenses:
Real Estate Taxes ($5)
Utilities (10)
Ground Rent to Landlord (SAFE) (15)
Other Operating Expenses (25)
Net Operating Income $45
Interest Expense ($30)
Net Income $15
Capital Expenditures ($5)
Net Cash Flow to Equity $10

12Safety, Income & Growth Inc.The Ground Lease Company
Income Growth:
GLs Generate Growing IncomeContractual rent increases create organic, long-term compounding cash flows
$100 $120$146
$178$216
$264
$322
$392
$478
$583
$696
4.0% 4.8%5.8% 7.1%
8.7%10.6%
12.9%15.7%
19.1%
23.3%
27.9%
$0
$100
$200
$300
$400
$500
$600
$700
0%
10%
20%
30%
40%
50%
1 10 20 30 40 50 60 70 80 90 99
Lease Term Year
Ground Rent GrowthAssuming 2.0% Annual Rent Escalations
Ground Rent
Rent Yield
Note: Reflects an illustrative example of how $100 of initial annual ground rent grows when increased by 1.5% annually over the life of a hypothetical 99-year ground lease.
(1) Illustrative first year ROA reflects the midpoint of SAFE’s targeted investment range of 3.0% - 5.0%.

13Safety, Income & Growth Inc.The Ground Lease Company
Income Growth:
GLs Offer Inflation Protection
Note: Charts reflect an illustrative example with the following assumptions: ROA of 4.0%, annual bumps of 2.0%, leverage of 2.0x debt to equity and fixed-rate liabilities of 3.5%.
5.0%5.0%5.2%
5.5%5.7%
6.0%6.2%
6.5%6.8%
7.1%7.3%
7.6%7.9%
8.2%8.5%
8.8%9.2%
3%
4%
5%
6%
7%
8%
9%
10%
11%
Star
t 1 2 3 4 5 6 7 8 9 10 11 12 13 14 15
Lease Term Year
Levered AAACMBS
Levered GroundRent
420 bps (+83%)
increase
4.0%4.0%4.1% 4.2% 4.2% 4.3% 4.4% 4.5% 4.6%4.7%4.8% 4.9% 5.0% 5.1% 5.2% 5.3%5.4%
3%
4%
5%
6%
7%
8%
9%
10%
11%
Star
t 1 2 3 4 5 6 7 8 9 10 11 12 13 14 15
Lease Term Year
AAA CMBS
Ground Rent
Ground leases produce a cash-on-cash growing income stream versus similar risk fixed debt
Adding fixed rate leverage amplifies the bumps

14Safety, Income & Growth Inc.The Ground Lease Company
Capital Appreciation:
Value Bank of $989MM or $54 per Share At the end of the lease, the building returns to SAFE, creating additional
potential value to stockholders
Value Bank is calculated as today’s estimated Combined Property Value (CPV) less SAFE’s Ground Lease Basis(1)
(1) Our ability to recognize value through reversion rights may be limited by the rights of our tenants under some of our ground leases, including tenant rights to purchase the properties or level properties under certain circumstances. See our Current Report on Form 8-K filed with the SEC on February 15, 2018 and “Risk Factors” in our Prospectus, dated June 27, 2017, as updated from time to time in our periodic reports, filed with the SEC, for a further discussion of such tenants rights.
(2) SAFE may utilize management’s estimate of CPV for ground lease investments recently acquired that CBRE has not yet appraised. See our 8-K filed February 15, 2018 with the SEC for additional detail on CBRE’s valuation and our calculation of Value Bank.
$989MM Estimated
Value Bank(CPV – Ground Lease Basis)
$497MM Ground Lease
Basis(Purchase Cost)
$1.5B Total CPV
At 12/31/17
Combined Property Value
Ground Lease Basis
Value Bank
$1,486MM
$497MM
$989MM
CBRE conducts independent appraisals of the CPV of each asset(2)
15Safety, Income & Growth Inc.The Ground Lease Company
Capital Appreciation:
GLs Offer Inflation Protection
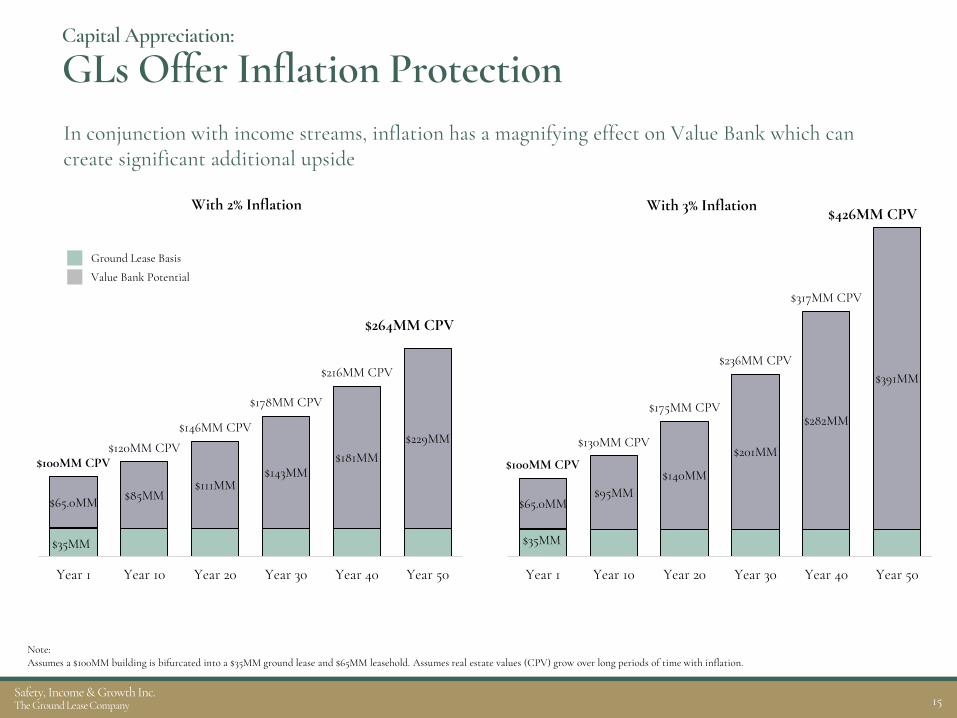
Note: Assumes a $100MM building is bifurcated into a $35MM ground lease and $65MM leasehold. Assumes real estate values (CPV) grow over long periods of time with inflation.
In conjunction with income streams, inflation has a magnifying effect on Value Bank which can create significant additional upside
$35MM
$65.0MM $85MM$111MM
$143MM$181MM
$229MM
$100MM CPV$120MM CPV
$146MM CPV
$178MM CPV
$216MM CPV
$264MM CPV
Year 1 Year 10 Year 20 Year 30 Year 40 Year 50
Ground Lease Basis
Value Bank Potential
$35MM
$65.0MM$95MM
$140MM
$201MM
$282MM
$391MM
$100MM CPV
$130MM CPV
$175MM CPV
$236MM CPV
$317MM CPV
$426MM CPV
Year 1 Year 10 Year 20 Year 30 Year 40 Year 50
With 2% Inflation With 3% Inflation

16Safety, Income & Growth Inc.The Ground Lease Company
The Relative Value

17Safety, Income & Growth Inc.The Ground Lease Company
GLs Offer Attractive Risk-Adjusted ReturnsRelative to First Mortgage Debt
Equity
Leasehold Mortgage
Ground Lease (SAFE)
GL Structure
Equity
First Mortgage
Fee Simple First Mortgage Financing
Attractive Current Rate
Inflation Mitigation
High Grade Debt Risk Profile
Residual Upside
Investment Scorecard:

18Safety, Income & Growth Inc.The Ground Lease Company
GLs Offer Attractive Risk-Adjusted ReturnsRelative to AAA CMBS
Single AssetCMBS
AA
A
BBB
BB
B
Equity
AAA
N/R
Equity
Leasehold Mortgage
Ground Lease (SAFE)
GL Structure
Attractive Current Rate
Inflation Mitigation
High Grade Debt Risk Profile
Residual Upside
Investment Scorecard:

19Safety, Income & Growth Inc.The Ground Lease Company
The Market
20Safety, Income & Growth Inc.The Ground Lease Company
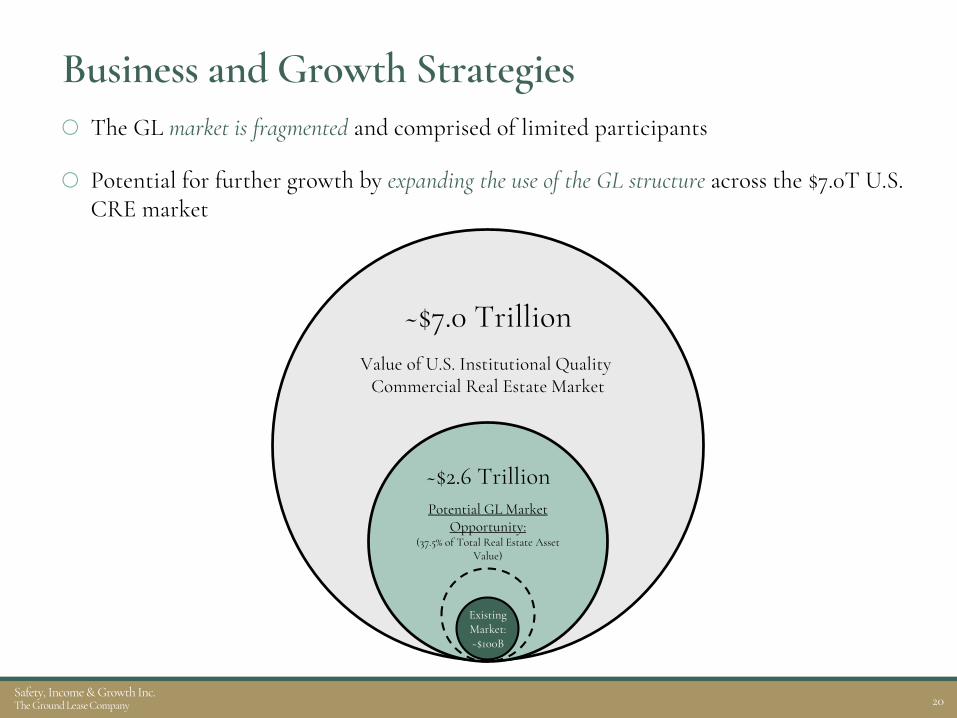
Business and Growth Strategies The GL market is fragmented and comprised of limited participants
Potential for further growth by expanding the use of the GL structure across the $7.0T U.S. CRE market
~$7.0 Trillion
~$2.6 TrillionPotential GL Market
Opportunity:(37.5% of Total Real Estate Asset
Value)
Value of U.S. Institutional Quality Commercial Real Estate Market
Existing Market:~$100B

21Safety, Income & Growth Inc.The Ground Lease Company
Origination Methods
1. Acquisition Purchase existing ground lease in whole or in part.
2. ManufactureCreate ground lease upon clients’ acquisition, recapitalization, or partner buyout.
3. DevelopmentCreate ground lease at commencement of construction based on improved land value.
4. BifurcateSAFE buys an existing building itself, sells or brings in third party equity partner on the leasehold, and retains the ground lease.

22Safety, Income & Growth Inc.The Ground Lease Company
Disciplined Investment CriteriaWe generally intend to target GLs that meet some or all of the following investment criteria:
(1) Combined Property Value (“CPV”) is the combined value of the land, buildings and improvements relating to a commercial property, as if no GL was in place at the property.(2) Ground Rent Coverage is the ratio of the underlying property cash NOI (excluding ground rent) to the annual base ground rent due under the GL for the initial twelve month period of the GL.
Investment Size $20MM - $250MM (with the ability to execute larger deals)
Locations High-barriers-to-entry major metropolitan areas
Cap Rate First-year rent yields of 3.0% - 5.0%
Exposure to Property Initially 30% - 45% of CPV(1)
Ground Rent Coverage(2) 2.0x to 5.0x for the first year of the lease
Initial Lease Term 30 to 99 years
Rent Escalators Periodic fixed or CPI-escalators or percent rent participations

23Safety, Income & Growth Inc.The Ground Lease Company
Onyx on First
1100 First St. SE – Washington, D.C.Date Closed 1/25/18
Asset Description A luxury 14-story multi-family property containing 266 units in Washington, D.C. The property, constructed in 2008, is well-located in the Navy Yard neighborhood, one block from the Navy Yard metro station and a short walk to Nationals Park.
Source Newly created SAFE Ground LeaseTM to enable client acquisition of property.
Purchase Price $38.5MM
Rent Escalation Structure Fixed annual escalations + capped CPI lookbacks
Basis as % of CPV(1) 39%
Going In Ground Rent Coverage 3.2x
Lease Term Remaining 99 Years
(1) See Glossary for definition of CPV (Combined Property Value).

24Safety, Income & Growth Inc.The Ground Lease Company
How a SAFE Ground Lease™ Maximizes Returns
$48.1M Agency Loan (74% LTV)T+200 Pricing
10yr Term (2 years I/O)
$16.9M Equity
SAFE Ground Lease™$35.0M GL
4.0% Initial Yield
Property
$75.0M Agency Loan (75% LTV)T+200 Pricing
10yr Term (2 years I/O)
$25.0M Equity $5.25M NOI5.25% Cap Rate$100.0M Value
Before With a SAFE Ground Lease ™
Same Purchase PriceLess Equity Needed
Better DSCR on Leasehold LoanBetter Cash-on-Cash Returns
$100.0$16.91.67x9.1%
$100.0$25.01.46x6.6%
Fee
Sim
ple
Cap
Sta
ck $
100.
0MLeasehold C
ap Stack $65.0M
The Power of a SAFE Ground Lease™

25Safety, Income & Growth Inc.The Ground Lease Company
ThePortfolio

26Safety, Income & Growth Inc.The Ground Lease Company
Asset Summary
Note: Portfolio as of 12/31/17†Park Hotels Portfolio Asset which is on a single master lease.(1) A majority of the land underlying this property is owned by a third party and is ground leased to us through 2044 subject to changes in the CPI; however, our tenant pays this cost directly to the third party.(2) Calculated using Estimated Underlying Property NOI.(3) Underlying Property NOI source: Prospectus, dated December 14, 2017, of the Wells Fargo Commercial Mortgage Trust 2017-C42.(4) Underlying Property NOI is based on TTM September 30, 2017 figures.(5) Coverage negatively impacted in current quarter due to ongoing renovations.
PropertyLocation
(MSA) Property TypeLease Expiration /
As ExtendedRent Escalation
StructureGround Rent
Coverage
6201 Hollywood (North) Los Angeles, CA Multi-Family 2104 / 2104 % of CPI >6.0x(2)
6200 Hollywood (South) Los Angeles, CA Multi-Family 2104 / 2104 % of CPI >5.4x(2)
Doubletree Seattle Airport(1)† Seattle, WA Hospitality 2025 /2035 % Rent 3.2x
One Ally Center Detroit, MI Office 2114 / 2174 Fixed w/ Inflation Protection 6.0x(3)
Hilton Salt Lake† Salt Lake City, UT Hospitality 2025 / 2035 % Rent 3.7x
LifeHope Medical Campus Atlanta, GA Office 2116 / 2176 Fixed 3.5x(2)
Doubletree Mission Valley† San Diego, CA Hospitality 2025 / 2035 % Rent 5.4x
Doubletree Durango† Durango, CO Hospitality 2025 /2035 % Rent 3.3x
Doubletree Sonoma† San Francisco, CA Hospitality 2025 / 2035 % Rent 5.5x
Northside Forsyth Hospital Medical Center Atlanta, GA Office 2115 / 2175 Fixed w/ Inflation Protection 3.0x(2)
Dallas Market Center: Sheraton Suites Dallas, TX Hospitality 2114 / 2114 Fixed 2.3x(4)(5)
The Buckler Apartments Milwaukee, WI Multi-Family 2112 / 2112 Fixed 9.2x(2)
NASA/JPSS Headquarters Washington, D.C. Office 2075 / 2105 Fixed 4.9x
Lock Up Self Storage Facility Minneapolis, MN Industrial 2037 / 2037 Fixed 6.6x(4)
Dallas Market Center: Marriott Courtyard Dallas, TX Hospitality 2026 / 2066 % Rent 17.9x(4)
Total / Weighted Avg. 49 / 67 yrs 4.7x

27Safety, Income & Growth Inc.The Ground Lease Company
Geographic Diversification by MSA
Note: Percentages based on total Ground Lease Basis of $497 million.
Seattle
14.6%
11.3%
18.3%
Detroit
Salt Lake City
6.5%
San Diego
4.4%
San Francisco
4.1%
Durango
2.8%
Dallas
5.6%
Atlanta
1.9%
Washington
1.6%
Milwaukee
28.6%
Los Angeles
0.4%
Minneapolis
28Safety, Income & Growth Inc.The Ground Lease Company
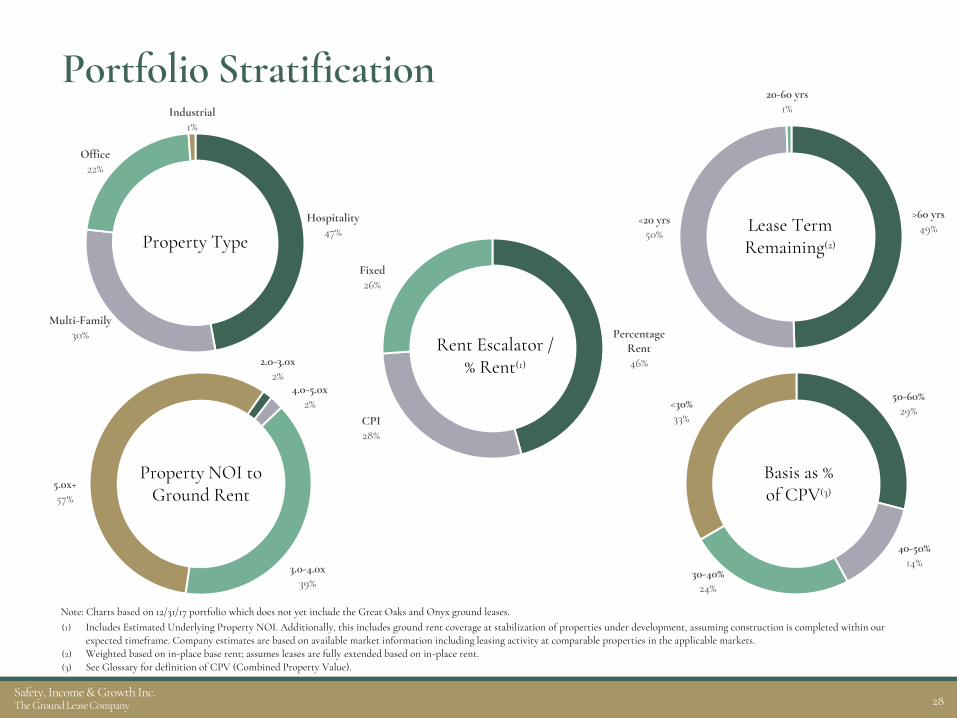
2.0-3.0x2%
4.0-5.0x2%
3.0-4.0x39%
5.0x+57%
>60 yrs49%
<20 yrs50%
20-60 yrs1%
Property NOI to Ground Rent
50-60%29%
40-50%14%
30-40%24%
<30%33%
Hospitality47%
Multi-Family30%
Office22%
Industrial1%
Portfolio Stratification
(1) Includes Estimated Underlying Property NOI. Additionally, this includes ground rent coverage at stabilization of properties under development, assuming construction is completed within our expected timeframe. Company estimates are based on available market information including leasing activity at comparable properties in the applicable markets.
(2) Weighted based on in-place base rent; assumes leases are fully extended based on in-place rent.(3) See Glossary for definition of CPV (Combined Property Value).
Property Type
Basis as % of CPV(3)
Lease Term Remaining(2)
Percentage Rent46%
CPI28%
Fixed26%
Rent Escalator / % Rent(1)
Note: Charts based on 12/31/17 portfolio which does not yet include the Great Oaks and Onyx ground leases.

29Safety, Income & Growth Inc.The Ground Lease Company
Portfolio Breakdown
Annualized Base Rent $20.2MM
Prior Year % rent $3.2MM
Total cash rent $23.4MM
Total GAAP rent (including TTM % rent) $29.5MM
Total cash rent as % of total ground leases 4.7%
Total GAAP rent as % of total ground leases 5.9%
W.A. Fixed Rent Escalations 1.6%
Note: Table based on 12/31/17 portfolio which does not yet include the Great Oaks and Onyx ground leases.
Rent Statistics
Ground lease basis as % of CPV 33.4%
Underlying Property NOI to ground rent coverage 4.67x
W.A. lease term remaining 49 years
W.A. lease term remaining including extensions 67 years
Total ground lease basis $497MM
Ground Lease Structure

30Safety, Income & Growth Inc.The Ground Lease Company
Office46%
Multifamily35%
Mixed Use8%
Hotel7%
Industrial4%
Create93%
Acquire7%
New York34%
Washington D.C.16%
Atlanta13%
Chicago9%
Phoenix6%
San Francisco4%
Orlando2% Miami
2%
Various14%
Pipeline (as of Feb 13)
$962MM Pipeline (24 Deals)
Location (MSA)
Under Review$792MM
16 Deals
On-going Negotiation$98MM
4 Deals
Under LOI$72MM 4 Deals
Note: There can be no assurance that SAFE will acquire or originate any of the investments currently being pursued on favorable terms or at all. Percentages are based on estimated ground lease value.
PropertyType
Sourcing Strategy
31Safety, Income & Growth Inc.The Ground Lease Company
CompanyDetails

32Safety, Income & Growth Inc.The Ground Lease Company
Balance Sheet StrategyIllustrative Financing Scenario
Maintain a strong equity profile and an appropriately leveraged balance sheet
An initial target leverage of approximately 25% of the Combined Property Value(1) and maintain an overall corporate debt to equity ratio of approximately 2.0x
(1) Combined Property Value (“CPV”) is the combined value of the land, buildings and improvements relating to a commercial property, as if there were no GL in place at the property.(2) Represents the average total debt divided the total market capitalization across equity REITs in Q3 2017 (as reported by NAREIT in December 2017’s Monthly REITWatch Report).
CRE Property
Equity REITDebt
GL (SAFE)
SAFE Debt
100% CPV
37.5% CPV
25% CPV
31.7% of TMC(2)

33Safety, Income & Growth Inc.The Ground Lease Company
Interest Rate ProtectionAs of December 31, 2017
Short-TermHedges
Start Date Term Notional
($MM)
Blended Hedge Rate
Total 8/1/17 3Y $105 1.69%
Long-TermHedges
Start Date Term Notional
($MM)
Blended Hedge Rate
Total 10/1/20 10Y $127 2.63%
In addition to $227M of existing fixed rate debt that matures in 2027, SAFE enters into 12-13 year hedging contracts to mitigate the impact of interest rate fluctuations on its floating rate debt
2.74%
1.69%
0.00%
0.50%
1.00%
1.50%
2.00%
2.50%
3.00%
3/1/2018 3/1/2019 3/1/2020
Short-Term Hedges
1mo LIBOR Curve Blended Hedge Rate
In the money In the money
2.00%
2.25%
2.50%
2.75%
3.00%
3.25%
3.50%Long Term Hedges
10-Yr Forward Curve Blended Hedge Rate

34Safety, Income & Growth Inc.The Ground Lease Company
Overview of Manager: iStar (NYSE: STAR)
Note: As of 12/31/17.(1) $ in millions. Figures based on carrying value of the company’s total investment portfolio, gross of accumulated depreciation and general loan loss reserves and assumes market value of SAFE investment.
iStar (NYSE: STAR) brings experience built on $35B of real estate finance and investment deals over the past two decades
National platform with 8 regional offices and 190 employees
Largest shareholder of SAFE (39.9% of shares outstanding)
Current iStar Investment Portfolio (1) Fully Integrated Platform
White Space
Underwriting
Structure / Legal / Tax
Credit
Construction
Design
Servicing
Capital Markets
Risk Management
Leasing
Asset Management
Relationships / JV
Development
Net LeaseFinance
MarketingDigitalNLA
$1,229 29%
SAFE$120 3%
RE Finance$1,318 31%
Land$933 22%
Operating Property
$629 15%
Strategic Investments
$14 0%
PortfolioBreakdown

35Safety, Income & Growth Inc.The Ground Lease Company
Stockholder-Friendly Management Contract
Manager Wholly owned subsidiary of iStar Inc.
Management Fee 1.0% of total shareholder’s equity (1) (up to $2.5B)0.75% of total shareholder’s equity (1) (> $2.5B)
Management Fee ConsiderationPayment will be in SAFE stock (at the greater of the volume weighted average market price of our stock during the quarter for which the fee is being paid or the IPO price)
Lock-up Restriction from selling common stock received for management fees for 2 years from the date of such issuance (2)
Management Fee Waiver No management fee paid to manager during first year
Incentive Fee None (alignment as largest shareholder)
Term 1 Year
Renewal Provision Annual renewal to be approved by majority of SAFE independent directors
Termination Fee None
(1) Based on the total stockholder’s equity.(2) Such restriction will terminate at the effective date of the termination of the management agreement.
Best-in-class management contract and fee arrangement to support growth

36Safety, Income & Growth Inc.The Ground Lease Company
Stockholder Friendly Corporate Governance
(1) iStar will not acquire, originate, invest in, or provide financing for a third party’s acquisition of, a GL unless it has first offered that opportunity to SAFE. The exclusivity agreement will not apply to opportunities that include only an incidental interest in GLs or opportunities to manufacture or otherwise create a GL from a property that has been owned by iStar’s existing net lease venture with GIC for at least three years after the closing of the offering.
(2) Board may not adopt a stockholder rights plan without majority stockholder approval, except if the Board determines that seeking stockholder approval will not be in the best interests under the then existing circumstances. If a stockholder rights plan is adopted by the board without prior stockholder approval, such plan will expire on the next annual stockholders meeting held after the first anniversary of the adoption of such plan
Board of Directors Corporate Governance
Majority Independent Board Opted out of the MGCL Business Combination Act
Non-staggered Board Opted out of the MGCL Control Share Act
Lead Independent Director Opted out of MUTA
Exclusivity agreement with iStar will provide SAFE with a first look at GL investments (1) No stockholder rights plan (2)
Strong corporate governance model facilitates corporate accountability and stockholder alignment
37Safety, Income & Growth Inc.The Ground Lease Company
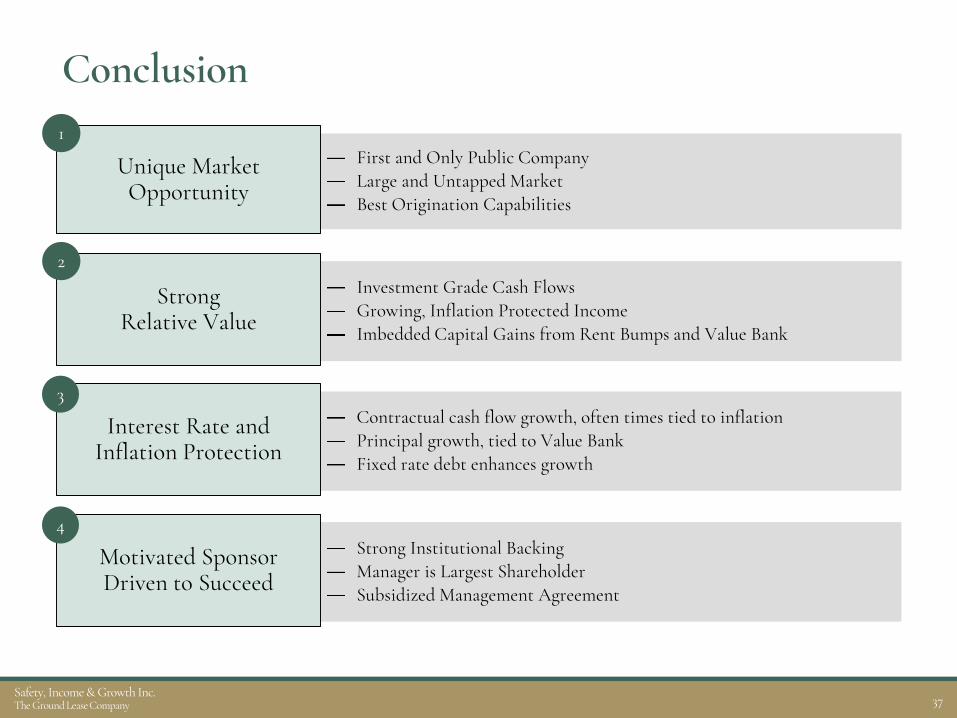
Conclusion
First and Only Public CompanyLarge and Untapped MarketBest Origination Capabilities
Unique Market Opportunity
Investment Grade Cash FlowsGrowing, Inflation Protected IncomeImbedded Capital Gains from Rent Bumps and Value Bank
StrongRelative Value
Strong Institutional BackingManager is Largest ShareholderSubsidized Management Agreement
Motivated Sponsor Driven to Succeed
1
2
4
Contractual cash flow growth, often times tied to inflationPrincipal growth, tied to Value BankFixed rate debt enhances growth
Interest Rate and Inflation Protection
3
38Safety, Income & Growth Inc.The Ground Lease Company
PortfolioValuation

39Safety, Income & Growth Inc.The Ground Lease Company
How to Value SAFE’s Portfolio
Two Separate Components of Portfolio Valuation:
This represents SAFE’s view of a useful methodology to value its portfolio. There may be other methodologies that should be considered. These valuation methodologies relate only to SAFE’s assets and should not be construed as measures of SAFE’s liquidity or performance.
1. PV of Portfolio Rent (PVPR)
Present value of rental payments assuming 30 years of rent with a sale of the GL at the going-in cap rate. (Based on discount rates for each future period payment provided by U.S. Treasury every month.)
2. Value Bank (VB)
Fee simple, spot value of the underlying properties within the portfolio, based on CBRE appraisal or recent acquisition price, less the aggregate amountpaid for the ground.
40Safety, Income & Growth Inc.The Ground Lease Company
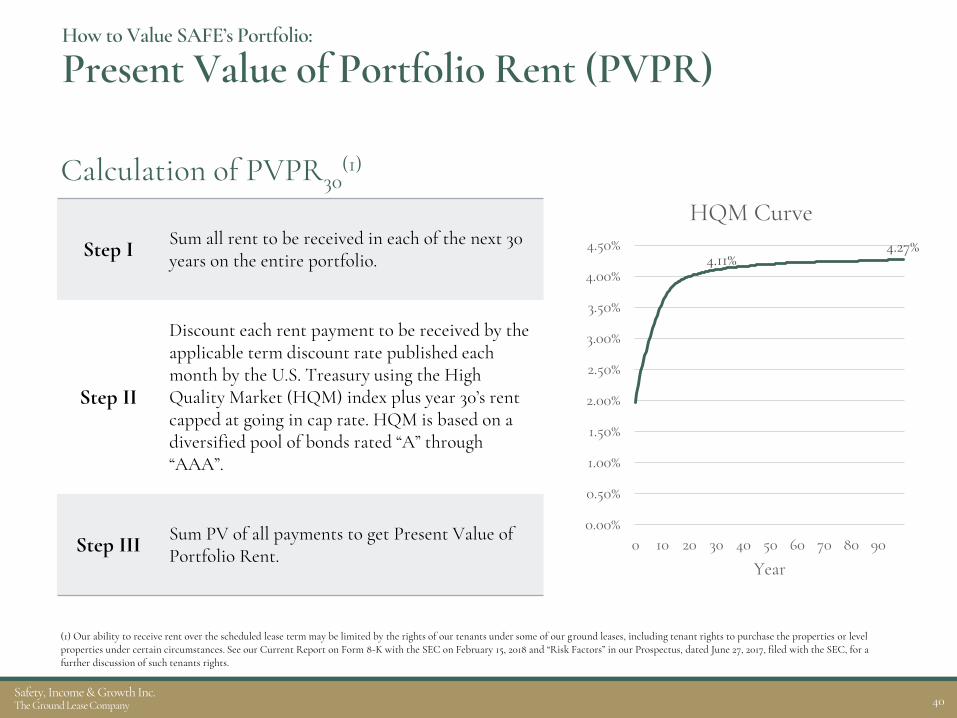
Calculation of PVPR30(1)
(1) Our ability to receive rent over the scheduled lease term may be limited by the rights of our tenants under some of our ground leases, including tenant rights to purchase the properties or level properties under certain circumstances. See our Current Report on Form 8-K with the SEC on February 15, 2018 and “Risk Factors” in our Prospectus, dated June 27, 2017, filed with the SEC, for a further discussion of such tenants rights.
Step I Sum all rent to be received in each of the next 30 years on the entire portfolio.
Step II
Discount each rent payment to be received by the applicable term discount rate published each month by the U.S. Treasury using the High Quality Market (HQM) index plus year 30’s rent capped at going in cap rate. HQM is based on a diversified pool of bonds rated “A” through “AAA”.
Step III Sum PV of all payments to get Present Value of Portfolio Rent.
How to Value SAFE’s Portfolio:
Present Value of Portfolio Rent (PVPR)
4.11%4.27%
0.00%
0.50%
1.00%
1.50%
2.00%
2.50%
3.00%
3.50%
4.00%
4.50%
0 10 20 30 40 50 60 70 80 90
Year
HQM Curve

41Safety, Income & Growth Inc.The Ground Lease Company
Calculation of Portfolio VB(1)(2):
(1) Our ability to recognize value through reversion rights may be limited by the rights of our tenants under some of our ground leases, including tenant rights to purchase the properties or level properties under certain circumstances. See our Current Report on Form 8-K filed with the SEC on February 15, 2018 and “Risk Factors” in our Prospectus, dated June 27, 2017, filed with the SEC, for a further discussion of such tenants rights.(2) SAFE may utilize management’s estimate of CPV for ground lease investments recently acquired that CBRE has not yet appraised. See our 8-K filed October 26, 2017 with the SEC for additional detail on CBRE’s valuation and our calculation of Value Bank.
Step I
CBRE appraises fee simple, spot value for all properties in portfolio assuming they are not subject to a ground lease(Combined Property Value or CPV)
Step II Subtract SAFE’s aggregate purchase price of ground leases.
How to Value SAFE’s Portfolio:
Value Bank (VB)
$989MMValue Bank
(CPV – Ground Lease Basis)
$497MM Ground Lease
Basis(Purchase Cost)
$1.5B Total CPV
At 12/31/17

42Safety, Income & Growth Inc.The Ground Lease Company
How to Value SAFE’s Portfolio:
Current Valuation
Note: Utilizes HQM from January 31, 2018.
PV of Portfolio Rent:(PVPR30)
$667MM
Value Bank (VB) $989MM
$989MM(Value Bank)
$497MM Ground Lease
Basis
Reverts to GLat the end ofthe lease
$170MMPVPR in Excess of GL Basis
1
2
Ground Lease Basis (Historical Cost) $497MM
SAFE Paid
SAFE Gets

43Safety, Income & Growth Inc.The Ground Lease Company
Case Studies

44Safety, Income & Growth Inc.The Ground Lease Company
Case Study: Regency Lakeview & Pershing Point
(1) Represents management’s estimate of the leasehold development cost.
11000 Regency Pkwy, Cary, NC 1375 Peachtree Street NE, Atlanta, GA
Date Closed 2/26/18 2/28/18
Asset DescriptionA two-building office campus comprising 376K square feet on 27 acres located in the vibrant “research triangle” between Raleigh, Durham and Chapel Hill.
A 7-story, 410K square foot office building in midtown Atlanta with excellent access to I-75, I-85 and GA-400 via the Peachtree Steet Connector.
Source SAFE Ground LeaseTM - Recapitalization SAFE Ground LeaseTM - Acquisition
Purchase Price $20 MM $30 MM
Rent Escalation Structure 2.0% / yr with 10 year CPI lookbacks, capped 3.25% per yr 2.0% / yr with 10 year CPI lookbacks
Basis as % of CPV(1) 24% 29%
Going In Ground Rent Coverage 5.15x 5.15x
Lease Term Remaining 99 Years 99 Years

45Safety, Income & Growth Inc.The Ground Lease Company
Case Study: Forward Commitment on Great Oaks
Raleigh Road & Via del Oro – San Jose, CA
Date Closed 10/17/17
Asset Description A luxury multi-family project containing 301 units currently under construction in San Jose, CA with an expected completion in December 2019.
Source Newly created SAFE Ground LeaseTM to enable ground-up development.
Forward Commitment SAFE has committed to purchase the ground lease from iStar(1) on November 1, 2020. iStar owns the land until that time and is the construction lender to the tenant.
Purchase Price $34.0MM
Rent Escalation Structure Fixed annual escalations
Basis as % of CPV(2) 26%
Stabilized Ground Rent Coverage(3) > 5.0x
Lease Term Remaining at SAFE acquisition 96 Years
(1) Transaction approved by the independent members of the Board of Directors of both SAFE and iStar.(2) See Glossary for general definition of term. Here, basis refers to the agreed upon future purchase price of $34.0MM and the Company’s current estimate of CPV.(3) Estimated ground rent coverage at stabilization, assuming construction is completed within our expected timeframe. Estimates are based on available market information including leasing activity at comparable properties in the market.
Note: Represents rendering of future construction.

46Safety, Income & Growth Inc.The Ground Lease Company
Case Studies: 6200 & 6201 Hollywood Blvd.
(1) Represents management’s estimate of the leasehold development cost.
6201 Hollywood Blvd., Los Angeles 6200 Hollywood Blvd., Los Angeles
Asset DescriptionNewly constructed multi-family building with 535 units, 71K SF ground floor retail space, and 1,300 below gradeparking spaces
Expected 1H’18 delivery of multi-family building with ~507 units, 56K SF ground floor retail space, and 1,237 below grade parking spaces
Origination Method Acquisition Acquisition
Purchase Price $68.4MM $73.6MM
Current Rent $2.4MM $2.6MM
Estimated Leasehold Development Cost (1) ~$200.0MM ~$250.0MM
Basis as % of CPV < 25% < 25%
Projected Stabilized Ground Rent Coverage > 5.0x > 5.0x
Rent EscalationsRent adjusts every 4 years based on a % of CPI with rent resets in 2059 and 2079 based on % of FMV of improvedland
Rent adjusts every 4 years based on a % of CPI with rent resets in 2058 and 2078 based on % of FMV of improvedland
Next Escalation 2/1/2019 5/1/2018
Lease Term Remaining 87 Years (Expires 2104) 87 Years (Expires 2104)

47Safety, Income & Growth Inc.The Ground Lease Company
Case Study: LifeHope Medical Campus
3333 Old Milton Parkway – Alpharetta, GA
Asset Description A 117K rsf, 6-story medical office building on 10.2 acres. The property will be renovated and converted into a class-A building, which is currently expected to take 12+ months.
Source New origination from repeat customer
Purchase Price $16.0MM
Initial Rent / Cap Rate $880k / 5.5%
Rent Escalations Rent adjusts annually with a fixed 2.0% increase
Basis as % of CPV(1) 33%
Projected Stabilized Ground Rent Coverage > 3.5x (grows to 4x in Year 2)
Lease Term Remaining 99 Years (Expires 2116)
Leasehold Property 100% pre-leased to sub-tenants with weighted average term of 17 years
Affiliate Transaction Leasehold finance provided by iStar
(1) CPV is Combined Property Value based on management’s estimate. Recently acquired and has not yet been reviewed by CBRE. Basis refers to SAFE’s historical cost basis in its ground leases. See Glossary.

48Safety, Income & Growth Inc.The Ground Lease Company
Case Study: Park Hotels Portfolio
897027_1.WOR (NY008KEU)
Durango, CODurango, CODurango, CODurango, CODurango, CODurango, CODurango, CODurango, CODurango, CODurango, CODurango, CODurango, CODurango, CODurango, CODurango, CODurango, CODurango, CODurango, CODurango, CODurango, CODurango, CODurango, CODurango, CODurango, CODurango, CODurango, CODurango, CODurango, CODurango, CODurango, CODurango, CODurango, CODurango, CODurango, CODurango, CODurango, CODurango, CODurango, CODurango, CODurango, CODurango, CODurango, CODurango, CODurango, CODurango, CODurango, CODurango, CODurango, CODurango, CO
Salt Lake City, UTSalt Lake City, UTSalt Lake City, UTSalt Lake City, UTSalt Lake City, UTSalt Lake City, UTSalt Lake City, UTSalt Lake City, UTSalt Lake City, UTSalt Lake City, UTSalt Lake City, UTSalt Lake City, UTSalt Lake City, UTSalt Lake City, UTSalt Lake City, UTSalt Lake City, UTSalt Lake City, UTSalt Lake City, UTSalt Lake City, UTSalt Lake City, UTSalt Lake City, UTSalt Lake City, UTSalt Lake City, UTSalt Lake City, UTSalt Lake City, UTSalt Lake City, UTSalt Lake City, UTSalt Lake City, UTSalt Lake City, UTSalt Lake City, UTSalt Lake City, UTSalt Lake City, UTSalt Lake City, UTSalt Lake City, UTSalt Lake City, UTSalt Lake City, UTSalt Lake City, UTSalt Lake City, UTSalt Lake City, UTSalt Lake City, UTSalt Lake City, UTSalt Lake City, UTSalt Lake City, UTSalt Lake City, UTSalt Lake City, UTSalt Lake City, UTSalt Lake City, UTSalt Lake City, UTSalt Lake City, UT
Seattle, WASeattle, WASeattle, WASeattle, WASeattle, WASeattle, WASeattle, WASeattle, WASeattle, WASeattle, WASeattle, WASeattle, WASeattle, WASeattle, WASeattle, WASeattle, WASeattle, WASeattle, WASeattle, WASeattle, WASeattle, WASeattle, WASeattle, WASeattle, WASeattle, WASeattle, WASeattle, WASeattle, WASeattle, WASeattle, WASeattle, WASeattle, WASeattle, WASeattle, WASeattle, WASeattle, WASeattle, WASeattle, WASeattle, WASeattle, WASeattle, WASeattle, WASeattle, WASeattle, WASeattle, WASeattle, WASeattle, WASeattle, WASeattle, WA
Rohnert Park, CARohnert Park, CARohnert Park, CARohnert Park, CARohnert Park, CARohnert Park, CARohnert Park, CARohnert Park, CARohnert Park, CARohnert Park, CARohnert Park, CARohnert Park, CARohnert Park, CARohnert Park, CARohnert Park, CARohnert Park, CARohnert Park, CARohnert Park, CARohnert Park, CARohnert Park, CARohnert Park, CARohnert Park, CARohnert Park, CARohnert Park, CARohnert Park, CARohnert Park, CARohnert Park, CARohnert Park, CARohnert Park, CARohnert Park, CARohnert Park, CARohnert Park, CARohnert Park, CARohnert Park, CARohnert Park, CARohnert Park, CARohnert Park, CARohnert Park, CARohnert Park, CARohnert Park, CARohnert Park, CARohnert Park, CARohnert Park, CARohnert Park, CARohnert Park, CARohnert Park, CARohnert Park, CARohnert Park, CARohnert Park, CA
San Diego, CASan Diego, CASan Diego, CASan Diego, CASan Diego, CASan Diego, CASan Diego, CASan Diego, CASan Diego, CASan Diego, CASan Diego, CASan Diego, CASan Diego, CASan Diego, CASan Diego, CASan Diego, CASan Diego, CASan Diego, CASan Diego, CASan Diego, CASan Diego, CASan Diego, CASan Diego, CASan Diego, CASan Diego, CASan Diego, CASan Diego, CASan Diego, CASan Diego, CASan Diego, CASan Diego, CASan Diego, CASan Diego, CASan Diego, CASan Diego, CASan Diego, CASan Diego, CASan Diego, CASan Diego, CASan Diego, CASan Diego, CASan Diego, CASan Diego, CASan Diego, CASan Diego, CASan Diego, CASan Diego, CASan Diego, CASan Diego, CA
DoubleTree Seattle Airport850 rooms
Built: 1969 / Renovated: 2011
DoubleTree Sonoma245 rooms
Built: 1987 / Renovated: 2016
DoubleTree Mission Valley300 rooms
Built: 1991 / Renovated: 2012
Hilton Salt Lake499 rooms
Built: 1983 / Renovated: 2012
DoubleTree Durango159 rooms
Built: 1986 / Renovated: 2009

49Safety, Income & Growth Inc.The Ground Lease Company
Case Study: Park Hotels Portfolio GL Tenant: Park Hotels & Resorts (NYSE: PK)
GL Origination Method: Acquisition (1997)
Base Rent Coverage: Property generates $39MM of NOI before rent (3.99x coverage) (1)
GL Rent:
Annual Base Rent: $9.9MM (2)
Percentage Rent: $3.0MM (3)
Basis:
~$109k per key / 1,953 keys
Lease Expiration: 2025
Plus two 5-year extensions (2035 fully extended)
First Full Value Bank realization opportunity (4)
(1) Ground Rent Coverage is the ratio of the underlying property cash NOI (excluding ground rent and FF&E) to the annualized base ground rent in place as of March 31, 2017, in the aggregate for the Park Hotels Portfolio.
(2) Yearly annual base rent throughout the lease term on the Park Hotels Portfolio. (3) In November 2016, the master lease governing the Park Hotels Portfolio was amended to change the look back period for which annual percentage rent is computed from the trailing twelve
months ended September 30th to the trailing twelve months ended December 31st. In March 2017, the Company recorded $0.5 million of income representing a one-time stub payment of percentage rent for the 3 months ended December 31st, 2016, to account for the change in the look back period. The aggregate $3.0 million percentage rent shown above for the hotels comprising the Park Hotels Portfolio excludes the one time $0.5 million stub period payment.
(4) SAFE owns a leasehold (tenant) position on the land underlying a majority of its DoubleTree Seattle Airport property that expires in 2044.

50Safety, Income & Growth Inc.The Ground Lease Company
Appendix

51Safety, Income & Growth Inc.The Ground Lease Company
Appendix
GlossaryGround Lease Basis Ground Lease Basis is the historical purchase price paid by SAFE to acquire or originate a ground lease.
Combined Property Value (CPV)
The current combined value of the land, buildings and improvements relating to a commercial property, as if there was no GroundLease on the land at the property. CPV is based on independent appraisals by CBRE. The Company will use management estimates for recently acquired and originated ground leases for which appraisals from CBRE are not yet available.
Basis as % of CPV Calculated as our Ground Lease Basis divided by CPV. We believe the metric is an indicative measure of the safety of our position in a real estate property’s capital structure and represents our last-dollar economic exposure to the underlying property values.
Value Bank Calculated as the difference between CPV and Ground Lease Basis. We believe Value Bank represents additional potential value to SAFE stockholders through the reversion rights embedded in standard ground leases.
Ground Rent Coverage
The ratio of the Underlying Property’s NOI to the annualized base rental payment due to us. We believe the metric is indicative of our seniority in a property’s cash flow waterfall. Underlying Property NOI is based on information reported to us by our tenants without an independent investigation or verification by us. We are prohibited from publically disclosing the Underlying Property NOI at One Ally Center pursuant to a confidentiality agreement with the tenant. We have estimated the ground rent coverage for One Ally Center based upon available market information.
Funds from Operations (FFO)
FFO is computed in accordance with the National Association of Real Estate Investment Trusts (NAREIT) which defines FFO as net income (determined in accordance with GAAP), excluding gains or losses from sales of depreciable operating property, plus real estate-related depreciation and amortization.
Adjusted Funds from Operations (AFFO)
Calculated by adding (or subtracting) to FFO the following items: straight-line rental income, the amortization of real estate-related intangibles, stock-based compensation, acquisition costs, non-cash management fees, and expense reimbursements, the amortization of deferred financing costs and other expenses related to debt obligations.
FCCR, as adjusted Fixed Charge Coverage Ratio computed as annualized adjusted EBITDA divided by annualized fixed interest charges.
Adjusted EBITDA Calculated as the sum of annualized AFFO prior to interest expense and the TTM percent rent payments from Park Hotels Portfolio.
Underlying Property NOI
With respect to a property, the net operating income of the commercial real estate being operated at the property without giving effect to any rent paid or payable under our ground lease. Net operating income is calculated as property-level revenues less property-level operating expenses as reported to us by the tenant. We rely on net operating income as reported to us by our tenants without any independent investigation by us. We are prohibited from publically disclosing the Underlying Property NOI at One Ally Center pursuant to a confidentiality agreement with the tenant; therefore, in this presentation we have provided information using an assumed Underlying Property NOI at One Ally Center, we have also presented the same information excluding all assumed Underlying Property NOI at One Ally Center.
Leverage The ratio of book debt to book equity.