the greening of jobs in germanydoku.iab.de/discussionpapers/2018/dp1418.pdfthe transition towards a...
TRANSCRIPT

IAB Discussion Paper 14/2018
ISSN 2195-2663
Markus Janser
Articles on labour market issues
The greening of jobs in Germany First evidence from a text mining based index and employment register data

IAB-Discussion Paper 14/2018 2
The greening of jobs in Germany First evidence from a text mining based index and employment register data
Markus Janser (IAB)
Mit der Reihe „IAB-Discussion Paper“ will das Forschungsinstitut der Bundesagentur für Arbeit den Dialog mit der externen Wissenschaft intensivieren. Durch die rasche Verbreitung von Forschungsergebnissen über das Internet soll noch vor Drucklegung Kritik angeregt und Qualität gesichert werden.
The “IAB-Discussion Paper” is published by the research institute of the German Federal Em-ployment Agency in order to intensify the dialogue with the scientific community. The prompt publication of the latest research results via the internet intends to stimulate criticism and to ensure research quality at an early stage before printing.

IAB-Discussion Paper 14/2018 3
Content
Abstract 4 Zusammenfassung 4 1 Introduction 6 2 Literature review 8 2.1 Definitions and measurement approaches 8
2.2 Descriptive findings on the greenness and greening of jobs 11
2.3 Theoretical framework and previous analytical findings 14
3 Data 17 3.1 Occupational BERUFENET data for basic index development 18
3.2 Statistical data to aggregate at occupational, sectoral and regional level 20
3.3 Administrative micro data for econometric analyses 20
4 The greenness-of-jobs index (goji) 21 4.1 Identification of green tasks by text mining 21
4.2 From green tasks to the employment weighted greenness-of-jobs
index goji 23
5 Descriptive analysis 30 5.1 The greenness-of-jobs index at individual occupation level 31
5.2 The employment-weighted distribution of the greenness and greening
of jobs 40
5.3 The sample for econometric analysis 47
6 Econometric analysis 52 6.1 Empirical approach 52
6.2 Estimation results 54
7 Conclusions 56 References 59 Appendix 66

IAB-Discussion Paper 14/2018 4
Abstract
The transition towards a greener, less carbon-intensive economy leads to a growing demand for green products, services and business processes. In theory, this trend should lead to a greening of jobs, i.e. to an increasing share of environmentally friendly requirements within occupations (greening of occupations) and to a rising la-bor demand for employees in these occupations (greening of employment). Due to a lack of measures, there is no empirical evidence on the relationship between the greening of jobs and the real labor market development so far. To fill this gap, the paper measures, describes and analyzes the greening of jobs and its associations with employment and wage growth. The cornerstone of this paper is the new task-based ‘greenness-of-jobs index’ (goji). The goji is derived by performing text mining algorithms on yearly data from 2006 and 2011 to 2016 of BERUFENET, an occupa-tional data base provided by the German Federal Employment Agency. The descrip-tive results of the paper show that there is a notable greening of jobs which varies strongly between sectors and regions. The econometric analysis is based on employ-ment register data from 2011 to 2016. The estimation results reveal that the overall level of greenness of occupations is positively correlated with employment growth. Furthermore, the increase of greenness is related to a slight increase in wage growth.
Zusammenfassung
Der Übergang zu einer grüneren, weniger kohlenstoffintensiven Wirtschaft führt zu einer wachsenden Nachfrage nach umweltfreundlichen Produkten, Dienstleistungen und Prozessen. Theoretisch sollte dieser Trend zu einem Greening of Jobs führen, d.h. zu einem steigenden Anteil an umweltfreundlichen Tätigkeitsanforderungen in-nerhalb von Berufen (Greening of Occupations) und zu einer steigenden Nachfrage nach Beschäftigten, die diese Berufe ausüben (Greening of Employment). Mangels geeigneter Indikatoren gibt es jedoch bislang keine empirischen Belege für einen Zu-sammenhang zwischen dem Greening of Jobs und der realen Arbeitsmarktentwick-lung. Um diese Forschungslücke zu schließen analysiert dieses Papier das Greening of Jobs und dessen Wechselbeziehung mit dem Beschäftigungs- und Lohnwachstum. Der Grundstein des Papiers ist der neue Greenness-of-Jobs Index (goji), der durch Text Mining erschlossen wird. Die Datengrundlage hierfür ist die Online-Datenbank BERUFENET der Bundesagentur für Arbeit. Die deskriptiven Ergebnisse des Papiers zeigen, dass es ein messbares Greening-of-Jobs gibt, das zwischen Sektoren und Regionen stark variiert. Die ökonometrische Analyse basiert auf den administrativen Beschäftigtendaten von 2011 bis 2016. Die Ergebnisse der Schätzungen zeigen, dass der Anteil umweltschutzrelevanter Tätigkeitsinhalte (Greenness) von Berufen positiv mit deren Beschäftigungswachstum korreliert ist. Darüber hinaus ist das Wachstum dieses Anteils mit einem leichten Anstieg des Lohnwachstums verbunden.
JEL-Klassifikation: J23, J24, O33, Q55, R23
Keywords: human capital, occupational tasks, structural change, labor market out-comes, green jobs, text mining

IAB-Discussion Paper 14/2018 5
Acknowledgements: I would like to thank Uwe Blien, Linda Borrs, Katharina Dengler, Johann Eppelsheimer, Jens Horbach, Florian Lehmer, Britta Matthes, and Michael Stops for many valuable comments. Further thanks go to the members of the IAB research units “Regional Labor Markets”, “Research Group of the Director” and the IAB Working Group “Occupations” as well as to the colloquium participants at the University of Regensburg for helpful feedback. Moreover, I am grateful to the partici-pants of the conference “GCW 2016 - Innovation, Employment and the Environment” of the Eurkind research network in Valencia, the European Regional Science Associ-ation Congress 2016 in Vienna, the Umeå University Conference on Mobility, Eco-nomic Transformation and Regional Growth 2017 in Stockholm, and the GESIS Con-ference on Data Mining in Job Advertisements 2018 in Cologne for useful discussions and advises.
IAB-Discussion Paper 14/2018 6
1 Introduction
Global environmental challenges such as climate change have led to manifold initia-tives aimed at improving the ecological sustainability of economic activity. These ini-tiatives take place at international (e.g. OECD 2011, UNEP 2011), supranational (e.g. EU 2015), national (e.g. BMBF 2016) and local level (e.g. Stappen/Schels 2002). Moreover, climate protection targets, environmental regulations and changes in con-sumer behavior have intensified the transitions towards a greener, less carbon-inten-sive economy. These structural changes of the economy are supposed to impact the labor market as well. Both organizations and employees have to adapt their practices and integrate new skills. Besides the formation of new occupations, the share of en-vironmentally friendly requirements within occupations is supposed to increase (‘greening of occupations’). The growing demand for green requirements may also lead to a rising labor demand for occupations containing these requirements (‘green-ing of employment’). Together, these two trends form the ‘greening of jobs’, which is analyzed in this paper.
Whereas some studies have already measured the greenness of occupations (as a static parameter) and its associations with employment in countries such as the USA (Deschenes 2013, Peters 2014, Vona et al. 2015, Consoli et al. 2016) and Australia (Annandale et al. 2004), no method has yet been established to measure the green-ness of occupations and its relations with labor demand in Germany. Furthermore, little is known about the extent to which the greening of occupations (as a dynamic parameter) really takes place, how it is distributed and how the greening of occupa-tions is associated with employment growth. To fill these research gaps, the paper has three research objectives: (1) to develop an indicator to measure the greening of occupations in Germany, (2) to describe the occupational, sectoral and regional dis-tribution of the greening of jobs and (3) to examine the relationship between the green-ing of occupations and labor market outcomes such as employment and wages.
The underlying question of the first research objective is ‘What indicator can best be used to analyze the greenness and greening of occupations – given the available data structure in Germany?’ To answer this question, the paper introduces the task-based ‘greenness-of-jobs index’ (goji). For each individual occupation, this index describes the share of the total number of all requirements that are relevant for protecting the environment (‘green tasks’). For the first time, the goji facilitates a task-based meas-urement of the greenness and greening of jobs for the entire range of occupations in Germany. The goji is derived by performing text mining procedures on the German occupations database BERUFENET provided by the Federal Employment Agency. These data are available for the years 2006 and 2011 to 2016. I also use employment statistics data to develop employment-weighted occupational, sectoral and regional goji aggregates. To calculate the goji, I apply and extend approaches by Dengler et al. (2014) and Consoli et al. (2016). The development of the goji is the cornerstone of this paper, because it is necessary for any further analyses on the greening of jobs in this and possibly also in future research. For the first time, the goji facilitates a task-
IAB-Discussion Paper 14/2018 7
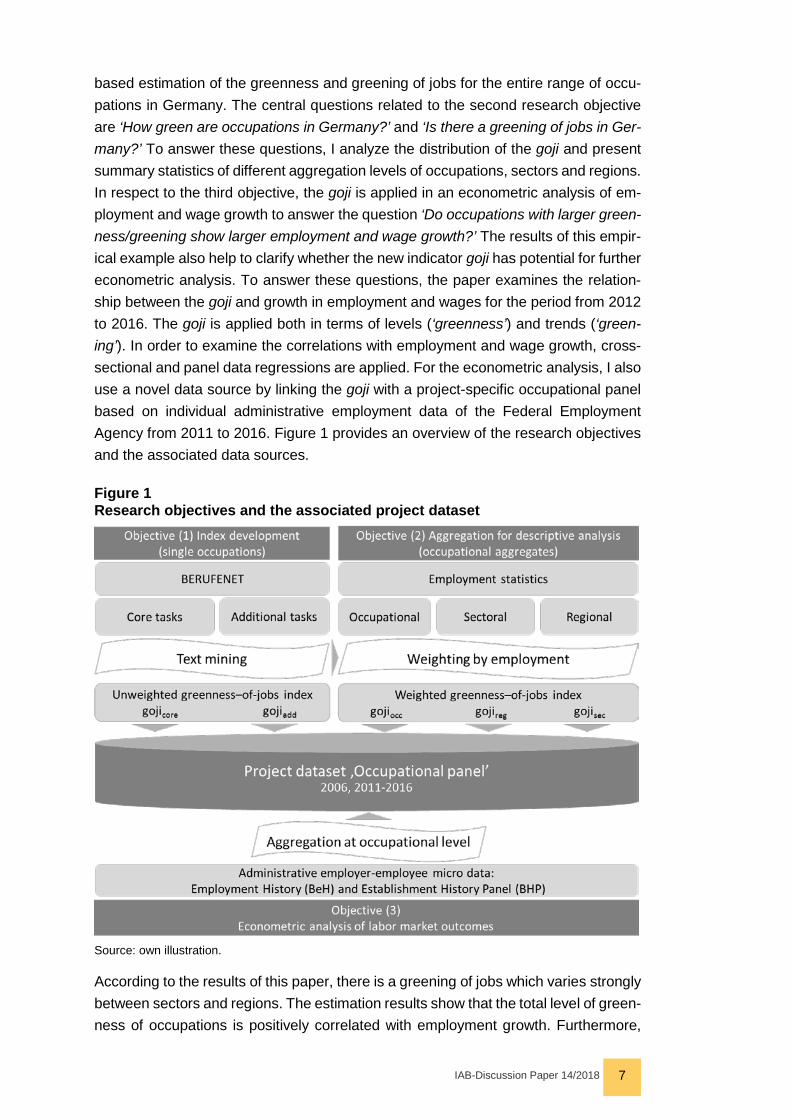
based estimation of the greenness and greening of jobs for the entire range of occu-pations in Germany. The central questions related to the second research objective are ‘How green are occupations in Germany?’ and ‘Is there a greening of jobs in Ger-many?’ To answer these questions, I analyze the distribution of the goji and present summary statistics of different aggregation levels of occupations, sectors and regions. In respect to the third objective, the goji is applied in an econometric analysis of em-ployment and wage growth to answer the question ‘Do occupations with larger green-ness/greening show larger employment and wage growth?’ The results of this empir-ical example also help to clarify whether the new indicator goji has potential for further econometric analysis. To answer these questions, the paper examines the relation-ship between the goji and growth in employment and wages for the period from 2012 to 2016. The goji is applied both in terms of levels (‘greenness’) and trends (‘green-ing’). In order to examine the correlations with employment and wage growth, cross-sectional and panel data regressions are applied. For the econometric analysis, I also use a novel data source by linking the goji with a project-specific occupational panel based on individual administrative employment data of the Federal Employment Agency from 2011 to 2016. Figure 1 provides an overview of the research objectives and the associated data sources.
Figure 1 Research objectives and the associated project dataset
Source: own illustration.
According to the results of this paper, there is a greening of jobs which varies strongly between sectors and regions. The estimation results show that the total level of green-ness of occupations is positively correlated with employment growth. Furthermore,

IAB-Discussion Paper 14/2018 8
the change of greenness is related to a slight increase in wage growth. The results also reveal pronounced differences between the requirements types of core and ad-ditional requirements. The econometric application demonstrates the potential of the new index for further empirical analyses.
This paper is valuable both for the scientific community and for policy purposes: the goji facilitates scientific studies of the greening of jobs in Germany in detail. From a methodological point of view, the application of text mining methods in order to exploit occupational data might be useful for related research questions (e.g. Janser 2018, Janser/Lehmer 2018). The descriptive and analytical results may help to disentangle some relationships between the greenness/greening of jobs and labor market out-comes, which may also be useful for future policy evaluations. Vona et al. (2015: 2) emphasize this potential for policy advice: “… understanding the extent to which greening the economy can induce significant changes in the demand for certain skills and, most cogently, which skills these might be, is crucial to inform policy.” The au-thors also stress that these insights – and thus also the results of the paper in hand – may help to design training policies that meet the changing demands of the labor market and thus enable the labor force to mitigate negative employment impacts that are conventionally associated with environmental regulation (e.g. Becker/Hen-derson 2000; Greenstone 2002).
The paper is organized as follows: Section 2 contains an overview of related literature. The different data sources used in this paper are presented in section 3. Section 4 introduces the greenness-of-jobs index (goji) and shows the development stages from text mining to the employment-weighted goji variations. The occupational, sectoral and regional distribution of greenness and greening is described in section 5. Section 6 covers the econometric analysis of the associations between the greenness / green-ing of jobs and labor market outcomes. Section 7 concludes with a summary and reflections on possible practical or political implications. An online appendix provides further results of the text mining procedure and further descriptive findings.1
2 Literature review
2.1 Definitions and measurement approaches In both science and public statistics, the topic of green jobs has been discussed widely in recent years. However, there is still no common definition and measurement con-cept but, instead, several coexisting approaches. The different concepts can be dif-ferentiated by output-, process- and occupation-based paradigms.
1 A selection of csv files with aggregated goji values is available on request from the
author.
IAB-Discussion Paper 14/2018 9
Output-based approach: identification by goods and services The most common approaches used so far to define and measure green jobs are related to the goods and services of firms or – at an aggregated level – of sectors. Up to now, there are no theoretical papers with a scientific definition of green jobs. Hence, in accordance to empirical green jobs papers (e.g. Deschenes 2013, Peters 2014, Vona et al. 2015, Consoli et al. 2016) I also refer to the common statistical definitions. According to the international System of Environmental-Economic Accounting, the environmental goods and services sector (EGSS) “… consists of a heterogeneous set of enterprises which produce environmental goods and services. Historically, the pro-duction of environmental goods and services focused on the demand for basic ser-vices, such as wastewater treatment and the collection of solid waste. However, with the drive towards cleaner and more resource-efficient processes, products and mate-rials, the activities of the sector have expanded to also include resource management activities.” (UN et al. 2017: 25 in connection with UN et al. 2014). This conception is in line with the EGSS as defined by Eurostat (2016: 8): The EGSS “… comprises all entities in their capacity as 'environmental producers', i.e., undertaking the economic activities that result in products for environmental protection and resource manage-ment. Producers in the EGSS may or may not be specialised in the production of environmental goods and services, and may produce them as principal or secondary activities or produce these products for own use.” As already mentioned in the Euro-stat definition, the main problem of the output-oriented approach is that many firms do not produce or deliver only environmental goods and services. They often follow a multi-purpose strategy (e.g. technical facilities like pump systems that can be applied both in biogas plants and in coal-fired power plants). Here the core question is: Where exactly should the line be drawn between environmental and non-environmental firms, or between environmental and non-environmental employment? It is also diffi-cult to identify the environmental share of employment, as many employees are not only involved in the production of environmental goods and services but also perform work for non-environmental goods and services (in the case of multi-purpose firms). Moreover, the environmental impact of products and services may differ. Neverthe-less, most publications identify labor market outcomes of the greening of the economy based on environmental goods and services (see also US DOL/BLS 2013b, US DOC 2010, and OECD/Cedefop 2014). Most research papers also use output-oriented identification strategies. For instance, Antoni et al. (2015) use the membership data of renewable-energy business associations to identify firms that are active in renew-able-energy value chains. They regard all workers in those firms as renewable-energy workers. Also Lehr et al. (2012), Hillebrand et al. (2006) and others focus on firms related to renewable energies. Becker/Shadbegian (2009) analyze a broader group of firms, namely manufacturers of environmental products, and measure employment in terms of total employment. Horbach/Janser (2016) and Rennings/Zwick (2002) an-alyze employment in the entire environmental goods and services sector. Hor-bach/Janser (2016) identify green employment by equating the turnover in the field of green goods and services with the share of employees involved in the production of

IAB-Discussion Paper 14/2018 10
green goods and services. This approach helps to tackle the issue of multi-purpose firms, but still neglects a large part of integrated environmental protection.
Adding the process perspective Using a process-based approach, it is possible to look beyond this limited goods and services perspective. Process-based perspectives focus on integrated environmental protection and the application of clean technologies and other environmentally friendly practices of business processes within firms. This approach is not regarded as an alternative approach but rather as an additional dimension sometimes included in def-initions of green jobs. For example, an extended definition of green jobs has been developed by the Bureau of Labor Statistics of the U.S. Department of Labor (BLS/DOL 2013a). Their definition involves the basic distinction between output and process. Whereas the output-related approach covers the green goods and services, the process approach “… identifies establishments that use environmentally friendly production processes and practices …” (Sommers 2013: 5). Also Deschenes (2013) uses a mixed approach for his overview about green jobs. Based on the SEEA defi-nition of environmental goods and services, the International Labour Organization (ILO) also emphasizes in their definition of employment in environmental activities the difference between employment in the production of environmental outputs and em-ployment in environmental processes (ILO 2013a, 2013b, 2013c, 2015). The ILO in-troduces an even tighter definition of green jobs by adding a decent work dimension to the environmental dimension (ILO 2013a, 2013b, 2013c, 2015). In the sense of the ILO definition, green jobs include only employment in environmental activities that fulfill the conditions of decent work (decent work indicators according to ILO 2012). Because the issues of measuring decent work would go beyond the scope of this paper, I do not cover this aspect of green jobs here. However, the connection between green jobs and decent jobs remains a worthwhile issue for future research.
Task-based approaches: identification by occupational tasks Peters (2014), Consoli et al. (2016) and Vona et al. (2015) were the first to apply the task-based approach to identify the greenness of jobs. They work with US-American data from the occupational database O*NET. Acemoglu/Autor (2011: 1045) define a task as “… a unit of work activity that produces output (goods and services).” Tasks have to be clearly distinguished from skills. According to Acemoglu/Autor (2011: 1045), a skill is “… a worker’s endowment of capabilities for performing various tasks. Workers apply their skill endowments to tasks in exchange for wages, and skills ap-plied to tasks produce output.” Hence, both worker skills and job tasks can change over time and may be reallocated if skills and/or tasks change within the working con-text. In the remainder of this paper I use a task-based approach to identify the green-ness of jobs in Germany. It is important to note that this paper focuses on the demand side of labor and thus on tasks rather than skills.
Dierdorff et al. (2009: 4), who work with US-American O*NET data, refer to the green-ing of occupations as “… the extent to which green economy activities and technolo-
IAB-Discussion Paper 14/2018 11
gies increase the demand for existing occupations, shape the work and worker re-quirements needed for occupational performance, or generate unique work and worker requirements”. They distinguish between the following types of greening oc-cupations: (1) Green Increased Demand Occupations: the greening of the economy causes increasing demand for existing occupations without significant changes in oc-cupational requirements, (2) Green Enhanced Skills Occupations: greening of the economy leads to significant changes in the occupational requirements of existing occupations – and may or may not lead to increasing labor demand, and (3) Green New and Emerging Occupations: greening of the economy triggers the need for new occupations. Both Green Enhanced Skills Occupations and Green New and Emerging Occupations can be identified by analyzing occupational contents, such as job re-quirements. The European Centre for the Development of Vocational Training has adopted this concept to a large extent (Cedefop 2012).
Similarly to the multi-purpose firms mentioned above, multi-purpose occupations are also a challenge for occupational concepts: most occupations do not include green tasks only. Instead, they include a certain share of environmental protection require-ments as well as non-green tasks. Only a few scientific papers analyze in detail the extent of greenness of jobs (e.g. Peters 2016, Consoli et al 2016, Vona et al. 2015, 2017), whereas almost all the studies on the greenness of jobs look at the US labor market. The focus and main contribution of the paper in hand is to demonstrate a text mining approach to identify Green Enhanced Skills Occupations in Germany, to meas-ure – for the first time – the related changes in occupational requirements over time and to analyze their impacts on employment growth.
2.2 Descriptive findings on the greenness and greening of jobs The following overview of descriptive evidence in literature reflects the predominant use of output-oriented approaches to measure green jobs. Most of the relevant arti-cles still work with a definition of green jobs as employment in the environmental goods and services sector. Therefore, I start with a review of the main papers within this field.
There are two main sources that have been used for previous analysis of green jobs in the German labor market: the IAB Establishment Panel survey conducted by the Institute for Employment Research and the statistical data of the Federal Statistical Office. Both deal with an output-oriented approach to green jobs (‘employment in the environmental goods and services sector’).
Three survey waves of the IAB Establishment Panel – 1999, 2005 and 2012 – include questions about environmental goods and services. There are several studies based on these data including relevant descriptive information for the present paper. Hor-bach/Janser (2016) show that environmental establishments have slightly higher em-ployment growth (+0.6 percentage points from 2009 to 2012) than other establish-ments. Furthermore, they identify marked differences between sub-groups of the en-

IAB-Discussion Paper 14/2018 12
vironmental establishments: the subgroup of ‘environmental remediation, soil conser-vation’ has the highest employment growth from 2009 to 2012 (+16.8 percent), while ‘waste management, recycling’ has the lowest value (+0.6 percent). ‘Climate protec-tion, renewable energies, energy saving’ increased by 6.2 percent, outperforming the average for the entire environmental sector (+4.7 percent). This study of the period from 2009 to 2012 documents a far more positive situation in the environmental sector than Horbach et al. (2009), who examined employment trends from 1999 to 2005. They report a drastic decline in employment in environmental firms dominated by end-of-pipe technologies. However, firms that produce or trade in clean technologies usu-ally have positive employment trends. Looking at the shares of employees with a uni-versity education, environmental establishments employ a larger share (13.4 percent) compared to the total sample of establishments (9.9 percent) (Horbach/Janser 2016). Corresponding to this result, the share of innovative establishments is also higher in the group of environmental establishments (53.4 percent) in comparison with the total sample (40.4 percent). The environmental sector seems also to be affected by labor shortages to a disproportionately large degree (Horbach 2014a).
The current way of estimating the gross employment effects of environmental protec-tion in Germany is based on the method presented by Blazejczak/Edler (2015). The authors estimate environmental employment from the production of environmental goods using a demand-driven approach using input-output methods. They calculate environmental employment from the provision of services using a supply-driven ap-proach based on multiple data sources. One of these data sources is also the IAB Establishment Panel mentioned above. According to this method, 2.2 million people were working for environmental protection in Germany in 2012 (Edler/Blazejczak 2016).
Deschenes (2013), who works with US labor statistics data, finds that – so far – green jobs only account for a small share of total employment in the USA. Over the last ten years, this share has seen relatively weak growth. Elliott/Lindley (2017) describe the distribution of green jobs in the USA in 2010. Not surprisingly, the distribution of green jobs varies widely between the states: measured as a share of total employment North Carolina has the largest share of green jobs, at 5.1 percent, whereas Florida has the smallest share, at 1.6 percent. The spatial distribution of the quantitative development of green jobs is also very heterogeneous, showing both positive and negative values of change in the percentage of green employment (largest increase: Maryland with +0.538 and largest decrease in Minnesota with -0.184). These findings correspond to the studies of Weinstein et al. (2010), Weinstein/Partridge (2010) and Vona et al. (2017), who also describe large heterogeneity between and within US states.
Considering the sectoral distribution, the manufacturing industry has the largest ab-solute number of green jobs in the private economy of the USA (507,168 green jobs) and the financial activities sector is the smallest sector, with 475 green jobs (El-liot/Lindley 2017). According to Elliott/Lindley (2017), measured as a percentage of total employment, the utilities sector is the largest provider of green jobs (12 percent),

IAB-Discussion Paper 14/2018 13
whereas the financial activities sector remains the smallest provider of such jobs (0.002 percent). Using a more detailed (3-digit) industry level, their results reveal that there is also high heterogeneity within sector aggregates, e.g. in manufacturing. In this perspective, ‘construction’ is largest provider of green employment in absolute figures and ‘transit/ground passenger transport’ the largest percentage of green em-ployment (55 percent). As an overall result of their descriptive analysis they conclude that those US states and sectors that were relatively green in 2010 became greener in 2011. Elliott/Lindley (2017) use data from the US American Green Goods and Ser-vices Survey (GGS), which was conducted from 2010 to 2012 before being discontin-ued due to public spending cuts in 20132. The challenge of discontinuous green em-ployment data also exists in Germany in the case of the IAB Establishment Panel survey, which is used in Horbach/Janser (2016).3
Meanwhile, many further studies have been conducted on single countries or groups of countries. Most of them are based on different output-definitions of green jobs, which makes it difficult to compare their results. Literature reviews about these studies are provided by GHK (2009) and Bowen/Kuralbayeva (2015). Horbach et al. (2015) present a comprehensive overview of relevant studies with a focus on employment in a circular economy.4
After summarizing the descriptive evidence from output-oriented green jobs ap-proaches, I continue with the few articles available working with the task-based ap-proach, usually presented on occupational level.
Consoli et al. (2016) work with US-American O*NET data and compare differences between green and non-green occupations in terms of skill contents and human cap-ital. They find that occupations with green tasks require more high-level cognitive skills and interpersonal skills as well as higher levels of formal education, work experience and on-the-job training. Vona et al. (2017) also work with O*NET data and discover that the proportion of green employment is between two and three percent and that
2 In 2013, the Bureau of Labor Statistics (BLS) had to cut its budget as a result of the
national spending cuts due to the Balanced Budget and Emergency Deficit Control Act. The BLS decided to withdraw all "measuring green jobs" products, including data on employment by industry and occupation for businesses that produce green goods and services; data on the occupations and wages of jobs related to green technologies and practices; and green career information publications (Sources: www.bls.gov/ggs/ and www.bls.gov/bls/sequester_info.htm).
3 The questions changed between 2005 and 2012. It is therefore not possible to directly compare the EGSS data of these two years. It is not yet clear whether the EGSS question will be included in the questionnaire again.
4 The concept of the circular economy is part of the sustainability strategy of the European Union (EU 2015) and can be regarded as an essential element of the green economy. The Ellen MacArthur Foundation (2015, p. 5) defines a circular economy as an economy ‘ ... that is restorative and regenerative by design and aims to keep products, components, and materials at their highest utility and value at all times, distinguishing between technical and biological cycles.’ (see also Ghisellini et al. 2016 and Lieder/Rashid 2016 for extensive literature reviews)

IAB-Discussion Paper 14/2018 14
the green wage premium is about four percent. In terms of geographical characteris-tics, they report that green jobs are more spatially concentrated than comparable non-green jobs and that the greenest regions are mostly high-tech regions. Vona et al. (2015) illustrate that green skills (i.e. green tasks in the sense of this paper) are high-level analytical and technical know-how related to the design, production, manage-ment and monitoring of technology.
Peters (2014), who analyzes about one thousand O*NET occupations using text min-ing methods, counts 176 occupations with at least one green task. Among these 176 green occupations there are 70 occupations that involve green tasks to a considerable extent. The latter ‘green-intense’ occupations generally have good working condi-tions: they are mainly full-time jobs, paying above-average salaries and covered by health insurance. The author reports positive employment prospects for all green jobs, though the new employment growth is lagging behind other sectors. He also finds that green jobs are accessible to disadvantaged workers with limited training and experi-ence. According to the author, most of the green occupations are male-dominated but ethnically diverse.
One contribution to the literature of my paper is to add first task-based evidence about the greening of jobs in Germany. Similar to the studies mentioned above, I examine the demographic, occupational, sectoral and regional distribution of the greening of jobs.
2.3 Theoretical framework and previous analytical findings To prepare for the econometric part of the paper, this subsection provides the theo-retical framework for the econometric model and presents analytical findings from previous literature.
From a theoretical perspective, the labor market impacts of the trend towards a green(er) economy may be explained by the interplay between the drivers of a green-ing economy (e.g. environmental regulation, change towards sustainable consump-tion patterns), innovation processes (e.g. eco-innovations, technological and struc-tural change, social transitions) and economic outcomes (e.g. economic competitive-ness, labor demand and wages). In terms of the interplay between environmental regulation, innovation and economic competitiveness, Porter/Van der Linde (1995) point out that environmental regulations may promote innovation and thus improve competitiveness - as long as the regulations are designed well. Acemoglu et al. (2012, 2016) also stress the high importance of directed technical change. According to them, a combination of both environmental regulation (e.g. by carbon taxes) and tem-porary research subsidies may lead to climate protection and sustainable long-run growth.
This is in contrast to scientific papers that present a more static model of the economy where regulations inherently lead to a loss of competitiveness or which at least do not find these positive impacts (e.g. Jaffe/Palmer 1997). Another reason for possible low
IAB-Discussion Paper 14/2018 15
employment effects – at least for technology-related green jobs - is presented by Pe-ters (2014). He notes that the numbers of jobs created on account of green energy should be rather small because energy technologies are generally capital-intensive. According to Deschenes (2013), it is difficult to draw a definitive conclusion on the employment potential of green policies. He calls for more careful and detailed empir-ical studies to learn more about the labor market impacts of green jobs. By means of the index and measurement approach presented in the following, the present paper contributes to this research strand.
Considering the determinants of labor demand, I start with a standard production func-tion. According to this function, initially formulated by Cobb/Douglas (1928), the labor market outcomes of labor demand and wages can be derived as follows:
𝑌𝑌 = 𝐴𝐴 ∗ 𝐿𝐿𝑎𝑎 ∗ 𝐾𝐾(1−𝑎𝑎) (2.1)
where 𝑌𝑌 is the output of production, 𝐴𝐴 is the total factor productivity (i.e. the real output per unit of input), 𝐿𝐿 is the measure of the flow of labor input, 𝐾𝐾 is the measure of the flow of capital input, 𝑎𝑎 is the output elasticity of labor (0 < 𝑎𝑎 < 1).
In competitive equilibrium, production factors are paid according to the value of their marginal product. According to this assumption, the real wage (𝑤𝑤) is equal to the marginal product of labor (𝑀𝑀𝑀𝑀𝐿𝐿).
𝑤𝑤 ≡ 𝑀𝑀𝑀𝑀𝐿𝐿 = 𝑑𝑑𝑑𝑑𝑑𝑑𝑑𝑑
= 𝑎𝑎 ∗ 𝐴𝐴 ∗ 𝐿𝐿(𝑎𝑎−1) ∗ 𝐾𝐾(1−𝑎𝑎) (2.2)
After dissolving the equation to L, the labor demand function is
𝐿𝐿 = (𝑎𝑎 ∗ 𝐴𝐴)−(1−𝑎𝑎) ∗ 𝐾𝐾 ∗ 𝑤𝑤−1/(1−𝑎𝑎) (2.3)
In addition, several economic papers (e.g. Neisser 1942, Appelbaum/Schettkat 1995, Möller 2001, Combes et al. 2004, Blien/Sanner 2004) emphasize the important role of demand elasticities in the production function: based on the studies mentioned be-fore, Blien/Ludewig (2017) show that technological progress leads to an increase in employment when product demand is elastic. However, it is accompanied by a decline in employment if product demand is inelastic. So far, no demand elasticity data are available to support the econometric analysis of this paper with demand elasticities. As soon as detailed data on demand elasticities become available this might be a promising starting point for future research. Nevertheless, the decisive role of demand elasticities will be useful for interpreting the empirical results of this paper. Horbach et al. (2009) have already benefited from this opportunity by using the concept of de-mand elasticities to explain the partial decline in the environmental goods and ser-vices sector. Using data from the IAB Establishment Panel, they show a strong decline in employment in the environmental sub-sectors dominated by end-of-pipe technolo-gies, which are at a stage in their product life cycle that is characterized by a low elasticity. On the other hand, their study also reveals positive employment trends and

IAB-Discussion Paper 14/2018 16
expectations for cleaner technologies, which – at least at the time of the study – were characterized by a high demand elasticity. According to their findings a similar result should be expected for the econometric analysis at the end of this paper. Smulders and Withagen (2012) also demonstrate how green growth can be integrated into dy-namic general equilibrium models. They find that green growth is feasible if there is a good substitution, a clean backstop technology, a low proportion of natural resources in the gross domestic product or green directed technical change.
Another important theoretical thread is the task-based approach and the literature on employment polarization and technological change (see Autor et al. 2003, Autor 2013, Autor/Dorn 2013, Goos et al 2014, Autor 2015), i.e. the rising employment shares in the highest and lowest paid occupations due to the shift in labor demand towards non-routine tasks. Especially computerization seems to cause substitution of repetitive, routine tasks which are mainly performed by medium-skilled occupations, whereas non-routine cognitive tasks predominantly used in high-skill occupations are comple-mented by computerization (Acemoglu/Autor 2011, Autor et al. 2003; Autor, 2013; Autor/Dorn 2013). Consequently, occupations with a large share of routine task show a higher risk of being replaced by computer algorithms and/or robots (Acemoglu/Re-strepo 2017, Blien/Ludewig 2017, Dauth et al. 2017 and Dengler/Matthes 2018). This important trend also may interact with the greening trends. Therefore the model of this paper also takes into account the task contents of occupations.
Now I turn to the last section of the literature review, presenting previous relevant analytical findings about labor market impacts of green jobs. Pollack (2012) works with US data and reports that, in terms of employment, green sectors grew faster between 2000 and 2010 than the economy as a whole. For every percentage-point increase in a sector’s green intensity (i.e. the share of employment in green jobs), annual employment growth was 0.034 percentage points stronger. Furthermore, green sectors had a larger proportion of workers without a college degree. For every percentage-point increase in green intensity in a particular industry, there was a cor-responding 0.28 percentage-point increase in the proportion of jobs held by workers without a four-year college degree in that sector. The author also reports that manu-facturing plays an important role in the green economy. Although it accounts for only 10.8 percent of total private employment, the manufacturing industry provides 20.4 percent of green jobs. However, Elliot/Lindley (2017) relativize these findings and show that Pollack’s results are largely driven by a limited sample of small industries. Elliot/Lindley (2017) work with a larger sample and put green goods and services into a Cobb-Douglas production function. In their empirical analysis, they find that there is a negative correlation between productivity growth and green employment intensity. Furthermore, they show that industries that have increased their technology invest-ment significantly over the past few years and that have generally grown relatively faster overall have at the same time grown more slowly in terms of the production of environmental protection goods and services. Their results largely support those ob-tained by Becker/Shadbegian (2009) who find no differences between environmental

IAB-Discussion Paper 14/2018 17
product manufacturers and other manufacturers in terms of wages, employment, pro-duction and exports. According to Becker/Shadbegian (2009), the only larger differ-ence between these two groups of firms is that environmental product manufacturers employ fewer workers in production.
As mentioned above, Elliott/Lindley (2017) and Weinstein et al. (2010) present evi-dence of a wide spread spatial distribution of green jobs in the USA in 2010. Analyzing the distribution of green jobs in Ohio, Weinstein/Partridge (2010) demonstrate that even within US states there is a strong heterogeneity. Vona et al. (2017) investigate employment effects of green jobs on US local labor markets and reveal that local subsidies under the American Recovery and Reinvestment Act (ARRA), the endow-ment of green knowledge and resilience to the great recession have the strongest impact on the creation of green jobs, whereas direct changes in environmental regu-lation are a secondary force. For Germany, no such in-depth spatial analyses of green jobs have been conducted yet. Closely connected to green jobs in general, Horbach (2014b) also documents a broad regional distribution of eco-innovations in Germany. Interestingly, he reveals higher probabilities of eco-innovations in regions with high poverty rates. This is in line with another finding in the same paper that eco-innova-tions are less dependent on urbanization advantages.
In general, eco-innovation seems to be closely linked with the creation of green jobs. For example, Cecere/Mazzanti (2017) investigate the relationship between green jobs and eco-innovations in European small and medium-sized enterprises and reveal that green innovation is highly relevant for the formation of green jobs. They report that the decision to hire for green jobs is especially driven by the interaction term between an eco-management system and product/service innovations. Observing the time pe-riod between 2001 and 2008, Gagliardi et al. (2016) also find that the emergence of eco-innovation has contributed considerably to long-run job creation. This positive in-fluence of eco-innovation is shown both for product innovation (Horbach 2010) and process innovation (Horbach/Rennings 2013). Horbach (2010) finds that the positive effect of eco-product innovation is even greater compared to other non-eco-innovation fields. Licht and Peters (2014) confirm that both environmental and non-environmen-tal product innovations are correlated to employment growth, but that non-eco product innovations are more likely to increase employment.
Based on cross sectional data analysis, the paper in hand contributes to the analytical literature by examining the interrelationships between the greenness of jobs and labor market outcomes in Germany. Using panel data analysis, it also contributes first in-sights how the growth of greenness, i.e. the greening of jobs, is associated with em-ployment and wage growth.
3 Data To address the objectives of this paper, I develop a new occupational index and link employment data sources into one comprehensive panel dataset at occupational level. First, I use BERUFENET data and text mining results to create the greenness-

IAB-Discussion Paper 14/2018 18
of-jobs index goji. Second, I weight the goji by occupational, sectoral and regional employment statistics data. The project dataset includes both weighted and un-weighted versions. Third, the empirical analysis of the relation between greenness of jobs and employment growth, I add administrative employer-employee data. The oc-cupational aggregates of these micro data are linked with the weighted greenness-of-jobs index and form the basis for the econometric analyses. All of these data sources are described in the remainder of this section.
3.1 Occupational BERUFENET data for basic index development BERUFENET is an online database provided by the Federal Employment Agency in Germany. It covers all items of the classification of occupations (Klassifikation der Berufe 2010 – KldB2010, see also Paulus/Matthes 2013). The purpose of this data-base is two-fold: it is used by vocational counselors and job placement officers at local employment agencies for career guidance and job placement, but it also serves the general public as a free database for career orientation5. BERUFENET is continu-ously updated by an editorial team who receives and implements change requests from the Federal Employment Agency resulting from the operational advisory pro-cesses. The updates are based on both official sources such as training regulations and requests for change from the counseling processes of the federal employment agencies. Both the application in public services and the central content management lead to a high degree of completeness and currency. BERUFENET has already been used for research projects, e.g. to derive occupational tasks (Dengler et al. 2014) as well as to develop an index for the degree of substitutability of occupations due to digitalization and automation (Dengler/Matthes 2015). The data extract of BERUFENET used for this project contains information about the requirements of oc-cupations for the years 2006 and 2011 to 2016. Both occupations and requirements together form an n:n occupations-requirements matrix. The data only include occupa-tions that are actively used in the job placement system of the Federal Employment Agency. Furthermore, occupations of civil servants and military services are not pre-sent in the data.
The requirements of BERUFENET are divided into three dimensions: core require-ments, additional requirements and requirements groups (Dengler et al. 2014). Core requirements are compulsory parts of every vocational training, further training or course of study. If occupations do not have a formal syllabus these requirements con-tain competencies that are usually carried out in practice. In turn, additional require-ments comprise those competencies that may be relevant for the pursuit of the occu-pation, but are non-compulsory elements of official curricula of occupations. For ex-ample, core requirements for roofers are ‘tile a roof’ and ‘roof drainage’, whereas ad-ditional requirements are ‘scaffolding’, ‘energy consulting’ and ‘photovoltaics’ (among others). The latter requirement of ‘photovoltaics’ illustrates the matrix format of the
5 https://berufenet.arbeitsagentur.de/
IAB-Discussion Paper 14/2018 19
BERUFENET: in the case of a roofer it is an additional requirement, in the case of an engineer for renewable energies, it is listed as a core requirement. A third dimension is called ‘requirement groups’. Requirement groups collect knowledge areas or tools that might also be relevant for practicing the occupation (e.g. competence group ‘CAD software’, competence group ‘roof types’). Unlike core and additional requirements, requirement groups are applied very differently in BERUFENET. Hence, and in line with Dengler et al. 2014, these requirement groups are not used in the following.
BERUFENET contains comprehensive lists of occupational requirements for every single occupation, but it does not include actual job descriptions of job offers. There-fore, this study is based on the overall requirements of every occupation as a set of common requirements rather than an analysis of current job offers. As BERUFENET is continuously being edited and developed on the basis of feedback from employers, employees and public institutions (e.g. to include new regulations of vocational train-ing courses), it is still a dynamic, but more stable source of occupational requirements. Based on the information about requirements, it is not always possible to identify the firms’ final products and services. The approach of this paper is therefore unable to identify jobs that have no environment-related requirements but are involved in the production of green goods and services (e.g. an office clerk who sells solar panels). As there are already several studies dealing with the issues of green employment in the green goods and services sector (e.g. Horbach et al. 2009, Becker/Shadbegian 2009, Deschenes 2013, Horbach/Janser 2016, Elliott/Lindley 2017), my contribution is to extend this knowledge with a focus on tasks and occupations.
The general approach of this paper for calculating the greenness of jobs is largely based on Consoli et al. (2016), who work with data from the US American occupa-tional database O*NET6. The basic blocks of their research are green tasks, which are flagged in O*NET. These green tasks flags are a result of the ‘Green Task Devel-opment Project (GTDP)’ (National Center for O*NET Development 2010). In Ger-many, neither BERUFENET nor any other data source provides information similar to the green flag of O*NET.7 Therefore, one of the steps in the groundwork for this paper is identifying ‘green tasks’ in Germany. To achieve this goal, I use a text mining ap-proach which is presented in the next section. Before moving on to this stage, I will briefly introduce the other data sources used for this project.
6 https://www.onetonline.org/ 7 The only environmental-related information in BERUFENET is the occupational field
‚occupations in environmental protection and nature conservation‘, which covers currently (January 2018) 38 occupations. (https://berufenet.arbeitsagentur.de/ > Berufsfelder >Landwirtschaft, Natur, Umwelt > Berufe im Umwelt- und Naturschutz). Compared to the broader definition of green tasks of this paper, the definition of the occupational field is much narrower and is based on an output-oriented approach (environmental goods and services).

IAB-Discussion Paper 14/2018 20
3.2 Statistical data to aggregate at occupational, sectoral and re-gional level
Aggregating the greenness-of-jobs index at occupational, sectoral and regional level requires statistical macro data of the Federal Employment Agency. All employment statistics I use for the goji aggregations cover data on every employee liable for social security contributions in Germany. In the descriptives based on statistical data, I ex-clude marginally employed workers and trainees. At the end of the weighting process, there are goji values at 16 aggregate levels for each year (2006 and 2011 to 2016). Table A-1 illustrates the goji aggregation levels resulting from this procedure. Some of them are presented in the remainder of this paper.8
3.3 Administrative micro data for econometric analyses The IAB Employment History (Beschäftigten-Historik - BeH) is a research dataset based on administrative data gathered by the Federal Employment Agency. It covers employee biographies from 1975 to the latest available data (here: 2016) of every employee subject to German social insurance contributions9. The main source of the BeH are mandatory annual notifications and (de-)registrations of firms to the health insurance institutions. The BeH contains variables about personal characteristics (e.g. age, gender, education, place of residence), individual employment characteristics (e.g. gross wages, tenure, staring/ending date), occupation characteristics (current occupation, occupational status), and some basic employer information (e.g. location, sector, establishment identification number). The present paper uses the full sample of all BeH employees aggregated at the 5-digit level of the KldB2010 (‘occupational panel’). Because the earliest BERUFENET data are from 2006, I set up a BeH panel dataset starting from 2006 to 2016 (the most recent data available). Furthermore, I apply common imputation procedures suggested by Fitzenberger et al. (2006) to im-prove the BeH education variable and by Gartner (2005) to impute wages above the social security contribution assessment threshold.
The Establishment History Panel (Betriebs-Historik-Panel – BHP) provides a full sam-ple of every German establishment that employs at least one worker liable for social security contributions or at least one marginal part-time worker. It is based on cross-sectional data and includes all German establishments that are listed in the BeH on June 30th. Corresponding to the BeH data, I choose 2006 as the first year of the BHP for my project dataset. The BHP comprises data about establishment size, establish-ment years, location, sector affiliation, and worker compositions in terms of qualifica-tions, age, gender and wages. Eberle/Schmucker (2017) provide further information
8 Further goji aggregates are shown in the online appendix (‘Text Mining and
Descriptives’). A selection of csv files with aggregated goji values is available on request from the author.
9 Owing to this restriction, the BeH does not include data about civil servants, people doing military service, self-employed people etc. Detailed information about the BeH can be found in the description of the Sample of Integrated Labour Market Biographies (SIAB) by Antoni et al. (2016).

IAB-Discussion Paper 14/2018 21
about this comprehensive dataset. I link these data to the BeH employee data. After aggregating BHP data at occupational level, I use these data to generate several dummy variables representing the typical composition of firm characteristics for each occupation.
4 The greenness-of-jobs index (goji)
4.1 Identification of green tasks by text mining The source used for the semantic analysis of the present paper is the so-called ‘re-quirements catalogue’ of BERUFENET, which contains yearly text information about the three requirements dimensions mentioned above. For example, the requirements catalogue of 2014 contains 14,546 words, which are subjected to computational con-tent analysis. This analysis is based on lexicometrics with a focus on frequency anal-ysis and key term extraction (Wiedemann 2016). I apply a deductive approach (Igna-tow/Mihalcea 2016) combining qualitative and quantitative content analysis. The aim of this step is to extract key terms associated with typical areas of activities, products and services in the green economy from national and international studies. Due to the explorative nature of this early stage I use qualitative content analysis methods (see Mayring 2014). After an extensive literature review10, I created a 'green tasks diction-ary’ in the sense of a controlled list of relevant words. This dictionary is the basis of the quantitative content analysis of the BERUFENET data.
As in many other text mining cases, the decision about the central definition of the text mining subject is crucial for the entire project and had to be made at this stage of the project. For the present paper, the definition of the character of a ‘green task’ is particular important. The literature above revealed that there is no standard scientific definition for green tasks. This is my definition, which is used for the rest of the anal-ysis, following the definition of general tasks by Acemoglu/Autor (2011): Green tasks are the explicitly environmentally friendly occupational requirements related to the production of output (goods and services) and to any other organizational process. These requirements may be related to all steps along the entire value chain. This includes knowledge areas, technologies and practices to reduce the use of fossil fuels, to decrease pollution and greenhouse gas emissions, to increase the efficiency of energy usage and material usage, to recycle materials, to develop and adopt re-newable sources of energy, to protect and promote biodiversity.
The decisive criterion in this context is the explicitly environmentally friendly specific task content. It was necessary to choose this rigid ‘explicit’ approach to avoid the definition of ‘green’ becoming a matter of subjective decision. Either the process of production or the products and services included in the title of the specific tasks can
10 The list of studies taken into account is documented in the Online Appendix 1 ‘Text
Mining’

IAB-Discussion Paper 14/2018 22
be used as an indicator for green tasks. Environmentally friendly covers all products and actions that actively foster the ecologically sustainable development goals of green economy principles. There are many different definitions of a green economy. I have adopted the definition of Dierdorff et al. (2009: 3) and extended it to include further green economy aspects which were stressed in literature (see literature re-view): the green economy comprises all economic activities to reduce the use of fossil fuels, to decrease pollution and greenhouse gas emissions, to increase the efficiency of energy usage and material usage, to recycle materials, to develop and adopt re-newable sources of energy, to protect and promote biodiversity. To distinguish be-tween green tasks and green skills, I adapt the general skills definition by Ace-moglu/Autor (2011): green skills are a worker’s endowment with capabilities for per-forming various green tasks. Workers apply their green skill endowments to green tasks in exchange for wages, and green skills applied to green tasks produce output. The output need not necessarily be explicitly environmentally friendly. In the remain-der of this paper, I focuses on green tasks to pursue my research objectives.
In accordance with the extended definition of green tasks, I worked with different the-sauri11 in order to define a basic set of keywords, which I extended using the literature review. The goal was to obtain a list with a wide range of different topics but a focus on the most relevant keywords. This strategy was adopted to avoid a too broad range of matches that might lead to less plausible results. Additionally, I aggregated words with the same root by reducing the words to their word stem (‘stemming’). At the end of this process, I had obtained a ‘green tasks dictionary’ by collecting the most fre-quently used key words in a structured list. Furthermore, I grouped the dictionary words by categories of keywords (see Table 1). This allocation to categories was de-rived from the main topic areas of the green economy literature. Each keyword was allocated to only one category (the one with the most frequent references).
11 I use the German and English versions of the multilingual thesaurus of the European
Union: http://eurovoc.europa.eu/drupal/?q=download/subject_oriented (e.g. parts from Subject 52 Environment, 66 Energy) as well as open content sources of http://www.openthesaurus.de and https://de.wiktionary.org/.

IAB-Discussion Paper 14/2018 23
Table 1 List of keyword categories
Category of Keywords
Category Code
Number of keywords
1 Energy production & storage EN 19
2 Mobility & tourism MOB 34
3 Building BUILD 21
4 Farming, forestry, food, consumer goods FFFC 19
5 Energy efficiency & further climate protection CP 10
6 Emission protection (air, water, soil, noise) EP 27
7 Circular economy, (raw) material efficiency & waste management CE 13
8 Environmental protection (general) EPGEN 10
Total number of green tasks keywords GT 153
Source: BERUFENET, own calculations.
On the basis of the green tasks dictionary I used the method of regular expressions to identify those job requirements in BERUFENET that contain key words from the dictionary. Those requirements were coded as ‘green tasks’. For the computational content analysis and automatic coding I used textmining packages of the statistical software R. The subject of the semi-automatic coding was job requirements in the requirements catalog generated from BERUFENET. The coding led to one class of ‘green tasks’ codes, comprising nine sub-codes for the main topic areas of the green economy introduced in the green tasks dictionary. I applied this process for the year 2006 and for 2011 to 2016. The results of the frequency analysis after the coding procedure are presented in section 5 ('Descriptive analysis').
4.2 From green tasks to the employment weighted greenness-of-jobs index goji
Unweighted greenness-of-jobs index To measure the share of environment-related requirements (‘green tasks’) involved in a specific occupation, I develop a greenness-of-jobs index (goji). The index exploits the information provided in BERUFENET’s ‘requirements’ section to shed light on the state and development of the greenness of occupations. Rather than simply distin-guishing between green (‘1’) and non-green (‘0’), goji facilitates analyses of occupa-tions within a huge range of different ‘shades of green’.
The basis of goji is a ‘green tasks-occupations matrix’ to allocate the number of green tasks to each individual occupation. The matrix is grouped by two requirement dimen-sions of core and additional requirements. To use the total number of (both green and non-green) requirements as the denominator, I expand the matrix to include the total count of requirements per individual occupation, which is also grouped by core and additional requirements. Occupations with a higher requirements level usually contain a larger number of requirements and thus have a higher probability of containing more green tasks than occupations with lower requirements. To avoid this bias the relative greenness-of-jobs index (goji) always reports the number of green requirements as a proportion of the total number of requirements.

IAB-Discussion Paper 14/2018 24
By means of the green tasks-occupations matrices for 2006 and 2011 to 2016, I cal-culate the greenness of occupations for each year. To calculate the shares per year, I apply a similar approach to that used by Consoli et al. (2016). However, their ap-proach works only with cross-sectional data. Furthermore, it does not include the di-vision into core and additional requirements or identify green tasks by themselves. They instead use the O*NET information of ‘green task’, which is not available for the German occupational classification system. Hence, I have to adapt the models and develop additional approaches due to the different data sources and the structure of BERUFENET:
𝒈𝒈𝒈𝒈𝒈𝒈𝒈𝒈𝒄𝒄𝒈𝒈𝒄𝒄𝒄𝒄𝒈𝒈𝒄𝒄𝒄𝒄𝒐𝒐𝒐𝒐,𝒕𝒕 =∑𝒈𝒈𝒄𝒄_𝒄𝒄𝒈𝒈𝒄𝒄𝒄𝒄𝒈𝒈𝒄𝒄𝒄𝒄𝒐𝒐𝒐𝒐,𝒕𝒕∑ 𝒄𝒄 _𝒄𝒄𝒈𝒈𝒄𝒄𝒄𝒄𝒈𝒈𝒄𝒄𝒄𝒄𝒐𝒐𝒐𝒐,𝒕𝒕
where
𝒈𝒈𝒈𝒈𝒈𝒈𝒈𝒈𝒄𝒄𝒈𝒈𝒄𝒄𝒄𝒄𝒈𝒈𝒄𝒄𝒄𝒄𝒐𝒐𝒐𝒐,𝒕𝒕 is the ‘green core tasks index’ (0…1) of occupation occ8d (8-digit level). Occupation occ8d is based on the index system of BERUFENET. This index is called the “occupational code number” (Berufskennziffer - BKZ).
�𝒈𝒈𝒄𝒄_𝒄𝒄𝒈𝒈𝒄𝒄𝒄𝒄𝒈𝒈𝒄𝒄𝒄𝒄𝒐𝒐𝒐𝒐,𝒕𝒕
is the number of green core requirements for occupation occ8d (8-digit level) in year t
�𝒄𝒄_𝒄𝒄𝒈𝒈𝒄𝒄𝒄𝒄𝒈𝒈𝒄𝒄𝒄𝒄𝒐𝒐𝒐𝒐,𝒕𝒕
is the number of all core requirements for occupation occ8d (8-digit level) in year t
The 𝒈𝒈𝒈𝒈𝒈𝒈𝒈𝒈𝒄𝒄𝒈𝒈𝒄𝒄𝒄𝒄 describes the proportion of green core tasks in the total of core require-ments for occupation occ8d (8-digit level) in year t. Because the core requirements cover those activities that are most essential for practicing the occupation, this index has the highest generalizability for each job within this occupation. However, due to its stability the core requirements are relatively static and changes last longer than additional requirements. Hence, 𝑔𝑔𝑔𝑔𝑔𝑔𝑔𝑔𝑐𝑐𝑐𝑐𝑐𝑐𝑐𝑐 is most helpful to measure green core occu-pations with green requirements at the center of their occupational conception. It is rather useful for long-term observations of the transition dynamics of the greening of jobs.
The 𝒈𝒈𝒈𝒈𝒈𝒈𝒈𝒈𝒂𝒂𝒐𝒐𝒐𝒐 describes the proportion of green additional tasks in the total sum of ad-ditional requirements for occupation occ8d (8-digit level) in year t:
𝒈𝒈𝒈𝒈𝒈𝒈𝒈𝒈𝒂𝒂𝒐𝒐𝒐𝒐𝒈𝒈𝒄𝒄𝒄𝒄𝒐𝒐𝒐𝒐,𝒕𝒕 =∑𝒈𝒈𝒄𝒄_𝒂𝒂𝒐𝒐𝒐𝒐𝒈𝒈𝒄𝒄𝒄𝒄𝒐𝒐𝒐𝒐,𝒕𝒕∑ 𝒄𝒄_𝒂𝒂𝒐𝒐𝒐𝒐𝒈𝒈𝒄𝒄𝒄𝒄𝒐𝒐𝒐𝒐,𝒕𝒕
where

IAB-Discussion Paper 14/2018 25
𝑔𝑔𝑔𝑔𝑔𝑔𝑔𝑔𝑎𝑎𝑑𝑑𝑑𝑑𝑜𝑜𝑜𝑜𝑜𝑜8𝑑𝑑,𝑡𝑡 is the ‘green additional tasks index’ (0…1) of occupation occ8d (8-digit level).
�𝑔𝑔𝑔𝑔_𝑎𝑎𝑎𝑎𝑎𝑎𝑐𝑐𝑐𝑐𝑐𝑐8𝑑𝑑,𝑡𝑡
is the number of green additional requirements for occupation occ8d (8-digit level) in year t
�𝑔𝑔_𝑎𝑎𝑎𝑎𝑎𝑎𝑐𝑐𝑐𝑐𝑐𝑐8𝑑𝑑,𝑡𝑡
is the number of all additional requirements for occupation occ8d (8-digit level) in year t
The additional requirements are those that can be activities of an occupation but are not part of its core occupational conception. The time spent on additional require-ments depends strongly on the specific job. The 𝑔𝑔𝑔𝑔𝑔𝑔𝑔𝑔𝑎𝑎𝑑𝑑𝑑𝑑 is well-suited for analyzing short-term dynamics within the green requirements composition of occupations, be-cause there is much higher fluctuation of BERUFENET contents in additional require-ments than in core requirements.
The 𝒈𝒈𝒈𝒈𝒈𝒈𝒈𝒈𝒕𝒕𝒈𝒈𝒕𝒕𝒂𝒂𝒕𝒕 facilitates the measurement of the share of green requirements in the total requirements. It describes the proportion of green core and additional require-ments in the total sum of core and additional requirements for occupation occ8d (8-digit level) in year t.
𝒈𝒈𝒈𝒈𝒈𝒈𝒈𝒈𝒕𝒕𝒈𝒈𝒕𝒕𝒂𝒂𝒕𝒕𝒈𝒈𝒄𝒄𝒄𝒄𝒐𝒐𝒐𝒐,𝒕𝒕 =∑𝒈𝒈𝒄𝒄_𝒄𝒄𝒈𝒈𝒄𝒄𝒄𝒄𝒈𝒈𝒄𝒄𝒄𝒄𝒐𝒐𝒐𝒐,𝒕𝒕 + ∑𝒈𝒈𝒄𝒄_𝒂𝒂𝒐𝒐𝒐𝒐𝒈𝒈𝒄𝒄𝒄𝒄𝒐𝒐𝒐𝒐,𝒕𝒕∑ 𝒄𝒄 _𝒄𝒄𝒈𝒈𝒄𝒄𝒄𝒄𝒈𝒈𝒄𝒄𝒄𝒄𝒐𝒐𝒐𝒐,𝒕𝒕 + ∑𝒄𝒄_𝒂𝒂𝒐𝒐𝒐𝒐𝒈𝒈𝒄𝒄𝒄𝒄𝒐𝒐𝒐𝒐,𝒕𝒕
where
𝑔𝑔𝑔𝑔𝑔𝑔𝑔𝑔𝑡𝑡𝑐𝑐𝑡𝑡𝑎𝑎𝑡𝑡𝑜𝑜𝑜𝑜𝑜𝑜8𝑑𝑑,𝑡𝑡 is the unweighted ‘green total index’ (0…1) of occupation occ8d (8-digit level).
�𝑔𝑔𝑔𝑔_𝑐𝑐𝑔𝑔𝑔𝑔𝑐𝑐𝑐𝑐𝑐𝑐𝑐𝑐8𝑑𝑑,𝑡𝑡
is the number of green core requirements for occupation occ8d (8-digit level) in year t
�𝑔𝑔_𝑐𝑐𝑔𝑔𝑔𝑔𝑐𝑐𝑐𝑐𝑐𝑐𝑐𝑐8𝑑𝑑,𝑡𝑡
is the number of all core requirements for occupation occ8d (8-digit level) in year t
�𝑔𝑔𝑔𝑔_𝑎𝑎𝑎𝑎𝑎𝑎𝑐𝑐𝑐𝑐𝑐𝑐8𝑑𝑑,𝑡𝑡
is the number of green additional requirements for occupation occ8d (8-digit level) in year t
�𝑔𝑔_𝑎𝑎𝑎𝑎𝑎𝑎𝑐𝑐𝑐𝑐𝑐𝑐8𝑑𝑑,𝑡𝑡
is the number of all additional requirements for occupation occ8d (8-digit level) in year t
The 𝑔𝑔𝑔𝑔𝑔𝑔𝑔𝑔𝑡𝑡𝑐𝑐𝑡𝑡𝑎𝑎𝑡𝑡 is based on the assumption that the requirements are equally distributed in terms of working time on average. An alternative assumption might be that the core requirements take up a larger part of the working time than the additional require-ments. For this reason, I also introduce and test a weighted index 𝒈𝒈𝒈𝒈𝒈𝒈𝒈𝒈𝒘𝒘𝒕𝒕𝒈𝒈𝒕𝒕𝒂𝒂𝒕𝒕 that takes this assumption into account. As the time component of core requirements
IAB-Discussion Paper 14/2018 26
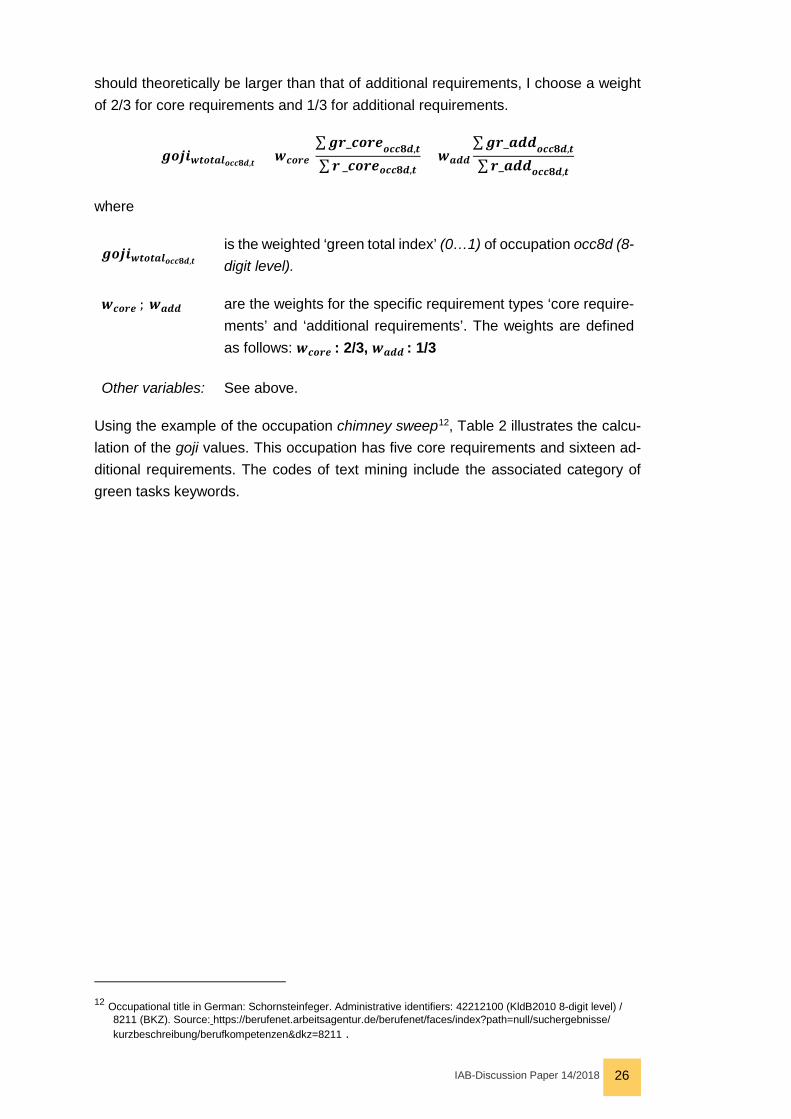
should theoretically be larger than that of additional requirements, I choose a weight of 2/3 for core requirements and 1/3 for additional requirements.
𝒈𝒈𝒈𝒈𝒈𝒈𝒈𝒈𝒘𝒘𝒕𝒕𝒈𝒈𝒕𝒕𝒂𝒂𝒕𝒕𝒈𝒈𝒄𝒄𝒄𝒄𝒐𝒐𝒐𝒐,𝒕𝒕 = 𝒘𝒘𝒄𝒄𝒈𝒈𝒄𝒄𝒄𝒄 ∑𝒈𝒈𝒄𝒄_𝒄𝒄𝒈𝒈𝒄𝒄𝒄𝒄𝒈𝒈𝒄𝒄𝒄𝒄𝒐𝒐𝒐𝒐,𝒕𝒕∑ 𝒄𝒄 _𝒄𝒄𝒈𝒈𝒄𝒄𝒄𝒄𝒈𝒈𝒄𝒄𝒄𝒄𝒐𝒐𝒐𝒐,𝒕𝒕
+ 𝒘𝒘𝒂𝒂𝒐𝒐𝒐𝒐∑𝒈𝒈𝒄𝒄_𝒂𝒂𝒐𝒐𝒐𝒐𝒈𝒈𝒄𝒄𝒄𝒄𝒐𝒐𝒐𝒐,𝒕𝒕∑ 𝒄𝒄_𝒂𝒂𝒐𝒐𝒐𝒐𝒈𝒈𝒄𝒄𝒄𝒄𝒐𝒐𝒐𝒐,𝒕𝒕
where
𝒈𝒈𝒈𝒈𝒈𝒈𝒈𝒈𝒘𝒘𝒕𝒕𝒈𝒈𝒕𝒕𝒂𝒂𝒕𝒕𝒈𝒈𝒄𝒄𝒄𝒄𝒐𝒐𝒐𝒐,𝒕𝒕 is the weighted ‘green total index’ (0…1) of occupation occ8d (8-digit level).
𝒘𝒘𝒄𝒄𝒈𝒈𝒄𝒄𝒄𝒄 ; 𝒘𝒘𝒂𝒂𝒐𝒐𝒐𝒐 are the weights for the specific requirement types ‘core require-ments’ and ‘additional requirements’. The weights are defined as follows: 𝒘𝒘𝒄𝒄𝒈𝒈𝒄𝒄𝒄𝒄 : 2/3, 𝒘𝒘𝒂𝒂𝒐𝒐𝒐𝒐 : 1/3
Other variables: See above.
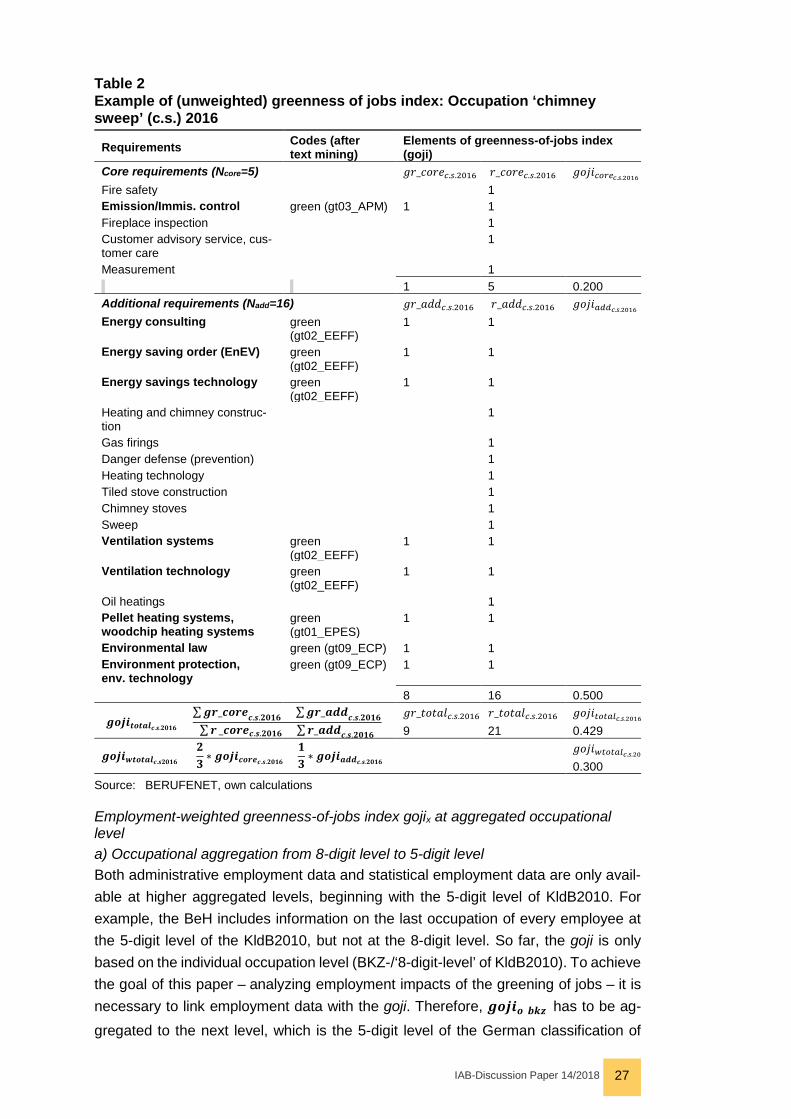
Using the example of the occupation chimney sweep12, Table 2 illustrates the calcu-lation of the goji values. This occupation has five core requirements and sixteen ad-ditional requirements. The codes of text mining include the associated category of green tasks keywords.
12 Occupational title in German: Schornsteinfeger. Administrative identifiers: 42212100 (KldB2010 8-digit level) /
8211 (BKZ). Source: https://berufenet.arbeitsagentur.de/berufenet/faces/index?path=null/suchergebnisse/ kurzbeschreibung/berufkompetenzen&dkz=8211 .
IAB-Discussion Paper 14/2018 27
Table 2 Example of (unweighted) greenness of jobs index: Occupation ‘chimney sweep’ (c.s.) 2016
Requirements Codes (after text mining)
Elements of greenness-of-jobs index (goji)
Core requirements (Ncore=5) 𝑔𝑔𝑔𝑔_𝑐𝑐𝑔𝑔𝑔𝑔𝑐𝑐𝑐𝑐.𝑠𝑠.2016 𝑔𝑔_𝑐𝑐𝑔𝑔𝑔𝑔𝑐𝑐𝑐𝑐.𝑠𝑠.2016 𝑔𝑔𝑔𝑔𝑔𝑔𝑔𝑔𝑐𝑐𝑐𝑐𝑐𝑐𝑐𝑐𝑜𝑜.𝑠𝑠.2016 Fire safety 1 Emission/Immis. control green (gt03_APM) 1 1 Fireplace inspection 1 Customer advisory service, cus-tomer care
1
Measurement 1 1 5 0.200 Additional requirements (Nadd=16) 𝑔𝑔𝑔𝑔_𝑎𝑎𝑎𝑎𝑎𝑎𝑐𝑐.𝑠𝑠.2016 𝑔𝑔_𝑎𝑎𝑎𝑎𝑎𝑎𝑐𝑐.𝑠𝑠.2016 𝑔𝑔𝑔𝑔𝑔𝑔𝑔𝑔𝑎𝑎𝑑𝑑𝑑𝑑𝑜𝑜.𝑠𝑠.2016 Energy consulting green
(gt02_EEFF) 1 1
Energy saving order (EnEV) green (gt02_EEFF)
1 1
Energy savings technology green (gt02_EEFF)
1 1
Heating and chimney construc-tion
1
Gas firings 1 Danger defense (prevention) 1 Heating technology 1 Tiled stove construction 1 Chimney stoves 1 Sweep 1 Ventilation systems green
(gt02_EEFF) 1 1
Ventilation technology green (gt02_EEFF)
1 1
Oil heatings 1 Pellet heating systems, woodchip heating systems
green (gt01_EPES)
1 1
Environmental law green (gt09_ECP) 1 1 Environment protection, env. technology
green (gt09_ECP) 1 1
8 16 0.500
𝒈𝒈𝒈𝒈𝒈𝒈𝒈𝒈𝒕𝒕𝒈𝒈𝒕𝒕𝒂𝒂𝒕𝒕𝒄𝒄.𝒔𝒔.𝟐𝟐𝟐𝟐𝟐𝟐𝟐𝟐 =∑𝒈𝒈𝒄𝒄_𝒄𝒄𝒈𝒈𝒄𝒄𝒄𝒄𝒄𝒄.𝒔𝒔.𝟐𝟐𝟐𝟐𝟐𝟐𝟐𝟐 + ∑𝒈𝒈𝒄𝒄_𝒂𝒂𝒐𝒐𝒐𝒐𝒄𝒄.𝒔𝒔.𝟐𝟐𝟐𝟐𝟐𝟐𝟐𝟐∑ 𝒄𝒄 _𝒄𝒄𝒈𝒈𝒄𝒄𝒄𝒄𝒄𝒄.𝒔𝒔.𝟐𝟐𝟐𝟐𝟐𝟐𝟐𝟐 + ∑𝒄𝒄_𝒂𝒂𝒐𝒐𝒐𝒐𝒄𝒄.𝒔𝒔.𝟐𝟐𝟐𝟐𝟐𝟐𝟐𝟐
𝑔𝑔𝑔𝑔_𝑡𝑡𝑔𝑔𝑡𝑡𝑎𝑎𝑡𝑡𝑐𝑐.𝑠𝑠.2016 𝑔𝑔_𝑡𝑡𝑔𝑔𝑡𝑡𝑎𝑎𝑡𝑡𝑐𝑐.𝑠𝑠.2016 𝑔𝑔𝑔𝑔𝑔𝑔𝑔𝑔𝑡𝑡𝑐𝑐𝑡𝑡𝑎𝑎𝑡𝑡𝑜𝑜.𝑠𝑠.2016 9 21 0.429
𝒈𝒈𝒈𝒈𝒈𝒈𝒈𝒈𝒘𝒘𝒕𝒕𝒈𝒈𝒕𝒕𝒂𝒂𝒕𝒕𝒄𝒄.𝒔𝒔𝟐𝟐𝟐𝟐𝟐𝟐𝟐𝟐 = 𝟐𝟐𝟑𝟑 ∗ 𝒈𝒈𝒈𝒈𝒈𝒈𝒈𝒈𝒄𝒄𝒈𝒈𝒄𝒄𝒄𝒄𝒄𝒄.𝒔𝒔.𝟐𝟐𝟐𝟐𝟐𝟐𝟐𝟐 +
𝟐𝟐𝟑𝟑 ∗ 𝒈𝒈𝒈𝒈𝒈𝒈𝒈𝒈𝒂𝒂𝒐𝒐𝒐𝒐𝒄𝒄.𝒔𝒔.𝟐𝟐𝟐𝟐𝟐𝟐𝟐𝟐
𝑔𝑔𝑔𝑔𝑔𝑔𝑔𝑔𝑤𝑤𝑡𝑡𝑐𝑐𝑡𝑡𝑎𝑎𝑡𝑡𝑜𝑜.𝑠𝑠.201 0.300
Source: BERUFENET, own calculations
Employment-weighted greenness-of-jobs index gojix at aggregated occupational level a) Occupational aggregation from 8-digit level to 5-digit level Both administrative employment data and statistical employment data are only avail-able at higher aggregated levels, beginning with the 5-digit level of KldB2010. For example, the BeH includes information on the last occupation of every employee at the 5-digit level of the KldB2010, but not at the 8-digit level. So far, the goji is only based on the individual occupation level (BKZ-/‘8-digit-level’ of KldB2010). To achieve the goal of this paper – analyzing employment impacts of the greening of jobs – it is necessary to link employment data with the goji. Therefore, 𝒈𝒈𝒈𝒈𝒈𝒈𝒈𝒈𝒈𝒈(𝒃𝒃𝒃𝒃𝒃𝒃) has to be ag-gregated to the next level, which is the 5-digit level of the German classification of

IAB-Discussion Paper 14/2018 28
occupations (Klassifikation der Berufe 2010 – KldB2010). To transform 𝒈𝒈𝒈𝒈𝒈𝒈𝒈𝒈𝒈𝒈𝒄𝒄𝒄𝒄(𝒐𝒐−𝒐𝒐𝒈𝒈𝒈𝒈𝒈𝒈𝒕𝒕) into 𝒈𝒈𝒈𝒈𝒈𝒈𝒈𝒈𝒈𝒈𝒄𝒄𝒄𝒄(≥𝟓𝟓−𝒐𝒐𝒈𝒈𝒈𝒈𝒈𝒈𝒕𝒕) , I use a procedure similar to that used by Dengler et al. (2014): the greenness index of the 8-digit occupations is added up and the total is divided by the number of 8-digit occupations within the 5-digit occupation.
𝒈𝒈𝒈𝒈𝒈𝒈𝒈𝒈𝒄𝒄𝒈𝒈𝒄𝒄𝒄𝒄,𝒂𝒂𝒐𝒐𝒐𝒐,𝒕𝒕𝒈𝒈𝒕𝒕𝒂𝒂𝒕𝒕𝒈𝒈𝒄𝒄𝒄𝒄𝟓𝟓𝒐𝒐,𝒕𝒕 =∑ 𝒈𝒈𝒈𝒈𝒈𝒈𝒈𝒈𝒄𝒄𝒈𝒈𝒄𝒄𝒄𝒄,𝒂𝒂𝒐𝒐𝒐𝒐,𝒕𝒕𝒈𝒈𝒕𝒕𝒂𝒂𝒕𝒕𝒈𝒈𝒄𝒄𝒄𝒄𝒐𝒐𝒐𝒐∈𝟓𝟓𝒐𝒐,𝒕𝒕
𝑵𝑵𝒈𝒈𝒄𝒄𝒄𝒄𝒐𝒐𝒐𝒐∈𝟓𝟓𝒐𝒐 ,𝒕𝒕
A weakness of this procedure is caused by a structural difference between occupa-tional data and employment data. As Dengler et al. (2014) point out, the general prob-lem with aggregating occupational data from the 8-digit to the 5-digit-level is that there is no information available about how many people are employed in individual occu-pations at the 8-digit-level. This information is only available at the 5-digit level. Thus the employment share of every 8-digit level occupation in a 5-digit level aggregate has to be estimated. The assumption of this approach is that the number of employees in individual occupations is equally distributed. This might lead to some bias in the remaining steps. As there is no pattern to explain which 5-digit occupations comprise more individual occupations and which comprise less, I assume that the bias is ran-domly distributed and averages out in total. The same applies to the aggregation of the goji. If employment data were available at the 8-digit level this would be a natural basis for a weighting scheme. As this is not the case, I again apply the approach used by Dengler et al. (2014) and divide the total sum of the goji within each 5-digit level occupation by the number of individual occupations within the 5-digit occupational type. Taking the occupational group of ‘Occupations in renewable energy technology - complex tasks’ as an example, Table 3 illustrates how this aggregation procedure is implemented in the goji data.
Table 3 Aggregation to occupational-type-level (KldB 2010, from 8- to 5-digit level): Example of ‘Occupations in renewable energy technology - complex tasks’ 2014 Individual Occupation 8-digit level of KldB 2010 (ID + Title)
Occupational type 5-digit level of KldB 2010 (ID + Title)
Number of employees 5-digit level
Number of employees 8-digit level
gojicore 8-digit level
gojicore 5-digit level (aggregate)
26243-100 Solar technician
26243 Occupations in
renewable energy tech. - complex tasks
2,671
Equal distribution assump-tion: 2,671:3= 890.33
0.200 (0.200+
0.100+ 0.333) : 3 = 0.211
26243-101 Wind energy technician 0.100
26243-108 Specialist solar tech.
0.333
Source: BERUFENET, employment statistics of the Federal Employment Agency, own calculations.
In the example of ‘chimney sweep’ the aggregation to the 5-digit level is less chal-lenging, because the 5-digit level of this occupation covers only one single occupation (here: # 42212 of KldB2010).

IAB-Discussion Paper 14/2018 29
b) Occupational aggregation from 5-digit level to higher aggregated levels The following step uses the employment data at the 5-digit level as starting point for the weighting. Employment weights 𝒘𝒘 are based on the number of employees of oc-cupational type occ5d (5-digit level of KldB2010) as a proportion of the total number of employees working in the Xd digit-level of the KldB 2010 occupational classifica-tion:
𝒘𝒘𝒈𝒈𝒄𝒄𝒄𝒄𝟓𝟓𝒐𝒐𝒕𝒕𝒈𝒈𝒐𝒐𝒐𝒐,𝒕𝒕 =𝒄𝒄𝒆𝒆𝒆𝒆𝒈𝒈𝒄𝒄𝒄𝒄𝟓𝟓𝒐𝒐 ∈𝒐𝒐 ,𝒕𝒕
∑ 𝒄𝒄𝒆𝒆𝒆𝒆𝒈𝒈𝒄𝒄𝒄𝒄𝟓𝟓𝒐𝒐 ∈𝒐𝒐𝒐𝒐,𝒕𝒕
where 𝒄𝒄𝒆𝒆𝒆𝒆𝒈𝒈𝒄𝒄𝒄𝒄𝟓𝟓𝒐𝒐 ∈𝒐𝒐 ,𝒕𝒕 is the number of employees in the individual 5-digit group within the x-digit group and ∑ 𝒄𝒄𝒆𝒆𝒆𝒆𝒈𝒈𝒄𝒄𝒄𝒄𝟓𝟓𝒐𝒐 ∈𝒐𝒐𝒐𝒐,𝒕𝒕 is the sum of employees (5-digit group) within the x-digit. In the next step, the products of weights and goji are added and lead to the goji at x-digit level (employment-weighted):
Goji at aggregated occupational levels (employment-weighted at X d(igit) level of KldB2010)
𝒈𝒈𝒈𝒈𝒈𝒈𝒈𝒈𝒄𝒄𝒈𝒈𝒄𝒄𝒄𝒄,𝒂𝒂𝒐𝒐𝒐𝒐,(𝒘𝒘)𝒕𝒕𝒈𝒈𝒕𝒕𝒂𝒂𝒕𝒕𝒈𝒈𝒄𝒄𝒄𝒄𝒐𝒐𝒐𝒐,𝒕𝒕 = � 𝒘𝒘𝒈𝒈𝒄𝒄𝒄𝒄𝟓𝟓𝒐𝒐𝒕𝒕𝒈𝒈𝒐𝒐𝒐𝒐,𝒕𝒕 ∗ 𝒈𝒈𝒈𝒈𝒈𝒈𝒈𝒈𝒄𝒄𝒈𝒈𝒄𝒄𝒄𝒄,𝒂𝒂𝒐𝒐𝒐𝒐,(𝒘𝒘)𝒕𝒕𝒈𝒈𝒕𝒕𝒂𝒂𝒕𝒕𝒈𝒈𝒄𝒄𝒄𝒄𝟓𝟓𝒐𝒐,𝒕𝒕
𝒏𝒏
𝒈𝒈𝒄𝒄𝒄𝒄𝟓𝟓𝒐𝒐∈𝒐𝒐𝒐𝒐=𝟐𝟐
The example of ‘chimney sweep’ demonstrates the weighting by employment (Table 4).
Table 4 Aggregation from 8digit to 5digit level: Example of goji weighted by employ-ment: Occupation ‘chimney sweep’
Example of Index Operation Result
Weight 𝒘𝒘#𝟒𝟒𝟐𝟐𝟐𝟐𝟐𝟐𝟐𝟐𝒕𝒕𝒈𝒈#𝟒𝟒𝟐𝟐𝟐𝟐,𝟐𝟐𝟐𝟐𝟐𝟐𝟒𝟒 𝒄𝒄𝒆𝒆𝒆𝒆#𝟒𝟒𝟐𝟐𝟐𝟐𝟐𝟐𝟐𝟐 ,𝟐𝟐𝟐𝟐𝟐𝟐𝟒𝟒
∑ 𝒄𝒄𝒆𝒆𝒆𝒆𝒈𝒈𝒄𝒄𝒄𝒄𝟓𝟓𝒐𝒐 ∈#𝟒𝟒𝟐𝟐𝟐𝟐𝒐𝒐,𝟐𝟐𝟐𝟐𝟐𝟐𝟒𝟒=
𝟐𝟐𝟓𝟓𝟐𝟐𝟓𝟓𝟐𝟐𝟑𝟑𝟏𝟏𝟓𝟓𝟏𝟏 = = 𝟐𝟐.𝟒𝟒𝟐𝟐𝟒𝟒
Greenness of jobs index (goji) (here: aggre-gation to 3-digit-level)
𝒈𝒈𝒈𝒈𝒈𝒈𝒈𝒈𝒄𝒄𝒈𝒈𝒄𝒄𝒄𝒄#𝟒𝟒𝟐𝟐𝟐𝟐,𝟐𝟐𝟐𝟐𝟐𝟐𝟒𝟒
� 𝒘𝒘𝒈𝒈𝒄𝒄𝒄𝒄𝟓𝟓𝒐𝒐𝒕𝒕𝒈𝒈𝟑𝟑𝒐𝒐,𝟐𝟐𝟐𝟐𝟐𝟐𝟒𝟒 ∗ 𝒈𝒈𝒈𝒈𝒈𝒈𝒈𝒈𝒄𝒄𝒈𝒈𝒄𝒄𝒄𝒄𝒈𝒈𝒄𝒄𝒄𝒄𝟓𝟓𝒐𝒐,𝟐𝟐𝟐𝟐𝟐𝟐𝟒𝟒
#𝟒𝟒𝟐𝟐𝟐𝟐𝟏𝟏𝟑𝟑
#𝟒𝟒𝟐𝟐𝟐𝟐𝟐𝟐𝟐𝟐
= 0.365*0.074+0.258*0.154+0.25*0.215+0.200*0.467+0.384*0.013+0.100*0.077=
= 0.0269 + 0.040 + 0.054 + 0.093 + 0.005 + 0.008 =
= 𝟐𝟐.𝟐𝟐𝟐𝟐𝟐𝟐
Note: As an example, I use the occupation ‘chimney sweep’. This occupation has the classification number 42212 (5-digit level) and 433 (3-digit level), respectively. The title of the 3-digit level is ‘Occupations in environmental protection engineering’.
Source: BERUFENET, employment statistics of the Federal Employment Agency, own calculations."
Conversion of goji from occupational 5-digit level to sectoral and regional level The aggregations of occupational and employment data from the 5-digit level to higher aggregated levels (e.g. from 5-digit to 3-digit level) is also applicable in analogy for calculating the sectoral and regional distribution of employees with green occupa-tions. I also use the employment data at the five-digit level as the base for the weight.

IAB-Discussion Paper 14/2018 30
Weights 𝒘𝒘 are based on the employees of occupational type occ5d (5-digit level of KldB2010) as a proportion of the total number of employees working in industry WZ-x or region NUTS-x.
Calculation of weight ‘employment share of occupational type occ5d in industry WZx in year t’:
𝒘𝒘𝒈𝒈𝒄𝒄𝒄𝒄𝟓𝟓𝒐𝒐𝒕𝒕𝒈𝒈𝒅𝒅𝒅𝒅𝒅𝒅,𝒕𝒕 =𝒄𝒄𝒆𝒆𝒆𝒆𝒈𝒈𝒄𝒄𝒄𝒄𝟓𝟓𝒐𝒐 ∈𝒅𝒅𝒅𝒅𝒅𝒅 ,𝒕𝒕∑ 𝒄𝒄𝒆𝒆𝒆𝒆𝒈𝒈𝒄𝒄𝒄𝒄𝟓𝟓𝒐𝒐 ∈𝒅𝒅𝒅𝒅𝒅𝒅,𝒕𝒕
where 𝒄𝒄𝒆𝒆𝒆𝒆𝒈𝒈𝒄𝒄𝒄𝒄𝟓𝟓𝒐𝒐 ∈𝒅𝒅𝒅𝒅𝒅𝒅 ,𝒕𝒕 is the number of employees of the specific occupational type (5-digit group) 𝒈𝒈𝒄𝒄𝒄𝒄𝟓𝟓𝒐𝒐 within the WZ-x industry in year t and ∑ 𝒄𝒄𝒆𝒆𝒆𝒆𝒈𝒈𝒄𝒄𝒄𝒄𝟓𝟓𝒐𝒐 ∈𝒅𝒅𝒅𝒅𝒅𝒅,𝒕𝒕 is the sum of employees of all occupational types (5-digit group) within the WZ-x industry.
The weight is now applied to the corresponding goji:
Greenness-of-jobs index at sectoral level (employment-weighted WZ-x level)
𝒈𝒈𝒈𝒈𝒈𝒈𝒈𝒈𝒄𝒄𝒈𝒈𝒄𝒄𝒄𝒄,𝒂𝒂𝒐𝒐𝒐𝒐,(𝒘𝒘)𝒕𝒕𝒈𝒈𝒕𝒕𝒂𝒂𝒕𝒕𝒅𝒅𝒅𝒅𝒅𝒅,𝒕𝒕 = � 𝒘𝒘𝒈𝒈𝒄𝒄𝒄𝒄𝟓𝟓𝒐𝒐𝒕𝒕𝒈𝒈𝒅𝒅𝒅𝒅𝒅𝒅,𝒕𝒕 ∗ 𝒈𝒈𝒈𝒈𝒈𝒈𝒈𝒈𝒄𝒄𝒈𝒈𝒄𝒄𝒄𝒄,𝒂𝒂𝒐𝒐𝒐𝒐,(𝒘𝒘)𝒕𝒕𝒈𝒈𝒕𝒕𝒂𝒂𝒕𝒕𝒈𝒈𝒄𝒄𝒄𝒄𝟓𝟓𝒐𝒐,𝒕𝒕
𝒏𝒏
𝒈𝒈𝒄𝒄𝒄𝒄𝟓𝟓𝒐𝒐∈𝒅𝒅𝒅𝒅𝒅𝒅=𝟐𝟐
Calculation of weight ‘employment share of occupational type occ5d in region NUTSx in year t:
𝒘𝒘𝒈𝒈𝒄𝒄𝒄𝒄𝟓𝟓𝒐𝒐𝒕𝒕𝒈𝒈𝑵𝑵𝒅𝒅𝒅𝒅𝒅𝒅𝒅𝒅,𝒕𝒕 =𝒄𝒄𝒆𝒆𝒆𝒆𝒈𝒈𝒄𝒄𝒄𝒄𝟓𝟓𝒐𝒐 ∈𝑵𝑵𝒅𝒅𝒅𝒅𝒅𝒅𝒅𝒅 ,𝒕𝒕∑ 𝒄𝒄𝒆𝒆𝒆𝒆𝒈𝒈𝒄𝒄𝒄𝒄𝟓𝟓𝒐𝒐 ∈𝑵𝑵𝒅𝒅𝒅𝒅𝒅𝒅𝒅𝒅,𝒕𝒕
where 𝒄𝒄𝒆𝒆𝒆𝒆𝒈𝒈𝒄𝒄𝒄𝒄𝟓𝟓𝒐𝒐 ∈𝑵𝑵𝒅𝒅𝒅𝒅𝒅𝒅𝒅𝒅 ,𝒕𝒕 is the number of employees of the specific occupational type 𝑔𝑔𝑐𝑐𝑐𝑐5𝑎𝑎 (5-digit group) within the NUTS-x region in year t and ∑ 𝒄𝒄𝒆𝒆𝒆𝒆𝒈𝒈𝒄𝒄𝒄𝒄𝟓𝟓𝒐𝒐 ∈𝑵𝑵𝒅𝒅𝒅𝒅𝒅𝒅𝒅𝒅,𝒕𝒕 is the sum of employees of all occupational types 𝑔𝑔𝑐𝑐𝑐𝑐5𝑎𝑎 (5-digit group) within the NUTS-x region. The weight is now applied to the corresponding goji:
Greenness-of-jobs index at regional level (employment-weighted NUTS-x level)
𝒈𝒈𝒈𝒈𝒈𝒈𝒈𝒈𝒄𝒄𝒈𝒈𝒄𝒄𝒄𝒄,𝒂𝒂𝒐𝒐𝒐𝒐,(𝒘𝒘)𝒕𝒕𝒈𝒈𝒕𝒕𝒂𝒂𝒕𝒕𝑵𝑵𝒅𝒅𝒅𝒅𝒅𝒅𝒅𝒅,𝒕𝒕 = � 𝒘𝒘𝒈𝒈𝒄𝒄𝒄𝒄𝟓𝟓𝒐𝒐𝒕𝒕𝒈𝒈𝑵𝑵𝒅𝒅𝒅𝒅𝒅𝒅𝒅𝒅,𝒕𝒕 ∗ 𝒈𝒈𝒈𝒈𝒈𝒈𝒈𝒈𝒄𝒄𝒈𝒈𝒄𝒄𝒄𝒄,𝒂𝒂𝒐𝒐𝒐𝒐,(𝒘𝒘)𝒕𝒕𝒈𝒈𝒕𝒕𝒂𝒂𝒕𝒕𝒈𝒈𝒄𝒄𝒄𝒄𝟓𝟓𝒐𝒐,𝒕𝒕
𝒏𝒏
𝒈𝒈𝒄𝒄𝒄𝒄𝟓𝟓𝒐𝒐∈𝑵𝑵𝒅𝒅𝒅𝒅𝒅𝒅𝒅𝒅=𝟐𝟐
5 Descriptive analysis
This section provides unique descriptive evidence about the greenness and greening of jobs along all dimensions of the research objectives: it contains information about the prevalence of green tasks in the BERUFENET and about the greenness and greening of occupations at the level of individual occupations to describe both the input and output of measuring the greenness of occupations. Furthermore, the section presents the occupational, sectoral and regional distribution of the greenness and

IAB-Discussion Paper 14/2018 31
greening of jobs. The section ends with details about the sample prepared for econo-metric analysis, including information about sample size and sample means.
5.1 The greenness-of-jobs index at individual occupation level Green tasks – the main components for measuring the greenness of jobs As mentioned above, measuring the greenness of jobs starts with applying text mining procedures to the BERUEFENET data. Including both core and additional require-ments, the yearly occupations-requirements matrices from the BERUFENET result in the following quantity structure (see Table 5):
Table 5 Quantity structure of occupations-requirements matrices derived from BERUFENET
Note: The decrease in the number of occupations between 2006 and 2011 is a technical effect due to the change in the occ. classification from KldB1988 to KldB2010. Therefore the total numbers of occupations in 2006 and 2011 et seq. cannot be compared, although the total number of requirements is still comparable.
Sources: BERUFENET, Classifications: KldB2010 (2011-2016) and KldB1988 (2006), own calculati-ons.
Table 5 reveals a considerable increase in the number of occupations and require-ments between 2012 and 2016: the number of individual occupations rose by 8.3 percent and the number of requirements by 9.8 percent. The resulting n:n-matrix, with about 26.2 to 36.8 million cells per year, is the basis for the text mining and the cal-culation of the greenness-of-jobs index. The content and relative frequency of the green tasks keywords identified by text mining procedures can be visualized by word clouds. For example, Figure 2 illustrates the changes between 2006 and 2016 in terms of the relative frequencies of the green tasks keywords weighted by their ap-pearance in the requirements section of the BERUFENET. The size of the terms rep-resents their weighted frequency, i.e. the larger the word the higher the frequency. The key words are presented in the original German language.
Year / Occ.classif.
Number of indiv. occupations
Number of requirements(‘tasks’)
Cells of n:n occupations- requirements matrices
2006 KldB1988 6,423 5,724 36.8M 2012 KldB2010 3,926 6,670 26.2M 2013 3,952 6,709 26.5M 2014 3,961 6,745 26.7M 2015 3,953 6,819 27.0M 2016 4,251 7,325 31.1M ∆ 2012-2016 325 655 5.0M as % 8.3% 9.8% 18.9%
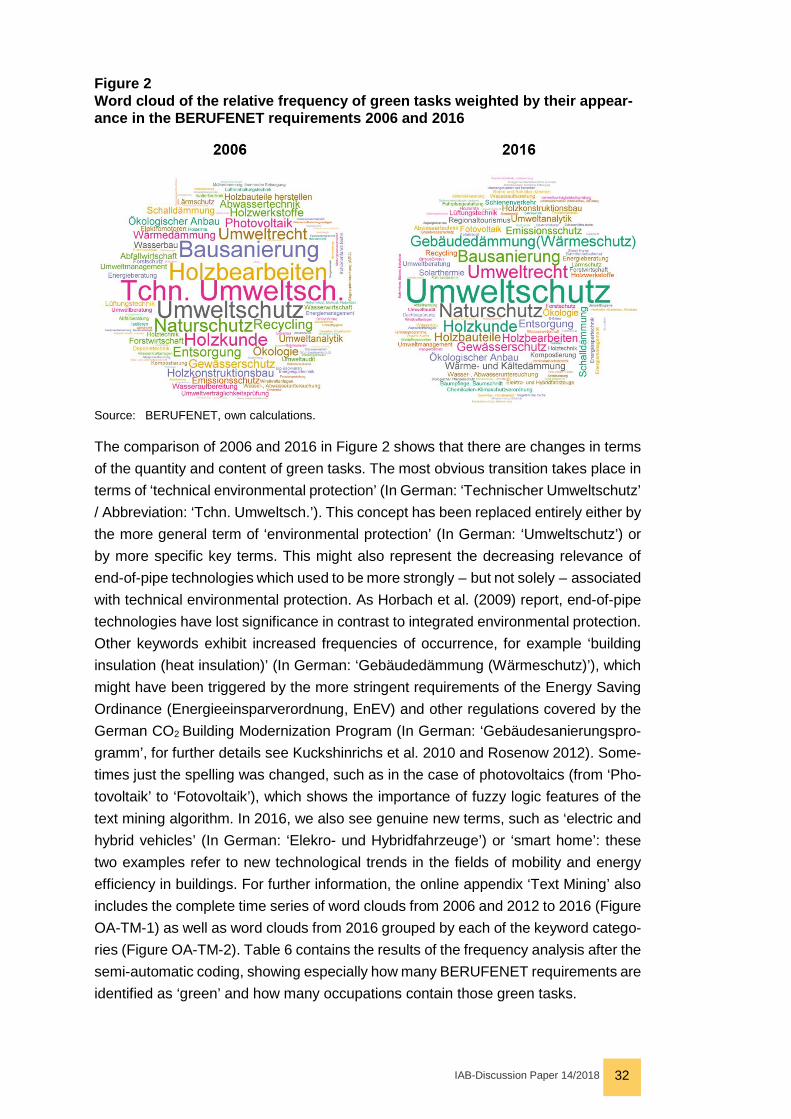
IAB-Discussion Paper 14/2018 32
Figure 2 Word cloud of the relative frequency of green tasks weighted by their appear-ance in the BERUFENET requirements 2006 and 2016
Source: BERUFENET, own calculations.
The comparison of 2006 and 2016 in Figure 2 shows that there are changes in terms of the quantity and content of green tasks. The most obvious transition takes place in terms of ‘technical environmental protection’ (In German: ‘Technischer Umweltschutz’ / Abbreviation: ‘Tchn. Umweltsch.’). This concept has been replaced entirely either by the more general term of ‘environmental protection’ (In German: ‘Umweltschutz’) or by more specific key terms. This might also represent the decreasing relevance of end-of-pipe technologies which used to be more strongly – but not solely – associated with technical environmental protection. As Horbach et al. (2009) report, end-of-pipe technologies have lost significance in contrast to integrated environmental protection. Other keywords exhibit increased frequencies of occurrence, for example ‘building insulation (heat insulation)’ (In German: ‘Gebäudedämmung (Wärmeschutz)’), which might have been triggered by the more stringent requirements of the Energy Saving Ordinance (Energieeinsparverordnung, EnEV) and other regulations covered by the German CO2 Building Modernization Program (In German: ‘Gebäudesanierungspro-gramm’, for further details see Kuckshinrichs et al. 2010 and Rosenow 2012). Some-times just the spelling was changed, such as in the case of photovoltaics (from ‘Pho-tovoltaik’ to ‘Fotovoltaik’), which shows the importance of fuzzy logic features of the text mining algorithm. In 2016, we also see genuine new terms, such as ‘electric and hybrid vehicles’ (In German: ‘Elekro- und Hybridfahrzeuge’) or ‘smart home’: these two examples refer to new technological trends in the fields of mobility and energy efficiency in buildings. For further information, the online appendix ‘Text Mining’ also includes the complete time series of word clouds from 2006 and 2012 to 2016 (Figure OA-TM-1) as well as word clouds from 2016 grouped by each of the keyword catego-ries (Figure OA-TM-2). Table 6 contains the results of the frequency analysis after the semi-automatic coding, showing especially how many BERUFENET requirements are identified as ‘green’ and how many occupations contain those green tasks.

IAB-Discussion Paper 14/2018 33
Table 6 Frequency table of matches from keywords to green tasks and occupations, 2012/ 2016
Green tasks category Number of keywords
1st step: Keyword-
requirements matches
2nd step: Green tasks- occupations
matches 2012 2016 2012 2016
Energy production & storage 20 14 15 58 71 Mobility & tourism 34 50 53 106 131 Building 21 19 21 268 295 Farming, forestry, food, consumer goods 19 15 16 91 107 Energy efficiency & further climate protec-tion 9 10 11 42 75
Emission protection (air, water, soil, noise) 27 26 26 146 168 Circular economy, (raw) material efficiency & waste management 13 24 24 87 92
Environmental protection (gen.) 10 25 25 256 306 Green tasks (total) 153 182 190 727 846 Share of total number of requirements 2.7% 2.6% 18.5% 19.9% Note: Total number of … … requirements … indiv. occupations 6,670 7,325 3,926 4,251
Source: BERUFENET, own calculations.
According to Table 6, 190 requirements were environment-related (‘green tasks’) in 2016. This represents 2.6 percent of all the requirements in BERUFENET. In that year, the 190 green tasks were included in 846 occupations, i.e. 19.9 percent of all individual occupations had at least one green task in their requirements profile. Con-sidering the mid-term period 2012 to 2016, it can be seen that the number of green tasks increased from 182 to 190 (+4.4 percent). However, the relative share of matched requirements remained the same or even decreased slightly in 2016 (from 2.7 percent to 2.6 percent), as the overall number of requirements increased more strongly during this period (+9.8 percent). In contrast, the total number of matched ‘green occupations’ – occupations containing at least one green task – grew faster than ‘non-green occupations’: between 2012 and 2016, the total number of green oc-cupations rose by 16.4 percent from 727 to 846, whereas the remaining occupations increased by 8.3 percent. Consequently the share of green occupations increased more than average from 18.4 percent to 19.9 percent during this period. With regard to the mid-term perspective from 2012 to 2016, Figure 3 illustrates the slight tendency towards a greening of requirements (‘green tasks’) and occupations.

IAB-Discussion Paper 14/2018 34
Figure 3 Number of hits after matching keywords with green tasks in BERUFENET 2012-2016
Source: BERUFENET, own calculations.
The additional use of green-task categories makes it possible to identify those green environmental fields that cause the overall change in requirements and occupations.
Table 6 also shows the distribution of matches in BERUFENET across the green tasks categories and their development between 2012 and 2016. In the first step, i.e. the keyword-requirements matches, the category of ‘building’ exhibits the largest growth, by 10.5 percent, whereas ‘mobility & tourism’ has the largest number of green tasks (2016: 53). ‘Emission protection’, ‘environmental protection (general)’ and ‘circular economy’ show a relatively large number of green tasks but no increase in tasks be-tween 2012 and 2016. ‘Farming, forestry, food & consumer goods’, ‘energy production & storage’ and ‘energy efficiency & further climate protection’ have smaller shares of the total number of green tasks, but each of them exhibited a slight increase in their number of green tasks – gaining one new green task each.
Analyzing the second step of matching at the level of green tasks categories, Figure 4 confirms that this step leads to a considerable number of hits. For example, in 2016 the 25 green tasks of ‘environmental protection (general)’ are matched with 306 indi-vidual occupations (growth rate 2006-2012: 19.5 percent). This is also the largest share of all the occupations with at least one green task, followed by the green tasks category ‘building’, matched with 295 occupations (growth rate 2006-2012: 10.1 per-cent). The remaining green tasks categories have fewer hits (from 168 in ‘emission protection’ to 71 hits in ‘energy production’) but they all show a positive growth rate between 2012 and 2016 (from 5.7 percent in ‘circular economy’ to 78.6 percent in ‘energy efficiency’).

IAB-Discussion Paper 14/2018 35
Figure 4 Number of hits after matching green tasks with occupations (8-digit level KldB2010): Individual occupations with at least one green task, grouped by green tasks categories
Source: BERUFENET, own calculations. Note: The online appendix comprises two corresponding tables with the time series of matches from green tasks to occupations.
The unweighted greenness-of-jobs index at individual occupation level
As explained in section 4, the unweighted greenness-of-jobs index (goji) is calculated as a ratio of the number of green tasks as described above and the total number of requirements. Table 7 provides a first idea of the distribution and values of goji by showing five occupations with maximum, medium and minimum gojitotal values respec-tively in 2016. For example, the occupation ‘specialist in environmental protection’ has the largest gojitotal. For this occupation, the first value in the column gojitotal is 0.889, i.e. 88.9 percent of the tasks performed by a specialist in environmental protection are ‘green’ in the sense of this paper. The three columns on the right contain the goji specifications based on core and additional requirements (gojicore and gojiadd), or based on the total number of skill requirements weighted by the requirements-type (gojiwtotal). Table 7 indicates that occupations with the largest gojitotal values have both large gojicore and large gojiadd values. Consequently, the difference between gojitotal and gojiwtotal is relatively small. In contrast, the example occupations from the center of the distribution show relatively high gojicore values but small or no gojiadd values. The smallest gojitotal values are 0.024. This group at the bottom of the distribution does not show a specific pattern: pos. 781 and 785 do not have any gojicore values, pos. 782 to 784 only have gojicore values but no gojiadd at all. Therefore, it can be concluded that the composition of green tasks within each ‘green occupation’ (with gojitotal > 0) differs considerably.

IAB-Discussion Paper 14/2018 36
Table 7 Greenness-of-jobs ranking of individual occupations: Top 5/Medium 5/Last 5 gojitotal values in 2016 (Kldb2010, 8-digit)
Pos. Occupational title (English translation) gojito-tal
gojicore
goji-add
gojiwto-tal
Top 5 1 Specialist - Environmental protection 0.889 0.900 0.875 0.892 2 Environmental advisor 0.850 0.833 0.857 0.841 3 Recycling specialist 0.769 0.750 0.778 0.759 4 Environmental auditor 0.765 0.750 0.769 0.756 5 Environmental management officer 0.750 0.700 0.786 0.729 … Medium 5 (Median gojitotal: 0.083) 388 Woodworking mechanic - Wood-based panel industry 0.083 0.250 0.042 0.183 389 Woodworking mechanic - Sawmill industry 0.083 0.250 0.050 0.183 390 Standardization expert 0.083 0.250 0.000 0.167 391 Master of hydraulic engineering 0.083 0.182 0.000 0.121 392 Technician - Machine tech. (process engineering) 0.083 0.167 0.000 0.111 … Last 5 781 Engineer - Viticulture 0.025 0.000 0.042 0.014 782 Motor mechanic 0.024 0.125 0.000 0.083 783 Engineer - Air-conditioning system technology 0.024 0.043 0.000 0.029 784 Engineer - Refrigeration system technology 0.024 0.037 0.000 0.025 785 Traffic construction engineer 0.024 0.000 0.043 0.014
Note: The decrease in the number of occupations between 2006 and 2011 is a technical effect due to the change in the occ. classification from KldB1988 to KldB2010. Therefore the total numbers of occupations in 2006 and 2011 et seq. cannot be compared, although the total number of requirements is still comparable.
Source: BERUFENET, own calculations.
To compare the general development of the goji values of occupations, I examine two groups: all occupations (also including occupations with a goji value of zero) and only occupations with a gojitotal larger than zero. Based on this distinction, Table 8 summa-rizes the development of different goji variations between 2012 and 2016. According to this table, the total number of occupations with gojitotal > 0 increases by 14.1 percent to 785 individual occupations. Relative to the total number of 3,946 individual occu-pations in 2016, this is a share of 19.9 percent ‘green’ occupations (2012: 18.6 per-cent). As a first interim result, I can state that a greening of occupations is occurring that amounts to 14.1 percent in terms of the growth of individual occupations that have an unweighted gojitotal larger than zero from 2012 to 2016. But does the level of goji also increase? Within the group of all occupations, the average gojitotal rises by 10.6 percent from 0.023 to 0.025. When distinguishing between requirement types, the growth of gojicore is even higher (15.3 percent), whereas the growth of gojiadd is lower (6.2 percent). Because the core requirements have twice the weight of the additional requirements in the gojiwtotal, its growth is 1.2 percentage points larger than gojitotal.
If these comparisons are restricted to the group of occupations with gojitotal > 0 (‘goji occupations’), we see that the average values of gojicore and goji(w)total also rise. With regard to gojicore and goji(w)total, the absolute growth of the goji value is even higher than in the overall group, whereas the relative growth as a percentage is lower than in the group of all occupations. Only the gojiadd values show a slight decrease in the
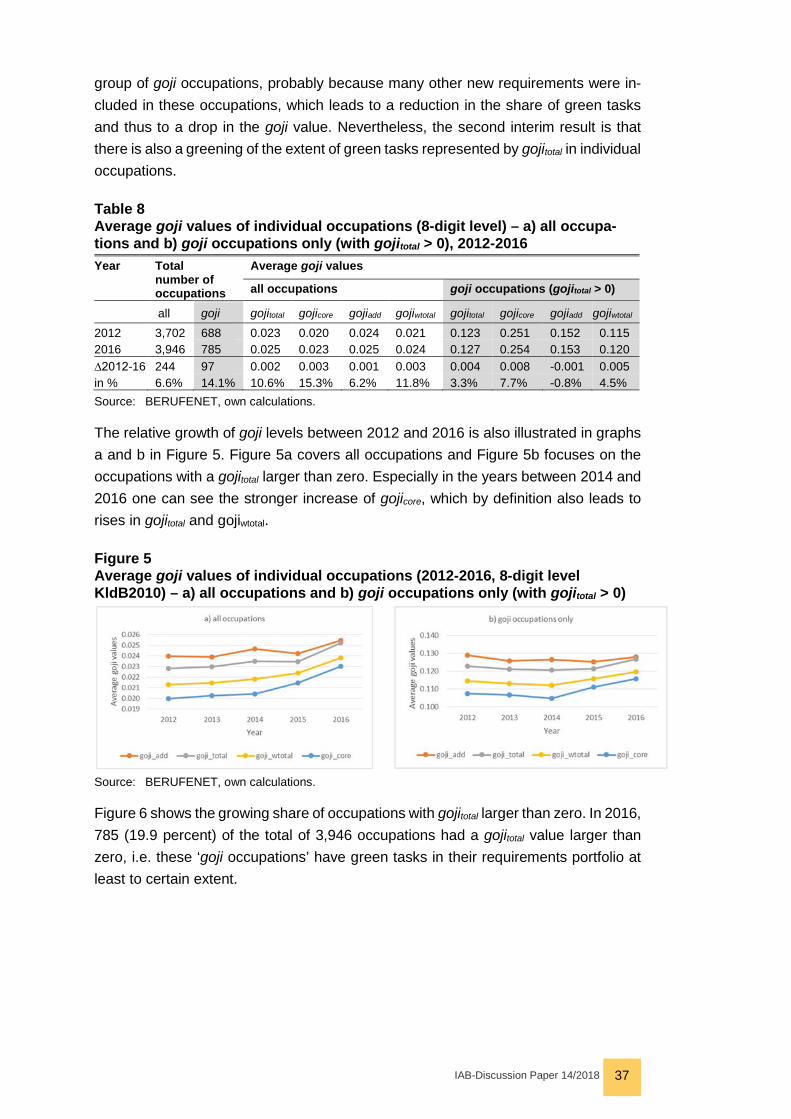
IAB-Discussion Paper 14/2018 37
group of goji occupations, probably because many other new requirements were in-cluded in these occupations, which leads to a reduction in the share of green tasks and thus to a drop in the goji value. Nevertheless, the second interim result is that there is also a greening of the extent of green tasks represented by gojitotal in individual occupations.
Table 8 Average goji values of individual occupations (8-digit level) – a) all occupa-tions and b) goji occupations only (with gojitotal > 0), 2012-2016 Year Total
number of occupations
Average goji values
all occupations goji occupations (gojitotal > 0)
all goji gojitotal gojicore gojiadd gojiwtotal gojitotal gojicore gojiadd gojiwtotal 2012 3,702 688 0.023 0.020 0.024 0.021 0.123 0.251 0.152 0.115 2016 3,946 785 0.025 0.023 0.025 0.024 0.127 0.254 0.153 0.120 ∆2012-16 244 97 0.002 0.003 0.001 0.003 0.004 0.008 -0.001 0.005 in % 6.6% 14.1% 10.6% 15.3% 6.2% 11.8% 3.3% 7.7% -0.8% 4.5% Source: BERUFENET, own calculations.
The relative growth of goji levels between 2012 and 2016 is also illustrated in graphs a and b in Figure 5. Figure 5a covers all occupations and Figure 5b focuses on the occupations with a gojitotal larger than zero. Especially in the years between 2014 and 2016 one can see the stronger increase of gojicore, which by definition also leads to rises in gojitotal and gojiwtotal.
Figure 5 Average goji values of individual occupations (2012-2016, 8-digit level KldB2010) – a) all occupations and b) goji occupations only (with gojitotal > 0)
Source: BERUFENET, own calculations.
Figure 6 shows the growing share of occupations with gojitotal larger than zero. In 2016, 785 (19.9 percent) of the total of 3,946 occupations had a gojitotal value larger than zero, i.e. these ‘goji occupations’ have green tasks in their requirements portfolio at least to certain extent.

IAB-Discussion Paper 14/2018 38
Figure 6 Share of individual occupations (8-digit level) with gojitotal > 0 in 2012 and 2016
Source: BERUFENET, own calculations.
Looking at the differences in terms of core and additional requirements, Figure 7 doc-uments that the number of occupations with gojiadd > 0 have the highest absolute number of new arrivals. In contrast, the occupations with gojicore > 0 include fewer new occupations (+63) but show the highest rate of increase (+21.4 percent). Neverthe-less, the number of occupations with gojiadd > 0 (656) is still almost twice as high as the number of occupations with gojicore > 0 (357). This indicates that up to now it is above all the large number of green additional tasks that is responsible for the large number of occupations with gojitotal > 0, whereas the strong increase in the number of green core tasks is responsible for the substantial growth of gojitotal.
Figure 7 Number of individual occupations with goji > 0 (8-digit level KldB2010)
Source: BERUFENET, own calculations.
137 individual occupations experienced an increase in gojitotal between 2012 and 2016.
Table 9 lists examples of the top, median and end of the distribution of these greening occupations. The first section of Table 9 covers the five occupations with the largest growth in gojitotal. For instance, between 2012 and 2016 the occupation of ‘technician - environmental protection technology (landscape ecology)’ increased from 0.300 to

IAB-Discussion Paper 14/2018 39
0.520, thus representing a rise of 0.220 in gojitotal (i.e. the share of green tasks in-creased by 22 percentage points). In the center of the distribution we see occupations such as ‘dietary cook’ or ‘body and vehicle construction mechanic – body mainte-nance’, which exhibit a greening of 0.035 and 0.034, respectively. The latter occupa-tion is also an example of an occupation that had no green task at all in 2012. The lowest level of greening can be observed in the occupation of ‘agricultural laboratory technician’ with a delta of 0.001. The entire list of greening occupations documents the wide range of different occupations that show an increase in goji between 2012 and 2016.
Table 9 Greening of jobs: ranking of individual occupations: Top/Medium/Last 5 of ∆ gojitotal 2012 - 2016 (Kldb2010, 8-digit)
gojitotal Pos. Occupational title (English translation) ∆ abs. 2012 2016
Top 5
1 Technician – Environm. protection techn.(landscape ecology) 0.220 0.300 0.520
2 Technician - Waste technology 0.212 0.407 0.619
3 Extension specialist (heat, cold and sound insulation work) 0.199 0.176 0.375
4 Wood preservation expert 0.144 0.056 0.200
5 Two-wheeler mechatronic technician – Production 0.139 0.111 0.250
... Medium 5 (Median ∆gojitotal: 0.035)
71 Dietary cook 0.035 0.080 0.115
72 Specialist agricultural farmer - Agricultural technology 0.035 0.056 0.091 73 Electronics technician - Energy & building services engineering 0.035 0.042 0.077
74 Master chimney sweep 0.035 0.238 0.273 75 Body and vehicle construction mechanic - Body maintenance 0.034 0.000 0.034
... Last 5
133 Food inspector 0.003 0.050 0.053
134 Helpers - Wood, wickerwork 0.002 0.048 0.050
135 Engineer - Interior design 0.002 0.040 0.042
136 Technician - Construction engineering 0.002 0.038 0.040
137 Agricultural laboratory technician 0.001 0.037 0.038
Source: BERUFENET, own calculations.
With regard to the unweighted goji, this subsection has shown that both the number of occupations with goji > 0 and the level of goji values increases between 2012 and 2016. The different values show that the level of greenness varies depending on the goji type examined (core/add/total/wtotal). It is therefore crucial to decide precisely which aspect of greenness should be considered for an in-depth analysis. The empir-ical example in section ‘econometric analysis’ shows the differences this decision yields in econometric analysis. As robustness checks prove, the results of models using gojiwtotal show less statistically significant differences to gojitotal. To reduce the

IAB-Discussion Paper 14/2018 40
complexity of the paper, I do not use the results for the gojiwtotal in the remainder of this paper.13
At the individual-occupation (8-digit) level I can show that there is a greening of jobs in respect of the unweighted goji. However, at this stage it is not possible to consider the employment development associated with the greenness and greening of jobs, because in German employment statistics and administrative employment data, the occupational data are coded at the 5-digit level.
5.2 The employment-weighted distribution of the greenness and greening of jobs
The goji at aggregated occupational levels As described in section 4, the use of employment statistics data facilitates an aggre-gation of the goji at every occupational, industrial and regional level. The only limita-tion is the availability of employment statistics at the relevant breakdown level. Table 10 illustrates the number of aggregates with a goji larger than zero within the hierar-chical structure of KldB 2010. The table documents the aggregation levels available after the aggregation procedure. There is the unweighted goji at 5-digit level after applying an equal distribution assumption. Furthermore, there are five aggregates of KldB 2010 as well as these five aggregates plus the information about the requirement level (5th digit of Kldb2010). All in all the table corroborates the results of the descrip-tive analysis at individual-occupation (8-digit) level: between 2012 and 2016 the num-ber of occupational goji aggregates increases – both after the aggregation to 5-digit level using an equal distribution assumption and after the aggregation to 3-digit level using weights derived from the specific employment share of the occupational groups.
13 Employment-weighted aggregates of the gojiwtotal as well as the results of all estimations
and robustness checks using gojiwtotal are available from the author on request.

IAB-Discussion Paper 14/2018 41
Table 10 The hierarchical structure of the classification of occupations 2010 (KldB 2010) and their number of aggregates with goji > 0
Breakdown level (Digit level KldB 2010)
Year Number of breakd. levels
Number of aggregates with goji > 0 𝒈𝒈𝒈𝒈𝒈𝒈𝒈𝒈𝒕𝒕𝒈𝒈𝒕𝒕𝒂𝒂𝒕𝒕>0 𝒈𝒈𝒈𝒈𝒈𝒈𝒈𝒈𝒄𝒄𝒈𝒈𝒄𝒄𝒄𝒄>0 𝒈𝒈𝒈𝒈𝒈𝒈𝒈𝒈𝒂𝒂𝒐𝒐𝒐𝒐>0
Unweighted goji at 5-digit level (equal distribution assumption) Occupational type 5-digit level
2012 1,174 355 166 311 2016 1,192 376 184 329
∆2012-16 18 21 18 18 in % 1.5% 5.9% 10.8% 5.8%
Employment-weighted goji Occupational groups, main groups and areas Occupational group 3-digit level
2012 140 82 49 78 2016 140 84 53 80
∆2012-16 0 2 4 2 in % 0.0% 2.4% 8.2% 2.6% Occupational main group 2-digit level
2012 36 34 28 33 2016 36 34 30 33
Occupational areas 1-digit level
2012 9 9 9 9 2016 9 9 9 9
Occupational segments and sectors Occupational segments S2-digit level
2012 14 14 13 14 2016 14 14 14 14
Occupational sectors S1-digit level
2012 5 5 5 5 2016 5 5 5 5
Occupational aggregates plus requirement level (5th digit) Occ. areas + req. level 3-digit level + 5th digit
2012 422 170 96 149 2016 424 173 106 151
Occ. main group + req. level 2-digit level + 5th digit
2012 131 90 62 80 2016 132 90 66 80
Occ. group + req. level 1-digit level + 5th digit
2012 36 31 29 28 2016 36 31 29 27
Occ. segments + req. level S2-digit level + 5th digit
2012 54 44 36 39 2016 55 44 37 39
Occ. sectors + req. level S1-digit level + 5th digit
2012 20 17 16 16 2016 20 17 16 15
Note: I do not use the 4-digit level, because the number of sub-groups included there is 700, which is relatively close to the 5-digit level (1,286 breakdown levels).
Source: BERUFENET, employment statistics data from the Federal Employment Agency, own calcu-lations.
At the 2-digit level and higher levels the greening of jobs in absolute numbers of ag-gregates with goji larger than zero becomes less obvious. In Table 10, only little de-velopment of the goji values is discernible. However, a look at the development of goji values within these higher aggregated levels reveals that a greening of jobs is still visible even at this level. For example, Table 11 presents the gojitotal values at the level of occupational sectors (S1-digit level). These values show a growth in gojitotal of 0.002 in the occupational sector concerning the production of goods, and a growth of 0.001 in the occupational sectors comprising occupations in personal services as well as occupations in business administration and other business-related services. This de-tailed view also reveals the occurrence of ‘degreening’ (-0.002) in service occupations in the IT sector and the natural sciences as well as in ‘S5: Other occupations in com-mercial services’. This development is caused by a more substantial increase in non-
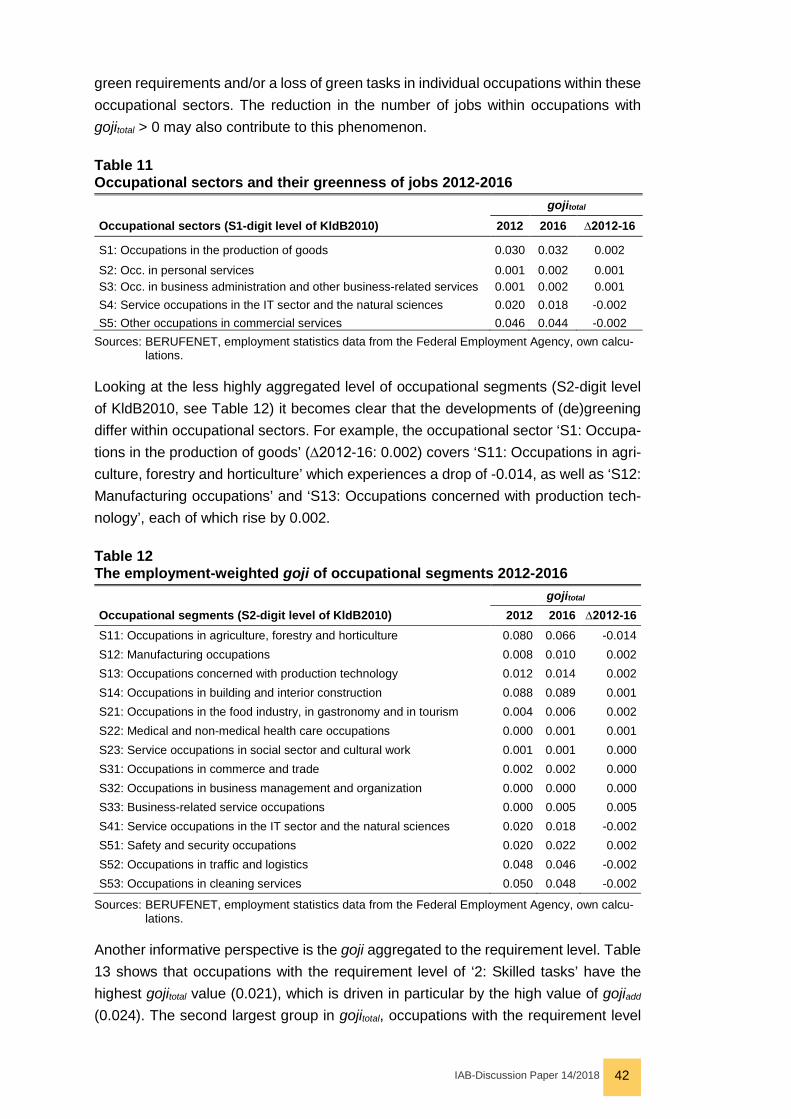
IAB-Discussion Paper 14/2018 42
green requirements and/or a loss of green tasks in individual occupations within these occupational sectors. The reduction in the number of jobs within occupations with gojitotal > 0 may also contribute to this phenomenon.
Table 11 Occupational sectors and their greenness of jobs 2012-2016
Occupational sectors (S1-digit level of KldB2010) gojitotal
2012 2016 ∆2012-16
S1: Occupations in the production of goods 0.030 0.032 0.002
S2: Occ. in personal services 0.001 0.002 0.001 S3: Occ. in business administration and other business-related services 0.001 0.002 0.001 S4: Service occupations in the IT sector and the natural sciences 0.020 0.018 -0.002 S5: Other occupations in commercial services 0.046 0.044 -0.002
Sources: BERUFENET, employment statistics data from the Federal Employment Agency, own calcu-lations.
Looking at the less highly aggregated level of occupational segments (S2-digit level of KldB2010, see Table 12) it becomes clear that the developments of (de)greening differ within occupational sectors. For example, the occupational sector ‘S1: Occupa-tions in the production of goods’ (∆2012-16: 0.002) covers ‘S11: Occupations in agri-culture, forestry and horticulture’ which experiences a drop of -0.014, as well as ‘S12: Manufacturing occupations’ and ‘S13: Occupations concerned with production tech-nology’, each of which rise by 0.002.
Table 12 The employment-weighted goji of occupational segments 2012-2016
Occupational segments (S2-digit level of KldB2010) gojitotal
2012 2016 ∆2012-16 S11: Occupations in agriculture, forestry and horticulture 0.080 0.066 -0.014 S12: Manufacturing occupations 0.008 0.010 0.002 S13: Occupations concerned with production technology 0.012 0.014 0.002 S14: Occupations in building and interior construction 0.088 0.089 0.001 S21: Occupations in the food industry, in gastronomy and in tourism 0.004 0.006 0.002 S22: Medical and non-medical health care occupations 0.000 0.001 0.001 S23: Service occupations in social sector and cultural work 0.001 0.001 0.000 S31: Occupations in commerce and trade 0.002 0.002 0.000 S32: Occupations in business management and organization 0.000 0.000 0.000 S33: Business-related service occupations 0.000 0.005 0.005 S41: Service occupations in the IT sector and the natural sciences 0.020 0.018 -0.002 S51: Safety and security occupations 0.020 0.022 0.002 S52: Occupations in traffic and logistics 0.048 0.046 -0.002 S53: Occupations in cleaning services 0.050 0.048 -0.002
Sources: BERUFENET, employment statistics data from the Federal Employment Agency, own calcu-lations.
Another informative perspective is the goji aggregated to the requirement level. Table 13 shows that occupations with the requirement level of ‘2: Skilled tasks’ have the highest gojitotal value (0.021), which is driven in particular by the high value of gojiadd (0.024). The second largest group in gojitotal, occupations with the requirement level

IAB-Discussion Paper 14/2018 43
of ‘1: Unskilled/semiskilled tasks’ (0.015) has seen a decrease of -7.3 percent (-0.001). In this group, gojiadd even fell to zero. Exhibiting a 15.9 percent increase (+ 0.002), occupations with the requirement level of ‘3: Complex tasks’ have the largest increase in gojitotal values, with both level and growth being driven mainly by the gojiadd values (2016: 0.015). These developments described in Table 13 suggest that the greening of jobs is mainly driven by the increase in occupations with complex tasks, skilled tasks and highly complex tasks. The occupations with unskilled/semiskilled tasks still have a relatively large gojicore value, but they are the only group that show decreasing goji values. With regard to the level of greenness-of-jobs, Table 12 also provides an overview of the substantial differences between the occupational aggre-gates. At the highest level of aggregation, occupational sectors (S1-digit level), the occupational sector ‘S5: Other occupations in commercial services’ has the highest goji value in 2016 (0.044). Looking at the level below that, occupational segments (S2-digit level), it becomes obvious that this high value is driven mainly by the two occupational segments ‘S52: Occupations in traffic and logistics’ (0.046) and ‘S53: Occupations in cleaning services’ (0.048). However there are even higher values at this level, e.g. ‘S14: Occupations in building and interior construction’ is the occupa-tional segment with the highest goji value in 2016 (0.089). With a gojicore of 0.046, the occupational area ‘(3) construction, architecture, surveying and technical building ser-vices’ shows the highest value at this level, closely followed by ‘(1) Agriculture, for-estry, farming, and gardening’ with a value of 0.042. After the third largest value of 0.020 (‘(5) Traffic, logistics, safety and security’), the only areas remaining have a very small gojicore. Three occupational areas show a value of 0.000 due to rounding to three decimal places. In fact, they all have shares larger than zero, but with very low values.
Table 13 Employment-weighted goji grouped by requirement level
Requirement level (5th digit of KldB 2010)
gojitotal gojicore gojiadd 2016 ∆2012-16 2016 2016
1: Unskilled/semiskilled tasks 0.015 -0.001 0.015 0.000 2: Skilled tasks 0.021 0.001 0.015 0.024 3: Complex tasks 0.011 0.002 0.006 0.015 4: Highly complex tasks 0.007 0.001 0.003 0.009
Source: BERUFENET, statistics data from the Federal Employment Agency, own calculations.
As mentioned above, I apply the aggregation procedure for the 5-digit level, and – as employment-weighted goji – for every breakdown level for the 3-, 2-, 1-, S1- and S2-digit-levels of the occupational classification KldB 2010. Furthermore, I calculate em-ployment-weighted goji values for each of these breakdown levels differentiated ac-cording to the requirement level (5th digit) of KldB 2010. The online appendix presents some of these employment-weighted aggregates. The aggregation procedure also facilitates the calculation of an employment-weighted overall goji for Germany, which may be regarded as an overall indicator for the greening of jobs in Germany. Table 14 provides an overview of the development of this ‘German greening of jobs index (goji.de)’ between 2012 and 2016.

IAB-Discussion Paper 14/2018 44
Table 14 The employment-weighted overall goji.de (KldB 2010) 2012-2016
Year gojitotal gojicore gojiadd Total
employment Full-green
employment equivalents
2012 0.0196 0.0143 0.0202 27,168,448 532,946 2016 0.0198 0.0150 0.0199 29,772,496 589,589
∆2012-16 0.0002 0.0007 -0.0003 2,604,048 56,643 in % 1.0% 4.6% -1.7% 9.6% 10.6%
Source: BERUFENET, statistics data from the Federal Employment Agency, own calculations.
In order to calculate the total employment development relative to gojitotal, (‘full-green employment equivalents’), I add up the individual employment data in relation to gojtotal. After this step I obtain the hypothetical number of employees with a pseudo gojitotal of 1. Using these ‘full-green equivalents’, we see from Table 14 that in 2016 there are 0.59 million persons employed in occupations with a hypothetical gojitotal of 1 (all gojitotal of the 29.77 million employment relationships with gojitotal > 0 are added together). Between 2012 and 2016, the full-green equivalents increased by 10.6 per-cent. As this describes only the raw employment development grouped by levels of gojitotal, the econometric analysis is going to disentangle the association between the greenness of jobs and employment growth.
The sectoral distribution of the goji The sectoral distribution of the goji identifies the industries in which the greening takes place. Table 15 presents the industry sections (1-digit level) of the Classification of Economic Activities, Edition 2008 (WZ 2008). Considering the greenness of industries in 2016, the table shows industry section ‘E. Water supply; sewerage, waste manage-ment, remediation activities’ as being the one with the largest gojitotal (0.108), followed by ‘H. Transportation and storage’ (0.063) and ‘F. Construction’ (0.057). In terms of the greening of jobs within industries, section ‘O. Public administration and defense; compulsory social security’ reports the largest growth in the absolute gojitotal value by +0.006, whereas ‘I. Accommodation and food service activities’ has the largest rela-tive growth rate (+69 percent) with an increase in gojitotal of 0.003. With -0.008 (-15.8 percent), the strongest loss of gojitotal – in both the absolute value and the percentage share – can be observed for ‘A. Agriculture, forestry and fishing’. This corroborates the finding in the occupational aggregates presented above (Table 12), where occu-pations in ‘S 11. Occupations in agriculture, forestry and horticulture’ show a strong decrease.

IAB-Discussion Paper 14/2018 45
Table 15 Industry sections and their employment-weighted greenness-of-jobs index (ISIC Rev. 4 / WZ 2008, 1-digit level), 2012-2016
Goji distribution in industry sections gojitotal
2012 2016 ∆2012-16 in %
A. Agriculture, forestry and fishing 0.052 0.044 -0.008 -
15.8% B. Mining and quarrying 0.020 0.022 0.002 9.0% C. Manufacturing 0.010 0.009 0.000 -1.6% D. Electricity, gas, steam and air conditioning supply 0.027 0.031 0.004 13.9% E. Water supply; sewerage, waste management, remediation activities 0.107 0.108 0.001 1.1% F. Construction 0.054 0.057 0.003 5.8% G. Wholesale and retail trade; repair of motor vehicles / mo-torcycles 0.006 0.008 0.002 37.9% H. Transportation and storage 0.066 0.063 -0.003 -3.8% I. Accommodation and food service activities 0.004 0.008 0.003 69.0% J. Information and communication 0.002 0.002 0.000 18.2% K. Financial and insurance activities 0.001 0.001 0.000 14.6% L. Real estate activities 0.026 0.029 0.003 10.9% M. Professional, scientific and technical activities 0.008 0.009 0.001 12.8% N. Administrative and support service activities 0.028 0.027 -0.001 -2.6% O. Public administration and defense; compulsory social secu-rity 0.016 0.022 0.006 36.5% P. Education 0.005 0.006 0.001 13.6% Q. Human health and social work activities 0.003 0.004 0.000 15.0% R. Arts, entertainment and recreation 0.008 0.009 0.001 9.1% S. Other service activities 0.010 0.011 0.001 9.6% T. Activities of households as employers; undifferentiated goods- and services-producing activities of households for own use 0.007 0.007 0.000 0.1% U. Activities of extraterritorial organizations and bodies 0.014 0.017 0.003 20.8%
Note: Industry sections according to the International Standard Industrial Classification of All Eco-nomic Activities, Rev.4 (ISIC Rev. 4) and Classification of Economic Activities, Edition 2008 (WZ 2008).
Sources: BERUFENET, employment statistics data from the Federal Employment Agency, own calcu-lations.
The regional distribution of the goji Analogous to the industry aggregates, I also apply the weighting procedure to NUTS-1 level (federal state level) and NUTS-3 level (county level). As part of the results of this conversion, the following two maps should give an example of gojicore at NUTS-1 / federal state level (Figure 8) and at NUTS-3 /county level (Figure 9). The two maps reveal pronounced differences between federal states and between counties. In the first place, this reflects the spatial disparities in terms of occupational distributions between regions. Figure 8 shows relatively high goji values in the north-eastern states of Mecklenburg-Vorpommern and Brandenburg, as well as in the states of Saxony-Anhalt, Thuringia and Rhineland-Palatinate, which might reflect to some extent the relatively large share of agricultural and other ‘green-by-nature’ occupations. Mean-while, however, renewable energy production also influences this distribution. For ex-

IAB-Discussion Paper 14/2018 46
ample, several manufacturers of wind power plants are located in Mecklenburg-Vor-pommern14 and there is a considerable amount of biogas production in Branden-burg15. Some states, such as Bavaria and Baden-Wuerttemberg, have lower goji val-ues despite the fact that many people work in green occupations there. This is prob-ably due to a greater heterogeneity of occupations (many green occupations, but also many/more non-green occupations). This reason might also hold for the city states of Berlin, Hamburg and Bremen. Moreover, these and other large cities do not have many ‘green-by-nature’ occupations, e.g. in the context of agriculture. The reflections on federal states (Figure 8) can be applied to a large extent to the county level, too. Interestingly, Figure 9 reveals that within some federal states there is considerably more heterogeneity between counties (e.g. in Bavaria or Baden-Wuerttemberg). Hence, the greenness of specific counties seems to stem partly from county-level characteristics, which should be taken into account in future analyses.
Figure 8 Gojicore 2014 at federal state level (NUTS-1), weighted by employment
Federal states level (NUTS 1) gojicore 2014
Note: Federal states and county codes: NUTS Classification (NUTS 1 and 3). Sources: BERUFENET, employment statistics data from the Federal Employment Agency, own cal-
culations.
14 Report on the wind energy industry in Mecklenburg-Vorpommern (German language):
https://www.energie-und-management.de/nachrichten/alle/detail/mecklenburg-vorpommern-vorwaerts-mit-dem-wind-101817
15 Statistics about renewable energies in the federal states of Germany (German language) https://www.foederal-erneuerbar.de/landesinfo/bundesland/BB/kategorie/bioenergie/auswahl/189-anzahl_und_dichte_vo
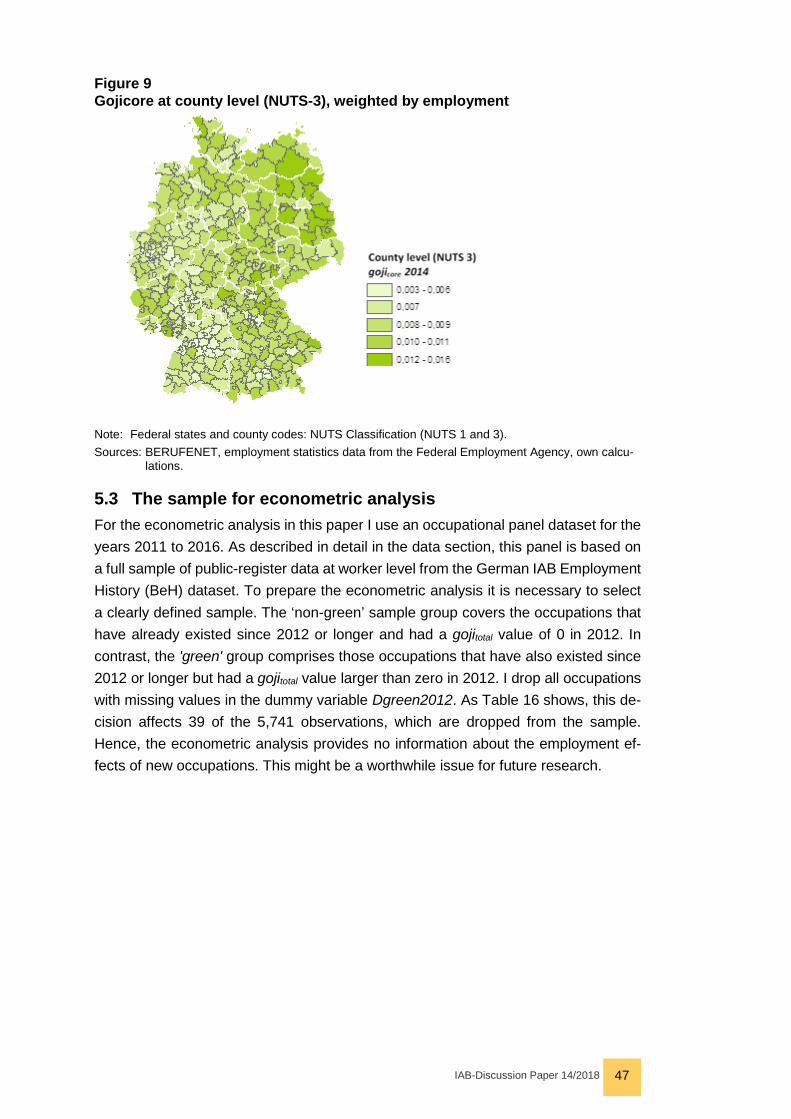
IAB-Discussion Paper 14/2018 47
Figure 9 Gojicore at county level (NUTS-3), weighted by employment
Note: Federal states and county codes: NUTS Classification (NUTS 1 and 3). Sources: BERUFENET, employment statistics data from the Federal Employment Agency, own calcu-
lations.
5.3 The sample for econometric analysis For the econometric analysis in this paper I use an occupational panel dataset for the years 2011 to 2016. As described in detail in the data section, this panel is based on a full sample of public-register data at worker level from the German IAB Employment History (BeH) dataset. To prepare the econometric analysis it is necessary to select a clearly defined sample. The ‘non-green’ sample group covers the occupations that have already existed since 2012 or longer and had a gojitotal value of 0 in 2012. In contrast, the 'green' group comprises those occupations that have also existed since 2012 or longer but had a gojitotal value larger than zero in 2012. I drop all occupations with missing values in the dummy variable Dgreen2012. As Table 16 shows, this de-cision affects 39 of the 5,741 observations, which are dropped from the sample. Hence, the econometric analysis provides no information about the employment ef-fects of new occupations. This might be a worthwhile issue for future research.

IAB-Discussion Paper 14/2018 48
Table 16 Sample groups – Number of occupations with gojitotal = 0 (‘Non-green’) or gojitotal > 0 (‘Green’) in 2012
Number of occupations - selection by: Dummy variable Dgreen2012 (Non-green = gojitotal 2012 = 0; Green = gojitotal 2012 >0)
Year Non-green (0) Green (1) Sample (0+1) Missing (.) Total
2012 784 362 1,146 1 1,147 2013 782 361 1,143 9 1,152 2014 777 361 1,138 11 1,149 2015 778 360 1,138 7 1,145 2016 777 360 1,137 11 1,148 Total 3,897 1,804 5,702 (to drop:) 39 5,741
Sources: BeH, BERUFENET, own calculations.
Table 17 describes the sample by comparing non-green and green occupations in 2012 and 2016, showing all available variables, including the absolute values and the delta values for 2012 to 2016 as percentages. As I restrict the analysis to the base year of 2012, the sample is not refilled if occupations disappear between 2012 and 2016. Consequently, both sample groups decrease slightly in number from 784 to 777 (non-green) and 362 to 360 (green). Both groups may experience greening or de-greening between 2012 and 2016 or may just keep the same gojitotal value of 2012. The potential transitions of the gojitotal values and their relations to employment growth are covered by fixed effects regressions, which are presented in the next subsection.
Furthermore, Table 17 shows similarities and marked raw differences between char-acteristics of occupational sample groups: in terms of the number of employees (total of full-time equivalents FTE), in 2016 the non-green group accounts for 77.0 percent (21.037M FTE) of the sample and the green group 23.0 percent (6.290M FTE). In the context of FTE, the group of green occupations shows an overall raw employment growth of 4.5 percent between 2012 and 2016, which is 0.7 percentage points larger than the employment growth of the non-green group (5.2 percent). The larger differ-ence in headcount growth between the green and the non-green groups (1.9 percent-age points more in the non-green group) reflects the development of full-time employ-ment: the green group has a larger share of full-time employees than the non-green group and the gap between the two groups even increased between 2012 and 2016.
Looking at wages – for comparison reasons I only use the imputed wages of full-time male workers here – both groups report an increase in wages between 2012 and 2016. The workers in the non-green occupation group saw a slightly larger raw wage growth than those in the green occupation group (delta value of median of imputed log wages: 0.1 percentage points). In general, there is a large raw wage gap between the groups: at 116.76 EUR, the median daily wage of male full-time workers in the non-green group in 2016 is about 15.7 percent larger than that of this employee group in green occupations (98.44 EUR). Obviously, this large raw wage gap is driven, among other things, by the larger share of highly educated employees, which was 21.0 percent in the non-green group and 11.4 percent in the green group in 2016.

IAB-Discussion Paper 14/2018 49
Besides the data on employee numbers and wages, there are plenty of control varia-bles that help to explain the differences between the groups of non-green and green occupations. In terms of the composition of employment characteristics, the green group has a larger share of full-time employees and of fixed-term contracts, but also a larger share of workers in marginal employment. However, the share of temporary agency work is smaller in green occupations than in non-green occupations.
There is also a pronounced heterogeneity in terms of employee characteristics of oc-cupations: green occupations seem to have a good absorption capacity for older em-ployees, as the proportion of this group in the green occupations is about 17 percent higher. In contrast, the non-green occupations employ about 22 percent more em-ployees who are younger than 30. The share of middle-aged workers as well as the average tenure are at a similar level. The green occupations are so far relatively male-dominated, because the share of female workers is about 50 percent smaller than in the non-green occupations group. This is in line with the literature which also claims that institutional changes should be undertaken in order to motivate women to work in green occupations. This claim is supported by the results of Horbach/Jacob (2018), who find that a large proportion of highly educated women and a gender diverse board of directors is positively linked to the realization of eco-innovations.
There seems to be particularly strong demand not only for older workers but also for low-skilled workers in green occupations, as their share is substantially larger than it is in the group of non-green occupations. In turn, the latter have a larger share of highly educated workers (non-green: 21.0 percent; green: 11.4 percent in 2016). Of course – like any aggregated characteristic – these values vary between each indi-vidual occupation.
Looking at the composition of occupational characteristics, the requirement level cor-responds to the distribution of the education level: the green group has more un-skilled/semi-skilled occupations and specialist occupations, whereas in the non-green group more workers are employed in complex specialist occupations and highly com-plex occupations. In terms of the average number of tasks and tools, the groups are relatively similar, but the task types vary strongly. Non-green occupations involve larger shares of non-routine analytical tasks and non-routine interactive tasks, whereas the group of green occupations has a much higher share of non-routine man-ual tasks. Overall, the group of green occupations has about ten percent fewer routine tasks (cognitive and manual). This indicates that green occupations entail a lower risk of being replaced by computer algorithms and/or robots. So far, however, the group of green occupations has a far smaller share of IT-aided and IT-integrated (‘industry 4.0’) digital tools. The interactions of the three trends of digitalization, routine biased technological change and the greening of the economy raises several interesting questions that cannot be covered by this paper, but shall be analyzed in more detail in future research.

IAB-Discussion Paper 14/2018 50
The composition of employer characteristics in the two groups also reveals pro-nounced differences and similarities: the largest share of small establishments is found in the group of green occupations, whereas the share of medium-sized firms is at the same level for green and non-green occupations. The share of larger establish-ments is greater in the group of non-green occupations. The establishment-age com-position is similar in both groups, indicating the same trend towards a larger share of older establishments. Looking at the differences in establishment size, it is no surprise that workers in green occupations are employed in establishments that pay lower wages (about ten percent less than the average wages in non-green occupations).
The sectoral distributions vary considerably within and between the groups. In gen-eral, green occupations are more prevalent in the primary sector and to some extent in the secondary sector. In contrast, the non-green occupations are prevailing in the tertiary sector. Within the group of green occupations, the industries with the largest shares are manufacturing, construction, and administrative and support service activ-ities. The green occupations have higher shares in in the following industry sections: ‘agriculture, forestry and fishing’, ‘electricity, gas, steam and air conditioning supply, ‘water supply, sewerage, waste management and remediation activities’, ‘construc-tion’, ‘transportation and storage’, ‘real estate activities’ as well as ‘administrative and support service activities’.
In respect of the regional distribution of occupations, the non-green group is more prevalent in core cities, while the green group has larger shares in rural districts. The category between these, that of ‘urbanized districts’, is equally occupied by both groups. The comparison of the distribution across federal states shows that green occupations have a higher share of employees in northern and especially eastern Germany. However, the larger share of green occupations in the eastern part of Ger-many decreased between 2006 and 2012. This may be due to the strong drop in the number of jobs in the eastern German solar industry. Besides the eastern German states, there are three western states with higher shares of green than non-green occupations: Schleswig-Holstein, Lower Saxony and Rhineland-Palatinate. The other states generally have similar or slightly higher shares of non-green occupations. Only the city states of Berlin and Hamburg have far higher shares of non-green occupa-tions.
Finally, the goji composition delivers some further insights: about two percent of oc-cupations that were non-green in the base year of 2012 have since become green. Additionally, two percent of the occupations that were already green in 2012 became greener between 2012 and 2016. The occupations with a goji larger than zero can be also distinguished by their shares of core tasks and additional tasks as well as by their green tasks categories (links to more than one category are possible). In 2016, 60.2 percent of green occupations have gojicore (covering only core tasks) larger than zero and 80.2 percent of green occupations have a gojiadd (covering only additional tasks) larger than zero. The green tasks categories of ‘building’, ‘circular economy’ and ‘mo-bility and tourism’ are the ones with the highest shares of green-task-specific gojitotal

IAB-Discussion Paper 14/2018 51
values larger than zero. To work out the relationship between the greenness and greening of jobs and employment growth, it is necessary to disentangle the different determinants by applying econometric methods. This last analytical step is described in the next section.
Table 17 Sample description: sample size, number of employees and sample means Non-green and green occupations 2012 and 2016
Non-green: gojitotal 2012 = 0; Green: gojitotal 2012 > 0 NON-GREEN GREEN NON-G. GREEN NON-G. GREEN 2012 2012 2016 2016 ∆2012-16 ∆2012-16 Variable (Label) abs. abs. abs. abs. ∆in % ∆in % Sample size: Number of observations Occupations existing in 2012 (N) 784 362 777 360 - - Number of employees Total full-time equivalents 19.995M 6.020M 21.037M 6.290M 5.2% 4.5% Total headcount 22.810M 6.978M 24.154M 7.260M 5.9% 4.0% Wages of full-time male workers Imputed log wages of male full-time workers - median
4.626 4.468 4.697 4.540 1.5% 1.6%
Imputed wages of male full-time work-ers - median
108.397 91.444 116.759 98.443 7.7% 7.7%
Employment characteristics Normal employment 0.957 0.933 0.964 0.944 0.7% 1.1% Marginal employment 0.043 0.067 0.036 0.056 -15.7% -15.7% Full-time 0.801 0.827 0.788 0.823 -1.7% -0.5% Permanent contract 0.888 0.903 0.846 0.864 -4.7% -4.4% Fixed-term contract 0.112 0.097 0.154 0.136 37.6% 40.7% Temporary agency work 0.034 0.025 0.034 0.023 -1.6% -5.9% Employee characteristics Employee age group: 16 to <30 years 0.198 0.149 0.192 0.149 -3.2% -0.1% Employee age group: >=30 to <50 y. 0.523 0.517 0.483 0.471 -7.5% -9.0% Employee age group: >=50 y. 0.279 0.334 0.325 0.380 16.3% 14.0% Tenure - average years 6.458 6.492 6.653 6.637 3.0% 2.2% Women 0.488 0.230 0.487 0.226 -0.4% -1.6% Foreign nationality 0.077 0.095 0.098 0.132 27.0% 38.1% Education level Low education 0.091 0.116 0.106 0.142 16.6% 22.6% Medium education 0.717 0.778 0.684 0.744 -4.6% -4.4% High education 0.192 0.106 0.210 0.114 9.2% 7.9% Occupational characteristics Requirement level Unskilled/semi-skilled occupation 0.155 0.172 0.157 0.174 1.2% 0.9% Specialist occupation 0.572 0.635 0.560 0.627 -2.1% -1.3% Complex specialist occupation 0.134 0.116 0.137 0.117 2.5% 0.7% Highly complex occupation 0.139 0.077 0.146 0.083 4.8% 7.5% Tasks characteristics Tasks complexity / N of tasks 18.554 18.637 19.381 19.040 4.5% 2.2% Number of core tasks 8.119 8.708 8.340 8.863 2.7% 1.8% Number of additional tasks 10.435 9.928 11.041 10.178 5.8% 2.5% Tasks-type: Non-routine analytical 0.269 0.166 0.279 0.172 3.5% 3.9% Tasks-type: Non-routine interactive 0.150 0.037 0.151 0.037 0.5% 0.5% Tasks-type: Routine cognitive 0.302 0.251 0.290 0.248 -3.7% -1.4%

IAB-Discussion Paper 14/2018 52
Non-green and green occupations 2012 and 2016 Non-green: gojitotal 2012 = 0; Green: gojitotal 2012 > 0
NON-GREEN GREEN NON-G. GREEN NON-G. GREEN 2012 2012 2016 2016 ∆2012-16 ∆2012-16 Variable (Label) abs. abs. abs. abs. ∆in % ∆in % Tasks-type: Routine manual 0.125 0.120 0.125 0.127 -0.4% 5.5% Tasks-type: Non-routine manual 0.154 0.426 0.155 0.416 1.0% -2.3% Tools characteristics Tools complexity: N of work tools 7.648 9.314 7.660 9.272 0.2% -0.5% Dig. tools share (total) 0.343 0.202 0.344 0.206 0.5% 1.8% Dig. tools share 1: IT-aided tools 0.322 0.192 0.323 0.195 0.4% 1.8% Dig. tools share 2: IT-integrated t. 0.021 0.010 0.021 0.010 1.9% 0.3% plus 27 variables for the goji composition – see Appendix (Table A-3) Employer characteristics Establishment size 1-49 0.383 0.454 0.356 0.423 -7.2% -6.8% Establishment size 50-449 0.397 0.370 0.383 0.358 -3.5% -3.4% Establishment size >500 0.220 0.176 0.261 0.219 18.9% 24.7% Establishment age 0-10 0.247 0.246 0.171 0.163 -30.8% -33.8% Establishment age 11-20 0.228 0.249 0.223 0.228 -2.3% -8.5% Establishment age >20 0.525 0.505 0.606 0.609 15.5% 20.7% Average daily wage in establishment 99.741 89.901 105.898 94.914 6.2% 5.6% Avg. age of workers in establishment 41.302 42.481 41.650 42.897 0.8% 1.0% Sectoral composition
Basic sectoral composition Primary sector 0.006 0.015 0.007 0.014 2.3% -5.6% Secondary sector 0.283 0.403 0.275 0.398 -2.9% -1.3% Tertiary sector 0.710 0.583 0.718 0.588 1.2% 1.0% plus 21 variables for sector composition at WZ-1 level (industry sections) – see Appendix (Table A-3) Regional composition
Regional types Core cities 0.380 0.326 0.382 0.328 0.5% 0.8% Urbanized districts 0.356 0.354 0.355 0.356 -0.2% 0.5%
Rural distr. with features of concentration
0.145 0.170 0.145 0.169 -0.4% -0.5%
Rural districts-sparsely populated 0.119 0.150 0.118 0.147 -0.6% -2.4% Federal states groups North 0.156 0.165 0.156 0.168 0.5% 1.8% West 0.350 0.338 0.346 0.335 -1.0% -1.1% East 0.181 0.211 0.180 0.204 -0.5% -3.1% South 0.314 0.285 0.317 0.293 1.2% 2.5% plus 16 variables for the regional composition at NUTS-1 level (fed. states) – see Appendix (Table A-3) Sources: BeH, BERUFENET, own calculations.
6 Econometric analysis
6.1 Empirical approach The empirical approach should support the third research question ‘Do occupations with larger greenness/greening show larger employment and wage growth?’ Two steps are necessary to answer this question: First, cross-sectional data regressions analyze the associations between the greenness of occupations (level of goji) and employment/wage growth. Second, panel data regressions (here: yearly data from 2012 to 2016) examine the relation of the greening of occupations (growth of goji)

IAB-Discussion Paper 14/2018 53
and employment/wage growth. The estimates should serve as a first example for the application of the goji in empirical research. To estimate the associations between the goji and employment/wage growth, I apply employment growth regressions and Mincer-type wage regressions at occupational level. In all models presented below, 𝑌𝑌𝑐𝑐𝑐𝑐𝑐𝑐 𝑡𝑡 represents the specific response variable of the model. Depending of the labor
market outcome of interest it covers either 𝐸𝐸𝑀𝑀𝑀𝑀𝑐𝑐𝑐𝑐𝑐𝑐 𝑡𝑡 or 𝑊𝑊𝐴𝐴𝑊𝑊𝐸𝐸𝑐𝑐𝑐𝑐𝑐𝑐 𝑡𝑡, where 𝐸𝐸𝑀𝑀𝑀𝑀𝑐𝑐𝑐𝑐𝑐𝑐 𝑡𝑡 is
the natural logarithm of the total of full-time equivalents and 𝑊𝑊𝐴𝐴𝑊𝑊𝐸𝐸𝑐𝑐𝑐𝑐𝑐𝑐 𝑡𝑡 is the natural
logarithm of the median of daily wages of male full-time workers in order to facilitate the comparison between occupations. The subscript occ stands for the occupational aggregate at 5-digit level of KldB2010. t stands for time and comprises yearly values. The base year t for the cross-sectional analysis is 2012, whereas the years used in the panel data analysis cover 2012-2016.
𝑊𝑊𝐺𝐺𝐺𝐺𝐺𝐺 𝑐𝑐𝑐𝑐𝑐𝑐 𝑡𝑡 represents the variable of interest, i.e. the greenness-of-jobs index goji in
three variations: gojitotal is based on both core and additional requirements, gojicore is based on core requirements and gojiadd is based on additional requirements. As men-tioned above, the greenness of occupations is measured by the level of goji (here: in 2012) and the greening of occupations comprises the change of goji over time (here: 2012-2016). 𝑋𝑋𝑐𝑐𝑐𝑐𝑐𝑐 𝑡𝑡 covers the control variables including the composition of employ-
ment, employee, employer, tasks, tools, regional and sectoral characteristics for each occupation occ and year t. In models with employment growth as dependent variable, the lagged occupational wage level (represented by the median daily wage of full-time male workers) is also included. For the fixed effects regression I only include those control variables that vary over time. A comprehensive list of all control variables is part of the sample description (Table 17).
Greenness of occupations and labor market outcomes: cross-sectional data analysis
As equation 6.1 shows, I estimate the correlation between the greenness of occupa-tions in 2012 and employment/wage growth of the time period from 2012 to 2016 based on OLS regressions. For these regressions, I estimate the following model:
∆𝑌𝑌𝑐𝑐𝑐𝑐𝑐𝑐 2012−2016 = 𝛽𝛽0 + 𝛽𝛽1𝑊𝑊𝐺𝐺𝐺𝐺𝐺𝐺𝑐𝑐𝑐𝑐𝑐𝑐 2012 + 𝛽𝛽2𝑋𝑋𝑐𝑐𝑐𝑐𝑐𝑐 2012 + 𝜀𝜀𝑐𝑐𝑐𝑐𝑐𝑐 2012 (6.1)
where ∆𝑌𝑌𝑐𝑐𝑐𝑐𝑐𝑐 2012−2016 is the difference of 𝑌𝑌𝑐𝑐𝑐𝑐𝑐𝑐 2016 − 𝑌𝑌𝑐𝑐𝑐𝑐𝑐𝑐 2012. As 𝑌𝑌𝑐𝑐𝑐𝑐𝑐𝑐 𝑡𝑡 represents
the specific response variable of the model, the model can be differentiated according to employment and wage growth:
∆𝐸𝐸𝑀𝑀𝑀𝑀𝑐𝑐𝑐𝑐𝑐𝑐 2012−2016 = 𝛽𝛽0 + 𝛽𝛽1𝑊𝑊𝐺𝐺𝐺𝐺𝐺𝐺𝑐𝑐𝑐𝑐𝑐𝑐 2012 + 𝛽𝛽2𝑋𝑋𝑐𝑐𝑐𝑐𝑐𝑐 2012 + 𝜀𝜀𝑐𝑐𝑐𝑐𝑐𝑐 2012 (6.1.1)
∆𝑊𝑊𝐴𝐴𝑊𝑊𝐸𝐸𝑐𝑐𝑐𝑐𝑐𝑐 2012−2016 = 𝛽𝛽0 + 𝛽𝛽1𝑊𝑊𝐺𝐺𝐺𝐺𝐺𝐺𝑐𝑐𝑐𝑐𝑐𝑐 2012 + 𝛽𝛽2𝑋𝑋𝑐𝑐𝑐𝑐𝑐𝑐 2012 + 𝜀𝜀𝑐𝑐𝑐𝑐𝑐𝑐 2012 (6.1.2)

IAB-Discussion Paper 14/2018 54
Greening of occupations and labor market outcomes: panel data analysis The employment effects of the change of greenness (‘greening’) are estimated by a fixed effects (FE) estimation (equation 6.2). This approach uses yearly panel data between 2012 and 2016. I estimate
𝑌𝑌𝑐𝑐𝑐𝑐𝑐𝑐 𝑡𝑡 = 𝛽𝛽0 + 𝛽𝛽1 𝑊𝑊𝐺𝐺𝐺𝐺𝐺𝐺𝑐𝑐𝑐𝑐𝑐𝑐 𝑡𝑡 + 𝛽𝛽2𝑋𝑋𝑐𝑐𝑐𝑐𝑐𝑐 𝑡𝑡 + 𝛾𝛾𝑐𝑐𝑐𝑐𝑐𝑐 + 𝛿𝛿𝑡𝑡 + 𝜀𝜀𝑐𝑐𝑐𝑐𝑐𝑐 𝑡𝑡 (6.2)
where 𝛾𝛾𝑐𝑐𝑐𝑐𝑐𝑐 and 𝛿𝛿𝑡𝑡 comprise the occupation- and time-fixed effects, and the error term 𝜀𝜀𝑐𝑐𝑐𝑐𝑐𝑐 𝑡𝑡 covers the residuals. The panel data model can also be differentiated according to employment and wage growth:
𝐸𝐸𝑀𝑀𝑀𝑀𝑐𝑐𝑐𝑐𝑐𝑐 𝑡𝑡 = 𝛽𝛽0 + 𝛽𝛽1 𝑊𝑊𝐺𝐺𝐺𝐺𝐺𝐺𝑐𝑐𝑐𝑐𝑐𝑐 𝑡𝑡 + 𝛽𝛽2𝑋𝑋𝑐𝑐𝑐𝑐𝑐𝑐 𝑡𝑡 + 𝛾𝛾𝑐𝑐𝑐𝑐𝑐𝑐 + 𝛿𝛿𝑡𝑡 + 𝜀𝜀𝑐𝑐𝑐𝑐𝑐𝑐 𝑡𝑡 (6.2.1)
𝑊𝑊𝐴𝐴𝑊𝑊𝐸𝐸𝑐𝑐𝑐𝑐𝑐𝑐 𝑡𝑡 = 𝛽𝛽0 + 𝛽𝛽1 𝑊𝑊𝐺𝐺𝐺𝐺𝐺𝐺𝑐𝑐𝑐𝑐𝑐𝑐 𝑡𝑡 + 𝛽𝛽2𝑋𝑋𝑐𝑐𝑐𝑐𝑐𝑐 𝑡𝑡 + 𝛾𝛾𝑐𝑐𝑐𝑐𝑐𝑐 + 𝛿𝛿𝑡𝑡 + 𝜀𝜀𝑐𝑐𝑐𝑐𝑐𝑐 𝑡𝑡 (6.2.2)
6.2 Estimation results Table 18 presents the coefficients of greenness (OLS, Column 1 and 2) and greening (FE, Column 3 and 4) of occupations with employment growth as dependent variable. The variables of interest are gojitotal 2012 (Column 1) or gojicore 2012 and gojiadd 2012 (Col-umn 2), respectively. The coefficient for gojitotal 2012 in Column (1) is 0.223 and highly significant at the 1-percent level. The regression results reported in Column (2) con-tain gojicore 2012 and gojiadd 2012, but in this case only the coefficient of 0.220 for gojiadd
2012 is significantly different from zero (at 5 percent level). The goji covers continuous values between 0 and 1 that can be interpreted as percentage values. Hence, the results of Column (1) and (2) indicate if the gojitotal or gojiadd value rises by one per-centage point, the employment development is related with an increase of employ-ment growth by 0.22 percent . It is obvious that this – economically slightly – positive relation of gojitotal and employment growth is largely driven by the proportion related to green additional tasks, represented by the coefficient of gojiadd.
Column (3) and (4) of Table 18 report the results of the fixed effects estimation using yearly panel data from 2012 to 2016. The coefficients of the goji variations indicate the associations between the growth of goji (‘greening’) and the employment growth. According to Table 18, the FE estimation gives statistically insignificant coefficients of gojitotal (Column 3) and gojicore /gojiadd (Column 4). Since institutional changes at the professional level are often slow, the relatively short observation period does not seem to allow for representative findings. The development of data material for further years might improve this situation. This remains an open point for future research projects.

IAB-Discussion Paper 14/2018 55
Table 18 Goji and employment growth: Estimation results
GREENNESS 2012 (level) GREENING 2012-2016 (growth)
Dependent variables:
OLS Full-time equivalents
(log, delta 2012-2016)
FE Full-time equivalents
(log, yearly panel 2012-2016)
(1) (2) (3) (4)
Share of green tasks total gojitotal
0.223*** (2.60)
-0.230 (-1.58)
Share of green core tasks gojicore
0.003 (0.05)
-0.058 (-1.31)
Share of green additional tasks gojiadd
0.220*** (2.72)
-0.102 (-1.05)
Constant 0.372 (1.51)
0.373 (1.49)
13.24*** (22.60)
13.25*** (22.59)
Control variables of occupational characteristics are included (employee, employer, employment, tasks, tools, (lagged) wage, regional and sectoral characteristics). The FE regression also contains time dummies for the years 2013-2016. Full regression results: see Appendix (Table A-4). N 1146 1146 5699 5699 R2 0.495 0.497 0.613 0.613
Note: t statistics in parentheses, * p<0.10, ** p<0.05, *** p<0.01. Full regression re-sults: see Table A-4. Source: BeH, BERUFENET, own calculations.
Turning to the wage development, the OLS estimations in Table 19 report a statisti-cally insignificant coefficient for gojitotal (Column 1), but show significant results for gojicore and gojiadd. Interestingly, gojicore returns a positive value of 0.070, whereas gojadd returns a negative value -0.079. In other words, a gojicore 2012 that is larger by 1 percent is associated with a slight increase of wage growth by 0.07 percent. Contrary, a gojiadd 2012 larger by 1 percent is related with a slight decrease of wage growth by 0.08 percent. The difference between gojicore and gojiadd might be explained by varia-tions in productivity related to those tasks. As there is no data available about related productivity so far, the analysis of the exact reasons for the wage differences between core and additional requirements is left to future research projects.

IAB-Discussion Paper 14/2018 56
Table 19 Goji and wage growth: Estimation results
GREENNESS 2012 (level) GREENING 2012-2016 (growth)
Dependent variables: OLS
Daily Wage (log, delta 2012-2016)
FE Daily Wage
(log, yearly panel 2012-2016) (1) (2) (3) (4)
Share of green tasks total gojitotal
-0.002 (-0.04)
0.098** (2.01)
Share of green core tasks gojicore
0.070** (2.11)
0.001 (0.01)
Share of green additional tasks gojiadd
-0.079* (-1.95)
0.062 (1.35)
Constant 0.0222 (0.14)
0.0193 (0.12)
5.747*** (11.38)
5.733*** (11.28)
Control variables of occupational characteristics are included (employee, employer, employment, tasks, tools, regional and sectoral characteristics). The FE regression also contains time dummies for the years 2013-2016. Full regression results: see Appendix (Table A-5) N 1137 1137 5702 5702 R2 0.473 0.477 0.694 0.694
Note: t statistics in parentheses, * p<0.10, ** p<0.05, *** p<0.01. Full regression results: see Table A-5.
Source: BeH, BERUFENET, own calculations.
Looking at the greening of occupations, Table 19 reports in Column (3) a positive gojitotal coefficient of 0.098 which is statistically significant at the five percent level, whereas the FE estimation results in Column (4) show coefficients of gojicore and goji-add which are not significantly different from zero. It can therefore be stated that growth of the gojitotal by 1 percent between 2012 and 2016 is accompanied by wage growth of 0.10 percentage points.
From a methodical point of view, this suggests that the set of gojicore and gojiadd should be applied to measure wage developments related to the greenness of jobs, whereas gojitotal might be the better choice to measure the relation between the greening of occupations and employment growth. One possible explanation for the relatively small coefficients in the field of labor market outcomes might be the short time period from 2012 to 2016, which might be not long enough to identify larger effects. Furthermore in some fields of activity the argument put forward by Peters (2014) might play a role. He states that the numbers of jobs created on account of green energy should be rather small because energy technologies are generally capital-intensive. This might also rule for other technology-intensive field of activity, too. But this interesting aspect will also be reserved for future research. The results presented show that there is obviously a large potential of the new index and also a need for further empirical anal-yses.
7 Conclusions This paper is the first that describes and analyzes the greening of jobs in Germany. The paper contributes to the literature in three ways: First, it introduces a novel ap-proach that develops the greenness-of-jobs index goji based on text mining with data from the German BERUFENET. Second, it describes the greenness and greening of

IAB-Discussion Paper 14/2018 57
jobs using employment weighted goji aggregates. Third, it analyzes the associations between goji and employment outcomes by applying econometric analyses.
The first objective of the paper is to develop an index to measure both the extent of the greenness of jobs and the development of greenness over time, i.e. the greening of jobs. At the beginning of the project I conduct a comprehensive literature review to compile a ‘green task dictionary’. Based on this dictionary I apply the text mining pro-cedures to BERUFENET data for every year. After a two-step matching process, the green tasks and all other information on each occupation’s requirements are used to compute the unweighted greenness-of-jobs index goji. The goji is a continuous value from 0 to 1 and is calculated for every occupation. There are three goji variations: core requirements (gojicore) and additional requirements (gojiadd). The gojitotal lies be-tween 0.024 and 0.889 with a median of 0.083. At the end of this step there are 785 individual occupations in 2016 with a gojitotal larger than zero. Compared to 2012, the share of occupations with a gojitotal larger than zero has risen from 18.6 percent to 19.9 percent. But not only the number of ‘goji occupations’ has increased, also the goji level. 137 occupations have experienced an increase in their gojitotal between 2012 and 2016. This study does not claim to cover all green jobs, but it provides first evidence of all occupations with green requirements even if they are not necessarily associated with the production or provision of green goods and services. It might be worthwhile combining the goji with output-oriented approaches in a follow-up project.
The second objective is to describe the occupational, sectoral and regional distribu-tions of the greenness and greening of jobs. To analyze the distribution of the goji in Germany and to prepare the data for record linkage, I calculate several occupational, sectoral and regional aggregates. The descriptive results show that there is an in-crease in the gojitotal at each level of aggregation. Even at the highest occupational aggregate, the overall German greenness-of-jobs index (gojide), a slight growth is ob-servable: the gojide has grown from 0.0196 in 2012 to 0.0198 in 2016, which is an increase of one percent. Noteworthy, at this level the differences between gojicore and gojiadd come to light. Whereas the higher gojiadd value of 0.0199 shows a slight de-crease of -1.7%, the smaller gojicore value (0.0150 in 2016) grows by 4.6 percent. To measure the true magnitude of the greenness of jobs, I also introduce the ‘full-green employment equivalent (FGE)’. According to the FGE in 2016, there were 590 thou-sand full-green employment equivalents in Germany. A comparison of the FGE re-veals that between 2012 and 2016 there was an increase in FGE of 56,643, i.e. a plus of 10.6 percent. The goji aggregates at industry level show heterogeneous develop-ments in terms of the goji and reveal many examples of greening and degreening sectors: the sector ‘public administration and defense; compulsory social security’ ex-hibits the largest growth in the absolute gojitotal value, whereas ‘accommodation and food service activities’ has the largest relative growth rate. The strongest reduction in gojitotal – both as an absolute and relative value – can be observed for ‘agriculture, forestry and fishing’. The same heterogeneity appears with respect to the regional distribution of the goji. Nevertheless, there are some patterns that are visible in each
IAB-Discussion Paper 14/2018 58
year: the eastern part of Germany has higher employment-weighted goji values, and larger cities have lower goji values than rural areas.
The third goal of this paper is to examine whether the greenness and greening of jobs influence labor market outcomes. In order to analyze these relationships, OLS and FE regressions are applied. The econometric analysis uses a novel data source, link-ing the goji with occupation panel data based on a full sample of individual employ-ment data from 2011 to 2016. The estimation results show a small positive and sta-tistically highly significant association between the total greenness of occupations (level of gojitotal) and employment growth. The coefficient of gojitotal may be interpreted such that one percentage point higher gojitotal value is accompanied by a 0.22 percent increase in employment growth. When differentiating between the two sub-indices gojicore and gojiadd , the results show that the positive correlation between the green-ness-of-jobs and employment growth is mainly driven by the shares of green addi-tional tasks. The OLS analysis of greenness and wage growth reveals the importance of differentiating between core and additional requirements. A gojicore 2012 that is larger by 1 percent is associated with a slight increase of wage growth by 0.07. Contrary, a gojiadd 2012 larger by 1 percent is related with a slight decrease of wage growth by 0.08 percent. The reasons for this mixed effects should be analyzed in future research. In terms of the relationship between greening of occupations and wage growth, the re-sults from FE estimation are clearer: an increase of gojitotal by 1 percent between 2012 and 2016 is accompanied by wage growth of 0.10 percentage points. The economet-ric results also demonstrate the potential of the new index for empirical studies in general. For example, the goji can be applied to examine the impact of environmental regulation on the greenness of jobs, the effects of a firm’s greenness composition on productivity, or the interplay between local economic development and the regional greenness of jobs.
The practical and political implications of the results of this paper are threefold: 1) As shown in the study, it is possible to identify the greenness and greening of jobs using existing administrative data without expensive surveys and new data sources. This approach might therefore be an efficient way to officially measure the green transitions of employment in Germany. If similar data sources exist in other countries, this ap-proach can be adopted or used for international comparisons. Moreover, the combi-nation of text mining, index development and aggregation has the potential to be ap-plied to other societal transition processes, e.g. ongoing digitalization (see Janser 2018, Janser/Lehmer 2018 for a first application). A necessary prerequisite for every application is the availability of up-to-date information on occupations, especially about the current requirements. Although the BERUFENET is updated regularly, there is still room for institutional improvement. It seems that the job requirements of training occupations lag somewhat behind current developments. A more proactive role of the participating institutions, like the Chamber of Handicrafts and the Chamber of Industry and Commerce, who are responsible for the contents of the vocational trainings in Germany, could lead to a more up-to-date data basis for practice and research. For this reason the use of web crawling and machine-learning procedures to analyze

IAB-Discussion Paper 14/2018 59
online job offers might be a promising approach to anticipate current developments on the labor market (Hermes/Schandock 2016). Furthermore, a flag of ‘green task’ similar to that in the US-American O*NET database would be a helpful feature of the BERUFENET. 2) The descriptive analysis of the goji distribution revealed a large het-erogeneity between occupational aggregates, industries and regions. This heteroge-neity should be kept in mind especially before policy implications are drawn. If the promotion of green jobs is a policy target, the results of this paper suggest that it is more advisable to promote the transformation of existing occupations rather than to design new occupations, though this may be necessary in individual cases. Further-more, the large heterogeneity of the distribution of the goji demands a precise align-ment of policy instruments. 3) Finally, the results of the third objective of this paper also have the potential to guide policy decisions. The general message of the econo-metric results is that the greenness of jobs is related to a moderate increase of em-ployment growth and the greening of jobs is associated with a moderate increase of wage growth. Only the level of gojiadd is conjoined with a slight slowdown of wage growth. An in-depth analysis of this phenomenon is an interesting issue for future research. The economic significance of the results is relatively small in the short time period observed. This is not bad news at all, because the overall results of this paper show that ‘green’ transitions and labor market outcomes can even positively interre-late with each other. Nevertheless, there is still a need to prevent threats of individuals to lose their employability through these transitions. Hence, the most important objec-tive for labor market policy might be to support the green adaptation of occupations, employees and employers to the changing needs of the labor market. This includes both continuous structural reforms of occupational contents and institutions and the use of existing active labor market policy instruments such as the promotion of further training, retraining and life-long learning.
References Acemoglu, D.; Autor, D. H. (2011): Skills, tasks and technologies: Implications for employment and earnings (Chapter 12). In: Ashenfelter, A.; Card D. (Eds.) Hand-book of Labor Economics, 4B, 1043-1171.
Acemoglu, D.; Aghion, P.; Bursztyn, L.; Hémous, D. (2012): The environment and directed technical change. In: American Economic Review, 102, 131–166.
Acemoglu, D.; Akcigit, U.; Hanley, D.; Kerr, W. (2016): Transition to clean technol-ogy. In: Journal of Political Economy, 124(1), 52-104.
Acemoglu, D.; Restrepo, P. (2017): Robots and Jobs: Evidence from US Labor Mar-kets. NBER Working Paper 23285. Cambridge, MA: National Bureau of Economic Research.
Annandale, D.; Morrison-Saunders, A.; Duxbury, M-L. (2004): Regional sustainabil-ity initiatives: the growth of green jobs in Australia. In: Local Environment, 9(1), 81-87.
Antoni, M.; Ganzer, A.; vom Berge, P. (2016): Sample of integrated labour market biographies (SIAB) 1975-2014. FDZ-Datenreport 04/2016 (en). Nuremberg: IAB.

IAB-Discussion Paper 14/2018 60
Antoni, M.; Janser, M.; Lehmer, F. (2015): The hidden winners of renewable energy promotion: Insights into sector-specific wage differentials. In: Energy Policy, 86, 595-613.
Appelbaum, E.; Schettkat, R. (1995): Are prices unimportant? In: Journal of Post-Keynesian Economics, 21(3), 387-398.
Autor, D. (2015): Why are there still so many jobs? The history and future of work-place automation. In: Journal of Economic Perspectives, 29(3), 3-30.
Autor, D. (2013): The ‚task approach‘ to labor markets – an overview. In: Journal for Labour Market Research, 46 (3), 185-199.
Autor, D.; Dorn, D. (2013): The growth of low skill service jobs and the polarization of the U.S. labor market. In: American Economic Review, 103(5), 1553-1597.
Autor, D.; Levy, F.; Murnane, R. (2003): The skill content of recent technological change: An empirical exploration. In: The Quarterly Journal of Economics, 118(4), 1279-1333.
Becker, R.; Henderson, V. (2000): Effects of air quality regulations on polluting in-dustries. In: Journal of Political Economy, 108(2), 379-421.
Becker, R.; Shadbegian, R. (2009): Environmental products manufacturing: A look inside the green industry. In: The BE Journal of Economic Analysis & Policy, 9(1). DOI: https://doi.org/10.2202/1935-1682.2117.
Blazejczak J.; Edler D. (2015): Estimating gross employment effects of environmen-tal protection: The DIW method. Data Documentation 76. Berlin: DIW. http://hdl.han-dle.net/10419/106654 (last access: Apri 13, 2018).
Blien, U.; Sanner, H. (2014): Technological progress and employment. In: Econom-ics Bulletin, 34(1), 245-251.
Blien, U.; Ludewig, O. (2017): Technological progress and (un)employment develop-ment. IZA discussion paper, 10472. Bonn: IZA.
Bowen, A.; Kuralbayeva, K. (2015): Looking for green jobs: the impact of green growth on employment. Policy brief March 2015. London: Global Green Growth In-stitute and Grantham Research Institute on Climate Change and the Environment.
Cecere G.; Mazzanti M. (2017): Green jobs and eco-innovations in European SMEs. In: Resource and Energy Economics, 49, 86-98.
Cedefop (2012): Green skills and environmental awareness in vocational education and training. Synthesis report. Research Paper 24. Luxembourg: Publications Office of the European Union. http://www.cedefop.europa.eu/EN/Files/5524_en.pdf (last access: April 8, 2018).
Cobb, C. W.; Douglas, P. H. (1928): A theory of production. In: The American Eco-nomic Review, 18(1), 139-165.
Combes, P.-P.; Magnac, T.; Robin, J.-M. (2004): The dynamics of local employment in France. In: Journal of Urban Economics, 56, 217-243.
Consoli, D.; Marin, G.; Marzucchi, A.; Vona F. (2016): Do green jobs differ from non-green jobs in terms of skills and human capital? In: Research Policy, 45(5), 1046-1060.
Dauth, W.; Findeisen, S.; Südekum, J.; Wößner, N. (2017): German robots - the im-pact of industrial robots on workers. IAB-Discussion Paper 30/2017. Nuremberg: IAB.

IAB-Discussion Paper 14/2018 61
Dengler, K.; Matthes, B.; Paulus, W. (2014): Occupational tasks in the German la-bour market – an alternative measurement on the basis of an expert database. FDZ-Methodenreport 12/2014, Nuremberg: IAB. http://doku.iab.de/fdz/re-porte/2014/MR_12-14_EN.pdf (last access: April 8, 2018).
Dengler, K.; Matthes, B. (2015): Folgen der Digitalisierung für die Arbeitswelt: Sub-stituierbarkeitspotenziale von Berufen in Deutschland. IAB-Forschungsbericht 11/2015. Nuremberg: IAB. http://doku.iab.de/forschungsbericht/2015/fb1115.pdf (last access: April 8, 2018).
Dengler, K.; Matthes, B. (2018): Substituierbarkeitspotenziale von Berufen: Wenige Berufsbilder halten mit der Digitalisierung Schritt. IAB-Kurzbericht 04/2018. Nurem-berg: IAB.
Deschenes, O. (2013): Green jobs. IZA Policy Paper 62. Bonn: IZA. http://ftp.iza.org/pp62.pdf (last access: January 4, 2018).
Dierdorff, E. C.; Norton, J. J.; Drewes, D. W.; Kroustalis, C. M.; Rivkin, D.; Lewis, P. (2009): Greening of the world of work: implications for O*NET-SOC and new and emerging occupations. Washington, DC: National Center for O*NET Development. http://www.onetcenter.org/reports/Green.html (last access: June 27, 2016).
Eberle, J.; Schmucker, A. (2017): The establishment history panel: Redesign and update 2016. In: Journal for Economics and Statistics, 237(6), 535-547.
Edler D.; Blazejczak, J. (2016): Beschäftigungswirkungen des Umweltschutzes in Deutschland im Jahr 2012: im Auftrag des Umweltbundesamtes. Umwelt, Innova-tion, Beschäftigung 2016/1, Dessau: Umweltbundesamt, 2016, 104 p. https://www.umweltbundesamt.de/publikationen/beschaeftigungswirkungen-des-um-weltschutzes-in-2 (last access: April 13, 2018).
Ellen MacArthur Foundation, (2015): Towards the circular economy: Economic and business rationale for an accelerated transition. https://www.ellenmacarthurfounda-tion.org/assets/downloads/TCE_Ellen-MacArthur-Foundation_9-Dec-2015.pdf (last access: January 7, 2017).
Elliott, R. J.; Lindley, J. K. (2017): Environmental jobs and growth in the United States. In: Ecological Economics, 132, 232-244.
European Union (2015): Communication from the Commission to the European Par-liament, the Council, the European Economic and Social Committee and the Com-mittee of the Regions: Closing the loop - An EU action plan for the circular economy. COM/2015/0614 final. http://eur-lex.europa.eu/legal-con-tent/EN/TXT/?uri=CELEX:52015DC0614.
Eurostat (2016): Environmental goods and services sector accounts - Handbook. Luxembourg: Publications Office of the European Union.
Fitzenberger, B.; Osikominu A.; Völter R. (2006): Imputation rules to improve the ed-ucation variable in the IAB employment subsample. In: Schmollers Jahrbuch – Jour-nal of Applied Social Science Studies, 126, 405-436.
Gagliardi, L.; Marin, G.; Miriello, C. (2016): The greener the better? Job creation ef-fects of environmentally-friendly technological change. In: Industrial and Corporate Change, 25(5), 779-807.
Gartner, H. (2005): The imputation of wages above the contribution limit with the German IAB employment sample. In: FDZ-Methodenreport, 02/2005. Nuremberg: IAB.

IAB-Discussion Paper 14/2018 62
Ghisellini, P.; Cialani, C.; Ulgiati, S. (2016): A review on circular economy: the ex-pected transition to a balanced interplay of environmental and economic systems. In: Journal of Cleaner Production, 114, 11-32. https://doi.org/10.1016/j.jcle-pro.2015.09.007.
GHK (2009): The impacts of climate change on European employment and skills in the short to medium term: A review of the literature. Final Report to the European Commission Directorate for Employment, Social Affairs and Inclusion Restructuring Forum Vol. 2. London: GHK.
Goos, M.; Manning, A.; Salomons, A. (2014): Explaining job polarization: Routine-biased technological change and offshoring. In: American Economic Review, 104(8), 2509-2526.
Greenstone, M. (2002): The impacts of environmental regulations on industrial activ-ity: Evidence from the 1970 and 1977 clean air act amendments and the census of manufactures. In: Journal of Political Economy, 110(6), 1175-1219.
Hermes, J.; Schandock, M. (2016): Stellenanzeigenanalyse in der Qualifikationsent-wicklungs-forschung. Die Nutzung maschineller Lernverfahren zur Klassifikation von Textabschnitten. Bonn: BiBB. https://www.bibb.de/veroeffentlichungen/de/publica-tion/show/8146 (last access: Feb 18, 2018).
Hillebrand B.; Buttermann H. G.; Behringer J. M.; Bleuel M. (2006): The expansion of renewable energies and employment effects in Germany. In: Energy Policy, 34(18), 3484-3494.
Horbach, J (2014a): Determinants of labor shortage - with particular focus on the German environmental sector. IAB-Discussion Paper 22/2014. Nuremberg: IAB. http://doku.iab.de/discussionpapers/2014/dp2214.pdf.
Horbach, J. (2014b): Do eco-innovations need specific regional characteristics? An econometric analysis for Germany. In: Review of Regional Research, 34(1), 23-38.
Horbach, J.; (2010): The impact of innovation activities on employment in the envi-ronmental sector: Empirical results for Germany at the firm level. In: Journal of Eco-nomics and Statistics, 230(4), 403-419.
Horbach, J. (2008): Determinants of environmental innovation – New evidence from German panel data sources. In: Research Policy, 37, 163-173.
Horbach, J.; Blien, U.; von Hauff, M. (2009): The environmental sector in Germany: Structural change and determinants of market shares. In: Zeitschrift für Umweltpoli-tik und Umweltrecht, 32, 427-446.
Horbach J; Jacob J. (2018): The relevance of personal characteristics and gender diversity for (eco‐) innovation activities at the firm‐level: Results from a linked em-ployer–employee database in Germany. In: Business Strategy and the Environment, 1–11, online first, https://doi.org/10.1002/bse.2042.
Horbach, J.; Janser, M. (2016): The role of innovation and agglomeration for em-ployment growth in the environmental sector. In: Industry and Innovation, 23(6), 488-511.
Horbach, J.; Rennings, K. (2013): Environmental innovation and employment dy-namics in different technology fields: An analysis based on the German Community Innovation Survey 2009. In: Journal of Cleaner Production, 57, 158-165.
Horbach, J.; Rennings, K.; Sommerfeld, K. (2015): Circular economy and employ-ment. Bonn: SUN Institute Environment & Economics. https://sunstif-tungsfonds.files.wordpress.com/2015/06/ce_employment_13052015.pdf.

IAB-Discussion Paper 14/2018 63
Ignatow, G.; Mihalcea R. (2016): Text mining: A guidebook for the social sciences. Los Angeles: SAGE Publications.
[ILO 2015] International Labour Office (2015): The green jobs programme of the ILO. Geneva: ILO.
[ILO 2013a] International Labour Office, ILO (2013a): Draft guidelines concerning a statistical definition of employment in environmental sector: Appendix to the room document prepared for discussion by the 19th International Conference of Labour Statisticians (Appendix IV) In: ILO (ed.) (2013): 19th International Conference of La-bour Statisticians, 2-11 October 2013. Geneva: ILO.
[ILO 2013b] International Labour Office, ILO (2013b): Proposals for the statistical definition and measurement of green jobs (room document: 5), In: ILO (ed.) (2013): 19th International Conference of Labour Statisticians, 2-11 October 2013. Geneva: ILO.
[ILO 2013c] International Labour Office, ILO (2013c): Report I. General report: Nine-teenth International Conference of Labour Statisticians, 2–11 October 2013. Ge-neva: ILO.
Lanfranchi, J.; Pekovic, S. (2014): How green is my firm? Workers' attitudes and be-haviors towards job in environmentally-related firms. In: Ecological Economics, 100, 16–29.
Jaffe, A. B.; Palmer, K. (1997): Environmental regulation and innovation: a panel data study. In: The Review of Economics and Statistics, 79(4), 610-619.
Janser, M. (2018): Measuring the degree of technological (r)evolution of occupa-tions: first evidence from the digital tools index (dtox) and administrative micro data. Mimeo.
Janser, M.; Lehmer, F. (2018): The impact of investments in new digital technolo-gies on wages - worker-level evidence from Germany. Mimeo.
Kuckshinrichs, W.; Kronenberg, T.; Hansen, P. (2010): The social return on invest-ment in the energy efficiency of buildings in Germany. In: Energy Policy, 38(8), 4317-4329.
Lehr, U.; Lutz, C.; Edler D. (2012): Green jobs? Economic impacts of renewable en-ergy in Germany. In: Energy Policy, 47(9), 358-364.
Licht, G.; Peters, B. (2014): Do green innovations stimulate employment? Firm-level evidence from Germany. WWW for Europe Working Paper 53: Vienna: WIFO/WWWforEurope. http://www.foreurope.eu/fileadmin/documents/pdf/Work-ingpapers/WWWforEurope_WPS_no053_MS54.pdf (last access: April 13, 2018).
Lieder M.; Rashid, A. (2016): Towards circular economy implementation: a compre-hensive review in context of manufacturing industry. In: Journal of Cleaner Produc-tion, 115, 36-51. https://doi.org/10.1016/j.jclepro.2015.12.042 (last access: April 13, 2018).
Mayring, P. (2014): Qualitative content analysis: theoretical foundation, basic proce-dures and software solution. Klagenfurt. https://www.ssoar.info/ssoar/handle/docu-ment/39517 (last access: April 13, 2018).
Möller, J. (2001): Income and price elasticities in different sectors of the economy. An analysis of structural change for Germany, the UK and the US, In: Raa, T. ten; Schettkat, R. (2001) (eds.): The Growth of Service Industries. The Paradox of Ex-ploding Costs and Persistent Demand, Cheltenham, Northampton: Edward Elgar.
IAB-Discussion Paper 14/2018 64
National Center for O*NET Development (2010): O*NET® Green Task Development Project. Washington, DC: National Center for O*NET Development. https://www.onetcenter.org/reports/GreenTask.html (last access: April 8, 2018)
Neisser, H. (1942): ’Permanent’ technological unemployment: ‘Demand for com-modities is not demand for labor’. In: American Economic Review, 32(1), 50-71.
[OECD 2011] Organisation for Economic Co-operation and Development (2011): Towards green growth. OECD Publishing. http://dx.doi.org/10.1787/9789264111318-en.
[OECD/Cedefop 2014] Organisation for Economic Co-operation and Development; European Centre for the Development of Vocational Training (2014): Greener skills and jobs. Paris: OECD Publishing. http://dx.doi.org/10.1787/9789264208704-en.
Paulus, W.; Matthes, B. (2013): The German classification of occupations 2010: structure, coding and conversion table. FDZ-Methodenreport 08/2013 (en). Nurem-berg: IAB.
Peters D. (2014): Understanding green occupations from a task-based approach. In: Applied Economic Perspectives and Policy, 36(2), 238–264. https://doi.org/10.1093/aepp/ppt026.
Pollack, E. (2012): Counting up to green: Assessing the green economy and its im-plications for growth and equity. Economic Policy Institute Briefing Paper 349. Washington, DC: Economic Policy Institute. http://www.epi.org/files/2012/bp349-as-sessing-the-green-economy.pdf.
Porter, M. E.; Van der Linde, C. (1995): Toward a new conception of the environ-ment-competitiveness relationship. In: The Journal of Economic Perspectives, 9(4), 97-118.
Rennings, K.; Zwick, T. (2002): The employment impact of cleaner production on the firm level: Empirical evidence from a survey in five European countries. In: Interna-tional Journal of Innovation Management, 6(3), 319-342.
Rosenow, J. (2013): The politics of the German CO2-building rehabilitation pro-gramme. In: Energy Efficiency, 6(2), 219-238.
Smulders, S.; Withagen, C. (2012): Green growth - lessons from growth theory. Pol-icy Research working paper WPS 6230. Washington, DC: World Bank. http://hdl.handle.net/10986/12080.
Sommers, D.; (2013): BLS green jobs overview. In: Monthly Labor Review, 136, 3-16. https://stats.bls.gov/opub/mlr/2013/01/art1full.pdf.
Stappen, R.; Schels H. (2002): Towards a Local Sustainability Strategy. Bavarian Minister for State Development and Environmental Affairs. Munich. http://www.faape.org/Local%20Sustainability%20Strategy.pdf (last access: Apr 8, 2018).
[UN et al. 2014] United Nations, European Union, Food and Agriculture Organization of the United Nations, International Monetary Fund, Organisation for Economic Co-operation and Development, The World Bank (2014): System of environmental-eco-nomic accounting - Central framework. New York: United Nations.
[UN et al. 2017] United Nations, European Union, Food and Agriculture Organization of the United Nations, Organisation for Economic Co-operation and Development, World Bank Group (2017): System of environmental-economic accounting - Applica-tions and extensions. New York: United Nations.

IAB-Discussion Paper 14/2018 65
[UNEP 2011] United Nations Environment Programme (2011): Towards a green economy: Pathways to sustainable development and poverty eradication. Nairobi: United Nation Environment Programme.
[US DOC 2010] US Department of Commerce (2010): Measuring the green econ-omy. Washington DC: United States Department of Commerce. http://www.esa.doc.gov/sites/default/files/greeneconomyreport_0.pdf (last access: January 03, 2018).
[US DOL/BLS 2013a] US Department of Labor / Bureau of Labor Statistics (2013a): Green jobs definition. https://www.bls.gov/green/green_definition.pdf (last access: January 02, 2018).
[US DOL/BLS 2013b] US Department of Labor / Bureau of Labor Statistics (2013b): Extended technical note on GGS methodology and data collection. https://www.bls.gov/ggs/ggs_technote_extended.pdf (last access: January 02, 2018).
Vona, F.; Marin, G.; Consoli, D. (2017): Measures, drivers and effects of green em-ployment: Evidence from US local labor markets, 2006-2014 (June 28, 2017). SWPS 2017-13. http://dx.doi.org/10.2139/ssrn.2994103 (last access: January 7, 2018).
Vona, F.; Marin G.; Consoli D.; Popp D. (2015): Green skills. NBER Working Papers 21116. Cambridge, MA: National Bureau of Economic Research. http://www.nber.org/papers/w21116.pdf (last access: May 02, 2018).
Wiedemann, G. (2016): Text mining for qualitative data analysis in the social sci-ences. A study on democratic discourse in Germany. Wiesbaden: Springer.
Weinstein, A.; Partridge, M.; Francis C. (2010): Green policies, climate change, and new jobs: Separating fact from fiction, the exurban change project and Swank Pro-gram in Rural-Urban Policy. Summary report, June. https://aede.osu.edu/sites/aede/files/publication_files/Green%20Poli-cies%2C%20Climate%20Change%2C%20and%20New%20Jobs.pdf (last access: January 8, 2018).
Weinstein, A.; Partridge, M. (2010) Making green jobs work for Ohio. Ohio: The Ohio Stata University. https://aede.osu.edu/sites/aede/files/publication_files/Mak-ing%20the%20Green%20Economy%20Work%20for%20Ohio%20Dec%2013.pdf (last access: January 8, 2018).

IAB-Discussion Paper 14/2018 66
Appendix
Table A-1 Goji aggregation levels
Aggregation dimension Aggregation level Number of breakdown levels
(here: 2016) Digit level Level name
Occupational (Classification of Occupations, KldB2010 / 2006: KldB1988)
5 Occupational type 1,192 3
(3plus5) Occupational group (extension: plus 5th digit)
140 (424)
2 (2plus5)
Occupational main group (extension: plus 5th digit)
36 (132)
1 (1plus5)
Occupational areas (extension: plus 5th digit)
9 (36)
S2 (S2plus5)
Occupational segment (extension: plus 5th digit)
14 (20)
S1 (2plus5)
Occupational sector (extension: plus 5th digit)
5 (55)
5th digit Requirements level 4 Sectoral (Classification of Economic Activities, WZ 2008)
2 Divisions 88 1 Sections 21
Regional (Nomenclature of Terri-torial Units for Statistics, NUTS)
NUTS 3 Districts 429 NUTS 1 Federal States 16
Note: The 5th digit of KldB2010 provides additional information about the requirements level.
Source: Employment Statistics of the Federal Employment Agency, own calculations.

IAB-Discussion Paper 14/2018 67
Table A-2 Greenness-of-jobs ranking of single occupations grouped by green tasks cat-egories: Examples for top 5 of gojigtcat,total values in 2016 (Kldb2010, 8-digit) Pos. Occupational title
grouped by green tasks category (gtcat) gojigtcat,total goji gtcat,core gojigtcat,add goji gtcat,wtotal
Top 5 – Energy production & storage 1 Specialist - solar technology 0.250 0.364 0.000 0.242
2 Climate protection manager 0.250 0.200 0.263 0.221
3 Energy consultant 0.188 0.250 0.167 0.222
4 Engineer - renewable energies 0.171 0.222 0.118 0.187
5 Tech. assistant - renewable raw materials 0.167 0.071 0.300 0.148
Top 5 - Circular economy, (raw) material efficiency & waste management 1 Recycling specialist 0.692 0.750 0.667 0.722
2 Specialist in recycling & waste mgmt. 0.526 0.667 0.462 0.598
3 Waste advisor 0.526 0.667 0.462 0.598
4 Waste manager 0.421 0.857 0.167 0.627
5 Technician for waste technology 0.381 0.667 0.267 0.533
Top 5 - Environmental protection (general) 1 Environmental management officer 0.417 0.300 0.500 0.367
2 Environmental expert 0.412 0.444 0.375 0.421
3 Environmental auditor 0.412 0.750 0.308 0.603
4 Head of expert office for the environment 0.320 0.214 0.455 0.294
5 Water pollution control officer 0.308 0.167 0.429 0.254 Note: Each occupation may appear in different groups of green tasks categories, because each
gojigtcat value represents only the share of green tasks from the specific green tasks category in the total number of requirements. For example, the occupation ‘Water pollution control officer’ contains four tasks related to environmental protection (one green core task and three green additional tasks) and is thus ranked in the green tasks list of ‘Environmental protection (general)’ with gojigtcat,total = 0.308). It is also ranked in the green tasks list of ‘Emission protection (…, water, …)’ with gojigtcat,total = 0.231, of which this occupation contains three green (core) tasks.
Source: BERUFENET, own calculations.

IAB-Discussion Paper 14/2018 68
Table A-3 Extension for sample description: Non-green occupations and green occupa-tions 2012 and 2016
Selection by gojitotal in 2012 (Non-green: gojitotal 2012=0; Green: gojitotal 2012> 0)
NON-GREEN GREEN NON-G. GREEN NON-G. GREEN
2012 2012 2016 2016 ∆2012-16 ∆2012-16
Variable (Label) abs. abs. abs. abs. ∆in % ∆in %
Sectoral composition
Agriculture, forestry and fishing 0.006 0.015 0.007 0.014 2.3% -5.6% Mining and quarrying 0.003 0.003 0.002 0.003 -24.0% -12.0% Manufacturing 0.244 0.199 0.237 0.196 -3.0% -1.4% Electricity, gas, steam and air condi-tioning supply
0.007 0.012 0.006 0.011 -6.8% -7.8%
Water supply, sewerage, waste management and remediation
0.005 0.021 0.005 0.021 -0.5% 0.3%
Construction 0.025 0.168 0.025 0.167 0.5% -0.6% Wholesale and retail trade, repair of motor vehicles and motorcycles
0.161 0.089 0.156 0.084 -3.3% -5.5%
Transportation and storage 0.034 0.123 0.035 0.128 2.3% 3.8% Accommodation and food service 0.042 0.018 0.043 0.018 2.4% 5.4% Information and communication 0.039 0.007 0.040 0.006 4.0% -15.0% Financial and insurance activities 0.041 0.003 0.039 0.003 -5.8% -7.9% Real estate activities 0.006 0.019 0.006 0.020 0.1% 1.7% Professional, scientific and technical activities
0.067 0.044 0.072 0.046 8.3% 6.1%
Administrative and support service activities
0.056 0.139 0.056 0.145 -0.1% 4.1%
Public administration and defence, compulsory social security
0.052 0.052 0.053 0.052 1.2% -1.0%
Education 0.036 0.021 0.038 0.021 5.8% -0.5% Human health and social work 0.136 0.036 0.143 0.036 4.7% -0.4% Arts, entertainment and recreation 0.011 0.006 0.011 0.006 0.8% -3.3% Other service activities 0.028 0.023 0.026 0.022 -7.1% -4.2% Activities of households as employ-ers, undifferentiated goods and services
0.001 0.001 0.001 0.001 2.4% -10.6%
Activities of extraterritorial organisa-tions and bodies
0.001 0.001 0.001 0.001 -27.1% -29.1%
Regional composition
Schleswig Holstein 0.028 0.033 0.028 0.034 -0.5% 2.0% Hamburg 0.031 0.025 0.031 0.025 0.7% 1.6% Lower Saxony 0.086 0.098 0.087 0.100 0.8% 2.0% Bremen 0.010 0.009 0.010 0.010 -0.3% 0.6% Northrhine-Westphalia 0.214 0.205 0.212 0.202 -1.0% -1.8% Hesse 0.080 0.074 0.080 0.075 -0.6% 1.6% Rhineland-Palatinate 0.043 0.046 0.042 0.046 -1.0% -0.9% Baden-Württemberg 0.144 0.129 0.145 0.132 0.5% 2.4% Bavaria 0.169 0.156 0.172 0.161 1.7% 2.7% Saarland 0.013 0.013 0.012 0.012 -3.6% -5.9% Berlin 0.041 0.037 0.044 0.038 5.6% 2.8% Brandenburg 0.025 0.033 0.024 0.032 -2.2% -4.4% Mecklenburg Western Pomerania 0.017 0.022 0.017 0.021 -2.6% -4.1% Saxony 0.048 0.056 0.048 0.055 -0.9% -2.6% Saxony-Anhalt 0.024 0.032 0.023 0.030 -4.6% -5.9% Thuringia 0.025 0.030 0.025 0.028 -2.6% -6.3%

IAB-Discussion Paper 14/2018 69
Selection by gojitotal in 2012 (Non-green: gojitotal 2012=0; Green: gojitotal 2012> 0)
NON-GREEN GREEN NON-G. GREEN NON-G. GREEN
2012 2012 2016 2016 ∆2012-16 ∆2012-16
Variable (Label) abs. abs. abs. abs. ∆in % ∆in % Goji composition
goji0_0 0.000 0.072 0.002 0.072 N/A -1.0% goji0_1 0.000 0.053 0.000 0.056 N/A 5.6% goji0_2 0.000 0.074 0.002 0.069 N/A -7.0% goji1_0 0.000 0.004 0.000 0.003 N/A -18.9% goji2_0 0.000 0.018 0.000 0.018 N/A 2.2% goji3_0 0.000 0.015 0.000 0.015 N/A 4.8% goji4_0 0.000 0.004 0.000 0.003 N/A -7.4% goji5_0 0.000 0.001 0.000 0.002 N/A 40.7% goji6_0 0.000 0.007 0.000 0.007 N/A -7.6% goji7_0 0.000 0.017 0.000 0.016 N/A -5.7% goji8_0 0.000 0.007 0.000 0.007 N/A 2.9% D1goji0_0 0.000 1.000 0.059 0.996 N/A -0.4% D1goji0_1 0.000 0.579 0.018 0.602 N/A 4.0% D1goji0_2 0.000 0.816 0.057 0.802 N/A -1.8% D1goji1_0 0.000 0.117 0.004 0.115 N/A -1.4% D1goji2_0 0.000 0.265 0.015 0.283 N/A 6.8% D1goji3_0 0.000 0.284 0.007 0.315 N/A 11.0% D1goji4_0 0.000 0.081 0.030 0.079 N/A -2.4% D1goji5_0 0.000 0.062 0.012 0.103 N/A 67.9% D1goji6_0 0.000 0.139 0.013 0.162 N/A 17.3% D1goji7_0 0.000 0.332 0.001 0.314 N/A -5.4% D1goji8_0 0.000 0.166 0.019 0.178 N/A 7.3% Dnongreensteady 0.939 0.000 0.940 0.000 0.1% N/A Dgreensteady 0.000 0.905 0.000 0.906 N/A 0.1% Dgreening 0.019 0.020 0.019 0.020 3.8% 0.6% Ddegreening 0.000 0.071 0.000 0.069 N/A -1.7% Dblsgreenenhanced 0.019 0.020 0.019 0.020 3.8% 0.6%
Source: BeH, own calculations.

IAB-Discussion Paper 14/2018 70
Table A-4 Goji and employment growth: Full estimation results
GREENNESS 2012 (level) GREENING 2012-2016 (growth)
Dependent variables:
OLS Full-time equivalents
(log, delta 2012-2016)
FE Full-time equivalents
(log, yearly panel 2012-2016)
(1) (2) (3) (4)
Share of green tasks total gojitotal
0.223*** (2.60)
-0.230 (-1.58)
Share of green core tasks gojicore
0.003 (0.05)
-0.058 (-1.31)
Share of green additional tasks gojiadd
0.220*** (2.72)
-0.102 (-1.05)
Imputed log wages of male full-time workers – median (lagged)
0.007 (0.16)
0.007 (0.16)
-0.030 (-1.00)
-0.030 (-1.00)
Employment age group 16 - <30 years
0.065 (0.54)
0.076 (0.62)
0.536*** (2.71)
0.534*** (2.69)
Employment age group >= 50 years
-0.372*** (-2.96)
-0.364*** (-2.90)
-1.565*** (-8.36)
-1.561*** (-8.31)
Tenure -0.021*** (-3.63)
-0.021*** (-3.68)
-0.059*** (-5.70)
-0.059*** (-5.73)
Women -0.117*** (-3.82)
-0.115*** (-3.75)
0.324 (1.26)
0.322 (1.24)
Foreign nationality -0.091 (-0.66)
-0.072 (-0.52)
0.084 (0.34)
0.089 (0.36)
Low education 0.209 (1.37)
0.203 (1.33)
-0.580** (-2.13)
-0.586** (-2.15)
High education 0.034 (0.90)
0.033 (0.86)
-0.250 (-1.05)
-0.248 (-1.04)
Establishment size 1-49 -0.198*** (-4.93)
-0.203*** (-4.96)
0.716*** (4.10)
0.719*** (4.12)
Establishment size >500 -0.206*** (-4.23)
-0.208*** (-4.20)
0.383*** (2.81)
0.385*** (2.82)
Establishment age 0-10 years 0.139 (1.01)
0.123 (0.90)
-0.187** (-2.30)
-0.189** (-2.31)
Establishment age > 20 years 0.125 (1.17)
0.117 (1.10)
0.131*** (2.95)
0.130*** (2.99)
Marginal Employment -0.256* (-1.88)
-0.250* (-1.85)
0.640 (1.51)
0.639 (1.51)
Part-time work 0.141** (2.00)
0.142** (2.01)
0.555** (2.08)
0.557** (2.09)
Fixed-term contract -0.248*** (-2.84)
-0.264*** (-3.06)
0.068 (0.35)
0.072 (0.37)
Unskilled/semi-skilled occupa-tion
0.026 (1.34)
0.029 (1.47)
N/A N/A
Complex specialist occupation -0.020 (-1.24)
-0.021 (-1.28)
N/A N/A
Highly complex occupation -0.034 (-1.37)
-0.035 (-1.41)
N/A N/A
Tasks complexity (Number of taskstotal)
-0.002** (-2.50)
-0.002** (-2.34)
-0.001 (-0.91)
-0.001 (-0.91)
Share of non-routine analytical tasks
0.220*** (6.42)
0.222*** (6.43)
0.161** (2.24)
0.159** (2.21)
Share of non-routine interac-tive tasks
0.137*** (3.07)
0.138*** (3.10)
0.065 (0.75)
0.063 (0.72)
Share of routine cognitive tasks
0.099*** (3.29)
0.098*** (3.22)
0.010* (1.90)
0.097* (1.86)
Share of non-routine manual tasks
0.124*** (3.98)
0.126*** (4.02)
0.186*** (4.27)
0.185*** (4.25)
Tools complexity (Number of toolstotal)
0.001 (1.09)
0.001 (1.12)
N/A N/A
dtoxIT-add: share of IT-aided digital tools
-0.0211 (-0.33)
-0.015 (-0.24)
N/A N/A
dtoxIT-int: share of IT-integrated digital tools
0.117 (0.85)
0.107 (0.78)
N/A N/A

IAB-Discussion Paper 14/2018 71
GREENNESS 2012 (level) GREENING 2012-2016 (growth)
Dependent variables:
OLS Full-time equivalents
(log, delta 2012-2016)
FE Full-time equivalents
(log, yearly panel 2012-2016)
(1) (2) (3) (4) Mining and quarrying -0.414***
(-2.80) -0.408*** (-2.78)
0.595 (0.75)
0.555 (0.70)
Manufacturing -0.036 (-0.71)
-0.030 (-0.59)
-0.790 (-1.52)
-0.804 (-1.54)
Electricity, gas, steam and air conditioning supply
-0.014 (-0.14)
-0.035 (-0.35)
-2.382** (-2.23)
-2.382** (-2.22)
Water supply, sewerage, waste management and reme-diation activities
-0.249*** (-2.79)
-0.175** (-2.04)
-1.723 (-1.38)
-1.736 (-1.39)
Construction -0.130*** (-2.66)
-0.128*** (-2.64)
-0.950 (-1.50)
-0.977 (-1.54)
Wholesale and retail trade, re-pair of motor vehicles and mo-torcycles
-0.126** (-2.47)
-0.122** (-2.39)
-0.766 (-1.31)
-0.782 (-1.33)
Transportation and storage -0.095 (-1.47)
-0.095 (-1.48)
-0.492 (-0.89)
-0.510 (-0.91)
Accommodation and food ser-vice activities
-0.131** (-2.27)
-0.133** (-2.33)
-0.480 (-0.60)
-0.496 (-0.62)
Information and communica-tion
-0.138* (-1.79)
-0.137* (-1.78)
-0.862* (-1.65)
-0.878* (-1.67)
Financial and insurance activi-ties
-0.168*** (-2.79)
-0.166*** (-2.77)
-2.170*** (-3.08)
-2.190*** (-3.09)
Real estate activities 0.203** (2.45)
0.200** (2.47)
-0.698 (-0.95)
-0.711 (-0.97)
Professional, scientific and technical activities
-0.046 (-0.65)
-0.044 (-0.62)
-0.742 (-1.43)
-0.758 (-1.45)
Administrative and support service activities
-0.151*** (-2.59)
-0.152** (-2.56)
-0.824* (-1.65)
-0.843* (-1.67)
Public administration and de-fence, compulsory social secu-rity
0.001 (0.03)
0.004 (0.08)
-1.068** (-1.98)
-1.080** (-2.00)
Education 0.069 (1.15)
0.074 (1.25)
-1.849*** (-3.16)
-1.867*** (-3.17)
Human health and social work activities
-0.007 (-0.15)
-0.004 (-0.08)
0.030 (0.05)
0.019 (0.03)
Arts, entertainment and recre-ation
-0.131** (-2.06)
-0.126** (-1.97)
-2.038*** (-2.95)
-2.056*** (-2.96)
Other service activities -0.088 (-1.43)
-0.086 (-1.40)
-2.389*** (-3.45)
-2.391*** (-3.45)
Activities of households as em-ployers, undifferentiated goods and services
0.168 (0.79)
0.158 (0.75)
-0.409 (-0.25)
-0.421 (-0.26)
Activities of extraterritorial or-ganisations and bodies
1.658* (1.68)
1.606 (1.61)
2.343 (0.91)
2.396 (0.93)
Urbanized districts -0.028 (-0.32)
-0.057 (-0.65)
-1.168*** (-5.55)
-1.166*** (-5.53)
Rural districts with features of concentration
-0.142 (-1.19)
-0.154 (-1.28)
-1.365*** (-3.92)
-1.364*** (-3.90)
Rural districts-sparsely popula-ted
0.033 (0.27)
0.044 (0.36)
-2.217*** (-5.76)
-2.221*** (-5.76)
Western fed. states: Northrine-Westphalia, Hesse, Rhineland-Palatinate, Saarland
-0.198* (-1.68)
-0.184 (-1.56)
0.455* (1.95)
0.456* (1.95)
Eastern fed. states: Berlin, Brandenburg, Mecklenburg Western Pomerania, Saxony,
-0.061 (-0.58)
-0.057 (-0.54)
0.189 (0.73)
0.198 (0.76)
Southern fed states: Baden-Wuertemberg, Bavaria
0.071 (0.71)
0.088 (0.88)
0.306 (1.13)
0.310 (1.15)
Dummy 2013 N/A N/A 0.039*** (8.15)
0.039*** (8.09)
Dummy 2014 N/A N/A 0.080*** (8.96)
0.080*** (8.88)
Dummy 2015 N/A N/A 0.102*** 0.102***

IAB-Discussion Paper 14/2018 72
GREENNESS 2012 (level) GREENING 2012-2016 (growth)
Dependent variables:
OLS Full-time equivalents
(log, delta 2012-2016)
FE Full-time equivalents
(log, yearly panel 2012-2016)
(1) (2) (3) (4) (8.14) (8.06)
Dummy 2016 N/A N/A 0.125*** (7.81)
0.124*** (7.73)
Constant 0.372 (1.51)
0.373 (1.49)
13.24*** (22.60)
13.25*** (22.59)
N 1146 1146 5699 5699 R² 0.495 0.497 0.613 0.613
Note: t statistics in parentheses, * p<0.10, ** p<0.05, *** p<0.01.
Reference groups: Employee age group: >=30-<50 years; Medium education; Establishment size 50-499; Establishment age 11-20 years; Specialist occupation; Share of routine manual tasks; Agriculture, forestry and fishing; Core cities; Dummy 2012.
Source: BeH, own calculations.

IAB-Discussion Paper 14/2018 73
Table A-5 Goji and wage growth: Full estimation results
GREENNESS 2012 (level) GREENING 2012-2016 (growth)
Dependent variables:
OLS Daily Wage
(log, delta 2012-2016)
FE Daily Wage
(log, yearly panel 2012-2016)
(1) (2) (3) (4)
Share of green tasks total gojitotal
-0.002 (-0.04)
0.098** (2.01)
Share of green core tasks gojicore
0.070** (2.11)
0.001 (0.01)
Share of green additional tasks gojiadd
-0.079* (-1.95)
0.062 (1.35)
Employment age group 16 - <30 years
-0.111* (-1.90)
-0.121** (-2.11)
0.179 (1.46)
0.181 (1.48)
Employment age group >= 50 years
-0.097 (-1.59)
-0.105* (-1.78)
0.123 (1.24)
0.122 (1.24)
Tenure 0.007*** (3.08)
0.007*** (3.16)
0.005 (0.90)
0.005 (0.91)
Women -0.059*** (-3.80)
-0.061*** (-3.97)
0.047 (0.27)
0.047 (0.27)
Foreign nationality 0.084 (1.04)
0.073 (0.91)
-0.318** (-2.35)
-0.320** (-2.37)
Low education -0.022 (-0.30)
-0.013 (-0.17)
-0.223 (-1.32)
-0.220 (-1.31)
High education 0.000 (0.02)
0.000 (0.01)
0.235** (2.41)
0.234** (2.40)
Establishment size 1-49 0.047** (2.17)
0.051** (2.36)
-0.417*** (-4.01)
-0.418*** (-3.99)
Establishment size >500 0.0170 (0.74)
0.021 (0.92)
0.086 (1.34)
0.086 (1.32)
Establishment age 0-10 years 0.129* (1.72)
0.139* (1.92)
-0.066 (-1.20)
-0.065 (-1.18)
Establishment age > 20 years 0.084 (1.54)
0.090* (1.76)
-0.066** (-2.22)
-0.065** (-2.19)
Marginal Employment 0.059 (0.93)
0.053 (0.84)
-0.254 (-1.22)
-0.252 (-1.21)
Part-time work 0.101*** (2.79)
0.103*** (2.84)
0.495*** (3.50)
0.494*** (3.49)
Fixed-term contract 0.012 (0.31)
0.019 (0.54)
-0.152** (-2.12)
-0.154** (-2.15)
Unskilled/semi-skilled occupa-tion
-0.037*** (-3.57)
-0.040*** (-3.70)
N/A N/A
Complex specialist occupation -0.008 (-1.02)
-0.007 (-0.95)
N/A N/A
Highly complex occupation -0.000 (-0.01)
0.001 (0.07)
N/A N/A
Tasks complexity (Number of taskstotal)
0.000 (0.78)
0.000 (0.58)
0.000 (0.83)
0.000 (0.86)
Share of non-routine analytical tasks
0.047** (2.37)
0.047** (2.39)
-0.111 (-0.99)
-0.108 (-0.95)
Share of non-routine interac-tive tasks
0.082*** (3.65)
0.082*** (3.69)
-0.187** (-2.07)
-0.186** (-2.06)
Share of routine cognitive tasks
0.053*** (3.15)
0.055*** (3.33)
-0.129 (-1.49)
-0.128 (-1.47)
Share of non-routine manual tasks
0.057*** (3.14)
0.057*** (3.15)
-0.013 (-0.32)
-0.014 (-0.37)
Tools complexity (Number of toolstotal)
0.000 (0.14)
0.000 (0.16)
N/A N/A
dtoxIT-add: share of IT-aided digital tools
0.009 (0.30)
0.005 (0.19)
N/A N/A

IAB-Discussion Paper 14/2018 74
GREENNESS 2012 (level) GREENING 2012-2016 (growth)
Dependent variables:
OLS Daily Wage
(log, delta 2012-2016)
FE Daily Wage
(log, yearly panel 2012-2016)
(1) (2) (3) (4) dtoxIT-add: share of IT-aided digital tools
0.009 (0.30)
0.005 (0.19)
N/A N/A
dtoxIT-int: share of IT-integrated digital tools
-0.027 (-0.35)
-0.021 (-0.28)
N/A N/A
Mining and quarrying -0.050 (-1.40)
-0.056 (-1.56)
-0.218 (-0.47)
-0.193 (-0.41)
Manufacturing -0.077*** (-3.15)
-0.079*** (-3.17)
0.164 (0.52)
0.179 (0.56)
Electricity, gas, steam and air conditioning supply
-0.086** (-2.05)
-0.071* (-1.70)
0.329 (0.85)
0.336 (0.86)
Water supply, sewerage, waste management and remediation activities
-0.032 (-0.99)
-0.055* (-1.69)
0.192 (0.46)
0.201 (0.48)
Construction -0.105*** (-4.98)
-0.103*** (-4.82)
-0.213 (-0.62)
-0.193 (-0.56)
Wholesale and retail trade, repair of motor vehicles and motorcycles
-0.120*** (-4.85)
-0.122*** (-4.87)
0.048 (0.14)
0.065 (0.19)
Transportation and storage -0.147*** (-4.58)
-0.146*** (-4.57)
-0.678* (-1.94)
-0.659* (-1.86)
Accommodation and food service activities
-0.047* (-1.82)
-0.045* (-1.78)
0.010 (0.02)
0.0228 (0.04)
Information and communication
-0.146*** (-3.95)
-0.145*** (-3.95)
0.007 (0.02)
0.021 (0.07)
Financial and insurance activities
-0.103*** (-4.10)
-0.103*** (-4.09)
-0.293 (-0.78)
-0.276 (-0.73)
Real estate activities -0.196*** (-3.69)
-0.187*** (-3.76)
-0.005 (-0.01)
0.02 (0.05)
Professional, scientific and technical activities
-0.117*** (-3.93)
-0.116*** (-3.89)
-0.111 (-0.36)
-0.096 (-0.31)
Administrative and support service activities
-0.119*** (-4.12)
-0.116*** (-4.08)
-0.172 (-0.55)
-0.156 (-0.49)
Public administration & defence, compulsory soc.security
-0.085*** (-3.32)
-0.085*** (-3.35)
-0.587* (-1.75)
-0.577* (-1.70)
Education -0.111*** (-3.53)
-0.113*** (-3.58)
-0.572 (-1.58)
-0.557 (-1.52)
Human health and social work activities
-0.089*** (-3.09)
-0.090*** (-3.10)
-0.725* (-1.86)
-0.715* (-1.82)
Arts, entertainment and recreation
-0.070** (-2.15)
-0.073** (-2.22)
-1.000** (-2.10)
-0.984** (-2.06)
Other service activities -0.049* (-1.72)
-0.049* (-1.70)
-0.625 (-1.55)
-0.622 (-1.54)
Activities of households as employers, undifferentiated goods and services
0.077 (0.32)
0.080 (0.33)
0.116 (0.14)
0.132 (0.16)
Activities of extraterritorial organisations and bodies
-1.177 (-1.45)
-1.155 (-1.43)
-1.583 (-0.70)
-1.555 (-0.69)
Urbanized districts 0.002 (0.05)
0.024 (0.53)
-0.186** (-2.01)
-0.186** (-2.01)
Rural districts with features of concentration
0.012 (0.21)
0.023 (0.40)
0.151 (0.83)
0.152 (0.83)
Rural districts-sparsely populated
0.073 (0.94)
0.061 (0.78)
-0.542*** (-2.81)
-0.541*** (-2.81)
Hamburg 0.172 (0.95)
0.175 (0.97)
-0.426 (-0.94)
-0.428 (-0.95)

IAB-Discussion Paper 14/2018 75
GREENNESS 2012 (level) GREENING 2012-2016 (growth)
Dependent variables:
OLS Daily Wage
(log, delta 2012-2016)
FE Daily Wage
(log, yearly panel 2012-2016)
(1) (2) (3) (4) Lower Saxony -0.029
(-0.18) -0.026 (-0.16)
-0.898** (-2.09)
-0.897** (-2.09)
Bremen -0.070 (-0.24)
-0.076 (-0.26)
-0.921** (-2.05)
-0.927** (-2.07)
Northrhine-Westphalia -0.054 (-0.35)
-0.061 (-0.40)
-0.849** (-2.28)
-0.848** (-2.29)
Hesse 0.050 (0.30)
0.041 (0.25)
-0.479 (-1.27)
-0.480 (-1.27)
Rhineland-Palatinate -0.067 (-0.43)
-0.076 (-0.49)
-0.747** (-2.05)
-0.748** (-2.06)
Baden-Wuerttemberg -0.059 (-0.39)
-0.075 (-0.50)
-0.572 (-1.50)
-0.575 (-1.51)
Bavaria -0.018 (-0.12)
-0.029 (-0.20)
-0.676* (-1.84)
-0.679* (-1.85)
Saarland -0.251 (-0.87)
-0.288 (-1.00)
-0.230 (-0.29)
-0.230 (-0.29)
Berlin 0.416** (2.21)
0.415** (2.22)
-1.425*** (-3.39)
-1.432*** (-3.42)
Brandenburg -0.113 (-0.61)
-0.131 (-0.72)
-0.565 (-1.19)
-0.560 (-1.18)
Mecklenburg Western Pomerania
-0.279 (-1.26)
-0.267 (-1.20)
-0.824 (-1.27)
-0.816 (-1.26)
Saxony 0.090 (0.56)
0.085 (0.53)
-1.153*** (-3.03)
-1.154*** (-3.04)
Saxony-Anhalt 0.031 (0.15)
0.035 (0.16)
-1.389*** (-2.84)
-1.399*** (-2.87)
Thuringia -0.281 (-1.50)
-0.261 (-1.40)
-1.196** (-2.23)
-1.201** (-2.24)
Dummy 2013 N/A N/A 0.019*** (7.57)
0.019*** (7.59)
Dummy 2014 N/A N/A 0.042*** (10.23)
0.042*** (10.25)
Dummy 2015 N/A N/A 0.059*** (9.66)
0.059*** (9.67)
Dummy 2016 N/A N/A 0.057*** (6.99)
0.057*** (7.02)
Constant 0.022 (0.14)
0.019 (0.12)
5.747*** (11.38)
5.733*** (11.28)
N 1137 1137 5702 5702 R² 0.473 0.477 0.694 0.694
Note: t statistics in parentheses, * p<0.10, ** p<0.05, *** p<0.01.
Reference groups: Employee age group: >=30-<50 years; Medium education; Establishment size 50-499; Establishment age 11-20 years; Specialist occupation; Share of routine manual tasks; Agriculture, forestry and fishing; Core cities; Schleswig Holstein; Dummy 2012.
Source: BeH, own calculations.
See also:
Online Appendix “Text mining and descriptives”

IAB-Discussion Paper 14/2018 76
Recently published
No. Author(s) Title Date
1/2018 Grimpe, C. Murmann, M. Sofka, W.
The Organizational Design of High-Tech Startups and Product Innovation
1/18
2/2018 Knörr, M. Weber, E.
Labor markets and labor mobility in the French-German border region
1/18
3/2018 Teichert, C. Niebuhr, A. Otto, A. Rossen, A.
Graduate migration in Germany – new evidence from an event history analysis
2/18
4/2018 Osiander, C. Stephan, G.
Unter welchen Bedingungen würden sich Be-schäftigte weiterbilden?
2/18
5/2018 Schropp, H. Ressourcenorientierte Förderung von jungen Menschen im Übergangsmaßnahmen
2/18
6/2018 Schäffler, J. Moritz, M.
German FDI in the Czech Republic – Employ-ment effects in the home country
2/18
7/2018 Fuchs, J. Weber, B.
Fachkräftemangel: Inländische Personalreserven als Altrnative zur Zuwanderung
2/18
8/2018 Wapler, R. Wolf, K. Wolff, J.
Do active labour market policies for welfare recipients in Germany raise their regional outflow into work?
3/18
9/2018 Wanger, S. Zapf, I.
For better or worse? How more flexibility in work-ing time arrangements and fatherhood affect men’s working hours in Germany
3/18
10/2018 Warning, A. Weber, E.
Digitalisation, hiring and personnel policy: evi-dence from a representative business survey
3/18
11/2018 Stepanok, I. FDI and Unemployment, a Growth Perspective 3/18 12/2018 Knize, V. Migrant women labor-force participation in Ger-
many 4/18
13/2018 Schierholz, M.; Brenner, L. Cohausz, L.; Damminger, L.; Fast, L.; Hörig, A.; Huber, A.; Ludwig, T.; Petry, A.; Tschischka, L.
Eine Hilfsklassifikation mit Tätigkeits-beschreibungen für Zwecke der Berufskodierung
5/18
As per: 2018-05-14
For a full list, consult the IAB website http://www.iab.de/de/publikationen/discussion-paper.aspx

Imprint
IAB-Discussion Paper 14/2018 17 May 2018
Editorial addressInstitute for Employment Research of the Federal Employment Agency Regensburger Straße 104D-90478 Nuremberg
Editorial staffRicardo Martinez Moya, Jutta Palm-Nowak
Technical completionRenate Martin
All rights reservedReproduction and distribution in any form, also in parts, requires the permission of IAB Nuremberg
Websitehttp://www.iab.de
Download of this Discussion Paperhttp://doku.iab.de/discussionpapers/2018/dp1418.pdf
ISSN 2195-2663 For further inquiries contact the authors:
Markus JanserPhone +49.911.179.5816E-mail [email protected]