the green best practice community - europa · the best environmental management practices for waste...
TRANSCRIPT
The European Commission’s science and knowledge service
Joint Research Centre
The Best Environmental Management Practices for
Waste Management and the upcoming Green Best
Practice Community Learning from frontrunners – helping organisations improve
waste management performance
Paolo Canfora – European Commission, Joint Research Centre
Treviso, 22/03/2018 – Public conference of the COLLECTORS project

The Best Environmental Management Practices for Waste Management and the upcoming Green
Best Practice Community
Who we are and what we do
Best Environmental Management Practices (BEMPs)
BEMP examples on Waste Management
The Green Best Practice Community
Content of this presentation
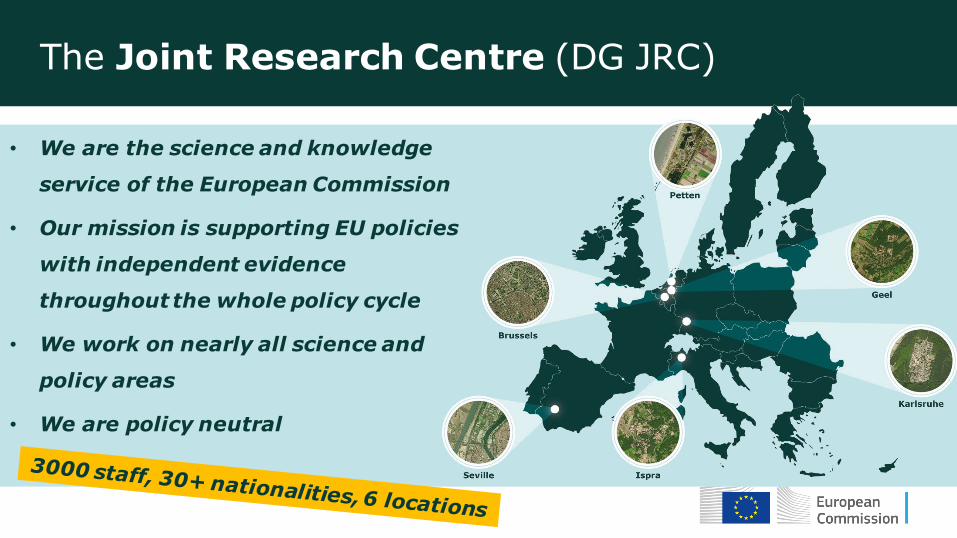
The Joint Research Centre (DG JRC)
• We are the science and knowledge
service of the European Commission
• Our mission is supporting EU policies
with independent evidence
throughout the whole policy cycle
• We work on nearly all science and
policy areas
• We are policy neutral
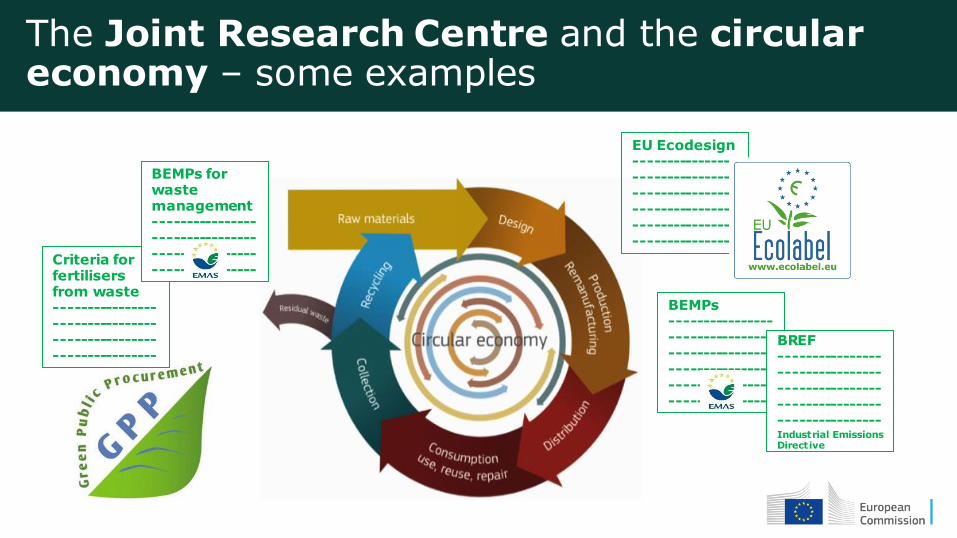
The Joint Research Centre and the circular economy – some examples
EU Ecodesign ---------------- ---------------- ---------------- ---------------- ---------------- ----------------
BEMPs ---------------- ---------------- ---------------- ---------------- ---------------- ----------------
BREF ---------------- ---------------- ---------------- ---------------- ---------------- Industrial Emissions Directive
Criteria for fertilisers from waste ---------------- ---------------- ---------------- ----------------
BEMPs for waste management ---------------- ---------------- ---------------- ----------------

Sectoral Reference Documents on Best Environmental Management Practice (BEMP)
Legal basis: EMAS Regulation (EC) No 1221/2009
BEMPs support all businesses and other organisations to improve environmental performance, not only EMAS registered organisations

11 Sectors
Retail Tourism Construction Agriculture Public Administration
Telecommunications Metal products manufacturing
Electronic equipment manufacturing
Car manufacturing
Waste Management
Food and Beverage manufacturing
We identify BEMPs…
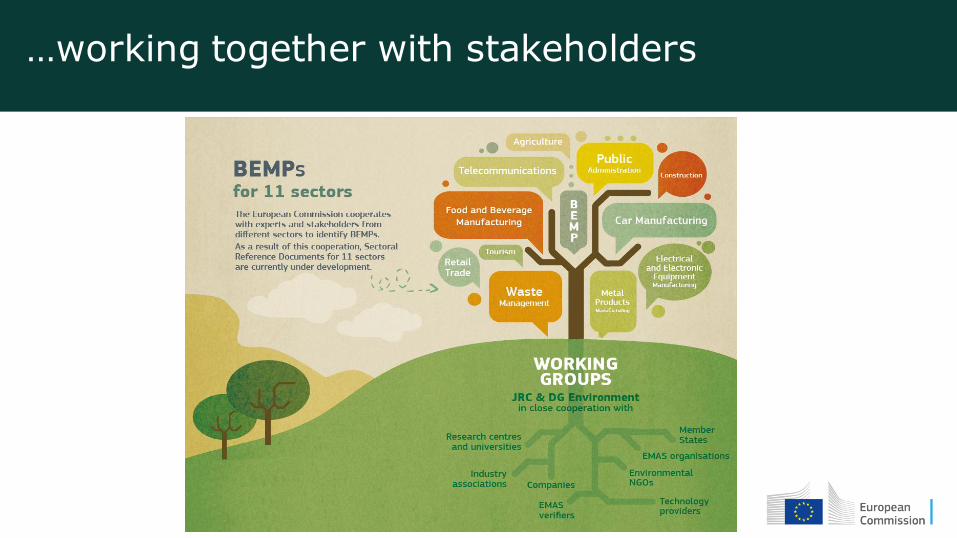
…working together with stakeholders
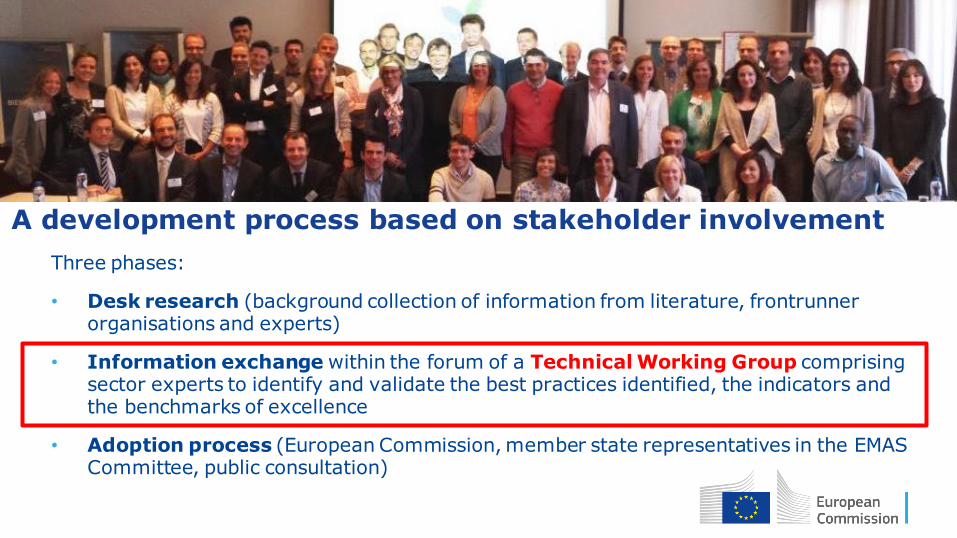
A development process based on stakeholder involvement
Three phases:
• Desk research (background collection of information from literature, frontrunner organisations and experts)
• Information exchange within the forum of a Technical Working Group comprising sector experts to identify and validate the best practices identified, the indicators and the benchmarks of excellence
• Adoption process (European Commission, member state representatives in the EMAS Committee, public consultation)

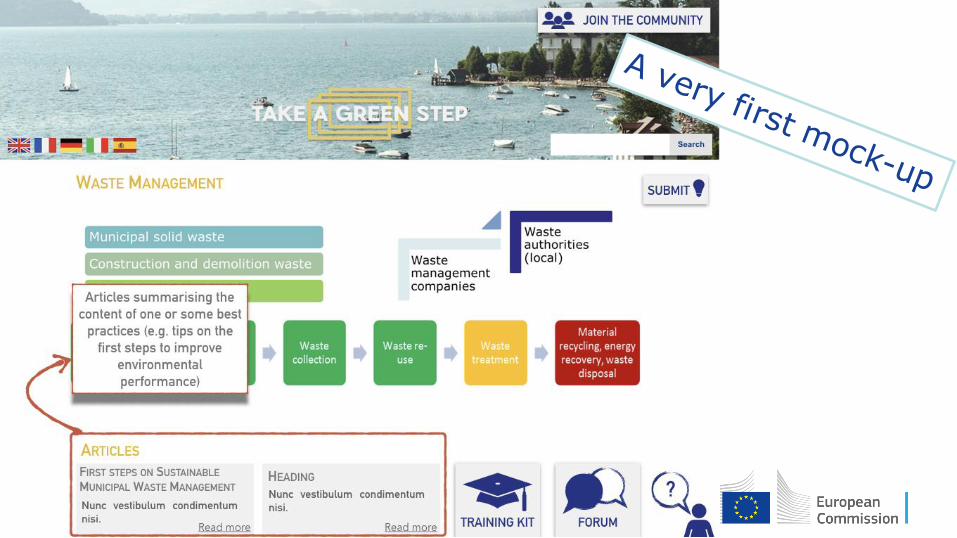
Best Environmental Management Practices for the Waste Management sector
Waste management companies
Waste authorities (local authorities)
Municipal solid waste
Construction and demolition waste
Healthcare waste
The scope

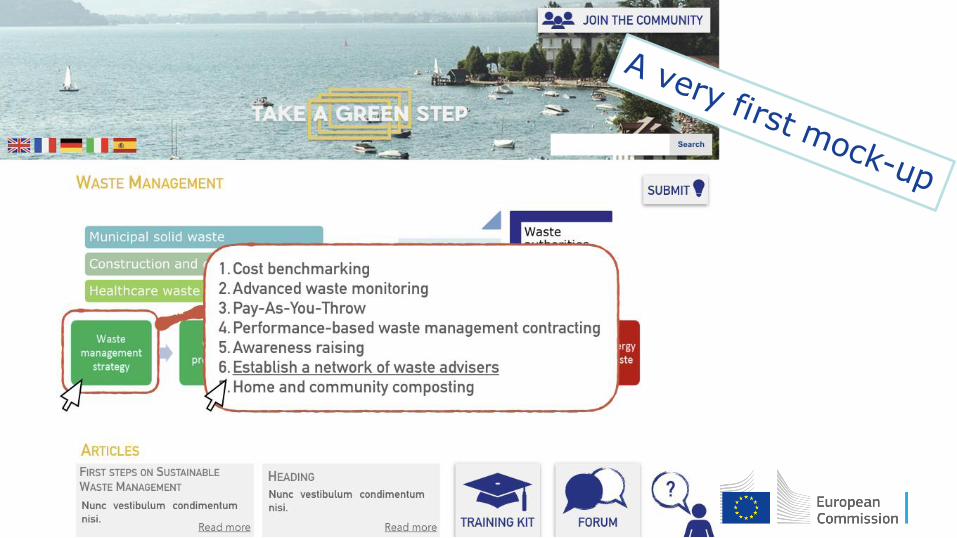
A few examples of BEMPs for municipal solid waste
• Waste monitoring
• Awareness raising
• Pay-As-You-Throw
• Local waste prevention programmes
• Waste advisers network
• Logistics optimisation for waste collection
• Inter-municipal cooperation
• Re-use schemes
• Treatment of waste mattresses for recycling
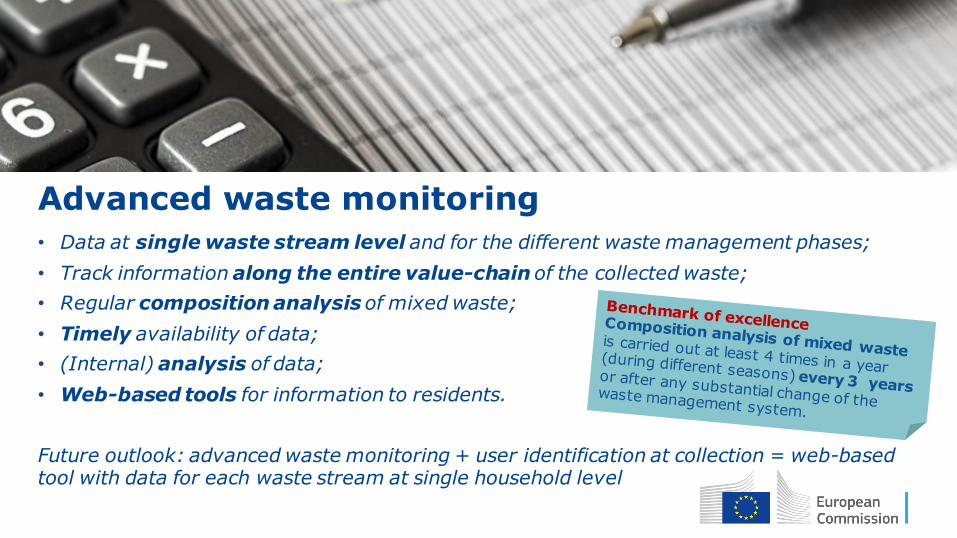
• Data at single waste stream level and for the different waste management phases;
• Track information along the entire value-chain of the collected waste;
• Regular composition analysis of mixed waste;
• Timely availability of data;
• (Internal) analysis of data;
• Web-based tools for information to residents.
Future outlook: advanced waste monitoring + user identification at collection = web-based tool with data for each waste stream at single household level
Advanced waste monitoring

Val di Non (IT)
Example – Advanced waste collection monitoring
Data for 35 separately
collected waste streams
Monthly data collection
Advanced waste monitoring is key for the calculation of meaningful indicators
Additionally, composition analysis of mixed waste every 3 months.

Pay-as-you-throw
• Introduce a system where
citizens pay per weight or per bag of residual waste generated.
• Ensure that infrastructure to
collect and to process the recyclables is available and
efficient.
• Organic waste and bulky waste are also weighted.

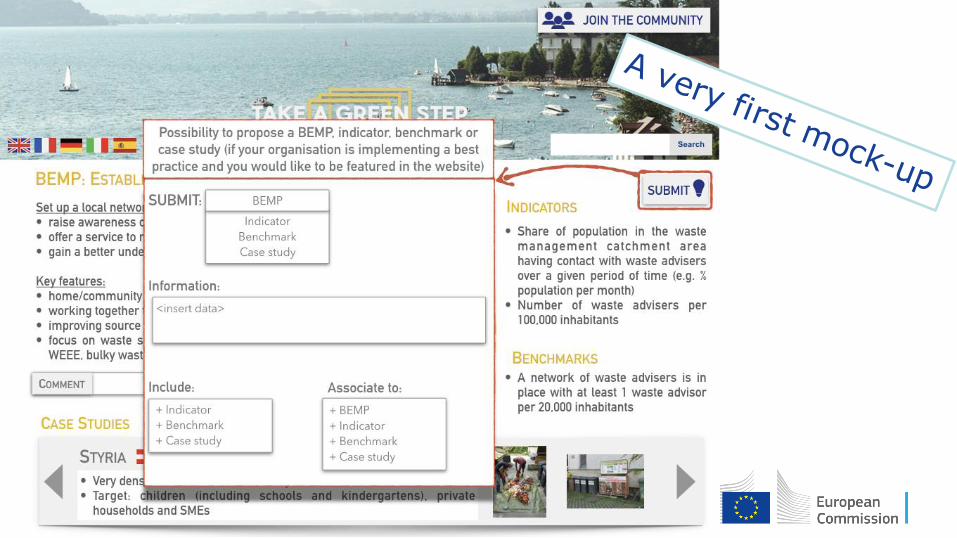
• Set up a local network of “waste advisers” to:
o raise awareness on waste management;
o offer a service to residents and entrepreneurs/small businesses;
o gain a better understanding of what happens on the ground (drivers, reasons).
• Key features:
o home/community visits (+ schools);
o working together to identify possibilities to reduce waste generation;
o improving source separation with practical what goes where sessions;
o focus on waste streams that are considered more problematic (food waste, WEEE, bulky waste, etc.).
Establish a network of waste advisers

Styria (AT)
Establish a network of waste advisers
Examples of frontrunners

Establish a network of waste advisers
Examples of frontrunners
• Very dense network: an adviser every 20,000 inhabitants
• Target: children (including schools and kindergartens), private households and SMEs
Nürnberg (DE)
• Waste advisers are both employees and volunteers
• Multi-lingual awareness raising for foreigners
(English, Turkish, Russian, Arabic, Farsi, Amharic, Kurdish…)
• Mobile information centre
Styria (AT)

Generation Collection Treatment
Common indicators for Municipal Solid Waste
Total municipal solid waste generation [kg/capita/year]
Amount of mixed waste collected
[kg/capita/year]
Waste sent to energy recovery and/or disposal [kg/capita/year]
Waste sent to disposal
[kg/capita/year] Capture rate for glass
[%]
Capture rate for paper/cardboard [%]
Impurity rate for separately collected
glass [%]
Bio-waste in mixed waste [kg/capita/year]
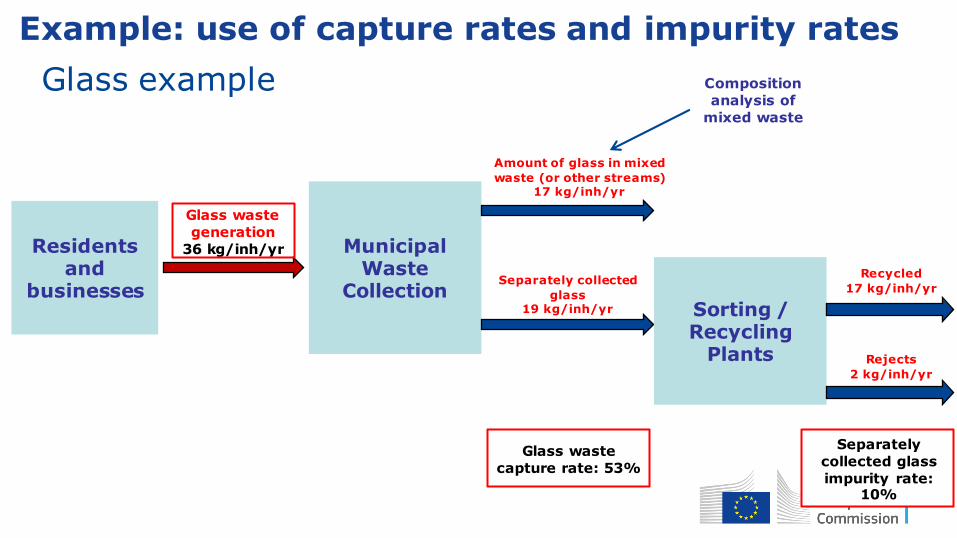
Residents and
businesses
Municipal Waste
Collection
Glass example
Glass waste
generation
36 kg/inh/yr
Separately collected
glass 19 kg/inh/yr
Amount of glass in mixed
waste (or other streams) 17 kg/inh/yr
Sorting / Recycling
Plants
Composition
analysis of
mixed waste
Recycled
17 kg/inh/yr
Rejects
2 kg/inh/yr
Glass waste
capture rate: 53%
Separately
collected glass
impurity rate: 10%
Example: use of capture rates and impurity rates

Municipal solid waste (MSW) generation - Benchmark of excellence:
The annual generation of MSW in the territory administered or managed (collected by all different
waste collection systems available in the area) is:
- lower than 75% of the national average of municipal waste generation, using the national
definition of municipal waste of their own country; or
- lower than 360 kg/capita, if calculated only for the following waste fractions: (i)
organic/biowaste (e.g. green cuttings, food, kitchen waste), (ii) co-mingled packaging,(iii) paper
and cardboard, (iv) glass, (v) plastics, (vi) metals, (vii) bulky, (viii) WEEE and (ix) mixed waste.
Frontrunners: Ljubljana (SI), Bristol (UK), Val di Non (IT)
MSW sent to energy recovery and/or disposal - Benchmark of excellence:
The annual amount of collected mixed MSW sent to energy recovery and/or disposal is:
- lower than 15% of the national average of municipal waste generation; or
- lower than 70 kg/capita.
Frontrunners: Treviso (IT), County of Aschaffenburg (DE), Val di Non (IT)
MSW sent to disposal - Benchmark of excellence:
The annual amount of MSW sent to disposal is:
- lower than 2% of the national average of municipal waste generation; or
- lower than 10 kg/capita.
Frontrunners: Vienna (AT), Ljubljana (SI), County of Aschaffenburg (DE)
Common BoE for MSW

From BEMP reports to an online tool & community
• BEMPs for 11 sector
• Interest from stakeholders
But there are improvement opportunities:
• Reports are not the best format for
communication
• When does BEMP need update?
• Need to sustain motivation and
minimise efforts for stakeholders
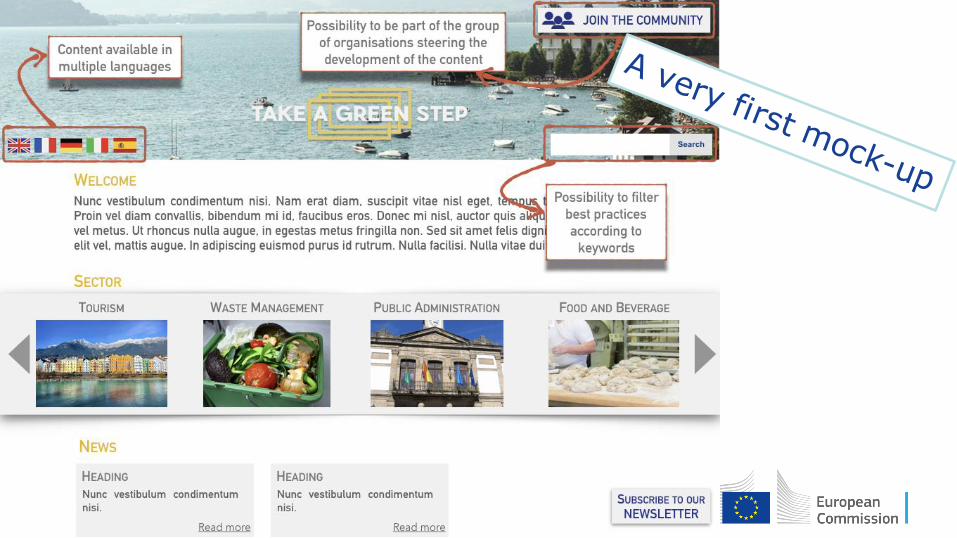
Development of the new approach
• On-line tool to access information
• Community
Features:
o More user friendly outputs
o Systematic monitoring and
stakeholder involvement
o More flexible information exchange
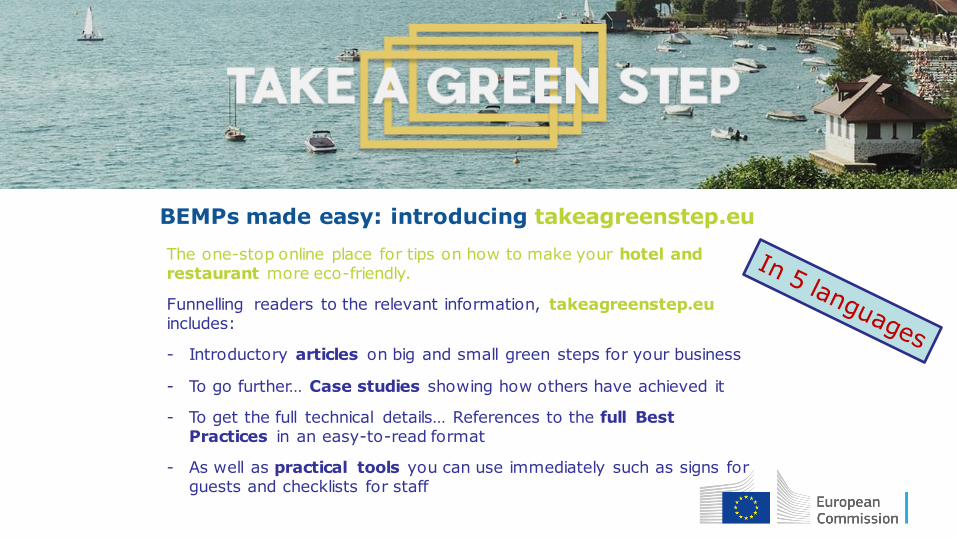
BEMPs made easy: introducing takeagreenstep.eu
The one-stop online place for tips on how to make your hotel and restaurant more eco-friendly.
Funnelling readers to the relevant information, takeagreenstep.eu includes:
- Introductory articles on big and small green steps for your business
- To go further… Case studies showing how others have achieved it
- To get the full technical details… References to the full Best Practices in an easy-to-read format
- As well as practical tools you can use immediately such as signs for guests and checklists for staff


The concept for a Green Best Practice Community
Continuous identification of
BEMPs
Getting the message out
Broaden stakeholder engagement
Are there new best practices in the
sector?
Are some BEMPs outdated?
Let frontrunners and organisations tell us
Meet actual needs of organisations
User friendly format
Partner with relevant
multipliers
Stimulate contributions
Engage key
sectoral actors


Download the BEMPs for waste management: http://susproc.jrc.ec.europa.eu/activities/emas/documents/WasteManagementBEMP.pdf
Get in touch with us at [email protected] to be involved in the Green Best Practice Community

Thanks Any questions? Interested to stay in touch? You can reach me at @PaoloCanfora [email protected]
- http://susproc.jrc.ec.europa.eu/bemp
- https://ec.europa.eu/jrc/en/research-topic/best-environmental-management-practice