the great reallocation - studio legale scala · led to lower commodity prices. at the same time,...
TRANSCRIPT
The Great ReallocationSovereign Wealth Fund Annual Report 2013
BAFFI Center on International Markets, Money and Regulation
Sovereign Investment Lab
Uni
vers
ità C
omm
erci
ale
Luig
i Boc
coni
contact infophone +39.02 [email protected] /sil
With the support of

3 From the Editor
7 The Sovereign Investment Landscape
13 SWF Investment in 2013Bernardo Bortolotti, Veljko Fotak, Laura Pellizzola
13 Activity15 Sectors23 Geography35 Funds36 The Great Reallocation
39 Articles39 Sovereign Shareholder Activism: How SWFs Can Engage in Corporate Governance
Paul Rose43 Sovereign Wealth Fund Investment Performance: Some Stylized Strategic Asset Allocation Results
Michael Papaioannou, Bayasgalan Rentsendorj49 Long Term For Real: SWF's Growing Investments in Infrastructure
Massimiliano Castelli
55 Spotlights on research
61 Appendix61 Methodology
Contents

Some call it the rise of the fiduciary state. From a long-term perspective, the bound-aries between states and markets have changed considerably in the past decades.After the massive wave of nationalizations and public investments of the post-warperiod, governments of all stripes experienced the poor quality of products and serv-ices provided and the abysmal financial and operating performance of state-ownedenterprises. With their reputation as managers severely dented, governmentslaunched a global wave of state sell-offs, and privatization became a legitimate toolof statecraft around the world. But while the rollback of the economic activity ofthe state continued apace particularly in developed economies, an opposing trendstarted to surface, and gained momentum with the turn of the century: the massiveaccumulation of assets by sovereign wealth funds (SWFs) and other state-sponsoredvehicles, growing in size to exceed the $4 trillion mark in 2013.
The key innovation that explains the apparent contradiction between resurging statecapitalism and privatization is that the recent government acquisitions of equityhave been conducted mostly by state entities acting as investors rather than owners,buying non-controlling stakes primarily in foreign companies in order to generatelong-term financial return rather than to manage these businesses. Under this newregime, sovereign investors are typically minority shareholders, with limited powerto exert political interference in the target companies. Furthermore, by investingabroad, they deliberately locate financial interest beyond the scope of their sover-eign authority or supervisory power.
But can governments ever act as objective, commercially driven long-term globalinvestors, managing their nation’s wealth as investment fiduciaries? Only time willtell, but for the time being we observe that SWFs are gaining ground, growing fasterthan any other type of asset owners, and graduating as highly respected players ofthe global financial industry.
Against this background, we are glad to present our annual report on SWF invest-ment in 2013. The reader will find here the usual high quality data which made the
From the Editor
3

5
Sovereign Investment Lab a rather unique source for independent, reliable informa-tion on global SWF transactions. Additionally, this issue boasts contributions frominternational experts such as Paul Rose, Michael Papaioannou, BayasgalanRentsendorj, and Massimiliano Castelli covering the corporate governance chal-lenges of SWFs, their strategic asset allocation, and the role they can play in boost-ing infrastructure investment.
Emerging markets have enjoyed breath-taking growth over the past two decades byclosing the productivity gap with the more developed economies. But, as the gapnarrowed, growth rates have declined – and the slowdown of China and India hasled to lower commodity prices. At the same time, the shale revolution in NorthAmerican energy markets has put downward pressure – and future uncertainty – onthe oil and natural gas prices that have underpinned much of SWF growth. This iswhy in 2013 not only have we observed SWF lower aggregate investments, but allo-cations have changed. The same slowdown that led to declining fund accumulationsin developing countries has also led to the same markets being less appealing invest-ment targets. We call this process the Great Reallocation, with implications acrossgeographies and sectors. The biggest beneficiaries of this reallocation have beendeveloped economies, primarily Europe, the United States, and Australia. Withinthis region, SWF selectively slowed down investment in manufactures indirectlyexposed to emerging market growth, and focused on real estate especially commer-cial properties in Europe, and safe assets as infrastructure. SWFs are quite unpre-dictable but we tend to foresee this trend consolidating in 2014.
2013 has been a crucial year for SWFs. The main facts can be summarized as follows.
• Investment slowing down. In 2013, we observed 19 SWFs completing 175 dealswith a total publicly reported value of $50.1 billion, a 35 percent decrease in thenumber of transactions, and a 15 percent decrease in total deal value relative to2012.
4
THE GREAT REALLOCATION From the Editor
• Banks vs real estate too close to call. By deals, financial services still receivedmore publicly reported investments from SWFs than any other sector: 47 dealsworth $11 billion. But their share by value continues declining in favour of realestate and hotels tourism facilities, reporting 22 deals worth $10 billion and 16deals worth $6 billion, respectively.
• Crawling down the energy value chain. SWF displayed strong interest in theenergy sector, the associated processing industries, including infrastructure.During 2013, the combined expenditure in those sectors was $5.2 billion.
• Developed markets targets of choice. The share of SWF investment in OECD tar-gets is steadily increasing, reaching a share of 65 percent by value, the highest sincethe outbreak of the financial crisis. Europe attracts most activity of value (33 dealsaccounting for $18.4 billion ), North America resumes in earnest from last yearlow with 29 deals worth $8.2 billion). For the first time in the SWF history, Francesurpasses the United Kingdom by deal value with $7.7 billion of investment.
• BRICs rebalancing. BRICs share of investments shrunk to 21 percent ($10.7 bil-lion), with China being the biggest loser. In 2013, foreign SWF investment inChina is down to $620 million from the $4.6 billion raised the previous year.Russia and India were the main beneficiaries of the reallocation, with $5.4 and$2.8 billion, respectively. Indirect exposure to emerging market growth via estab-lished multinational firms as targets is also toning down.
• The rise of co-investment alliances. Cooperation amongst like-minded investorsis increasing and taking the form of joint-ventures and co-investments amongSWFs, but also partnerships involving private investors. 53 SWF deals worth$16.9 billion involved investment alliances, and 84 percent by value with privatepartners.
Bernardo BortolottiDirector, SIL

7
There is no consensus, in either the academic orpractitioner literature, on exactly what constitutesa sovereign wealth fund (SWF). While SWFs are aheterogeneous group, most of the larger and moreestablished SWFs evolved from funds set up bygovernments whose revenue streams were depend-ent on the value of one underlying commodity andthus wished to diversify investments with the goalof stabilizing revenues. Accordingly, most SWFshave been established in countries that are rich innatural resources, with oil-related SWFs being themost common and most important. These includethe funds sponsored by Arab Gulf countries,Russia and the ex-Soviet republics, Malaysia,Brunei and Norway. A newer set of funds has
recently been established in response to discoveryof major new resource endowments – particularlynatural gas, but also oil, coal, diamonds, copper,and other minerals. The other important group ofSWFs includes those that have been financed out ofaccumulated foreign currency reserves resultingfrom persistent and large net exports, especially
The Sovereign Investment Landscape
SWFs are just one type of state-sponsored investment vehicle and several countries are launching new funds
The SIL definition of SWF According to our definition, SWFs have an inde-pendent corporate identity (they are not managedby a central bank or finance ministry) and invest forcommercial return over the long term. Unlike cen-tral-bank, stabilisation, or public pension funds,SWFs have no explicit liabilities—i.e., their assetsare not routinely called on for stabilisation or pen-sion contributions—so they can have a greater tol-erance for risk and illiquid assets to generate supe-rior returns. As such, these funds have a strategicasset allocation that incorporates a wide range ofassets that can include any of the following: equi-ties, bonds, private equity, real estate, hedge funds,exchange-traded funds, futures contracts, com-modities, etc. These investments may be madethrough asset managers or directly, in domesticassets or international markets.1
A “Sovereign Wealth Fund” is an investment vehiclethat is:1 Owned directly by a sovereign government2 Managed independently of other state financial
and political institutions3 Does not have predominant explicit current pen-
sion obligations4 Invests in a diverse set of financial asset classes in
pursuit of commercial returns5 Has made a significant proportion of its publicly
reported investments internationally
1 All SWFs with equity portfolios, and many with only fixed-income portfolios,
employ asset managers. However, the funds that invest a significant proportion
of their portfolios directly often do so through a series of wholly owned subsidiaries
that often are registered in low-tax environments such as Mauritius or the
Cayman Islands.

9
The Sovereign Investment Landscape
8
THE GREAT REALLOCATION
Table 1: Sovereign Wealth Funds, Assets Under Management, 2013
SWFs website, SWF Institute Website and Sovereign Investment Lab estimates
Country Fund Name Inception Source AUM
Year of Funds (US$BN)
Norway Government Pension Fund – Global£ 1990 Commodity (Oil & Gas) 840.80
China China Investment Corporation** 2007 Trade Surplus 575.20
UAE-Abu Dhabi Abu Dhabi Investment Authority† 1976 Commodity (Oil & Gas) 773.00
Kuwait Kuwait Investment Authority† 1953 Commodity (Oil & Gas) 410.00
Singapore Government of Singapore Investment Corporation† 1981 Trade Surplus 285.00
Russia National Wealth Fund and Reserve Fund 2006 Commodity (Oil & Gas) 174.60
Singapore Temasek Holdings§ 1974 Trade Surplus 173.30
China National Social Security Fund** 2000 Trade Surplus 141.40
Qatar Qatar Investment Authority† 2005 Commodity (Oil & Gas) 115.00
Australia Australian Future Fundµ 2006 Non-Commodity 87.60
UAE - Dubai Investment Corporation of Dubai† 2006 Commodity (Oil & Gas) 70.00
Libya Libyan Investment Authority† 2006 Commodity (Oil & Gas) 60.00
UAE-Dubai International Petroleum Investment Company 1984 Commodity (Oil & Gas) 63.46
UAE-Abu Dhabi Mubadala Development Company PJSC¥ 2002 Commodity (Oil & Gas) 55.50
Kazakhstan Kazakhstan National Fund† 2000 Commodity (Oil & Gas) 68.90
Republic of Korea Korea Investment Corporation** 2005 Government-Linked Firms 56.62
Malaysia Khazanah Nasional Berhard 1993 Government-Linked Firms 31.70
Brunei Brunei Investment Agency† 1983 Commodity (Oil & Gas) 40.00
Azerbaijan State Oil Fund of Azerbaijan 1999 Commodity (Oil & Gas) 35.89
Ireland National Pension Reserve Fundµ 2001 Non-Commodity 19.90
New Zealand New Zealand Superannuation Fund 2001 Non-Commodity 20.20
East Timor Timor-Leste Petroleum Fund¥ 2005 Commodity (Oil & Gas) 14.56
UAE - Dubai Istithmar World* 2003 Government-Linked Firms 11.50
Bahrain Mumtalakat Holding Company** 2006 Government-Linked Firms 10.90
UAE Emirates Investment Authority* 2007 Commodity (Oil & Gas) 10.00
UAE-Abu Dhabi Abu Dhabi Investment Council* 2007 Commodity (Oil & Gas) 10.00
Oman State General Reserve Fund* 1980 Commodity (Oil & Gas) 8.20
UAE-Ras Al Khaimah Ras Al Khaimah Investment Authority* 2005 Commodity (Oil) 2.00
Vietnam State Capital Investment Corporation* 2005 Government-Linked Firms 0.60
Kiribati Revenue Equalization Reserve Fund* 1956 Commodity (Phosphates) 0.50
São Tomé & Principe National Oil Account* 2004 Commodity (Oil & Gas) < 0.01
Oman Oman Investment Fund 2006 Commodity (Oil & Gas) Unknown
UAE - Dubai Dubai International Financial Center 2002 Government-Linked Firms Unknown
Total OIL & GAS 2,751.91
TOTAL TRADE SURPLUS 1,174.90
TOTAL OTHER 239.52
TOTAL AUM 4,166.33
£ AUM as of December 22, 2013** AUM as of the end of 2012 AUM as of January 2014§ AUM as of March 2013µ AUM as of the end of 2013† Estimate by SWF Institute as of March 17, 2014 AUM as of June 2013¥ AUM as of September 2013* Sovereign Investment Lab estimate of assets under management (AUM).
Table 2: New Sovereign Investment Funds Launched or Proposed Since January 2008
Country
Angola
Brazil
Chile
France
Ghana
Greenland
India
Iran
Date fund
proposed
officially
October
2012
June
2008
April
2008
October
2008
January
2010
2008
April
2008
2010
Status, as of April 3, 2014
Became operational October
2012 with $5 bn initial capital.
In July 2013, the president’s son
named the fund’s first head.
Fund launched July 2008 with
$6.1 bn initial capital. Now has
$11.6 bn.
Apparently established, but
little news reported on actual
investments.
Launched in October 2008, with
!6 bn initial capital; currently has
about !20 bn in total capital.
First Fund board meeting
held March 2012. Initial funding
of $69.2 mn, but no investments
announced yet. First report
in May 2012 noted areas
of concern.
Fund established but thus
far unfunded.
Fund still pending
and apparently not yet formally
approved by Parliament.
Currently has reported value
of about $35 bn, but no major
investments announced yet.
Rationale for Fund, funding source, and discussion
The Fundo Soberano de Angola (FSDEA) was launched with $5 billion
of seed capital from Angola’s oil revenues to stabilize impact of commodity
price volatility, invest in domestic infrastructure, and invest internationally.
Brazil announced plans to establish a new Fundo Soberano do Brasil
(FSB) soon after Petrobras proved massive new offshore “pre-salt” oil
reserves. Purpose to reduce inflationary impact of government spending,
minimize real appreciation, and support Brazilian firms’ foreign investment.
Ultimately hope to achieve funding of $200-300 bn from oil revenues.
Government announced plans to invest up to $5.9 bn from Chile’s two
existing stabilization and wealth funds in publicly listed international stocks
and bonds. Modeled after Norway’s SWF, purpose was to diversify Chilean
state assets globally.
President Sarkozy proposed setting up a new Strategic Investment Fund
to protect French companies from acquisition by foreign “predators”.
New fund to be operated and 51% owned by Caisse des Dépôts et
Consignations and authorized to make loans and direct equity investments
in French companies threatened by foreign competition or acquisition,
which it has done.
Finance Minister proposed setting up a SWF to channel surplus oil
revenues expected to begin accruing in 2011. Parliament passed the
law in March 2011 formally establishing two funds: the Ghana Heritage
Fund and the Ghana Stabilization Fund with a minimum of 30% of state’s
projected oil revenues to be allocated.
After a US Geological Survey in 2008 estimated that 31 bn barrels of oil
lies off Greenland’s coast, Greenland’s parliament approved creation
of a SWF, based on Norway’s model, to be funded by oil revenues.
To date, no commercial quantities of oil have been produced.
A government-appointed panel of experts recommended setting up a
SWF to earn a higher return on India’s $300 bn foreign reserves. India’s
central bank long opposed this, since country has a very low savings rate
and large fiscal deficit, but pressure continued to build. In April 2012
government officially proposed setting up a new SWF, with $10 bn
initial capital to be provided from disinvestment proceeds, to help acquire
overseas energy assets and raw materials.
A new National Development Fund was set up by the Ahmadinejad
government in 2010 to help break country’s economic isolation and to
benefit future generations. Mandated to invest at least 20% internationally,
the rest locally.
10
THE GREAT REALLOCATION
Israel
Italy
Japan
Lebanon
Liberia
Maldives
Mongolia
Nigeria
Panama
Papua
New
Guinea
Russia
January
2012
July
2011
April
2008
August
2010
September
2012
November
2008
April
2012
November
2011
June
2012
February
2012
September
2012
SWF bill proposed by
government in October 2012;
Parliament approved bill and
SWF survived court challenge
in 2013. No actual revenues
or investments yet.
First investments in May 2012 of
!200 mn for 46% stake in Reti
TLC-Metroweb and of !150 mn
for 90% stake in Kedrion.
Still under consideration but
no official legislation submitted
to Diet.
No gas proceeds have been
realized and so fund remains
embryonic.
Still in planning stage.
Unclear whether SWF ever
actually set up; no investments
have been made.
Apparently still
in planning stage.
First Fund board meeting held in
September 2012, and first
investment ($200 mn) made in
September 2013. Issued $1 bn
Eurobond in 2013 and committed
$550 mn to boosting electricity
supply in February 2014.
Pending.
Fund set up, awaiting initial
capital injection planned
for 2014.
Two SWFs (the Russia Reserve
Fund and National Welfare Fund)
are already operating. FFA to
begin 2013.
After two enormous natural gas fields were proven off Israel’s coastline,
the government proposes a new SWF to be funded from the state’s future
gas revenues. The fund will invest in education and health and will help
develop Israel’s high-tech export industries. Though initial capitalization
to be $10 bn, plans call for the fund to reach $80 bn by 2040.
Italy launched the Fondo Strategico Italiano with a seed investment
of !1 bn from state entities Cassa Depositi e Prestiti and Fintecna. Fund’s
purpose to acquire minority interests in promising Italian companies,
and plans are to achieve !4 bn in total funding.
A panel set up by ruling Liberal Democratic Party proposed legislation to
set up SWF. In September 2011, ruling Democratic Party of Japan again
proposed setting up a $5 bn SWF using some of Japan’s huge foreign
exchange reserves in order to weaken the yen, earn higher returns on
forex reserves, and cushion fiscal impact of country’s aging population.
Lebanon’s Parliament approved a long-delayed Energy law establishing
procedures for developing large offshore natural gas deposits
and authorizing a new SWF if and when state revenues begin to accrue.
A new SWF was proposed by country’s finance minister after African Petroleum
Corporation announced it had found significant offshore oil reserves.
The newly-elected president, Mohamed Nasheed, proposed that Maldives
divert a portion of its tourist revenues to set up a SWF as insurance
against climate change and rising seas. President later claimed
that the fund was established.
Government announced plans to use proceeds from mining vast
newly-discovered mineral deposits to set up SWF with an initial $600 mn
capitalization.
Newly-appointed finance minister Ngozi Okonjo-Iweala announced plans
to set up SWF to better manage part of country’s large — but historically
mismanaged — oil revenues. Fund actually established in September
2012 with $1 bn initial capitalization and $100 mn per month revenue
inflow. Fund unsuccessfully challenged in court by nation’s powerful state
governors.
Cabinet Council approved a plan for the Savings Fund of Panama,
a sovereign wealth and stabilization fund, to be funded through Panama
Canal revenues in excess of 3.5% of GDP. Bill submitted to Congress
calling for fund to begin in 2015, and eventually reach $6 bn funding.
Prime Minister Peter O’Neill announced that one new liquefied natural gas
(LNG) project would ultimately contribute over $30 bn (ten times the coun-
try’s GNP) to a new SWF. The SWF bill was quickly approved unanimously
by PNG’s Parliament in February 2012. The LNG project should begin its
first exports, and contributions to SWF in 2014.
Russian finance minister Anton Siluanov announced plans for the new
Federal Financial Agency (FFA) to begin operating in 2013. The new SWF
will invest excess oil revenues broadly in international and domestic assets,
including equities for the first time. The $150 bn of assets in the two exi-
sting funds will be transferred to the FFA.
Source: Megginson, W.L., and V. Fotak, “The rise of the fiduciary state: a survey of SWF research”, SIL Working Paper, 2014.
Saudi
Arabia
Scotland
Sierra
Leone
Slovenia
South
Africa
Tanzania
Zimbabwe
January
2008
November
2012
April
2012
July
2012
November
2010
September
2012
November
2013
Apparently established,
but no major investments
yet announced.
Proposed, but actual establishment
would only occur if SNP wins
the independence election
in September 2014.
Planned but not yet
established or funded.
Planned but not yet approved.
Under consideration, but no
formal plans for a SWF
have been submitted
by the government.
Planned but not yet formally
approved or funded.
Planned but not yet approved.
The vice governor of Saudi Arabian Monetary Authority (SAMA) announced
that Saudi Arabia’s Finance Ministry was considering launching a SWF,
with about $6 bn initial capitalization, that would mostly make equity
investments. The fund was apparently established in March 2009.
Setting up a Scottish SWF on the lines of Norway’s model has long been
a proposal of the Scottish National Party (SNP), using oil revenues
from the UK sector of North Sea fields. Listed as an objective if SNP wins
election to make Scotland independent from UK.
The Finance Minister, Samura Kamara, announced plans to set up a SWF
financed through “windfall mining revenues” and proceeds from oil sales
that could flow by 2015.
Government submitted to Parliament draft legislation to set up a SWF
as a “bad bank” to take over !10 bn worth of bad loans from the nation’s
banks. The opposition successfully forced a referendum on the bad
bank/SWF plan, which is pending.
The government proposed setting up a SWF to help manage forex
reserves, reduce the value of the rand, and promote economic
development. The proposal was not adopted, but in February 2012
a report commissioned by the ruling African National Congress called
for a SWF to be set up and funded with a new tax on the mining industry
that could raise $5.3 bn per year.
Government proposed setting up a SWF to manage revenues from large,
newly discovered offshore natural gas deposits.
In a 15,000 word document, government proposed setting up a SWF to
be funded through various fiscal savings and new bond issues. Legislation
officially tabled by government in January 2014.
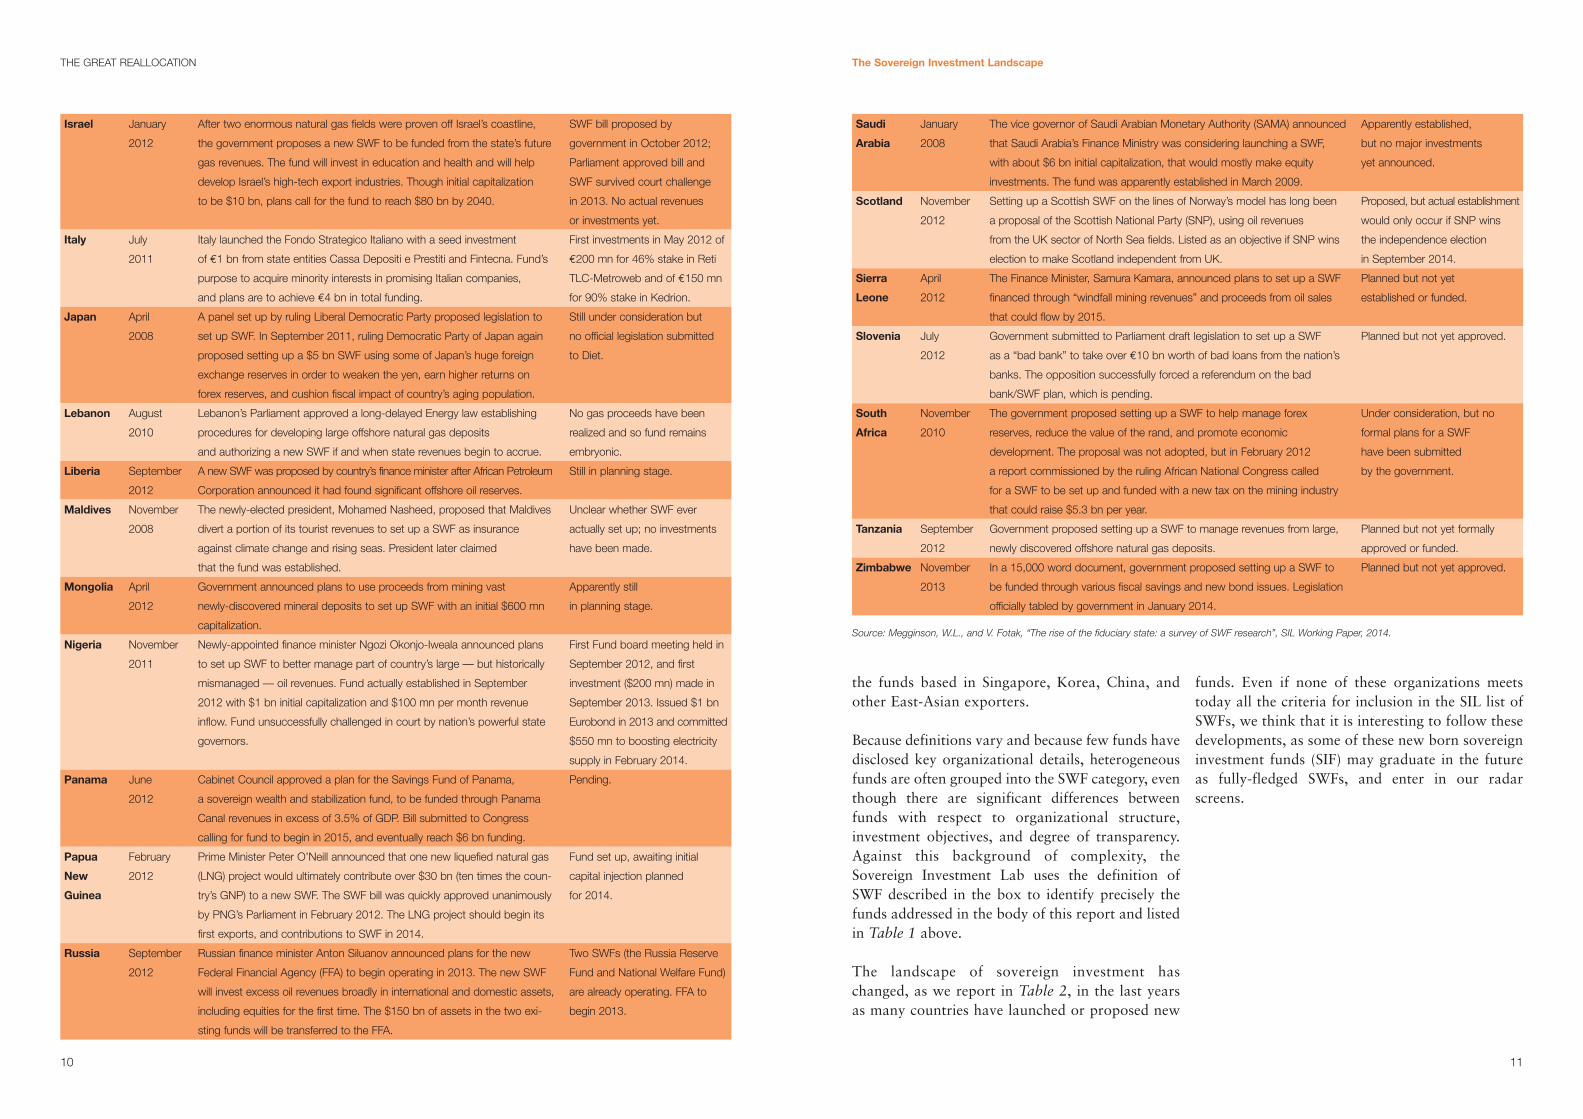
the funds based in Singapore, Korea, China, andother East-Asian exporters.
Because definitions vary and because few funds havedisclosed key organizational details, heterogeneousfunds are often grouped into the SWF category, eventhough there are significant differences betweenfunds with respect to organizational structure,investment objectives, and degree of transparency.Against this background of complexity, theSovereign Investment Lab uses the definition ofSWF described in the box to identify precisely thefunds addressed in the body of this report and listedin Table 1 above.
The landscape of sovereign investment haschanged, as we report in Table 2, in the last yearsas many countries have launched or proposed new
funds. Even if none of these organizations meetstoday all the criteria for inclusion in the SIL list ofSWFs, we think that it is interesting to follow thesedevelopments, as some of these new born sovereigninvestment funds (SIF) may graduate in the futureas fully-fledged SWFs, and enter in our radarscreens.
The Sovereign Investment Landscape
11
13
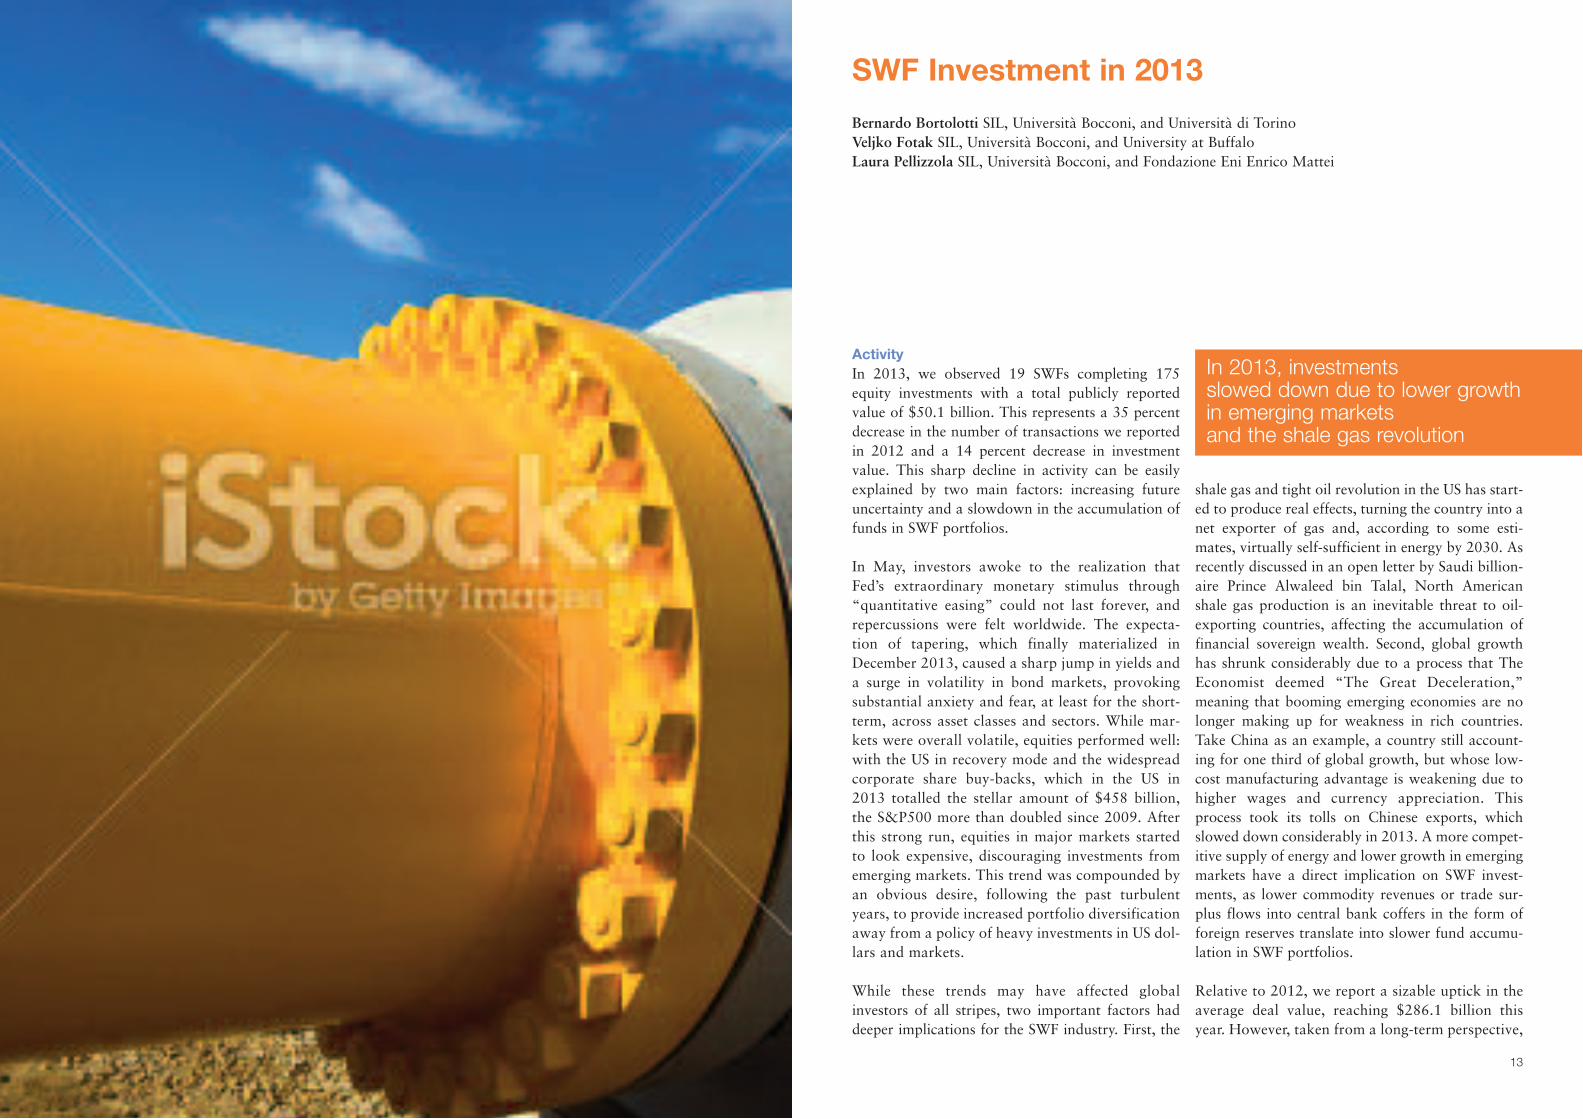
Activity In 2013, we observed 19 SWFs completing 175equity investments with a total publicly reportedvalue of $50.1 billion. This represents a 35 percentdecrease in the number of transactions we reportedin 2012 and a 14 percent decrease in investmentvalue. This sharp decline in activity can be easilyexplained by two main factors: increasing futureuncertainty and a slowdown in the accumulation offunds in SWF portfolios.
In May, investors awoke to the realization thatFed’s extraordinary monetary stimulus through“quantitative easing” could not last forever, andrepercussions were felt worldwide. The expecta-tion of tapering, which finally materialized inDecember 2013, caused a sharp jump in yields anda surge in volatility in bond markets, provokingsubstantial anxiety and fear, at least for the short-term, across asset classes and sectors. While mar-kets were overall volatile, equities performed well:with the US in recovery mode and the widespreadcorporate share buy-backs, which in the US in2013 totalled the stellar amount of $458 billion,the S&P500 more than doubled since 2009. Afterthis strong run, equities in major markets startedto look expensive, discouraging investments fromemerging markets. This trend was compounded byan obvious desire, following the past turbulentyears, to provide increased portfolio diversificationaway from a policy of heavy investments in US dol-lars and markets.
While these trends may have affected globalinvestors of all stripes, two important factors haddeeper implications for the SWF industry. First, the
shale gas and tight oil revolution in the US has start-ed to produce real effects, turning the country into anet exporter of gas and, according to some esti-mates, virtually self-sufficient in energy by 2030. Asrecently discussed in an open letter by Saudi billion-aire Prince Alwaleed bin Talal, North Americanshale gas production is an inevitable threat to oil-exporting countries, affecting the accumulation offinancial sovereign wealth. Second, global growthhas shrunk considerably due to a process that TheEconomist deemed “The Great Deceleration,”meaning that booming emerging economies are nolonger making up for weakness in rich countries.Take China as an example, a country still account-ing for one third of global growth, but whose low-cost manufacturing advantage is weakening due tohigher wages and currency appreciation. Thisprocess took its tolls on Chinese exports, whichslowed down considerably in 2013. A more compet-itive supply of energy and lower growth in emergingmarkets have a direct implication on SWF invest-ments, as lower commodity revenues or trade sur-plus flows into central bank coffers in the form offoreign reserves translate into slower fund accumu-lation in SWF portfolios.
Relative to 2012, we report a sizable uptick in theaverage deal value, reaching $286.1 billion thisyear. However, taken from a long-term perspective,
SWF Investment in 2013
In 2013, investments slowed down due to lower growth in emerging markets and the shale gas revolution
Bernardo Bortolotti SIL, Università Bocconi, and Università di TorinoVeljko Fotak SIL, Università Bocconi, and University at BuffaloLaura Pellizzola SIL, Università Bocconi, and Fondazione Eni Enrico Mattei

15
diversification will continue being a driving force,but sectors and geographies where these organiza-tions tend to have a competitive advantage asinvestors will skew operations in favour of largerdeals and high price tags.
SectorsIn 2013, as usual, financial services received morepublicly reported investments from SWFs than anyother sector: 47 deals worth $11.0 billion, 22 per-cent of total investment. At the peak of the finan-cial crisis, the financial sector attracted the lion’sshare of sovereign investments and stellar amountsin the form of capital injections in distressed banksin both developed and emerging economies. Morerecently, SWFs have diversified their portfolios bet-ter by reducing overall exposure to banks in their
new investments.Also, we should note that, while SWF investments inthe financial industry in the 2008-2011 years werefocused on domestic rescues and recapitalizations ofstruggling Western financial institutions, in 2013SWFs allocated their investments abroad primarilyto banks in emerging economies. In other words,while SWFs are still in part aiding with domesticrecovery, about half of their financial-sector invest-ments are aimed at gaining exposure to the sector’srecovery – and are thus more likely to be cross-bor-der investments.
At any rate, SWFs’ appetite for big internationalbanks did not vanish completely in 2013. Indeed, oneof the most significant deals of the year is the $1 bil-lion investment in Bank of America by the QatarInvestment Authority (QIA), an example of the fund’s
SWF Investment in 2013
the general trend confirms a decline in deal valuereflecting deep organizational changes in theindustry. An increasing number of SWFs is rethink-ing the traditional model based on external for-profit asset managers and questioning the valueproposition it offers against agency costs and man-agement fees. As a result, these organizations arebecoming more active in the direct management oftheir portfolios through the creation of internalteams. In this direction, several SWFs have alsorecently opened satellite offices in internationalfinancial centres as a strategy to acquire highly spe-cialized skills from established pools of humancapital and to activate local network effectsenabling deal flows. Enhanced internal capacityenabled the direct execution of a larger number ofoperations, and more deals of smaller size appearon our radar screen. However, structural and orga-
14
nizational changes take time. Consider that SWFare very large organizations by assets with verylimited staff. The combined personnel of the threelargest funds (Norges Bank InvestmentManagement, which manages the wealth of theNorwegian Government Pension Fund Global,China Investment Corporation, and Abu DhabiInvestment Authority) is about 3,000 people withtotal assets under management exceeding $2 tril-lion, as compared to the 20,000 staff of an institu-tional investor such as Fidelity, managing $1.5 tril-lion. The internal capabilities for internal execu-tion will increase, but still the legacy of SWF as rel-atively understaffed organization will matter forthis developments. We thus expect that deal sizewill tend to decrease on average, but will remainsignificantly higher than typical private sectortransactions in the foreseeable future. Indeed,
THE GREAT REALLOCATION
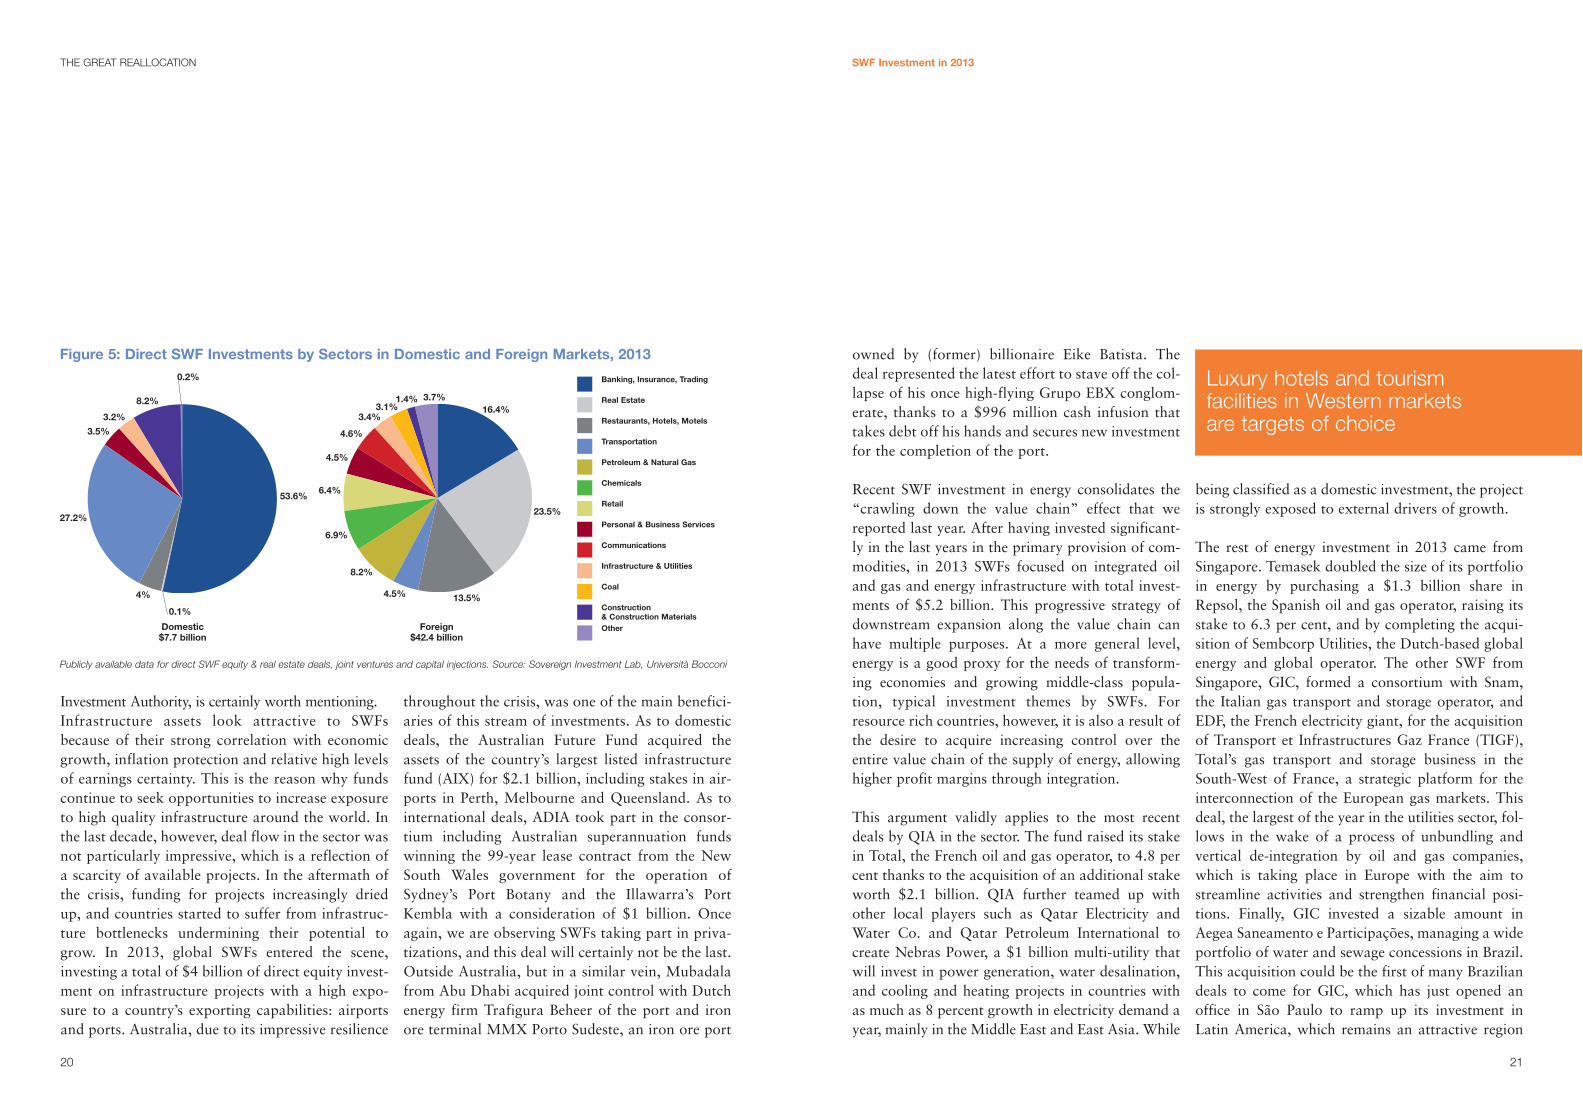
Publicly available data for direct SWF equity & real estate deals, joint ventures and capital injections. Source: Sovereign Investment Lab, Università Bocconi
Figure 1: Direct SWF Investments since 2000Value (US$BN)Number
Average Deal Size (US$MN)300
250
200
150
100
50
02000 2001 2002 2003 2004 2005 2006 2007 2008 2009 2010 2011 2012 2013
27 201.8 0.5 1.3 1.8 5.7 11.5
25.2
77.7
111.7
88.2
47.6
82.6
58.4
33 3853
93 92
137
173158
210
250270
50.1
175
Publicly available data for direct SWF equity & real estate deals, joint ventures and capital injections. Source: Sovereign Investment Lab, Università Bocconi
Figure 2: Direct SWF Investment: Average Deal Size since 2000
800.0
700.0
600.0
500.0
400.0
300.0
200.0
100.0
0.02000 2001 2002 2003 2004 2005 2006 2007 2008 2009 2010 2011 2012
66.324.4 38.8 46.2
106.8 123.4
273.6
566.9
645.6
558.2
226.4
330.4
216.3
2013
286.1

17
ing global expansion as demand for offshore finan-cial services surges along with the growing presenceof Chinese companies in overseas markets. In 2013,CCB, has acquired 72 percent of capital of BancoIndustrial e Comercial, a primary commercial bankin Brasil, and also participated with a $100 millionticket to the consortium involving SWFs for abovementioned privatization of the Russian VTB.Construction Bank, which added operations incountries including Dubai and Japan this year, nowhas 17 subsidiaries with assets of about $120 billionin 15 nations. Geographical diversification of activ-ities by Chinese banks has become an importanttrend to follow and could have strong consequencesfor the SWFs who have invested in them.
Since the financial crisis, real estate had anincreasing role on SWF investment portfolios.
During 2012, SWFs went on a spending binge andso reporting a scaling back in 2013 is hardly sur-prising. With 22 publicly reported deals worth$10 billion, real estate still represents 20 per centof total investment value, quite in line with thetotal amount raised in the financial industry – andthose numbers do not include the substantialinvestments in hotels that we analyse and discussseparately. Indeed, over the last decade, appetitefor brick-and-mortar assets has increased, andnowadays together with alternative investmentsand private equity real estate represents a signifi-cant and increasing share of SWF portfolios.Several explanations can be set forth to under-stand this trend, such as the demand for safe,“inflation-free” assets, but also the cheap pricesthat can still be fetched in the housing markets ofdeveloped economies.
SWF Investment in 2013
strategy to acquire minority stakes in major globalcompanies. The position, while significant in absolutesize, represents a stake below 1 percent and did thusnot require regulatory disclosure. Accordingly, whileQIA disclosed the investment in the fall of 2013,shares were likely accumulated over the previous twoyears on the open market. The rationale of the invest-ment appears to be a desire to profit from the USrecovery. Yet, we know little about QIA’s stakes in USfirms and it is possible that the SWF is holding other,undisclosed, investments below the five percentreporting threshold. In the past, QIA has gainedexposure to Western financial institutions through astake in Credit Suisse, acquired in 2008, and threecapital injections into Barclays in the same year. QIAcurrently holds also interests in the financial sector inGreece, after investments in the now merged AlphaBank and Eurobank.
With this notable exception, in 2013 SWFs shiedaway from the financial industry of developedeconomies, focusing instead on emerging markets.Probably one of the most interesting deals of theyear is the joint acquisition of Russia’s second-largest bank VTB by a consortium of sovereignwealth funds, including Qatar Holding, Azerbaijan’sstate oil fund SOFAZ, and Norges Bank InvestmentManagement, each investing about $500m. This$3.3 billion secondary offering – a privatizationdiluting the Russian Government’s ownership stakefrom 75.5 percent to 60.93 percent - has strength-ened considerably VTB Bank’s capital ratio, beingalso a direct result of the Russian Government’sstated policy of seeking to privatize a number of keystate entities over the next several years.Interestingly, this deal represents a case of sovereign
16
involvement on the two sides of the market, as sell-er and buyer, an outcome that we will be observingfrequently in future privatization waves. Amongstcross-border deals in the financial sector, we shouldalso note the acquisition by the Government ofSingapore Investment Corporation (GIC) of 5.6 per-cent of the Bank of Philippines Island marking theenduring relevance of the fund as a key regionalplayer in South Asia.
Reporting on China Investment Corporation (CIC)activism in the domestic banking industry in 2012,we concluded that with slowing GDP growth andshrinking bank profits due to bad loans, the mostrecent round of capital infusions was not going to bethe last. Indeed, our prediction was correct. In 2013,CIC has relied heavily on its domestic arm, CentralHuijin, to strengthen all “Big Four” state-ownedbanks also as a strategy to prop up the domesticequity markets for “A shares”. The fund invested$439 million in nine capital injections involving theIndustrial and Commercial Bank of China (ICBC),the Bank of China, the Agricultural Bank of China,and the China Construction Bank (CCB). Temasek,the second largest fund from Singapore, followed inthis wake by buying a minority stake in ICBC in twotranches worth $273 million. Temasek, by amassingstakes worth almost $18 billion in Big Four, is thebiggest foreign investor in Chinese banks, and iscontinuing to build on the portfolio rather thanshrinking it. Such an overexposure to the Chinesebanks may be risky: if growth in China continues toslow down, the financial sector will be the firstaffected, and this might seriously dent the portfolio.It must be noted, however, that Chinese banks, fac-ing deteriorating conditions at home, are accelerat-
THE GREAT REALLOCATION
Publicly available data for direct SWF equity & real estate deals, joint ventures and capital injections. Source: Sovereign Investment Lab, Università Bocconi
Figure 3: Number of Direct SWF Investments by Target Sector, 2006 - 2013
280
240
200
160
120
80
40
0
Banking, Insurance, Trading
Real Estate
Petroleum & Natural Gas
Transportation
Chemicals
Precious Metals, Non-Metallic,and Industrial Metal MiningInfrastructure & Utilities
Aircraft, Autos, Ships & Trains
Retail
Communications
Restaurants, Hotels, Motels
Other
2006
92
2007
137
2008
173
2009
158
2010
210
2011
250
2012
270
2013
175

19
but more recently its allocation has changed toinclude a 5 percent of assets in real estate. In 2013,the fund landed in the US after tapping Europeanproperty markets, and started to add on its globalportfolios properties worth $1.7 billion, includingthe entire block of the iconic Time Square Towerfrom Boston Properties, the assets of a joint venturewith the US pension fund TIAA-CREF, and a port-folio of 11 UK distribution properties from the realestate firm LondonMetric through a joint venturewith Prologis (U.S. Logistic Venture – USLV)
Finally, the Kuwait Investment Authority (KIA) sur-passed the $1 billion mark of property investment inLondon and New York. KIA completed its acquisi-tion of Bank of America’s European headquartersfrom the private equity group Evans Randall. Thesale of London’s 5 Canada Square marks one of themost valuable office transactions in London sincethe start of the global financial downturn and high-lights the increasing interest from Middle Easternsovereign wealth funds in prime office space inLondon. In U.S., the Atlanta-based subsidiary ofKIA acquired Washington’s 1200 19th St. NW forabout $294 million, or roughly $871 per squarefoot, one of the highest prices for an investment salein downtown D.C. Finally, KIA joined also forceswith real estate developer Related Companies andOxford properties to invest in the $15 billionHudson Yards project in Manhattan.
In 2013, deal flow in hotels and tourism facilitieshas been particularly impressive, yielding $6 billionin 16 acquisitions, following a very similar patternof real estate deals. SWFs displayed a strong prefer-ence for assets of established brands in developed
markets, and the usual handful of funds wasinvolved. QIA confirmed its appetite for trophy-assets and luxury brands by acquiring via its special-ized subsidiary Constellations Hotels Holding noth-ing less than the InterContinental flagship hotels inLondon and New York, l’Hotel du Louvre in Paris,and the Four Seasons Hotel in Florence. In a sepa-rate £100m deal it also acquired the freehold fromthe Crown Estate, the property company that con-trols the assets of the Crown in the United Kingdom.Indeed, QIA is building a global top-end hotel port-folio, and this year’s $2.4 billion purchases markanother landmark in the process.
However, the single largest deal of the year in the hotelsector was completed by GIC, acquiring three luxuryresorts managed by the Waldorf Astoria Hotels &Resorts brand of Hilton Worldwide, among which theGrand Wailea Resort in Maui, Hawaii for $1.5 billion.After winning a tough bidding with other investorsincluding other SWFs, Abu Dhabi InvestmentAuthority (ADIA) bought for $991 million 42Marriott-branded hotels from Britain’s Royal Bank ofScotland featuring landmark hotels in the UnitedKingdom’s capital, including the County Hall hoteland the renowned London Regent’s Park. Finally, theacquisition of the historical Hotel Eden in Rome by theDorchester Group, the luxury hotel operator of Brunei
SWF Investment in 2013
While in line with these broad trends shaping port-folio reallocation, we highlight a few noteworthyfeatures in 2013 activity in real estate: a high con-centration of very large deals in the United Kingdomand US and the absence of development projects inemerging economies. The BRICs (Brazil, Russia,India, and China) are slowing down in bothabsolute and relative terms: according to IMF esti-mates, they accounted for two-thirds of world GDPgrowth in 2008, for half of it in 2011, and for about40% in 2013. Naturally, this translates into lowerinvestment flows towards development and infra-structure projects in the developing world.
Interestingly, sovereign investment in real estate lastyear is dominated by four SWFs. GIC alone spent$3.58 billion in the sector and executed one of thebiggest European property deals since the financial
18
crisis, the $2.8 billion acquisition of BroadgateEstates, a large office and retail complex at the heartof the City of London, purchased from US privateequity firm Blackstone. In partnership with ADIA,the Singaporean fund also contributed $400 millionto a $1.3 billion purchase of Time Warner’s head-quarters in the Time Warner Center. Indeed, ADIAhas been very active in the French property marketlast year, by completing the acquisition of DocksLyonnais portfolio – which includes 6-8 BoulevardHaussmann in Paris, Le Capitole in Nanterre andAntony Parc in the south of Paris - from UBS WealthManagement fund, for $916 million, and the acqui-sition of a large property in 90 Boulevard Pasteur.
The Norwegian Government Pension Fund Global(GPFG) is not immune to this trend. Its portfolio hasbeen traditionally focused on equities and bonds,
THE GREAT REALLOCATION
The boom in real estate continues a pace with a shift from development projects to existingbrick-and-mortar assets
Publicly available data for direct SWF equity & real estate deals, joint ventures and capital injections. Source: Sovereign Investment Lab, Università Bocconi
Figure 4: Value of Direct SWF Investments by Target Sector, 2006 - 2013
120
100
80
60
40
20
02006
25.2
2007
77.7
2008
111.7
2009
88.2
2010
47.6
2011
82.6
2012
58.4
2013
50.1
Banking, Insurance, Trading
Real Estate
Petroleum & Natural Gas
Transportation
Chemicals
Precious Metals, Non-Metallic,and Industrial Metal MiningInfrastructure & Utilities
Aircraft, Autos, Ships & Trains
Retail
Communications
Restaurants, Hotels, Motels
Other
21
SWF Investment in 2013
Investment Authority, is certainly worth mentioning.Infrastructure assets look attractive to SWFsbecause of their strong correlation with economicgrowth, inflation protection and relative high levelsof earnings certainty. This is the reason why fundscontinue to seek opportunities to increase exposureto high quality infrastructure around the world. Inthe last decade, however, deal flow in the sector wasnot particularly impressive, which is a reflection ofa scarcity of available projects. In the aftermath ofthe crisis, funding for projects increasingly driedup, and countries started to suffer from infrastruc-ture bottlenecks undermining their potential togrow. In 2013, global SWFs entered the scene,investing a total of $4 billion of direct equity invest-ment on infrastructure projects with a high expo-sure to a country’s exporting capabilities: airportsand ports. Australia, due to its impressive resilience
owned by (former) billionaire Eike Batista. Thedeal represented the latest effort to stave off the col-lapse of his once high-flying Grupo EBX conglom-erate, thanks to a $996 million cash infusion thattakes debt off his hands and secures new investmentfor the completion of the port.
Recent SWF investment in energy consolidates the“crawling down the value chain” effect that wereported last year. After having invested significant-ly in the last years in the primary provision of com-modities, in 2013 SWFs focused on integrated oiland gas and energy infrastructure with total invest-ments of $5.2 billion. This progressive strategy ofdownstream expansion along the value chain canhave multiple purposes. At a more general level,energy is a good proxy for the needs of transform-ing economies and growing middle-class popula-tion, typical investment themes by SWFs. Forresource rich countries, however, it is also a result ofthe desire to acquire increasing control over theentire value chain of the supply of energy, allowinghigher profit margins through integration.
This argument validly applies to the most recentdeals by QIA in the sector. The fund raised its stakein Total, the French oil and gas operator, to 4.8 percent thanks to the acquisition of an additional stakeworth $2.1 billion. QIA further teamed up withother local players such as Qatar Electricity andWater Co. and Qatar Petroleum International tocreate Nebras Power, a $1 billion multi-utility thatwill invest in power generation, water desalination,and cooling and heating projects in countries withas much as 8 percent growth in electricity demand ayear, mainly in the Middle East and East Asia. While
being classified as a domestic investment, the projectis strongly exposed to external drivers of growth.
The rest of energy investment in 2013 came fromSingapore. Temasek doubled the size of its portfolioin energy by purchasing a $1.3 billion share inRepsol, the Spanish oil and gas operator, raising itsstake to 6.3 per cent, and by completing the acqui-sition of Sembcorp Utilities, the Dutch-based globalenergy and global operator. The other SWF fromSingapore, GIC, formed a consortium with Snam,the Italian gas transport and storage operator, andEDF, the French electricity giant, for the acquisitionof Transport et Infrastructures Gaz France (TIGF),Total’s gas transport and storage business in theSouth-West of France, a strategic platform for theinterconnection of the European gas markets. Thisdeal, the largest of the year in the utilities sector, fol-lows in the wake of a process of unbundling andvertical de-integration by oil and gas companies,which is taking place in Europe with the aim tostreamline activities and strengthen financial posi-tions. Finally, GIC invested a sizable amount inAegea Saneamento e Participações, managing a wideportfolio of water and sewage concessions in Brazil.This acquisition could be the first of many Braziliandeals to come for GIC, which has just opened anoffice in São Paulo to ramp up its investment inLatin America, which remains an attractive region
20
throughout the crisis, was one of the main benefici-aries of this stream of investments. As to domesticdeals, the Australian Future Fund acquired theassets of the country’s largest listed infrastructurefund (AIX) for $2.1 billion, including stakes in air-ports in Perth, Melbourne and Queensland. As tointernational deals, ADIA took part in the consor-tium including Australian superannuation fundswinning the 99-year lease contract from the NewSouth Wales government for the operation ofSydney’s Port Botany and the Illawarra’s PortKembla with a consideration of $1 billion. Onceagain, we are observing SWFs taking part in priva-tizations, and this deal will certainly not be the last.Outside Australia, but in a similar vein, Mubadalafrom Abu Dhabi acquired joint control with Dutchenergy firm Trafigura Beheer of the port and ironore terminal MMX Porto Sudeste, an iron ore port
THE GREAT REALLOCATION
Luxury hotels and tourism facilities in Western markets are targets of choice
Banking, Insurance, Trading
Real Estate
Restaurants, Hotels, Motels
Transportation
Petroleum & Natural Gas
Chemicals
Retail
Personal & Business Services
Communications
Infrastructure & Utilities
Coal
Construction & Construction MaterialsOther
Publicly available data for direct SWF equity & real estate deals, joint ventures and capital injections. Source: Sovereign Investment Lab, Università Bocconi
Figure 5: Direct SWF Investments by Sectors in Domestic and Foreign Markets, 2013
Domestic$7.7 billion
Foreign$42.4 billion
16.4%
23.5%
13.5%4.5%
53.6%
0.1%
4%
0.2%
27.2%
3.5%3.2%
8.2%
8.2%
6.9%
6.4%
4.5%
4.6%
3.4%3.1%
1.4% 3.7%

23
ling stake from the real estate investment division ofDeutsche Bank’s Asset Management division via itsspecialized Luxemburg-based operating arm DivineInvestment, outbidding the French competitorGaleries Lafayette. QIA also increased its stake inTiffany & Co. to 11.3 percent, with the acquisitionof an additional 3.2 million shares of the retailer.After Harrods, LVMH, Porsche, and some ofEurope’s leading luxury hotels, the extent of Qatar’sInvestment Authority involvement in the luxuryindustry this year has become even more impressive,perhaps not surprising given that Qatar is, by somemetrics, the richest country in the world.
GeographyIf one takes a broad view on SWF investment flowsover the last years by target regions, the strong pref-
erence given to developed markets sticks out. Onaverage, OECD economies account for the majorityof deal values. Interestingly, this share has beensteadily increasing since 2010, reaching 65 percentof total investment in 2013 ($32.7 billion), the high-est value since the financial crisis. The share ofBRICS, conversely, shrunk to 21 percent ($10.7 bil-lion), while frontier markets (i.e. economies withthin capitalization and illiquid markets but endowedwith a potential to graduate as fully fledged emerg-ing economies) lagged behind. One could interpretthis decline of interest by SWFs in emerging marketsas an initial effect of the so called GreatDeceleration, whereby the investment in BRICs doesnot look any longer impressive as compared to theprospect and stability of mature economies and tothe low prices that can fetched in these markets.Indeed, with the Eurozone stabilizing thanks to ECB
SWF Investment in 2013
despite macroeconomic turbulence and bleakgrowth prospect, at least in the short run.
Companies in the chemical sector did not enter theradar screen of SWFs since the large-scale acquisi-tions reported in 2009. 2013 marks a definiteupward trend of investment in the sector, primarilythanks to the acquisition of the world largestpotash producer, the Russian Uralkali, by CIC. This$2.1 billion deal, the third largest by value in 2013,involved the exchange into equity of bonds issuedby a special purpose vehicle owned by Russian oli-garch Suleiman Kerimov. The move paves the wayfor Mr. Kerimov’s exit as shareholder to quell anugly dispute with Belarus that has landed Uralkali’schief executive in a Belarusian prison and prompt-ed Belarus to issue a warrant for Mr. Kerimov’sarrest. The arrest of the CEO on abuse of power
22
charges followed Uralkali’s departure from a trad-ing partnership with Belarus’ state-run potashminer that effectively ended an informal globalpricing cartel and threw the market for the fertiliz-er additive into turmoil. Chinese investors shouldcontribute to stabilize company and markets. At amore general level, as economic development andurbanization continues, China’s demand for agri-cultural products (including fertilizers) will keep ongrowing. Agriculture is a relatively stable invest-ment, but more importantly, it provides China withresources that it needs in the long term.
Finally, QIA confirmed its interest in “trophyassets”, as its investment in luxury brands andretailers continues unabated. QIA’s subsidiary QatarHolding took full control of French departmentstore Printemps. Qatar Holding bought a control-
THE GREAT REALLOCATION
Publicly available data for direct SWF equity & real estate deals, joint ventures and capital injections. Source: Sovereign Investment Lab, Università Bocconi
Figure 6: SWF Investments in OECD and Non-OECD Markets, 2006 - 2013
100.00%
90.00%
80.00%
70.00%
60.00%
50.00%
40.00%
30.00%
20.00%
10.00%
02006
25.2
29.3%
70.7%
2007
77.7
40.2%
59.8%
2008
111.7
34.0%
66.0%
2009
88.2
50.2%
49.8%
2010
47.6
50.0%
50.0%
2011
82.6
47.6%
52.4%
2012
58.4
41.0%
59.0%
2013
50.1
34.6%
65.4%
OECD
Non-OECD
Publicly available data for direct SWF equity & real estate deals, joint ventures and capital injections. Source: Sovereign Investment Lab, Università Bocconi
Figure 7: Direct SWF Investments by Country in 2012 and 2013
14
12
10
8
6
4
2
0
USA
France UK
Russia
Australi
aQat
arIndia
Spain
Indonesia
Italy
Brazil
China
New Z
ealan
d
Germ
any
South K
orea
Other
s
7.977.70
6.61
5.37
2.12
10.11
11.82
0.33
1.19
2.64
0.10
1.50
2.98
1.050.21
14.71
9.38
4.023.64
2.84
1.65 1.60 1.50 1.37 1.13 0.78 0.66
2.31
0.260.93
2013
2012

Over the past year, SWFs have displayed anincreasing desire and ability to team up and findopportunities for co-investments with other SWFsor other financial investors and through joint-ven-tures. This trend is related to SWFs moving awayfrom expensive – and not always effective – exter-nal fund management and towards more internalportfolio management. As SWFs attempt to man-age a larger portion of their funds in-house, collab-oration is a way to leverage limited human-resources, to learn from their investment partners,and to spread risks. The rationale is very simple:sharing information, generating economies of scale,leverage up control power while maintaining portfo-lio diversification.
Alliances amongst SWF have typically taken theform of direct equity co-investments in the sametarget, epitomized by high mark acquisition of Totaland Xstrata by the pooled resources of QIA, CIC,and GIC. Another high-profile co-investment is theacquisition in 2013 by GIC, ADIA, KIA, and theGPFG of an undisclosed share of Royal Mail, therenowned postal operator of the United Kingdom,with a combined deal value of $340 million. In par-ticular, GIC emerged as the second biggest privateinvestor in Royal Mail with a 4.1 percent stake inthe newly privatised delivery company. SWF co-investment in privatizations included also theacquisition of Russia’s second-largest bank VTB bya consortium including Qatar Holding, Azerbaijan’sstate oil fund SOFAZ, and Norges Bank InvestmentManagement, each investing approximately$500m.
A trend surfacing in 2012 and consolidating in 2013is the emergence of private equity funds as joint-ventures amongst SWFs and other sovereigninvestors. Last year we reported the launch of theIQ Made in Italy joint-venture between FondoStrategico Italiano, the private equity investmentarm of Italian Cassa Depositi e Prestiti, and QatarHolding, the subsidiary of QIA. This model has beeninstitutionalized by the Russian Development
24
Investment Fund (RDIF). By statute, in every trans-action it enters into, RDIF is mandated to co-investwith an international investor qualified by size. In2013, RDIF successfully established bilateralinvestment platforms with SWFs such as Mubadalafrom Abu Dhabi, the Korea Investment Corporation,CIC, and the Fondo Strategico Italiano, and dealsstarted to flow. The Russia-China venture investedin the Russian Forest Products Group and in theMoscow Exchange. In a similar vein, this year alsowitnessed the investments in Indian operatorsNational Commodity and Derivative Exchange andthe Bangalore based ING Vysya Bank by the OmanIndia Joint Investment Fund. This special purposevehicle between Oman’s SWF and the State Bankof India was launched in 2011with an initial corpusof $100 million for promoting joint investment inprojects in India but the investment partnershipbetween India and Oman is reflected through oper-ation of hundreds of joint ventures which are valuedat $7.5 billion.
In context of rising alliances, a very interesting trendto follow is the increased cooperation betweenSWFs and other private, like-minded investors indeal making. In a rather bold move, the QatarInvestment Authority has invested $3 billion in thelaunch of Doha Global Investment Company, a newbusiness half-owned by the country’s sovereignwealth fund and half by the private sector, givingQatari institutions and individuals the chance toinvest around the world alongside the state. Thevehicle was slated for listing on the QatarExchange, which seeks to rival Dubai as a financialhub, but the IPO has been postponed officially dueto lacking regulatory approvals. Indeed, the publiclisting of the company might require the disclosureof information about sponsoring entities, and theQatar Investment Authority – a rather conservativeorganization – might be reluctant to fully open itsbooks. However, the QIA move is a step further: theSWF not only acts as a co-investor and partner, butis here the largest investor and catalyst for a largenumber of private-sector co-investors.
THE GREAT REALLOCATION
25
SWF Investment in 2013
Teaming up: the rise of alliances among like-minded investors
Recent joint ventures involving SWFs
Joint Venture Name
Astrea I
(Partnership of Temasek)
Oman Brunei
Investment Company
Oman India Joint
Investment Fund (OIJIF)
Russia-China
Investment Fund (RCIF)
Russian-Korean
Investment Platform
RDIF-Mubadala
Co-Investment Fund
Unnamed Assets Fund
(Partnership of GIC)
NSW Ports
(Partnership of ADIA)
JV Norwegian Government
Pension Fund Global
and Boston Properties
Year
of Inception
2006
2009
2011
2012
2013
2013
2013
2013
2013
Description
Temasek sponsored Astrea I in 2006 with a diversified and balanced portfolio of selected
Temasek interests in high quality private equity funds. Astrea I was intended as the first
of a series of private equity co-investment platforms.
Oman Brunei Investment Co. is a private equity fund jointly capitalised by Ministry
of Finance, Government of Oman (@ 50%) and the Brunei Investment Agency (@ 50%)
with a capital of US$ 100 million. The fund company has been created to promote social,
financial and economic benefits to Oman, GCC and Brunei. The fund shall undertake
investments in Infrastructure, Utilities, Metals, Education, Service, Healthcare,
Manufacturing and add value to its investee companies over the investment horizon.
Oman India Joint Investment Fund is a private equity fund sponsored by Oman’s sovereign
wealth fund State General Reserve Fund and India’s largest lender State Bank of India.
It was created with an initial corpus of US$100 million.
The Russia-China Investment Fund (RCIF) is a $2-4 billion private equity fund, established
jointly by the Russian Direct Investment Fund (RDIF) and China Investment Corp (CIC),
aims to generate strong returns from equity investments in projects that take advantage
of the increasingly robust economic relationship between Russia and China.
The Russian Direct Investment Fund and the Korea Investment Corporation agreed
to form the Russian-Korean Investment Platform. The investment platform will focus
on cross-border investments which fulfill Russian- Korean strategic interests.
RDIF-Mubadala Co-Investment Fund is a $2 billion co-investment fund to pursue
opportunities in Russia. The fund will predominantly focus on long-term investment
opportunities across a range of industry sectors, acting as a catalyst for direct investment
in Russia. The announcement is aligned with Mubadala’s plans to establish a strong
presence in key international markets. Mubadala and RDIF are each committing $1 billion.
The majority of Mubadala's commitment will be deployed in opportunities that will be
evaluated on a deal-by-deal basis while some of the capital will be invested as
an automatic co-investment into RDIF deals.
A unnamed dedicated assets fund created by a Consortium constituted by Snam,
the Italian gas transport and storage operator (45%), GIC, the Singaporean
sovereign fund (35%) and EDF (20%, through its dedicated assets for the dismantling
of nuclear plants)
Led by Industry Funds Management, the consortium includes AustralianSuper, Cbus,
HESTA, HOSTPLUS and Tawreed Investments Limited, a wholly owned subsidiary
of the Abu Dhabi Investment Authority. NSW Ports is committed to the long term
sustainable development of the ports for the benefit of the shareholders.
Real Estate Joint Venture

26
THE GREAT REALLOCATION
JV Norwegian Government
Pension Fund Global
and TIAA-CREF
Astrea II
(Partnership of Temasek)
2013
2014
In February 2013, TIAA-CREF and Norwegian Government Pension Fund Global
announce $1.2 Billion Real Estate Joint Venture. TIAA-CREF, a leading financial services
provider, enters into a joint venture with Norges Bank Investment Management (NBIM),
manager of the Norwegian Government Pension Fund Global, to invest in high-quality
office properties in Boston, New York and Washington. TIAA-CREF owns a 50.1 percent
share and will manage the joint venture. NBIM holds the remaining 49.9 percent share.
The joint venture is invested in several prime office properties measuring 1.9 million
square feet and valued at $1.2 billion (approximately 6.6 billion kroner). TIAA-CREF
and NBIM plan to co-invest in additional high-quality office properties in Boston,
New York and Washington.
Astrea II is a co-investment vehicle with broadly diversified holdings in 36 private equity
funds. Temasek is the single largest investor in Astrea II at 38%. Astrea II is the latest
of Temasek's continuing efforts to develop co-investment platforms where diversified
portfolios of assets can be made available to a broader base of investors, including
retail investors in the long term.
Publicly available data for direct SWF equity & real estate deals, joint ventures and capital injections. Source: Sovereign Investment Lab, Università Bocconi
Direct SWF Co-investments by Type of Partnership, 2013
Value: US$16.9 billion Number of Deals: 53
Sovereign Investors28,3%
Private Partners71,7%
Sovereign Investors16,0%
Private Partners84,0%

announcements and the US in sustained recoverymode, in 2013 SWFs pushed heavily investments inWestern markets, where they found suitable targetsby size and well-functioning institutions to protecttheir returns.
At a closer look, the regional breakdown revealssome new interesting trends. While European tar-gets still attract most SWF activity (33 dealsaccounting for $18.4 billion, 37 percent of totalvalue), the Asian-Pacific region is down to 18 per-cent ($9.1 billion), half of what it raised in 2012.Investments in the United States resumed in earnest,up from the tiny 5 percent of deal value reported lastyear to 16 percent ($8.3 billion). But the real sur-prise of 2013 is the Non Pacific Asia, boasting 18percent of total investment ($8.9 billion) thanks torevamping interest in Russia, India and Turkey. The
28
analysis by target region thus allows us to qualifymore precisely the effects of the macroeconomicadjustments reported before: within BRICs, Chinawas the country mainly affected by the reallocation.
Lumping global SWF activity by region misses aqualifying feature in the geography of sovereigninvestment such as its international profile capturedby the distinction between domestic and foreigndeals, which in turn hinges upon their investmentstrategy and ultimately their mission. Some funds(such as Mubadala, Temasek, etc.) have a strongdomestic focus and a broad mandate to support thenational economy. Other funds (such as QIA, KIA,etc.), due to the limited absorption capacity of theirnational economies, invest internationally a largershare of surplus, seeking better returns and diversi-fication opportunities.
THE GREAT REALLOCATION
29
The SIL definition of a “sovereign wealth fund”hinges upon a significant share of investment to becarried out abroad by the funds, even if all ourfunds (with the notable exception of Norway’sGPFG) are free to invest at home especially if thenational economy requires support, as it oftenhappened throughout this prolonged crisis. Thatthe overwhelming majority of direct equity invest-ments by our funds took place abroad is thushardly surprising. Nevertheless, the stability ofthis share in the last years is quite striking: in2013, the share of foreign deals by value is 85 per-cent, remaining virtually unchanged relative toprevious year. As long as some pro-cyclicality canbe traced in the international patterns of SWFactivity, this recent trend can be interpreted as anadditional sign of stabilization and recovery of theinvesting countries.
As usual, the largest share of cross-border invest-ment landed in Europe, with a twist. For the firsttime since the inception of our series, the UnitedKingdom does not lead the ranking by annual dealvalue. In 2013, the prize is carried off to France, inthe context of an overall rebalancing in favour ofthe Eurozone. True, London still attracts the largestdeal flow by operations, but the total price tag forFrench targets acquired by SWF is one billion largerthan the British, with a total of $11.6 billion raisedin the Eurozone. Furthermore, in 2013 SWFs start-ed to worry about the growth prospect of emergingeconomies and therefore limited the indirect expo-sure to those markets via investment in Europeanmanufacturers with a large market shares abroad.This rebalancing is clearly visible in the sector allo-cation of SWF investment in 2013: the combinedvalue invested in European non tradable sectors
SWF Investment in 2013
Publicly available data for direct SWF equity & real estate deals, joint ventures and capital injections. Source: Sovereign Investment Lab, Università Bocconi
Figure 9: Foreign SWF Investments in Europe, 2013
Value (US$BN)
0.20
11.63
6.61
France7.70
Spain1.65
Italy 1.50
Germany0.78
Eurozone
UK
Serbia
Publicly available data for direct SWF equity & real estate deals, joint ventures and capital injections. Source: Sovereign Investment Lab, Università Bocconi
Figure 8: Value of Direct SWF Investments by Target Region, 2006 - 2013
Europe
Asia-Pacific
North America
MENA
Non-Pacific Asia
Latin America
Sub-Saharan Africa
120
100
80
60
40
20
02006
25.2
2007
77.7
2008
111.7
2009
88.2
2010
47.6
2011
82.6
2012
58.4
2013
50.1

31
In the last years, SWFs shied away from the UnitedStates, with their fingers burnt from the big bailoutof Wall Street banks. However, in 2013 they cameback strong, investing $8.2 billion in 29 US targets.At a closer look, with the only exception of QIAinvestment on Bank of America, SWF shied awayfrom finance and invested with a vengeance in onesector, real estate. Indeed, 2013 was the record yearfor American brick-and-mortar, with 14 deals worth$4.8 billion executed mainly by Norway’s GPFGand GIC. With the sole exception of IT company
BMC Software acquired by GIC, in 2013 globalSWFs did not execute a single significant deal withUS manufacturers as targets.
As we noticed above, the geographical reallocationwithin BRICs primarily affected China. Indeed, with-in the Asia Pacific Region, 2013 witnessed a signifi-cant shift of market shares from China in favor ofanother developed country such as Australia andamongst emerging economies such as Indonesia.Chinese data are particularly impressive. Foreign
SWF Investment in 2013
(primarily real estate) is $10 billion, 55 percent ofthe total European investments, against the 36 per-cent reported last year.
France jumped in top position thanks to the trophybrick-and-mortar assets purchases by ADIA andQIA along with stakes acquired in top energy play-ers by GIC and again QIA. London, the usual mag-net of SWF investments in real estate, completed fivelarge scale operations (including a real estate devel-opment project involving the Norway’s GPFG)worth in total $5.4 billion, 81 percent of total SWFinflow in the country.
Singapore’s SWFs Temasek and GIC account for therest, acquiring a stake of around 10 percent inMarkit, the fast-growing UK financial data compa-ny, and Rothesay Life, a large pension insurer. Spainimplemented some structural reforms aimed atincreasing competitiveness, and in terms of attrac-tion of foreign capital, those are starting to pay out.SWF investment in Spanish companies increased sig-nificantly in 2013, thanks to two large investments:the 5 percent stake acquired by Temasek in the oilgroup Repsol makes the Singapore investor thecompany’s fourth-largest shareholder; and theinvestment in the railroad construction companyConstrucciones y Auxiliar de Ferrocarriles by the
30
Norwegian GPFG. For Spain, a confidence vote byhighly respected SWFs is certainly a valuable politi-cal dividend. Italy, a country finally on the radarscreen of foreign institutional investors, gained theattention of SWFs, as they invested $1.5 billion infive sizable deals. Those included the QatarInvestment Authority acquiring a 40% stake in theMilan financial district Porta Nuova and thusboosting one of the most ambitious real estate devel-opment projects in the country, and the bail-out ofPiaggio Aero by Abu Dhabi Mubadala, an acquisi-tion recently cleared by Italian government enjoyinga “golden share” in the company.
In 2013, the other most attractive regions in termsof cross-border investment flows have been Non-Pacific Asia and North America, each reporting atotal deal value more than $8 billion, 17 percent ofthe total foreign investment. The leap forward ofNon Pacific Asia has been quite spectacular thanksprimarily to the keen interest on Russian targets,which raised alone $5.4 billion. SWF investment inRussia in 2013 has some key features: heavilyskewed in favor of the financial and chemical sec-tors, typically executed in partnership with the localsovereign investor or with other SWFs, and stronglyaffected by Chinese acquisitions. Indeed, CIC, pri-marily via its subsidiary Chengdong InvestmentCorporation, was the key player investor in allmajor deals. India sticks out as the other country ofchoice in the region, with 17 operations worth $2.8billion. The Oman Investment Fund via its JV withthe State Bank of India and Temasek have been themost active funds and broadly diversified invest-ments across sectors, aiming to mitigate risks of acountry growing recently at a slower pace.
THE GREAT REALLOCATION
Figure 10: Investment Flows from Middle East & North Africa SWFs 2013
Publicly available data for direct SWF equity & real estate deals, joint ventures and capital injections. Source: Sovereign Investment Lab, Università Bocconi
MENA to Europe19 deals, $10.5bn
Within MENA12 deals, $3.8bn
MENA to Sub-Saharan Africa2 deals, $0.0bn
MENA to Pacific Asia6 deals, $2.2bn
MENA to Non-Pacific Asia13 deals, $3.8bn
MENA to Latin America1 deal, $0.5bn
MENA to North America10 deals, $2.4bn
Western companies have been targets of choice while
investments in BRICs slowed down especially in China

33
SWF investment in the country primarily fromSingapore totaled $620 million, a figure dwarfed bythe 4.6 billion raised in 2012. Conversely, Australiawas the most successful economy of the region inattracting SWFs and the country of choice of ADIA,pouring $1.9 billion in tourist and infrastructureassets. Finally, activity in Indonesia is also notewor-thy, where CIC invested heavily in coal industries, inquest of cheap energy for its manufacturers.
At a more aggregate level, an important dimensionof the geography of cross-border investment by
SWFs is the share of activity in neighbouring coun-tries and region, within a logic of South-Southtrade and financial integration between emergingcountries, as opposed to the share occurring atgreat distance across hemispheres. In 2013, South-South foreign SWF investment flows (i.e. withinMENA, Africa, Asia-Pacific and Latin America)accounted for a total value of $6.9 billion in 47transactions, while South-North for $31.9 billionin 86 deals. These values represent respectively the16 per cent and the 75 per cent of the SWF foreigninvestments in 2013. In 2012, South-South foreign
SWF investment flows accounted for 26 per centwhile South-North for 66 per cent.
Foreign investments represent a qualifying, and forsome alarming, feature of SWFs activity.Nonetheless, sovereign investment is also deployedwithin the national borders to support long-termeconomic development or the domestic economywhen the outlook deteriorates. We already noticedthat 2013 the share domestic investments remainedin the same range of the previous year, with SWFspurchasing domestic assets worth $7.7 billion in 33deals. The bigger spender was QIA, due to the siz-able investment in the Doha InvestmentCorporation, followed by Australian Future Fundand New Zealand Superannuation Fund, heavilyengaged in upgrading infrastructure. The mostactive organization by number of deals is the usualsuspect, CIC’s Central Huijin, propping up with 12equity investments in local big banks and financialinstitutions.
FundsAfter the spectacular records of last year, one couldhardly figure out that QIA’s could gain furtherprominence as direct equity investor amongst SWF.Yet in 2013 QIA not only leads the ranking by dealvalue, but it has also increased its share of totalinvestment from 26 percent to 30 percent, thanks to26 acquisitions worth $14.9 billion.
Momentum changes occurred in Qatar in 2013. InJuly, the Emir Hamad Al Thani left the throne tohis and Sheikha Moza’s 33-year-old son SheikTamim. Ahmad Al-Sayed, who headed Qatar
Holding LLC, was promoted QIA chief executiveofficer, replacing Sheikh Hamad bin Jassim al-Thani (HBJ), who set the style and tone of Qatar’sinvestment drive the former emir’s 18-year reign.Commentators worried that HBJ’s departure couldmean a slowdown in the pace of external invest-ment. However, deals continued to flow regularlyalso in the third and fourth quarter, with the usualpenchant for trophy assets – often, real estate icons– and established brands across sectors. For thetime being, we conclude that the changeover inpower meant more continuity than disruption.Furthermore, by clarifying the lines between politi-cal leaders and the state’s sovereign wealth fund,recent changes could modernize the fund and arm’slength management might be beneficial to its imageas a more professional institution.
Singaporean funds have been extremely activeinvestors in 2013. As in 2012, Temasek and GIClead the ranking by number of deals with 60 acqui-sitions, one third of total volume. GIC, the largestfund by assets, confirms its role of top spenderwith a total direct equity investment of $9.4 bil-lion. The geographical and sector diversification ofboth funds is impressive, and confirming their rep-utation of truly global investors with distinctivemissions: Temasek a strategic investor with largerstakes, GIC a fund aiming at global portfoliodiversification.
ADIA and CIC are the other big spenders in 2013,each reporting direct equity investment above the$5 billion, 10 percent of the total. ADIA displayedits usual appetite for safe assets, primarily realestate and infrastructure, in developed economies,
SWF Investment in 2013
32
THE GREAT REALLOCATION
Figure 11: Investment Flows from Asia-Pacific SWFs 2013
Publicly available data for direct SWF equity & real estate deals, joint ventures and capital injections. Source: Sovereign Investment Lab, Università Bocconi
Asia-Pacific to Europe10 deals, $7.2bn
Asia-Pacific to Sub-Saharan Africa3 deal, $0.2bn
Within Asia-Pacific52 deals, $6.9 bn
Asia-Pacific to Non-Pacific Asia16 deals, $4.1bn
Asia-Pacific to Latin America4 deals, $0.9bn
Asia-Pacific to North America18 deals, $4.0bn
Asia-Pacific to MENA0 deals, $0.0 bn

35
while CIC, under tighter budget constraint, pulledback investments even further, focusing on thedomestic financial sector and foreign targets pro-ducing commodities to fuel cheaply its deceleratingeconomy.
Interestingly, in 2013 a new entry in the top ten listby number of deals is the Oman Investment Fund,which balanced investments at home with sizable
deals in India in order to strengthen commercial tieswith the neighbouring country. By keeping the valueof its assets strictly undisclosed, uncertainty remainsover the effective firepower of this organization.
Finally, we report interesting news from downunder. Australia’s Future Fund and the NewZealand Superannuation Fund have entered our topten list by deal value, with a respectable $3 billionof domestic direct equity investment primarily ininfrastructure to strengthen their potential to grow.
The Great ReallocationEmerging markets have enjoyed breath-takinggrowth over the past two decades by closing theproductivity gap with the more developedeconomies. But, as the gap has narrowed, growthrates have declined – and the slowdown of Chinaand India has led to lower commodity prices. At thesame time, the shale revolution in North Americanenergy markets has put downward pressure – andfuture uncertainty – on the oil and natural gas pricesthat have underpinned much of SWF growth.
This is why in 2013 not only have we observed SWFlower aggregate investments, but allocations havechanged. The same slowdown that led to decliningfund accumulations in developing countries has also
SWF Investment in 2013
34
THE GREAT REALLOCATION
QIA is the usual top spender and Singaporean funds are the most active
Publicly available data for direct SWF equity & real estate deals, joint ventures
and capital injections. Source: Sovereign Investment Lab, Università Bocconi
Figure 12: Value of Direct Investments by Top Spending SWFs, 2013
50.00
40.00
30.00
20.00
10.00
0.00
9.40
5.27
5.17
4.31
3.14
2.081.841.031.011.92
14.90
Other
Kuwait Investment Authority (KIA)
New Zealand SuperannuationFundMubadala Development Company PJSCFuture Fund
Government Pension Fund Global
Temasek Holdings Pte Ltd
China Investment Corporation(CIC)Abu Dhabi Investment Authority(ADIA)Government of SingaporeInvestment Corporation (GIC)Qatar Investment Authority (QIA)
Table 3: Direct SWF Investments of over $1 billion, 2013
Publicly available data for direct SWF equity & real estate deals, joint ventures and capital injections. Source: Sovereign Investment Lab, Università Bocconi
Fund Target Target Sector Deal Size Country
Name Country (Value US$ Billion)
Qatar Investment Authority (QIA) Doha Global Investment Qatar Banking, Insurance, Trading 3.00
Government of Singapore
Investment Corporation (GIC) Broadgate Estates Ltd UK Real Estate 2.78
China Investment Corporation (CIC) OAO Uralkaliy Russia Chemicals 2.14
Qatar Investment Authority (QIA) Total SA France Petroleum & Natural Gas 2.14
Future Fund Australian Infrastructure Fund (AIX) -
Australian Infrastructure Assets Australia Transportation 2.08
Qatar Investment Authority (QIA) France Printemps SA France Retail 2.08
Government of Singapore
Investment Corporation (GIC) BMC Software Inc USA Personal & Business Services 1.68
Government of Singapore
Investment Corporation (GIC) Grand Wailea Resort Hotel USA Restaurants, Hotels, Motels 1.50
Temasek Holdings Pte Ltd Repsol SA Spain Petroleum & Natural Gas 1.35
China Investment Corporation (CIC) Bumi Resources Tbk Indonesia Coal 1.30
Qatar Investment Authority (QIA) Bharti Airtel Ltd India Communications 1.26
Qatar Investment Authority (QIA) Louvre Hotels France Restaurants, Hotels, Motels 1.10
Government of Singapore
Investment Corporation (GIC) TIGF France Infrastructure & Utilities 1.09
Qatar Investment Authority (QIA) Porta Nuova Srl Italy Real Estate 1.05
Qatar Investment Authority (QIA) Bank of America Corporation USA Banking, Insurance, Trading 1.00
Mubadala Development
Company PJSC RDIF-Mubadala Co-Investment Fund Russia Banking, Insurance, Trading 1.00

led to the same markets being less appealing invest-ment targets. We call this process the GreatReallocation, with implications across geographiesand sectors.
The biggest beneficiaries of this reallocation havebeen developed economies, primarily Europe, andthe United States, and Australia. Within thisregion, SWF selectively slowed down investment inmanufactures indirectly exposed to emerging mar-ket growth, and focused on real estate especiallycommercial properties in Europe, and safe assets asinfrastructure. But the real surprise is a newemphasis on lodging, with, first and foremost,Qatar, but also Brunei, Abu Dhabi and Singaporeacquiring hotel chains and trophy properties.Amongst BRICs, Russia remained on the radarscreen only thanks to the strong capital injectionsfrom Chinese funds.
The easiest trend to forecast is that, despite theslowdown in the accumulation of central bank andSWF reserves we have discussed, SWFs are likely tokeep growing, even if at a somehow slower pacethan over the recent past. In a world of increasingeconomic uncertainty and market volatility, all elseis difficult to forecast, but, as SWFs continue inter-nalizing wealth management, the recent trend ofco-investments and partnerships is likely to expand.QIA’s leading role within the Doha GlobalInvestment Company heralds a new evolution inthis trend – that of a SWF being not just a partnerof other, private-sector, investors, but a leader andcatalyst. We expect SWFs in the future to increas-ingly leverage their investment power by creatingsuch investment partnerships and we wonder how
36
long will it be before SWFs, just like their private-sector counterparties, start doing so the old-fash-ioned way, by large-scale debt issues. The trend hasalready begun – Singapore’s Temasek has issuedbonds to institutional investors since 2005 andMalaysia and Abu Dhabi have experimented withbond issues linked to their SWFs – but, in a worldfacing challengingly low yields, we suspect thistrend might intensify.
THE GREAT REALLOCATION
37
The growing share of funds that is internally man-aged is also leading to increased control and SWFsare more frequently taking an assertive role in thefirms in which they invest. In many ways, internalmanagement, increased assertiveness, and betterdiversification are all manifestation of the sameprocess of evolution of these funds. To a largeextent, prior to the 2008 financial crisis, SWFswere happy to outsource fund management and toconcentrate their direct investments into Westernfinancial companies. Their passive stance – alongwith their love for the North American financialsector – are both casualties of the 2008-2009 cri-sis. SWFs are maturing in both capabilities andexpectations – yet, for active investments tobecome a reality, their staffing levels will have toincrease.
SWFs will keep seeking diversification, away fromgovernment bonds – especially away from USTreasuries – and into private markets and alterna-tive asset classes. Over the recent years, we haveseen private equity funds increasing their allocationsto the syndicated loans market and we suspect thatSWFs might follow suit, filling the gap that Westernbanks, hobbled by increasingly stringent capitalrequirements, are leaving and that is increasinglybeing filled by non-traditional lenders. Whether SWF investments in Europe will continuein the future to retain the lion’s share of SWF assetallocations depends, largely, on the performance ofEuropean economies – and there is a large degree ofuncertainty in that. Our bet is that safe assets indeveloped economies will remain the targets ofchoice in 2014.
The landscape of sovereign investment is changingrapidly. We are seeing several developing countries,primarily from Africa, launching organizationswhich could graduate soon into fully-fledge SWFs.Whether they will grow up in size and respect, it istoo soon to tell. Sure, we will keep track.
SWF Investment in 2013
Publicly available data for direct SWF equity & real estate deals, joint ventures
and capital injections. Source: Sovereign Investment Lab, Università Bocconi
Figure 13: Number of Direct Investments by Top Spending SWFs, 2013
180
160
140
120
100
80
60
40
20
0
31
29
26
26
14
8766
22
Other
New Zealand SuperannuationFundMubadala Development CompanyPJSCOman Investment Fund
Government Pension Fund Global
Abu Dhabi Investment Authority(ADIA)Qatar Investment Authority (QIA)
China Investment Corporation(CIC)Government of SingaporeInvestment Corporation (GIC)Temasek Holdings Pte Ltd

for an identical 3% interest in an Australian compa-ny. Likewise, Italy may view an investment from theAlberta Heritage Fund as qualitatively different froman investment by the Russian National Wealth Fund,even though the same Italian regulatory frameworkmay be used to analyze each investment. That SWFsare quite different and that they operate in very dif-ferent political contexts is well known to asset man-agers, most SWF researchers, and of course, SWFofficials, but these important distinctions are oftenlost when SWF activity is reported in the press andeven in some academic literature.
The second problem, which has received less atten-tion, is one of equivocation on important terms incorporate governance, and particularly equivoca-tion on the term “activism”. Understanding the dif-ferent forms of shareholder activism that occurtoday gives insight into how sovereign investors canengage in corporate governance while minimizingthe risk of adverse regulation by host countries.
Types of ActivismActivism is linked to the increasing importance ofcorporate governance, a phrase that itself “onlycame into vogue in the 1970s in a single country—the United States—[and] became within 25 yearsthe subject of debate worldwide by academics,regulators, executives and investors”.2 Even as
Articles
Paul Rose Ohio State University
IntroductionAs the number of, and assets controlled by, sovereignwealth funds (SWFs) has increased dramatically inrecent years, so too has scrutiny about how SWFs aremaking use of these assets. With respect to equityinvestments in publicly traded firms, one facet of thisconcern is that SWFs will become “activist” share-holders. Notwithstanding genuine concerns abouthow governments exercise political power througheconomic entities, two threshold issues must beaddressed before one can develop and evaluate prop-er policy responses to sovereign shareholder activism.
First, SWFs are often viewed through a single para-digm when, in reality, SWFs differ along many dimen-sions, including the way in which they are organized,their legal status, and their stated policies.1 Even ifone sets aside differences in internal governance andlegal status, each SWF operates in unique politicalenvironments, and geopolitical realities affect theiruse and the ways in which they are viewed by othercountries. For instance, Australia may view an invest-ment by China’s CIC as very different from an invest-ment by Norway’s GPF-G, even if the investment is
39
Sovereign Shareholder Activism: How SWFs Can Engage in Corporate Governance
1 Capapé, Javier and Guerrero Blanco, Tomas, “More Layers than an Onion:
Looking for a Definition of Sovereign Wealth Funds” (June 1, 2013).
SovereigNET Research Papers; ESADE Business School Research Paper No. 21.
Available at SSRN: http://ssrn.com/abstract=2391165 or
http://dx.doi.org/10.2139/ssrn.2391165.

4140
ability” activism that is most commonly associatedwith large public pension funds and even some sover-eign wealth funds. Norway’s NBIM, which managesthe Government Pension Fund – Global, providesperhaps the best example of this sort of activismamong SWFs. In 2013, for example, NBIM submittedthree shareholder proposals requesting access to thecorporate proxy, which would enable a shareholderthat has held 1% of the company’s outstanding com-mon stock for one year to nominate one director forthe company’s board of directors.
Moving Beyond the Passivity ParadigmIn contrast to these two types of activist sharehold-ers, most shareholders are largely passive. They maychoose not to exercise their shareholder rights at all,or simply to follow any management proposal.Many SWFs fit in this category. This passivity isattributable to the fact that SWFs tend to be whatBortolotti et al. have termed “Constrained ForeignState Investors” that “will refrain from taking anactive corporate governance role in target compa-nies in order not to generate political opposition ora regulatory backlash.”3 Even efforts to influence (asopposed to control) companies may result in dra-matic regulatory consequences. For example, a SWFthat pressures a poorly-performing CEO to stepdown could subject its investment in the company toreview and even divestment under U.S. law.
And yet, a consensus appears to be developing thatlarge institutional investors, including SWFs,should be aware of corporate governance issues attheir portfolio companies, even if they choose notto actively attempt to influence management.
Because they are long-term investors and oftenunder political and regulatory scrutiny that makesthem less likely to sell, SWF capital tends to be cap-tive capital. Thus, protecting long-term returns bymonitoring governance is a priority for many sov-ereign investors.4 The difficulty for most SWFs,then, is how to hold mangers accountable withoutselling or directly engaging in ways that would con-cern regulators.
Fortunately for SWFs, the market for corporateinfluence in many countries has become sufficientlyrobust that portfolio companies with poor gover-nance tend to be targeted early by activist investors;in other words, SWFs typically need not worryabout initiating governance engagement, at leastwith firms that have significant institutional investorownership. Hedge funds and, not infrequently, pen-sion funds may be already pressuring a poorly-per-forming corporate management. Because SWFs areoften large but passive blockholders, they can exertsignificant influence simply through the exercise oftheir voting rights.
While this kind of corporate governance engage-ment may seem like governance free-riding, it is
ing how sovereigns could (and perhaps should)engage in corporate governance. As Cheffins andArmour have recently noted, hedge funds tend toengage in what they term “offensive” shareholderactivism. Offensive activism is typically event-driv-en: the offensive activist agitates for change at thecompany, seeking to squeeze out value that, in theview of the activist, may be locked up in a subsidiaryor in cash reserves. Under what has become a tradi-tional strategy, the activist may seek to force thecompany to (among other things) spin off a sub-sidiary or pay a special dividend.
An important feature of successful offensive activistcampaigns has been the ability of the hedge fund toconvince other shareholders, including relativelymore passive shareholders such as mutual funds,pension funds and other large institutionalinvestors, to support the hedge fund. Often, thehedge fund will seek approval of the strategy byproxy advisors, who can help influence large institu-tions. Supporting hedge funds does not make theother investors “activists”—they were not the onesinstigating the change, after all—but simply meansthat the offensive activists’ value-creation story wasconvincing to other shareholders.
In contrast to the offensive activism of hedge funds,some large institutional investors are engaged in“defensive” activism. The defensive activist monitorsthe firm not to seek ways to force value-creatingchanges, but to prevent losses from mismanagement.In other words, whereas offensive activism isdesigned to produce wealth in the short to mediumterm, defensive activism is designed to protect wealthin the long term. It is this type of defensive, “account-
THE GREAT REALLOCATION Articles
recently as the 1990s, institutional investors spentrelatively little on corporate governance matters,and the most prominent activist investors were“gadfly” individual investors that took stakes incompanies in order to agitate for governance—and frequently, social—changes at publicly tradedcompanies. Corporate governance has taken onincreased importance for institutional investorsfor a variety of reasons, including enhanced focuson governance issues by regulators, as well as therise of the corporate governance industry andproxy advisory services such as InstitutionalShareholder Services. More recently, hedge fundshave become important activist investors by push-ing for governance and tactical changes at compa-nies around the world.
The types of activism engaged in by hedge funds andmost other institutional investors, such as publicpension funds, differ in important ways. These dif-ferences are important to highlight when consider-
Articles
3 Bortolotti, Fotak, Megginson and Miracky, “Quiet Leviathans: Sovereign Wealth
Fund Investment, Passivity, and the Value of the Firm”, FEEM Note di Lavoro
22.2009. Available at http://www.baffi.unibocconi.it/wps/allegatiCTP/SWF-
paper-RFS-Final-oct25_2010.pdf.
4 I note, however, that there is mixed evidence that active influence by institutional
investors results in stronger performance, and no evidence that influence by
public investors results in stronger performance. However, I am not advocating
influence through defensive activism, but merely engagement through normal
governance mechanisms, including shareholder voting.
2 Cheffins, Brian R., “The History of Corporate Governance” (December 1, 2011).
OXFORD HANDBOOK OF CORPORATE GOVERNANCE, Mike Wright, Donald
Siegel, Kevin Keasey and Igor Filatotchev, eds., Oxford University Press, 2013;
University of Cambridge Faculty of Law Research Paper No. 54/2011; ECGI -
Law Working Paper No. 184/2012. Available at SSRN:
http://ssrn.com/abstract=1975404 or http://dx.doi.org/10.2139/ssrn.1975404.
SWF may shift from passive to active shareholders to protect
long-term returns by monitoring governance

43
more accurate to think of it as riding on a reducedfare; the SWF will incur some costs in developingrobust policies and procedures for the exercise ofvoting rights. The effort is essential, however,because if SWFs fail to exercise their rights as share-holders they risk creating a monitoring deficit thathas the perverse effect of entrenching poor man-agers.5 This risk is increasingly relevant as SWFstake larger minority positions.
SWF should be as transparent as possible about howthey intend to use corporate governance rights. Forexample, a SWF may believe, as NBIM does, thatcompanies should apply the principle of one share,one vote, so that a shareholder’s voting rights anddividend payments reflect the size of his or hershareholding.6 Publishing such governance and vot-ing policies, on the Internet and in annual reports,provides an important signaling effect to companiesand other shareholders. It also provides a strong sig-nal to the sponsor sovereign and its citizens of thequality of governance at the SWF itself. Moreover,so long as the SWF merely exercises its voting rightsand does not directly try to influence the company,it is unlikely to run afoul of host country regula-tions. As the Santiago Principles make clear inGAPP 21, transparency with respect to the exercise
42
of corporate governance rights helps to “dispel con-cerns about potential noneconomic or nonfinancialobjectives.”
Many SWFs will not choose to engage portfoliocompanies as Norway has (and indeed, the politicalreality is that many SWFs would invite unwelcomeregulatory scrutiny if they did so). But all SWFs canand should develop a stated policy on corporategovernance issues, even if the SWF believes that it,like most mutual fund companies, will generallysupport management.
THE GREAT REALLOCATION ArticlesArticles
5 This hypothesis finds support in Bortolotti, Bernardo, Fotak, Veljko and
Megginson, William L., “The Sovereign Wealth Fund Discount: Evidence from
Public Equity Investments” (September 17, 2013). Baffi Center Research Paper
No. 2013-140; FEEM Working Paper No. 22.2009. Available at SSRN:
http://ssrn.com/abstract=2322745 or http://dx.doi.org/10.2139/ssrn.2322745.
6 Norges Bank Investment Management, Equal Treatment of Shareholders
(accessed May 2014). Available at http://www.nbim.no/en/responsibility/
responisble-investments/equal-treatment-of-shareholders/.
Michael Papaioannou and Bayasgalan Rentsendorj International Monetary Fund
Introduction. The Markowitz portfolio theory hasbeen used during the past six decades by variousinstitutional investors, including sovereign wealthfunds (SWFs), to determine their asset allocations.Our analysis of the strategic asset allocation of theworld’s largest sovereign wealth fund –The NorwayGovernment Pension Fund Global (GPFG), demon-strates that it is broadly consistent with that gener-ated by a simple one-period Markowitz model. Thisinvestment performance critically depends on thefund’s permissible asset classes, risk tolerance, andstrategies in attaining the set portfolio objectives,such as stability of returns over an assumed timehorizon. Further, appropriate asset weight rebal-ancing allows for higher returns and achievementof long-term investment objectives. The obtainedresults for the GPFG need to be contrasted withthat of other sovereign wealth funds to establishwhether there is a broader conformity with invest-ment allocations proposed by the Markowitzmodel.
Asset management often faces challenges withregards to the risk-return characteristics of assetclasses. This is particularly important for SWFsthat are owned by governments and are mandatedto a certain performance, based on set bench-marks. This challenge has been more pronouncedduring the last few years, especially after the recentglobal financial crisis and current low-return envi-
ronment. In this connection, our investigationshows that the GPFG successfully rode out therecent financial crisis and grew stronger throughsuccessive portfolio rebalancing actions. For exam-ple, the GPFG had progressively taken advantageof investment opportunities of mispriced equityassets, realizing that active management does notcontradict the modern efficient market hypothesis.This helped achieve historic returns of 25.6% in2009, with the equities portion having beenincreased to 62.4% in the total portfolio from lessthan 41% in 2006 (GPFG Annual Report, 2009).This countercyclical investment behavior, whichled to the increase of volatile (yet high potential-return) assets when other long-term institutionalinvestors tried to contain the equity risk, requiredstrong independent institutional and governanceframeworks, which the GPFG had been able toestablish before the financial crisis. This behavioralso helped avoid pro-cyclical investment SWF“herding” phenomena, where asset allocationsmove in tandem with market fluctuations, as wasthe case for many institutional investors thatincreased their fixed-income share rather than theequity share in their portfolios during 2008 and2009 (Papaioannou, et al., 2013).
Sovereign Wealth Fund Investment Performance: Some Stylized Strategic Asset Allocation Results1
1 The views expressed in this note are those of the authors and should not be
attributed to the IMF, its Executive Board, or its Management. Authors’ e-mail
addresses: [email protected], [email protected]

45
Asset allocation decisions require in depth macro-financial analysis. As a long-term investor, the GPFG’sfocus on systematic risk, while allowing flexibility fora given market opportunity with substantial adjust-ment room, improved its overall risk-adjusted return.An example of this approach was the GPFG’s decisionto enter the global real estate market in 2011, rightbefore the international real estate surge in 2012.Since 2009, asset allocations of many SWFs manifesta significantly increased share in equities over time,while their fixed-income share is steadily reduced(Bodie and Briere, 2013). This has taken place againstthe background of the current prolonged low-returnfinancial environment. In particular, the GPFG’s long-term portfolio composition has been rebalanced, withits risk appetite being increased. The share of fixed-income in the composition of the GPFG’s portfolio hasgradually been reduced to 37% of the total portfolio
in 2014, from 59% in 2006, while the global equityshare was substantially increased to more than 62%of the total portfolio in 2014, from 41% in 2006. Theincrease in the equity share in its portfolio, with anincreased mean variance for the overall portfolio, didnot alter the theoretical return and position on the effi-cient frontier. As countries’ contributions to globalGDP evolve over time, the GPFG’s portfolio adaptedto this trend and increased its emerging markets’share, with careful consideration on its historicallyhigh level of risk. The extent of correlation and possi-ble causality in the GPFG’s portfolio investments, inresponse to increasing market volatility, needs to beexamined further.
A stylized efficient frontier The efficient frontier, the set of optimal portfolio
compositions with highest perceived return and low-est risk level, of long-term investors may be tested bymarket volatility. For the GPFG, the dynamics ofglobal economic integration and various marketshocks have challenged its optimal asset allocation,especially with regards to investing in line with theefficient frontier allocations of other long-term insti-tutional investors. Despite these challenges, theGPFG’s efficient frontier has demonstrated a broadconformity with asset allocations being generated bya simple one-period Markowitz model. Further, theflexibility in the GPFG’s asset allocation allows high-er yield results and generates optimal outcomes (seeFigure 3). The GPFG’s case has illustrated that coun-tercyclical portfolio rebalancing has played an impor-tant role in accomplishing the set portfolio objectives,e.g., stability of risk-adjusted return over time.Examples of countercyclical asset allocation, e.g.,
increased share of high-volatility assets with conse-quent reduced share of less volatile fixed-incomeassets during periods of market crisis have beenobserved over time (see Figure 1). Illustrative calcula-tions indicate that, given a return level, risk can bereduced by 0.3% if the equity share is reduced by5.9%, while the fixed-income share is increased by2.0% and the real estate portion is reduced to almostzero in the overall portfolio. These results, of course,depend on the used sample period (1998-2013).
The GPFG’s actual investment portfolio, which isbroadly consistent with the one-period Markowitz-generated efficient frontier, takes into accountsocial, ethical, and environmental considerations.The investment universe and permissible asset class-es are scrutinized by Norway’s parliament. The fundis the signatory of the United Nation’s Principles of
44
THE GREAT REALLOCATION Articles
Source: Annual and Quarterly Reports, GPFG, Norges Bank Investment Management
Figure 1: Total Assets and Asset Allocation of GPFG (% of Total Portfolio)
70%
60%
50%
40%
30%
20%
10%
0%
5.000
4.500
4.000
3.500
3.000
2.500
2.000
1.500
1.000
500
0
1/1/
2011
7/1/
2011
1/1/
2012
7/1/
2012
1/1/
2013
7/1/
2013
1/1/
2014
7/1/
2014
1/1/
2015
7/1/
2015
1/1/
2016
7/1/
2016
1/1/
2017
7/1/
2017
Total Portfolio (Right)
Equity
Fixed income
Real estate
Source: Annual and Quarterly Reports, GPFG, Norges Bank Investment Management
Figure 2: Portfolio and Individual Asset Class Returns of GPFG (%)
25,0
20,0
15,0
10,0
5,0
-
(5,0)
(10,0)
(15,0)
(20,0)
12/1
/200
6
6/1/
2007
12/1
/200
7
6/1/
2008
12/1
/200
8
6/1/
2009
12/1
/200
9
6/1/
2010
12/1
/201
0
6/1/
2011
12/1
/201
1
6/1/
2012
12/1
/201
2
6/1/
2013
Equity
Fixed income
Real estate
Portfolio Return

47
asset classes, selection of benchmarks, determinationof risk tolerance levels on different asset classes, per-formance measurements, application of accountingstandards, accepted rating(s) for investment instru-ments, and related market predictions. In the case ofthe GPFG, the Ministry of Finance ultimately sets thebenchmark indexes for investment portfolio compo-sitions and global mandates, considering marketweights (GDP weights). The GPFG benchmarkindexes are quite open to changes, so as to supportan active asset management framework that ensureshigher returns over time.
The adoption of a comprehensive framework fortimely portfolio rebalancing is another challenge inmanaging a diversified global portfolio. TheGPFG’s performance illustrates the possibility ofenhancing overall returns with a lower risk level,through rebalancing of asset classes that is in linewith market trends. This adjustment involvesdynamic asset allocations that allow funds to rebal-ance in line with their strategic policy/benchmarktarget compositions. The timing and frequency ofasset weight changes, especially in response tointense market volatility, require a strong institu-tional development and risk management frame-work, along with close monitoring of market devel-opments. For the GPFG, the changes in asset allo-cation to increase the equity composition over timepaid off significantly in recent years, yielding high-er returns. In particular, in 2013, the investmentportfolio provided an exceptional performance of15.9 %, following actions that deviated from thebenchmark index, mostly driven by the equityinvestments in North America and European equi-ties (GPFG Annual Report, 2013).
Despite its long-term investment horizon, the GPFGappears to be resilient to market volatility, based ona VaR analysis (GPFG Report to the Storting, 2014).As the recent global financial crisis has showed, it isnot possible to fully assess ex ante the market riskfrom emerging external shocks, which can thenbecome a major challenge in the investment rebal-ancing process. In this regard, the GPFG’s broaddiversification approach (i.e., global GDP-weighteddiversification) is justified, especially in view of thesize of the fund. Although our analysis indicates thatthe GPFG’s current asset allocation is broadly con-sistent with that of the Markowitz approach, it alsohighlights that there is room to reduce risk by cur-tailing the equities share, even though past experi-ence has shown that the GPFG is able to effectivelyabsorb market risk.
Sovereign wealth funds’ asset allocations need to befrequently reassessed. Especially a low-return envi-ronment may significantly affect a fund’s portfoliocomposition and return on assets. The GPFG’s port-folio composition indicates continuous adaptationsin the dynamics of its strategic asset allocation,while its efficient frontier illustrates the constraintsin its effective portfolio diversification from lowreturns of employed fixed-income assets. Also, itshould be noted that restrictions in the investment
Articles
Responsible Investment (PRI), which advocate morerelevance on environmental, social and corporategovernance issues than on pure returns in invest-ment practices. Accordingly, the GPFG has a verystrong Council of Ethics that frequently reviews thefund’s global investments with respect to an adopt-ed ethical guideline framework, without regards toyield implications. In particular, it reviews whethercompanies in GPFG’s investment portfolio are with-in the framework of socially responsible, humanitar-ian, ethical, and environmentally friendly standards.Thus, the total number of companies excluded fromthe allowed investment portfolio reached 48 in2009, 51 in 2010, and 55 in 2011 (GPFG Councilon Ethics Report, 2011). The rationale for responsi-ble investments is based on the premise that: “…organizations that manage environmental, socialand governance (ESG) factors effectively are more
46
likely to endure and create more value over the long-term than those which do not” (GPFG StrategyCouncil Report, 2013). Examples of companies thatare excluded from the GPFG’s investment portfolioare: all tobacco producers, due to human healthconcerns, Barrick Gold Corp. and Rio Tinto, due toalleged environment damages, and Boeing Co. andNorthrom Grummanm Corp., due to their produc-tion of arms. While the GPFG has been consistentlyadhering to its ethical and transparent investmentprinciples, its investment activities have not preclud-ed it from generating long-term returns well withinits set objectives (Clark and Monk, 2010).
Challenges in a SAA OptimizationThere are several challenges in carrying out an SAAoptimization, including the decision on admissible
THE GREAT REALLOCATION
Publicly available data for direct SWF equity & real estate deals, joint ventures and capital injections. Source: Sovereign Investment Lab, Università Bocconi
0,6
0,4
0,2
0
Frontier
Target
Benchmark
Current
Equity only
Fixed income only
Real estate only
0 1STANDARD DEVIATION %
EX
PE
CTE
D R
ETU
RN
%
2 3 4
Figure 3: Efficient frontier of Norway Government Pension Fund Global
The strategic allocation of GPFG is broadly consistent with that generated by theoretical models

48
THE GREAT REALLOCATION
49
Massimiliano Castelli UBS Global Asset Management
Historically the key provider of long-term financinghas been the banking sector. Debt financing has his-torically accounted for 70 to 90 per cent of initialproject funding, with the equity component beingprovided by either the public or the private sector.According to data provided by the World EconomicForum,1 from 1999 to 2009 commercial banks pro-vided an estimated 90 per cent of all private debt withlarge banks in developed economies acting as a majorsource of financing to emerging markets as well.
Due to both cyclical factors (in particular the ongo-ing deleveraging in Europe) and structural factors(capital charges making long-term capital commit-ment by financial institutions more expensive), thebanking sector has substantially reduced the amountof project finance it provides for long-term invest-ing. Globally, project finance loans fell by between10 and 30 per cent in 2012 alone and the reducedavailability of debt has also reduced the equity pro-vided by private investors or governments.
The reduced lending by the banking sector haswidened the long-term investment gap, which isnow estimated at about USD 1.5 trillion globally.2
Who could realistically fill this funding gap over thenext decades?
Institutional investors, including pension funds,insurance funds and sovereign wealth funds,
appear to be the ideal candidates to fill the gap.Their asset base is growing at a good pace, theirinvestment horizon is typically long-term driven bythe long-term nature of their liability structure andover the last few years there has been a significantshift in their investments towards alternative assetclasses to capture the liquidity premium and boostreturns.
Indeed, according to estimates from the WorldEconomic Forum, in 2012 institutional investorsprovided about 20 per cent of all project financelending with insurers accounting for 7 per cent andpension funds for 3 per cent. However, several fac-tors make it very unlikely that insurance funds andpension funds can substantially raise their alloca-tions to long-term investing. Insurance funds arebeing impacted by new regulations such asSolvency II capital charges in Europe which dis-courage long-term investing. For instance, accord-ing to these regulations, a 25 year A-rated bond(very common in infrastructure investing) would becharged at 18 per cent; a 5 year A-rated bondwould be charged at 7 per cent. It is not surprisingthat, given the ongoing regulatory changes, the G20
Articles
Long Term For Real: SWF's Growing Investments in Infrastructure
ReferencesBodie Zvi and Marie Briere, 2013, Sovereign Wealthand Risk Management: A Framework for OptimalAsset Allocation of Sovereign Wealth Optimal AssetAllocation for Sovereign Wealth Funds, available via:http://papers.ssrn.com/sol3/papers.cfm?abstract_id=1460692.Clark, L. Gordon and Ashby H. B. Monk, 2010,The Norwegian government pension fund: Ethicsover efficiency, Rotman International Journal ofPension Management, 3(1): 14-19.Norway Government Pension Fund Global, 2006-2013, Annual Reports, Norges Bank InvestmentManagement, Available via: www.nbim.no.Norway Government Pension Fund Global, 2011,Council on Ethics for the Government PensionFund Global, Annual Report, available via:http://www.regjeringen.no/pages/1957930/Annual_Report_2011.pdf. Norway Government Pension Fund Global, 2013,Responsible Investment and the NorwegianGovernment Pension Fund Global, Main Report byStrategy Council, available via: http://www.regjerin-gen.no/pages/38525979/sc_mainrreport.pdf.Norway Government Pension Fund Global, 2014,Recommendations of the Ministry of Finance of April 4, 2014, approved by the Councilof State, The Management of the GovernmentPension Fund in 2013, Report No. 19 to theStorting (white paper), 2013-2014.Papaioannou, Michael, Joonkyu Park, JukkaPihlman, and Han van der Hoorn, 2013, ProcyclicalBehavior of Institutional Investors During theRecent Financial Crisis:Causes, Impacts, andChallenges, IMF Working Paper, 13/193.
mandate to allocate a certain portion of the portfo-lio to specific assets, e.g., public investments, servic-es, or energy and infrastructure projects, mayimpose a significant constraint to the efficient fron-tier. In turn, the risk tolerance level, risk-adjustedreturns and portfolio rebalancing may need to beappropriately modified, while frequent stress testingshould be used to improve the optimal strategicasset allocation. In general, funds should rebalancetheir portfolios as needed, especially followingchanges in the global macroeconomic and marketconditions, and assess their performance regularly.
Concluding remarksOur study shows that (i) the strategic asset allocationof GPFG broadly conforms with a Markowitz effi-cient frontier, (ii) a countercyclical active asset man-agement framework or flexibility of benchmark devi-ations works perfectly in case of a large SWF thataims to enhance long-term returns over time, and(iii) socially responsible investments have not appar-ently distorted the asset allocation returns and effi-cient frontier over time. It should also be pointed outthat the GPFG’s long-term strategy has been support-ed by transparent governance and operational man-agement that advocates long-term investment behav-ior, even during periods of global financial crisis.
Similar analyses of the investment portfolios ofother SWFs could be undertaken to examinewhether there are commonalities in their investmentbehavior with that of the GPFG. If such patterncould be established, we could argue for a broaderconformity of SWFs’ investment allocations withthose proposed by the Markowitz theory.
1 World Economic Forum, Infrastructure Investment Policy Blueprint, February
2014.
2 Swiss Re, Institute of International Finance, Infrastructure Investing. It Matters,
2014.

51
leading SWF, has recently announced that it willinvest in the Brazilian sewage sector by injectingequity into a local utility company.4
What is remarkable about this Brazilian deal, andmany other similar deals, is that SWFs often co-invest together with Multilateral DevelopmentBanks, leveraging the sector expertise and knowl-edge of the recipient countries of these institutions.For instance, the Japan Government PensionInvestment Fund has recently formed a partnershipwith Development Bank of Japan and the OntarioMunicipal Employees Retirement System to jointlyinvest up to USD 3 billion (about 0.2 per cent of itsasset base) into infrastructure projects.5 And thismonth the African Development Bank announcedthe setting up of a USD 3 billion infrastructure fundwith funds raised from regional and non-Africanpension funds, insurance companies and SovereignWealth Funds.6
All these initiatives can make a difference byincreasing the fire power of the multilateral develop-ment funds in a time when governments do notappear to have the appetite for providing them withadditional funding.
Another fundamental driver of the rising interestfrom Sovereign Wealth Funds in investing more inthe infrastructure sector is the ongoing shift in theirasset allocation towards so-called real assets.Despite the increasing diversification across assetclasses, SWFs (in particular so-called stabilizationfunds) have a large allocation to fixed income assets,in particular government bonds denominated in cur-rencies of advanced economies.
As a result of the ultra-loose monetary policies inthese economies, these assets currently provide avery low yield in nominal terms and zero or evennegative returns in real terms. Furthermore, giventhe long-term fiscal challenges faced by mostWestern economies, these reserves are exposed to anincreasing sovereign risk should any Westerneconomies default on their public debt or debasetheir currency in the years to come.
Over the last few years, the shift towards realassets has been very visible in the real estate sectorwhere the flow of investments by SWFs has beenvery large, reflecting the fact that this asset class isvery accessible and very bankable. However, simi-lar to real estate, infrastructure assets are also avery good fixed income diversifier as they providesteady higher cash flows thus making them attrac-tive for more income-oriented investors.Furthermore, infrastructure assets often provide agood hedge against inflation over the medium-tolong-term.
Are Western economies taking advantage ofSovereign Wealth Funds’ growing demand for infra-structure assets? While we are witnessing the previ-ously mentioned growing flow of sovereign assets inthis space, there is no doubt that, given the existinglong-term investment gap, the potential is certainlylarger.
Articles
has recently asked the Financial Stability Board toassess the impact of new capital standards on thesupply of long-term capital.
Within the pension fund sector, the shift fromdefined benefit schemes to defined contributionschemes is discouraging long-term investing as thelatter are often restricted from illiquid investmentssuch as infrastructure lending. Furthermore, thedemographics in a number of advanced economiesare pushing many defined benefit schemes to lockin the recent gains in equity prices by aggressivelyshifting their asset allocation towards fixedincome assets such as government and corporatebonds.
Within the institutional investor universe, SovereignWealth Funds and public pension funds appear to bethe ideal candidates to contribute to filling the gapin long-term investing.
While diverse in terms of their investment mandateand organizational set up, sovereign institutionsshare two important features: first, directly or indi-rectly they are government funded entities and assuch their mandate often goes beyond returns toinclude strategic objectives such as enhancing invest-ments and promoting growth. Secondly, by beingmandated to preserve the wealth of the nation they
50
generally have a relatively conservative asset alloca-tion with a large exposure to government bonds ofadvanced economies.
Indeed, in the aftermath of the financial crisis wehave already witnessed an evolution of these institu-tions in this direction. For instance, most of therecently established Sovereign Wealth Funds, inaddition to having the traditional macroeconomicand long-term saving mandates, are often alsotasked with enhancing domestic developmentthrough the funding of long-term investments oftenin cooperation with other investors.
This trend is particularly visible in the African con-tinent where the infrastructure funding gap is esti-mated at about USD 50 billion per year and theenhancement of basic infrastructure is a must tomaintain recent strong economic growth of theseeconomies. Some of the recently establishedSovereign Wealth Funds have an explicit mandate toincrease the flow of investment to the infrastructuresector by either providing funding or by acting as acatalyst for other investors.
Some of the most established SWFs, with sufficient-ly strong in-house capabilities to deal with complexinvestments such as infrastructure, have also beenvery active. For instance, last year the KuwaitInvestment Authority announced that it is seeking toinvest up to USD 5 billion in infrastructure assetsmostly in the UK, echoing a similar move by theSovereign Wealth Fund from Qatar.3
And SWFs are not afraid of investing in infrastruc-ture in emerging markets. Singapore’s GIC, another
THE GREAT REALLOCATION
3 Infrastructure: Asset class gains more appeal, Financial Times, July 7, 2013.
4 Singapore SWF invest in Brazilian sewage, Financial Times, October 2, 2013.
5 GPIF joins DBJ, OMERS to invest up to USD 2.7bn in infrastructure, Asian
Venture Capital Journal, March 3 2014.
6 Africa set to gain USD 3bn in infrastructure fund, Financial Times, May 1, 2014
SWFs and public pension funds are ideally placed to fill the gap
in infrastructure investment

The good news is that long-term investing is nowhigh on the agenda of the G20, and a number ofinstitutions including the OECD, the EuropeanCommission, the World Bank and the IMF havestarted consultations with stakeholders to promotelong-term investing. In Europe, the EuropeanCommission and the European Investment Bankhave launched the “2020 Project Bond Initiative”with the goal of creating a more harmonized projectbond market across Europe. At international level,the G20 and OECD have recently finalized their“High Level Principles of Long-Term Investing”.Last but not least, emerging markets have alsolaunched new initiatives with the most prominentone being the BRICs led Development Bank.
As the competition to attract funds from SovereignWealth Funds and other long-term investors willintensify in the future, individual countries shouldbe encouraged to take two policy actions: enhancethe regulatory framework surrounding infrastruc-ture projects and better communicate their existingbankable projects to attract the interest of SWFs andother institutional investors.
52
THE GREAT REALLOCATION

55
In this section, we attempt to present the most inter-esting studies pertaining SWFs that have been pub-lished (or that have made public) in 2013. Ourselection is by design limited, with the goal of iden-tifying a roadmap to the most debated topics andthe most influential works.
Much of the research about SWFs published thisyear pertains the allocation of funds and investmentselection, which is a herculean task given the insuf-ficient data and heterogeneity of the funds.Bernstein et al. (2013) find that political interfer-ence leads to more short-term investment at theexpense of return maximization, but the oppositeview if championed by Ghahraman (2013), who, inhis careful analysis of fund allocations, finds no evi-dence of geopolitical priorities affecting investmentdecisions. Johan et al. (2013) examine how the allo-cate funds between public and private equity andfind that SWFs prefer private equity when investorprotection law is low and where the bilateral politi-cal relations are weak.
A second topic that has attracted considerableattention is whether SWFs are an optimal vehiclefor the allocation of financial resources. Wei andHan (2013) present a complex quantitative modelfor the optimal allocation of wealth to foreign cur-rency reserves and SWFs accounting for govern-ments with different investment horizons and liq-uidity needs. Van der Ploeg et al. (2013) discuss
how the optimal allocation of wealth to a com-modity-based SWF should take into account notjust the oil being extracted, but below-groundreserves as well. Rashid (2013) tackles directly thequestion whether a SWF should be established inIraq, while Kalter and Schena (2013) more broad-ly address the same question for a range of emerg-ing economies.
The impact of SWFs on investment targets, whichhas received so much interest in the previous years,is being examined by Fernades (2013), who con-cludes that SWF ownership leads to positive changesin corporate market values and operating perform-ance of investment targets.
The historical evolution of SWFs is the subject of apaper by Braunstein (2013), who takes a broad viewcontrasting 17th century financial mercantilismwith the 20th century monetary mercantilism toexplain the recent role of SWFs in the global econo-my. Fei et al. (2013) more narrowly focus on therecent financial crisis and on how the related marketturmoil changed the investment strategies of SWFs. Finally, two recent papers focus on the regulatoryframework: Ghahramani (2013) writes about howSWFs are leading to new challenges in transnationallaw and institutions, while Jog and Mintz (2013)more narrowly discuss how sovereign exemptionscreates tax advantages for SWFs in Canada – andadvocate for changes.
Spotlights on research
Overall, it is encouraging to see the emergence of a literature that is more broadly considering the importance and role of SWFs not from a westerncentric perspective, but that dares to ask whether SWFs are indeed the best allocation of the wealth of emerging, commodity-dependent economies.

57
equity compared with public equity in targetnations where investor protection is low, and wherethe bilateral political relations between the SWFand the target nation are weak. Surprisingly, cultur-al differences play a marginally positive role in thechoice to invest in private equity investment outsidean SWF’s own sovereign nation. Comprehensively,we find that SWFs act distinctively from other tra-ditional institutional investors when investing inprivate equity.
Resources Management and Optimal Strategy
Wei, Xiaoyun and Liyan Han. 2013. “OptimalAllocation between International Reserves andSovereign Wealth Funds for Different Horizons.”International Journal of Applied Mathematics andStatistics, 39(9).We present a dynamic model to allocate internation-al reserves and sovereign wealth funds for differenthorizons. Particular attention is paid to dynamicrebalancing cases. The numerical method was usedto obtain optimal allocation ratio of two assets. Theresults show that, in both buy-and-hold and rebal-ancing cases, there are strong horizon effects.Government with a longer horizon chooses signifi-cantly more reserves than someone with short hori-zon in buy-and-hold case. The reason is long-hori-zon governments have an intrinsically larger needfor reserves to quell possible M2 flight and repayshort term external debt for stability purpose. Inrebalancing case, however, when the horizon islengthened, the government should hold less liquid
reserves, for high yield of SWFs makes the demandfor liquid assets decrease when government extendsits horizons in rebalancing case. We also concludethat, for horizon presented here, the governmentswho optimally rebalance their portfolio at regularintervals would hold significantly less reserves thanones implementing buy-and-hold policy. A possiblereason is they could receive updated information atthe end of each period and rebalance portfolio basedon existing information.
Van der Ploeg, Rick, Samuel Wills, and Ton van denBremer. 2013. “The Elephant in the Ground:Managing Oil and Sovereign Wealth.” OxCarreResearch Paper 129.Many oil exporters accumulate large sovereignwealth funds, though their portfolio allocation doesnot take into account below-ground assets, like oil.Similarly, the above-ground portfolio does notaffect the decision to extract oil. This paper showsthat subsoil oil wealth should change a country’sabove-ground asset allocation in two ways. First,the holding of all risky assets is leveraged becausethere is additional wealth outside the fund. Second,more (less) is invested in financial assets that arenegatively (positively) correlated with oil to hedgeagainst the riskiness of subsoil exposure.Furthermore, if marginal oil rents move pro-cycli-cally with the value of the financial assets in thefund, then oil will be extracted slower than predict-ed by the standard Hotelling rule. This leaves abuffer of oil to be extracted when both oil pricesand asset returns are high. Finally, any unhedgedresidual volatility must be managed through addi-tional precautionary saving.
Spotlights on research
Asset Allocation and Investment Selection
Bernstein, Shai, Josh Lerner, and Antoinette Schoar.2013. “The Investment Strategies of SovereignWealth Funds.” Journal of Economic Perspectives,27(2): 219-238.Sovereign wealth funds have emerged as majorinvestors in corporate and real resources world-wide. After an overview of their magnitude, weconsider the institutional arrangements underwhich many of the sovereign wealth funds operate.We focus on a specific set of agency problems thatis of first-order importance for these funds: that is,the direct involvement of political leaders in themanagement process. We show that sovereignwealth funds with greater involvement of politicalleaders in fund management are associated withinvestment strategies that seem to favor short-termeconomic policy goals in their respective countriesat the expense of longer-term maximization ofreturns. Sovereign wealth funds face several otherissues, like how best to cope with demands fortransparency, which can allow others to copy theirinvestment strategies, and how to address theproblems that arise with sheer size, like the diffi-culties of scaling up investment strategies that onlywork with a smaller value of assets under invest-ment. In the conclusion, we discuss how variousapproaches cultivated by effective institutionalinvestors worldwide—from investing in the bestpeople to pioneering new asset classes to compart-mentalizing investment activities—may provideclues as to how sovereign wealth funds mightaddress these issues.
56
Bodie, Zvie and Marie Briere. 2013. “OptimalAsset allocation for sovereign Wealth Fund: Theoryand Practice.” Bankers, Markets & Investors, 128:49-54.This paper addresses management of sovereignwealth from the perspective of the theory of contin-gent claims. Starting with the sovereign’s balancesheet, we frame sovereign fund management as anasset-liability management (ALM) problem, cover-ing all public entities and taking explicit account ofall sources of risks affecting government resourcesand expenditures. Real-life SWFs asset allocationsdiffer strongly from theoretical ones. Financial man-agement of the sovereign balance sheet is hamperedby a lack of aggregate data, which compromises thecoordination of sovereign wealth management withfiscal policy, monetary policy and public debt man-agement. In this framework, we suggest institution-al arrangements that could overcome this obstacleand enable efficient coordination.
Johan, Sophia, April Knill, and Nathan Mauck.2013. “Determinants of sovereign wealth fundinvestment in private equity versus public equity.”Journal of International Business Studies, 44: 155-172.This paper examines the investments of 19 sover-eign wealth funds (SWFs) in 424 firms (both publicand private) around the world from 1991 through2010. The data indicate that SWFs, similar to otherinstitutional investors, are less likely to invest inprivate equity than in public equity internationally.However, the economic significance of this impactis surprisingly low. Unlike other institutionalinvestors, SWFs are more likely to invest in private
THE GREAT REALLOCATION

59
ties that are likely to provide companies with alower-cost (as well as more “patient”) source ofequity capital; and (3) as politically well-connectedstrategic investors that enable their companies toleverage important connections when accessing newproduct markets.
Historical Perspectives
Braunstein, Jürgen. 2013. “The Novelty ofSovereign Wealth Funds: The Emperor’s NewClothes?” Global Policy, Forthcoming.This article broadens the empirical and conceptualperspective on sovereign wealth funds (SWFs). Thisis first done through providing a definition of con-temporary SWFs. Using recent literature it suggeststhat SWFs can be differentiated into discrete cate-gories in terms of their funding, governance andinvestment structures. Using this definition, the sub-sequent history section identifies earlier instances ofSWFs in the context of 17th century financial mer-cantilism and 1930s monetary mercantilism. Thisleads directly to a number of investment deals in the2000s where some countries with SWFs were sub-ject to intense media and government scrutiny. Inthe aftermath, commentators warned of protection-ism and a resurgence in financial and monetary mer-cantilism by pointing to emerging economies, mostnotably China. Though contemporary SWFs are notthe same as earlier state-related pools of capital,there are important similarities concerning policy-relevant variables, highlighted by the SWF litera-ture. A historical interpretative approach provides abridge between historical instances and a reconcep-
tualised notion of SWFs, linking historical evidencedirectly to functional claims about the purposes ofcontemporary SWFs.
Fei, Yiwen, Xichi Xu, and Rong Ding. 2013.“Sovereign wealth fund and financial crisis – a shift-ing paradigm.” China Finance ReviewInternational, 3(1): 42-60.Purpose – The purpose of this research is to empiri-cally analyze the influence of the financial crisis onthe investment behavior of sovereign wealth funds(SWFs).Design/methodology/approach – Using 615 dealsfrom 20 SWFs, a series of research are designed andconducted to compare the SWFs’ governance, exter-nal environment, investment strategy and financialmarkets’ feedback around the crisis.Findings – The paper finds that the recent financialcrisis did not only bring SWFs heavy losses and thepressure to improve its image and governance struc-ture, but also a precious opportunity of a betterexternal environment by easing the nerves of therecipient country’s government. Their investmentstrategies will be more positive, diversified and com-plementary to their own real economy. The eventstudies illustrate that financial markets turn to bemore effective after the crisis. The market reaction toSWF’s investment tends to mitigate speculative trad-ing to a larger extent, which is shown by the lowercumulative abnormal return and turnover volatility.Originality/value – This paper tries to test thechange of SWFs’ behavior pro- and post-crisis. Itreveals that SWFs have changed their effects onSWF’s home country, SWF’s host country, the finan-cial market and the real economy after the financial
Spotlights on research
Rashid, Samee Omer. 2013. “Sovereign WealthFunds and the Possibilities of Establishing Them inIraq.” University of Wisconsin Legal StudiesResearch Paper.This research discusses the Sovereign Wealth Fundsphenomena in Iraq as well as their types andsources. It first explains the concept of SovereignWealth Funds and some main characteristics ofthem. In addition, it attempts to answer the questionof whether Iraq has Sovereign Wealth Funds, andwhether the Development Fund for Iraq is consid-ered to being a Sovereign Wealth Fund. Then it dis-cusses corporate governance of SWFs by explainingtheir organizational and legal structure and invest-ment strategy by giving two different examples, AbuDhabi Investment Authority (ADIA) andGovernment Pension Fund Global (GPF-G) ofNorway that may have an impact on governancestructure of the potential Iraqi Sovereign WealthFunds. Moreover, this research identifies benefitsthat SWFs offer to Iraq as well as challenges thatneed to be addressed in order to develop SWFs rolein supporting Iraq’s economy. Overall, this researchencourages the Iraqi government to consider build-ing a well-diversified investment portfolio thatwould create a sustainable source of revenue, reducethe economy’s dependence on oil and act as a sav-ings fund for the future. This would also help inrealizing the future strategic plan of the governmentof Iraq to develop non-oil dependent economy in thenext decade.
Kalter, Eliot and Patrick Schena. 2013. “Into theInstitutional Void: Managing the Sovereign Wealthof Emerging Economies.” In Investing in Emerging
58
and Frontier Markets, Euromoney Books, London. The number of sovereign wealth funds has expand-ed dramatically since 2000. Most of these new fundshave been established in emerging economies. Thispaper analyzes the evolution and role of SWFs inemerging markets in the context of economic insti-tutional-building.
Corporate Value and SWFs
Fernandes, Nuno. 2013. “The Impact of SovereignWealth Funds on Corporate Value andPerformance.” Journal of Applied CorporateFinance, 26(1):76-84.The last few years have seen a remarkable increasein the participation of sovereign wealth funds(SWFs) in global capital markets. In this article, theauthor draws on a unique dataset of SWF interna-tional holdings—one that dates back to the year2002 and includes individual SWF holdings in morethan 8,000 companies in 58 countries—to provideevidence of the impact of SWFs on corporate valuesand operating performance. Contrary to claims thatSWFs expropriate minority investors and pursuepolitical agendas, the main finding of the author’sstudy is that SWF ownership is associated with pos-itive changes in both corporate market values andoperating returns. In support of these findings, theauthor also identifies three important ways thatSWFs work to increase the performance and valueof the companies they invest in: (1) as long-termholders that provide a stable source of financing; (2)as representatives of deep pools of internationalcapital in search of global diversification opportuni-
THE GREAT REALLOCATION

crisis, which is helpful for government and institu-tions to maintain the stability of the national econ-omy and security market.
Transparency, Legal and Political IssuesGhahramani, Salar. 2013. “Sovereign WealthFunds, Transnational Law, and The New Paradigmsof International Financial Relations.” Yale Journalof International Affairs, 8(2): 52-64.International financial relations have largely beendefined by cross-border trade, foreign direct invest-ments, and global banking relations. This paperdemonstrates that another activity, sovereign invest-ments by special vehicles known as sovereign wealthfunds, is rapidly redefining the traditional para-digms, providing both opportunities for further inte-gration of the financial markets as well as posingparticular challenges for policy makers.
Jog, Vijay and Jack Mintz. 2013. “Sovereign Wealthand Pension Funds Controlling CanadianBusinesses: Tax-Policy Implications.” School ofPublic Policy Research Paper 6(5).In a world without taxes, investors that take overcompanies would do so because they expect to be ableto operate the business efficiently and at a high rate ofreturn. But in Canada today, some acquirers enjoy taxadvantages over others. And that could mean that cer-tain buyers, who may not be best suited to owning aparticular company, are able to outbid those who arebetter positioned to run that company at optimal effi-ciency. That is a problem not just for investors whoend up outbid, due to Canada’s uneven tax policy, but
60
for the Canadian economy, which suffers from theresulting economic inefficiency. With respect to regis-tered pension plans, the so-called 30-per-cent rule putsa cap on the amount of voting equity in a companythat they are permitted to own. Meanwhile, however,sovereign wealth funds — whether controlled byChina or Australia — face no such limit when pur-chasing stakes in Canadian firms. The number andsize of sovereign wealth funds, globally, is only grow-ing — and rapidly. But as Canada increasingly attractsforeign capital, with foreign-controlled government-affiliated funds seeking out Canadian takeover targets,much of the discussion around public policy hasfocused primarily on the Investment Canada Act andthe “net benefit test” for foreign direct investment.Another component in ensuring that Canadian inter-ests are preserved, however, is the question of whetherCanadian institutional investors can operate on a levelplaying field with foreign sovereign wealth funds.With the 30-per-cent rule limiting equity purchases forone but not the other, it would appear that they arenot. The most appealing remedy to this imbalance is atax solution: limiting the corporate deductions oninterest, fees, royalties, rents, and the like, that sooften factor in to the takeover calculation, as part of atax-minimization strategy. This would not only putpension funds and sovereign wealth funds on equalfooting, but it could also be applied to investors oper-ating from low- or zero-tax jurisdictions, as well. Thisapproach is not without disadvantages. But overall,the neutrality it could achieve among different types ofinstitutional investors, and the potential it has toenable those investors best able to maximize manage-ment excellence and synergies, make it the preferablepolicy direction for ensuring the greatest level of effi-ciency in the Canadian economy.
THE GREAT REALLOCATION
MethodologyOur research methodology focuses on two mainobjectives: comprehensiveness of research and accu-racy of information. To ensure comprehensiveness,we survey multiple sources, primarily relying onestablished business and financial databases butemploying also press releases, published news, fundannual reports and many other data sources. Toensure accuracy, we follow a strict process for cap-turing deal information and we establish a clear hier-archy of sources, based on our estimate of reliability:
1 Financial transaction databases: Bloomberg,SDC Platinum, Zephyr (we have also usedDatamonitor and Dealogic in the past).
2 Database for target firm information:DataStream.
3 Sovereign Fund disclosures, including annualreports, press releases and other informationcontained on their websites.
4 Target and vendor company disclosures: pressreleases and other information contained on theirwebsites.
5 Regulatory disclosures: stock exchange filings forpublicly listed companies; Regulators; SEC 13Dand 13G Filings; Land Registries; CompetitionCommissions, and Bond/IPO prospectuses etc.
6 Service provider disclosures: such as lawyers,investment banks, and project financers workingwith the SWFs.
7 Information aggregators: LexisNexis andFactiva. Those include news reported bynewswires (Dow Jones, Reuters, Business Wire,Associated Press and others) and national newsagencies (KUNA, Xinhua, WAM etc.) numerouswell-regarded selected newspapers (e.g. The WallStreet Journal, Financial Times, New YorkTimes), and their regional equivalents (e.g.Economic Times, China Daily, The National),and the local trade press.
8 Other websites, including Zawya.com, GoogleFinance, Yahoo! Finance, AME Info, BBC Newsand others. Most of the deals are amassed andconsolidated from the financial transaction data-bases, while the other sources are mostly used forcorroboration where necessary. At least one high-quality source is captured for each data point,and, where possible, multiple sources are identi-fied. News items from information aggregatorssuch as LexisNexis are carefully examined toascertain the reliability of the original source.
Appendix
61

63
Notes
62

64
Notes

Sovereign Investment LabThe Sovereign Investment Lab is a group of researchers brought together inthe Baffi Center on International Markets, Money and Regulation at UniversitàCommerciale Luigi Bocconi. The Lab tracks the trends of sovereign fundinvestment activity worldwide and conducts path-breaking research on therise of the State as an investor in the global economy. Research output aims tomeet the highest scientific standards, but also to be accessible for a variety ofstakeholders also outside academia: institutional investors, policymakers,diplomats, regulators, and the media.
EditorBernardo BortolottiDirector, Sovereign Investment Lab – Baffi Center, Università Bocconiand Università degli Studi di Torino
desi
gn: s
tudi
o C
appe
llato
e L
aure
nt –
Mila
n