the great depression and great recession october 3, 2011 jim butkiewicz university of delaware
Post on 20-Dec-2015
219 views
TRANSCRIPT

The Great Depression and Great Recession
October 3, 2011Jim Butkiewicz
University of Delaware

Comparisons
The recent Great Recession has resulted in significant economic losses and personal suffering
Still, the Great Depression was far worse

1 2 3 4 5 6 7 8 9 10 11 120
20
40
60
80
100
120
140
Real GDP
Depression
08-09 Crisis
Years (Year 1 is peak)
Va
lue
re
lati
ve
to
cy
cle
pe
ak

1234567891011121314151617181920212223242526272829303132333435363738394041424344454647484950515253545556575859606162636465666768697071727374757677787980818283848586878889909192939495969798991001011021031041051061071081091101111121131141151161171181191201211221231241251261271281291301311320
20
40
60
80
100
120
Consumer Prices
Depression
08-09 Crisis
Months (Month 1 January of peak year)
Va
lue
re
lati
ve
to
pe
ak

1 2 3 4 5 6 7 8 9 10 11 12 13 14 150
5
10
15
20
25
30
Unemployment Comparison
Depression
08-09 Crisis
Years (Year 1 is cycle peak)
Ra
te (
Pe
rce
nt)

Recovery from the Depression
Treasury’s expansionary monetary policy

1919 1924 1929 1934 19390
50
100
150
200
250
IIP*CPI and M2
IIP*CPIM2In
dex

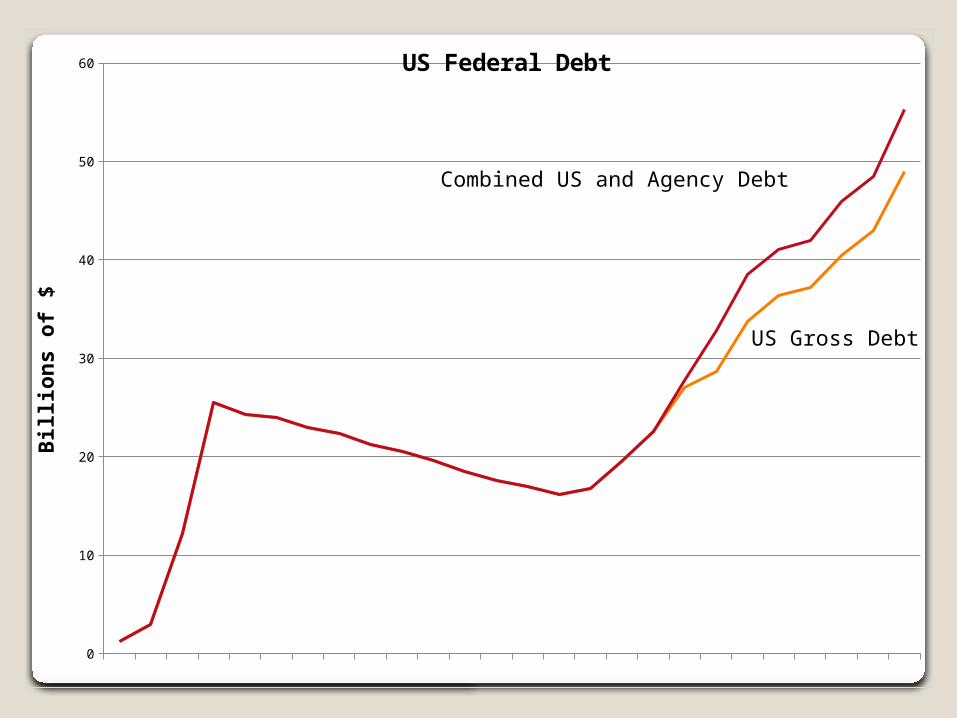
Recovery from the DepressionTreasury’s expansionary monetary policyFiscal policy not expansionaryBank lending stagnant $20 - $22 billionFederal lending by new agencies
◦Home Owner’s Loan Corporation◦Federal Farm Mortgage Corporation◦Reconstruction Finance Corporation◦Commodity Credit Corporation◦U.S. Housing Authority and Federal Housing
Administration

1916
1917
1918
1919
1920
1921
1922
1923
1924
1925
1926
1927
1928
1929
1930
1931
1932
1933
1934
1935
1936
1937
1938
1939
1940
1941
0.00%
10.00%
20.00%
30.00%
40.00%
50.00%
60.00%
Gross Federal and Agency Debt - % of GNPP
erc
en
tag
e o
f G
DP
US Gross Debt
US Gross and Agency Debt
0
10
20
30
40
50
60 US Federal DebtB
illion
s of
$
Combined US and Agency Debt
US Gross Debt

The Great RecessionThe downturn was due to a real shock – the
bursting of the housing bubbleInitially expansionary monetary response
became contractionary, but has since reversed
Impact of fiscal stimulus questionable◦State and local governments constrained and
have significant unfunded liabilitiesFiscal policy now constrained unlike
depressionBank lending a constraint

1999
-01-
01
1999
-06-
01
1999
-11-
01
2000
-04-
01
2000
-09-
01
2001
-02-
01
2001
-07-
01
2001
-12-
01
2002
-05-
01
2002
-10-
01
2003
-03-
01
2003
-08-
01
2004
-01-
01
2004
-06-
01
2004
-11-
01
2005
-04-
01
2005
-09-
01
2006
-02-
01
2006
-07-
01
2006
-12-
01
2007
-05-
01
2007
-10-
01
2008
-03-
01
2008
-08-
01
2009
-01-
01
2009
-06-
01
2009
-11-
01
2010
-04-
01
2010
-09-
01
2011
-02-
01
2011
-07-
01
2011
-12-
01
-6.00%
-4.00%
-2.00%
0.00%
2.00%
4.00%
6.00%
8.00%
10.00%
12.00%
Real GDP and M2 Growth RatesG
row
th R
ate
(Y
ear
over
year)
M2 Growth (1 Year Lag)
Real GDP Growth
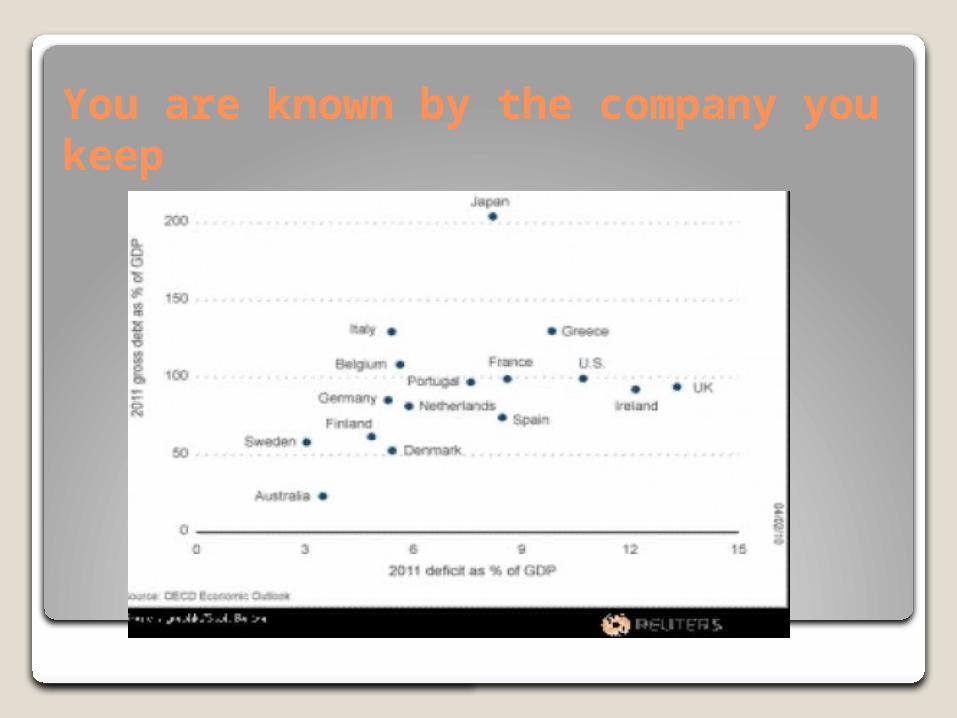
You are known by the company you keep

1999
-01-
01
1999
-06-
01
1999
-11-
01
2000
-04-
01
2000
-09-
01
2001
-02-
01
2001
-07-
01
2001
-12-
01
2002
-05-
01
2002
-10-
01
2003
-03-
01
2003
-08-
01
2004
-01-
01
2004
-06-
01
2004
-11-
01
2005
-04-
01
2005
-09-
01
2006
-02-
01
2006
-07-
01
2006
-12-
01
2007
-05-
01
2007
-10-
01
2008
-03-
01
2008
-08-
01
2009
-01-
01
2009
-06-
01
2009
-11-
01
2010
-04-
01
2010
-09-
01
2011
-02-
01
2011
-07-
010.0
1000.0
2000.0
3000.0
4000.0
5000.0
6000.0
7000.0
8000.0
Total Loans & Leases - All Commercial BanksB
illion
s of
$

Remaining Hurdles
Administration’s anti-business attitude and policies (Obama similar to FDR)◦Uncertainty regarding health care policy◦Uncertainty about regulation◦NLRB – Boeing decision
Continuing housing deflation

1880 1900 1920 1940 1960 1980 2000 20204
4.5
5
5.5
6
6.5
7
7.5
8
8.5
9Nominal House Prices and Consumer Prices
Year
Log
arit
hmic
Val
ue
House Prices
Consumer Prices