the great british transport debate what would high … 3.7 100 120 140 160 weekly expenditure (£)...
TRANSCRIPT
The great British Transport Debatewhat would high speed rail achieve?
1
Stephen GlaisterDirector RAC Foundation
University of Pennsylvania 10st February 2010
The geography matters!
England is a small, dense country
Distances are short
Land values are high


EddingtonEngland is already well-connected
London-Birmingham by rail = 1 hour 20 mins
London Manchester by rail = 2 hours 10 mins
Evidence that transport investment stimulates economic regeneration is poor
that lack of capacity constrains economic growth and productivity is good

The major problem in England is
Lack of capacity Lack of capacity
RoadsRailwaysMajor airportsSea ports

London is the focus of the strategic road network and the most congested areaarea
Source: Eddington Review

Source: Eddington Review

Most rail travel is centred on London
Source: Eddington Review

Some principles
Rail and road face the SAME problems
They should be treated together consistently and even-handedly
It is not “public transport versus roads”!
You’ve got to do the sums!

The problems are:
Capacity and crowdingeconomic recoverypopulation growth
UK pop 61.4m rise to 71.6m by 2033
CarbonSafetyPublic expenditure
30
40
50
Pas
sen
ger
Km
Bn
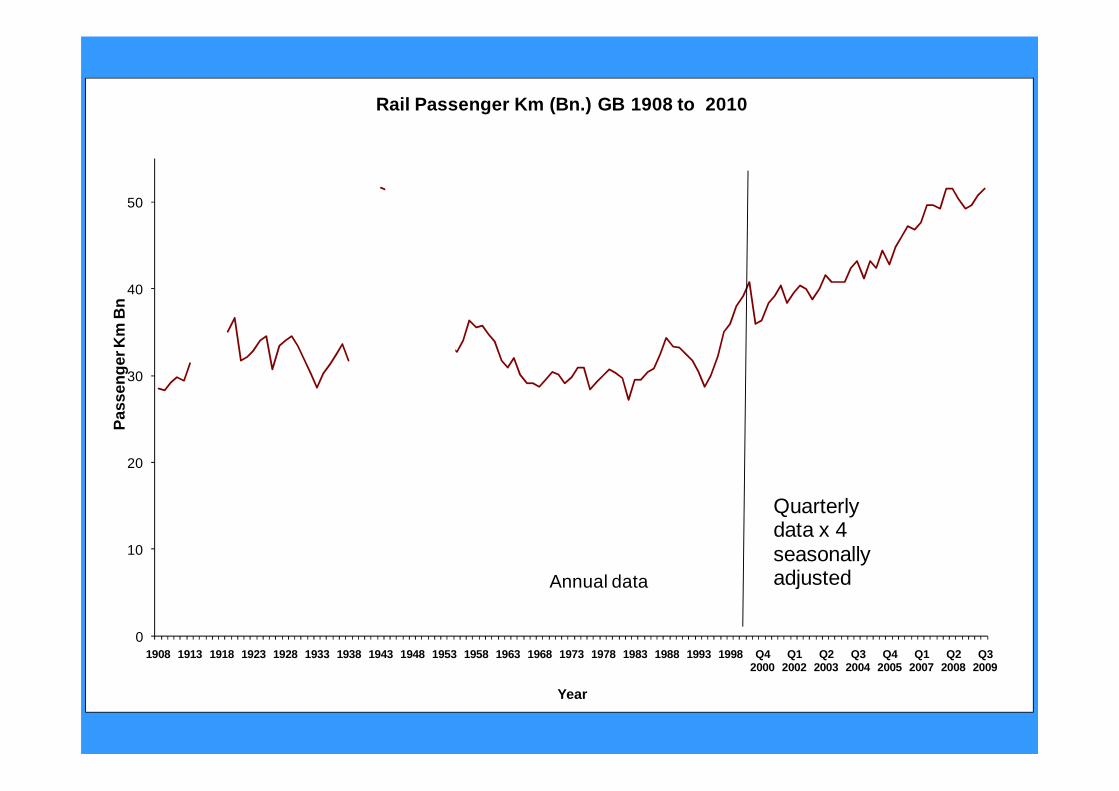
Rail Passenger Km (Bn.) GB 1908 to 2010
0
10
20
1908 1913 1918 1923 1928 1933 1938 1943 1948 1953 1958 1963 1968 1973 1978 1983 1988 1993 1998 Q4 2000
Q1 2002
Q2 2003
Q3 2004
Q4 2005
Q1 2007
Q2 2008
Q3 2009
Pas
sen
ger
Km
Bn
Year
Annual data
Quarterly data x 4 seasonally adjusted

Past road traffic growth(source: Road Statistics 2008, DfT)
www.racfoundation.org 1212

National Traffic Forecast (DfT, 2008)
www.racfoundation.org 13

All parties are claiming the economy will recover
Implies return to growing demand for road and rail
We are already short of capacity on both!

Why congestion has got worse in the past

Public transport cannot help much
Public transport improvements may be good policy
BUTBUT
They cannot make much impact on road congestion or carbon emissions at a cost that is feasible
Rail and local bus each have 6% of passenger market

Committee on Climate Change, First Report, 12 October 2009
www.racfoundation.org 17

2009 Budget Report

After General Election
Government expenditure cutsGovernment expenditure cuts
Transport NOT “protected”

The objectives:
to improve quality of life to meet needs for mobility
whilst recognising carbon, congestion, pollution, noise, severance etc. equity
Not “to get people out of their cars” or“to promote rail use”

Shortage of public funds
How to spend reducing public funds most effectively?
The economics and politics of rail pricing mean that rail schemes will usually increase public funding
But we can improve roads and reduce public funding?

Investment good value for money?
Sector Number of projects Average Benefit: cost
Highways Agency 93 4.7
Local Road 48 4.2 Local Road 48 4.2
Local Public Transport 25 1.7
Rail 11 2.8
Light Rail 5 2.1
Walking and Cycling 2 13.6
Total 184
Source: Eddington (Dodgson, RAC Foundation, 2009)

Funding vs social benefit
There is a fundamental difference between:
“this will generate benefits greater than the costs”“this will generate benefits greater than the costs”
“this will not increase the demands on the taxpayer”
E. g. “… study after study shows that over time high speed rail will pay for itself” (Mrs Villiers, 12 January)
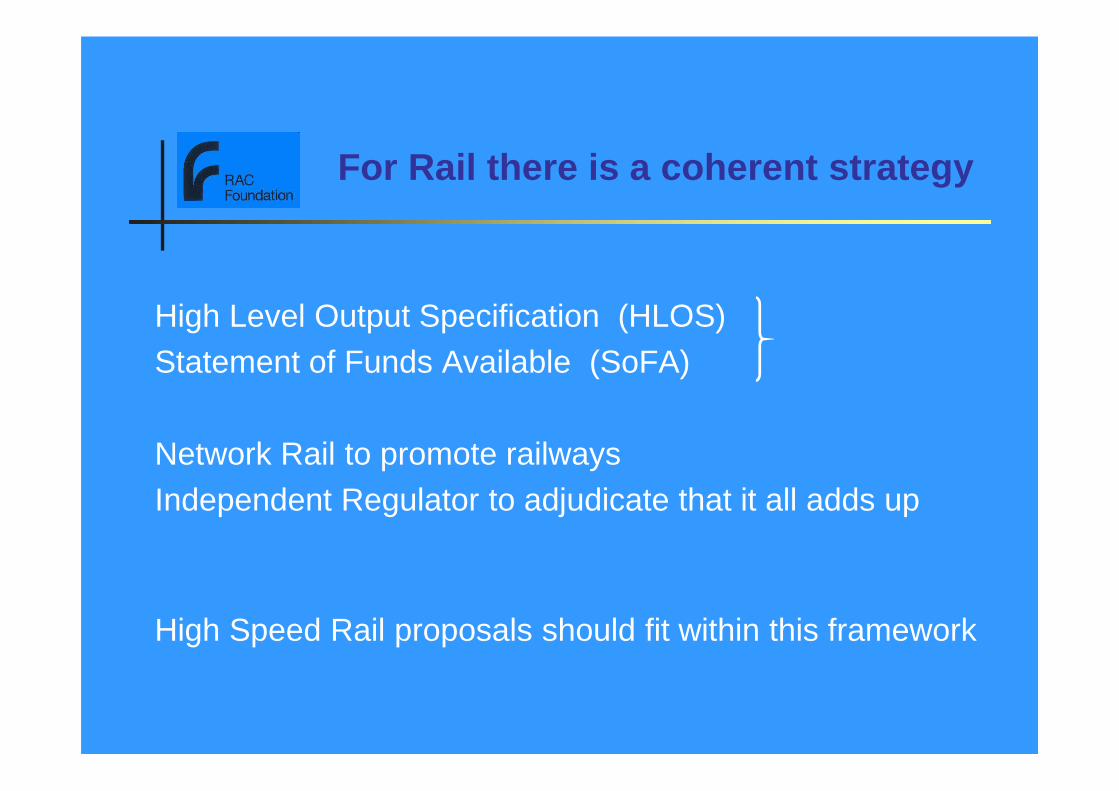
For Rail there is a coherent strategy
High Level Output Specification (HLOS)Statement of Funds Available (SoFA)
Network Rail to promote railwaysIndependent Regulator to adjudicate that it all adds up
High Speed Rail proposals should fit within this framework

HS2
There is NO FORMAL commitment to build a HSR
“HS2 Ltd was created in January 2009 to look at the feasibility of, and business case for, a new high speed rail line between London and the West Midlands….West Midlands….
The next step is for Government to consider and respond to our report by the end of March 2010. It is expected that our report will be published as part of this response.”
Should it serve Heathrow?
Options for continuing north?
http://www.hs2.org.uk/

The realities of process
We await a White Paper (official Gvt. Policy)
There will be a General Election soon
May be a change of government
Much power resides with the Treasury!
There will be bitter opposition once a route is published
Construction would not start until 2017 for 2025 opening

January 2010
Tory policies on rail (Less than 10% of passenger and freight market: heavily loss-making.)
Reduce faresimplies more capacity?implies more capacity?
Reduce crowding
Increase competitive pressure on Network RailReduce competitive pressure on train operators
Invest heavily in High Speed Rail network
Teresa Villiers, 12 January
January 2010
Tory policies on road(More than 90% of passenger and freight market: Profit-making)
Road congestion and unreliability a recognised as a problem…
Improve road works, traffic lightsMore localised decision-makingLorry road user-charging (No general road user-charging)Make Highways Agency more efficient
New road projects only “where … consistent with a responsible approach to the public finances”.
Teresa Villiers, 22 January.

The HS2 Report is not yet published.
When it is, READ IT CAREFULLY!!When it is, READ IT CAREFULLY!!
Meanwhile, we can discuss previous studies
www.racfoundation.org 30
There is a big literature!
Atkins (2003, 2008)Booz Allen Hamilton for DfT 2007Capita Symonds for Sustainable Development Commission
(2007)(2007)De Rus (several) on SpainEddington (2006)Greengauge21 (2009)Network Rail (2009)
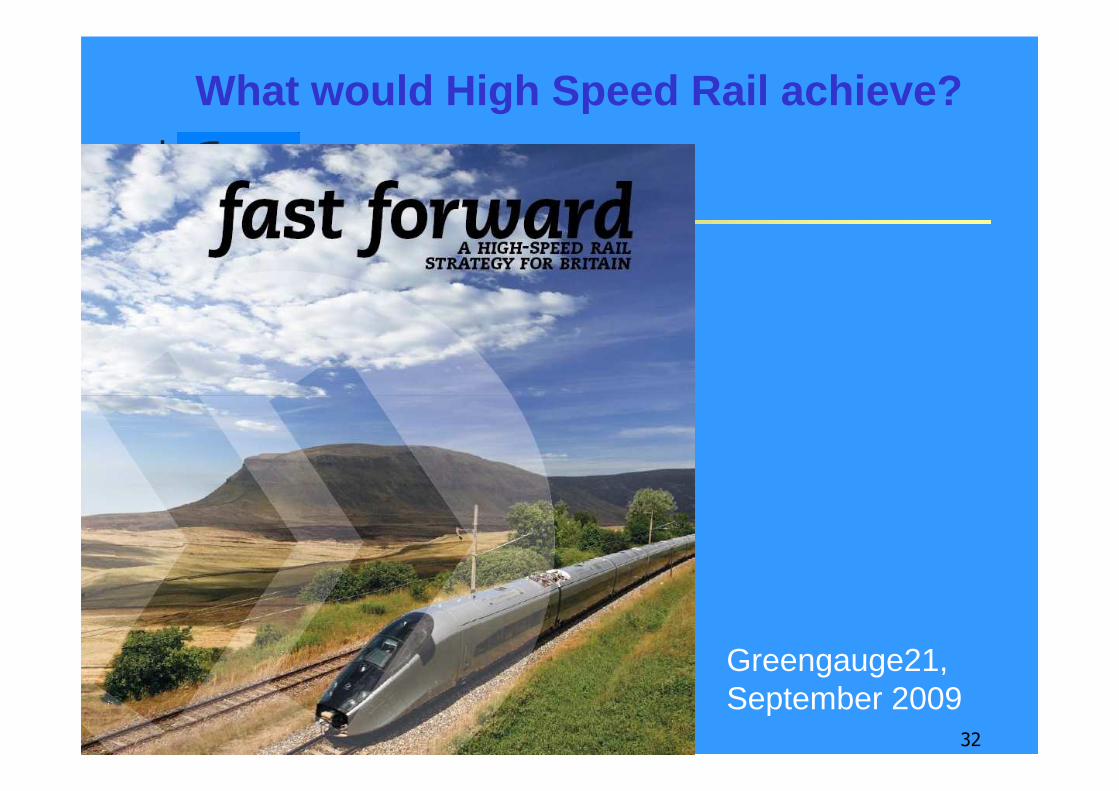
What would High Speed Rail achieve?
32
Greengauge21, September 2009

“This report shows how, when operational, a national High Speed Rail network would reduce carbon emissions by one million tonnes a year.
Greengauge21, September 2009
33
million tonnes a year.
It is the green option for our national transport system.
It will … support an evolution from the previous age of motorway building.

34

35
Benefits:costs = 3.48:1The cost to the taxpayer is £26.5 billion
(£400 per head of population)

The cost to the taxpayer is £26.5 billion
That is £400 per head of population!
36
It would not open until 2022

AVE Madrid-Seville
HSRs overseas are not all successful
37
Revenues less than operating costs
Benefits only 18% of costs

Currently, all rail trips in the country of over 80 km
2.1 trips per head per year at an average length of 117 km per trip.
Are the growth forecasts plausible?
38
15 billion passenger km per annum.
These are moving all over the country,
Greengague21: on their new high speed railway by 2055
178 million trips per annum average length of 300 km
53 billion passenger km per annum
HSR proposals are “predict and provide”
There is nothing wrong with this! …There is nothing wrong with this! …
… providing it is good value for money and can be funded
There are many road schemes showing goodvalue for money: so do those too!

8.2
3.7
100
120
140
160
Weekly
exp
en
dit
ure
(£)
Operation of pesonal transport Purchase of Vehicles Bus and Coach
Rail and Tube Combined Fares
Spending on rail and Tube (£ pw)
Railways are mainly used by the richFamily Spending (2006) £ per week
2.1
2.3
1.91.4
1
10.6
0.30.4
0
20
40
60
80
141 160 233 261 303 362 479 584 683 990 443
Weekly household gross income (£)
Weekly
exp
en
dit
ure
(£)
40

Railways are mainly used by the richFamily Spending (2006) £ per week
10.0%
12.0%
14.0%
16.0%
18.0%
Pro
port
ion
of expendit
ure
(%
)
Private vehicles Bus and Coach Rail and Tube Combined Fares
41
0.0%
2.0%
4.0%
6.0%
8.0%
141 160 233 261 303 362 479 584 683 990 443
Weekly household gross income (£)
Pro
port
ion
of expendit
ure
(%
)

Issues
Carbon from construction?Where does electrical power come from
AT THE MARGIN
www.racfoundation.org 42
AT THE MARGINRisk on achieving forecast load factorsPlanning powersDistribution of passengers esp. in LondonRegional development: agglomeration

What problems is HSR a solution to?
Reducing carbon emissions?
Capacity shortages on classic rail?Capacity shortages on classic rail?
Faster journeys to Midlands and Scotland?
Regional economic development?
Helping the poor – “social inclusion”?
43

The car is used by rich and poorThe Car in British Society, RAC F (2009)
Lowest 2nd 3rd 4th Highest
44