the graduate students association of ghana (grasag) e
TRANSCRIPT

The Graduate Students Association of Ghana (GRASAG) e-journal Volume 1, Issue 1, pp. 23-
49.
23
RELATIONSHIP BETWEEN CORPORATE SOCIAL RESPONSIBILITY AND
FINANCIAL PERFORMANCE UNDER SLACK RESOURCES THEORY: EVIDENCE
FROM GHANAIAN LISTED FIRMS
GODFRIED ASAMOAH
University of Professional Studies, Accra (UPSA)
Ghana
ABSTRACT
This study empirically examines the relationship between Corporate Social Responsibility (CSR)
investments and financial performance under slack resources theory using a panel research design
which includes a sample 22 firms out of 34 listed on the Ghana Stock Exchange over a six-year
period (2006-2011). Multivariate correlations are applied in analyzing data. The study found that
CSR has a positive relationship with return on assets, return on sales and slack financial resources,
but a negative relationship with return on equity under slack resource theory. Also firm financial
performance, and two of the control variables, firm age and firm size afforded firms the requisite
strategic incentives for further maximizing their long-term economic performance and CSR was
only a means or strategic tool employed by such firms characteristically possessing excess
financial slack, to achieve competitive edge over smaller and younger ones. The study
recommends for further studies, the development of an empirical econometric or mathematical
model to help predict the level of slack financial resources possessed by firms at which CSR
investments would minimize marginal costs of CSR investments and maximize financial
performance.
Keywords: Corporate social responsibility, corporate social performance, financial
performance, slack resources.

The Graduate Students Association of Ghana (GRASAG) e-journal Volume 1, Issue 1, pp. 23-
49.
24
1. INTRODUCTION
There is currently an extensive global debate about corporate social responsibility (CSR), that is, the extent to which companies should integrate social and environmental initiatives into their business model. These debates have influenced the myriad of western theories propounded by academics and researchers in this field namely: Carroll’s Model, shareholder view, stakeholder views, managerial opportunism hypothesis, virtuous cycle, vicious cycle, resource-based view, managerial entrenchment hypothesis, curvilinear model etc. However, the most used and quoted among the list of western models of CSR is Carroll's (1991) Pyramid of Corporate Social Responsibility. Carroll considers CSR to be framed in such a way that the entire range of business responsibilities are embraced and that CSR consists of four social responsibilities; economic, legal, ethical and philanthropic, with decreasing importance in that order. For the past two decades Carroll’s Pyramid of Corporate Social Responsibility has been used widely by both business managers and academicians to better define and explore CSR. The Pyramid has been useful to managers in particular to see the different obligations that the society within which they operate expect from businesses. Carroll has integrated the concepts of stakeholders and corporate citizenship into the pyramid, which views corporate social responsibility as involving giving back to the community and being a good corporate citizen through donations and active participation in charities or other community welfare programs (Carroll & Buchholtz, 2006).
There is a significant body of work exploring the relationship between corporate social performance (CSP) and corporate financial performance (CFP), some of which supports a positive relation, some neutral, and some negative. Regarding the nature of the relation between corporate social performance and corporate financial performance, there is a long history of commentators within the economic and finance literatures who have argued that a focus on corporate social responsibility (CSR) will reduce financial performance, implying that CSR is negatively related with financial performance (Friedman, 1970, Bragdon & Marlin, 1972; Vance, 1975; Langbein & Posner, 1980; Aupperle, Carroll & Hatfield, 1985; Knoll, 2002; Brammer, Brooks & Pavelin, 2006; and Fu, Wang & Jia, 2012). Another body of research suggests a neutral relation between CSP and CFP. Ullmann (1985), for instance, argues that given such a large number of variables intervene between the social responsibility performance and the financial performance of companies, there is no reason to assume that a direct relation should exist. Other authors have asserted that a neutral association can also be explained by the financial market’s inability to value and thus price CSP (Skudiene, McClatchey & Kancleryte, 2013; Iqbal, Ahmad, & Nadeem, 2012; Statman, 2000).
Several studies support a positive relation between CSP and CFP (Guerard, 1997; Griffin & Mahon 1997; Orlitzky, Schmidt & Ryes, 2003; Derwall, Guenster, Bauer & Koedijk, 2005; Flammer, 2013). These authors argue that investments in CSR will lead to positive CFP over the medium to long- term due to the impact of CSP on reputation, brand, and the attractiveness of such companies to high quality managers and employees. In effect, when it comes to the nature of the relationship between corporate social responsibility and financial performance, the research evidence is mixed.

The Graduate Students Association of Ghana (GRASAG) e-journal Volume 1, Issue 1, pp. 23-
49.
25
The mixed research findings could be attributable to different theoretical underpinnings. Given the myriad of theories explaining the possible nature of the relationship between CSR and financial performance, it is important to test theoretical arguments using empirical data. Amongst all the theories explaining the nature of relationship between CSR and financial performance, the slack resources theory, this study argues, is the most logical. Slack resources theory argues that financial performance is the cause of corporate social performance. In other words, firms would need to be profitable first before they could truly embark on corporate social initiatives. This is of course underpinned by the assumption that corporate social responsibility initiatives should be backed by purely ethical motives. In other words, managers are assumed to engage in CSR for purely ethical reasons. However, even if they had other “unethical motives” for pursuing CSR initiatives, it still makes sense to assume that CSR activities always require cash investments; whether the cash is in excess or not, managers would still need to find cash from somewhere before they invest in CSR initiatives. This cash for CSR investments could come from a number of sources; slack financial resources, retained earnings, income surplus or profits. Therefore this study asserts that every CSR investment would require substantial slack resources; firstly financial slack resources and secondly other slack resources which could mainly be intangible resources possessed by the firm including its human capital base, innovative capacity, reputation, competitive advantage and organizational culture. In addition, the study argues that certain firm-specific characteristics could afford firms additional advantages when it comes to the fulfillment of CSR initiatives from the perspective of slack resources theory. For example firm age, firm size, firm risk and firm advertising intensity are seen as important variables that could influence a firm’s capacity for embarking on CSR initiatives, therefore in a way these variables could be construed as slack in nature. The objective of this study therefore is to explore the relationship between corporate social performance and financial performance under slack resources theory. To achieve this, the study would specifically examine the relationship between selected financial performance indicators, measures of intangible assets (slack resources) and other intervening variables like firm age, firm size, firm risk and firm advertising intensity and corporate social performance. Some research has been conducted on various aspects of corporate social responsibility, but very few have gone into investigating the relationship between CSR and firm financial performance underpinned by slack resources theory in Ghana. This research, therefore seeks to contribute to knowledge in that area and to add up to existing literature on the subject matter. In addition, it is hoped that the findings of this study would serve as important quantitative information into the cauldron of policy as well as add to the existing body of empirical literature from a developing stock exchange such as that of Ghana. The need for a study of this kind is even more important in an environment like Ghana’s, which is characterized by growing calls for responsible corporate citizenship, and the need for businesses to become more responsive to the needs of deprived communities within certain parts of the country and the society as a whole.
The rest of the paper will be in the following order. Section two is a literature review. The third section describes the model, data and methodology used in this paper. Section four provides detailed analysis results. Finally, section five present the conclusion and recommendation of this study.
The Graduate Students Association of Ghana (GRASAG) e-journal Volume 1, Issue 1, pp. 23-
49.
26
2. THEORITICAL AND EMPIRICAL LITERATURE
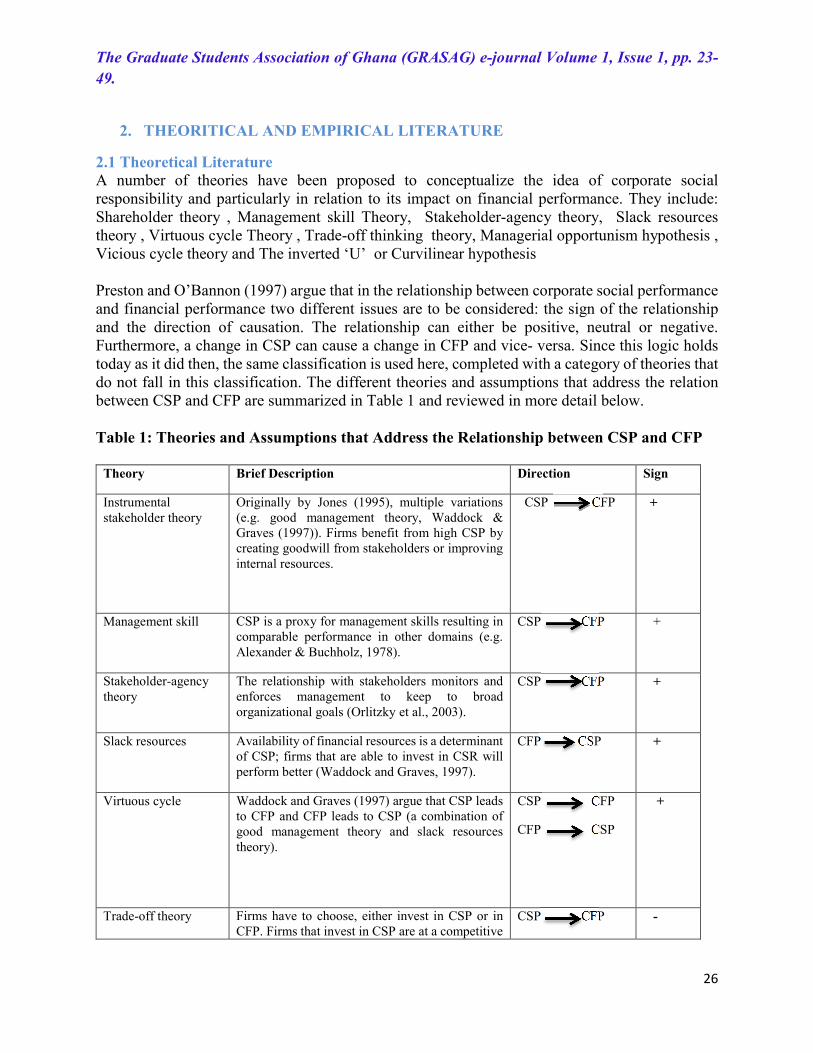
2.1 Theoretical Literature A number of theories have been proposed to conceptualize the idea of corporate social responsibility and particularly in relation to its impact on financial performance. They include: Shareholder theory , Management skill Theory, Stakeholder-agency theory, Slack resources theory , Virtuous cycle Theory , Trade-off thinking theory, Managerial opportunism hypothesis , Vicious cycle theory and The inverted ‘U’ or Curvilinear hypothesis Preston and O’Bannon (1997) argue that in the relationship between corporate social performance and financial performance two different issues are to be considered: the sign of the relationship and the direction of causation. The relationship can either be positive, neutral or negative. Furthermore, a change in CSP can cause a change in CFP and vice- versa. Since this logic holds today as it did then, the same classification is used here, completed with a category of theories that do not fall in this classification. The different theories and assumptions that address the relation between CSP and CFP are summarized in Table 1 and reviewed in more detail below. Table 1: Theories and Assumptions that Address the Relationship between CSP and CFP
Theory Brief Description Direction Sign
Instrumental stakeholder theory
Originally by Jones (1995), multiple variations (e.g. good management theory, Waddock & Graves (1997)). Firms benefit from high CSP by creating goodwill from stakeholders or improving internal resources.
CSP CFP
+
Management skill CSP is a proxy for management skills resulting in comparable performance in other domains (e.g. Alexander & Buchholz, 1978).
CSP CFP +
Stakeholder-agency theory
The relationship with stakeholders monitors and enforces management to keep to broad organizational goals (Orlitzky et al., 2003).
CSP CFP +
Slack resources Availability of financial resources is a determinant of CSP; firms that are able to invest in CSR will perform better (Waddock and Graves, 1997).
CFP CSP +
Virtuous cycle Waddock and Graves (1997) argue that CSP leads to CFP and CFP leads to CSP (a combination of good management theory and slack resources theory).
CSP CFP
CFP CSP
+
Trade-off theory Firms have to choose, either invest in CSP or in CFP. Firms that invest in CSP are at a competitive
CSP CFP -

The Graduate Students Association of Ghana (GRASAG) e-journal Volume 1, Issue 1, pp. 23-
49.
27
disadvantage compared to firms that chose not to (Friedman, 1970; McGuire et al., 1988).
Managerial opportunism hypothesis
Managers with a short-term outlook, for example due to remuneration plans, will attempt to cash in when performing well financially. When not performing well, managers will attempt to disguise this by investing heavily in CSP (O’Bannon & Preston, 1997).
CFP CSP
-
Negative synergy O’Bannon and Preston (1997) argue that the possibility exists that CSP negatively influences CFP, which in turn has a negative effect on CSP.
CSP CFP
CFP CSP
-
Inverted “U” or Curvilinear Relationship
There is an optimal level of CSP, deviations from this level result in lower CFP (Salzmann, 2005; Barnett & Salomon, 2006).
+ or -
Source: Preston and O’Bannon (1997). 2.2 Meaning of Arrows and Signs in Table 1 It is important to note that the arrows ( ) shown in Table 1 above indicate the direction of relationship. For example the expression CFP CSP, for Slack Resources Theory and Managerial Opportunism Hypothesis imply that financial performance leads to changes (positive or negative) in corporate social performance. The sign, i.e. the positive (+) or negative (-) indicates the exact nature of the changes, where positive (+) represents increases and negative (–) represent decreases. Therefore for Slack Resources Theory, the expression CFP CSP, with a positive (+) sign in the next column of the table associated with it implies that corporate financial performance could lead to or result in improvements in corporate social performance. For Managerial Opportunism Hypothesis, however, the same expression, CFP CSP, however with a negative (-) sign in the next column of the table associated with it indicates that corporate financial performance could have negative effects of corporate social performance. 2.3 Slack Resources Theory This study argues, that slack resources theory should be the most logical to better explain the relationship between corporate social responsibility and financial performance. This is not to undermine the explanatory power of the other theories, but given that embarking on corporate social initiatives requires financial resources, it makes sense to argue that financial resources would be required firms and foremost, if firms would be able to engage in CSR activities.
Slack resource theory is developed based on the view that a company is able to carry out its activities because of the resources owned by the company, which have normally been dedicated to the predefined activities. The function of the resource is to enable the company to successfully adapt to internal pressure for adjustment or to external pressures for change (Buchholtz et al., 1999). The resource needed by the company to successfully adapt is slack in nature, which is defined as any available or free resource (financial and other organization resource) used to attain the company’s certain goal (Bourgeois, 1981; Jensen, 1986). According to Waddock and Graves

The Graduate Students Association of Ghana (GRASAG) e-journal Volume 1, Issue 1, pp. 23-
49.
28
(1997), when a company’s financial performance improves, slack resources will be available to enable the company to conduct corporate social performance such as society and community relation, employee relation, and environment performance. Some activities conducted by the company in the domain of corporate social performance are meant to develop and enhance the company’s competitive advantage through image, reputation, segmentation, and long term cost saving (Miles & Covin, 2000; Miles & Russel, 1997; Miles et al., 1997).
McGuire et al. (1988, 1990) have provided some empirical support to the theory. Slack resources theory states that there is a positive relation between CSP and CFP. However, compared to instrumental stakeholder theory, this theory proposes a different direction of causation. Slack resources theorists argue that firms with better financial performance will have resources available to invest in CSR. Since these resources, financial and other, are necessary to improve CSP, a link between the two is expected. In this line of reasoning, better CFP will result in better CSP (Waddock & Graves, 1997). In other words, all firms may want to excel in CSR but only those with sufficient resources will find themselves performing well (O’Bannon & Preston, 1997).
McGuire et al. (1988) again add to this discussion by stating that CSR is an area of high managerial discretion, making it more likely that CSP will depend on available resources. Thus from the perspective of the slack resources theory, financially performing firms have a greater likelihood becoming socially responsible than less financially performing ones. Figure 1 below summarizes the Slack Resources Theory.
Figure 1: Scheme of the Relationship between CSP and CFP According to Slack Resources
Theory
Source: Author, 2013.
2.4 Empirical Literature and Hypotheses Development With respect to empirical literature on the relationship between corporate social responsibility and financial performance, research evidence is mixed. Numerous researches that found a positive relationship between corporate social responsibility and financial performance were underpinned
CORPORATE SOCIAL RESPONSIBILITY
AVAILABILITY OF SLACK RESOURCES
FINANCIAL PERFORMANCE
SL
AC
K
RE
SO
UR
CE
S
TH
EO
RY
PO
SIT
IVE
EF
FE
CT
(+
)

The Graduate Students Association of Ghana (GRASAG) e-journal Volume 1, Issue 1, pp. 23-
49.
29
by the stakeholder theory, which argues that investments in CSR could create certain positive reputational effects. For example the works of Spicer (1978) and Griffin and Mahon (1997) found that the higher the level of pollution control the greater the profitability and size of the firm and the lower the systematic and total risk. He concluded that the benefits seen were short lived. The findings of Anderson and Frankle (1980) meant that investors were investing more in firms who reported CSR than those who did not providing some evidence of the existence of the ‘ethical investors.’ Such findings affirm that investments in CSR translate into financial performance only when such investments create positive reputational effects for the firms and improve upon its public image, thus confirming the stakeholder theory. Although a recent research by Orlitzky, Schmidt and Ryes (2003) also found a positive correlation between reporting CSR with performance and firm value, they noted the difficulty of measuring the benefits of CSR. The authors however saw some indication of a time lag between when CSR was reported and the financial benefits seen. These findings however, conflicted with the results of Spicer (1978) who found that the financial benefits were short lived. Nevertheless their conflicting findings still pointed to the fact that investments in CSR could create both short-term and long-term reputational advantages for firms leading to improvements in financial performance; thus confirming the stakeholder theory. The findings of more recent studies supporting a positive relationship between CSP and CFP (Derwall, Guenster, Bauer & Koedijk, 2005; Flammer, 2013) similarly, argue that investments in CSR will lead to positive CFP over the medium to long- term due to the impact of CSP on reputation and brand and the attractiveness of such companies to high quality managers and employees, again confirming stakeholder theory. Hypothesis 1: There is a positive relationship between corporate social and financial performance under slack resources theory. Riahi-Belkaoui (1992) found a negative relationship between external perceptions of a company’s CSR activities and executive compensation schemes, providing a new angle on the relationship. This finding was in direct contrast to Spicer’s 1978 paper which found a significant positive relationship and highlighted the inconsistency of the results obtained by different studies, suggesting that how CSR is measured could also have a large impact on the conclusions that are reached. However, the explanation that Riahi-Belkaoui (1992) provided for the negative results was that investors are put off by CSR, a finding that suggested a negative relationship between external perceptions of a company’s CSR activities and executive compensation schemes, providing a new angle on the relationship. These results provide evidence of inability of firms to manage certain external stakeholder groups, such as investors, creating negative reputational effects, leading to a reduced financial performance. These findings support the stakeholder agency theory) and particularly, Riaha-Belkaoui’s findings suggest that top management may be discouraged from undertaking CSR activities because shareholders do not appreciate their profits being spent on activities they do not consider beneficial to them, further confirming stakeholder agency theory. More recent studies (Brammer, Brooks & Pavelin, 2006; Fu, Wang, & Jia, 2012) predicting a negative relationship between CSR and financial performance have argued that the negative relationship arises due to the additional costs incurred to improve social or environmental performance, which does not contribute to enhancing shareholder value. Also, profitable business and investment strategies that are rejected only because of CSR concerns must result in lowering economic performance (Knoll, 2002). These explanations further support the stakeholder agency theory.

The Graduate Students Association of Ghana (GRASAG) e-journal Volume 1, Issue 1, pp. 23-
49.
30
Hypothesis 2: Hypothesis 1: There is a negative relationship between corporate social and financial performance under slack resources theory. A few studies, however found no relationship between CSR and financial performance. For example Alexander and Buchholz (1978) examined the relationship between the level of CSR and stock market performance, and also stock level risk. Alexander and Buchholz’s empirical study did not find any significant relationship between CSR and stock market performance, and also stock level risk. Their study however suggested an efficient market hypothesis in which any positive news will change the share price instantly rather than over a period of time (Fama, 1985). The research carried out by Aupperle et al. (1985) which were critical of the research that had been carried out previously, especially in regards to what they had considered to be weak methodology applied on the relationship of CSR and financial performance. However, no relationship was found between the variables, CSR and financial performance, suggesting the effect CSR has on profitability is neutral and by reporting CSR profits are neither increased nor decreased (Aupperle et al., 1985). Other researches supporting a negative relationship includes those carried out by Ullmann (1985) who argued that given such a large number of variables intervene between the social responsibility performance and the financial performance of companies, there is no reason to assume that a direct relation should exist. However, more recent studies have explained the neutral association between CSR and financial performance as the financial market’s inability to value and thus price CSP (Statman, 2000; Iqbal, Ahmad, & Nadeem, 2012; Skudiene, McClatchey & Kancleryte, 2013). Alternatively, it has been suggested that CSR investments might impact on firm and portfolio performances (Derwall et al., 2005) resulting in a neutral relationship with financial performance. Hypothesis 3: There is a neutral relationship between corporate social and financial performance under slack resources theory.
2.5 Definition of Terms and Constructs
The following are the operational definitions of terms or expressions as applied throughout this study:
2.6 Corporate Social Responsibility and Corporate Social Performance
Corporate Social Responsibility throughout this study refers to activities of firms which involve their commitment to improving social and environmental concerns including investments in education, healthcare, environmental/ecological sustainability, infrastructural development, rural development, sponsorships, providing job opportunities, offering aid/relief to victims of natural disasters and calamities, donating in cash/kind towards worthy cause, providing employee training programs, ensuring fairness in the work place and respecting workplace diversity. It is used synonymously with Corporate Social performance (CSP), though other researchers apply them differently under different circumstances.

The Graduate Students Association of Ghana (GRASAG) e-journal Volume 1, Issue 1, pp. 23-
49.
31
2.7 Corporate Financial Performance Throughout this paper, corporate financial performance refers to return on assets (ROA), return on equity (ROE), return on sales (ROS) and slack financial resources (SLACKRES) of firms.
2.8 Slack Resources
Slack resources refer to the stock of excess resources available to an organization during a given planning cycle (Nohria & Gulati, 1996). Slack can accrue as a result of organizational performance in prior periods, as a planned buffer, or as a result of poor planning. In this study, slack resources were extended to include intangible assets such Innovation, Human capital, Reputation, Competitive Advantage and Organizational Culture. 2.9 Financial Slack Financial slack refers to the level of liquid assets, such as cash on hand, that is available to an organization (Nohria & Gulati, 1996). Though valuable, financial slack is a generic and therefore less rare resource. Financial resources, representing no particular stakeholder, can be generated internally via multiple means or garnered from external sources in relatively short order through a variety of market mechanisms (Davidson, Coetzee & Visser, 2010). Perfectly divisible for allocation to multiple activities, financial slack is the least absorbed form of slack and the easiest to redeploy ((Nohria & Gulati, 1996). This study specifically devised a proxy for measuring financial slack.
3. METHODOLOGY
3.1 Research Design This study relied on quantitative, descriptive and critical reflective/reflexive approaches to examine corporate social responsibility and firm financial performance of firms listed on the Ghana Stock Exchange. A panel research design was employed in which corporate social performance and financial performance indicators were measured over a period of time (2006-2011) for a number of firms. 3.2 Target Population, Sample Size Computation and Sampling Technique The target population for the study consisted of the 34 firms listed on the Ghana Stock Exchange as at the period of the study. The sample size for the study was computed manually, using the Minimum Sample Size calculation formulae, given as:
� =��
{ ��(� − 1) + �}
� = �(� − �)�/�(� − 1)
� = Z��
����
�
. �(100 − �)
Where n = sample size, E = margin of error, x = variable representing the product of the square of the critical value Z(c/100), for the confidence level c and the response rate, r, and the non-

The Graduate Students Association of Ghana (GRASAG) e-journal Volume 1, Issue 1, pp. 23-
49.
32
response rate(100-r), and N is the population size. The population size of firms listed on the Ghana Stock Exchange at the time of the study was N = 34. The study was interested in receiving 95% responses from all the firms, hence r = 95% or 0.95 and only 5% non-response rate or 0.05. The critical value for the 95% confidence level c (i.e., c =95%) is Z(c/100) which has a value of 1.96. The margin of error E of a confidence interval is defined to be the value added or subtracted from the sample mean which determines the length of the interval:
� = �(� − �)�/�(� − 1)
The margin of error for this study was set at 0.05, which was conventionally reasonable and also because the population standard deviation parameter, �was unknown.
After putting the values of all variables into the sample size equation, the minimum sample size was computed was, n= 22.
3.3 Sampling Technique
The sampling technique used in actually selecting the sample size of 22 firms from the total population of 34 was a type of purposive sampling, known as homogenous sampling. Purposive sampling represents a group of different non-probability sampling techniques which relies on the judgement of the researcher when it comes to selecting the units. In order to eliminate potential researcher bias, the 22 firms selected for this study were all firms which firstly possessed all relevant data relating to CSR and financial performance. Secondly these firms included only those that had financial reports covering the periods from 2006 to 2011. In addition the 22 firms selected were those which had recorded positive net cash flows and general improvements in financial performance over the period of study, signifying availability of excess financial slack. Although purposive sampling technique is known to be weaker than simple random sample in terms of eliminating sampling bias and errors, in this regard the use of it rather strengthened the sampling technique. Since this study was underpinned by the slack resources theory, which postulates the availability of financial slack as being a motivational incentive for corporate social performance, selecting a list of firms by simple random sampling, without considering whether they actually had available financial slack would undermine the very theoretical foundation of the study. Thirdly, firms which did not have annual reports for any of the years within the period of 2006 and 2011 were ignored and those which had recorded negative values of net cash flows over the period were also eliminated. The rejection of firms recording negative cash flow also further strengthened the slack resources theory, for selecting such firms would have been making a case for managerial opportunism hypothesis instead.
In effect the issue of researcher bias, associated with the use of purposive sampling method in this instance is flawed and the sample size of 22 firms, out of a population of 34 firms listed on the GSE could be construed as being representative of the population. This is further substantiated by the fact that these sampled firms represented nearly 65% of the population, making the findings of this study generalizable. The period, 2006-2011 was selected because that was the period within which all relevant data on listed firms could be obtained, and this justifies why other time periods were not selected. And although it could be argued that that there was a selection bias in respect of the time period, it could still be argued that this bias could not substantially affect the findings of the study given the fact that the theoretical underpinning of this study was slack resources theory
The Graduate Students Association of Ghana (GRASAG) e-journal Volume 1, Issue 1, pp. 23-
49.
33
which needed the selection of firms which had recorded net positive cash flows, and general increases in financial performance, net assets and other slack resources over the period. Interestingly this was the case between 2006-2011, hence in terms of the time period; the research design was further strengthened.
3.4 Data Sources and Instrumentation
The data for this research was obtained basically from both primary and secondary sources. The data collection method used for collecting this secondary data was the internet. Secondary sources of information, consisting of Annual and Sustainability Reports of listed Companies, books, journals, and other scholarly articles and publications that were related to the subject matter were gathered and thoroughly reviewed. Secondary data on financial performance proxies and CSR were in their raw formats and had not been subject any processing; hence there was the need to carry out specific calculations and computations. Primary data was obtained through the administration of questionnaire, which was specifically used to measure organizational culture. In addition, annual reports of companies were exclusively used for measuring all the other proxies of the variables, namely financial performance, corporate social responsibility, and intangible assets (human capital, innovation, reputation and competitive advantage) together with the control variables (size, age, risk, and advert) which is in agreement with that of other researchers such as Deegan and Rankin (1997).
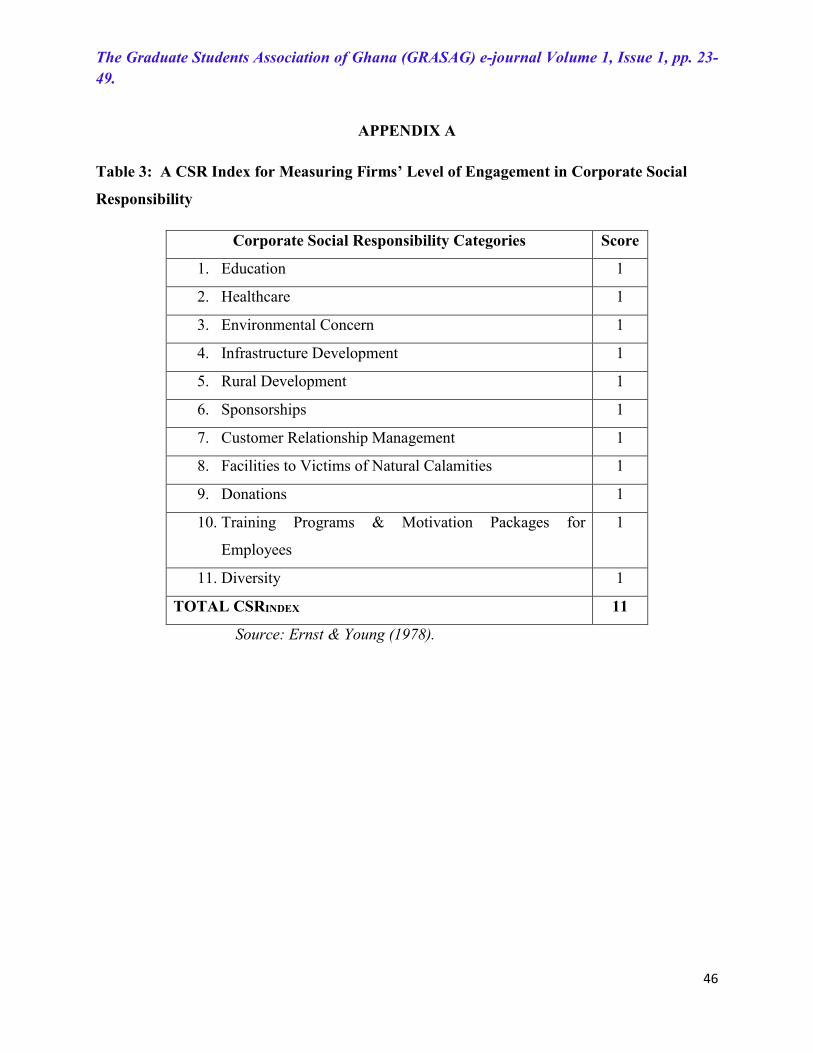
3.5 Variables Description and Measurement Corporate Social Performance (CSP): Variable that measures firms’ commitment to CSR activities as computed by the CSR Score. CSR was measured by constructing an appropriate index, taking into consideration, the eleven dimensions/areas which were finalized on the basis of different aspects covered by KLD and Fortune Magazine. These are: education, health care, environment, infrastructure development, rural development, sponsorships, job opportunity, and facilities to the victims of natural calamities, donations, and training programs for employees, and diversity (reservation of posts for disabled persons, women empowerment, etc.). By following a technique, similar to the one adopted by Ernst and Young (1978), one point was assigned to each dimension/ area of CSR. For instance, if a company is engaged in five areas of social responsibility, it is assigned five points. On this basis, CSR index would be constructed, as shown in Table 3, Appendix A. This proxy measuring corporate social responsibility, also known as the Equal-Weighted CSRINDEX (EW), was calculated as the simple sum of scores for the N categories of the CSRINDEX. That is Equal-weighted CSRINDEX (EW) it = ∑ � �����
��� , where Xikt is the score for firm i, the CSR index category k for year t. In using the CSR index above, the number of categories would be N=11, hence the maximum score attainable by a firm on this category for a particular year was 11. On the EW CSR index, companies with higher value of index are said to be more socially responsible.
Return on assets (ROA): Variable that represents a firm’s Average return on assets from 2006-2011. Values are based on the following equation: ROA = profit before tax / total assets Return on sales (ROS): Variable that represents a firm’s average return on sales from 2006-2011.Values are based on the following equation: ROS = profit before tax / total sales
The Graduate Students Association of Ghana (GRASAG) e-journal Volume 1, Issue 1, pp. 23-
49.
34
Return on equity (ROE): Variable that represents a firm’s average return on equity from 2006-2011.Values are based on the following equation: ROE = profit after tax / total equity Financial Slack Resources (SLACKRES): Variable that represents a firm’s total cash flow from operating, investing and financing activities expressed as a ratio of its total assets i.e., SLACKRES =net cash flow from operating, investing and financing activities/total assets from 2006-2011. Firm Size (In TA): Variable that represents a firm’s average total assets from 2006-2011, after taking the natural logarithm of the original values. Firm Size (In TS): Variable that represents a firm’s average total sales from 2006-2011, after taking the natural logarithm of the original values. Risk (RISK): Variable that represents a firm’s average risk from 2006-2011. Values are based on the following equation: RISK = total long term debt / total assets. Firm Age (AGE): AGE = Number of years since a firm’s initial public offering up to 2011 Firm Advertising (ADVERT): ADVERTISING = (selling, general, and administrative expenses)/Total sales from 2006-2011.
3.6 Measurement Proxies for Intangible Assets
Innovation: Innovation (INNOVit) was measured as the ratio of the book value of firms’ investments in new products/services and information technology (research and development) to total assets over the period of study. Thus mathematically, Innovation = book value of investments in new products/services + Technology (Research and Development)/total assets Human capital: Human capital (HUM.CAPit) was measured as the ratio of the book value of firms’ investments in human capital as represented by expenditures on employee training and development to total sales. Mathematically, Human capital = book value of expenses on employee training and development/total sales. Reputation: Firm reputation (REPUTATIONit), was measured as the natural log of average market capitalization of each firm over the period 2006-2011. Mathematically, Reputation = In (Market Capitalization). Competitive Advantage: Competitive Advantage (COMPET.ADVANTAGEit) was measured as the ratio between the natural log of market capitalization of a firm and the number of firms within a particular firm’s industry. Mathematically, Competitive advantage = Reputation = In (Market Capitalization)/N, where N= number of firms within a particular firm’s industry.
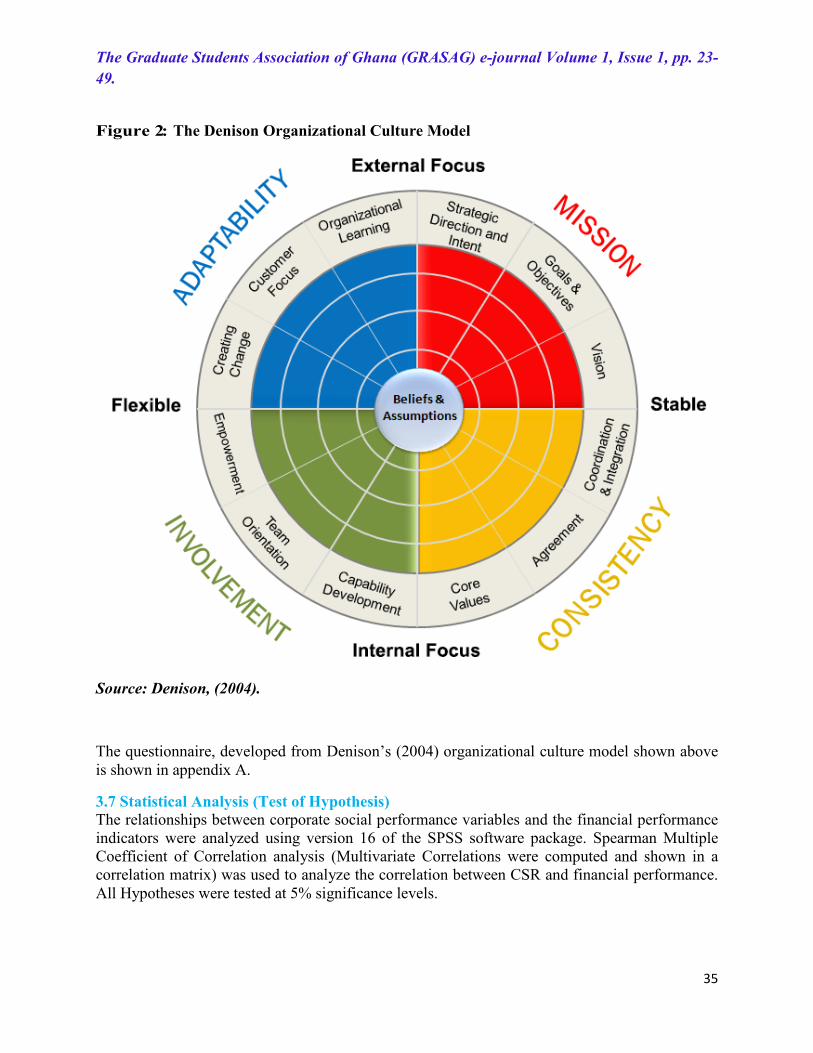
Organizational Culture: Organizational culture (ORG.CULTUREit) was measured as an aggregate score for each firm according to a questionnaire instrument developed by the author, after Denison’s (2004) organizational culture model shown in Appendix A:
The Graduate Students Association of Ghana (GRASAG) e-journal Volume 1, Issue 1, pp. 23-
49.
35
Figure 2: The Denison Organizational Culture Model
Source: Denison, (2004).
The questionnaire, developed from Denison’s (2004) organizational culture model shown above is shown in appendix A.
3.7 Statistical Analysis (Test of Hypothesis) The relationships between corporate social performance variables and the financial performance indicators were analyzed using version 16 of the SPSS software package. Spearman Multiple Coefficient of Correlation analysis (Multivariate Correlations were computed and shown in a correlation matrix) was used to analyze the correlation between CSR and financial performance. All Hypotheses were tested at 5% significance levels.

The Graduate Students Association of Ghana (GRASAG) e-journal Volume 1, Issue 1, pp. 23-
49.
36
4. SUMMARY OF RESULTS AND DICUSSIONS
Corporate social responsibility (CSR) that is the extent to which corporations integrate social and environmental concerns into their business bottom–line is currently a topical issue. Several studies have been conducted to explore various aspects of the subject matter such as its relationship with financial performance; however the research findings are mixed. Yet in Ghana only few studies have sought to examine the relationship between corporate social responsibility and financial performance, therefore this current study is even more relevant. The main objective of this study was to empirically examine the nature of the relationship between investments in Corporate Social Responsibility and Financial performance amongst selected firms listed on the Ghana Stock Exchange under slack resources theory. This current study developed a theoretical framework based on the slack resources theory and introduced an additional financial measurement proxy, slack resource (SLACKRES), in addition to what previous studies made use of namely return on assets (ROA), return on sales (ROS) and return on equity (ROE). 4.1 Relationship between and Corporate Social Responsibility and Financial Performance Indicators under Slack Resources Theory The study found corporate social responsibility to be more positively and strongly related to financial slack resources than it was to return on sales and return on assets(See Table 4,below). This implies the following : Firstly, under slack resources theory, corporate social responsibility initiatives/activities is more likely to be associated with firms possessing excess financial slack resources, mainly in the form of positive cash flows from operating, financing and investing activities. Secondly, an effective and efficient management coupled with a superior sale and marketing strategy are required to convert available slack resources into superior financial performance. In other words firms possessing excess positive net cash flows at their disposable, having a skillful, an effective and efficient management and a strategic human capital base (sales force) are much more expected to engage in CSR than firms possessing relatively limited amounts of these resources. The main mechanism involved here might also relate to firm size, firm age, competitive advantage and management skill and experience. Older, larger firms are more likely to be found engaging in CSR initiatives because they are more likely to possess abundant slack resources and market experience (See Table 4 below). A skillful and experienced management, which possesses a good knowledge of the market dynamics stand in a better strategic position to make use of the slack resources of their firm to improve their financial performance, through increasing innovative capacity, human capital development and sustained competitive advantage, the ultimate goal being the efficient and effective utilization of firm assets and the creation of positive returns. This line of thinking appears to be consistent in part to the findings of Solomon and Hansen, (1985); Pava and Krausz, (1996); Preston and O’Bannon, (1997) and Griffin and Mahon, (1997) who found that investments in corporate social responsibility have a big return in terms of image and overall financial result, measured as return on assets and return on sales, asserting further, that the related benefits associated with CSR investments are in fact bigger than the related costs. Roberts and Dowling, (2002); Fombrun, Gardberg and Barnett (2000); Porter and Van Der Linde (1995) and Spicer (1978), posit that CSR initiatives can lead to reputational advantage as improvements in

The Graduate Students Association of Ghana (GRASAG) e-journal Volume 1, Issue 1, pp. 23-
49.
37
invested trust, new market opportunities and positive reactions of capital market would enhance organization’s financial performance. Moreover the finding on a positive relationship between corporate social responsibility(CSPit) and financial performance (ROAit, ROSit and SLACKRESit), partly agrees with findings of other studies, such as Guerard, (1997); Griffin & Mahon (1997); Orlitzky, Schmidt & Ryes, (2003); Derwall, Guenster, Bauer & Koedijk, (2005); and Flammer (2013), who argue that investments in CSR will lead to positive financial performance over the medium to long-term due to the impact of corporate social responsibility on reputation and brand and the attractiveness of such companies to high quality managers and employees. On the contrary CSR was found to be negatively related to return on equity (See Table 4 below). This indicated that embarking on corporate social investments, through human capital training and development, improvements in innovative capacity and enhancement of competitive advantage by increasing advertising intensity of firms may constitute a cost, representing excessive spending in terms of selling, general and administrative expenses which could result in erosion of shareholder wealth. Arguing along this line it could be asserted that possession of excess financial slack by a firm may have some negative connotations on financial performance, which is consistent with arguments put up by earlier researchers, who have viewed financial slack as both creating funding opportunities for innovation, as well as encouraging wasteful, undisciplined spending that hurts innovation outcomes. These researchers suggest that too little slack may inhibit experimentation leading to innovation, while too much slack may lead to diminishing returns, or accelerating diminishing returns, as a consequence of undisciplined spending and improper oversight of innovation projects (Bourgeois, 1981; Nohria & Gulati, 1996; Geiger & Cashen, 2002). To extend this argument further, this study postulates further that the use of CSR to achieve innovation, enhance human capital development and achieve competitive advantage through increased advertising intensity, by making use of available financial slack, may constitute erosion of shareholder wealth (as measured by return on equity) if is not accompanied by strict managerial discipline and desire to fulfill shareholder interests. In this regard, therefore it may be argued that CSR may represent a managerial tool for either satisfying managerial interests (as postulated by agency theory), being underpinned by managerial opportunism or it may be a reflection of managerial entrenchment tendencies. This line of reasoning agrees in part with that of O’Bannon and Preston (1997) who explained the negative CSR-FP relationship as relating to managers’ pursuit of private goals, for instance benefiting from remuneration schemes, which is linked to short-term financial performance. These managers are less likely to invest in CSR because these investments will not pay off in the short-term and would endanger managerial compensation. The temptation here is that managers might cash into the firms’ financial slack resources, reducing CSR investments, leading to a negative CSR-FP relationship. Goss and Roberts and Dowling (2002); reason in a similar way: managers that want to polish their reputations may do so at the expense of shareholders, as it could lead such opportunistic managers to utilize shareholder funds, resulting in a negative effect on ROE.
The Graduate Students Association of Ghana (GRASAG) e-journal Volume 1, Issue 1, pp. 23-
49.
38
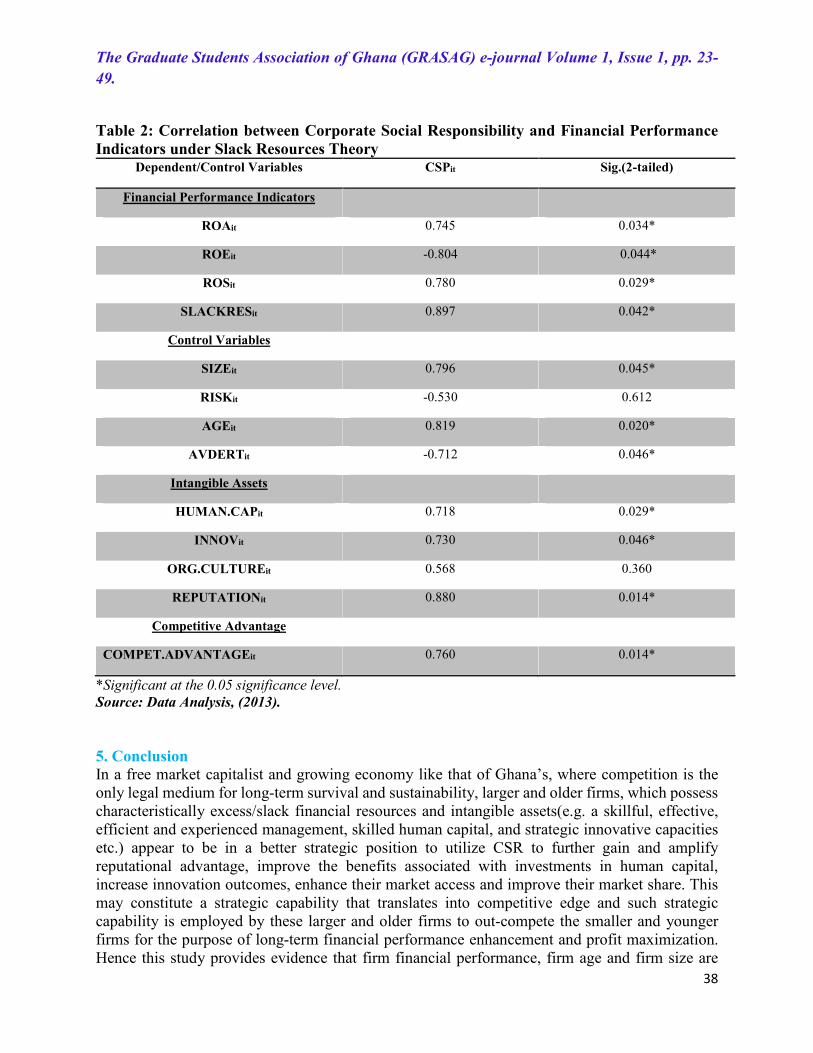
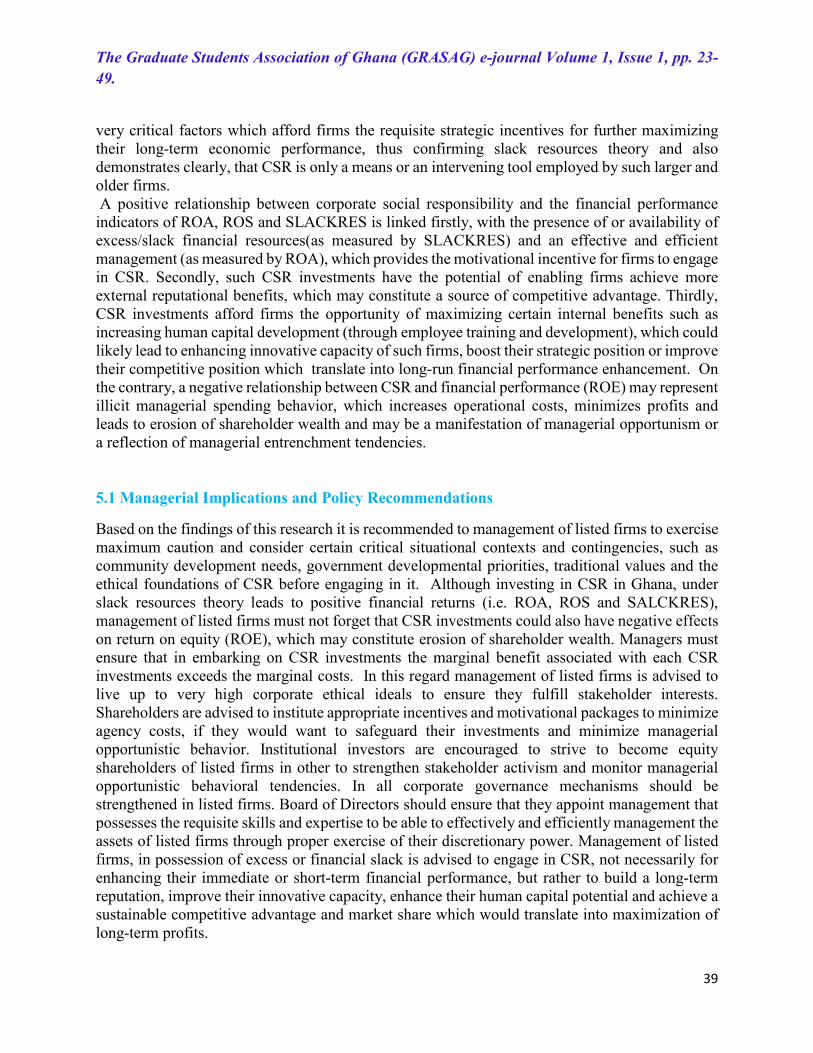
Table 2: Correlation between Corporate Social Responsibility and Financial Performance Indicators under Slack Resources Theory
Dependent/Control Variables CSPit Sig.(2-tailed)
Financial Performance Indicators
ROAit 0.745 0.034*
ROEit -0.804 0.044*
ROSit 0.780 0.029*
SLACKRESit 0.897 0.042*
Control Variables
SIZEit 0.796 0.045*
RISKit -0.530 0.612
AGEit 0.819 0.020*
AVDERTit -0.712 0.046*
Intangible Assets
HUMAN.CAPit 0.718 0.029*
INNOVit 0.730 0.046*
ORG.CULTUREit 0.568 0.360
REPUTATIONit 0.880 0.014*
Competitive Advantage
COMPET.ADVANTAGEit 0.760 0.014*
*Significant at the 0.05 significance level. Source: Data Analysis, (2013). 5. Conclusion In a free market capitalist and growing economy like that of Ghana’s, where competition is the only legal medium for long-term survival and sustainability, larger and older firms, which possess characteristically excess/slack financial resources and intangible assets(e.g. a skillful, effective, efficient and experienced management, skilled human capital, and strategic innovative capacities etc.) appear to be in a better strategic position to utilize CSR to further gain and amplify reputational advantage, improve the benefits associated with investments in human capital, increase innovation outcomes, enhance their market access and improve their market share. This may constitute a strategic capability that translates into competitive edge and such strategic capability is employed by these larger and older firms to out-compete the smaller and younger firms for the purpose of long-term financial performance enhancement and profit maximization. Hence this study provides evidence that firm financial performance, firm age and firm size are
The Graduate Students Association of Ghana (GRASAG) e-journal Volume 1, Issue 1, pp. 23-
49.
39
very critical factors which afford firms the requisite strategic incentives for further maximizing their long-term economic performance, thus confirming slack resources theory and also demonstrates clearly, that CSR is only a means or an intervening tool employed by such larger and older firms. A positive relationship between corporate social responsibility and the financial performance indicators of ROA, ROS and SLACKRES is linked firstly, with the presence of or availability of excess/slack financial resources(as measured by SLACKRES) and an effective and efficient management (as measured by ROA), which provides the motivational incentive for firms to engage in CSR. Secondly, such CSR investments have the potential of enabling firms achieve more external reputational benefits, which may constitute a source of competitive advantage. Thirdly, CSR investments afford firms the opportunity of maximizing certain internal benefits such as increasing human capital development (through employee training and development), which could likely lead to enhancing innovative capacity of such firms, boost their strategic position or improve their competitive position which translate into long-run financial performance enhancement. On the contrary, a negative relationship between CSR and financial performance (ROE) may represent illicit managerial spending behavior, which increases operational costs, minimizes profits and leads to erosion of shareholder wealth and may be a manifestation of managerial opportunism or a reflection of managerial entrenchment tendencies. 5.1 Managerial Implications and Policy Recommendations
Based on the findings of this research it is recommended to management of listed firms to exercise maximum caution and consider certain critical situational contexts and contingencies, such as community development needs, government developmental priorities, traditional values and the ethical foundations of CSR before engaging in it. Although investing in CSR in Ghana, under slack resources theory leads to positive financial returns (i.e. ROA, ROS and SALCKRES), management of listed firms must not forget that CSR investments could also have negative effects on return on equity (ROE), which may constitute erosion of shareholder wealth. Managers must ensure that in embarking on CSR investments the marginal benefit associated with each CSR investments exceeds the marginal costs. In this regard management of listed firms is advised to live up to very high corporate ethical ideals to ensure they fulfill stakeholder interests. Shareholders are advised to institute appropriate incentives and motivational packages to minimize agency costs, if they would want to safeguard their investments and minimize managerial opportunistic behavior. Institutional investors are encouraged to strive to become equity shareholders of listed firms in other to strengthen stakeholder activism and monitor managerial opportunistic behavioral tendencies. In all corporate governance mechanisms should be strengthened in listed firms. Board of Directors should ensure that they appoint management that possesses the requisite skills and expertise to be able to effectively and efficiently management the assets of listed firms through proper exercise of their discretionary power. Management of listed firms, in possession of excess or financial slack is advised to engage in CSR, not necessarily for enhancing their immediate or short-term financial performance, but rather to build a long-term reputation, improve their innovative capacity, enhance their human capital potential and achieve a sustainable competitive advantage and market share which would translate into maximization of long-term profits.

The Graduate Students Association of Ghana (GRASAG) e-journal Volume 1, Issue 1, pp. 23-
49.
40
In addition, Ghanaian firms are advised to engage in CSR activities with a purely ethical motive; to contribute towards the good of society, improve upon the social and environmental conditions of the less privileged in society, through the provision of opportunities for the less educated, poor communities, i.e., the sick and the disadvantaged in society. Firms should do so with the understanding that though they may not gain immediate financial returns from such ethical or philanthropic initiatives yet such CSR activities however, may contribute to sustainable development and improved livelihoods, which in turn could lead to increased productivity, improved infrastructural development and reduced illiteracy rate (through the provision of educational sponsorships). Again, investing in such purely ethical CSR activities has the potential of increasing life expectancies (through investing in health initiatives), the overall effect, being to enhance economic growth and sustainable development.
Furthermore, larger, older and more profitable firms should be more socially and environmentally responsible in helping propel national economic development agenda as they are in better position to do so; the wealth of their managerial skill and experience, competent human capital resource, excellent innovative capacities, and presence of abundant slack financial resources (excess cash flows and abundant assets) and other intangible resources (good brand, reputational advantage, and increased market share, etc.) put them in a better position to be more socially responsible(without necessarily eroding their shareholder wealth and minimizing their profitability in the long- run) than younger and smaller firms would be able to do. Government is advised to formulate and implement a nation-wide CSR policy which takes into consideration the profitability of the firm, age of the firm and its size (that is total assets it possess) and compel them to contribute more to national economic development agenda, through requesting them to pay a CSR premium, since these larger, older and resource-rich firms are in a better position to embark on CSR investments than smaller, younger, less resource-rich firms might be able to accomplish. 5.2 Limitations of Study and Areas of further Research The study was limited in terms of the sample size used, the time frame for the study and the relative difficulty of obtaining the requisite information in time. Financial constraints were another major limitation of this study. These limitations however do not in any way affect the validity of the findings.
In furtherance of research work on corporate social responsibility and firm financial performance, considerable efforts should be made towards increasing the sample size of firms and number of years for data analysis to present a fair view of findings. This study used data over a period of 6years (2006-2011), which may limit the findings of this research, but again the problem here is the availability of data. It appears that data management in Ghana is very poor, thus making research generally very difficult and sometimes quite frustrating. Further studies should specifically examine the following:
1. Assess the relationship between firm age and its economies of scope, economies of scale, brand image and reputational image.

The Graduate Students Association of Ghana (GRASAG) e-journal Volume 1, Issue 1, pp. 23-
49.
41
2. Test the relationship between corporate social responsibility and financial performance underpinned by the virtuous cycle theory, managerial opportunism hypothesis and curvilinear relationship theory, with much greater sample size as this could lead to very interesting findings.
3. Investigate whether CSR activities reported by firms are exactly what they engage in. 4. Develop a universal measurement proxy for assessing Corporate Social Responsibility. 5. Examine the relationship between CSR and financial performance using market
performance ratios such as Tobin’s Q, Market price per share, Dividend per share etc., instead of the accounting ratios of ROA, ROE, ROS and slack resources used in this research.
6. Test the likelihood of a contingency theory as that might best explain the relationship between corporate social responsibility and financial performance.
7. Develop an economic model the could be used to predict the level of slack financial resources possessed by firms at which CSR investments would minimize marginal costs and maximize marginal benefits as this could enable Management of firms adopt a more scientific/quantitative approach to making efficient and effective decisions on CSR investments, instead of just relying on managerial discretion, which is purely intuitive in nature.
8. Critically assess the potential of CSR investments/contributions as a strategic tool to poverty reduction, economic growth enhancement and sustainable development maximization.
The Graduate Students Association of Ghana (GRASAG) e-journal Volume 1, Issue 1, pp. 23-
49.
42
REFERENCES Alexander, G.J., & Buchholz, R.A. (1978). Corporate Social Responsibility and Stock Market Performance. Academy of Management Journal, 21(3), 479-486. http://dx.doi.org/10.1016/0304-405X(88)90053-0
Aupperle, K., Carroll, A., & Hatfield, J. (1985). An Empirical Examination of the Relationship between Corporate Social Responsibility and Profitability. Academy of Management Journal, 28, 446-463. Retrieved May 26, 2010 from http://ssrn.com/abstract=221350ordoi:10.2139/ssrn.221350.
Barnett, M., & Solomon, R.M. (2006). Beyond Dichotomy: The Curvilinear Relationship Between Social Responsibility and Financial Performance. Strategic Management Journal, 27(11), 1101-1122. http://dx.doi.org/10.1111/1467-6486.00252 Bourgeois, L. J. (1981). On the Measurement of Organizational Slack. Academy of Management Review 6: 29-39. http://dx.doi.org/10.1111/j.1467-6486.1992.tb00672.x
Bragdon, J., & Marlin, J. (1972). Is Pollution Profitable? Risk Management, 19(1), 9–18. http://dx.doi.org/10.1108/00251749910274234
Brammer, S., Brooks, C., & Pavelin, S. (2006). Corporate Social Performance and Stock Returns: Evidence From Disaggregate Measures, Financial Management, 35 (1), 97–116. http://ssrn.com/abstract=221350ordoi:10.2139/ssrn.221350
Carroll, A. B. (1991). The Pyramid of Corporate Social Responsibility: Toward the Moral Management of Organizational Stakeholders. Business Horizons, 34(1), 39–48. Carroll, A., & Bocholt, A. (2003). Business and Society: Ethics and Stakeholder Management, 5th Edition. Cincinnati, Ohio South Western College Publishing, Australia.
Deegan, C., M. & Rankin (1997). Firms’ Disclosure Reactions to Major Social Incidents: Australian Evidence‟, Accounting Forum, Vol.24, No.1, pp.101–130
Derwall, J., Guenster, N., Bauer, R., & Koedijk, C. G. (2005). The Eco–Efficiency Premium Puzzle, Financial Analysts Journal, 61(1), 51–63. http://dx.doi.org/10.1177/014920639602200303
Davidson G., Coetzee M., & Visser, D. (2010). Organizational Culture and Financial Performance
in a South African Investment Bank. SA Journal of Industrial Psychology, 33 (1), 38-48. Retrieved
on 25/04/12 from http:// www.academy.business.africa.edu/ji?
The Graduate Students Association of Ghana (GRASAG) e-journal Volume 1, Issue 1, pp. 23-
49.
43
Demacarty, P. (2009). Financial Returns of Corporate Social Responsibility and the Moral
Freedom and Responsibility of Business Leaders. Business and Society Review, 114(3), 393-433.
Retrieved on 05/07/12 from http:// www.academy.business.africa.edu/ji?
Ernst & Young (1978). Social Responsibility Disclosure, Ernst & Ernst, Cleveland, Ohio, USA. Fama, E. (1985), “What’s different about banks?”, Journal of Monetary Economics 15, 29-39.
Flammer, C. (2013). Does Corporate Social Responsibility lead to Superior Financial Performance? A Regression Discontinuity Approach, Unpublished Dissertation Submitted To The MIT Sloan School Of Management. The Journal of Contemporary Management, 20(4), 332-360. http://dx.doi.org/1929-0128-2013-01-17-21
Fombrun, C. J., Gardberg, N. A., & Barnett, M. L. (2000). Opportunity Platforms and Safety Nets: Corporate Citizenship and Reputational Risk, Business and Society Review 105(1), 85–106. http://dx.doi.org/10.1111/j.1467-8683.2004.00367.x
Friedman, M. (1970, September 7). Social Responsibility of Business. New York Times Magazine 159 (3), 53. Fu G., Wang, J., & Jia, M. (2012). The Relationship between Corporate Social Performance and Financial Performance: Modified Models and their Application: Evidence from Listed Companies in China. The Journal of Contemporary Management, 20(4), 200-205. http://dx.doi.org/ 1929-0128-2013-01-17-21jpj? 1? 23
Geiger, S. W., & Cashen, L. H. (2002). A Multidimensional Examination of Slack and its Impact on Innovation. Journal of Managerial Issues 14(1),68-84. Ghana Stock Exchange (2012). Company Annual Reports. Downloaded from www.annualreportsghana.com Griffin, J. J., & Mahon, J. F. (1997). The Corporate Social Performance and Corporate Financial Debate: Twenty-Five Years of Incomparable Research, Business and Society, 36(1), 5–31.
Guerard, J. B. (1997). Is there a Cost to being Socially Responsible in Investing? Journal of Business Ethics, 84(4), 325–339.
Iqbal, N., Ahmad, N., & Nadeem, M. (2012). Impact of Corporate Social Responsibility on Financial Performance of Corporations: Evidence from Pakistan. International Journal of Learning & Development, Vol. 2(6), 34-50.

The Graduate Students Association of Ghana (GRASAG) e-journal Volume 1, Issue 1, pp. 23-
49.
44
Jensen, M. C. (1993). The Modern Industrial Revolution, Exit, and the Failure of Internal Control Systems. Journal of Finance 48(1), 831-880.
Jones, T. M. (1995). Instrumental Stakeholder Theory: A Synthesis of Ethics and Economics. Academy of Management Review, 20(2), 404-437.
Knoll, M. S. (2002). Ethical Screening in Modern Financial Markets: The Conflicting Claim. Journal of Finance 48(2), 675-689. Langbein, J. H., & Posner, R. A. (1980). Social Investing and the Law of Trusts. Michigan Law Review, 79(1), 72–112.
McGuire, J. B., Scheneeweiss, T., & Branch, B. (1990). Perception of Firm Quality: A Cause or Result of Firm Performance. Journal of Management, 16(1), 167-180.
McGuire, J. B., Sundgren, A. & Schneeweis, T. (1988). Corporate and Social Responsibility and Firm Financial Performance. Academy of Management Journal, 31(1), 854-872.
Miles, M. P., & Covin, J. G. (2000). Environmental Marketing: A Source of Reputational, Competitive, and Financial Advantage. Journal of Business Ethics; 23(3), 299 – 311.
Miles, M. P., Munilla, L. S., & Russell, G. R. (1997). Marketing and Environmental Registration/Certification: What Industrial Marketers Should Understand about ISO 14000. Industrial Marketing Management, 26, 363-370.
Miles, M. P., Russell, G. R. (1997). ISO 14000 Total Quality Environmental Management: The Integration of Environmental Marketing, Total Quality Management and Corporate Environmental Policy. Journal of Quality Management, 2(1), 151-168
Nohria, N., & Gulati, R. (1996). Is Slack Good or Bad for Innovation? Academy of Management Journal 39 (5), 1245-1264. Orlitzky, M., Schmidt, F. L., & Rynes, S. L. (2003). Corporate Social and Financial Performance: A Meta-Analysis. Organization Studies, 24(1), 403–441. Pava, L. & Krausz, J. (1996). The Association between Corporate Social Responsibility and Financial Performance. Journal of Business Ethics, 15(1), 321-357. Porter M. E., & Van Der Linde, C. (1995). Green and Competitive: Ending the Stalemate, Harvard Business Review, 73 (5), 121-134. Preston, L. E., & O‟ Bannon, D. P. (1997). The Corporate Social-Financial Performance Relationship: A Typology and Analysis, Business and Society, 36 (4), 419-429.
The Graduate Students Association of Ghana (GRASAG) e-journal Volume 1, Issue 1, pp. 23-
49.
45
Roberts, P. W., & Dowling G. R. (2002). Corporate Reputation and Sustained Superior Financial Performance. Strategic Management Journal, 23(1), 1077–1093. DOI: 10.1002/Smj.274. 2012.07.23. Riahi-Belkaoui, N. (1992). Relationship between External Perceptions of a Company’s CSR
Activities and Managerial Compensation. Business and Society Review, 114(3), 393-433.
Skudiene, V., Mcclatchey, C., & Kancleryte, A. (2013). Strategic Versus Ad-Hoc Corporate Social Performance: An Analysis of CSP Maturity and its Relationship to Corporate Financial Performance, Journal of Management and Sustainability, 3(1), 45-78.
Soloman, R., & Hansen, K. (1985). Is Corporate Social Responsibility Good Business? Atheneum, New York, Journal of Business Ethics, 44(1), 107-119. Spicer, B. H. (1978). Investors, Corporate Social Performance and Information Disclosure: An Empirical Study. Accounting Review, 53(1), 94–110. SPSS 16 for Windows Evaluation Version 15.0 (2006). LEAD Technologies, Inc. Statman, M. (2000). Socially Responsible Mutual Funds, Financial Analysts Journal, 56(1), 30–9.
Ullman, A. A. (1985). Data In Search of a Theory: A Critical Examination of the Relationships among Social Performance, Social Disclosure, and Economic Performance of U. S. Firms. The Academy of Management Review, 10(3), 540-557. Vance, S. C. (1975). Are Socially Responsible Corporations Good Investment Risks? Management Review, 64(1), 18–24. Waddock, S. A., & Graves, S. B. (1997). The Corporate Social Performance-Financial Performance Link. Strategic Management Journal, 18(4), 303-319.
The Graduate Students Association of Ghana (GRASAG) e-journal Volume 1, Issue 1, pp. 23-
49.
46
APPENDIX A
Table 3: A CSR Index for Measuring Firms’ Level of Engagement in Corporate Social
Responsibility
Corporate Social Responsibility Categories Score
1. Education 1
2. Healthcare 1
3. Environmental Concern 1
4. Infrastructure Development 1
5. Rural Development 1
6. Sponsorships 1
7. Customer Relationship Management 1
8. Facilities to Victims of Natural Calamities 1
9. Donations 1
10. Training Programs & Motivation Packages for
Employees
1
11. Diversity 1
TOTAL CSRINDEX 11
Source: Ernst & Young (1978).

The Graduate Students Association of Ghana (GRASAG) e-journal Volume 1, Issue 1, pp. 23-
49.
47
APPENDIX B
QUESTIONNAIRE FOR MEASURING ORGANIZATIONAL CULTURE
QUESTION YES =2
NO=1 DON’T KNOW
=0 1. Core Beliefs and Assumptions
Does Your organization run with certain core beliefs and assumptions?
2. Involvement is about building employees capability, ownership, and responsibility. Your organization’s score on this trait reflects how much the organization focuses on developing, informing, involving your people and getting them engaged.
i. Empowerment: Are your people empowered with
real responsibility? ii. Sense of Ownership : Have management created a
sense of ownership and initiative? iii. Team orientation: Is Value is placed on working
cooperatively towards common goals? iv. Capability development: Do you continually invest in
the development of your employees’ skills to stay competitive, meet ongoing business needs, and meet employees desire to learn and develop?
3. C o n s i s t e n c y is to examine whether you have a strong and cohesive internal culture.
i. Core Values: Does your company have a shared set of values that creates a strong sense of identity and a clear set of expectations among organization members?
ii. Agreement: Are leaders skilled enough to achieve high agreement and reconcile different opinions on critical issues?
iii. Coordination & Integration: Do different functions and units of the organization work together well?
iv. Do departmental or group boundaries interfere with cooperation?
4. Adaptability is focusing on an organization’s ability of adapt quickly to the signals from the external environment, including customers and the marketplace.
i. Creating Change: Is your organization afraid of taking risks to create change?

The Graduate Students Association of Ghana (GRASAG) e-journal Volume 1, Issue 1, pp. 23-
49.
48
ii. Continual Improvement: Are you learning to read the business environment, envision changes in process and procedures, and make timely change?
iii. Customer Focus: Adaptable organizations are driven by their customers; are you able to understand your customers, satisfy them and anticipate their future needs?
iv. Organizational Learning: Can you interpret the signals from the environment into opportunities for encouraging innovation and gaining knowledge?
Mission: Successful organizations have a clear sense of purpose that defines long-term directions. The Mission trait is useful in identifying whether you are in danger of shortsightedness or you are equipped with systematically defined strategic and action plans.
i. Mission statement and Statement of core values : Does your organization have a clear mission statement and statement of core values?
ii. Vision: Do you have a shared view of a desired future state? Is that vision understood and shared by all in the organization?
iii. Strategic Direction & Intent: Are you planning to .make your mark. In your industry? Are there clear strategic intentions convey the organization’s purpose and make it clear how everyone can contribute.
iv. Goals & Objectives: Is a clear set of goals and objectives linked to the mission, vision, and strategy adequately provided so that everyone could draw as reference in their own work?
Source : Author,(2013) after The Denison Organizational Culture Model,(2004).