the good childhood report 2013 - the children's society€¦ · the good childhood report 2013...
TRANSCRIPT

The Good Childhood Report 2013 | 1
The Good Childhood Report 2013
A better childhood. For every child. www.childrenssociety.org.uk

2 | The Good Childhood Report 2013
This report is the product of an ongoing collaboration between The Children’s Society and the University of York. The report summarises work conducted by the joint research team:
Gwyther Rees, Haridhan Goswami and Larissa Pople, The Children’s Society
Jonathan Bradshaw, Antonia Keung and Gill Main, University of York
Further details of the research programme as a whole, including additional publications, can be found at:
www.childrenssociety.org.uk/well-being
If you have any queries about the report or the research programme, please email The Children’s Society’s Research Team at: [email protected]
© The Children’s Society, 2013

The Good Childhood Report 2013 | 3
Contents
1 Introduction 4
2 Children’swell-being:concepts,variationsandtrends 7
3 Thebackgroundtochildren’swell-being 19
4 Whatcanbedonetoimprovechildren’swell-being 30
5 Conclusions 46
References 48
Appendix1:Theresearchprogramme 51
Notes 54

4 | The Good Childhood Report 2013
1 Introduction
Children’s well-being remains an important issue of debate in the UK. The recent UNICEF Report Card 11 (UNICEF Office of Research, 2013) showed some improvements in aspects of children’s well-being in the UK up to 2010, although there is still considerable room for further improvement in comparison with other wealthy countries. The media coverage of Report Card 11 also raised concerns that current national and global economic problems could adversely affect young people and put this progress at risk.
2013 presents a very different social and economic context to child well-being than when we started this programme of research in 2005. The economy was growing, employment was at a post-war peak, social expenditure on children was increasing with increases in health, education and childcare spending. Child poverty and deprivation were falling. In comparison, the latest official statistics on child poverty for 2011/12 estimate that absolute poverty has increased by two percentage points and the Institute for Fiscal Studies estimate that relative child poverty will increase from 17% to 24% by 2020.
This report will hopefully make a timely addition to this ongoing debate. It provides an update on research and analysis we have undertaken in the 18 months since the publication of The Good Childhood Report 2012. In the conclusion to last year’s report we identified some priorities for future research on children’s well-being. These were:
1. To explore in more detail the well-being of specific sub-groups of children who may not be well represented in general population surveys
2. To undertake research that explores the connections between well-being and other issues in children’s lives
3. To learn more about ways in which children’s well-being can be enhanced.
4. To continue to monitor children’s well-being, particularly in view of changes in our society.
This report contains important new evidence related to the latter three of these priorities.
At the same time, the report provides an opportunity to summarise what we have learned from the programme of research on children’s well-being that we started in 2005, placing our new findings within the context of what has become one of the most extensive programmes of research on children’s well-being so far conducted.
This introductory chapter therefore aims to provide an overarching narrative of the report while at the same time drawing attention to the key new findings contained within it.
Chapter 2 begins with a review of definitions, concepts and measures of children’s self-reported well-being. This includes a presentation of recent work we have been undertaking to extend the scope of our research to cover children’s psychological well-being (personal development and growth) as well as their subjective well-being (happiness and life satisfaction). We also discuss how these two different components of children’s well-being – subjective and psychological – can be used together to develop a picture of the extent to which children are ‘flourishing’. We estimate that around four-fifths of children aged 10 to 15 in the UK can be said to be flourishing in the sense of having reasonably high levels of life satisfaction and psychological well-being.
The chapter goes on to look at variations in well-being across sub-groups of children. We present some new work which extends the age range we have surveyed to include young people aged 16 and 17. Early findings from this work suggest that the steady decline in well-being observed in our previous research between the ages of eight and 15 may be halted and reversed from the age of 16 onwards. This is an important new insight and suggests that there needs to be a particular focus on the dip in well-being that appears to occur around the ages of 14 and 15 in particular.

We then turn to a set of other key questions about children’s well-being concerning trends and stability in levels of well-being. We present updated analysis of data from the youth questionnaire in the British Household Panel Survey which suggests some discernible trends in children’s satisfaction with some aspects of their lives between 1994 and 2011. We also present some new analysis from our own research which supports the idea that, at an individual level, children’s well-being is relatively stable over periods of time from three months to a year. This has important implications for the extent to which we view low well-being as an issue of concern.
Finally in Chapter 2 we provide a brief description, based on a re-analysis of earlier published findings, of what life is like for children with low levels of well-being. This evidence supports the idea that children’s well-being should be a matter of concern in its own right.
Given this evidence it is logical to try and understand what causes variations in well-being, and what can be done to prevent low well-being and to help children who experience it.
Chapter 3 explores the influence of situational factors on children’s well-being. In particular, it focuses on three issues that have emerged from our research programme as having the strongest associations with children’s life satisfaction. These are choice/autonomy, money/possessions and family relationships.
The issue of autonomy has regularly cropped up as an important factor in understanding variations in children’s life satisfaction. In this chapter we present new material from some recent qualitative research that we have undertaken with young people to explore this issue in more depth.
1 Introduction
6 | The Good Childhood Report 2013
In terms of money and possessions, an earlier publication from our research programme described the development of a new child-centred measure of material deprivation, and demonstrated that this measure was much more closely associated with children’s subjective well-being than measures of household prosperity (Main and Pople, 2011). The new analysis presented in this report extends previous findings by focusing on the well-being of the most deprived children, that is, those lacking five or more items from our 10-item material deprivation scale.
The final section in the chapter explores different dimensions of family relationships and how they affect children’s well-being. We present new analysis of the strength of the combined impact of family conflict and parental support on children’s life satisfaction. We then go on to highlight the additional relevance of parental autonomy-granting as a factor which influences children’s well-being. The analysis suggests that all three of these factors are important components in understanding the significant influence that family relationships have for children’s well-being.
Chapter 4 moves on to the question of what can be done to improve children’s well-being. We consider this question at a range of levels, from how children can help themselves, to how national policy needs to change.
One potential key source of information to inform national policy is international comparative work. There is a growing body of evidence about substantial cross-national variations in children’s objective and self-reported well-being. The recent publication by UNICEF mentioned earlier is an important source of information on variations in well-being amongst children in wealthy nations.
The chapter then goes on to consider the potential of local initiatives to improve children’s well-being. We describe some recent piloting work we have been doing with three local authorities in England to make use of measures of children’s self-reported well-being to inform local priorities for children. We also present some key findings from the first completed pilot. This pilot suggests that there is considerable potential for local authorities and other agencies to make use of localised data on children’s self-reported well-being for policy development.
Another key potential point of intervention to improve children’s well-being is services and professionals who work directly with children and young people. We present some initial findings from an analysis we have been undertaking of data from the Understanding Society survey, which suggests that well-being measures could form a useful part of monitoring children’s welfare and identifying those at risk, in addition to more commonly used measures of mental ill-health.
Finally in Chapter 4 we consider ways in which children themselves might be able to enhance their own well-being, and ways in which parents might be able to support them with this. We presents some initial findings from a study we are undertaking with nef (the new economics foundation) to extend the work they developed on ‘ways to well-being’ to include children. These early findings suggest that thenef framework (see Aked & Thompson, 2011) may also be applicable to children with some adaptation, and that actions such as ‘taking notice’ and ‘being active’ are associated with higher well-being in children.
We conclude the report, as we did last year, with some overarching comments and the identification of key future research priorities in the field of children’s self-reported well-being.
Statistical note
We have used a range of appropriate statistical tests to support the findings presented in this report. All differences identified as ‘significant’ in the report are based on accepted tests of statistical significance using a 99% confidence level. Because this is a non-technical report we have avoided using technical language regarding these tests in the main text, although some basic explanatory information is sometimes provided in footnotes and appendix. Full details of all the data sources are also provided in the appendix. Further details on the technical aspects of the research are available from The Children’s Society’s Research Team (see contact details at start of report).

The Good Childhood Report 2013 | 7
2 Children’s well-being: concepts, variations and trends
In this chapter we describe some key well-being concepts and how we have measured these concepts with children through our ongoing research programme. We then go on to describe some of the basic findings of our research in terms of how children evaluate their lives and how self-reported well-being varies for different sub-groups of children. We also look at evidence of recent trends in children’s self-reported well-being in the UK. The chapter then concludes with an exploration of the numbers of children who have low well-being and a discussion of what life is like for children in this situation.
Broadly speaking, well-being can be measured in two ways – either through objective living conditions or through asking people to evaluate their own lives.
The first approach – using social indicators – has been widely used. An example in relation to children is the recent UNICEF Report Card 11 (UNICEF Office of Research, 2013). This report compared countries using sets of indicators in five dimensions – material well-being (eg child deprivation rates), health and safety (eg infant mortality rates), education (eg school participation rates), behaviours and risks (eg percentage of children who are overweight) and housing and environment (eg average rooms per person).
The second approach – self-reported well-being – has also become common, particularly in research with adults. For example, the recent World Happiness Report (Helliwell et al, 2012) was able to compare adults’ self-reported well-being across a wide range of countries around the world. Also the Organisation for Economic Co-operation and Development (OECD)1 produces a ‘Better Life Index’ including an indicator of adult life satisfaction. In the UK, the Office for National Statistics (ONS), as part of its national well-being programme, has recently published its first annual experimental report on the subjective well-being of adults.2 It has also begun to publish annual reports on the well-being of children (Beaumont, 2013). UNICEF Report Card 11 included some child self-report measures (Bradshaw et al, 2013).
We will go on to discuss how we have developed questions to ask children to evaluate their own lives in the next section. However first, we briefly review some of the concepts that are commonly used to categorise different aspects of people’s self-reported well-being.
Although many different frameworks of self-reported well-being have been developed, some broad concepts are fairly well-established. First of all, there is a distinction between subjective (or ‘hedonic’) well-being (which focuses on happiness and satisfaction) and psychological (or ‘eudaimonic’) well-being (which focuses more on personal development and growth).
Subjective well-being is typically sub-divided into affective and cognitive components. The affective component is concerned with the experience of positive and negative emotions, which may typically be quite variable over time. The cognitive component is concerned with evaluations of one’s life overall (life satisfaction) or particular aspects of one’s life (domain satisfaction). These evaluations are thought to be more stable over time.
Psychological well-being is a complex concept. One well-known example of some of the different aspects of this component of well-being is Ryff’s model which consists of: self-acceptance, environmental mastery, positive relationships with others, autonomy, purpose in life, personal growth (Ryff, 1989).
What is well-being?

8 | The Good Childhood Report 2013
Figure 1 shows a visual depiction of these different components of self-reported well-being.
It should be clear from this very brief overview of key concepts that self-reported well-being is about far more than just ‘happiness’. It is a means of learning about how people feel about and evaluate the quality of their own lives in the present and the direction that they feel their lives may take in the future.
How can we measure children’s self-reported well-being?Historically there has been much more research asking adults about their well-being than children. However, in the last 20 years there have been attempts to extend the measurement of self-reported well-being to children and young people. For example Huebner (1994) in the US and Cummins and Lau (2005) in Australia have developed and validated questions to measure children’s self-reported well-being. Inevitably there are limitations on the use of these measures related to children’s levels of understanding, literacy and so on. But it is now widely accepted eg Casas (2011, 2012) in the field of well-being research that it is possible and valid to ask children and young people from at least the age of 10 upwards to report on aspects of their own well-being.
It is very important, however, to develop self-reported well-being measures that are appropriate and relevant to children’s lives and concerns. That is why the initial step in our well-being research programme, in 2005, was to ask young people what they thought was important for them to have a good life. In some cases it has proved possible simply to use the same questions that have been developed for adults, while in other cases this is inappropriate. We have therefore tested all the measures we describe in this report with children, both through individual and group discussions and through pilot surveys and statistical testing.
For each component of self-reported well-being it is possible to ask a single question, or a set of questions. There are competing advantages to these different options. Single questions have the advantage of brevity and of being quite general – allowing people to define the concept for themselves. Multi-item measures (sets of questions, the responses to which are added to create an overall score), on the other hand, take up more room on the survey questionnaire and tend to be more specific, but are more statistically reliable and stable and can facilitate more confident statistical analysis of patterns and differences. We have used both single-item and multi-item measures.
Well-being
‘Hedonic’ Subjective well-being
‘Eudaimonic’ Psychological
well-being
Affective Cognitive For example: • Self-acceptance • Environmental mastery • Positive relationships • Autonomy • Purpose in life • Personal growth
Life satisfaction
‘Domain’ satisfactions
Positive affect
Negative affect
Figure 1: Components of self-reported well-being
The Good Childhood Report 2013 | 9
Affect
We recently piloted questions about both positive and negative affect in focus groups with children aged 12 to 13. We found that children understood and felt comfortable to answer questions about positive affect (eg feeling happy or excited), but were less comfortable with questions about negative affect (such as feeling anxious or lonely). They felt that these questions could be experienced as intrusive or upsetting in a self-report survey. We need to explore this issue further, but in view of this feedback we have only so far used questions about positive affect in our recent survey work.
We have used a single question developed by the ONS in its work with adults. This question asks people how happy they felt yesterday, using a scale from zero to 10, where zero means ‘not at all happy’ and 10 means ‘completely happy’.
We have also used a longer set of questions, based on previous research on affect (eg Laurent et al, 1999) – see Figure 2.
Life satisfaction
Most recently, the main single-item measure of life satisfaction we have used is a question developed by the ONS and used in its recent research with adults (Office for National Statistics, 2011). This question asks people how satisfied they are with their life as a whole, using a scale from zero to 10, where zero means ‘not at all satisfied’ and 10 means ‘completely satisfied’.
The multi-item measure of life satisfaction we have used consists of five statements (eg ‘My life is going well’) to which children are asked to respond on a five-point scale from ‘strongly disagree’ to ‘strongly agree’ (see Figure 2). This is derived from a seven-item measure originally developed by Huebner (1994) in the US. Children’s responses to each question are coded on a scale from zero (‘strongly disagree’) to four (‘strongly agree’), with the score for the middle statement being reversed because it is negatively phrased. Then these scores are added together to create an overall scale from zero to 20.
We have also used domain-specific measures of life satisfaction. In particular, we developed (based on ideas from Cummins, 2005 and others) The Good Childhood Index consisting of the above overall life satisfaction measure and then a further 10 questions about satisfaction with particular domains. The domains covered in our index relate to: relationships with family; relationships with friends, time use, health, expectations of the future, home, things (money and possessions), school, appearance and amount of choice in life. Children are asked to respond to each item on an 11-point scale where zero denotes ‘very unhappy’ and 10 denotes ‘very happy’. (See Rees et al, 2010b for further information about the development of this index).
Psychological well-being
Finally, we have recently tested and used a number of measures of psychological well-being. This work has been exploratory because there has been very little research internationally that has attempted to develop measures of self-reported psychological well-being for children.
First we tested a single-item measure developed by the ONS for use with adults, which asks about the extent to which life feels ‘worthwhile’. We found that most children aged 11 to 15 understood this question, but that typically around 10% did not (this is higher than for questions about affect or life satisfaction).
Then, we also tested a further set of ONS questions used with adults (Office for National Statistics, 2011). We found that generally children found the wording of these questions a little complex or confusing. So we created simpler wordings for a number of the questions, examples of which are shown in Figure 2. Children were also asked to respond to these questions on a scale from zero to 10 where zero meant ‘totally disagree’ and 10 meant ‘totally agree’.
These pilot questions worked reasonably well and we have been doing further work to develop and refine a new self-report measure of children’s psychological well-being which we will be publishing as an extension of The Good Childhood Index later in the year.

10 | The Good Childhood Report 2013
Figure 2: Examples of self-report measures of different components of well-being
Positive affect Life satisfaction Psychological well-being
Sin
gle
ite
mM
ult
i-it
em
Overall, how happy did you feel yesterday?
Overall, how satisfied are you with your life nowadays?
Overall, to what extent do you think the things you do in your life are worthwhile?
How calm did you feel yesterday?
How excited did you feel yesterday?
How relaxed did you feel yesterday?
How full of energy did you feel yesterday?
My life is going well
My life is just right
I wish I had a different kind of life
I have a good life
I have what I want in life
plus ‘domain’ measures such as:
How happy are you with your health?
I feel that I am learning a lot at the moment
I feel that I am achieving things in my daily life
I feel that I have a sense of direction in life
I feel that I do things that are useful in my daily life
Well-being: How are children faring?Each of the above measures will provide a different perspective on how children are faring. As an illustration of the three key concepts of affect, life satisfaction and psychological well-being, Figure 3 shows children’s responses to the three ONS questions about feeling happy yesterday, feeling satisfied with life, and finding life worthwhile.
There are similar patterns in children’s responses to each question with most children rating their lives positively and the most common rating being eight out of 10. The mean scores for these three questions were also similar – being 7.2 for happiness yesterday, 7.4 for life satisfaction and 7.3 for finding life worthwhile. However, as can be seen from the chart, a higher proportion (10%) of children scored below the mid-point of five out of 10 for feeling happy yesterday than for feeling satisfied with life (5%) or finding life worthwhile (6%).
Statistical tests indicate that the associations between children’s answers to the above questions are not all that strong.3 This is also confirmed by statistical testing4 of the multi-item questions listed in Figure 2 which supports the idea that, as with adults, there are different components of children’s well-being.
Some further evidence of the distinction between these different components is provided by looking at time-related variations in well-being. As outlined earlier, theoretically we would expect that measures of affect – which are focused on recent emotions such as feeling happy – would be less stable than measures of life satisfaction or psychological well-being. Our recent surveys provide some evidence to support this theory. Figure 4 shows mean scores for these three questions, according to
25%
20%
15%
10%
5%
0%0 1 2 3 4 5 6 7 8 9 10
Figure 3: Children’s responses to different single-item measures of well-being
Source: Quarterly survey, Wave 7
Happy yesterday
Satisfied
Worthwhile
% o
f ch
ild
ren
ag
ed
8 t
o 1
5

The Good Childhood Report 2013 | 11
the day of the week on which children answered them. However because the happiness question was asked about yesterday, the days for this question reflect the day before the survey. It can be seen from this chart that while responses to the questions about life satisfaction and finding life worthwhile hardly vary at all by the day of the week when they were asked, there is more substantial variation in happiness yesterday – with scores being highest when children were referring to a weekend day. This observed pattern therefore matches theoretical expectations.
‘Flourishing’
The different components of well-being have been used by some researchers (eg Keyes, 2002) to arrive at estimates of the proportion of the population who can be said to be ‘flourishing’ – that is to score relatively well on different measures of well-being. We can apply this concept to the questions covered in Figure 3. For example, Figure 5 shows the proportion of children who did and did not score above the mid-point of five out 10 for the questions about life satisfaction and finding life worthwhile. Just over four-fifths (81%) of children scored above the mid-point for both questions. But only around 10% of children scored five or less out of 10 for both questions. This leaves 3% of children who scored highly for finding life worthwhile but not for life satisfaction and a further 6% who felt relatively satisfied with life but did not find life so worthwhile. This suggests that around four-fifths of children aged eight to 15 in the UK are ‘flourishing’ in the sense of being satisfied with their lives and finding their lives worthwhile.
However, the single-item measures discussed in this section have limitations as discussed earlier, and there is a need to develop better measures of children’s psychological well-being in particular than currently exist. We have begun to test sets of questions that might capture some of the psychological well-being concepts identified by Ryff (1989). Children’s responses to some questions of this type are shown in Figure 6:
• 85% of children felt that they were learning a lot at the moment. This type of question might be taken as an aspect of personal growth in Ryff’s categorisation.
• On the other hand, less than two-thirds (61%) felt that they had a sense of direction in life.
Me
an
sco
re
Happy Satisfied Worthwhile0
1
2
3
4
5
6
7
8
Figure 4: Children’s well-being on different days of the week
9
10
Mon Tue Wed Thu Fri Sat Sun
Score (out of 10)
0 to 5
6 to 10
Feeling satisfied with life
10%
6%
3%
81%
Finding life worthwhile
0 to 5 6 to 10
Figure 5: Overlap in low well-being using life satisfaction and wothwhile measures
Source: Quarterly survey, Wave 7
Source: Quarterly survey, Wave 7

12 | The Good Childhood Report 2013
Figure 6: Some potential measures of children’s psychological well-being
Disagree
I like being the way I am
I am good at managing my daily responsibilities
People are generally pretty friendly towards me
I have enough choice about how I spend my time
I feel that I have a sense of directon in life
I feel that I am learning a lot at the moment
Neither Agree
7% 14% 78%
16% 26% 58%
4% 9% 87%
11% 15% 73%
11% 28% 61%
5% 10% 85%
Source: Quarterly survey, Wave 9
Measures such as these could help to develop a much more rounded picture of children’s well-being and this is an important area for future research. However at this stage the majority of the data we have generated through our research programme has utilised measures of life satisfaction (overall and in specific domains) and most of the remainder of this report focuses on presenting new analysis using these measures of children’s well-being.
How stable is life satisfaction?
The main measure of children’s self-reported well-being we make use of throughout this report is the five-item measure of life satisfaction described above. We use the five questions in the measure to create an overall score of children’s life satisfaction from zero to 20, where higher scores indicate higher levels of satisfaction. Figure 7, which is reproduced from an earlier report, shows the distribution of children’s responses to this life satisfaction measure. Most children respond positively and the mean life satisfaction score is between 14 and 15 out of 20. Using this measure, around 10% of children aged eight to 15 score below the mid-point (10 out of 20) and can be said to have low well-being.
An important consideration in using this measure is to establish how stable and reliable it is. This issue often arises in well-being research in terms of the extent to which people’s evaluations of their own lives remain fairly constant over short periods, as would be expected conceptually, or are affected by transitory events or issues. This is important because stability of measures is generally an important requirement for their usefulness.
0 1 2 3 4 5 6 7 8 9 10 11 12 13 14 15 16 17 18 19 20
Figure 7: Children’s overall life satisfaction
% o
f ch
ild
ren
ag
ed
8 t
o 1
5
Overall well-being score (out of 20)
0%
2%
6%
10%
12%
14%
Source: Quarterly survey, Waves 1 to 5
8%
4%

The Good Childhood Report 2013 | 13
We have presented in a previous report (Rees et al, 2010a) some analysis of a ‘test-retest’ survey which covered the same young people at two points in time, a few weeks apart. We found that the multi-item measure of life satisfaction we were utilising met accepted requirements for stability over this type of period. Our recent research provides further examples about stability of this particular measure.
It has been possible for us to compare well-being scores for these children at two points in time. Overall, children who had low life satisfaction the first time that they participated in the survey had a 44% chance of also having low well-being the second time they participated (this would be between three and 15 months later). In comparison, children who did not have low well-being the first time had a 5% chance of having low well-being the second time. Not surprisingly, the link was stronger when the gap between the two surveys was shortest. But even where children took the second survey a year after the first survey, the link was still evident with 39% of children who had low well-being the first time also having a low well-being 12 months later. This evidence has some limitations because we cannot be sure that the children who took part on more than one occasion are representative of the general population.
Age variations in children’s well-beingContrary to what might be expected, the well-being of adults and children has only been found to vary by small amounts on the basis of characteristics such as age, gender, ethnicity and so on. In addition, other socio-demographic factors such as income levels and family structure have significant but relatively small associations with well-being. The analysis we published in The Good Childhood Report 2012 were in keeping with these findings, with individual and family factors only explaining a minority (less than 10%) of the variation in well-being.
For this reason, a key focus for our ongoing research on this issue has been to seek other explanations for the differences in children’s well-being observed in our surveys. We will present new findings in relation to this in Chapter 3.
However, our research has highlighted some important issues about age variations in well-being. It has also highlighted the fact that some particular marginalised sub-groups of children have much lower than average well-being. For example in last year’s report we reported that children who did not currently live with their family were around five times as likely to have low well-being as those who did live with their family. This finding has been supported by recent research on children in Spain (Dinisman et al, 2012).
In this section we present some new findings on the issues of age variations. Our previous research has found a significant link between children’s age and their well-being. Between the ages of eight and 15 children’s well-being declines significantly.
In the most recent wave of our quarterly survey, we decided to extend this analysis by including young people aged 16 and 17. We included a sample of 500 young people in this age group5 in the survey so it is possible to make some comparisons. Because of the relatively small numbers sampled in this age group we have combined both ages in the charts presented below.
Figure 8 shows mean levels of life satisfaction for different age groups. It can be seen that the mean level for young people aged 16 and 17 was a little higher than for those aged 15 and there were suggestions of a reversal of the age-related trend.
Me
an
lif
e s
ati
sfacti
on
8 9 10 11 12 13 14 15 16/17
Age
0
2
4
6
8
10
12
14
16 15.1 14.8 14.6 14.413.9 13.6 13.3 13.0 13.2
Source: Quarterly survey, Waves 1 to 10
Figure 8: Age patterns in life satisfaction
14 | The Good Childhood Report 2013
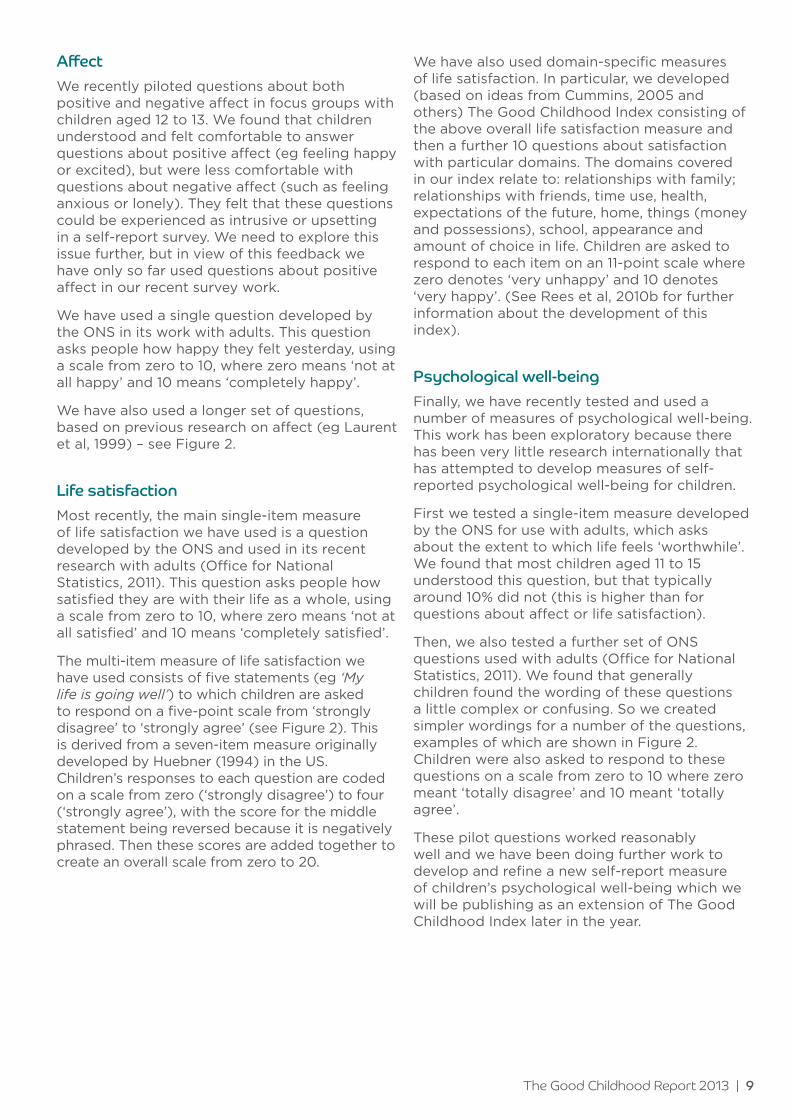
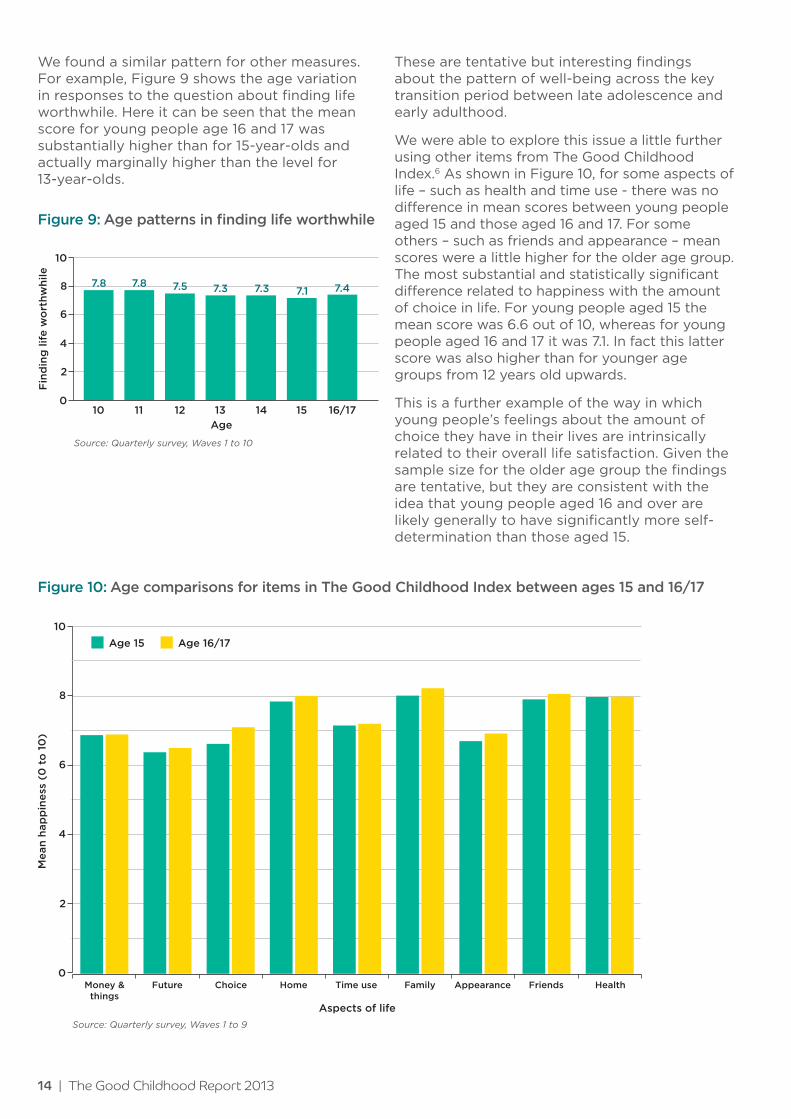
We found a similar pattern for other measures. For example, Figure 9 shows the age variation in responses to the question about finding life worthwhile. Here it can be seen that the mean score for young people age 16 and 17 was substantially higher than for 15-year-olds and actually marginally higher than the level for 13-year-olds.
These are tentative but interesting findings about the pattern of well-being across the key transition period between late adolescence and early adulthood.
We were able to explore this issue a little further using other items from The Good Childhood Index.6 As shown in Figure 10, for some aspects of life – such as health and time use - there was no difference in mean scores between young people aged 15 and those aged 16 and 17. For some others – such as friends and appearance – mean scores were a little higher for the older age group. The most substantial and statistically significant difference related to happiness with the amount of choice in life. For young people aged 15 the mean score was 6.6 out of 10, whereas for young people aged 16 and 17 it was 7.1. In fact this latter score was also higher than for younger age groups from 12 years old upwards.
This is a further example of the way in which young people’s feelings about the amount of choice they have in their lives are intrinsically related to their overall life satisfaction. Given the sample size for the older age group the findings are tentative, but they are consistent with the idea that young people aged 16 and over are likely generally to have significantly more self-determination than those aged 15.
Fin
din
g lif
e w
ort
hw
hile
10 11 12 13 14 15 16/17
Age
0
2
4
6
8
10
7.8 7.8 7.3 7.4
Source: Quarterly survey, Waves 1 to 10
Figure 9: Age patterns in finding life worthwhile
7.5 7.3 7.1
10
8
6
4
2
0
Figure 10: Age comparisons for items in The Good Childhood Index between ages 15 and 16/17
Age 15 Age 16/17
Me
an
hap
pin
ess
(0
to
10
)
Money & things
Future Choice Home Time use Family Appearance Friends Health
Aspects of life
Source: Quarterly survey, Waves 1 to 9

The Good Childhood Report 2013 | 15
If we combine our previous analysis of age differences in respect of The Good Childhood Index for eight to 15-year-olds with our new analysis of 16 and 17-year-olds, we find some interesting patterns for different aspects of children’s lives.
The Good Childhood Index domains with the greatest drops between eight and 15 are school, appearance, money/possessions and the future, while the domains with the greatest increases between 15 and 16/17 are choice, family and appearance. Thus appearance seems to be an aspect of life that is a particular issue for children in their early teenage years. There is a large drop in happiness with appearance between the ages of 8 and 12, which continues at a low level for 13, 14 and 15 year-olds, and then increases again at 16/17.
9
6
8
Me
an
hap
ine
ss (
ou
t o
f 10
)
7
8 9 10 11 12 13 14 15 16/17
Age
Figure 11: Age differences for items in The Good Childhood Index: ages 8 to 16/17
FamilyHealthHomeFriends
Money & thingsSchoolAppearanceTime use
ChoiceThe future
Source: Quarterly survey, Waves 1 to 10
16 | The Good Childhood Report 2013
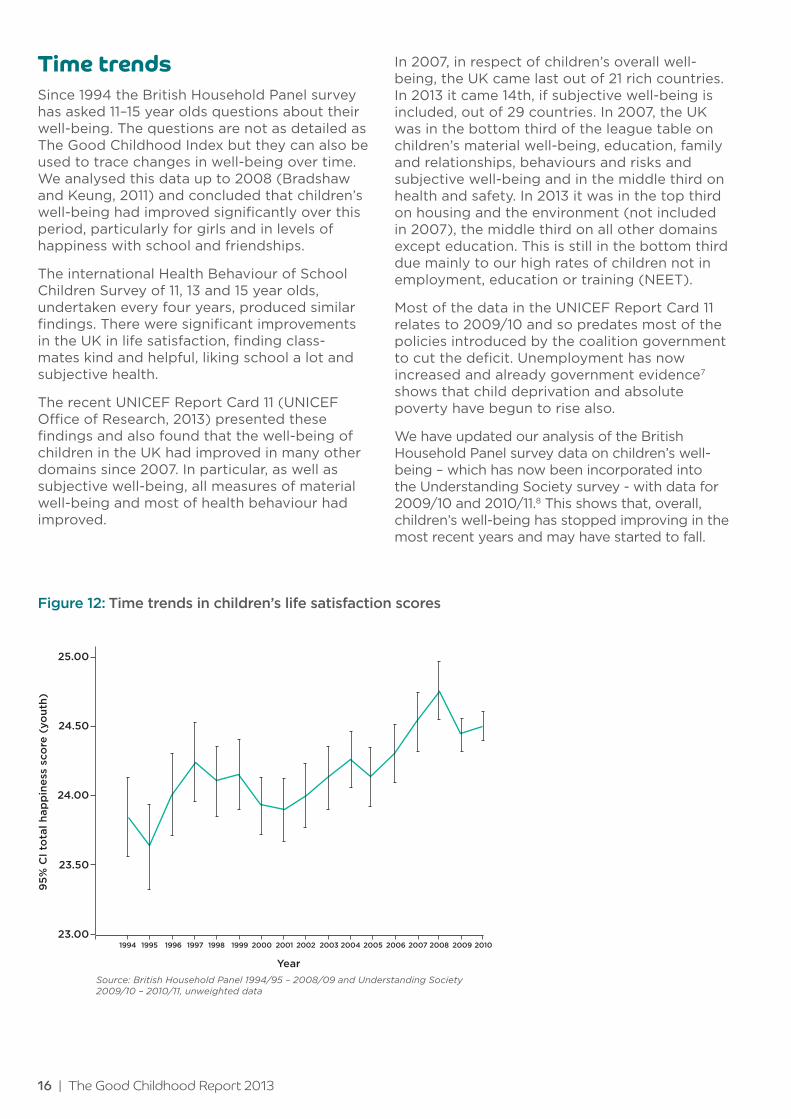
Time trendsSince 1994 the British Household Panel survey has asked 11–15 year olds questions about their well-being. The questions are not as detailed as The Good Childhood Index but they can also be used to trace changes in well-being over time. We analysed this data up to 2008 (Bradshaw and Keung, 2011) and concluded that children’s well-being had improved significantly over this period, particularly for girls and in levels of happiness with school and friendships.
The international Health Behaviour of School Children Survey of 11, 13 and 15 year olds, undertaken every four years, produced similar findings. There were significant improvements in the UK in life satisfaction, finding class-mates kind and helpful, liking school a lot and subjective health.
The recent UNICEF Report Card 11 (UNICEF Office of Research, 2013) presented these findings and also found that the well-being of children in the UK had improved in many other domains since 2007. In particular, as well as subjective well-being, all measures of material well-being and most of health behaviour had improved.
In 2007, in respect of children’s overall well-being, the UK came last out of 21 rich countries. In 2013 it came 14th, if subjective well-being is included, out of 29 countries. In 2007, the UK was in the bottom third of the league table on children’s material well-being, education, family and relationships, behaviours and risks and subjective well-being and in the middle third on health and safety. In 2013 it was in the top third on housing and the environment (not included in 2007), the middle third on all other domains except education. This is still in the bottom third due mainly to our high rates of children not in employment, education or training (NEET).
Most of the data in the UNICEF Report Card 11 relates to 2009/10 and so predates most of the policies introduced by the coalition government to cut the deficit. Unemployment has now increased and already government evidence7 shows that child deprivation and absolute poverty have begun to rise also.
We have updated our analysis of the British Household Panel survey data on children’s well-being – which has now been incorporated into the Understanding Society survey - with data for 2009/10 and 2010/11.8 This shows that, overall, children’s well-being has stopped improving in the most recent years and may have started to fall.
25.00
24.50
24.00
23.50
23.00
Figure 12: Time trends in children’s life satisfaction scores
1994
95
% C
I to
tal h
ap
pin
ess
sco
re (
yo
uth
)
1995 1996 1997 1998 1999 2000 2001 2002 2003 2004 2005 2006 2007 2008 2009 2010
Year
Source: British Household Panel 1994/95 – 2008/09 and Understanding Society 2009/10 – 2010/11, unweighted data
Has been bullied more than three times in past three months

The Good Childhood Report 2013 | 17
What is life like for children with low well-being?Hopefully it is clear from the discussion in this chapter that measuring children’s well-being is not primarily about asking about their happiness (although that is one component of it). Rather it is more about asking children how they evaluate their lives as a whole.
Figure 13 provides some insights into the lives of children who are classified as having low well-being using our measure of life satisfaction discussed earlier. It compares children who have low life satisfaction with those who do not, using a number of questions relating to different aspects of their lives. The comparisons are striking. For example children with low well-being, compared to those with average to high well-being:
• Are eight times as likely to feel there is conflict in their family
• Are almost five times as likely to have been recently bullied
• Are three times as likely to feel they do not have enough friends
• Are three times as likely to feel they have a lot less money than their friends
and so on.
These types of findings serve as an important reminder that measuring children’s well-being is important and worthwhile.
In the next two chapters we go on to explore in more depth some of the associations between well-being and other factors and issues in children’s lives using analysis of new data from our own research, some additional analysis of other data sources and references to other relevant recent research.
Figure 13: Low well-being and associated issues
Has been bullied more than three times in past three months
Has a lot less money than friends
Likes the way they look
Does not feel free to express their opinions
Does not look forward to going to school
Feels their life has a sense of purpose
Family does not get along well together
Does not feel safe at home
Does not have enough friends
Feels there are people who support them
12%35%
65%24%
6%36%
19%51%
78%44%
5%42%
1%24%
5%17%
7%33%
93%64%
0% 20% 40% 60% 80% 100%
Average to high well-being Low well-being
% of children aged 10 to 15
Source: Quarterly survey, Waves 1 to 8

18 | The Good Childhood Report 2013
Summary• Recently in our well-being research
programme, we have tested different sets of questions in respect of children’s happiness (affective well-being), life satisfaction (cognitive well-being) and psychological well-being. Statistical analysis of these questions confirms that they are measuring different components of well-being, and also that life satisfaction and psychological well-being are stable concepts, whereas children’s happiness varies on different days of the week.
• Around four fifths of children could be said to be ‘flourishing’, meaning that they about score on or above the midpoint for questions about their life satisfaction and psychological well-being.
• In our well-being research programme, we have consistently found that well-being declines with age for eight to 15-year-olds. However, new findings show that this age-related downward trend reverses at age 16/17 for life satisfaction, psychological well-being and some of The Good Childhood Index domains, notably choice.
• Overall, at any one time, around 10% of children could be said to have low well-being. We explore what life is like for these children, and show that they are several times more likely than children with average to high well-being to experience family conflict, bullying, problems in their friendships and other negative experiences.
• This underlines the importance of measuring and understanding children’s well-being.
• Finally, our analysis of the time trends shows an increase in children’s self-reported well-being between 1994 and 2008. However, when we update these data for 2009/10 and 2010/11, there is evidence that children’s life satisfaction has stopped improving and may have begun to fall in the most recent years.

3 The background to children’s well-being: family, choice and money
Clearly, a fundamental issue in terms of understanding children’s well-being is to identify the factors that are associated with higher and lower levels of well-being. As discussed in the previous chapter, our research indicates that (as has been found in research with adults) factors such as individual characteristics, family structure and economic circumstances are only able to explain a relatively small proportion of the variations in children’s well-being.
In last year’s report we discussed some alternative explanations for variations in well-being. We presented some initial findings that demonstrated the importance of child-centred approaches to poverty measurement and also the influence that recent events - such as experiencing bullying, experiencing family change, problems at school, and so on – can have on children’s well-being.
Another approach to explaining variations in overall well-being is to focus on children’s evaluations of different aspects of their lives. This is the approach that we took when we developed The Good Childhood Index. The initial report that we published on the index (Rees et al, 2010b) identified 10 questions about happiness with different aspects of life that explained over half (52%) of all the variation in children’s life satisfaction.
We also used regression analysis to explore the influence of each domain on overall well-being while holding the other domains constant. Table 1 shows the results of the regression analysis. A larger ‘beta’ score shows a greater influence. As can be seen in Figure 14, three of our Good Childhood Index items stand out as being the most influential – family relationships, choice and money/possessions.
The importance of these three aspects of life is further emphasised by looking at the types of experiences that are linked with low well-being. Earlier in this report we showed that children responding negatively to particular questions about their family relationships, choice and money/possessions were much more likely to have low well-being than children responding positively to these questions. For example:
• Children who said that their family does not ‘get along well together’ were eight times more likely to have low well-being
• Children who said that they do not ‘feel free to express their ideas and opinions’ were six times more likely to have low well-being
• Children who report having ‘a lot less money than their friends’ were three times more likely to have low well-being.
In this chapter we present new analysis relating to choice/autonomy, material deprivation and family relationships that extends our understanding of the way in which these three key factors influence children’s overall well-being. In all three cases, the material presented builds on work described in The Good Childhood Report 2012.
The Good Childhood Report 2013 | 19
Family
Choice
Money and possisions
Health
Time use
The future
Appearance
School
Home
Friends
.178
.163
.139
.091
.086
.081
.078
.074
.055
.024
.000
.000
.000
.000
.000
.000
.000
.000
.000
.221
Beta Sig
Figure 14: Regression analysis of The Good Childhood Index domains and life satisfaction
Source: Quarterly survey, Wave 1

20 | The Good Childhood Report 2013
Choice and autonomyIn The Good Childhood Report 2012 (The Children’s Society, 2012a), we observed that while children are likely to have greater autonomy as they move into their teenage years, nvertheless their dissatisfaction with the amount of choice they have increases as they get older. There was a 10% percentage drop in happiness with choice between the ages of eight and 15.
In this report, we have been able to extend this analysis to 16 and 17-year-olds, and this has yielded some interesting findings. As can be seen on page 14, choice is the aspect of life with the largest increase between ages 15 and 16/17. Thus, choice appears to have a relatively steep age-related curve, and reaches its lowest point at the age of 15. This suggests that there is a mismatch between how much self-determination children in their early teenage years would like and how much they have in reality.
What children have told us
Choice, autonomy and freedom have been frequently recurring topics in our discussions with children about their well-being.
In our initial consultation with 14 to 16-year olds in 2005, freedom was a cross-cutting theme running through young people comments about what constitutes a good life. They emphasised different aspects of freedom, including being free to go out with their friends and being able to choose what they do in certain contexts. However, they also recognised that there should be limits to their autonomy so that they are able to have a reasonable level of self-determination within the bounds of what is safe.
Similar themes were raised by younger children in a series of focus groups that we ran with eight to 10-year-olds in 2010. Children thought that they should be allowed to go out in their local area on their own or with friends without adults worrying unduly about their safety.
‘We need to get introduced to responsibility about this age... and we should be able to go short distances by ourself and with our friends.’
‘I’d like people not to be always totally so worried about children and that we are capable of handling some stuff by ourselves, just not everything.’
The comments above underline the important link that exists between autonomy and the family, and the role that parents and other caregivers play as the main gatekeepers of children’s autonomy.
Younger children in our focus groups also felt that they should be able to make choices regarding things like their free time, clothes, food, lessons at school and future career options.
‘Where we sit at lunch, what we eat at lunch…’
‘I wish in story time the children can read their books’
‘You should be able to get to be what you want to be.’
Me
an
hap
pin
ess
wit
h c
ho
ice
(o
ut
of
10)
8 9 10 11 12 13 14 15 16/17
Age
6
7
8
Source: Quarterly survey, Waves 1 to 10
Figure 15: Age comparisons for happiness with choice

The Good Childhood Report 2013 | 21
Interviews with young people
Given the importance of autonomy and choice to children and young people – both in their responses to open-ended questions, and in the associations that we have found in our survey research – we decided to explore this theme more closely in a series of interviews with 14 and 15-year-olds. The age of the interviewees is noteworthy given our survey findings about 15 being the age at which happiness with choice is lowest.
Choice and relationships with family
The young people we interviewed felt that they should have some choice in respect of their family relationships and the decisions that are made within the home.
‘I don’t get to have choice on what we have for dinner... Stuff like that. Obviously I don’t have choice on where we go on holiday or what we do as a family.’
More frequently, however, and in keeping with comments presented above and in previous reports, our interviewees placed great value on being able to choose where, when and with whom they spend time outside of the home. One young woman said she was happy with the amount of choice that her parents give her and appreciated that expression of trust.
‘I have a lot of choice about what I do in my free time and I think that’s quite important cos it can [influence] how happy you are with your life.’
The young people that we interviewed were measured in their views about the balance that needs to be struck between granting young people autonomy and keeping them safe.
‘I think [young people] should have a lot of choice, well choices that are sensible… Like they shouldn’t have a choice whether to smoke or something... You shouldn’t be allowed to smoke and stuff like that. But they should have choices in like what they can do in their spare time and who they can hang out with.’
‘They [parents] try to influence me not to do bad things and do more good things, which is right.’
We have heard similar opinions from young people before about the need for there to be limits to their autonomy. However, our in-depth interviews allowed us to explore this in more detail, and pointed to a rather complex dynamic between the amount of choice that young people have and the quality of their relationships within the family.
For example, one young man described having a poor relationship with his family, while on the other hand experiencing almost no restraints on his freedom. There is a clear implication from his comments that he would happily sacrifice some of his freedom and choice for more supportive family relationships.
‘I do what I want to do and me mam doesn’t really say anything about it’
‘I think I should have a bit less choice than what I do.’
In contrast, one of the young women that we interviewed was critical of her mother’s lack of trust and autonomy-granting, and saw this as the reason for ongoing conflict between them.
‘I’m turning 16 and I’m not allowed to go out without me mam texting us. It’s beyond a joke.’
These comments show that the precise amount of autonomy that is desirable will vary from one young person to another but both autonomy and support/nurture are essential components of positive family relationships.
One young man summed up the dynamic as follows:
‘If you have too much choice, you can end up doing stupid things. And if you have less choice, you’ll end up getting angry with your family, so I think you should have just the right amount of choice which is right for themselves.’
22 | The Good Childhood Report 2013
Choice and relationships with friends and peers
Most of the young people we interviewed supported the idea that they should be free to choose their friends. However, there were mixed views about whether parents should intervene if friends are involved in behaviours that they might later regret. Some felt that sometimes parents intervene for good reason.
‘If they’re going around with people who drink a lot and take drugs and that... then I think the parents should like have some say in it’
Others felt that parents should let young people face the consequences of the choices that they make.
‘It’s their choice, if they wanna do it, they should get on with it.’
‘If they want to do something negative, let them do it, they’ll face the consequences.’
One of the young women that we interviewed who was happy with the amount of choice that her family give her was much more negative about choice in relation to her peers, worrying that she might get drawn into things that she wouldn’t otherwise ‘choose’.
‘I’m always worried I’m going to say yes to stuff, I worry that I’m just going to give in and go with it’
‘Lots of people my age are drinking... I don’t drink, I’ve never drunk but I’m worried I could be at some party and get caught up with it.’
A number of the young people that we interviewed talked about the ways in which their choices might be constrained by the choices and actions of other young people. For one young woman, this related to not feeling free to participate in lessons as she would like to.
‘Some of them [other young people] are quite intimidating... especially in [a lesson] where you want to give your views, you don’t feel like you can because of them.’
A different perspective on the link between choice and friendship was offered by one young person who pointed out that loneliness could constrain your choices.
‘They might be lonely and not really have much choice in what they do in their spare time.’
Choice relating to appearance and self-expression
Several of the comments above relate to the choices that young people make about their appearance, self-expression and behaviour in the context of the wider peer group. The young people that we interviewed talked about the ways in which choice can be constrained by the attitudes of their peer group and the pressure that exists to look or dress a certain way.
‘Lots of young people have the mick taken out of them because of what they look like... I think people should just get on with what they want to do and look.’
‘I know a lot of people who kind of feel forced to wear certain clothes because they’re in the ‘in set’ and they could get rejected...’
The interviews drew out individual accounts of the impact that the attitudes of peers can have on young people, and the choices that they make as a result. One girl described her defiance in the face of such pressure:
‘I wear what I want to wear but sometimes I do get people looking at me… but I don’t really mind because it’s free choice… and I don’t mind if people stare. They can do what they want.’
The Good Childhood Report 2013 | 23
Meanwhile, another girl described how the negative attitudes of other young people tainted her enjoyment of choices she had made (about music preferences) and constrained her subsequent choices:
‘Like when I used to like this band, I used to get all this grief, which means I don’t like this band any more because they just really wound me up and I couldn’t listen to them.’
Choice related to school and the future
The young people that we interviewed also talked about the importance of being able to make choices about the subjects that they follow at school and the next steps for education.
‘I don’t know who decides what GCSEs you take and stuff but you’re not given much choice. I think they should ask students what they would like to do.’
‘Where you go after school, there’s not really much choice where you can go.’
Their comments highlighted the ways in which choice might be constrained across the spectrum of school achievement. One young woman described the pressure that she feels to do certain subjects because she is considered to be academic.
‘Just because we do well at school, they’re kind of expecting us to be outstanding in these subjects when actually, if we really don’t like them, we’re not going to do well in them.’
While another young person felt that he had less choice about his future as a result of being less academic.
‘Choice of what you want to make of your future. So if someone doesn’t work as hard, their choices will be limited but they should still have choice.’
One young person also talked about the way that freedom and choice can be restricted at school in a more general sense.
‘Because like they put cameras all the way around the school... It feels like a prison. … We’re not allowed to drink like water and that in the corridor.’
Constraints on choice arising from circumstances
The young people in our interviews also described the constraints on choice that they felt could arise from their circumstances and/or a lack of opportunities.
‘They could be in like in a rough area and like not have choice in what they do or who they hang around with.’
‘I feel like I’m in a prison... It feels like I’ve been in a prison all me life since I started getting bullied. I want to be able to walk to the shop without someone starting.’
Our survey findings show that there is a link between the amount of choice that children have and their material circumstances. For example, children lacking five or more items on our child-centred deprivation index were eight times more likely than children lacking none of these items to be unhappy with the amount of choice that they have (The Children’s Society, 2012a).
Another constraint on choice arising from circumstances relates to the legal age at which young people are allowed to do certain things like vote, for example. As one young person put it:
‘At my age you don’t get to have much choice about things, do you?... You don’t get to have much choice about anything... like you don’t get to have much choice about like politics. I don’t get why eighteen is the age where you get all these choices.... I think like sixteen is where you should have all these choices; you know - about right and wrong.’

24 | The Good Childhood Report 2013
In summary, the key themes that emerged from our interviews with 14 and 15-year-olds build on previous findings from our qualitative research with children in different age groups to deepen our understanding of what choice means to children and young people. This analysis supports previous findings underlining the importance of children being able to choose what they do in their free time and with whom, while emphasising that that young people do not want unfettered freedom. It also contributes further insights into, for example, the role that friends and peers can play in constraining young people’s choices, especially in relation to their appearance and self-expression. Furthermore, it highlights the importance of having loving, supportive family relationships on the one hand, and a reasonable level of choice/autonomy on the other.
Family relationshipsFrom the outset, our research programme has highlighted the importance of the quality of family relationships to children’s subjective well-being.
Our initial consultations (The Children’s Society, 2006) with children and young people in 2005 to 2008 identified good quality relationships with family, friends and others as being of paramount importance in children’s own views of what constitutes a good childhood.
The importance of the quality of family relationships in particular has been identified in our more recent survey based work.
• Our initial report (Rees et al, 2010a) on the 2008 well-being survey demonstrated that a simple measure of family harmony was a much more powerful determinant of children’s well-being than family structure
• As discussed earlier in this chapter, analysis of our Good Childhood Index (see, for example, Rees et al, 2010b) has shown that the quality of family relationships is one of the three most significant aspects of life which contribute to children’s overall sense of well-being
• The Good Childhood Report 2012 (The Children’s Society, 2012a) showed that a set of questions about family relationships explained over a third of the variation in children’s overall subjective well-being.
Given the importance of this domain to children’s subjective well-being, it makes sense to try and develop a more in-depth understanding of the particular aspects of family relationships which are associated with variations in children’s well-being.
In a more recent survey of young people aged 14 and 15 – our Still Running 3 survey - we had the opportunity to further explore the links between aspects of family relationships and children’s subjective well-being. The survey was undertaken in May to September 2011 with a representative sample of young people in year 10, aged 14 and 15. The survey covered several other topics in addition to family relationships, some findings from which have been published elsewhere (Rees, 2011). The data we have analysed for this section was gathered from a sample of 6064 young people in 79 secondary schools selected to be representative by region and economic prosperity.9
We included in the survey questionnaire a range of 20 questions, most from previous research and some designed specifically for this survey, with the intention of covering three topics that had emerged as important in our earlier research, as discussed above – family conflict, parental support and parental autonomy-granting. Using statistical techniques10 we were able to identify within the group of questions we included, three sets of four questions related to these topics that functioned well statistically. These are shown in Figure 16.
Statistical tests suggest that each of these sets of questions work well together.11 So for each set of questions we created an overall score by summing young people’s responses to each question.12 We use these scores in the following analysis. For brevity, as in Figure 17, we sometimes refer to each of the three topics with a single word as follows: harmony (family harmony/conflict), support (parental support/communication), and autonomy (parental autonomy-granting).
We tested whether the scores varied according to children’s gender and socio-economic indicators. The support and autonomy scores had no significant association with gender or family socio-economic status. However there were some small but statistically significant differences in relation to family conflict. First, females reported higher levels of family conflict higher than did males. Second, children living in households where there was no adult in paid work and/or who were entitled to free school meals reported slightly higher than average levels of family conflict.

The Good Childhood Report 2013 | 25
Figure 16: Questions about three aspects of family relationships
Family harmony/conflict
Members of my family talk nicely to one another
My family gets along well together
There are not a lot of arguments in my family
Frequency of quarreling with parent(s)13
Parental support/communication
If I have a problem, my parents will help me
If I am upset or unhappy, my parents spend time listening to me
My parents listen to my views and take me seriously
Frequency of talking to parent(s) about things that matter14
Parental control/autonomy-granting
My parents are too strict
My parents try to control how I live my life
My parents like me to make my own decisions
My parents give me enough freedom
For illustrative purposes we also created a simpler two-way split for each topic, dividing the sample roughly in half to represent high and low parental support, high and low parental autonomy-granting and high and low levels of family harmony.
All three topics were significantly associated15 with children’s overall life satisfaction as illustrated in Figure 17. As we expected from our previous research, young people who scored ‘high’ in relation to each of these aspects of family relationships had substantially higher mean life satisfaction scores than those who scored ‘low’.
The use of these three measures of different aspects of family relationships enables us to look a little further into the relative influence of each aspect on children’s well-being.
Support Autonomy Harmony0
2
4
6
8
10
12
14
16 15.3
12.4
14.8
12.4
15.3
12.3
Figure 17: Three dimensions of family relationships and children’s life satisfaction
18
20
High Low
Source: Still Running 3 survey
Source: Still Running 3 survey
Me
an
lif
e s
ati
sfacti
on
(0
to
20
)

26 | The Good Childhood Report 2013
First of all we will focus on family harmony/conflict and parental support. Other previous research (see for example O’Connor & Scott, 2007, p7 for discussion) has drawn attention to the combined negative effect on children of living in high conflict-low warmth family environments. This is illustrated in Figure 18. It can be seen that the highest levels of life satisfaction are for children living in low conflict-high support family environments. It appears that lacking either one of these two positive dimensions of family relationships has a roughly equal impact in reducing on well-being. However, there appears to be a cumulative effect when both positive dimensions are lacking; ie there is substantially lower average well-being for children living in high conflict-low support families.
This analysis suggests the importance of considering multiple dimensions of family relationships and how the interplay between them affects children’s well-being.
We can extend the analysis further by introducing the third set of questions regarding parental autonomy-granting. A summary of this analysis is shown in Figure 19. It can be seen that even when we look within particular combinations of family harmony and parental support, levels of parental autonomy-granting still make a difference to children’s well-being. This is true both for the group of children living in high conflict-low support families, and also at the other end of the continuum for children living in low conflict-high support families.
More advanced statistical analysis indicates that all three dimensions of family relationships considered above make a unique, significant contribution to children’s life satisfaction. Family harmony/conflict is the strongest predictor of life satisfaction, followed by parental support and then parental autonomy-granting.
The latter two dimensions – support and autonomy-granting – are conceptually similar to two dimensions that appear in the extensive literature on typologies of parenting styles. The most widespread typology (Baumrind, 1991; Maccoby & Martin, 1983) identifies four broad styles defined through the combination of two dimensions – responsiveness/warmth/acceptance and control/demandingness. The first of these dimensions is relatively straightforward in that high levels of responsiveness, acceptance and warmth are associated with higher well-being and long-term outcomes for children.
The second requires a little more clarification as it is important to distinguish between appropriate levels of control and over-control. For example ‘authoritative’ parenting is characterised by clear boundaries together with encouragement of independence and individuality; whereas ‘authoritarian’ parenting is characterised by clear boundaries but low encouragement of independence. Recent work has focused on the importance of parental autonomy-granting (Soenens & Beyers, 2012). Our analysis confirms the importance of this distinction in finding that it is a combination of high support and high autonomy-granting that is associated with the highest levels of children’s well-being.
14.114.1
Me
an
lif
e s
ati
sfacti
on
(0
to
20
)
Low conflict + High support
Low conflict + Low support
High conflict + Low support
0
2
4
6
8
10
12
14
1615.9
Figure 18: Four categories of family relationships and children’s life satisfaction
18
20
High conflict + High support
11.5
Me
an
lif
e s
ati
sfacti
on
(0
to
20
)0
2
4
6
8
10
12
14
1614.8
16.2
Figure 19: Eight categories of family relationships and children’s life satisfaction
18
20Low autonomy High autonomy
Low conflict + High support
Low conflict + Low support
High conflict + Low support
High conflict + High support
13.4
14.613.9
14.3
11.1
12.5
Source: Still Running 3 survey
Source: Still Running 3 survey

The Good Childhood Report 2013 | 27
In summary the analysis presented briefly in this section highlights three important dimensions of family relationships which all contribute independently to children’s overall life satisfaction. These relate to children’s basic needs to live in harmonious and supportive family environments, but also their need to be recognised as a competent autonomous individual as they mature.
Poverty/material deprivationIt may seem contradictory to say that material deprivation is one of the major influences on children’s well-being given the findings discussed earlier in the report regarding the relatively small associations between socio-demographic factors and life satisfaction. Indeed our previous research suggests that while household income, for example, has a significant association with children’s well-being, this influence is quite small with income only explaining around 2% of the variation in children’s life satisfaction (Rees et al, 2010).
However we have shown in more recent reports that taking a more child-centred approach to poverty, by asking children themselves to report on their levels of material deprivation, yields much stronger links with well-being (see Main & Pople, 2011).
We have developed a material deprivation index, which includes the following 10 items and experiences:
1. Some pocket money each week to spend on yourself
2. Some money that you can save each month, either in a bank or at home
3. A garden at home, or somewhere nearby like a park where you can safely spend time with their friends
4. A family car for transport when you need it
5. At least one family holiday away from home each year
6. Family trips or days out at least once a month
7. The right kind of clothes to fit in with other people your age
8. A pair of designer or brand name trainers
9. An iPod or other personal music player
10. Cable or satellite TV at home
(See Main & Pople, 2011 for a description of how our child-centred index of deprivation was developed)
In this section we present new analysis using this child-centred material deprivation index, and focus on what life is like for the children who lack - and would like to have – five or more items or experiences from this index. This is the case for about 5% of eight to 15-year-olds nationally, or 250,000 children. We focus on this group of children because, when compared to the c70% of children who are lacking none or one of the items from our index, there are stark differences in well-being.
We have previously published findings showing that children who lack items and experiences from our child-centred material deprivation index are much more likely than their peers to have low overall well-being. For example, children lacking five items or more items from our index were more than five times as likely as children who lack no items, and twice as likely as children who lack two items, to have low well-being (page 9 of summary, Main & Pople, 2011).
Our new analysis demonstrates that material deprivation is linked with lower well-being in every aspect of children’s lives covered by The Good Childhood Index.
As can be seen in Figure 20, children lacking five or more items from our material deprivation index, when compared with children lacking none or one of the items, have lower happiness in every domain. Perhaps unsurprisingly, the domain where this difference is greatest is money and possessions, followed by choice and home.
Figure 21 provides further insights into the lives of children who do not have (and would like to have) five items or more from our 10-item measure of material deprivation. These children, who we describe as ‘materially deprived’ in the figure overleaf, are much more likely than children lacking none or one of the items to report being disabled. They are also more likely to report low self-esteem and bullying, and to feel unhappy with aspects of their home, their prospects for the future, their friendships, the amount of choice that they have and their health.

28 | The Good Childhood Report 2013
10
8
6
4
2
0
Figure 20: Difference in happiness with different aspects of life between materially deprived children and non-deprived children
Money & things
Choice Home Future Appearance Family Health Time use School Friends
Me
an
hap
pin
ess
(0
to
10
)
Aspects of life
Figure 21: Differences between materially deprived children and non-deprived children
Does not feel that thay have enough choice about how they spend their time
Does not feel safe at home
Does not feel that their home is nice
Disagrees that they have a lot to be proud of
Does not feel that a lot of things about them are good
Does not feel that their friends treat them well
Is disabled
Does not feel that their friends will help them if they need it
Does not feel safe with their friends
2%23%
2%24%
3%27%
4%31%
2%17%
3%14%
3%18%
2%14%
6%35%
5%33%
0% 10% 20% 30% 40% 50%
Non-deprived (lacking 0-1 items) Deprived (lacking 5+ items)
% of children
5%25%
5%21%
9%37%
Does not always feel positive about the future
Does not feel safe at school
Feels that their health is bad or very bad
Has been bullied more than three times in the past three months
Non-deprived (lacking 0-1 items) Deprived (lacking 5+ items)
Source: Quarterly survey, Waves 1 to 8
Source: Quarterly survey, Waves 1 to 8

The Good Childhood Report 2013 | 29
For example, children lacking five or more items, in comparison to children lacking none or one of the items, are:
• Home: Thirteen times more likely to disagree that ‘I feel safe at home’
• Self-esteem: Nine times more likely to disagree that ‘overall I have a lot to be proud of’
• Future: Six times more likely to disagree that ‘I always feel positive about the future’
• Disability: Six times more likely to say that they are disabled
• Friends: Six times more likely to disagree that ‘my friends will help me if I need it’
• Choice: Six times more likely to disagree that ‘I have enough choice about how I spend my time’
• Health: Four times more likely to say that their health is bad or very bad
• Bullying: Four times more likely to have experienced bullying three or more times in the last three months.
In summary, the analysis presented in this section builds on previous findings to show that children who are materially deprived have markedly lower well-being than their peers, and are more likely to report friendship problems, bullying, lower self-esteem and to be unhappy with aspects of their home, health, choice and the future.
Summary• In this chapter, we turn to the aspects of
children’s lives that are most strongly related to their well-being. Three aspects of The Good Childhood Index stand out as being the most influential – choice, family and money/possessions.
• Children’s happiness with choice drops steadily between the ages of eight and 15, but then there is a marked rise at age 16/17, suggesting that there is a mismatch between the amount of choice that children in their early teenage years have and how much they would like.
• Interviews with young people aged 14 and 15 about choice highlight a number of key themes for this age group, including: the role that friends and peers play in relation to choice, especially in relation to their appearance and self-expression; and the equal importance of having loving, supportive family relationships on the one hand, and being granted a reasonable level of choice/autonomy on the other.
• Autonomy is also a theme that emerged from our analysis of family relationships. Expanding on findings that we have already published about the fundamental importance of family harmony, parental support and choice/autonomy, we demonstrate that all of these dimensions of family relationships are associated with, and make an independent contribution to, children’s self-reported well-being.
• Finally, in this chapter we present new analysis exploring what life is like for children that are materially deprived, by which we mean that they lack five items or more from 10-item measure of deprivation. This group of children have markedly lower well-being than their peers for all of The Good Childhood Index domains, and are more likely to report low self-esteem, friendship problems, bullying and to be unhappy with their home.

30 | The Good Childhood Report 2013
4 What can be done to improve children’s well-being
In the previous chapters we have presented evidence from our research programme, and from other sources, which provides an overview of the self-reported well-being of children aged eight to 15 in the UK, explores some of the factors which affect children’s well-being and examines the associations between well-being and other issues.
This evidence clearly demonstrates that children’s feelings about their lives – their self-reported well-being – is an important consideration for all those concerned with, or responsible for, children’s welfare and life chances. This includes parents, professionals and local and national policy makers. In this chapter we consider what can be done to improve children’s well-being and describe some recent work we have been doing through the well-being research programme.
A framework for thinking about ways of improving children’s well-beingChildren’s well-being can be influenced by a wide range of factors at different levels; from children’s own choices and behaviours to national policy decisions and societal attitudes. Figure 22 attempts to illustrate this point in a diagram, using the framework of Bronfenbrenner’s ecological systems theory of human development (Bronfenbrenner, 1979).
Bronfenbrenner’s theory delineates a set of systems that can affect children’s development. Working from the inside of the diagram outside, the microsystem refers to the child’s closest relationships, with parents, carers and others. The mesosystem represents the relationships between components of the microsystem. The exosystem then refers to people and institutions that the child may not have direct contact with but nevertheless exert an influence on them. The macrosystem represents more remote factors such as societal values, attitudes and culture. Finally the chronosystem represents change over time.
This may be a helpful framework for thinking about different routes to influencing children’s well-being.
In this chapter we present some initial pieces of work which may begin to enhance our understanding of parts of this framework. In particular we discuss ways in which national policy, local policy, services for children, parents and carers, and children themselves, may be able to influence well-being.
We have not yet been able to explore the influence of the broad macrosystem on children’s well-being, although general societal attitudes to young people, for example was an issue that young people aged 14 to 16 identified as affecting their well-being in our initial consultation work in 2005, as illustrated by the following quotes:
‘... crime which is exagerated by media who overestimate the figures and levels of crime. Also young people in general are blamed for Britains ‘rising crime’ (according to media) this makes people scared and frightened of young people.’[What stops young people having a good life]
‘To socialise and not to be discriminated against because we are young. We all are not thugs or vandals.’[What makes for a good life]
‘People thinking we are all the same eg a teenager might have been rude to someone, elderly, person etc. So they think we are all like that and then be rude to other teenagers.’[What stops young people having a good life]
Source: The Children’s Society, 2005
The influence of societal attitudes is an important area for future exploration in relation to children’s well-being.

The Good Childhood Report 2013 | 31
Child
Services
Local area
National
Attitudes
CultureValues
Routes to influencing children’s well-being
Based on Brofenbrenner’s ecological model of human development
Chronosystem
Exosystem
Macrosystem
Neighbours
TeachersFamily
Microsystem
Mesosystem
Figure 22: Different spheres of influence on children’s well-being
National policyThere have been ongoing debates about the extent to which children’s subjective well-being is ‘policy amenable’. A recent OECD report (Chapple & Richardson, 2009) argued that it was not.
Certainly there are aspects of children’s lives such as the connections with parenting styles and quality of family relationships discussed in Chapter 3 that may be relatively difficult for national governments to exert direct influence over. On the other hand there are other aspects raised in this and our previous reports, such as material deprivation, safety in schools, and the quality of the environment that appear to be much more easily amenable to both national and local policy interventions.
As a companion to The Good Childhood Report 2012 we published a paper outlining some of the ways in which policy makers could take children’s well-being into account (The Children’s Society, 2012b). Our framework, which is depicted in Figure 23, is based on six key factors which have been identified by the Office of National Statistics as directly influencing people’s well-being (Beaumont, 2011).
An important prerequisite for policy intervention is available evidence on children’s self-reported well-being. In addition to the type of evidence generated through one-off surveys of children, such as those produced by our research programme, it would be particularly helpful at a national level to have information about trends and about comparisons with other countries.
Source: Based on Brofenbrenner’s ecological model of human development (Brofenbrenner, 1979)

32 | The Good Childhood Report 2013
Figure 23: Six priorities for children’s well-being
SelfHave a positive view of themselves and an identity that is
respected
MoneyHave enough of
what matters
EnvironmentHave a safe and suitable home
environment and local area
LearningThe conditions to learn and develop
RelationshipsHave positive
relationships with family and friendsLeisure
Have opportunities to take part in
positive activities to thrive
Thesixprioritiesfor
children’swell-being
Netherlands
Iceland
Spain
Finland
Greece
Belgium
Norway
Switzerland
Estonia
Slovenia
Sweden
Ireland
Denmark
United Kingdom
Italy
Austria
Luxembourg
France
Czech Republic
Latvia
Portugal
Germany
United States
Canada
Slovakia
Hungary
Lithuania
Poland
Romania
94.2%
90.2%
89.8%
89.8%
89.0%
88.5%
88.0%
87.5%
87.1%
86.8%
86.7%
86.6%
86.1%
86.0%
85.8%
85.8%
85.7%
85.5%
84.9%
84.8%
84.7%
84.2%
84.2%
83.8%
82.9%
82.5%
81.3%
79.7%
76.6%
Figure 24: National variations in children’s subjective well-being
70% 80% 90% 100%
% of children aged 11, 13 and 15 with scores above the middle of a life satisfaction scale
Source: Bradshaw et al, 2013

The Good Childhood Report 2013 | 33
We have summarised some available trends-based data on children’s self-reported well-being in Chapter 2, but this is relatively sparse at the moment and adding to it is a long-term endeavour.
However there is also some data available on cross-national comparisons in self-reported well-being which can provide a benchmark for national governments. Figure 24 is reproduced from a recent working paper (Bradshaw et al, 2013) to support the publication of UNICEF Report Card 11. It is based on a single question about children’s life satisfaction from the HBSC survey in 29 countries. The United Kingdom lies in 14th place on this list.
Such comparisons can be a useful stimulus for debate and more detailed analysis to establish the reasons for differences between countries. This may in turn suggest policy initiatives that could be taken at a national level to improve children’s lives.
Local policyWhile aspects of national policy can have a significant influence on children’s well-being, there is also potential for more localised policy initiatives to improve the quality of children’s lives. Over the last year we have been working with three local authorities in England to design and undertake surveys of children within their area which can provide information on different aspects of children’s lives. The intention is that the findings from these surveys can then be fed into strategic planning and local policy initiatives in relation to children and young people.
A report on the first pilot, in the Isle of Wight, was published in early 2013. Figure 25 shows the mean scores for the 10 items in The Good Childhood Index covering different aspects of life, plus an item about the local area.
We were able to compare these results with our national findings (taking into account variations in the Isle of Wight sample in the numbers of children of different ages and gender). These comparisons suggest that in two aspects of life; family relationships and feelings about the local area, children on the Isle of Wight were faring a little better than the national average. At the same time there were two domains; school and appearance, where they were faring a little worse than the national average.
We were then able to undertake further more detailed analysis and consultation with children on the island on these two aspects of life. In relation to school, feelings of safety were identified as a key issue. In relation to appearance, we were able to identify that it was particularly girls on the Isle of Wight who had lower satisfaction than the national average, as shown in Figure 26. It can be seen that the differences here are quite striking with, for example, 63% of females in Year 8 (12 and 13 years old) on the Isle of Wight agreeing that they often worry about the way that they look compared to 44% nationally.
Family relationships
Friends
Home
Money
Health
Time use
Choice
Local area
Future
School
Appearance
0 1 2 3 4 5 6 7 8 9 10
Mean happiness score (0 to 10)
Figure 25: Happiness with different aspects of life (Isle of Wight)
8.4
8.4
8.4
8.2
7.8
7.6
7.6
7.6
7.4
7.0
6.7
% a
gre
ein
g
0
10%
20%
30%
40%
50%
60%
70%
80%
63%
74%
Figure 26: ‘I often worry about the way I look’ by school year and gender, national comparisons
Year 8 Year 10
Isle of Wight female
National female
National male
Isle of Wight male
44%
56%
33% 34%31% 32%
Source: Isle of Wight survey 2012 and national survey 2010
Source: Isle of Wight survey 2012

34 | The Good Childhood Report 2013
Issues such as these may well be amenable to local initiatives. This pilot survey therefore highlighted some concrete evidence in terms of different aspects of children’s lives which could be used to inform future local policy.
ServicesWe now turn to another way in which using measures of children’s self-reported well-being may be useful in improving the quality of their lives in the short and longer term. This relates to the ways in which professionals working in services for children and young people might take account of children’s own evaluations of their lives to inform individual interventions.
A key proposition in the literature on well-being is that positive mental health is more than merely the absence of mental health problems. There is a growing body of evidence to support this proposition (eg Keyes, 2002 and 2005 in the US; Bergsma & Veenhoven, 2011).
This is an area where there has also been research in relation to children and young people. Wilkinson and Walford (1998) explored the connection and distinction between well-being and distress amongst late adolescents in Australia. They concluded that these two dimensions, while strongly linked, are also distinguishable.
More recently, researchers in the US have developed what has been termed the ‘dual factor’ model of mental health (Greenspoon & Saklofske, 2001). This attempts to incorporate measures of positive well-being and more traditional measures of mental ill-health into a single framework. This model has been tested and extended in number of more recent studies Suldo and Shaffer, 2008; Antaramian et al, 2010; Suldo et al, 2011; Lyons et al, 2012a; Lyons et al, 2012b). A key overarching point from these studies is that children who did not meet recognised thresholds for mental ill-health but had low life satisfaction fared significantly worse in terms of a range of measures of academic attainment and emotional, cognitive and behavioural engagement.
We have recently undertaken some analysis of this model using UK data from Wave 1 of the youth questionnaire in the Understanding Society survey, a major new longitudinal household panel study, to explore its relevance within a UK context.
The Wave 1 youth questionnaire of the Understanding Society survey includes measures of life satisfaction, mental health problems and a range of other indicators of children’s lives. The questionnaire is completed by young people aged 10 to 15 in households participating in the study, and included over 4800 young people in Wave 1.
The measure of mental health problems included in the questionnaire was the Strengths and Difficulties Questionnaire (SDQ) (Goodman et al, 1998), a measure which is widely used for research and clinical work internationally. The measure of life satisfaction included in the questionnaire is a single question about children’s about their lives as a whole, to which they are asked to respond on a scale from one to seven.
Single-item measures such as this have significant limitations for statistical analysis in terms of their stability and their ability to distinguish between different levels of well-being. However we have undertaken the analysis because the data set provides a rare opportunity to explore the links between positive well-being and mental ill-health using UK data from children.
Our initial analysis suggests that, while there is a significant association16 between children’s mental health problems and their life satisfaction, these are not one and the same thing. Around 20% of the sample of young people were identified as potentially having mental health problems using the SDQ scores.17 However, less than a third of these young people (6% of the sample) had low life satisfaction.18 At the same time, a further 5% of young people did not have mental health problems but had low life satisfaction.
Figure 27: Overlap between mental health problems and life satisfaction
Mental health problems
(20%)
Low life satisfaction
(11%)
6% 5%14%
Source: Understanding Society survey, Wave 1

The Good Childhood Report 2013 | 35
One of the practical uses of measures like the SDQ is as a screening instrument for practitioners to identify young people who may be in need of support from services. Following the US research on the dual factor model discussed above, we were interested in whether taking into account young people’s life satisfaction as well as their SDQ score might have practical value for screening purposes. To explore this we looked at the extent to which the SDQ and life satisfaction scores in the Understanding Society survey predicted answers to a range of other questions on the questionnaire. The questions we selected covered a range of behavioural, academic and relationship issues as follows. Whether the young person:
• Had ever drunk alcohol
• Had stayed out after 9pm without parents knowing whereabouts at least once in last month
• Had ever truanted
• Felt that it was ‘very important’ to achieve at school
• Argued with their mother and/or father most days
• Talk to their mother and/or father about things that matter at least once a week
• Felt mostly supported by family.
There were age and gender differences in young people’s responses to these questions (for example, not surprisingly, older young people were more likely to have ever drunk alcohol). So we also included age and gender in our analysis.
The results of our exploratory analysis19 are as follows:
1. Young people’s life satisfaction did not contribute to predicting behavioural indicators (drinking alcohol, staying out late and truanting) once age, gender and SDQ score were taken into account.
2. Life satisfaction did make a significant contribution to predicting how important young people felt it was to achieve at school, once other factors were taken into account.
3. Similarly, life satisfaction made a significant contribution to predicting the three family relationship variables once other factors were taken into account. In fact in two out of three questions (talking to parents and feeling supported by family) life satisfaction was a stronger predictor than the SDQ score.
An example of these findings is shown in Figure 2820 which shows the percentage of young people who talked regularly to their parents about things that matter for those with high SDQ scores (mental health problems), those with low SDQ scores and low life satisfaction and those with low SDQ scores and high life satisfaction. It can be seen that young people with a low SDQ score (no identified mental health problems) but a low life satisfaction score were the least likely (53%) to talk to a parent at least once a week about things that matter.
The use of a measure of life satisfaction was therefore able to identify a group of young people who were not faring so well within their family and at school, although they would not be identified as potentially having mental health problems using standard screening instruments (SDQ). It is notable that these results were obtained even though life satisfaction was measured by only a single question, while the SDQ score was derived from 20 questions. It would be valuable to undertake similar research using a more robust measure of subjective well-being.
Low SDQ score,
low life satisfaction
Low SDQ score,
high life satisfaction
High SDQ score
0% 20% 40% 60% 80% 100%
Figure 28: Whether young people talked to their mother or father about things that matter at least once a week
47%53%
33%67%
38%62%
Yes No
Source: Understanding Society survey, Wave 1
% of children aged 10 to 15

36 | The Good Childhood Report 2013
These findings together with the more substantial body of research on this topic from the US outlined earlier, have potentially important practical implications. If measuring life satisfaction provides valuable additional information over and above that provided by existing measures of mental ill-health, then it may make sense to combine both types of measures in efforts to screen the adolescent population and identify sub-groups of young people in need of additional support.
The identification of a group of young people who do not cross the threshold for potential mental health problems but nevertheless score significantly low on life satisfaction has at least two practical uses. First, we may be concerned about low life satisfaction in its own right and may wish to alleviate the unhappiness of young people in this situation. Second, as suggested by the evidence from adult populations cited above, low life satisfaction may be a precursor to significant longer-term problems, and therefore screening and identification may offer the possibility of early intervention to prevent the development of these problems.
Children and parents: Five ways to well-beingFinally we turn to the question of what children themselves can do to improve their own well-being, and how parents can support them in doing so.
In our initial consultation in 2005, young people aged 14 to16 recognised that their own behaviours and approach to life contributed to their well-being as illustrated by the following quotes:
What makes for a good life?
Live life as if its your last day and to get along with others.
Growing up and taking responsibility.Source: The Children’s Society, 2005
In 2008, nef (the new economics foundation) was commissioned by the Government Office for Science to summarise the evidence on the determinants of well-being and produce clear messages on what individuals could do to improve well-being (Aked et al., 2008). The five ways to well-being framework produced serves as a simple heuristic, echoing the five-a-day message around fruit and vegetable consumption. They may not be the five strongest drivers of well-being, but they are ones that most people can act upon daily.
The five ways framework – Connect, Be active, Take notice, Keep learning and Give – is now used in a wide range of contexts, both in the UK and abroad. However, as with many areas of well-being research, most of the evidence on this issue relates to adults. So The Children’s Society saw a need to explore the extent to which the framework might also be relevant to children and young people. We have undertaken a research project jointly with nef to explore this question. Details of this project, including methodology, findings and practical implications, form the remainder of this section.
Methodology
We used a combination of focus groups and survey research to provide an insight into ways to well-being that are relevant for children – informed by the perspectives of children themselves as well as by the five ways framework.
In the survey, we asked around 1500 young people aged 10 to 15 a number of questions related to the five ways that we felt might be relevant to children’s lives. Figure 29 shows how often children in our survey reported carrying out these activities. This shows that some activities are much more common than others. For example, two thirds of children (64%) reported seeing their friends outside of school most days or every day, while only 2% said that they do volunteering most days or every day.
We also asked questions on self-reported well-being.21 We were then able to carry out analysis to see if children who reported doing five ways activities more tended to report higher well-being than those who did them less. In these analyses we controlled for age and household socioeconomic status to ensure that it really was the five ways determining well-being.

The Good Childhood Report 2013 | 37
Figure 29: Pilot questions to explore nef’s five ways to well-being with young people aged 10 to 15
Chatting to friends on the phone or via social websites
Seeing friends
Seeing people in your family that you don’t live with
Talking to people in your family about things that matter
Walking or cycling around your local area
Playing sports or doing exercise but not on a team
Playing sports on a team (like football or netball)
Taking part in organised activities (like youth clubs)
Teaching yourself new things
Reading for fun
Learning new things for fun (like music, languages)
Volunteering or helping out in your community
Taking care of or helping out with siblings or other family members
Helping out around the house
Paying attention to your feelings and emotions
Paying attention to how you feel physically
Noticing and enjoying your surroundings
0% 10% 20% 30% 40% 50% 60% 70% 80% 90% 100%
‘Never’ or ‘hardly ever’ ‘Most days’ or ‘every day’
CO
NN
EC
TB
E A
CT
IVE
KE
EP
LE
AR
NIN
GG
IVE
TA
KE
NO
TIC
E
Figure 30 shows, for each of the five ways activities, the difference in well-being (on a scale of zero to 20) between children who never carried out the activity, and those who did so on most days or very often.
Eleven guided focus group discussions were also conducted with children and young people in six schools in England. Each focus group comprised between six and eight children of the same year group, including a range of ethnicities reflecting the ethnic profiles of the schools involved. Participants’ ages ranged from eight to 15 years. In these focus groups, the children had the opportunity to suggest their own ideas about ways to well-being, and they were then led into a discussion about the nef ways to well-being that they did not mention themselves.
It is important to note some differences between the methodology used here, and the approach taken in developing the five ways for adults. The latter were based on a literature review predominantly of studies involving surveys, experiments, and neuroscience. The study we present here is inevitably based on less data, but it does incorporate evidence from focus groups, which the adult studies lacked. As a result, any differences found could be a result of the differences in methodology, and not necessarily differences between children and adults.
In the following sections we present the main findings from our research, structured around nef’s five ways. We discuss the qualitative and quantitative aspects of the research together. The information provided here is of necessity brief, however, a full research report will be available at: www.childrenssociety.org.uk/well-being
Source: Quaterly survey, Wave 10
% of children aged 10 to 15

38 | The Good Childhood Report 2013
Figure 30: Difference in well-being between children who carry out an activity most days/very often, and those who never do
Seeing friends
Chatting to friends on the phone or via social websites
Seeing people in your family that you don’t live with
Talking to people in your family about things that matter to you
Playing sports on a team
Playing sports or doing exercise not on a team
Walking or cycling
Learning new things for fun
Reading for fun
Teaching yourself new things
Taking part in organised activities
Helping out around the house
Taking care of siblings or other family members
Volunteering
Paying attention to how you feel physically
Paying attention to your feelings and emotions
Noticing and enjoying your surroundings
0.0 1.0 2.0 3.0 4.0 5.0 6.0
Connect
One of the most commonly cited activities for improving well-being was spending time with friends or family. For some children this was intrinsically linked with a certain activity – such as playing or going on holiday – whilst for others spending time with friends or family was the main emphasis.
In particular, children valued the support that they received from their friends and family:
‘[Friends] are funny, they’re kind to you… You look out for each other, look after each other. Me and my friend say that we’ll protect each other and stand by each other’s side, like if one of us gets bullied we’ll help each other cos that’s what we always do.’
‘I think it’s important to tell your parents stuff as well as your friends. like if it were anything really serious or if it involved them I’d let them know.’
Although most of these discussions about relationships centred on friends and immediate family, children also talked about wider family, such as grandparents, aunts, uncles and cousins:
‘It’s like a treat when you get to see [wider family]’
The positive responses from children regarding the importance of ‘connecting’ with friends and family are consistent with the evidence from our survey research. Three of the ‘connect’ activities that we asked children about in our survey – seeing friends, talking to family about things that matter, and seeing extended family – were positively associated with well-being.
Source: Quaterly survey, Wave 10
Difference in mean life satisfaction scores (out of 20)

The Good Childhood Report 2013 | 39
In the case of talking to family about things that matter, the relationship appeared linear – with each increase in frequency associated with roughly the same increase in well-being. A more striking pattern was observable in the data on seeing friends. The few children who reported never seeing friends had much lower well-being (a score of 8.4 out of 20, compared to an average of 13.9 for the survey as a whole). However, increasing frequency beyond ‘less than once a week’ seemed to make little difference.
Interestingly, chatting to friends on the phone or online was not associated in any way with well-being.
Be active
Another of the most frequently mentioned ways to improve well-being was physical activity. This sometimes took the form of organised sessions, such as playing football within a club setting, and sometimes referred to informal activities such as bike riding in the local neighbourhood.
‘The park has obstacle things where you can be active and you can go on the swings, it just makes you feel happy to do it.’
As well as associating physical activity with feeling good, some children also associated it with functioning well. As one young person indicated, for her it engendered a sense of vitality.
‘I used to go running in the mornings, before I hurt my knee. I would be in a better mood in the day, and feel wide awake.’
In addition to the more immediate well-being effects of their physical activities, some children also acknowledged the longer-term, health benefits, which themselves could bring peace of mind.
‘If you keep fit you know that you won’t get diseases later in life like obesity... That makes you feel good.’
These findings are supported by what we found in our survey research. All three of the ‘be active’ activities that we asked about – walking or cycling, team sports, and non-team sports or exercise – had significant associations with children’s well-being.
The clearest relationship was for non-team sports and exercise, for which well-being increased in line with frequency. In comparison, for cycling or walking, the biggest effect was the substantially lower well-being of children who ‘never’ walked or cycled. This highlights that even a little walking or cycling is associated with higher well-being.
Never Hardly ever
Less than once a week
Once or twice
a week
Most days
Every day
10.0
10.5
11.0
11.5
12.0
12.5
13.0
13.5
14.0
Figure 31: Children’s well-being by frequency of talking to family about things that matter
14.5
15.0
Never Hardly ever
Less than once a week
Once or twice
a week
Most days
Every day
8.0
Figure 32: Children’s well-being by frequency of seeing friends
15.0
14.0
13.0
12.0
11.0
10.0
9.0
Source: Quaterly survey, Wave 10 Source: Quaterly survey, Wave 10

40 | The Good Childhood Report 2013
Learning
An enthusiasm for learning and its positive effects came through strongly in our focus groups with children, both in relation to school and outside of school, in formal settings and informally.
‘Well you learn everyday even if you don’t go to school cos there are so many things around you and you don’t actually know what everything is, so you actually learn something all the time even if it isn’t school or a game, just by seeing things.’
For some children, learning was a sole pursuit, whereas for others it was social, an experience to be shared with others. There was also the suggestion that being informed about the world could be important for social relationships.
‘I like watching the news, you come away thinking you’ve learned something about the world and you can tell your friends and it gives you something to talk about.’
For some children, an understanding of the longer-term benefits of learning was a key part of what made it so enjoyable.
‘I enjoy learning, I absolutely love learning in my favourite lessons. I also enjoy learning in other lessons cos I know they’ll contribute to what I want to do when I’m older.’
Enthusiasm for learning was also linked to a sense of achievement, which we discuss in more detail within the ‘cross-cutting themes’ section.
Again, the evidence from our focus groups is supported by our survey research. All four of the learning activities that we asked children about in our survey – reading for fun, learning new things for fun, teaching yourself new things, and taking part in organised activities – were significantly linked with well-being.
The strongest relationship was for reading for fun, with a three-point difference on a scale of zero to 20 between those who never read for fun, and those who read for fun most days. For the other three learning activities, the biggest effect was the substantially lower well-being of children who ‘’never’ or ‘hardly ever’ carried out learning activities, suggesting that even a little learning can improve well-being substantially.
Never Hardly ever
Less than once a week
Once or twice
a week
Most days
Every day
10.0
10.5
11.0
11.5
12.0
12.5
13.0
13.5
14.0
Figure 33: Children’s well-being by frequency of doing exercise and sports (not on a team)
14.5
15.0
Never Hardly ever
Less than once a week
Once or twice
a week
Most days
Every day
10.0
10.5
11.0
11.5
12.0
12.5
13.0
13.5
14.0
Figure 34: Children’s well-being by frequency of walking or cycling
14.5
15.0
Source: Quaterly survey, Wave 10 Source: Quaterly survey, Wave 10

The Good Childhood Report 2013 | 41
Never Hardly ever
Less than once a week
Once or twice
a week
Most days
Every day
Figure 35: Children’s well-being by frequency of reading for fun
Never Hardly ever
Less than once a week
Once or twice
a week
Most days
Every day
9.0
Figure 36: Children’s well-being by frequency of teaching yourself new things
16.0
15.0
14.0
13.0
12.0
11.0
10.0
Take notice
Perhaps the most difficult of nef’s five ways to well-being to discuss with children was ‘take notice’. The principle on which it is based – mindfulness meditation – has very little precedent in UK culture and language, and has only recently been identified as useful for children through initiatives such as Mindfulness in Schools, set up in 2007.
It is therefore not surprising that children did not mention this activity unprompted. However, there were three exceptions to this. The first was a year 10 pupil who said:
‘I go in the bath, like taking yourself out of everything that’s busy, to calm myself down I’ll just go in the bath and it makes me forget everything.’
One young person made a connection between mindfulness and meditation, or prayer, with which she was familiar through her religious practice. When asked if anyone had heard of mindfulness she responded with the following:
‘Like meditation you mean? Like it’s part of our religion to pray, we do like praying where we focus on more important things... Yeah it makes you feel more calm, it makes you understand more what’s going on around you and makes you improve yourself.’
One set of children attended a school where a teacher had introduced some of the practice and principles of mindfulness. These children reported positively on the experience, noting a sense of calmness, happiness and freedom from ‘bad thoughts’.
‘It makes me feel nice and calm and happy and peaceful.’
‘It makes me feel not stressed, not like ‘I need to do this, then I need to do this, then I need to do this’. It’s like it gets the bad thoughts out of my head.’
‘I feel calm and peaceful and I feel like I want to take on the day.’
Our survey research supports the tentative evidence suggested by the focus groups that awareness of physical and emotional feelings, as well as of the surroundings in which children live, may be important for children’s well-being. Of all the activities that we asked children about in our survey, the one with the strongest relationship to well-being was ‘noticing and enjoying your surroundings’.
Source: Quaterly survey, Wave 10 Source: Quaterly survey, Wave 10
10.0
10.5
11.0
11.5
12.0
12.5
13.0
13.5
14.0
14.5
15.0

42 | The Good Childhood Report 2013
Giving
Children in the focus groups only talked about giving when prompted. In the first instance, our questions about helping at home or with siblings yielded mainly negative responses. However, when we broadened our questioning to include being kind or doing things to help others in non-specified ways, children’s responses were far more positive, and it was evident that those who did these things, felt good about doing so.
Giving was often linked to another activity. One participant spoke of her love of creative activity in terms of how this allowed her to give something to others:
‘I like making things and drawing things because I can give it to someone and make them happy... like my sisters and my mum.’
Another participant spoke of her love of dance, noting that what she really enjoyed was teaching others:
‘It’s nice seeing the younger ones and how they progress and get better, it’s a good feeling and makes me feel like I’ve helped them get there.’
For many, giving was achieved through everyday acts such as holding doors open for people or putting money in a charity collection tin.
‘It’s like if you go to a shop and put your change in the charity box it makes you feel good cos you’ve helped.’
As with the group discussions, the survey data also produced weaker evidence in relation to giving. Helping out around the house was significantly related to well-being but the association was not strong. However, the discussion above in relation to the qualitative research suggests that we may not have been asking the right questions.
Never Hardly ever
Some- times
Often Very often
All the time
10.0
Figure 37: Children’s well-being by frequency of noticing and enjoying surroundings
16.0
15.0
14.0
13.0
12.0
11.0
Never Hardly ever
Less than once a week
Once or twice
a week
Most days
Every day
Figure 38: Children’s well-being by frequency of helping out around the house
Source: Quaterly survey, Wave 10 Source: Quaterly survey, Wave 10
10.0
16.0
15.0
14.0
13.0
12.0
11.0

The Good Childhood Report 2013 | 43
Creativity and imagination
Might there be another activity which represents a clearer fifth way to well-being for children? Our focus group discussions pointed towards a set of activities around creativity, imagination and perhaps simply play.
This over-arching category includes activities such as informal play (inside or outside, alone or with friends), creative activities, electronic games, and organised extra-curricular activities. Some of these activities have already been discussed in relation to the learning theme. There is considerable cross-over for all of the ways to well-being, and this theme is no exception. For example going to an after school club or playing on a games console may be a way of interacting with friends, learning new things and having fun. However, we group these activities together here because the creative and imaginative aspects of this theme were a particularly strong feature experienced and conceptualised by children.
‘I like designing stuff. I like sketching things, copying things - it just makes me feel good that I can draw stuff.’
Enabling and preventing factors
As well as asking children what activities they thought contributed to a good life, we also asked them what factors would enable them and hinder them in carrying out those activities. The enabling and disabling factors can be categorised as either intrinsic (physical and psychological), or extrinsic. Some children spoke of intrinsic factors such as having certain health conditions – for example asthma – which prevented them from participating in physical activities of their choice. There was also a discussion of psychological factors such as lacking the belief that they can do something well enough.
However, most of the barriers or enablers that children cited were extrinsic. The most predominant here was having permission, usually from parents, to do certain things. Another obstacle was siblings – either because they got in the way of children being able to enjoy ways to well-being activities or because they needed to be cared for.
For many children, having busy schedules was a barrier to doing things that make them happy, or doing more of them, as illustrated in the following excerpt:
‘If you have Arabic classes or you have school, and you have to do your homework, that’s important, and help your mum if she has babies.’
This echoes the evidence that adults in the UK also do not have enough time on their hands, compared to those in many other countries in Western Europe.
Related to the above, there was also a sense that one way to well-being could be a barrier to engaging in another. For example, commitments to friends or family could prevent children from spending time doing a much-loved hobby, and commitments to learning – though enjoyed – could prevent children from spending as much time with family and friends as desired.
Several children spoke of bullying or power imbalances within groups of children that prevented them from engaging in desired activities. As one young boy put it:
‘Big kids, they take over the adventure playground and make it really hard for little kids, and sometimes they just take the ball and then they keep it to themselves… So then you can’t play.’
And for others, lack of money or transport was a factor preventing them from attending activities outside the home.
‘Sometimes with the activities, it’s too far away so you always have to have someone to pick you up and drop you off, so it could be a problem.’
This was confirmed in the survey analysis, as children who lived in households in the bottom income quartile of the survey carried out the fewest five ways activities.
Many of these enabling and preventing factors point to the way in which the issue of autonomy is particularly important for children. We turn to this, as well as to other cross-cutting issues, in the following section.

44 | The Good Childhood Report 2013
Cross-cutting issues
In this section we report briefly on two cross-cutting themes, which arose throughout discussions of each of the ways to well-being – a sense of autonomy and a sense of achievement. The emergence of these two themes corroborates the self-determination theory of psychologists Richard Ryan and Edward Deci, which posits that autonomy, a sense of competence and relatedness are universal psychological needs (Deci & Ryan, 2000).
The importance of autonomy
Perhaps the most significant issue to cut across all areas of our focus group discussions was that of autonomy. Indeed, for some people it was cited directly as a way to well-being in itself, although we have not considered it as such because it is not amenable to being ‘done by’ children as the other ways to well-being arguably are.
When probed for what it was they enjoyed about a certain activity, children often described the feeling of independence it afforded them:
‘It’s not the actual game playing on my PS3, it’s having that time and the independence to do what I want.’
And for some, the focus was on the negative aspects of having little or no say in what they did:
‘I used to play the piano and my step dad made me practice every single day, like every day I had to play for an hour, and it just became horrible cos, well I really enjoyed playing the piano but the fact that he would like tell me I had to do it for an hour a day, it just really annoyed me. Now I’m trying to teach myself the guitar and I enjoy that cos no-one’s telling me to do it.’
The importance of achieving
For many children, activities cited as making them happy transpired to have positive effects because of the sense of achievement they engendered. As well as emphasising other benefits of certain activities, children often spoke of the sense of development they achieved and the pride they took in this. As one older boy noted with regard to skate boarding:
‘You can see yourself progressing.’
Similarly, a sense of being capable, and feeling good as a result, is evident in the narrative of a girl in the middle of our age bracket:
‘I like designing stuff. I like sketching things, copying things - it just makes me feel good that I can draw stuff.’
Again, a similar sentiment is evident in the statement of a young girl, who spoke of her love of skipping:
‘At first I didn’t know criss-cross jumping, it’s so hard, but now I know and I can do it. It makes me feel proud.’
Ways to well-being
In summary, we found good evidence for four of nef’s five ways – Connect, Be active, Take notice, Keep learning – in our research with children. Evidence for the fifth – Give – was more mixed, although children did talk about being kind and doing things to help others in an informal sense, suggesting that giving makes most sense to children in terms of their relationships with others. We also found evidence for a potential new fifth way to well-being relating to creativity, imagination and play.

The Good Childhood Report 2013 | 45
Summary• In this chapter we look at what can be done to
improve children’s well-being by children and families themselves as well as at the national and local policy level, and via services.
• An essential prerequisite for interventions to improve children’s well-being is available evidence from children about their lives.
• At the national level, recent cross-national comparisons of self-reported well-being show that children in the UK are approximately mid-table when compared to other similar countries. Analysis of the national policy contexts in which children have higher or lower average well-being can be a useful way of identifying changes to policy that could improve children’s well-being in the UK.
• Evidence from the well-being pilots that we have recently carried out with three local authorities demonstrates that well-being measures can be used at the local level to improve our understanding of the ways in which children in a particular area are faring, and to help identify priorities for local policy and strategic planning.
• Well-being measures can also be used at an individual level to inform specific interventions. Our analysis of the Understanding Society survey shows that children who have low life satisfaction but do not meet thresholds for mental ill-health are more likely to experience a range of poor outcomes in relation to school, family and health behaviours than children with higher life satisfaction. This points to the useful role that well-being measures could play in the early identification of problems in children’s lives, which would enable early intervention to prevent the entrenchment of these problems.
• Finally, in Chapter 4, we also consider what children themselves can do to maintain and promote their well-being. We found good evidence for four of nef’s five ways: Connect, Be active, Take notice and Keep learning, in our research with children. The evidence on the fifth way, Give, was more mixed, although informal help for others did seem important for relationships and well-being overall. We also found evidence for another way to well-being specific to children relating to creativity, imagination and play.

5 Conclusions
This report provides both an update of evidence on the well-being of children and young people in England, and an update on the research programme on children’s well-being conducted by The Children’s Society in collaboration with the University of York.
Overall our research programme has set out to answer three key questions:
1. What does well-being mean from a child-centred perspective?
2. Is it possible to measure children’s well-being through self-report measures?
3. If so, is it practically useful to do so?
In this concluding chapter we provide an overview of our progress in answering these three questions, including a summary of key new findings in the current report.
What does well-being mean from a child-centred perspective?
Our initial work focused primarily on this question through qualitative survey questions involving over 8000 young people aged 14 to 16 in 2005 and the subsequent consultations we undertook with a wider age range as part of The Good Childhood Inquiry.
The evidence we gathered from children has formed the foundation of the ongoing research work and many of the key themes from this early evidence are represented in the current report. For example, our early work identified the fundamental importance of close relationships for children’s sense of well-being; the significance of a sense of choice and autonomy; and children’s wish for ‘enough’ money and material resources for their everyday lives and activities (as opposed to wealth). These themes are the focus of Chapter 3 of the report which provides new findings on choice, family relationships and material deprivation:
• The significance of a sense of choice has been a recurring theme in our statistical analysis of what contributes to children’s well-being. The new evidence we present from qualitative interviews with young people sheds light on the meaning of ‘choice’ for young people in different circumstances in relation to their family,
their friendships, school and their sense of self. This material provides valuable insights on this important theme.
• The new evidence we present on family relationships and well-being builds on our previous work on this issue and demonstrates the importance of three key dimensions of family relationships; family conflict, parental support and parental autonomy-granting, that together each make a significant contribution to variations in children’s self-reported well-being.
• The new analysis on material deprivation also extends our previous work by presenting statistics demonstrating what life is like for children living in poverty. It is interesting that here again, the association between deprivation and a sense of choice emerges as an important aspect of the analysis.
In the current report we have also picked up on another key theme from our initial research with young people in 2005. One of the issues that young people recognised was the way in which their own choices and behaviours could impact on their well-being. This is a theme we have only recently begun to explore and Chapter 4 presents important new evidence on ways in which children’s behaviours are associated with their sense of well-being.
This range of new evidence expands our understanding of what well-being means from a child-centred perspective.
Is it possible to measure children’s well-being through self-report measures?
This second key question was a key focus of several reports we published in 2010 and 2011 which presented details of statistical testing on measures of overall subjective well-being (Rees et al, 2010a), an index of well-being in particular aspects of life (Rees et al, 2010b) and a child-centred index of material well-being (Main & Pople, 2011).
In the current report we have provided some details of work we are undertaking to extend the measurement of children’s self-reported well-being to include psychological well-being (a sense of personal growth and development) as well as subjective well-being (satisfaction
46 | The Good Childhood Report 2013

The Good Childhood Report 2013 | 47
with life as a whole and particular aspects of it). This includes some initial evidence on the concept of ‘flourishing’ – that is, children who are both satisfied with their lives and have a sense of personal growth and development. Our initial estimates suggest that around four-fifths (81%) of children aged eight to 15 in England are ‘flourishing’, while around 10% have relatively low well-being both in terms of life satisfaction and personal growth.
We hope to be able to develop and extend the measurement of psychological well-being in future work.
Is it practically useful to gather evidence of children’s self-reported well-being?
As the research programme has gradually accumulated evidence on the meaning and measurement of children’s well-being, we have increasingly focused on the question of the practical utility of measuring children’s self-reported well-being. In our earlier reports we have argued that asking children to evaluate their lives was important as a matter of principle, for example, in terms of consulting children in line with the UN Convention on the Rights of the Child. In the current report we focus more on the potential uses of self-reported well-being evidence to inform policy and practice.
Chapter 4 of the report suggests a framework for thinking about practical uses of well-being measures at a national, local, service and individual level.
In relation to national policy, the evidence presented in Chapter 2 on time trends in children’s self-reported well-being in the UK, and the recent UNICEF evidence reproduced in Chapter 4 provides food for thought. This evidence suggests both that children in the UK are still not faring well in comparison with many developed nations (the UK was 14th out of 29 countries on children’s life satisfaction in the recent UNICEF report) and that after a period of moderate increase, children’s well-being in the UK may have started to fall. In order to make use of this type of time series and comparative data, national governments need more specific information about particular potential areas for improvement and the findings which will be generated from the Children’s Worlds survey being conducted in a diverse range of countries around the world will provide important evidence in this respect.
At a local level, we have recently made significant progress in demonstrating the practical value of asking children to evaluate their lives. We have
worked with three local authorities to pilot well-being surveys at a local level. In Chapter 4 we present evidence from the first of these pilots on the Isle of Wight. The survey highlighted several aspects of life (family relationships and local facilities) where children on the island were happier than the national average as well as some aspects where they were less happy than average (appearance and safety at school). This evidence is already being used by the local authority to inform its future children’s strategy.
Chapter 4 also presents some initial findings from a piece of analysis we are undertaking of data from the Understanding Society survey to explore the overlaps and distinctions between self-reported well-being and mental ill-health. Our findings so far suggest that, as has been found in research in other countries, positive well-being is not simply the absence of mental ill-health. Our analysis indicates that there are many young people who do not meet the criteria for mental health problems but are nevertheless substantially unhappy with their lives. Moreover these young people are significantly more likely to have low academic motivation and poor quality relationships with family – factors that may impact on their future well-being. There is therefore potential value in practitioners using measures of self-reported well-being alongside existing measures of mental health problems to identify young people who may be in need of interventions.
Finally in Chapter 4 we also consider what children themselves can do to maintain and promote their well-being. We found good evidence for four of nef’s five ways to well-being – Connect, Be active, Take notice, Keep learning – in our research with children. The fifth – give – did not work so well, although children did talk about giving in an informal sense in their relationships with others. We also found evidence for a new fifth way to well-being relating to creativity, imagination and play.
Concluding remarks
In summary, the evidence presented in this new report, together with other research being undertaken internationally, strengthens the case for all those concerned with children’s welfare to take account of children’s own feelings and evaluations of their lives.
At both a national and a global level this is a time of huge social, economic, technological and environmental change. Inevitably there are risks that these changes will adversely affect children. An ongoing commitment to monitoring children’s self-reported well-being is an important first step in mitigating these risks and safeguarding children in the present and the future.
48 | The Good Childhood Report 2013
References
Aked J & Thompson S (2011). Five Ways to Wellbeing: New Applications, New Ways of Thinking. London: New Economics Foundation.
Antaramian, S. P., Scott Huebner, E., Hills, K. J., & Valois, R. F. (2010). A Dual-Factor Model of Mental Health: Toward a More Comprehensive Understanding of Youth Functioning. American Journal of Orthopsychiatry, 80(4), 462–472. doi:10.1111/j.1939-0025.2010.01049.x
Baumrind, D. (1991) ‘Effective parenting during the early adolescent transition’, in P. Cowan and E.M. Hetherington (eds) Family Transitions. Hillsdale, NJ: Lawrence Erlbaum
Beaumont J (2011) Measuring National Well-being – Discussion paper on domains and measures. Newport: ONS.
Bergsma, A., & Veenhoven, R. (2011). The happiness of people with a mental disorder in modern society. Psychology of Well-Being, 1(1), 1–6.
Bradshaw, J. and Keung, A. (2011) Trends in child subjective well-being in the UK, Journal of Children’s Services, 6, 1, 4-17.
Bradshaw J, Martorano B, Natali L & de Neubourg C (2013) Children’s Subjective Well-Being in Rich Countries. Working Paper 2013-03. Florence: UNICEF Office of Research.
Bronfenbrenner U (1979) The Ecology of Human Development. Cambridge, MA: Harvard University Press.
Casas, F., Sarriera, J. C., Abs, D., Coenders, G., Alfaro, J., Saforcada, E., & Tonon, G. (2011). Subjective Indicators of Personal Well-Being among Adolescents. Performance and Results for Different Scales in Latin-Language Speaking Countries: A Contribution to the International Debate. Child Indicators Research, 5(1), 1–28. doi:10.1007/s12187-011-9119-1
Casas, F., Tiliouine, H., & Figuer, C. (2013). The Subjective Well-being of Adolescents from Two Different Cultures: Applying Three Versions of the PWI in Algeria and Spain. Social Indicators Research. doi:10.1007/s11205-012-0229-z
Chapple, S., & Richardson, D. (2009). Doing better for children. Paris: OECD.
Cummins R & Lau A (2005) Personal Wellbeing Index – School Children (Third Edition). Melbourne: School of Psychology, Deakin University
Cummins RA (2009) ‘Subjective wellbeing, homeostatically protected mood and depression: a synthesis’. Journal of Happiness Studies. (Published online 9th October 2009).
Deci, E. L., & Ryan, R. M. (2000). The ‘what’ and ‘why’ of goal pursuits: Human needs and the self-determination of behavior. Psychological Inquiry, 11, 227-268.
Diener, E., & Chan, M. Y. (2011). Happy People Live Longer: Subjective Well-Being Contributes to Health and Longevity. Applied Psychology: Health and Well-Being, 3(1), 1–43. doi:10.1111/j.1758-0854.2010.01045.x
Diener E & Lucas RE (1998) ‘Personality and subjective well-being’.In Kahneman D, Diener E & Schwarz N (eds.) Hedonic psychology: scientific perspectives on enjoyment, suffering, and well-being. New York: Russell Sage.
Dinisman, T., Montserrat, C., & Casas, F. (2012). The subjective well-being of Spanish adolescents: Variations according to different living arrangements. Children and Youth Services Review, 34(12), 2374–2380. doi:10.1016/j.childyouth.2012.09.005
Furnham, A., & Petrides, K. V. (2003). Trait emotional intelligence and happiness. Social Behaviour and Personality. 31, 815-824.
Goldberg, L. R. (1990). An alternative ‘description of personality’: The big-five factor structure. Journal of Personality and Social Psychology, 59, 1216-1229.
Goodman R, Meltzer H, Bailey V (1998) The Strengths and Difficulties Questionnaire: A pilot study on the validity of the self-report version. European Child and Adolescent Psychiatry, 7, 125-130
Greenspoon, P. J., & Saklofske, D. H. (2001). Toward an integration of subjective well-being and psychopathology. Social Indicators Research, 54(1), 81–108.
Helliwell J, Layard R, & Sachs J (2012). World Happiness Report. The Earth Institute / CIFAR / CEP.

The Good Childhood Report 2013 | 49
Huebner ES (1994) ‘Preliminary development and validation of a multidimensional life satisfaction scale for children’ Psychological Assessment 6(2): 149-158
Keyes, C. L. (2002). The mental health continuum: From languishing to flourishing in life. Journal of Health and Social Behavior, 207–222.
Keyes, C. L. M. (2005). Mental Illness and/or Mental Health? Investigating Axioms of the Complete State Model of Health. Journal of Consulting and Clinical Psychology, 73(3), 539–548. doi:10.1037/0022-006X.73.3.539
Keyes, C. L., Dhingra, S. S., & Simoes, E. J. (2010). Change in level of positive mental health as a predictor of future risk of mental illness. American Journal of Public Health, 100(12), 2366–2371.
Laurent, J., Catanzaro, S., Joiner, T., Rudolph, K., Potter, K., Lambert, S., Osborne L, Gathright, T. (1999). A measure of positive and negative affect for children: Scale development and preliminary validation. Pscyhological Assessment, 11(3), 326–338.
Lyons, M. D., Huebner, E. S., & Hills, K. J. (2012a). The Dual-Factor Model of Mental Health: A Short-Term Longitudinal Study of School-Related Outcomes. Social Indicators Research. doi:10.1007/s11205-012-0161-2
Lyons, M. D., Huebner, E. S., Hills, K. J., & Shinkareva, S. V. (2012b). The Dual-Factor Model of Mental Health: Further Study of the Determinants of Group Differences. Canadian Journal of School Psychology, 27(2), 183–196. doi:10.1177/0829573512443669
Maccoby, E.E. and Martin, J.A. (1983) ‘Socialization in the context of the family: parent–child interaction’, in E.M. Hetherington (ed.) Mussen Manual of Child Psychology, Vol. 4. New York: John Wiley
Marques, S. C., Pais-Ribeiro, J. L., & Lopez, S. J. (2011). The Role of Positive Psychology Constructs in Predicting Mental Health and Academic Achievement in Children and Adolescents: A Two-Year Longitudinal Study. Journal of Happiness Studies, 12(6), 1049–1062. doi:10.1007/s10902-010-9244-4
Main G & Pople L (2011) Missing Out: A child-centred analysis of material deprivation and subjective well-being. London: The Children’s Society.
O’Connor, T. G., & Scott, S. (2007). Parenting and outcomes for children. York [England]: Joseph Rowntree Foundation. Retrieved from www.jrf.org.uk/bookshop/ebooks/parenting-outcomes.pdf
Office for National Statistics. (2011). Initial investigation into Subjective Well-being from the Opinions Survey. Newport: ONS. Retrieved from www.ons.gov.uk/ons/rel/wellbeing/measuring-subjective-wellbeing-in-the-uk/investigation-of-subjective-well-being-data-from-the-ons-opinions-survey/initial-investigation-into-subjective-well-being-from-the-opinions-survey.html
Olsson, C. A., McGee, R., Nada-Raja, S., & Williams, S. M. (2012). A 32-Year Longitudinal Study of Child and Adolescent Pathways to Well-Being in Adulthood. Journal of Happiness Studies, 14(3), 1069–1083. doi:10.1007/s10902-012-9369-8
Proctor CL, Linley PA and Maltby J (2009) ‘Youth satisfaction: A review of the literature’ Journal of Happiness Studies, 10: 583-630
Rees G, Bradshaw J, Goswami H & Keung A (2010a) Understanding Children’s Well-being: A national survey of young people’s well-being. London: The Children’s Society
Rees G, Goswami H & Bradshaw J (2010b) Developing an Index of Children’s Subjective Well-Being in England. London: The Children’s Society
Rees G, Pople L & Goswami H (2011) Links between family economic factors and children’s subjective well-being: Initial findings from Wave 2 and Wave 3 quarterly surveys. London: The Children’s Society
Rees G (2011) Still Running 3: Early Findings from our Third National Survey of Young Runaways, 2011. London: The Children’s Society
Ryff C (1989) ‘Happiness is everything, or is it? Explorations on the meaning of psychological well-being’ Journal of Personality and Social Psychology. 57(6): 1069-1081.
Soenens, B., & Beyers, W. (2012). The cross-cultural significance of control and autonomy in parent–adolescent relationships. Journal of Adolescence, 35(2), 243–248. doi:10.1016/j.adolescence.2012.02.007
Suldo, S., & Shaffer, E. (2008). Looking beyond psychopathology: The dual-factor model of mental health in youth. School Psychology Review, 37(1), 52–68.

50 | The Good Childhood Report 2013
Suldo S, Thalji A & Ferron J (2011) ‘Longitudinal academic outcomes predicted by early adolescents’ subjective well-being, psychopathology, and mental health status yielded from a dual factor model’ The Journal of Positive Psychology, Vol. 6(1) 17-30
The Children’s Society (2006) Good Childhood? A Question for Our Times. London: The Children’s Society
The Children’s Society (2012a) The Good Childhood Report: A review of our children’s well-being. London: The Children’s Society
The Children’s Society (2012b) Promoting Positive Well-being for Children: A report for decision-makers in parliament, central government and local areas. London: The Children’s Society.
UNICEF (2007) Child poverty in perspective: An overview of child well-being in rich countries, Innocenti Report Card 7, UNICEF: Florence
UNICEF Office of Research (2013) Child Well-Being in Rich Countries: A Comparative Overview (Innocenti Report Card 11). Florence: UNICEF Office of Research
Wilkinson, R. B., & Walford, W. A. (1998). The measurement of adolescent psychological health: One or two dimensions? Journal of Youth and Adolescence, 27(4), 443–455.
Wood, A. M., & Joseph, S. (2010). The absence of positive psychological (eudemonic) well-being as a risk factor for depression: A ten year cohort study. Journal of Affective Disorders, 122(3), 213–217. doi:10.1016/j.jad.2009.06.032

The Good Childhood Report 2013 | 51
Appendix 1: The research programme
The Children’s Society’s research programme on children’s well-being began in 2005 and is being undertaken in collaboration with the University of York.
AimsThe programme aims to:
• Develop a better understanding of the concept of well-being as it relates to children, taking full account of the perspectives of children themselves.
• Establish self-report measures of children’s well-being and use these to identify the reasons for variations in well-being and to monitor changes in well-being over time.
• Promote the widespread use of self-report measures of children’s well-being by policy makers, services and other organisations.
Research phases so farThe research programme consists of cycles of research involving consultation with young people; development and refinement of survey questions; and undertaking surveys and has generated a unique and comprehensive set of data on children’s well-being. So far, over 42,000 children and young people in the eight to 17 age range have participated in our surveys.
• In 2005, as part of a survey covering a range of topics we asked young people aged 14 to 16 what they felt were the most important ingredients for them to have a good life and what things prevented this. Over 8000 young people provided responses to these questions. The survey was administered in mainstream schools, special schools and pupil referral units in 25 areas of England by researchers at the University of York.
• We used young people’s responses to this survey, together with a review of existing international work on children’s well-being to devise and pilot our first well-being survey.
• This survey was conducted23 in 2008 with a representative sample of over 7000 children aged 10 to 15 in mainstream schools in England.
• We then undertook further consultation with younger children aged eight and nine years old and also tested out additional survey questions on topics not covered in 2008. From this work we developed two further surveys.
• The first was a follow-up to the 2008 survey in schools in late 2010 and early 2011. This survey24 included a representative sample of just under 6000 children aged eight to 15 in mainstream schools in England.
• We also initiated a cycle of brief quarterly surveys with children aged eight to 15 in the UK25 through an existing household panel.26 Each wave of the survey consists of a representative quota sample of 2000 children aged eight to 15. The first wave of the survey took place in July 2010 and data from the first 10 waves of this survey are used in this report.
• In 2011 we undertook supplementary samples27 of children in special schools and pupil referral units to represent the views of children who are not covered in mainstream schools surveys. These surveys were completed in 2012.
• In 2011, we also carried out the third wave of our Still Running surveys (previously conducted in 1999 and 2005), which have focused on the topic of young people running away from home. The survey involved a representative sample of over 7000 young people aged 14 to 16 in England and was administered by Dubit using an online questionnaire. As well as questions about running away, the questionnaire included questions about subjective well-being and family relationships.
• In 2012 we conducted 10 pilot interviews with young people aged 14 and 15 years old to test an interview method. We asked all the young people involved to respond to questions about choice in addition to two other areas of their choosing, from The Good Childhood Index.

52 | The Good Childhood Report 2013
• Later on in 2012 we also carried out some analysis of the UK data from the Understanding Society survey; including measures of life satisfaction, mental health problems and a range of other indicators of children’s lives. The questionnaire is completed by young people aged 10 to 15 in and included over 4800 young people.
• Earlier this year we completed our first local authority pilot in the Isle of Wight with children and young people aged eight to 17. Almost 5000 children and young people in 38 primary schools and six secondary schools participated in the survey. We expect to publish the findings from the two other local authority pilots over the next few months.
The findings presented in this report draw from all the surveys and consultation work undertaken so far.
Reports published so farOur first report from the research programme was a summary of themes from the consultation with young people through the 2005 survey, which was included in the launch report for The Children’s Society’s Good Childhood Inquiry in 2006 (The Children’s Society, 2006).
Subsequent reports have focused primarily on statistical findings from our survey work as follows:
• A report on the first statistical findings from our 2008 survey (Rees et al, 2010a)
• A brief paper, presenting The Good Childhood Index (Rees et al, 2010b)
• Findings from our quarterly surveys on the links between household economic factors and children’s well-being (Rees et al, 2011)
• A paper presenting a new proposed child-centred index of material deprivation and links to well-being (Main & Pople, 2011).
• The first in a series of annual reviews of children’s well-being (Rees et al, 2012)
• A report based on our survey work carried out in partnership with the Isle of Wight council (The Children’s Society, 2013).
All the above reports are freely available from: www.childrenssociety.org.uk/well-being
Findings from the surveys have also appeared in a chapter of an edited collection on children’s well-being (Bradshaw et al, 2010a); in several chapters of a recent overview of children’s well-being in the UK (Bradshaw, 2011); in two peer-reviewed journal articles (Bradshaw et al, 2010b), (Goswami, 2011); and in presentations at an international conference on children’s well-being.

The Good Childhood Report 2013 | 53
Notes
1. www.oecdbetterlifeindex.org/topics/life-satisfaction
2. www.ons.gov.uk/ons/rel/wellbeing/measuring-subjective-wellbeing-in-the-uk/first-annual-ons-experimental-subjective-well-being-results/index.html
3. Bivariate Pearson correlations for the three measures were 0.66 (happiness yesterday and life satisfaction); 0.58 (happiness yesterday and worthwhile) and 0.81 (life satisfaction and worthwhile.
4. Using exploratory factor analysis.
5. Note: Because our quarterly survey uses a household panel, it only includes children and young people living in households with older adults. This means that the sample of 16 and 17 year-olds covered is not entirely representative as it is likely to exclude young people who have already left home.
6. Note that the item about school does not appear in the chart as this question could not be asked of 16 and 17 year olds as many would have left school.
7. DWP (2012) Households below average income 1994/95-2010/11 http://research.dwp.gov.uk/asd/hbai/hbai2011/index.php?page=chapters
8. Each wave is collected over 24 months, such that the first wave of data was collected between January 2009 and January 2011, and the second wave between January 2010 and January 2012.
9. The indicator of prosperity was the proportion of young people entitled to free school meals in each school. Data has additionally been weighted for representativeness by numbers of young people participating per school, gender and free school meal quintiles.
10. Exploratory factor analysis and reliability analysis
11. Cronbach’s alpha coefficients were: 0.81 for parental support/communication; 0.76 for control/autonomy-granting; and 0.79 for family conflict.
12. Negatively framed questions were reverse-scored prior to summing.
13. This question, originally used with young people in the British Household Panel Survey was asked separately in relation to mothers and fathers and if the young person lived with both parents, a mean score was created for both parents
14. As for previous footnote.
15. The Pearson correlations with our life satisfaction scale (described earlier) were Support (0.48), Autonomy (0.42) and Harmony (0.51)
16. The correlation between life satisfaction and the SDQ total difficulties score was -0.453.
17. Using a threshold of 16 and above for the total difficulties score.
18. Using a threshold of four and above for the life satisfaction question (values range from one to seven with lower values indicating a higher degree of satisfaction).
19. Using logistic regression with age, gender, total difficulties score and life satisfaction score as independent variables and a binary variable relating to each of the seven questions in the bulleted list as dependent variable.
20. Note that the figures in the chart are for illustrative purposes only and do not take into account variations in age and gender.
21. We calculated the Huebner Score which is a scale from zero to 20, with zero being the lowest well-being, and 20 the highest.
22. The 2008 survey was administered for The Children’s Society by Ipsos Mori.
23. The 2010 survey was administered for The Children’s Society by the National Foundation for Educational Research.
24. The surveys have included all four nations of the UK although due to sampling issues children in Northern Ireland have only been represented in some waves of the survey.
25. The quarterly surveys are conducted for The Children’s Society by Research Now.
26. These supplementary surveys are being administered for The Children’s Society by Dubit.

54 | The Good Childhood Report 2013

The Good Childhood Report 2013 | 55

Find out more about our well-being programme at:
www.childrenssociety.org.uk/well-being
Email: [email protected]
The most disadvantaged children rarely suffer on just one front. We work directly with these children, many of whom have nowhere else to turn, to ensure that they are loved, valued and listened to. With them we fight childhood poverty, harm and neglect. Our network of programmes includes drop-in services for runaways, as well as children’s centres and support for young carers. We support children who are refugees from
violence, and we give those in care a voice. We transform the lives of many more children by pressurising government and local authorities to change policy and practice to protect them, and we challenge the negative attitudes that perpetuate harm and injustice. In hard times, children are among the hardest hit. We don’t just help them survive – we support them to flourish.
The Children’s Society
A better childhood. For every child.
Charity Registration No. 221124 | Photopgraphs modelled for The Children’s Society | © Laurence Dutton
A better childhood. For every child.