the gold bullion market - longwave group · the gold bullion market im now going to talk about gold...
TRANSCRIPT

1
The gold bullion market
I’m now going to talk about gold and silver. I will be talking mostly about gold, because gold’s role is
purely monetary, while silver is produced in larger quantities and today is mostly an industrial metal.
That is not to denigrate silver: far from it. Silver is certain to outperform gold, purely because it is
about twice as volatile. Furthermore, the monetary relationship that was established over time was
approximately 15 ounces of silver should exchange for one ounce of gold. The relationship today is
over 50.
Let me start with three statements which summarise the role of precious metals in society:
1. Gold and silver have always been the medium of exchange for social groups who divide and
share their labour. That is how co-operative society originated, and how it grew from family
groups to small communities, and then communities that traded and networked with one
another. It allowed social co-operation to develop beyond the limits imposed by barter.
2. Fiat currency is the product of government. Control of money is power. And if you can make
people use your fiat money you have ultimate power. Fiat money has always financed
political ambitions. Look at it this way: if your politicians said they want to spend a trillion
dollars defeating Iran, so they need to raise this in tax and every man woman and child will
have to contribute an average of $3,000, how would that go down? No, the way to raise a
trillion is to borrow and print it.
3. And lastly, fiat currencies always die. They die because governments always take the process
to destruction. Always. And that is true today.
That is why gold is so important. That is why governments have done everything they can to drive it
out of circulation. You all know this, or at least suspect it, which is why you are here today.
The total known stock of gold is estimated to be 170,000 tonnes. This estimate appears to be
reasonable, because the bulk of it has been extracted in the last 100 years, as exploration and

2
mining techniques have improved. The rate of annual supply is the green line in this chart. The
World Gold Council estimates that all of the world’s gold in 1945 amounted to less than 60,000
tonnes, and nearly twice as much has been mined since. In arriving at estimates of gold before
statistical records were available, estimates have been made of gold extracted in earlier gold rushes
and by earlier civilisations from ancient Egypt onwards.
If the records of Marco Polo, who travelled along the silk route to China in the late thirteenth
century, are credible the extraction of precious metals in China and Japan over the centuries must
be underestimated by western statisticians. This supports tales such as Yamashita’s gold, allegedly
seized during the Japanese occupation of Manchuria before and during the Second World War, and
anecdotal stories that the Chinese Government owns considerably more gold than officially declared
as owned by the central bank. The actual gold holdings of the Chinese government has implications
for the political power-play between China and the West, which I cover later on, but for the moment
it is fair to assume that the estimate of all known gold is unlikely to be wrong by more than 20 per
cent.
New supply from mines is running at about 2,700 tonnes per annum, and has not increased
materially in the last ten years. Future supply is hampered by lower grades, the absence of new large
discoveries and rising energy costs. What is not generally appreciated is that at the time of Bretton
Woods, world gold stocks were estimated at less than 58,000 tonnes, and central bank gold
accounted for 52% of this figure.
The largest producers in 2010 are shown in this table. The main features are the dramatic decline in
production by South Africa, the boost to world-wide production from heap-leaching techniques in
the late 1980s, and the growing dominance of the ex-communist countries in recent years. China in
particular has prioritised gold production, and preliminary estimates for her production in 2011 are
in excess of 360 tonnes.
The ownership of gold is far from clear. According to the World Gold Council, 30,750 tonnes of it is
owned by the central banks. However, there is evidence to suggest that this figure is inaccurate. So
we shall now look at their position.
Estimated mine supply by country ranked in 2010 (tonnes)2010 2009 2008 2005 2000 1995 1980 1970
China 345 314 288 224 154 139 - -
Australia 255 227 225 263 296 254 16 19
USA 230 216 234 262 353 317 31 55
South Africa 190 205 232 296 428 524 675 995
Russia 195 205 164 157 142 133 259 202
Peru 170 180 175 207 134 58 - -
Indonesia 70 90 90 167 124 63 - -
Ghana 83 90 81 63 60 62 - -
Canada 91 95 100 119 154 153 51 75
Uzbekistan 91 80 85 - - - - -
Others 880 870 682 761 729 545 189 131
World total 2,600 2,572 2,356 2,518 2,573 2,248 1,220 1,477
3
Central banking and gold
The central banks are the largest defined category of gold holders. Originally, the role of gold was to
back the central banks’ issue of paper money, which was convertible on demand. They, or
commercial banks in their network, obtained their gold from the public, who would deposit their
gold against a receipt. This receipt was standardised, and could be used instead of gold (or silver for
that matter) as money.
The first central bank was the Bank of England, which adopted this role as a result of the Banking Act
of 1844. This gave it the monopoly of issuing notes in England and Wales. By law, the Bank of
England had to be prepared to redeem its notes for gold, hence the statement on the face of each
note, “I promise to pay the bearer on demand the sum of – pounds”, followed by the signature of
the Chief Cashier. The Bank of England became the model for central banks throughout the empire
when the pound sterling was the international standard currency before the First World War, a
model copied by most other nations subsequently. This was how the bulk of known gold stocks, by
providing the backing for government-sponsored note-issues, ended up in the vaults of central
banks.
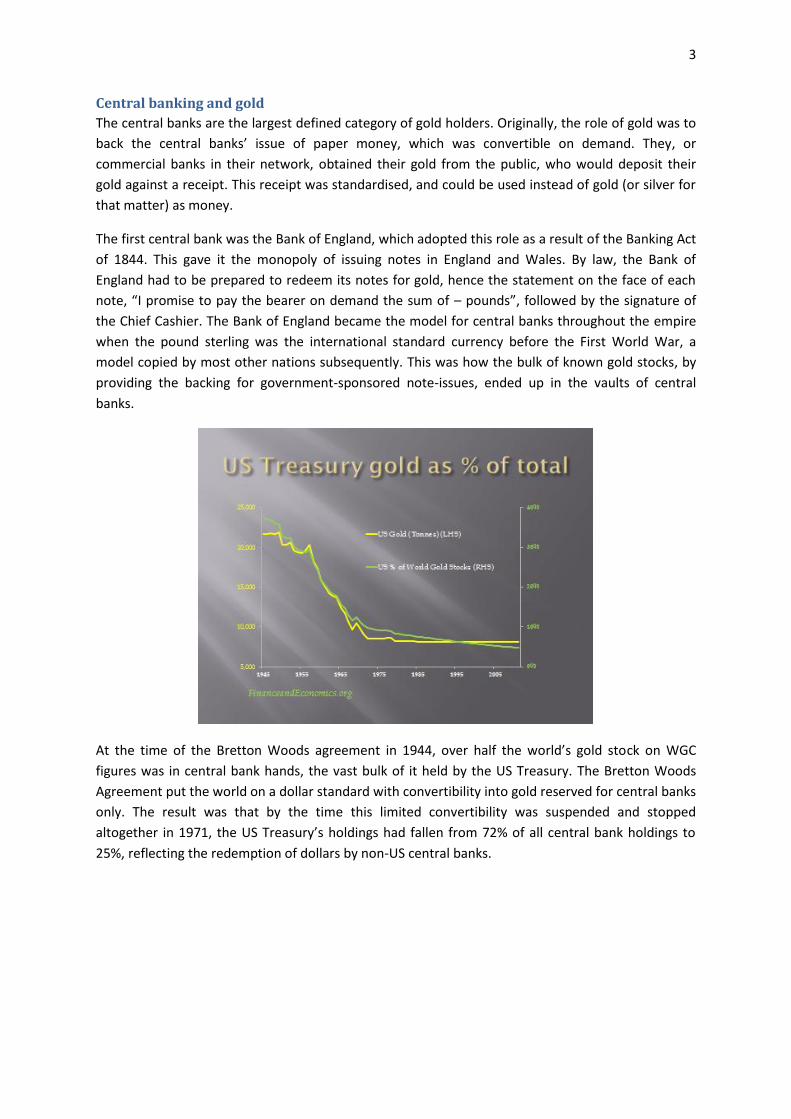
At the time of the Bretton Woods agreement in 1944, over half the world’s gold stock on WGC
figures was in central bank hands, the vast bulk of it held by the US Treasury. The Bretton Woods
Agreement put the world on a dollar standard with convertibility into gold reserved for central banks
only. The result was that by the time this limited convertibility was suspended and stopped
altogether in 1971, the US Treasury’s holdings had fallen from 72% of all central bank holdings to
25%, reflecting the redemption of dollars by non-US central banks.

4
This is shown in this chart, the dotted line being the point where the Bretton Woods Agreement
broke down. From that point in time, the leading central banks, led by the US, embarked on a policy
of removing gold entirely from the monetary system. For confidence to remain in unbacked paper
currencies, it was deemed vital that gold should lose all credibility as money. As Nixon said in his
speech to the nation, “The US dollar must never again be hostage to international speculators”. This
is a straightforward reference to those central banks, particularly the Banque de France, who were
redeeming their dollars for gold.
As can be seen in this slide, since the Nixon Shock in August 1971 there has been a small decline in
the US’s official gold holdings, as the US sold gold into a rising market in a series of sales in the years
following. This policy, which was designed to suppress the gold price failed completely, as gold was
eagerly absorbed by the market. Since then the remaining gold has sat on the G7 central banks’
books as an embarrassing asset.
In the mid-eighties central banks started to lease their gold to private-sector bullion banks. This gold
was used as the collateral for a carry-trade, which involved selling the leased bullion into the market
and using the proceeds to buy government debt. The cost of leasing central bank gold was less than
the yield on this debt, and at the end of the transaction, it was either rolled, or the debt sold or
redeemed, the gold bought back and returned to the central bank. Everyone was happy: the central
bank made some money as lessor, the bullion banks made some commission, the lessee made an
interest rate turn, and governments had buyers for their debt. A win-win-win-win situation!
In theory this is fine, so long as the gold, which has been sold into the market, can be reacquired.
Annual production during the 1980s averaged about 1,800 tonnes, and there is also the net balance
of jewellery fabrication and commercial demand to consider. Once one takes into account hoarding
and dishoarding it is impossible to know whether or not the stock was available to deliver leased
gold back to the central banks.
The evidence suggests that there was not the bullion available. Firstly, the London Bullion Market
has leveraged upwards its transactions on the bullion actually available, suggesting an underlying
shortage of bullion, and secondly the bullion market ran into difficulties in Sept 1999, when the Bank
of England and the Federal Reserve Board had to intervene.
5
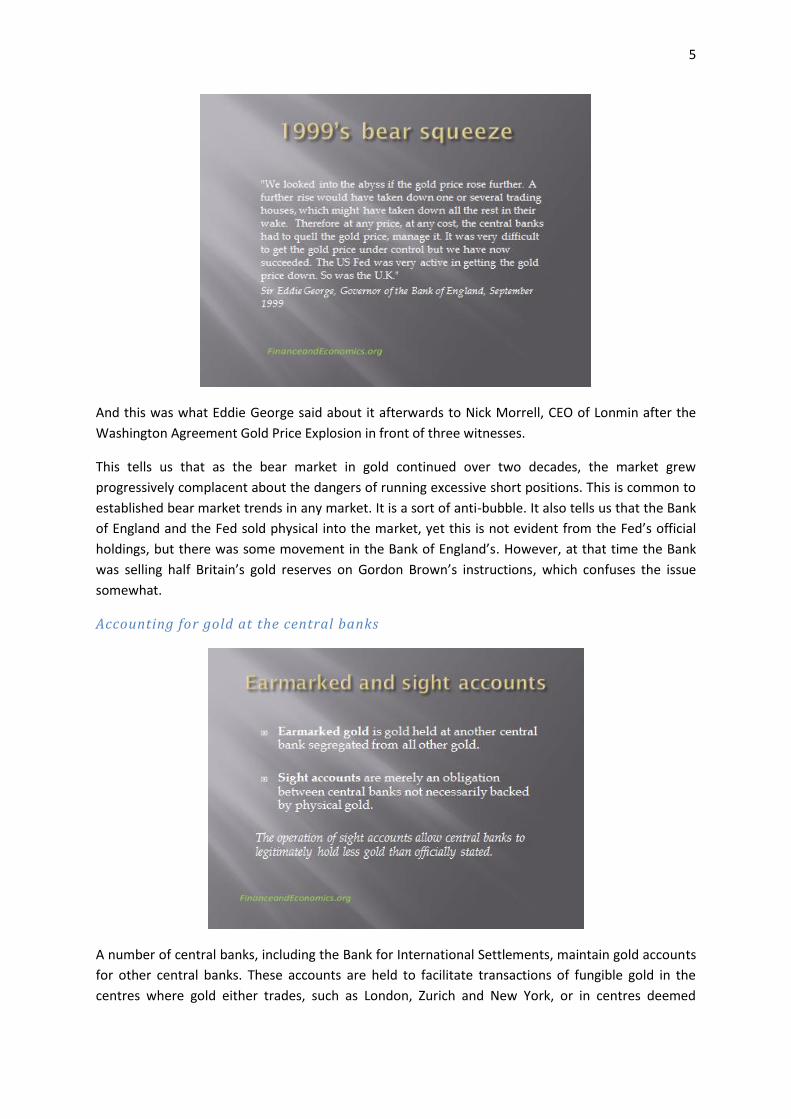
And this was what Eddie George said about it afterwards to Nick Morrell, CEO of Lonmin after the
Washington Agreement Gold Price Explosion in front of three witnesses.
This tells us that as the bear market in gold continued over two decades, the market grew
progressively complacent about the dangers of running excessive short positions. This is common to
established bear market trends in any market. It is a sort of anti-bubble. It also tells us that the Bank
of England and the Fed sold physical into the market, yet this is not evident from the Fed’s official
holdings, but there was some movement in the Bank of England’s. However, at that time the Bank
was selling half Britain’s gold reserves on Gordon Brown’s instructions, which confuses the issue
somewhat.
Accounting for gold at the central banks
A number of central banks, including the Bank for International Settlements, maintain gold accounts
for other central banks. These accounts are held to facilitate transactions of fungible gold in the
centres where gold either trades, such as London, Zurich and New York, or in centres deemed

6
strategically desirable. Of course, all central banks have the option to store their own gold, but given
that it has to be shipped to a settlement centre if it is sold, gold so held is viewed as a sterile asset.
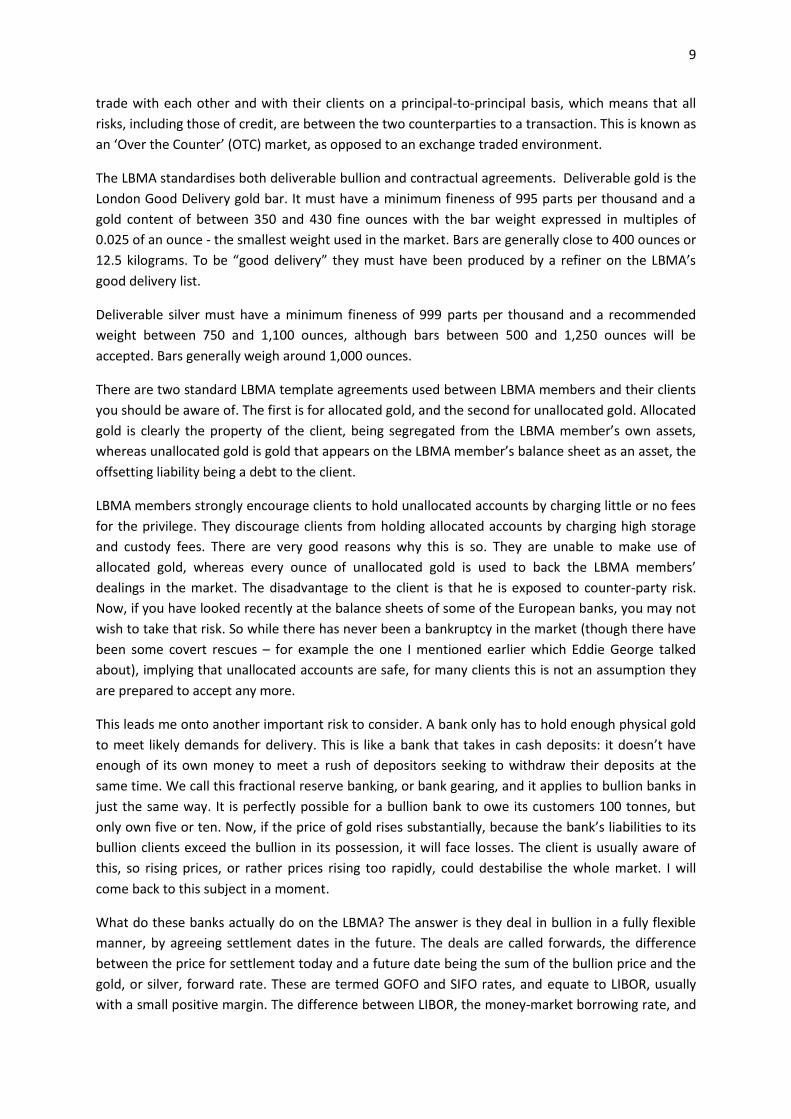
There are two types of gold account at the Central banks in the dealing centres:
1. Earmarked gold, where a central bank holds gold in custody for another central bank,
separated from all other gold accounts, earmarked and identified as the property of another
named central bank, and
2. Sight accounts, where a central bank has access to deposited gold, can use this gold for
settlements independent of the depositor, with a promise to the depositor that gold will be
made available to the amount deposited if so desired.
While there are differences, these facilities can be compared to those offered by a commercial bank,
where currency or gold can be held in custody, separate from the bank’s assets, or comingled with
them, exposing the depositor to counterparty risk.
Given that the primary reason for depositing gold with another central bank is that it can be used as
a fungible asset, there is a preference for sight accounts. This gives a central bank, such as the Bank
of England, immense flexibility in managing bullion markets for a desired market outcome.
Furthermore, since gold can be bought from and sold into the market and still owed to the original
owner, there need be no change in officially reported holdings.
Given that gold has been substantially under-priced relative to paper currency in issue, besides
perhaps the spike in the gold price in 1979-80, the pressure has always been for central banks to
supply gold to the market. They did this originally through outright gold sales following the Nixon
shock, through declared sales by other central banks, such as the Swiss National Bank and the Bank
of England, and then sales formalised through a gentleman’s agreement limiting sales to 400 tonnes
a year from 1999 onwards (these are termed the Washington Agreements). Also, gold leasing by
central banks is commonly acknowledged in the London bullion market to have been a major supply
factor from the 1980s until 2008, when systemic risk became an issue generally.
It is the leasing activities and other unannounced interventions that are not reflected in central bank
gold accounts, the former because in a leasing agreement ownership remains with the lessor so it is
not reported, and the latter because they are hidden by the sight account system. The logical
conclusion is that thirty years of supplying gold to the market to keep gold well below its free market
value has depleted official gold reserves to a significant degree. And since central banks refuse to
discuss the matter, we have no idea how much of the officially declared gold actually exists. The
IMF’s gold is likely to be held on a sight basis in its entirety. When the IMF disposed of 400 tonnes
between 2009 and 2010, they turned down bids from the private sector, selling only to other central
banks. I believe this gold was in sight accounts (i.e. did not actually exist), so a condition of sale was
that it could only be transferred and held between central banks and supra-national government
organisations. This certainly seems likely, but the sale terms were never actually made public.
So, to summarise: the central banks at the heart of price manipulation have had the means to sell
substantial amounts of bullion without having to account for it.
The bullion banks

7
We now turn to the bullion banks. The bullion banks are defined as the banks that are members of
the London Bullion Market Association. The LBMA is the largest physical market by far. Daily
turnover is estimated at as much as 100m ounces, with daily settlements averaging about 20m
ounces. So every day on average, more than 3,000 tonnes are transacted, more than total annual
mine production. The market is an over-the-counter market between members and is unregulated;
unregulated for two reasons:
1. Commodity markets in London are specifically exempt from investment regulation.
2. It is a market entirely between professional members and members of the public are
excluded, so there is no regulatory need to protect the public.
There are eleven market-making members who have agreed to quote two-way prices to each other
during the London business day for agreed minimum quantities at least twice a day in both gold and
silver. They are shown on the slide above.
This is not to be confused with the daily fix, which for gold is between Barclays Capital, Deutsche
Bank, Scotiabank, HSBC, and Societe Generale. For silver it is between Deutsche Bank, Scotiabank
and HSBC. The fix provides an opportunity for market users through these banks to buy and sell gold

8
at a single quoted price. This is useful to users of the market who wish to deal at an official price,
rather than an ad hoc one between two or three market makers.
The gold fix is twice a day at 10.30am London time and 3.00pm. Silver is fixed once at midday.
Besides these market-makers, there are fifty-eight ordinary members, 27 of them banks from all
round the world, the remainder being commodity dealers acting mostly on behalf of producers and
fabricators. The list of banks is shown on this slide. These banks give us a clue to the governments
and citizens who are particularly interested in gold. Thus, we see China is represented by Bank of
China and the Industrial and Commercial Bank of China. This is interesting because China is now the
world’s largest producer at 345 tonnes, none of which she sells into the markets. So if these banks
do anything, they must be net buyers. The Swiss are represented by the two big banks, Credit Suisse
and UBS, and also by Julius Baer and Zurcher Kantonal Bank, presumably on behalf of the whole
Canton banking network.
We see the Eurozone represented by six German and French banks, which tells us that French and
German nationals, have a significant interest in gold investment. We therefore have to think about
the impact on appetite for gold from the nationals of these two countries from the Eurozone crisis.
We also have to consider the financial position of these banks, and their ability to deliver bullion to
their underlying customers, a point I will go into in a moment.
Besides these there are the banks you would expect to be on the list. The US is well represented by
Citibank, Morgan Stanley, to which we must add market-making members Goldman Sachs, HSBC
USA, JPMorgan Chase and Merrill Lynch. As well as dealing for their international clients, some of
these banks are very active in futures and options markets here in the US, so they are the main link
between the two markets.
About the LBMA
The LBMA’s client base is the majority of the central banks that hold gold, plus producers, refiners,
fabricators and other traders throughout the world. Members of the London bullion market typically
9
trade with each other and with their clients on a principal-to-principal basis, which means that all
risks, including those of credit, are between the two counterparties to a transaction. This is known as
an ‘Over the Counter’ (OTC) market, as opposed to an exchange traded environment.
The LBMA standardises both deliverable bullion and contractual agreements. Deliverable gold is the
London Good Delivery gold bar. It must have a minimum fineness of 995 parts per thousand and a
gold content of between 350 and 430 fine ounces with the bar weight expressed in multiples of
0.025 of an ounce - the smallest weight used in the market. Bars are generally close to 400 ounces or
12.5 kilograms. To be “good delivery” they must have been produced by a refiner on the LBMA’s
good delivery list.
Deliverable silver must have a minimum fineness of 999 parts per thousand and a recommended
weight between 750 and 1,100 ounces, although bars between 500 and 1,250 ounces will be
accepted. Bars generally weigh around 1,000 ounces.
There are two standard LBMA template agreements used between LBMA members and their clients
you should be aware of. The first is for allocated gold, and the second for unallocated gold. Allocated
gold is clearly the property of the client, being segregated from the LBMA member’s own assets,
whereas unallocated gold is gold that appears on the LBMA member’s balance sheet as an asset, the
offsetting liability being a debt to the client.
LBMA members strongly encourage clients to hold unallocated accounts by charging little or no fees
for the privilege. They discourage clients from holding allocated accounts by charging high storage
and custody fees. There are very good reasons why this is so. They are unable to make use of
allocated gold, whereas every ounce of unallocated gold is used to back the LBMA members’
dealings in the market. The disadvantage to the client is that he is exposed to counter-party risk.
Now, if you have looked recently at the balance sheets of some of the European banks, you may not
wish to take that risk. So while there has never been a bankruptcy in the market (though there have
been some covert rescues – for example the one I mentioned earlier which Eddie George talked
about), implying that unallocated accounts are safe, for many clients this is not an assumption they
are prepared to accept any more.
This leads me onto another important risk to consider. A bank only has to hold enough physical gold
to meet likely demands for delivery. This is like a bank that takes in cash deposits: it doesn’t have
enough of its own money to meet a rush of depositors seeking to withdraw their deposits at the
same time. We call this fractional reserve banking, or bank gearing, and it applies to bullion banks in
just the same way. It is perfectly possible for a bullion bank to owe its customers 100 tonnes, but
only own five or ten. Now, if the price of gold rises substantially, because the bank’s liabilities to its
bullion clients exceed the bullion in its possession, it will face losses. The client is usually aware of
this, so rising prices, or rather prices rising too rapidly, could destabilise the whole market. I will
come back to this subject in a moment.
What do these banks actually do on the LBMA? The answer is they deal in bullion in a fully flexible
manner, by agreeing settlement dates in the future. The deals are called forwards, the difference
between the price for settlement today and a future date being the sum of the bullion price and the
gold, or silver, forward rate. These are termed GOFO and SIFO rates, and equate to LIBOR, usually
with a small positive margin. The difference between LIBOR, the money-market borrowing rate, and

10
GOFO or SIFO is effectively the lease rate. It works like this. A bank sells gold for spot delivery, and
buys it back for delivery in 3 months’ time, the difference in price being the three-month GOFO rate.
It buys 3-month LIBOR with the proceeds and at the end of the three months closes the position and
takes delivery of the bullion. The profit is the difference between LIBOR and GOFO (or SIFO in the
case of silver), and is effectively the cost of leasing gold or silver for three months.
Now let’s look at two more examples.
Forward transactions are the basis for a range of other activities, such as loans, swaps, repurchase
agreements, leases, etc. First we will look at a simple transaction. In this deal, a producer delivers
gold to the Bullion Bank against payment, and the bullion bank sells it on to a fabricator. The BB
makes a simple turn on the deal.
The next slide is an example of a more imaginative deal. Here, the BB has persuaded the producer to
sell bullion forward, and the BB lends money to the producer against the deal, so that the producer
has instant cash to pay for his operations. The BB now knows that it will receive the gold in say six
months’ time. This allows it, on a fractional reserve basis, to sell 10 times as much to a hedge fund.

11
The hedge fund wants the deal to be financed, so that is a further income opportunity. The basis of
the deal, obviously, is that the gold is held in an unallocated account, so no delivery need take place.
The key to understanding the London Bullion Market is that gold bullion is simply the basis for many
transactions, earning banks dealing profits, commissions, and loan interest; and by using unallocated
accounts the gold itself need not exist. Furthermore, the settlements between bullion banks at the
end of a day’s trading are mostly done through book entries, because they tend to share the same
storage facilities.
There are many variations of deals the bullion banks do, and it is estimated that gold turnover can be
100 times the actual physical backing the deals. And that explains how the London Bullion Market is
able to turn over 3,000 tonnes a day. To this must be added all the banking transactions that ensue.
And while a bullion bank will be short of bullion on its unallocated accounts, the dealing and banking
profits that result from this massive turnover more than compensate for losses from a rising bullion
price, unless of course, there is a very sharp rise in the price.
Derivative markets
Now we move on to futures and options, derivatives, and the largest futures market by far is Comex.
For those unfamiliar with futures I’ll give you a brief definition: a future is a standardised contract on
a listed exchange that on expiry gives the owner the right to have the underlying asset delivered. Its
standardisation is the principal difference from a forward contract, which is more flexible. Being
listed on a regulated exchange they are more accessible to members of the public, both those who
wish to use futures to hedge risk, such as miners or farmers, and those that wish to speculate.
Unlike over-the-counter markets such as the LBMA, information is made available to non-
participants, in the interest of ensuring a fair market.
By far the largest precious metals futures market is the CME, or Comex. Besides noting that China is
developing futures markets in Hong Kong and Shanghai, these are as yet small compared with
Comex. So this analysis will concentrate on Comex.
Comex provides large amounts of price, volume, settlement and warehouse data all of which is
available through their website. Unless you are a dedicated dealer, monitoring it is very time
consuming. Instead, there are a number of blogs you can follow. Perhaps the most detailed free-bee
site is Harvey Organ’s daily Gold and Silver Report. Ed Steer’s daily email also produces a good
market summary together with links to stories that have caught his eye. There are also subscription-
based services, and in Silver I should mention Ted Butler. If you troll around the GATA website, you
will come across other names where a daily analysis of Comex trading is available.

12
One of the most useful tools is the weekly Commitment of Traders Report, which can be accessed
through the CFTC’s website: the CFTC is the Commodities Futures Trading Commission. For those not
familiar with actual dealing on an exchange floor, understanding the weekly COT Report can be very
difficult to comprehend, but if you follow the basics, you will be able to understand what others are
saying about the figures.
There are two sets of information break-down given to us. The first, with which most of us are
familiar, is shown on this slide. This is termed a Legacy Report, because it is now supplemented by a
separate report on what is termed disaggregated data, which I will come on to in a moment.
This legacy report, adapted here by Goldseek.com, is for gold contracts of 100 ounces for the week
ending Tuesday April 3rd (they always run Wednesday to Tuesday and are published on the following
Friday), and as you can see traders are broken down into three categories: Large speculators,
Commercials and others (small speculators). Commercials are at the heart of the system, and consist
of producers, fabricators, dealers in physical and banks dealing in bullion and swaps. A swap by the
way is the hedging of another position off-market.
The speculators or non-commercials include professional money managers, such as hedge funds, as
well as a wide array of non-commercial, or speculative traders. The term speculator here is
something of a misnomer. It includes investors buying futures with the intention of taking delivery. It
includes hedge funds who take a position to hedge another unrelated asset. The categories are
catch-all to a degree, because the COT reports are produced for all futures markets. There is also a
further legacy report which includes options on futures which I will omit for simplicity, but is also
available from the CTFC and published in this form by Goldseek.
To understand COT legacy reports, you have to appreciate that the commercials are in control of the
market most of the time. Producers in this category use the market to transfer entrepreneurial risk
to speculators. They will use the market to lock in today’s known prices to fund future production
costs, removing the possibility that they might get a lower price when physical product is ready to be
sold. So they sell futures with the intention of delivering product to the market. Fabricators and
processors, who are also Commercials obviously might want to take delivery in the future, and so

13
might want to lock in today’s prices for future delivery, removing the risk of a price rise in the
intervening time. The bullion banks, the most influential Commercials, might deal for their trading
book, they might hedge a position they have taken with clients on other markets (this is swap
activity), or they may be dealing for a client. The large bullion banks use futures as only part of their
overall activities.
Overall, there is likely to be a bias in gold and silver such that the commercials have a net short
position. This is because bullion banks in the Commercial category providing liquidity will respond to
demand, which as in any market will tend to be on the buy side, because non-commercials,
members of the public and money-managers, tend to be buyers on balance if they are at all
interested. So the commercials will always be net short, and the bigger that position, the more
overbought the market will be.
So when the commercials are adding to their longs and reducing their shorts, as you can see in this
report, that is giving us a possible signal. It would be reasonable for us to think that at the margin
the commercials think price falls are less likely than they did the previous week. We see that the
large speculators are cutting their positions long and short. The market appears to be less
overbought, which is at least less bearish, and probably bullish. Their spreading position, which is
when they are long of one maturity matched by a short on another (in other words they are taking a
financial arbitrage between maturities) we can basically ignore here.
The small speculators are also reducing positions, and since they are always the weakest holders,
this has to be bullish. And we can see that the level of outstanding contracts has fallen by 9,500. This
is also positive, but not in addition to the factors already covered.
The money in the market is always unbalanced in favour of the Commercial bullion banks. They have
lots of money, even your money as a taxpayer if they are too big to fail, and can always bluff anyone
not prepared to put up funds for delivery. This is because the non-commercials and speculators have
geared positions, which will magnify their losses. We see this happening time and time again. The
big commercial bullies wait for the punters to build up their long positions, and then they whack it
hard. They know that by doing so they will trigger all those stop-losses. In an afternoon they can
make $100 an ounce this way. They make lots more money trading this way than they lose from
being continually short in a bull market. You have been warned!
14
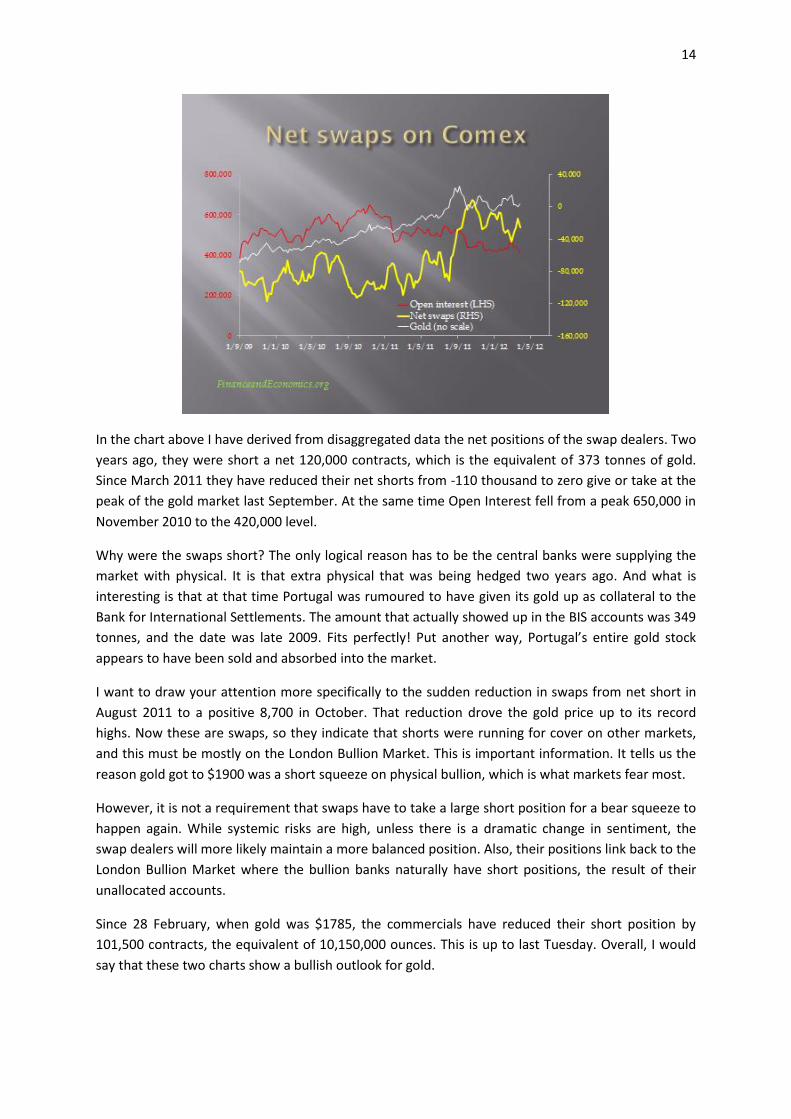
In the chart above I have derived from disaggregated data the net positions of the swap dealers. Two
years ago, they were short a net 120,000 contracts, which is the equivalent of 373 tonnes of gold.
Since March 2011 they have reduced their net shorts from -110 thousand to zero give or take at the
peak of the gold market last September. At the same time Open Interest fell from a peak 650,000 in
November 2010 to the 420,000 level.
Why were the swaps short? The only logical reason has to be the central banks were supplying the
market with physical. It is that extra physical that was being hedged two years ago. And what is
interesting is that at that time Portugal was rumoured to have given its gold up as collateral to the
Bank for International Settlements. The amount that actually showed up in the BIS accounts was 349
tonnes, and the date was late 2009. Fits perfectly! Put another way, Portugal’s entire gold stock
appears to have been sold and absorbed into the market.
I want to draw your attention more specifically to the sudden reduction in swaps from net short in
August 2011 to a positive 8,700 in October. That reduction drove the gold price up to its record
highs. Now these are swaps, so they indicate that shorts were running for cover on other markets,
and this must be mostly on the London Bullion Market. This is important information. It tells us the
reason gold got to $1900 was a short squeeze on physical bullion, which is what markets fear most.
However, it is not a requirement that swaps have to take a large short position for a bear squeeze to
happen again. While systemic risks are high, unless there is a dramatic change in sentiment, the
swap dealers will more likely maintain a more balanced position. Also, their positions link back to the
London Bullion Market where the bullion banks naturally have short positions, the result of their
unallocated accounts.
Since 28 February, when gold was $1785, the commercials have reduced their short position by
101,500 contracts, the equivalent of 10,150,000 ounces. This is up to last Tuesday. Overall, I would
say that these two charts show a bullish outlook for gold.
15
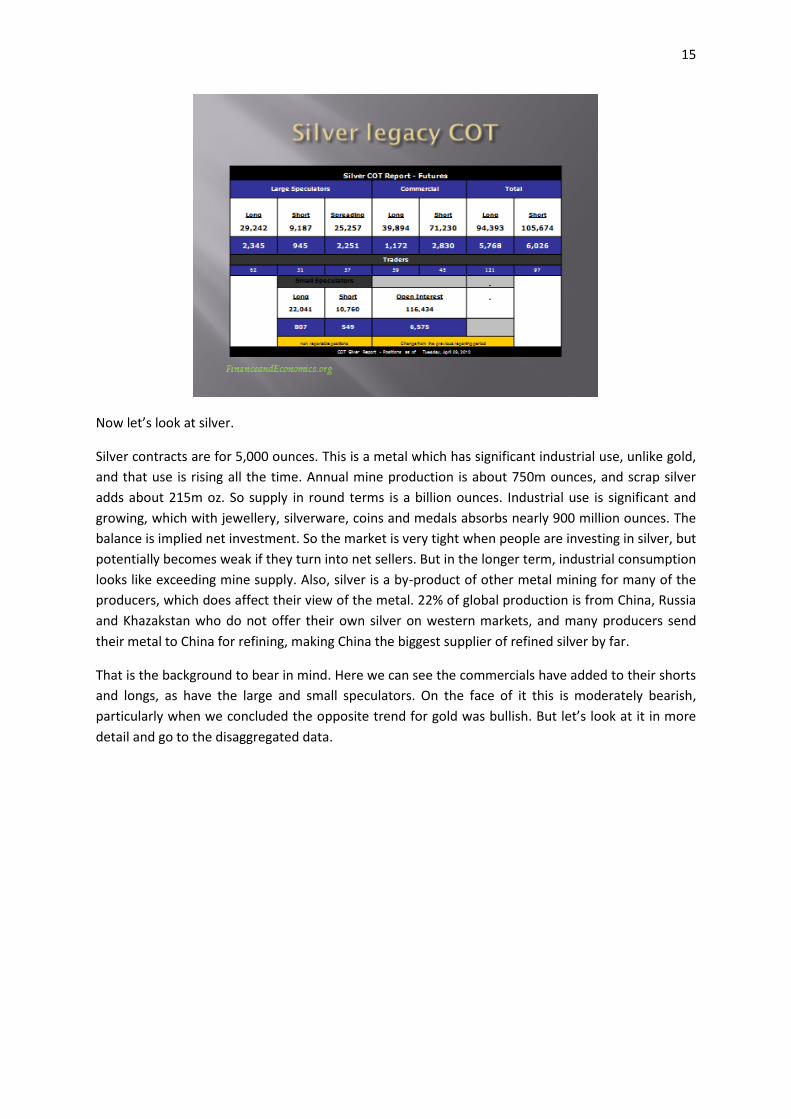
Now let’s look at silver.
Silver contracts are for 5,000 ounces. This is a metal which has significant industrial use, unlike gold,
and that use is rising all the time. Annual mine production is about 750m ounces, and scrap silver
adds about 215m oz. So supply in round terms is a billion ounces. Industrial use is significant and
growing, which with jewellery, silverware, coins and medals absorbs nearly 900 million ounces. The
balance is implied net investment. So the market is very tight when people are investing in silver, but
potentially becomes weak if they turn into net sellers. But in the longer term, industrial consumption
looks like exceeding mine supply. Also, silver is a by-product of other metal mining for many of the
producers, which does affect their view of the metal. 22% of global production is from China, Russia
and Khazakstan who do not offer their own silver on western markets, and many producers send
their metal to China for refining, making China the biggest supplier of refined silver by far.
That is the background to bear in mind. Here we can see the commercials have added to their shorts
and longs, as have the large and small speculators. On the face of it this is moderately bearish,
particularly when we concluded the opposite trend for gold was bullish. But let’s look at it in more
detail and go to the disaggregated data.

16
We know that the commercials have had a large illiquid short position, and that the swaps are
hedging shorts elsewhere. This is shown on this chart.
First, let’s deal with the swaps, which are the yellow line and the right hand scale. Unlike gold, the
swaps have been generally net long, with the exception of the beginning of 2011, when in February
the swap position spiked down to minus 8,932 contracts. Otherwise, over the period covered by the
chart, the average position works out at just over 2,500 contracts long. In February 2011 silver
crossed the $30 level on its way up to $50, so the swaps scrambled for cover, indicating that silver
bullion was in short supply. Interestingly, despite the dramatic slide from the highs at $48 on 28th
April 2011 to the lows last September and late December, the swaps continued to build long
positions. This indicates that despite the collapse in the silver price, there was still a shortage of
physical metal. Since then, the swaps have reduced their long positions, indicating that the balance
of bullion relative to physical demand has begun to ease market shortages.
Now let’s look at the Producers, bullion banks and fabricators, the green line and the left-hand scale.
Back in October 2009 their net short position was 640,000 contracts (320m ounces), while the gross
short position with the longs stripped out was 730,000 contracts (365m ounces). This is half global
mine production. Since then they have been reducing their short position, during the the run-up in
silver to its high at $48 and in the subsequent shake-out, and only began to increase their net shorts
from December. Of course, we do not know the actual identity behind these shorts, though it is well-
known in the market that JPMorgan, or a client of JPMorgan is the big short.
There is continual debate about this position, which was apparently inherited from Bear Sterns,
when JPMorgan took it over. Those of you who have followed this debate will know that JPMorgan
are routinely accused of market manipulation and even illegal dealing.
However, the head of JP Morgan’s, commodities division (Blythe Masters) publicly stated on TV
recently that they did not run uncovered positions. I cannot believe a senior executive of JPMorgan
goes on TV to tell a straightforward lie.

17
So, taking her statement at face value, JPMorgan’s silver position, which they took on from Bear
Sterns, has to be for a client, and that is most probably China, who besides being a major producer is
the largest refiner of silver concentrate and doré (which is semi-refined ingots). Others have
suggested the Fed, who certainly have a history of market manipulation. But I can’t see any logical
reason why they should manipulate silver: Gold yes, silver no. This also explains why JPMorgan has
been unable to comment and enquiries by the CTFC have yielded no comment, until Ms Masters
narrowed the field for us.
So the variable we need to know is actually how many months forward are the Chinese government
looking to sell their refined output. Given that management of commodities dealing is a centralised
government function, this is probably both a strategic, political decision and a commercial decision.
Bear in mind that from a commercial point of view, the Chinese want low silver prices, but from a
strategic point of view they probably want to build a strategic reserve. However, they have been
shortening their time horizon, which we can deduce from the green line on the chart above has gone
from many months (like six plus when you allow for forward purchases by fabricators) to perhaps
less than three months. Looked at another way, on the price decline from Feb 28 when silver was at
$37, the commercials have bought back 27,800 net contracts of silver (139 million oz). That is up to
last Tuesday (2nd May).
So, a legacy COT report which looks bearish on first sight is not bearish at all. All we can conclude is
that someone, most probably China, is controlling the price, and has been reducing their position.
Commercial considerations mean that ideally for China the price of silver should not rise too fast. But
it is already under-priced relative to gold at over 50 to 1, and the next rise in the gold price only
needs to take investment demand above 100m ounces annually for the price itself to take off again.
For the answer we have to look at China’s global political strategy and her gold position, which is at
the heart of my next subject.
Politics and precious metals
Gold
In my economic analysis earlier I gave you the history and reasons why gold became demonetised.
The advanced economies in the West set themselves on a course of increasing government control,
encouraged by their neo-classical economic approach. This was a course that the communist
countries backed down from in the face of crisis twenty years ago.
Their economics was Marxist. All the economists in the USSR and China were taught that capitalism
would destroy itself, because Marx said it would. And from that narrow point of view, they see this is
finally coming true. However, they have learned the pitfalls of communism, because it bankrupted
them. Beyond that there are differences between the new Russia and the new China. Russia is now
run by powerful men with little regard for democracy. China is run by the communist party,
struggling to keep diverse ethnic groups united and which is acutely aware of the consequences of
losing control. But there are things that unite them: wariness of America and NATO. There is fear of
terrorism. The strategy for dealing with these fears is no longer nuclear threats and suppression of
18
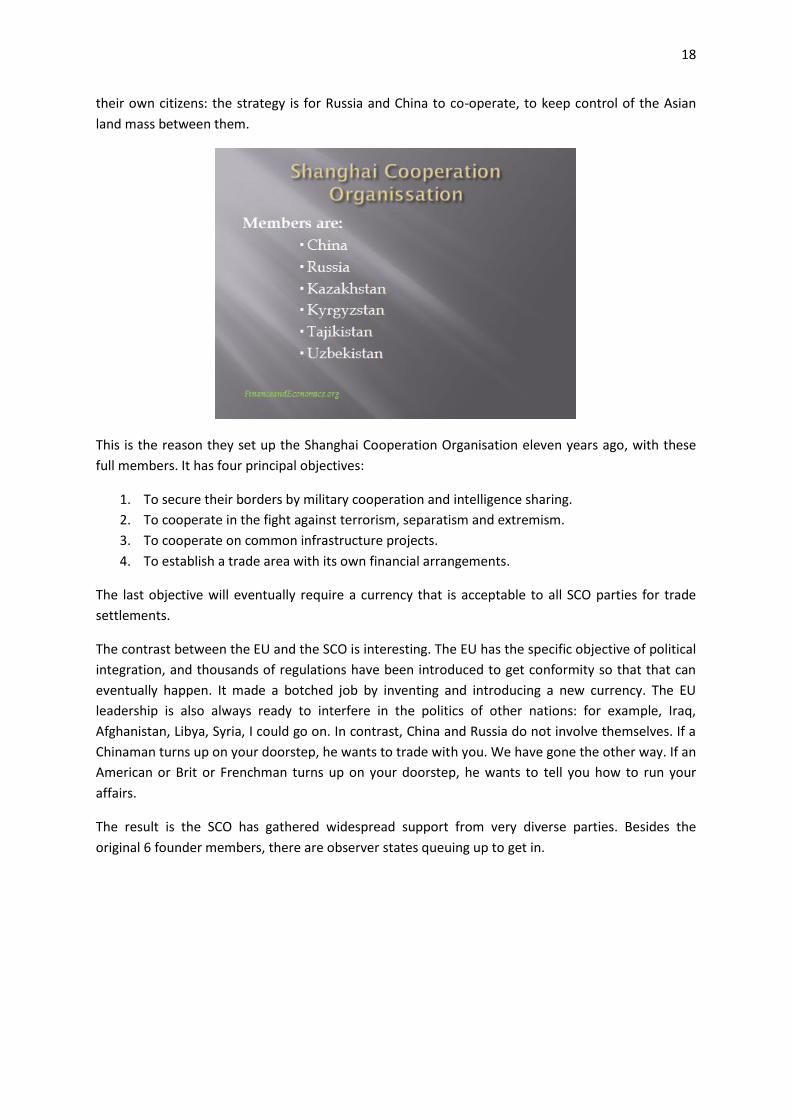
their own citizens: the strategy is for Russia and China to co-operate, to keep control of the Asian
land mass between them.
This is the reason they set up the Shanghai Cooperation Organisation eleven years ago, with these
full members. It has four principal objectives:
1. To secure their borders by military cooperation and intelligence sharing.
2. To cooperate in the fight against terrorism, separatism and extremism.
3. To cooperate on common infrastructure projects.
4. To establish a trade area with its own financial arrangements.
The last objective will eventually require a currency that is acceptable to all SCO parties for trade
settlements.
The contrast between the EU and the SCO is interesting. The EU has the specific objective of political
integration, and thousands of regulations have been introduced to get conformity so that that can
eventually happen. It made a botched job by inventing and introducing a new currency. The EU
leadership is also always ready to interfere in the politics of other nations: for example, Iraq,
Afghanistan, Libya, Syria, I could go on. In contrast, China and Russia do not involve themselves. If a
Chinaman turns up on your doorstep, he wants to trade with you. We have gone the other way. If an
American or Brit or Frenchman turns up on your doorstep, he wants to tell you how to run your
affairs.
The result is the SCO has gathered widespread support from very diverse parties. Besides the
original 6 founder members, there are observer states queuing up to get in.

19
These are India, Iran, Pakistan, Mongolia; and Afghanistan has announced her intention to become
an observer state. Then there are dialog partners, who share the same values but have no current
plans to join.
This really is an interesting mix. It will amuse you to know that about eight years ago the United
States toyed with the idea of joining, but she was not welcome.
India and Pakistan are barely on speaking terms over Kashmir, and both have nuclear weapons. Iran
is important as an oil producer, and put together with Russian production, gives the SCO oil
dominance over global energy. Iran’s position in the Persian Gulf is of great strategic importance to
the SCO for obvious reasons.
Mongolia and Belarus are no surprise. And Afghanistan is sitting on enormous untapped mineral
wealth, which as soon as NATO leaves will be at the disposal of the SCO.
The SCO with its observers and dialog partners represents over 40% of the world’s population, and
dwarfs North America and Europe put together. They have considerable resource security, and they
have further availability of all the resources they need through China’s investments in Africa, the
dependence of Australia on China, and strong relationships with other developing nations, both in
Asia and elsewhere.
Our interest here is in gold.

20
This slide shows some interesting information on our subject. The combined output of the SCO
group is 26% of the world’s total, and there is little doubt that the full gold mineral potential of
Central Asia still lies untapped. The gold reserves shown here are those that have been officially
declared. It is quite likely that Russia has under-declared her position, having been actively mining
gold for many decades. China is certainly under-declaring her position. Her holdings here are the
central bank holdings, and are not regularly updated. Furthermore my contacts tell me that the
Communist Party itself is a major holder, and it is quite possible her total holdings exceed 10,000
tonnes – perhaps even more. Furthermore, she is trying to buy gold mines in Australia and
elsewhere.
We must also note that China legalised gold ownership for her citizens in 2002, and Chinese savers
have rapidly become keen buyers, almost to the level of the Indian public. The central banks for
Russia, China, India, Iran, Belarus and Sri Lanka have all bought gold recently. The fact that China has
substantial gold interests, both at government and at individual levels, suggests that she is aiming
for the yuan, backed by significant gold reserves, to be the trade settlement currency of choice for
the SCO region.
We must think about the implications.
Here is an economic and political bloc that is building its combined gold reserves, and increasingly
stands to benefit from a rise in the gold price. Meanwhile, we have every reason to suspect the
Western central banks, including the US, have been feeding gold into the market over the last thirty
years, and have either not declared these sales in their central banks’ accounts, or are hiding them
quite legitimately behind the sight account system. The United States and the Euro Area officially
hold 18,926 tonnes. It is quite possible that much of it no longer exists as central bank reserves,
given the continual attempts to de-monetise gold completely since the Nixon Shock 40 years ago.
Add to that the inherent short position on the London Bullion Market, probably a further 3-4,000
tonnes, and the price potential on discovery could be spectacular.
Finally a few brief words on silver. China has gained a substantial degree of control of silver by
becoming the largest refiner of rough ingots, known as silver doré. It is by all accounts a nasty

21
polluting process, and unprofitable for Western refiners, particularly when the price was low. These
were not problems for China. I have seen a figure stating they have over 40% of this market, but I
cannot verify that. Whatever their share, it is large and important. This allows them to buy the rough
doré either for spot or forward, and cover the commitment by selling forward, or selling futures; or
alternatively just build a strategic reserve. This is why they could be behind the large short position
on Comex. This gives them the means to control the silver price.
It is in their industrial interest to keep the price of silver low for their expanding manufacturing of
items such as solar panels. I think this is the likely explanation for much of the apparent price
manipulation in the market, but I don’t actually know this for certain.
More generally and returning to China’s role in the SCO, they have built up an industrial economy
based on cheap exports to the West. That has given them the infrastructure to develop their own
consumer economy, and to develop markets throughout the Asian continent. They have secured
many of the resources to do this. They have secured the political partnership in Asia to give them a
market many times larger and longer lasting that the crumbling empires of America and Europe.
Every step we take, like freezing Iranian assets, or shutting down their access to the international
bank transfer systems, strengthens China’s position. If the cold war has been replaced by a financial
war, we may have won the cold war but we are losing the financial war.
Our fiat currencies have done away with the restrictions of gold, to the temporary delight of the
neo-classical economists. Paper money now depends totally on ephemeral confidence in them. As
we dig deeper holes for ourselves, leading to the eventual collapse of our paper currencies, the
Chinese intend to survive and have a future. Marx said that capitalism will destroy itself, and they
intend to survive this destruction. They are the dominant party in the SCO. And if we as individuals
are going to survive this financial maelstrom, we will do well to understand them, understand what
they are doing with gold and silver, and take whatever personal action is necessary.
In conclusion, today we have covered these topics that relate to gold and silver, and they will
determine their future prices.
I have described to you what neo-classical economics is about, its shortcomings and
fallacies. I have discussed the motivations behind Keynes and Keynesianism and how it has
22
developed out of a mixture of social prejudice and misplaced trust in governments’ ability to
improve on free markets. I have tried to show you why we must stop thinking like
Keynesians or monetarists, and why the economic theory developed by Austrian economics,
particularly by von Mises, is superior to neo-classical non-theory. And if you can grasp
Austrian theory, you can understand the economic outcome for events as they develop. It
explains why fiat money will eventually become worthless.
I have shown how gold has become significantly undervalued as a result of the dramatic
monetary expansion that has occurred since Bretton Woods, and more particularly since the
Nixon Shock. And I have pointed out recent monetary growth has gone hyperbolic, driven by
the dynamics of an inescapable debt trap.
The balance of power has shifted to Asia, particularly China, and central to that power is
control of real money, the money that society chooses for itself, not that enforced by
government as a monopoly upon us.
Untold amounts of gold have disappeared from the advanced economies’ central banks, and
the London Bullion Market is exposed to a sharp rise in the gold price.
With this knowledge, anyone who does not take steps to protect him or herself from the
increasingly certain event, a collapse in paper money, a fundamental change in our whole
economic paradigm, is nuts.
15 May 2012