the global labour market for seafarers - cardiff universitythe global labour market for seafarers...
TRANSCRIPT


The Global Labour Market for Seafarers Working Aboard Merchant Cargo Ships
2003
Ellis, N., Sampson, H.
Seafarers International Research Centre (SIRC) Cardiff University
52 Park Place Cardiff
CF10 3AT
Tel: +44 (0)29 2087 4620 Fax: +44 (0)29 2087 4619
[email protected] www.sirc.cf.ac.uk
June 2008
ISBN: 1-900174-35-9
ii
Contents
Page Introduction 1 Methods 2 Sample Distribution 2 Vessel Type 2 Flag 3 Summary of Sample Distribution Comparison 5 Sample Characteristics 6 Vessels 6 Ship Type 6 Deadweight Tonnage 7 Flag by dwt 8 Flag by Ship Type 9 Crew Size 11 Seafarers 12 Rank 12 Department 13 Nationality 14 Age 15 Profiles of Seafarers by Vessels and Roles 16 Nationality by Rank 16 Nationality by Department 20 Nationality by Ship Type 22 Nationality by Rank and Ship Type 24 Nationality by Department and Ship Type 26 Nationality by Flag 28 Nationality by Rank and Flag 31 Age by Nationality 34 Age by Rank 35 Age by Rank and Nationality 36 Crew size by Ship Type 37 Crew Size by dwt 38 Crew Size by Flag 40 Conclusion 41 References 43 APPENDIX 1 44 APPENDIX 2 46 APPENDIX 3 47

iii
Tables
Page
Table1 Top 10 Flags of Registration by dwt in the GLMS and WFS Databases
4
Table 2 Frequency of Ship Types 6
Table 3 Top 10 Flags of Registration by dwt 8
Table 4 Flag in Rank Order (Top 5) for Each Vessel Type 10
Table 5 Ranks Within the Sample (%) 12
Table 6 Department 13
Table 7 Top 10 Nationality of Seafarers 14
Table 8 Age of Seafarers (Grouped) 15
Table 9 Top 10 Nationalities of Senior Officers 17
Table 10 Top 10 Nationalities of Junior Officers 18
Table 11 Top 10 Nationalities of Ratings 18
Table 12 Top 10 Nationalities in the Deck Department 21
Table 13 Top 10 Nationalities in the Engine Department 21
Table 14 Top 10 Nationalities in the Catering Department 21
Table 15 Top 10 Nationalities in the Combined Deck and Engine Department
22
Table 16 Top 10 Nationalities on Bulk Carriers 23
Table 17 Top 10 Nationalities on General Cargo/ Container Ships 23
Table 18 Top 10 Nationalities on Tankers 24
Table 19 Top 5 Nationalities by Rank for Bulk Carriers 25
Table 20 Top 5 Nationalities by Rank for General Cargo/ Container Ships
26
Table 21 Top 5 Nationalities by Rank for Tankers 26
Table 22 Top 5 Nationalities by Department for Bulk Carriers 27
Table 23 Top 5 Nationalities by Department for General Cargo/ Container Ships
27
Table 24 Top 5 Nationalities by Department for Tankers 28
Table 25 Top 5 Nationalities by Flag of Vessel (Top 10 Flags by dwt shown in rank order)
29
Table 26 The Percentage of Seafarers Working on Their Own Nationality Vessels (Top 10 nationalities)
30

iv
Page Table 27 The Top 5 Nationalities Working on Panamanian Flagged
Vessels Split by Rank 33
Table 28 The Top 5 Nationalities Working on Liberian Flagged Vessels Split by Rank
33
Table 29 The Top 5 Nationalities Working on Maltese Flagged Vessels Split by Rank
33
Table 30 The Top 5 Nationalities Working on Greek Flagged Vessels Split by Rank
34
Table 31 The Top 5 Nationalities Working on Cyprus Flagged Vessels Split by Rank
34
Table 32 Descriptive of Age for the Top 10 Nationalities 35
Table 33 Age of Seafarers by Rank 35
Table 34 Mean Crew Size by Vessel 37
Table 35 Mean Crew Size by dwt (Grouped) 39
Table 36 Mean Crew Size by Flag 40

v
Figures Page Figure 1 The Percentage of Vessels by Type 3 Figure 2 The Percentage of Overall dwt for the Top 10 flags of
Registration by dwt 5 Figure 3 Pie Chart Showing Ship Types 7 Figure 4 The Percentage of Vessels in the dwt Groups in the GLMS
Dataset 7 Figure 5 Top 10 flags of Registration by dwt 9 Figure 6 Crew Size 12 Figure 7 Pie Chart Showing Ranks 13 Figure 8 Pie Chart Showing Seafarers Department 14 Figure 9 Pie Chart Showing the Top 10 Nationality of Seafarers 15 Figure 10 Bar Graph Showing the Age of Seafarers (Grouped) 16 Figure 11 The Top 10 Nationalities of Senior Officers 19 Figure 12 The Top 10 Nationalities of Junior Officers 19 Figure 13 The Top 10 Nationalities of Ratings 20 Figure 14 For each of the Top 10 Nationalities the Percentage of
Seafarers Working On Their National Flagged Vessels 31 Figure 15 Mean Ages by Rank for the Top 10 Nationalities 36 Figure 16 Crew Size by Ship Type 38 Figure 17 Crew Size by dwt 39

vi
Acknowledgements
We would like to thank all of the Maritime Administrations who provided us with
access to crew list information. We would also like to acknowledge the efforts of the
SIRC team involved in inputting the crew list data and contributing to project
management. Finally thanks are due to Professor Michael Bloor and Ms Louise
Deeley for their contributions to the preparation and improvement of this manuscript.

vii
Foreword
The Global Labour Market Survey was initiated by the former Director of SIRC,
Professor Tony Lane. Initially the survey was somewhat experimental and data
produced in early sweeps was not judged to be very reliable and was not widely
publicised. In 2003, however, the data that was collected was considered to be
sufficiently robust to warrant dissemination. Following dissemination in various
forms the Centre has received a steady, and seemingly un-diminishing, series of
requests for data relating to individual requirements. The requests have generally
come from people working within the industry and government. They have been met
on a case by case basis with the supply of ‘tailor-made’ tables and figures.
At this time we have decided to publish the full findings from the survey as widely as
possible (via this report). Whilst the data is fast becoming out of date, it is the only
data of its kind that we are aware of and it has proved to be of great value to many
‘end-users’ in the industry. A new data sweep is now required to update the picture
and we remain optimistic that the value of the work will encourage individuals or
groups to approach us with proposals that would enable us to repeat the study for the
year 2009. In the meantime I hope that the data contained herewith is of some benefit
and interest to the industry and to the broader maritime sector.
Professor Helen Sampson (SIRC Director)

1
Introduction
The Global Labour Market for Seafarers (GLMS) study has been conducted by the
Seafarers International Research Centre (SIRC) for several years, and data collated
from crew lists is available for the periods: 1993-2000; 2002; and 2003. Data from
the study have previously been used to consider the profile of the seafaring workforce
for the global cargo fleet in terms of characteristics such as age, nationality, ship type,
and rank.
The GLMS produces labour market estimates based upon crew lists collected from a
sample of world ports. Its innovative methodology offers a valuable alternative to
labour market estimates based on surveys of employers which suffer from low and
potentially biased response rates as well as from a necessary reliance upon the
subjective views of managers. Bias within the GLMS is more transparent, where it
exists, and it relates almost entirely to port (sample) selection which can be assessed
using comparisons with world fleet composition data.
This report presents an overview of the 2003 data and looks at the profile of those
crewing the world fleet, outlining nationality, age, rank and job, as well as the types
of vessel they are employed on, and in what capacity.
The data presented here were collected in the final funded year of the SIRC research –
2003. However, data have also been collected from the previous year, and were
collected less systematically between 1993 and 2002. The expertise to conduct further
data sweeps for this study remains at SIRC, and the centre is currently attempting to
raise funds to repeat the research in 2008/91.
1 Should any individual, any organisation, or any consortium, be interested in sponsoring this research, the SIRC Director would be very pleased to hear from them. The research costs approximately £80,000 to carry out per year and multiple sponsorship would be welcomed by the Centre.

2
Methods
This report is based upon the descriptive statistics derived from a dataset established
at SIRC via the collation of information entered upon crew lists which were collected
from a range of ports across the world. Specifically it reports on crew lists collected
in March 2003.
Although data were only collected from a limited number of ports, these were
carefully selected ‘hub’ ports, at which many of the internationally trading ships
operating in the area would be expected to call. Via our large purposive sample we
hoped to obtain a broadly representative coverage of the international vessels trading
locally.
From the crew lists that were collected in 2003, information on 4,240 vessels, and
80,863 seafarers was recorded. This constitutes approximately 10% of the world fleet
as recorded in the generally recognised Lloyd’s Register World Fleet Statistics
(2003).
Sample Distribution
In order to check our sample ‘shape’ and the distribution of vessel types and flags (the
registration of ships) within our sample, we compared it with the detailed breakdown
of the world fleet as presented in the Lloyd’s Register World Fleet Statistics (WFS)
(2003).
Vessel Type
Having removed passenger/cruise vessels from both our sample and the WFS data we
compared vessel type distribution and the distribution of flag.

3
We found similarities in the two datasets, particularly in relation to the categories of
‘bulk carrier’, ‘other cargo’, ‘reefers’, and ‘other tankers’. However, there were also a
number of apparent differences. Proportionately the GLMS data contained over twice
as many container vessels and nearly a third more liquid/ gas carrier vessels than were
listed in the WFS. Thus it would seem that these vessel types are over-represented in
our sample. By contrast, some vessel types appear to be under-represented in our
sample. Proportionately, the WFS contain details of more general cargo vessels
(almost a 10% variation), and approximately twenty-five percent more oil tankers
than our GLMS sample. However, the most apparent difference was for ro-ro’s where
the WFS contained three times more vessels than the GLMS sample (see Figure 1).
Figure 1: The Percentage of Vessels by Type
0
5
10
15
20
25
30
35
40
Bulk C
arriers Ro-R
o
Contain
er
Genera
l Carg
o
Other C
argo
Reefe
r
Liquid
/ Gas
Oil Tan
kers
Other T
anker
s
Vessel Type
Per
cent
age
GLM
WFS
Flag
Flag of the vessels listed in the WFS was compared to the GLMS data in relation to
deadweight (dwt). Table 1 shows the total dwt as well as overall rank order for the
top ten flags by dwt in the two data sets. Flags which are ranked amongst the top ten
in one data set but outside the top ten in the other, are highlighted in yellow.

4
Table 1: Top 10 Flags of Registration by dwt in the GLMS and WFS Databases
GLMS WFS
Flag Rank order dwt
Percentage of overall
dwt Rank order dwt
Percentage of worlds
dwt
Panama 1 25,796,449 19.8% 1 183,974,112 21.7% Liberia 2 14,563,051 11.2% 2 79,787,483 9.4% Malta 3 9,255,512 7.1% 5 40,797,336 4.8% Greece 4 9,135,877 7.0% 3 54,519,431 6.4% Cyprus 5 7,775,396 6.0% 7 35,167,103 4.2% Bahamas 6 7,007,816 5.4% 4 45,473,151 5.4% Norway (NIS) 7 6,868,179 5.3% 11 23,979,689 2.8% Hong Kong 8 5,142,413 3.9% 8 34,456,489 4.1% Marshall Islands 9 3,729,506 2.9% 9 28,872,911 3.4% Singapore 10 3,219,759 2.5% 6 35,998,380 4.3% China 14 2,015,093 1.5% 10 26,257,775 3.1%
The top ten Flag/dwt rankings are very similar in the two datasets, with eight of the
ten flags from each source appearing in both sets of top ten rankings. When the
percentage of the worlds dwt is compared to the GLMS overall dwt these are also
very similar, with the two data sets showing similar patterns of distribution across the
flags (see Figure 2). When flags were considered individually, differences could be
seen for the percentages for Norway (NIS) and China. In the cases of the Norway
(NIS), the WFS data had nearly half the tonnage found in the GLMS sample, whereas
in contrast in relation to the Chinese flag, the WFS data has over twice the tonnage
found in the GLMS sample.

5
Figure 2: The Percentage of Overall dwt for the Top Ten flags of Registration by dwt
0
5
10
15
20
25
Pana
ma
Liberia
Malta
Greece
Cyprus
Baha
mas
Norway
(NIS)
Hong
Kong
Marsha
ll Islan
ds
Singa
pore
China
Flag
Per
cent
age
GLM
WFS
Summary of Sample Distribution Comparison
Using the WFS as a reference it appears that the GLMS does, approximately,
correspond with the world fleet. For example, eight of the top ten flags as defined by
tonnage were found to be present in both data sets and further analysis suggested that
the percentage of tonnage for each flag across the groups was also fairly similar.
However, when vessel type is taken into account differences between the GLMS data
and the WFS become more apparent. It would appear that some of the hub ports
included in the survey have a concentration, or specialization in particular trades (e.g.
container traffic), whilst attracting fewer vessels engaged in alternative operations
(general cargo, oil transportation). Should we be in a position to repeat the survey we
will endeavour to adjust our sampling points (ports) to attempt to capture more of the
under-represented vessel types within our data.
In summary, in some respects the GLMS sample appears to be a fair match with the
world fleet (as recorded by the WFS) however in others it appears to deviate more

6
markedly (specifically in relation to some vessel types). Thus generalisations from the
data should be made with appropriate caution.
Sample Characteristics
Before considering the findings it is worth briefly examining the sample for the
GLMS in a little more detail.
Vessels
Ship Type
If we consider the sample in relation to the numbers of vessels of each type we
observe that general cargo vessels constitute the largest group, container vessels are
the next largest group, followed by bulk carriers and liquid/gas carriers (see Table 2).
However, if we examine vessel type in relation to dwt we find that bulk carriers
constitute our largest group by tonnage, closely followed by oil tankers (see Table 2
and Figure 3).
Table 2: Frequency of Ship Types
Rank Order by freq Ship Type Freq Percent Total dwt
Percentage of total dwt
1 General Cargo 1223 28.8% 6,850,198 5.9% 2 Container 773 18.2% 22,197,070 19.0% 3 Bulk Carrier 724 17.1% 37,216,155 31.9% 4 Liquid/ Gas Carrier 612 14.4% 9,297,759 8.0% 5 Oil Tanker 484 11.4% 37,147,940 31.8% 6 Refrigerated Cargo 184 4.3% 1,424,531 1.2% 7 Ro-Ro 145 3.4% 1,895,105 1.6% 8 Other 46 1.1% 233,545 0.2% 9 Other Cargo 26 0.6% 293,156 0.3% 10 Other Tanker 23 0.5% 109,018 0.1%
Total 4240 100.0% 116,664,477 100.0%

7
Figure 3: Pie Chart Showing Ship Types
Other1.1%
Other Cargo0.6%
Other Tanker0.5%
Ro-Ro3.4%
Refrigerated Cargo4.3%
Oil Tanker11.4%
Liquid/ Gas Carrier14.4%
Bulk Carrier17.1%
Container18.2%
General Cargo28.8%
Deadweight Tonnage
dwt was positively skewed with the majority of vessels being at the lower end of the
tonnage distribution. However, there was a considerable concentration of tonnage in
the 20,000-49,000 dwt category which did not fit with the overall distribution (see
Figure 4).
Figure 4: The Percentage of Vessels in the dwt Groups in the GLMS Dataset
0
5
10
15
20
25
30
Per
cen
tag
e
< 1000 1000 -2999
3000 -4999
5000 -9999
10000 -19999
20000 -49999
50000 -69999
70000 -99999
>=100000
DWT Group

8
Flag by dwt
Within the sample Panama was the most significant registry, constituting 16% of the
total number of vessels in the sample and 20% of the dwt. Liberia was the second
most significant register in relation to dwt but Malta marginally exceeded Liberia in
relation to numbers of vessels. The top ten flags as represented within the sample
(Panama, Liberia, Malta, Greece, Cyprus, Bahamas, Norway NIS, Hong Kong,
Marshall Islands, Singapore) accounted for 71% of the dwt included within the
GLMS dataset for 2003 (see Table 3, Figure 5).
Table 3: Top 10 Flags of Registration by dwt
Rank Order Flag
Percentage of total
numbers of vessels
Percentage of overall
dwt
Cumulative percentage of overall
dwt 1 Panama 15.7% 19.8% 19.8% 2 Liberia 7.2% 11.2% 30.9% 3 Malta 7.4% 7.1% 38.0% 4 Greece 3.2% 7.0% 45.0% 5 Cyprus 4.7% 6.0% 51.0% 6 Bahamas 4.1% 5.4% 56.4% 7 Norway (NIS) 3.3% 5.3% 61.6% 8 Hong Kong 2.5% 3.9% 65.6% 9 Marshall Islands 1.6% 2.9% 68.4%
10 Singapore 1.9% 2.5% 70.9% Other 48.4% 29.1% 100.0% Total 100.0% 100.0% ---
This is shown graphically in Figure 5.

9
Figure 5: Top 10 flags of registration by dwt
Other29.1%
Singapore2.5%
Marshall Islands2.9%
Hong Kong3.9% Norway (NIS)
5.3%Bahamas
5.4%Cyprus6.0%
Greece7.0%
Malta7.1%
Liberia11.2%
Panama19.8%
Flag by Ship Type
When we considered flag by ship type we found that whilst Panama-flagged ships
dominated some categories of vessel (bulk, ro-ro, container, reefer, liquid gas carrier)
they were less prominent in other categories which were dominated by Netherlands
(other tanker, other cargo, other), Malta (oil tanker), and Russia (general cargo). It
seems likely that the domination of the Netherlands in the miscellaneous ‘other’
categories reflects the inclusion of Rotterdam as one of the hub ports and the nature of
some of the local trade (see Table 4).

10
Table 4: Flag in Rank Order (Top 5) for Each Vessel Type
Ship Type Rank Order Flag Percent
1 Panama 21.5% 2 Malta 11.9% 3 Cyprus 10.1% 4 Greece 7.6% 5 Hong Kong 7.2% Other 41.7%
Bulk Carrier
Total 100.0% 1 Panama 38.6% 2 Norway (NIS) 9.0% 3 Sweden 6.2% 4 Bahamas 5.5% 5 Japan 4.1% Other 36.6%
Ro-Ro
Total 100.0% 1 Panama 21.6% 2 Liberia 13.8% 3 Germany 8.4% 4 Antigua and Barbuda 7.0% 5 Denmark (DIS) 3.8% Other 45.4%
Container
Total 100.0% 1 Russian 10.3% 2 Antigua and Barbuda 9.8% 3 Netherlands 8.4% 4 Malta 7.9% 5 Turkey 6.1% Other 57.4%
General Cargo
Total 100.0% 1 Netherlands 15.4% 2 Liberia 11.5% 3 Netherlands Antilles 11.5% 4 Indonesia 7.7% 5 Panama 7.7% Other 46.2%
Other Cargo
Total 100.0% 1 Panama 24.5% 2 Bahamas 15.2% 3 Liberia 13.0% 4 Malta 9.8% 5 Cayman Islands 6.5% Other 31.0%
Refrigerated Cargo
Total 100.0%

11
Table 4 (cont): Flag in Rank Order (Top 5) for Each Vessel Type
1 Panama 20.8% 2 Norway (NIS) 11.6% 3 Liberia 8.3% 4 Italy 8.0% 5 Netherlands 5.2% Other 46.1%
Liquid/ Gas Carrier
Total 100.0% 1 Malta 15.3% 2 Greece 10.5% 3 Panama 10.3% 4 Liberia 8.7% 5 Cyprus 5.8% Other 49.4%
Oil Tanker
Total 100.0% 1 Netherlands 17.4% 2 Denmark (DIS) 17.4% 3 China 8.7% 4 Georgia 4.3% 5 Isle of Man 4.3% Other 47.8%
Other Tanker
Total 100.0% 1 Netherlands 13.0% 2 Bahamas 10.9% 3 Panama 8.7% 4 Russian 8.7% 5 United Kingdom 8.7% Other 50.0%
Other
Total 100.0%
Crew Size
The mean crew size for the GLMS dataset was 19 (s.d.= 7.0), with a considerable
range of from 4-84. However, the predominant crew size (mode) was 21. This is
illustrated graphically, with the use of a histogram, in Figure 6. Two distinct peaks in
the distribution of crew sizes can be seen, one at 12 and another at 22.

12
Figure 6: Crew Size
4 6 8 10 12 14 16 18 20 22 24 26 28 30 32 34 36 38 40 42 44 46 48 51 56 84
Crew size
0
100
200
300
400Fr
eque
ncy
Seafarers
Rank
Across the sample there was a distribution of seafarers by rank as follows: 56% of the
sample occupied ratings positions; 22% were junior officers and there were
approximately the same number (marginally fewer) senior officers (see Table 5).
Table 5: Ranks Within the Sample (%)
Percent Senior 21.5% Junior 22.1% Rating 56.4%
Total 100.0%
The rank of seafarers is illustrated graphically in Figure 7.
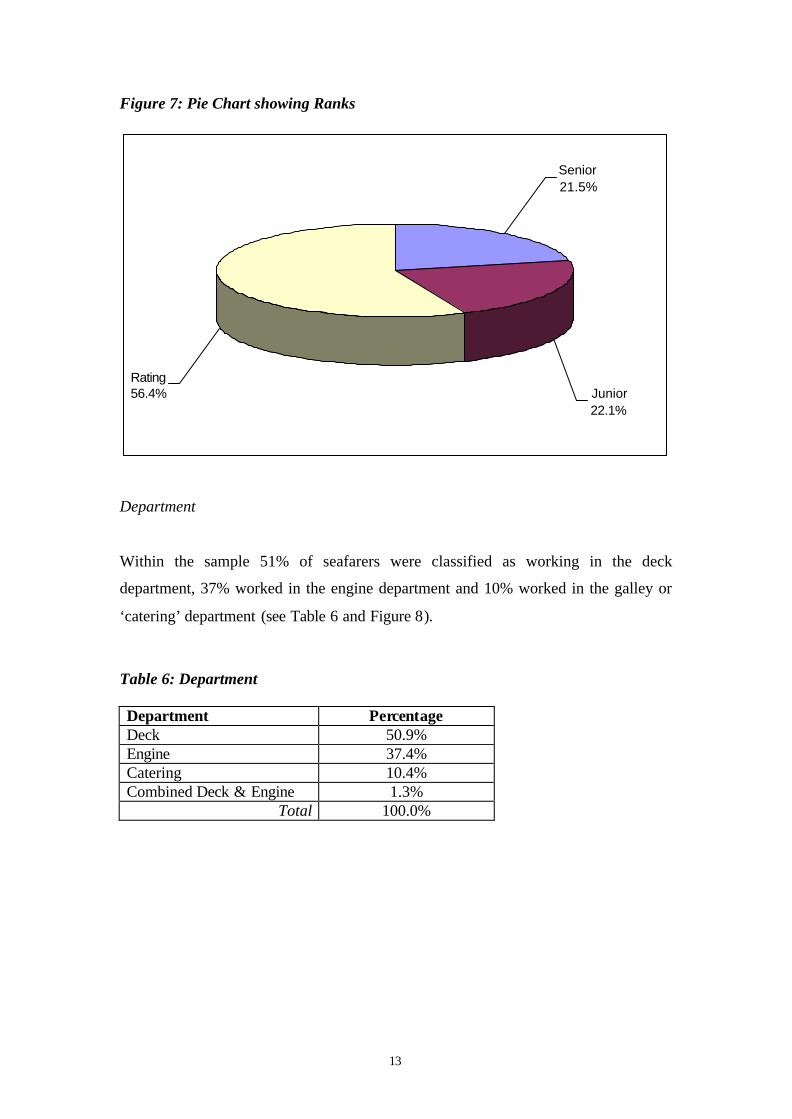
13
Figure 7: Pie Chart showing Ranks
Rating56.4% Junior
22.1%
Senior21.5%
Department
Within the sample 51% of seafarers were classified as working in the deck
department, 37% worked in the engine department and 10% worked in the galley or
‘catering’ department (see Table 6 and Figure 8).
Table 6: Department
Department Percentage Deck 50.9% Engine 37.4% Catering 10.4% Combined Deck & Engine 1.3%
Total 100.0%

14
Figure 8: Pie Chart Showing Seafarers Department
Deck50.9%
Engine37.4%
Catering10.4%
Combined Deck & Engine
1.3%
Nationality
As with previous years the Philippines was found to dominate the global seafarer
labour market with 28% of the sample holding Filipino nationality. Russians, Indians,
Ukrainians, and Chinese nationals all constituted a similar proportion of the sample
(between 6 and 7 %) followed by Turkey, Indonesia, Poland, Greece and Myanmar in
descending order (see Table 7). These ten nationalities constitute 70% of the total
sample (see Figure 9).
Table 7: Top 10 Nationality of Seafarers
Rank Order Nationality Percent
Cumulative Percent
1 Philippines 27.8% 27.8% 2 Russian 7.0% 34.9% 3 India 6.6% 41.4% 4 Ukraine 6.4% 47.8% 5 China 6.1% 53.9% 6 Turkey 4.0% 58.0% 7 Indonesia 3.5% 61.4% 8 Poland 3.0% 64.4% 9 Greece 2.8% 67.2%
10 Myanmar 2.2% 69.4% Other (n=124) 30.6% 100.0% Total 100.0% ----

15
Figure 9: Pie Chart Showing the Top 10 Nationality of Seafarers
Poland3.0%
Greece2.8%
Myanmar2.2%
Others30.6%
Indonesia3.5%
Turkey4.0%
China6.1%
Ukraine6.4%
India6.6%
Russian7.0%
Philippines27.8%
Age
The average age of the seafarers in the sample was 38 (s.d. 10.45). Each age cohort
from 31-51 demonstrates attrition (less than 5% between 31 and 41 and about 14%
between 41 and 51). However it is noteworthy that there are more seafarers in the 31-
40 age category than there are in the 21-30 category. Whilst there is nothing
conclusive that may be reported on the basis of these data they could be indicative of
under-recruitment in the latter category and predictive of a future shortage of
seafarers, most particularly amongst those groups that traditionally enter seafaring
immediately post-compulsory education (generally officers). See Table 8 and Figure
10 for further details.
Table 8: Age of Seafarers (Grouped)
Age (Grouped) Percentage Cumulative
Percent 20 or less 1.2% 1.2% 21-30 26.1% 27.4% 31-40 30.5% 57.9% 41-50 27.6% 85.5% 51-60 13.1% 98.6% 61 and over 1.4% 100.0%
Total 100.0% ----

16
Figure 10: Bar Graph Showing the Age of Seafarers (Grouped)
0
5
10
15
20
25
30
35
Per
cen
tag
e
20 or less 21-30 31-40 41-50 51-60 61 andover
Age group
Profiles of Seafarers by Vessels and Roles
In the previous section a basic outline was given of the vessels and seafarers included
in the GLMS dataset. This section presents further details relating to rank,
department, and nationality in order to try and build up a picture of the global labour
market for the world cargo fleet.
Nationality by Rank
Whilst seafarers from the Philippines dominate the labour market overall, their
domination is less marked in relation to senior officer positions than others. They
remain the largest nationality group amongst senior officers however nationalities are
much more evenly distributed in the senior officer category, than they are in general.
Filipinos constituting roughly 11% of senior officers are closely followed by Russians
who account for almost 10% of senior officers. Ukrainian, Greek, and Indian officers
account for approximately 6-7% of senior officers each, and Chinese, Polish, South
Korean, German and Turkish seafarers are all represented at the level of around 4%
(each) (see Table 9 and Figure 11). The top ten nationalities in the sample account for

17
just over 60% of the sample illustrating that there is a greater variety of nationalities
represented at senior officer level than there is across the board.
Table 9: Top 10 Nationalities of Senior Officers
Rank Order Nationality Percent 1 Philippines 11.2% 2 Russian 9.8% 3 Ukraine 7.4% 4 Greece 6.2% 5 India 5.9% 6 China 4.7% 7 Poland 4.2% 8 Korea, South 4.2% 9 Germany 4.1% 10 Turkey 3.8%
-------- Other (n=87) 38.5% Total 100.0%
Amongst junior officers the domination of the labour market by Filipinos appears as a
marked feature. 24% of junior officers in the sample were found to be of Filipino
nationality and this proportion is considerably larger than that constituted by the
second largest national group, Russians, who made up approximately 9% of the
sample. Indian, Ukrainian, and Chinese nationals constitute between around 7 and 8%
of the sample (each), with Polish, South Korean, Indonesian, and Romanian seafarers
constituting smaller groups amongst the top ten nationalities of junior officer (see
Table 10 and Figure 12). Other things being equal, this distribution of junior officers
suggests that in the future Filipinos will constitute a much larger proportion of senior
officers across the fleet. However, should there be any barriers to the transition of
Filipino seafarers from junior officer to senior officer status, these figures could
suggest that there may be problems in later years for companies wishing to recruit
senior officers.

18
Table 10: Top 10 Nationalities of Junior Officers
Rank Order Nationality Percent 1 Philippines 24.2% 2 Russian 9.4% 3 India 7.8% 4 Ukraine 7.8% 5 China 6.8% 6 Greece 3.5% 7 Poland 3.2% 8 Korea, South 3.1% 9 Indonesia 2.9% 10 Romania 2.4%
-------- Other (n=87) 29.0% Total 100.0%
By far the largest group of ratings by nationality is Filipino. Filipino seafarers
constitute more than a third of all ratings in our sample. Their domination of the
ratings labour market is significant and all of the other nationalities, even in the top
ten represented amongst ratings, can be considered to represent minor groupings by
contrast (see Table 11 and Figure 13).
Table 11: Top 10 Nationalities of Ratings
Rank Order Nationality Percent 1 Philippines 36.7% 2 China 6.3% 3 Ukraine 5.9% 4 Russian 5.5% 5 India 5.2% 6 Turkey 4.4% 7 Indonesia 4.1% 8 Poland 2.7% 9 Myanmar 2.6% 10 Bulgaria 2.1%
-------- Other (n=106) 24.5% Total 100.0%

19
Figure 11: The Top 10 Nationalities of Senior Officers
Other38.5%
10. Turkey3.8%
9. Germany4.1% 8. Korea, South
4.2%7. Poland
4.2%6. China
4.7%
5. India5.9%
4. Greece6.2%
3. Ukraine7.4%
2. Russian9.8%
1. Philippines11.2%
Figure 12: The Top 10 Nationalities of Junior Officers
7. Poland3.2%
9. Indonesia2.9%
10. Romania2.4%
Other29.0%
8. Korea, South3.1%
6. Greece3.5%
5. China6.8%
4. Ukraine7.8%
3. India7.8%
2. Russian9.4%
1. Philippines24.2%

20
Figure 13: The Top 10 Nationalities of Ratings
8. Poland2.7%
7. Indonesia4.1%
9. Myanmar2.6%
10.Bulgaria2.1%
Other24.5%
6. Turkey4.4%
5. India5.2%
4. Russian5.5%
3. Ukraine5.9%
2. China6.3%
1. Philippines36.7%
Nationality by Department
Filipino seafarers were the most prevalent national group across all departments but
were most dominant in relation to the catering, or ‘galley’ department (deck 29%,
engine 26%, galley 37%). Whilst their order varied, the same four national groups
occupied positions 2-5 in the rankings for all departments. These were Russia,
Ukraine, India, and China. Whilst there was some consistency in the national make-up
of each department, we nevertheless identified in each department one national group
which uniquely appeared in that department’s top ten nationalities. Thus seafarers
from Myanmar appeared in the top ten nationalities working in the deck department
(but not in any other department), seafarers from Romania were only represented in
the top ten nationalities in the engineering department, and seafarers from Taiwan
were only represented in the top ten nationalities in the galley department (see Tables
12, 13, 14).

21
Table 12: Top 10 Nationalities in the Deck Department
Rank Order Nationality Percent 1 Philippines 29.0% 2 Russian 7.5% 3 China 6.1% 4 Ukraine 6.0% 5 India 5.5% 6 Indonesia 3.6% 7 Turkey 3.5% 8 Poland 3.0% 9 Greece 2.9% 10 Myanmar 2.3%
------- Other (n=116) 30.6% Total 100.0%
Table 13: Top 10 Nationalities in the Engine Department
Rank Order Nationality Percent 1 Philippines 25.7% 2 Ukraine 7.5% 3 Russian 7.2% 4 India 6.8% 5 China 6.1% 6 Turkey 4.1% 7 Poland 3.2% 8 Indonesia 3.1% 9 Greece 2.9% 10 Romania 2.6%
------- Other (n=105) 30.8% Total 100.0%
Table 14: Top 10 Nationalities in the Catering Department
Rank Order Nationality Percent 1 Philippines 36.8% 2 Russian 5.6% 3 India 5.5% 4 Ukraine 5.5% 5 China 5.2% 6 Indonesia 4.2% 7 Turkey 4.0% 8 Poland 2.6% 9 Taiwan 2.3% 10 Greece 2.2%
------- Other (n=75) 26.0% Total 100.0%

22
Few seafarers worked in combined engine and deck departments, however of those
who did Indians represented the largest group (19%) with Filipinos, Chinese, and
Danish seafarers clustering in the same proportions and constituting around 10% of
the sample each (see Table 15).
Table 15: Top 10 Nationalities in the Combined Deck and Engine Department
Rank Order Nationality Percent 1 India 19.1% 2 Philippines 10.6% 3 China 10.1% 4 Denmark 9.9% 5 Turkey 7.0% 6 Indonesia 5.4% 7 Russian 4.5% 8 Ukraine 4.2% 9 Latvia 3.9% 10 Poland 2.5%
------- Other (n=44) 22.8% Total 100.0%
Nationality by Ship Type
In order to try and better identify trends in nationality patterns, ship types were
categorised into three major groupings excluding a miscellaneous ‘other’ category2.
This demonstrated that whilst the main nationality groups (Philippines, China, India,
Russia, Ukraine) were present in the top ten nationalities of almost all ship types (NB
Ukrainians were not amongst the top ten national groups on tankers) there were some
nationalities which appeared in relation to only one specific ship type, and who were
obscured in the distribution of seafarers across all ships when undifferentiated by type
(see Table 7 for comparison). Latvian seafarers, for example, were the fourth largest
national grouping aboard tankers (see Table 18); German seafarers were the tenth
largest national group in relation to general cargo/container vessels (see Table 17);
and Croatian seafarers were the ninth largest group on bulk carriers (see Table 16).
2 The categorisation is detailed in Appendix Two.

23
Table 16: Top 10 Nationalities on Bulk Carriers
Rank Order Nationality Percent
1 Philippines 30.5% 2 China 13.5% 3 India 10.0% 4 Ukraine 8.9% 5 Greece 5.6% 6 Turkey 4.8% 7 Bulgaria 3.9% 8 Russian 2.2% 9 Croatia 1.9% 10 Romania 1.7% --- Other (n=75) 17.1%
Total 100.0%
Table 17: Top 10 Nationalities on General Cargo/ Container Ships
Rank Order Nationality Percent
1 Philippines 23.9% 2 Russian 9.3% 3 Ukraine 8.0% 4 China 4.9% 5 India 4.8% 6 Turkey 4.5% 7 Indonesia 4.1% 8 Poland 4.0% 9 Myanmar 3.2% 10 Germany 2.2% --- Other (n=102) 31.0%
Total 100.0%

24
Table 18: Top 10 Nationalities on Tankers
Rank Order Nationality Percent
1 Philippines 33.0% 2 India 7.5% 3 Russian 6.1% 4 Latvia 4.2% 5 Greece 3.9% 6 Indonesia 3.8% 7 Italy 3.6% 8 China 3.3% 9 Korea, South 2.9% 10 Turkey 2.8% Other (n=87) 28.9%
--- Total 100.0%
Nationality by Rank and Ship Type
Aboard bulk carriers and tankers Filipinos occupied the position of the largest
national grouping of senior officers (see Table 19 and 21). However, they were less
significant as a national group (occupying third place in the rank order) when the
senior officers of general cargo/container vessels were considered (see Table 20).
Bulk carriers and tankers also shared other crewing characteristics with regard to the
composition of the senior officer cohort, with India and Greece appearing in the top
ten national groupings for both ship types (but not aboard general cargo/container
vessels). Aboard container vessels Polish and German senior officers were prevalent
amongst senior officers but they did not constitute one of the top five national groups
on either tankers or bulk carriers. Similarly South Korean seafarers uniquely
constituted one of the largest five national groups of senior officers aboard tankers but
did not appear amongst the top five groups of senior officers on bulk carriers or
general cargo/container vessels. Chinese seafarers were not one of the five largest
national groups for any rank, senior officer, junior officer, or rating, aboard tankers.
A more consistent pattern was identified for junior officers when ship type and rank
were considered. Filipinos constituted the largest national grouping aboard all the
three vessel categories although they were more dominant in relation to bulk carriers

25
and tankers. Indian junior officers also appeared in the top five rankings by nationality
for all three categories of vessel. However, Latvian junior officers were uniquely
concentrated aboard tankers (see Table 21) and, as for senior officers, Russians did
not constitute one of the five national groups of junior officers aboard bulk carriers
(although they did on tankers and general cargo/container vessels). As amongst senior
officers, Greek seafarers did not constitute one of the top five largest groups of junior
officers aboard general cargo/container vessels (Table 20) but they were ranked
amongst the top five on bulk carriers and tankers (Tables 19 and 21).
When the distribution of ratings by nationality is considered across ship types,
Filipinos are found to be strongly dominant and appear in the greatest proportion of
any nationality aboard bulk carriers, general cargo/container vessels and tankers.
Ratings from Ukraine, China, and Turkey are represented amongst the five largest
national groups on both bulk carriers and general cargo/container vessels, whilst
Latvians and Indonesians only appear amongst the five largest national groups of
ratings on tankers (see Table 21).
Table 19: Top 5 Nationalities by Rank for Bulk Carriers
Senior Officers Junior Officers Ratings Nationality Percent Nationality Percent Nationality Percent Philippines 18.9% Philippines 28.3% Philippines 35.9% Greece 15.6% China 14.5% China 13.6% China 11.9% Ukraine 11.0% India 8.5% Ukraine 9.5% India 10.5% Ukraine 8.4% India 9.5% Greece 6.0% Turkey 5.1% Other (n=56) 34.6% Other (n=53) 29.8% Other (n=63) 28.5% Total 100.0% Total 100.0% Total 100.0%

26
Table 20: Top 5 Nationalities by Rank for General Cargo/ Container Ships
Senior Officers Junior Officers Ratings Nationality Percent Nationality Percent Nationality Percent Russian 13.4% Philippines 20.4% Philippines 32.9% Ukraine 9.6% Russian 12.6% Ukraine 7.3% Philippines 8.4% Ukraine 9.5% Russian 7.0% Germany 6.8% India 6.1% Turkey 5.1% Poland 5.6% China 5.6% China 4.9% Other (n=83) 56.2% Other (n=76) 45.7% Other (n=90) 42.7% Total 100.0% Total 100.0% Total 100.0%
Table 21: Top 5 Nationalities by Rank for Tankers
Senior Officers Junior Officers Ratings Nationality Percent Nationality Percent Nationality Percent Philippines 11.6% Philippines 27.9% Philippines 44.0% Greece 8.7% India 9.2% India 6.0% Russian 7.3% Russian 8.3% Russian 5.4% India 6.9% Greece 5.2% Indonesia 4.5% Korea, South 6.4% Latvia 4.2% Latvia 4.0% Other (n=63) 59.1% Other (n=67) 45.1% Other (n=71) 36.1% Total 100.0% Total 100.0% Total 100.0%
Nationality by Department and Ship Type
For each category of ship there is considerable consistency in the make-up of crews
across departments in terms of nationality. Aboard bulk carriers the top five
nationalities are the same across all departments and the top two nationalities appear
in the same rank order (first and second) across all three main departments (Filipino
and Chinese). Aboard general cargo/container ships and tankers there is great
consistency across departments with only one nationality (in the top five) found in
only one department: on cargo/container vessels Turkish seafarers are only found in
the galley/catering department; aboard tankers Indonesians are only represented
amongst the top five nationalities in the galley/catering department. This indicates that
companies are not generally specialising in relation to the recruitment of deck or
engine personnel but are tending to select personnel from several major supply

27
sources. It may also indicate that in relation to the galley, there may be some
specialisation occurring, with Turkish and Indonesian seafarers being recruited to
catering departments whilst not being well represented across others. It is not
immediately obvious why this is the case. It is also worth noting that Chinese
seafarers were not amongst the top five nationalities in any of the three main
departments on tankers. This confirms that not only are Chinese seafarers not present
in numbers aboard tankers (see Tables 19, 20, 21) but that there is no departmental
specialisation in relation to the Chinese labour market which might have been
obscured when looking at nationality and vessel type alone.
Table 22: Top 5 Nationalities by Department for Bulk Carriers
Deck Engine Catering Rank Order Nationality Percent Nationality Percent Nationality Percent
1 Philippines 32.6% Philippines 28.7% Philippines 34.8% 2 China 14.0% China 12.9% China 12.8% 3 India 8.9% Ukraine 10.6% India 9.2% 4 Ukraine 8.3% India 9.4% Ukraine 8.1% 5 Greece 6.1% Greece 5.2% Greece 4.9%
--- Other (n=72) 30.2% Other (n=67) 33.1% Other (n=40) 30.2% --- Total 100.0% Total 100.0% Total 100.0%
Table 23: Top 5 Nationalities by Department for General Cargo/ Container Ships
Deck Engine Catering Rank Order Nationality Percent Nationality Percent Nationality Percent
1 Philippines 25.1% Philippines 22.1% Philippines 32.0% 2 Russian 10.1% Russian 9.4% Russian 7.3% 3 Ukraine 7.8% Ukraine 9.1% Ukraine 6.8% 4 China 4.8% India 5.4% Indonesia 4.7% 5 Indonesia 4.3% China 4.8% Turkey 4.7%
--- Other (n=99) 47.9% Other (n=90) 49.1% Other (n=66) 44.5% --- Total 100.0% Total 100.0% Total 100.0%

28
Table 24: Top 5 Nationalities by Department for Tankers
Deck Engine Catering Rank Order Nationality Percent Nationality Percent Nationality Percent
1 Philippines 33.6% Philippines 30.0% Philippines 46.1% 2 India 6.5% India 7.5% India 6.5% 3 Russian 6.4% Russian 6.6% Russian 5.0% 4 Greece 4.1% Latvia 4.7% Indonesia 4.7% 5 Latvia 4.0% Greece 4.1% Latvia 3.5%
--- Other (n=84) 45.4% Other (n=76) 47.1% Other (n=55) 34.1% --- Total 100.0% Total 100.0% Total 100.0%
Nationality by Flag
There are interesting variations in crewing practices in relation to nationality aboard
vessels registered with different flag states (see Table 25). Whereas the Philippines is
the predominant nationality in relation to eight of the ten flags examined, Filipino
seafarers are not the most prevalent aboard Greek and Hong Kong-flagged vessels. In
each case nationals (Greeks and Chinese) are favoured over Filipinos. Filipinos make
up a significant proportion of seafarers (ranked second) aboard Greek vessels, but are
less prevalent (only 13% of crew) on Hong Kong-flagged ships. Hong Kong-flagged
vessels employ significant numbers of Indian seafarers in addition to their Chinese
personnel. In total Indian seafarers are found in numbers aboard the vessels flagged
with seven of the ten flag states considered here. However, they do not appear in the
top five nationalities found on Maltese, Greek, and Cypriot, ships. On these ships,
there appears to be a stronger East European influence with Ukraine, Russia, Poland,
Latvia, and Romania appearing in the top five labour supply countries. Just as the
European-based flags appear to have a stronger preference for European seafarers, so
too do some other flags demonstrate that there may be some regional preferences at
work in relation to flag and crew selection. Hong Kong-flagged vessels do not have
any European groups represented in the top five most prevalent nationalities found on
board and for Singapore-flagged ships the picture is the same with Asians dominating.
By contrast vessels flagged with the Marshall Islands, Liberia, and Bahamas, employ
a mixture of seafarers from East and West with Asian and East European seafarers
appearing in the top five most common nationalities on board.

29
Table 25: Top 5 Nationalities by Flag of Vessel (Top 10 Flags by dwt shown in rank order)
1. Panama 2. Liberia 3. Malta 4. Greece 5. Cyprus Nationality Percent Nationality Percent Nationality Percent Nationality Percent Nationality Percent Philippines 39.2% Philippines 32.7% Philippines 27.9% Greece 48.8% Philippines 41.3% China 11.3% Russian 9.9% Ukraine 19.0% Philippines 39.3% Ukraine 11.1% India 9.8% India 8.4% Russian 11.1% Romania 2.1% Russian 8.4% Korea, South 9.3% China 5.8% Turkey 7.2% Ukraine 1.4% Poland 6.6% Taiwan 4.3% Latvia 5.7% Romania 6.2% Honduras 1.3% Latvia 6.2% Other (n=70) 26.3% Other (n=65) 37.6% Other (n=46) 28.6% Other (n=41) 7.0% Other (n=43) 26.5%
Total 100.0% Total 100.0% Total 100.0% Total 100.0% Total 100.0%
6. Bahamas 7. Norway (NIS) 8. Hong Kong 9. Marshal Islands 10. Singapore Nationality Percent Nationality Percent Nationality Percent Nationality Percent Nationality Percent Philippines 34.1% Philippines 52.3% China 54.3% Philippines 35.0% Philippines 33.1% Poland 9.9% India 18.2% India 16.6% Poland 7.9% India 15.7% Ukraine 8.8% Norway 10.4% Philippines 12.7% India 7.7% Indonesia 11.1% India 8.0% Poland 5.2% Taiwan 2.0% Myanmar 7.0% China 9.5% Russian 5.4% Latvia 3.6% Indonesia 1.8% Romania 6.2% Myanmar 6.0% Other (n=58) 33.9% Other (n=28) 10.4% Other (n=24) 12.5% Other (n=30) 36.3% Other (n=23) 24.7%
Total 100.0% Total 100.0% Total 100.0% Total 100.0% Total 100.0%

30
In order to consider the prevalence of preference for own nationals we undertook an
analysis of numbers of seafarers working on their ‘own’ nationally flagged ships (see
Table 26 and Figure 14). Of the top ten nationalities found in our sample Turkish and
Greek seafarers were the most likely to be working aboard their own nationally
flagged vessels (70% and 67% respectively). Nearly 40% of Russian seafarers were
found to work aboard Russian vessels whilst similar proportions of Chinese,
Myanmar, and Ukrainian seafarers worked upon ‘their own’ nationally flagged ships
(18, 17, 16% respectively). Filipinos and Poles were the least likely to be working on
ships carrying a flag of the same nationality. A full breakdown of all crew
nationalities for all flags is given in Appendix 3.
Table 26: The Percentage of Seafarers Working on Their Own Nationality Vessels (Top 10 nationalities)
Nationality National Flag Percent Turkey 69.8% Greece 67.1% Russian 37.3% Indonesia 19.7% China 17.8% Myanmar 17.3% Ukraine 16.0% India 9.7% Philippines 2.1% Poland 0.2%

31
Figure 14: For each of the Top 10 Nationalities the Percentage of Seafarers Working On Their National Flagged Vessels
0
10
20
30
40
50
60
70
80
Turke
y
Greece
Russian
Indon
esia
China
Myanmar
Ukraine Ind
ia
Philip
pines
Polan
d
Nationality
Per
cent
age
Nationality by Rank and Flag
When we consider rank and flag we find that aboard Liberian-flagged vessels
Filipinos are not amongst the top five nationalities at senior officer level. They are
also significantly under-represented (given their overall dominance of the labour
market) amongst senior officers on Greek-flagged vessels (0.4%). However, it is clear
that Greek vessels remain predominantly populated by Greek officers at the senior
level in line with flag state restrictions on crewing3. Filipinos are present in smaller
proportions than expected amongst senior officers aboard Maltese (14%) and Cypriot
(17%) ships. By contrast aboard Panamanian flagged vessels, where South Korean
senior officers are concentrated (20%), we find Filipino officers present in significant
numbers and they constitute the biggest single group of senior officers by nationality
(22%).
3 Greek vessels are obliged to carry Greek officers in specific ranks (Master and Mate) and to carry a specified number of Greek officers and ratings in relation to tonnage-linked manning scales on ocean going Greek-flagged ships (Hill Dickinson 2008).

32
European officers are most likely to be present in significant numbers aboard
Liberian, Greek, Cypriot, and Maltese vessels. Aboard Liberian vessels Indian seniors
are also found and Cypriot registered ships carry Filipino seniors alongside those from
Greece, Ukraine, Poland and Russia. Panamanian vessels in contrast do not have any
European nations appearing in the top five nationalities of seniors. Alongside
Filipinos and South Koreans they also carry Indian seniors and uniquely, of the five
top registers (by tonnage), they also employ significant proportions of Chinese and
Taiwanese seafarers (9% and 7% respectively).
The picture alters somewhat when junior officers are considered and here we see
Filipino seafarers in much greater numbers. Filipinos are the largest group of junior
officers found aboard Cypriot, Maltese, Liberian and Panamanian ships. Only aboard
Greek flagged vessels do they appear to be under-represented, constituting only 16%
of junior officers, most of whom (70%) are Greek. This pattern suggests that, all other
things remaining equal, we will see a considerable shift away from the employment of
European senior officers aboard the world fleet and towards the employment of senior
Filipino officers in the next five to ten years. This is already true of the Panamanian
fleet where the distribution of junior officers by nationality is relatively closely
matched to that of senior officers although amongst junior officers there are more
Filipinos found than amongst seniors, and fewer South Koreans than amongst
seniors. This implies that the domination of senior officer positions by Filipinos is
likely to strengthen.
Filipinos constitute almost half of the ratings aboard all of the vessels registered with
the top five flags with the exception of Malta. Aboard Maltese vessels Ukrainian
ratings seem relatively common and Filipinos only make up just over a third of all
ratings on board.

33
Table 27: The Top 5 Nationalities Working on Panamanian Flagged Vessels Split by Rank
Senior Junior Rating Nationality Percent Nationality Percent Nationality Percent Philippines 22.2% Philippines 34.9% Philippines 48.1% Korea, South 20.2% Korea, South 12.6% China 12.5% India 11.6% India 11.9% India 6.7% China 8.7% China 10.9% Korea, South 4.6% Taiwan 6.7% Taiwan 4.4% Indonesia 4.5% Other (n=53) 30.6% Other (n=41) 25.3% Other (n=48) 23.6%
Total 100.0% Total 100.0% Total 100.0%
Table 28: The Top 5 Nationalities Working on Liberian Flagged Vessels Split by Rank
Senior Junior Rating Nationality Percent Nationality Percent Nationality Percent Germany 13.5% Philippines 26.9% Philippines 43.8% Russian 12.1% Russian 14.2% Russian 8.2% Poland 9.3% India 10.8% India 6.5% India 8.8% China 7.3% Latvia 5.9% Croatia 8.2% Latvia 5.0% Myanmar 5.9% Other (n=41) 48.1% Other (n=37) 35.8% Other (n=41) 29.7%
Total 100.0% Total 100.0% Total 100.0%
Table 29: The Top 5 Nationalities Working on Maltese Flagged Vessels Split by Rank
Senior Junior Rating Nationality Percent Nationality Percent Nationality Percent Ukraine 21.8% Philippines 23.9% Philippines 33.5% Russian 16.5% Ukraine 22.9% Ukraine 17.3% Philippines 13.5% Russian 13.2% Russian 9.0% Greece 10.4% Romania 6.0% Turkey 7.8% Turkey 7.1% Bulgaria 5.9% Romania 6.9% Other (n=27) 30.7% Other (n=25) 28.2% Other (n=34) 25.3%
Total 100.0% Total 100.0% Total 100.0%

34
Table 30: The Top 5 Nationalities Working on Greek Flagged Vessels Split by Rank
Senior Junior Rating Nationality Percent Nationality Percent Nationality Percent Greece 97.0% Greece 70.3% Philippines 60.6% Netherlands 0.6% Philippines 15.5% Greece 25.2% Norway 0.4% Ukraine 3.9% Romania 2.9% Philippines 0.4% Bulgaria 2.3% Honduras 2.1% Ukraine 0.4% Romania 2.2% Indonesia 1.8% Other (n=6) 1.3% Other (n=17) 5.9% Other (n=27) 7.3%
Total 100% Total 100.0% Total 100.0%
Table 31: The Top 5 Nationalities Working on Cyprus Flagged Vessels Split by Rank
Senior Junior Rating Nationality Percent Nationality Percent Nationality Percent Greece 17.7% Philippines 41.1% Philippines 50.2% Philippines 17.3% Ukraine 14.2% Ukraine 10.0% Ukraine 12.9% Russian 10.9% Russian 6.9% Poland 12.0% Poland 5.4% Latvia 6.0% Russian 11.6% India 5.3% Poland 5.7% Other (n=28) 28.7% Other (n=24) 23.1% Other (n=29) 21.1%
Total 100.0% Total 100.0% Total 100.0%
Age by Nationality4
When we consider the age of the top ten nationalities found in our sample we find that
European seafarers (Greeks, Poles, Russians, and Ukrainians) tend to be of a higher
average age than non-Europeans (Filipinos, Indonesians, Chinese, Indians, Myanmar
nationals and Turks). Table 32 shows the mean ages and their distributions for the top
ten nationalities of seafarers found in the GLMS database.
4 In this sections age has been cropped by removing ages below 16 and above 80 in order to remove outliers which may skew the distributions.

35
Table 32: Descriptive of Age for the Top 10 Nationalities
Nationality Mean Std.
Deviation Minimum Maximum Greece 44.5 11.3 16 73 Poland 43.5 10.1 18 67 Russian 39.7 9.6 17 71 Ukraine 39.4 10.4 16 75 Philippines 37.3 8.5 17 73 Indonesia 36.8 9.5 18 64 China 36.4 9.7 16 71 India 36.3 10.4 18 62 Myanmar 36.3 9.3 17 64 Turkey 34.8 10.1 18 72
Age by Rank
The average age of senior officers is higher than that of junior officers by some
margin (eight years and seven months). This is to be expected given the anticipated
progression of (young) seafarer cadets from junior to senior officer status over time
and with experience and further qualification. The difference in the average age of
ratings as compared with the average age of senior officers may relate to the nature of
the work involved (ratings may be expected to do far more strenuous physical work
than senior officers for example, and may leave the workforce with the onset of age
related conditions such as arthritis and occupational injuries associated with repeated
heavy work). Table 33 shows the mean ages of seafarers by rank.
Table 33: Age of Seafarers by Rank
Rank Frequency Mean Std. Deviation
Senior 16394 44.9 9.1 Junior 16901 36.3 9.5 Rating 43030 37.7 9.7

36
Age by Rank and Nationality
This pattern of age and rank was found for most nationalities of seafarer where in
most cases senior officers were of the highest average age, junior officers were of the
lowest average age and the average age of ratings fell between the two. However for
three of the top ten nationalities the distribution was not observed. It was not found in
the case of seafarers from the Philippines, Ukraine, and Myanmar. In these three cases
senior officers had the highest average age, junior officers had the next highest
average age, and ratings had the lowest average age (see Figure 15).
Figure 15: Mean Ages by Rank for the Top 10 Nationalities
0
10
20
30
40
50
60
Philippin
es
Russi
an India
Ukraine
China
Turke
y
Indon
esia
Polan
d
Greece
Myanm
ar
Nationality
Mea
n A
ge
SeniorJunior
Rating

37
Crew Size by Ship Type
Crew sizes vary considerably with the highest variation found amongst general cargo
vessels (standard deviation 6.8) and tankers (s.d. 6.5) and the most consistency in
crew size found aboard reefers (s.d. 3.8) and bulk carriers (s.d. 4.3). The biggest
average crew size (23.1) was found for tankers and the smallest crews, on average,
were found aboard general cargo vessels (13.7) and ‘other tankers’ (13.3). See Table
34 and Figure 16 which show the mean crew sizes for each vessel type.
Table 34: Mean Crew Size by Vessel
Ship type Mean Std.
Deviation Minimum Maximum Oil Tanker 23.1 6.5 6 55 Bulk Carrier 22.7 4.3 5 48 Container 21.1 4.9 6 49 Ro-Ro 21.1 5.0 7 40 Refrigerated Cargo 20.8 3.8 7 32 Liquid/ Gas Carrier 18.9 6.3 5 44 Other Cargo 17.2 6.4 5 32 General Cargo 13.7 6.8 4 57 Other Tanker 13.3 6.2 6 26
This is represented in Figure 16, where the dark bar on each box plot represents the
mean, and the upper and lower points of each box represent the standard deviation.

38
Figure 16: Crew Size by Ship Type
Oil Tanker
Bulk Carrier
Container
Ro-RoRefrigerated Cargo
Liquid/ Gas Carrier
Other Cargo
General Cargo
Other Tanker
Ship Type
0
5
10
15
20
25
30
35
40C
rew
siz
e
Crew Size by dwt
To consider vessel type without taking tonnage into account is likely to be misleading
as some categories of ship type may contain much higher proportions of small ships,
which may require smaller crews than others, or they may be engaged in more labour
intensive activities than others. When crew size is considered in relation to
deadweight tonnage a clear size effect can be demonstrated (see Table 35), with crew
size increasing on average with increase in size5 (see Table 35, Figure 17). Statistical
tests further confirm this relationship, as a strongly significant positive correlation is
found between crew size and dwt [r (4238) =.456, p=000)]. This indicates clearly that
5 NB we have not included vessels under 1000 dwt as we had insufficient numbers of these in the sample.

39
vessel and ship type need to be combined in order to properly understand the
relationship between vessel type and crew size and we have previously made an effort
to undertake this comparison and to further consider the impact of flag (see
Winchester, Sampson, Shelly 2006).
Table 35: Mean Crew Size by dwt (Grouped)
dwt Group Mean Std.
Deviation Minimum Maximum 1000 - 2999 10.0 4.8 4 51 3000 - 4999 12.8 4.0 5 33 5000 - 9999 16.8 4.6 5 49 10000 - 19999 21.3 5.8 7 84 20000 - 49999 23.5 4.3 9 55 50000 - 69999 23.6 4.4 7 46 70000 - 99999 24.4 4.0 11 39 >=100000 25.3 4.2 19 48
Figure 17: Crew Size by dwt
< 10001000 - 2999
3000 - 4999
5000 - 9999
10000 - 19999
20000 - 49999
50000 - 69999
70000 - 99999
>=100000
Deadweight Tonnage
0
5
10
15
20
25
30
35
40
Cre
w s
ize

40
Crew Size by Flag
Crew size appears to be influenced by flag, with Greek flagged vessels generally
having the largest crews (mean crew size 23), and Antigua and Barbuda flagged
vessels generally having the smallest crews (mean crew size 11). A clear difference
can be seen between the Russian, Netherlands, and Antigua and Barbuda flagged
vessels, which tend to have smaller crews than the other flagged vessels. In fact when
tested this difference is found to be statistically significant (F=96.995, d.f.=10,
p=.000). Flag type, ship type, ship size and crew size are considered in considerable
detail in an earlier SIRC publication (Winchester, Sampson, Shelly 2006).
Table 36 shows the mean crew sizes for the top 10 flag6.
Table 36: Mean Crew Size by Flag
Flag Frequency Mean Std. Deviation Minimum Maximum
Greece 134 23.0 4.5 7 32 Liberia 303 22.5 4.5 8 39 Norway (NIS) 141 21.4 7.6 5 38 Panama 665 21.1 4.2 7 51 Malta 313 20.9 5.8 6 37 Bahamas 175 20.6 8.9 5 84 Cyprus 200 20.1 6.5 5 32 Russian 151 14.4 5.0 9 39 Netherlands 184 11.2 6.8 5 33 Antigua and Barbuda 189 10.8 5.0 4 23
6 In this case the top 10 flags are defined by frequency, not by dwt (as in the rest of the report), as a relationship has been found between dwt and crew size, which may mask the influence of flag on crew size.

41
Conclusions
Within the GLMS dataset Filipino seafarers were found to dominate the global labour
market for seafarers constituting almost a third of the total number of seafarers in the
sample. Seafarers from Eastern Europe, from Russia, from India, and from relatively
new labour supply countries such as Myanmar were also found amongst the top ten
labour supply countries although their share of the labour market remains relatively
insignificant when compared with the Philippines.
However Filipinos were less dominant in relation to the labour market for senior
officers than in relation to that for junior officers or ratings. The labour market for
senior officers was the most diverse of the three rank categories and Filipinos only
constituted 11% of the total numbers of senior officers in the sample, with Russians,
Ukrainians, Greeks, Indians, Chinese, Polish, South Korean, German and Turkish
seafarers all maintaining a share. Amongst junior officers the position of Filipinos in
the labour market strengthened (relative to seniors) and they made up almost a quarter
of the junior officers in the sample. However, it was when ratings were considered
that the real strength of the grasp of the Philippines on the global seafarer labour
market is revealed, with 37% of the ratings in the sample originating from the
Philippines.
National specialisation with regard to department was not identified as a strong
feature of the labour market in this study. Some specialisation was noted within the
galley department but this was limited and seemed to involve a degree of
concentration amongst Turkish and Indonesian seafarers on some vessels.
Specialisation by ship type was also not found to be a very strong feature, however, it
was noted that Chinese seafarers were not amongst the top five nationalities in any of
the three main departments on tankers7 where Latvian seafarers maintained a stronger
presence than aboard other vessel types. Additionally German seafarers were found
amongst the top ten nationalities aboard general cargo/container vessels, and
Croatians were the ninth largest group of seafarers aboard bulk carriers, despite
7 Chinese seafarers had the fifth largest nationality group in the sample overall (see Table 8).

42
neither national group appearing amongst the top ten sources of labour overall (see
Table 7).
As might be expected, given that some flags retain crewing requirements with regard
to nationality, flag did impact upon crew composition. In contrast with the ‘norm’
Filipino seafarers were not the most prevalent national group aboard vessels flagged
with two registers: Greece and Hong Kong. Aboard Maltese, Greek, and Cypriot
flagged vessels Russian and East European (Polish, Ukrainian) seafarers were more
commonly concentrated than on other ships. Indian seafarers did not appear in the top
five nationality groups of vessels carrying these same flags (i.e. Maltese, Greek,
Cypriot) in contrast with those flagged with other registers. Whilst Europeans were
concentrated aboard some European-flagged vessels they were notably absent from
Hong Kong-flagged ships which did not have any European national groupings
represented in the top five nationalities found on board. This pattern was repeated for
Singapore-flagged ships where, as with the Hong Kong fleet, most seafarers were
found to originate from Asia.
In relation to rank and flag there were some interesting variations in crewing patterns.
Most notably, Greek officers were concentrated aboard Greek vessels and Filipino
senior officers were present in smaller numbers than expected aboard Maltese and
Cypriot ships. Similarly, Filipino senior officers did not constitute one of the five
largest national groups of senior officers aboard Liberian flagged vessels.
European seafarers tended to be older, on average, than non-Europeans, and as would
be expected, senior officers were, on average, older than junior officers, and ratings
were younger than senior officers (but older, on average, than junior officers).
A clear size effect was demonstrated when considering crew size by ship size (dwt)
with a positive correlation found between ship size and crew size (i.e. the bigger the
ship the bigger the average crew size). There also seemed to be an independent flag
effect in relation to crew size with Greek vessels carrying larger than average crews
and Antigua and Barbuda, Netherlands and Russian vessels carrying smaller crews
than found aboard other vessels.

43
References
Hill Dickinson (2008) ‘International Ship Registration Requirements’ on line www.hilldickinson.com/downloadfile.aspx?10=185 accessed 19/2/08. Winchester, N., Sampson, H., Shelly, T. (2006) An Analysis of Crewing Levels: Findings from the SIRC Global Labour Market Study, SIRC: Cardiff University, ISBN: 1-900174-27-8.

44
APPENDIX 1
Vessel Type Recoding for GLMS database Comparison to Other Sources
GLMS Database WFS Data GLMS WFS GLMS WFS Main type categories Type Frequency Type Frequency Totals Totals Percent Percent
Bulk / Oil Carrier 18 Bulk / Oil Carrier 174 Bulk Carrier 660 Cement Carrier 10 Ore / Oil Carrier 3 Ore Carrier 13 Self-Discharging Bulk Carrier 8 Self-Discharging Bulk Carrier 168 Wood Chips Carrier 11 Stone Carrier 1 Bulk Dry 5,046
Bulk Carriers
Other Bulk Dry 1,112 724 6500 17.3% 14.9% Container Ro-Ro Cargo Ship 1 Ro-Ro Cargo Ship 48 Ro-Ro Cargo Ship 1,921 Passenger / Ro-Ro Cargo Ship 4 Passenger / Ro-Ro Cargo Ship 2,737
Ro-Ro Vehicles Carrier 92 145 4,658 3.5% 10.7% Container Container Ship 773 Container Ship 3,055 773 3,055 18.4% 7.0%
General Cargo Ship 1219 General Cargo Ship 16,253 Passenger / General Cargo Ship 2 Passenger / General Cargo Ship 340
General Cargo
Palletised Cargo Ship 2 1223 16,593 29.2% 38.0% Other Cargo 2 Barge Carrier 5 Deck Ca rgo Ship 2 Heavy Load Carrier 10 Landing Craft 2 Livestock Carrier 5
Other Cargo
Other Dry Cargo 250 26 250 0.6% 0.6%

45
Vessel Type Recoding for GLMS database Comparison to Other Sources (cont.)
Refrigerated Cargo Ship 183 Refrigerated Cargo Ship 1,272 Reefer Fruit Juice Tanker 1 184 1,272 4.4% 2.9% Passenger Passenger
Chemical / Oil Products Tanker 330 Chemical Tanker 170 Chemical Tanker 2,828 LNG Tanker 5 LNG Tanker 153
Liquid/ Gas
LPG Tanker 107 LPG Tanker 1,027 612 4008 14.6% 9.2% Crude Oil Tanker 269 Crude Oil Tanker 1,810 Oil Tankers Oil Products Tanker 215 Oil Products Tanker 5,136 484 6,946 11.5% 15.9% Bitumen Tanker 9 Edible Oil Tanker 5 Fish Oil Tanker 1 Vegetable Oil Tanker 7 Wine Tanker 1
Other Tankers
Other Liquid 371 23 371 0.5% 0.8% Other Ship Fish catching Other Fishing Offshore supply Other offshore Research Towing/ pushing Dredging
Other
Other Activities 4,194 43,653 4,194 43,653 100.0% 100.0%
N.B. The shaded out types in others indicate those which were excluded from analysis.

46
APPENDIX 2
Vessel Type Groupings for Analysis
Vessel Types Original Vessel Type Frequency Percent of Group
Bulk Carrier 724 100.0% Bulk Carriers Total 724 100.0%
Ro-Ro 145 6.2% Container 773 33.2% General Cargo 1223 52.6% Refrigerated Cargo 184 7.9%
General Cargo/ Containers
Total 2325 100.0% Liquid/ Gas Carrier 612 54.7% Oil Tanker 484 43.3% Other Tanker 23 2.1%
Tankers
Total 1119 100.0% Other Cargo 26 36.1% Other 46 63.9%
Others
Total 72 100.0%

47
APPENDIX 3
The Percentage of Seafarers Working on Their Own Nationality Vessels
Flag Seafarers Nationality Percent Albania Albania 100.0
Bangladesh 1.1 Belgium 0.4 Bolivia 0.0 Canada 0.1 Cape Verde 1.8 Croatia 2.9 Cyprus 0.1 Czech Rep 0.0 Estonia 0.5 Finland 0.1 Georgia 0.0 Germany 6.2 Ghana 0.5 Hungary 1.0 Iceland 2.4 India 0.6 Latvia 0.3 Lithuania 5.5 Myanmar 4.4 Netherlands 0.2 Norway 0.2 Philippines 32.9 Poland 14.6 Portugal 0.1 Moldova Rep 0.0 Romania 2.9 Russian 8.5 Slovakia 0.0 Slovenia 1.6 Spain 0.0 Sri Lanka 0.1 Switzerland 0.0 Taiwan 0.4 Turkey 0.2 Ukraine 9.8 Yugoslavia 0.1
Antigua and Barbuda
Total 100.0 Azerbaijan 88.3 Russian 11.7
Azerbaijan
Total 100.0 Australia 0.0 Bangladesh 0.3 Belarus 0.1 Belgium 0.1 Bosnia and Herzegovina 0.1
Bahamas
Brazil 0.1

48
British Virgin Islands 0.1 Bulgaria 0.6 Canada 0.1 Cape Verde 0.1 Chile 0.1 China 4.2 Colombia 0.0 Croatia 4.3 Cuba 0.9 Czech Rep 0.5 Denmark 0.1 Ecuador 1.1 Egypt 0.7 Estonia 0.1 Finland 0.6 France 0.4 Georgia 0.1 Germany 0.1 Greece 1.6 Guyana 0.2 Hungary 0.0 India 8.0 Indonesia 0.6 Ireland 0.1 Italy 0.3 Latvia 2.1 Lithuania 1.0 Malaysia 0.1 Maldives 1.2 Myanmar 1.0 Namibia 0.0 Netherlands 0.2 Nigeria 0.1 Norway 1.3 Pakistan 0.9 Panama 0.3 Philippines 34.1 Poland 9.9 Portugal 0.1 Korea, South 0.5 Romania 1.3 Russian 5.4 Saint Lucia 0.0 Singapore 0.0 Slovakia 0.1 Slovenia 0.1 South Africa 2.4 Spain 0.3 Sweden 0.3 Switzerland 0.0 Taiwan 0.6 Turkey 0.5

49
Ukraine 8.8 United Kingdom 1.5 Tanzania 0.0 Yugoslavia 0.3
312 0.0 Total 100.0 Egypt 16.7 India 16.7 Iraq 3.3 Maldives 3.3 Philippines 56.7 Syrian 3.3
Bahrain
Total 100.0 Bangladesh Bangladesh 100.0
Canada 1.1 Cape Verde 5.4 Czech Rep 1.1 Estonia 1.1 Ghana 2.2 Hungary 1.1 India 48.9 Lithuania 2.2 Poland 26.1 Romania 2.2 Russian 1.1 Trinidad and Tobago 1.1 United Kingdom 1.1 Yugoslavia 5.4
Barbados
Total 100.0 Belgium 23.1 Germany 1.9 India 1.9 Malaysia 3.8 Morocco 1.9 Netherlands 17.3 Philippines 30.8 Singapore 1.9 Thailand 3.8 Ukraine 13.5
Belgium
Total 100.0 Austria 1.5 Denmark 0.7 Germany 0.7 Indonesia 20.4 Latvia 3.6 Myanmar 7.3 Netherlands 0.7 New Zealand 0.7 Philippines 4.4 Russian 35.8 Thailand 2.2
Belize
Ukraine 3.6

50
United Kingdom 0.7 Viet Nam 16.8 Yugoslavia 0.7 Total 100.0 Bulgaria 10.4 China 17.2 Croatia 12.7 India 14.2 Latvia 10.4 Lithuania 3.0 Philippines 17.9 Poland 0.7 Romania 0.7 Russian 1.5 Turkey 9.0 United Kingdom 2.2
Bermuda
Total 100.0 Egypt 73.1 Romania 19.2 Sudan 3.8 Syrian 3.8
Bolivia
Total 100.0 Brazil 71.7 Ukraine 28.3
Brazil
Total 100.0 Bulgaria Bulgaria 100.0
Azerbaijan 1.5 Bulgaria 4.5 China 2.4 Egypt 10.2 Georgia 0.4 Greece 0.2 India 2.9 Indonesia 5.9 Latvia 0.6 Lebanon 0.2 Myanmar 2.1 Palestinian Territory 0.2 Philippines 1.6 Korea, South 0.7 Moldova Rep 0.2 Romania 1.6 Russian 19.1 Syrian 11.8 Turkey 6.9 Ukraine 25.5 Venezuela 0.1 Viet Nam 1.5
Cambodia
Total 100.0 Canada Canada 100.0
Australia 0.3 Cayman Islands Austria 0.1

51
Bangladesh 0.2 Belarus 0.1 Belgium 0.1 Bulgaria 1.8 Canada 0.3 Croatia 3.0 Czech Rep 1.2 Denmark 0.2 Finland 0.1 Georgia 0.5 Germany 0.1 Greece 1.0 India 2.7 Ireland 0.2 Italy 0.4 Latvia 11.8 Lithuania 0.8 Netherlands 1.3 Norway 3.5 Philippines 46.4 Poland 3.4 Romania 0.1 Russian 10.0 Slovakia 0.5 South Africa 0.1 Spain 0.3 Sri Lanka 0.2 Sweden 1.1 Turkey 1.1 Ukraine 3.9 United Kingdom 2.6 Yugoslavia 0.4 Total 100.0
Chile Chile 100.0 China 70.9 France 0.1 Indonesia 0.5 Myanmar 3.7 Philippines 3.9 Taiwan 20.9
China
Total 100.0 Colombia Colombia 100.0
Egypt 12.4 Greece 3.4 Lebanon 7.9 Pakistan 37.1 Romania 6.7 Syrian 19.1 Ukraine 12.4 United Kingdom 1.1
Comoros
Total 100.0 Croatia Croatia 99.5

52
Slovenia 0.5 Total 100.0 Australia 0.0 Austria 0.0 Bangladesh 0.0 Belarus 0.1 Belgium 0.2 Bulgaria 1.8 Cape Verde 0.1 Chile 0.0 China 0.9 Croatia 0.6 Cuba 2.8 Cyprus 0.1 Denmark 0.0 Egypt 0.0 Estonia 0.1 Georgia 0.1 Germany 0.6 Greece 4.6 Iceland 0.0 India 6.0 Indonesia 1.1 Italy 0.1 Kazakhstan 0.0 Kiribati 0.5 Latvia 6.2 Lithuania 0.3 Malaysia 0.0 Maldives 0.2 Myanmar 1.2 Netherlands 0.1 New Zealand 0.0 Pakistan 0.1 Philippines 41.3 Poland 6.6 Korea, South 0.4 Romania 1.3 Russian 8.4 Sri Lanka 1.0 Syrian 0.0 Togo 0.2 Turkey 0.0 Tuvalu 0.2 Ukraine 11.1 United Kingdom 0.2 United States 0.0 Uruguay 0.0 Viet Nam 0.4 Yugoslavia 0.2
Cyprus
Total 100.0 Korea, North Azerbaijan 3.4

53
Korea, North 23.4 Egypt 8.3 Greece 2.1 India 1.4 Lebanon 2.1 Myanmar 4.8 Romania 8.3 Sudan 2.1 Syrian 22.8 Turkey 3.4 Ukraine 17.9 Total 100.0 Denmark 96.0 Faeroe Islands 4.0
Denmark
Total 100.0 Ecuador Ecuador 100.0 Egypt Egypt 100.0
Azerbaijan 10.0 Turkey 90.0
Equatorial Guinea
Total 100.0 Belarus 3.3 Estonia 53.3 Latvia 16.7 Russian 20.0 Ukraine 6.7
Estonia
Total 100.0 Ethiopia 90.6 Ghana 9.4
Ethiopia
Total 100.0 Denmark 3.6 India 14.3 Norway 67.9 Poland 7.1 Sweden 7.1
Faeroe Islands
Total 100.0 Estonia 2.4 Finland 75.0 Philippines 22.6
Finland
Total 100.0 Croatia 25.0 France 27.5 Philippines 47.5
France
Total 100.0 Azerbaijan 0.5 Egypt 14.7 Estonia 0.3 Georgia 1.9 Romania 5.6 Russian 15.8 Sudan 0.5 Syrian 17.6
Georgia
Turkey 12.8

54
Ukraine 24.3 Yugoslavia 5.9 Total 100.0 Austria 0.2 Azerbaijan 0.1 Cape Verde 0.5 Chile 0.1 China 0.1 Croatia 0.4 Denmark 0.1 Egypt 0.1 Estonia 0.1 Germany 27.9 Ghana 0.1 Hungary 0.1 India 0.3 Indonesia 0.1 Iraq 0.1 Kiribati 3.1 Latvia 0.2 Lithuania 0.5 Myanmar 1.7 Philippines 55.7 Poland 0.8 Portugal 0.3 Korea, South 0.3 Russian 3.1 Spain 0.3 Sweden 0.1 Turkey 0.2 Tuvalu 1.4 Ukraine 1.9 United Kingdom 0.3 Uruguay 0.1 Yugoslavia 0.1
Germany
Total 100.0 Austria 0.3 Cameroon 0.6 Cape Verde 0.3 China 0.3 Croatia 0.6 Cuba 0.3 Germany 4.4 Ghana 0.6 Greece 3.0 Guyana 0.8 Hungary 0.3 Indonesia 3.6 Israel 0.3 Kazakhstan 0.3 Latvia 1.1
Gibraltar
Lithuania 1.1

55
Philippines 29.5 Poland 17.9 Romania 2.5 Russian 16.0 Sweden 0.3 Turkey 0.3 Ukraine 14.9 United Kingdom 1.1 Total 100.0 Belgium 0.0 Bulgaria 1.0 Canada 0.0 Chile 0.2 China 0.7 Costa Rica 0.1 Cote d Ivoire (Ivory Coast) 0.2 Croatia 0.0 Cyprus 0.1 Denmark 0.2 Ecuador 0.0 Egypt 0.2 El Salvador 0.3 Finland 0.0 Germany 0.0 Greece 48.5 Guinea 0.1 Honduras 1.3 India 0.2 Indonesia 1.1 Italy 0.1 Japan 0.0 Latvia 0.2 Malaysia 0.3 Maldives 0.1 Mali 0.0 Mexico 0.1 Morocco 0.2 Myanmar 0.6 Netherlands 0.1 Nicaragua 0.2 Norway 0.1 Pakistan 0.1 Panama 0.1 Philippines 39.0 Poland 0.4 Romania 2.1 Russian 0.2 Slovenia 0.0 Sri Lanka 0.0 Syrian 0.0 Turkey 0.0
Greece
Ukraine 1.4

56
United Kingdom 0.0 United States 0.1 Yugoslavia 0.1 Total 100.0 Colombia 8.5 Greece 6.0 Honduras 4.3 Indonesia 39.3 Japan 0.4 Lebanon 3.0 Myanmar 0.9 Panama 1.3 Philippines 2.1 Romania 8.1 Syrian 3.0 Thailand 17.1 Ukraine 4.3 United States 1.7
Honduras
Total 100.0 Australia 0.1 Bangladesh 0.8 Belarus 0.0 Canada 0.1 China 54.3 Croatia 1.4 Germany 0.4 Ghana 0.2 Greece 1.7 India 16.6 Indonesia 1.8 Ireland 0.1 Latvia 0.0 Lithuania 0.0 Malaysia 0.4 Myanmar 1.7 Pakistan 0.3 Philippines 12.7 Poland 0.3 Korea, South 0.8 Romania 0.4 Russian 0.4 Singapore 0.3 Sri Lanka 1.0 Taiwan 2.0 Ukraine 1.2 United Kingdom 0.5 United States 0.4 Yugoslavia 0.0 Total 100.0 System
Hong Kong
India India 100.0

57
Indonesia 99.3 Myanmar 0.4 Sweden 0.4
Indonesia
Total 100.0 Bangladesh 3.3 China 0.3 Gambia 0.3 Ghana 3.3 India 5.6 Iran 83.7 Nigeria 0.3 Pakistan 2.0 Sri Lanka 0.3 Ukraine 1.0
Iran
Total 100.0 Ireland 12.2 Kiribati 18.4 Poland 40.8 United Kingdom 28.6
Ireland
Total 100.0 Australia 0.4 Bangladesh 0.1 Bulgaria 2.0 Canada 0.1 China 0.2 Croatia 2.1 Czech Rep 0.1 Denmark 0.2 Estonia 0.5 Germany 2.7 Iceland 2.1 India 5.6 Ireland 0.3 Kiribati 0.8 Latvia 1.0 Lithuania 1.5 Namibia 0.1 Netherlands 0.4 New Zealand 0.1 Norway 1.2 Oman 0.3 Pakistan 8.5 Philippines 40.9 Poland 6.2 Portugal 0.1 Romania 0.8 Russian 6.7 South Africa 3.8 Tonga 0.6 Turkey 0.4 Turkmenistan 0.4
Isle of Man
Ukraine 2.4

58
United Kingdom 7.6 Total 100.0 Bulgaria 21.8 Ghana 0.7 Hungary 0.7 Israel 42.9 Philippines 7.5 Poland 0.7 Romania 20.4 Singapore 0.7 Tajikistan 0.7 Turkey 2.0 Ukraine 1.4 Yugoslavia 0.7
Israel
Total 100.0 Argentina 0.2 Belarus 0.1 Cape Verde 0.1 Croatia 0.7 Estonia 0.1 Georgia 0.1 Greece 0.1 India 8.3 Italy 63.1 Pakistan 0.1 Philippines 10.5 Poland 1.3 Portugal 0.1 Romania 9.4 Russian 2.6 Spain 1.0 Taiwan 0.1 Ukraine 1.4 Yugoslavia 0.6
Italy
Total 100.0 Jamaica Russian 100.0
Indonesia 3.1 Japan 26.8 Philippines 70.1
Japan
Total 100.0 Bosnia and Herzegovina 1.1 Bulgaria 2.2 Egypt 8.9 India 14.4 Ireland 1.1 Kuwait 3.3 Pakistan 5.6 Philippines 56.7 Poland 1.1 Syrian 1.1 United Kingdom 4.4
Kuwait
Total 100.0

59
Egypt 10.0 Lebanon 25.0 Poland 2.5 Romania 3.8 Syrian 56.3 Ukraine 2.5
Lebanon
Total 100.0 Armenia 0.0 Austria 0.0 Azerbaijan 0.0 Bangladesh 0.3 Belarus 0.1 Brazil 0.9 British Virgin Islands 0.0 Bulgaria 2.3 Chile 0.2 China 5.8 Croatia 3.5 Czech Rep 0.0 Denmark 0.0 Ecuador 0.0 Egypt 0.0 El Salvador 0.0 Estonia 0.1 Fiji 0.0 Finland 0.0 France 0.0 Georgia 0.1 Germany 3.5 Ghana 0.0 Greece 0.5 Haiti 0.0 Hong Kong 0.0 Hungary 0.0 India 8.4 Indonesia 2.6 Italy 0.1 Japan 0.3 Jordan 0.0 Kiribati 2.3 Latvia 5.7 Lithuania 0.6 Malaysia 0.1 Maldives 0.4 Mexico 0.1 Myanmar 4.6 Netherlands 0.1 Norway 0.5 Pakistan 0.2 Panama 0.0 Peru 0.0
Liberia
Philippines 32.7

60
Poland 3.8 Portugal 0.1 Korea, South 0.4 Moldova Rep 0.0 Romania 1.1 Russian 9.9 Saudi Arabia 0.1 Singapore 0.0 Slovakia 0.0 Slovenia 0.0 South Africa 0.0 Spain 0.2 Sri Lanka 0.7 Sweden 0.1 Taiwan 1.1 Trinidad and Tobago 0.1 Turkey 0.9 Turkmenistan 0.0 Tuvalu 0.9 Ukraine 2.7 United Kingdom 0.7 United States 0.4 Venezuela 0.0 Yugoslavia 0.4
312 0.0 Total 100.0 System Egypt 4.8 Libyan 28.6 Romania 38.1 Syrian 28.6
Libyan
Total 100.0 Lithuania 88.5 Russian 7.7 Ukraine 3.8
Lithuania
Total 100.0 Algeria 0.4 Belgium 19.8 Canada 0.8 Cape Verde 0.8 Chile 0.4 Croatia 5.8 Estonia 0.4 Finland 1.9 France 1.6 Germany 1.9 India 6.2 Indonesia 0.8 Italy 3.1 Malaysia 1.9 Morocco 0.4
Luxembourg
Netherlands 1.9

61
Norway 0.4 Philippines 27.6 Poland 7.4 Portugal 0.4 Romania 8.2 Russian 6.2 Slovakia 0.4 Spain 0.4 Ukraine 0.8 Total 100.0 Bangladesh 1.1 China 0.3 Gambia 0.1 Ghana 0.7 India 4.3 Indonesia 26.2 Malaysia 47.1 Myanmar 7.1 Netherlands 0.1 Nigeria 0.5 Pakistan 1.3 Philippines 9.4 Korea, South 0.7 Russian 0.1 Singapore 0.4 Sri Lanka 0.1 Thailand 0.7 Yugoslavia 0.1
Malaysia
Total 100.0 India 5.6 Maldives 88.9 Sri Lanka 5.6
Maldives
Total 100.0 Austria 0.0 Azerbaijan 0.2 Bangladesh 0.0 Belarus 0.0 Benin 0.1 Bosnia and Herzegovina 0.0 Bulgaria 4.1 Canada 0.0 Chile 0.1 China 2.1 Costa Rica 0.0 Croatia 1.4 Cuba 0.4 Ecuador 0.0 Egypt 0.4 Estonia 0.0 Georgia 0.8 Germany 0.0
Malta
Ghana 0.2

62
Greece 3.0 Honduras 0.4 Hungary 0.1 India 3.7 Indonesia 0.7 Iran 0.0 Israel 0.3 Italy 0.6 Jordan 0.0 Latvia 3.4 Lithuania 0.2 Maldives 0.2 Myanmar 0.5 New Zealand 0.0 Palestinian Territory 0.0 Pakistan 0.3 Philippines 27.9 Poland 2.4 Portugal 0.0 Moldova Rep 0.0 Romania 6.2 Russian 11.1 Slovenia 0.0 Sri Lanka 0.5 Syrian 1.3 Taiwan 0.0 Togo 0.0 Turkey 7.2 Ukraine 19.0 United Kingdom 0.0 Tanzania 0.1 Yugoslavia 0.8 Total 100.0 Bulgaria 0.3 Canada 0.2 Chile 3.0 Croatia 3.6 Denmark 0.1 Egypt 0.3 Estonia 0.1 Georgia 4.2 Germany 1.2 Greece 3.1 Hungary 0.1 India 7.7 Indonesia 0.2 Ireland 0.1 Italy 0.1 Latvia 1.4 Lithuania 0.2 Myanmar 7.0
Marshall Islands
New Zealand 0.1

63
Norway 0.1 Philippines 35.0 Poland 7.9 Korea, South 1.1 Romania 6.2 Russian 3.9 South Africa 0.1 Spain 0.3 Sweden 0.1 Thailand 0.3 Turkey 3.6 Tuvalu 0.4 Ukraine 6.2 United Kingdom 1.6 Venezuela 0.1 Yugoslavia 0.1 Total 100.0
Mexico Mexico 100.0 Germany 1.2 Morocco 97.6 Ukraine 1.2
Morocco
Total 100.0 Myanmar 99.4 Philippines 0.3 Yugoslavia 0.3 Total 100.0 Belgium 0.4 Benin 0.0 Brazil 0.0 Burkina Faso 0.0 Cape Verde 2.0 Chile 0.1 Croatia 0.4 Denmark 0.2 Estonia 0.9 Germany 0.5 Ghana 0.1 Indonesia 18.1 Ireland 0.0 Latvia 0.2 Liberia 0.0 Lithuania 0.4 Malaysia 0.1 Netherlands 38.2 Norway 0.1 Philippines 20.3 Poland 3.8 Portugal 1.7 Romania 0.5 Russian 6.0 Slovenia 0.0
Myanmar Netherlands
Spain 1.2

64
Sweden 0.0 Ukraine 4.1 United Kingdom 0.1 Total 100.0 Belarus 0.2 Bulgaria 8.5 Canada 0.7 Cape Verde 0.7 Croatia 0.7 Estonia 1.2 Germany 0.7 India 0.2 Indonesia 0.2 Ireland 0.2 Latvia 5.8 Lithuania 2.9 Netherlands 2.2 Norway 0.5 Philippines 19.7 Poland 5.1 Portugal 0.2 Romania 1.7 Russian 20.2 Sweden 0.2 Ukraine 27.5 Yugoslavia 0.2
Netherlands Antilles
Total 100.0 Bangladesh 0.5 India 1.5 Latvia 2.0 Norway 79.9 Philippines 14.6 Spain 0.5 Sweden 0.5 United Kingdom 0.5
Norway
Total 100.0 Pakistan Pakistan 100.0
Argentina 0.0 Azerbaijan 0.0 Bangladesh 1.1 Belarus 0.0 Belgium 0.0 Bosnia and Herzegovina 0.0 Bulgaria 1.0 Chile 0.3 China 11.3 Colombia 0.1 Costa Rica 0.0 Croatia 1.2 Cuba 0.1 Korea, North 0.2
Panama
Denmark 0.0

65
Ecuador 0.0 Egypt 0.4 Estonia 0.0 Finland 0.0 France 0.1 Gambia 0.0 Georgia 0.1 Germany 0.0 Ghana 0.1 Gibraltar 0.0 Greece 0.6 Grenada 0.0 Guatemala 0.0 Honduras 0.3 Hungary 0.0 India 9.8 Indonesia 3.7 Ireland 0.0 Italy 0.8 Jamaica 0.0 Japan 1.2 Jordan 0.0 Kazakhstan 0.0 Latvia 0.7 Lebanon 0.0 Lithuania 0.0 Madagascar 0.1 Malaysia 0.1 Mexico 0.0 Myanmar 2.8 Netherlands 0.2 Nicaragua 0.1 Norway 0.0 Pakistan 0.1 Panama 0.2 Peru 0.4 Philippines 39.2 Poland 0.8 Korea, South 9.3 Moldova Rep 0.0 Romania 0.6 Russian 1.1 Samoa 0.0 Singapore 0.0 Slovenia 0.0 Spain 0.5 Sri Lanka 0.2 Sudan 0.0 Sweden 0.0 Syrian 0.0 Taiwan 4.3 Thailand 0.3

66
Tunisia 0.0 Turkey 0.4 Ukraine 3.5 United Kingdom 0.3 United States 0.0 Venezuela 0.0 Viet Nam 0.9 Yugoslavia 0.9 Total 100.0 System Bangladesh 0.2 China 3.8 Greece 0.2 Lithuania 0.2 Philippines 95.0 Korea, South 0.4 United Kingdom 0.2
Philippines
Total 100.0 Philippines 78.6 Poland 21.4
Poland
Total 100.0 Benin 1.9 Bulgaria 1.9 Chile 4.8 Italy 5.7 Lithuania 1.0 Peru 4.8 Philippines 24.8 Poland 1.0 Portugal 30.5 Romania 2.9 Spain 5.7 Togo 1.9 Ukraine 13.3
Portugal
Total 100.0 Egypt 15.6 India 11.1 Iraq 4.4 Pakistan 7.8 Philippines 60.0 Saudi Arabia 1.1
Qatar
Total 100.0 China 7.2 India 0.5 Indonesia 3.4 Myanmar 12.5 Philippines 7.2 Korea, South 68.7 United Kingdom 0.5
Korea, South
Total 100.0 France 23.1 Reunion Malaysia 73.1

67
Romania 3.8 Total 100.0 Romania 98.1 Russian 1.3 Ukraine 0.6
Romania
Total 100.0 Azerbaijan 0.0 Belarus 0.1 Georgia 0.0 Italy 0.0 Kazakhstan 0.1 Russian 97.3 Ukraine 1.8 United Kingdom 0.5
Russian
Total 100.0 Azerbaijan 0.3 Belarus 0.1 British Virgin Islands 0.1 Bulgaria 10.1 Cape Verde 0.4 China 7.5 Colombia 0.2 Croatia 3.0 Ecuador 0.6 Egypt 3.5 Estonia 0.2 Georgia 1.1 Germany 0.2 Ghana 0.1 Greece 3.0 Iceland 0.1 India 2.7 Indonesia 0.6 Latvia 1.9 Lebanon 0.2 Lithuania 0.7 Malaysia 0.1 Maldives 1.8 Morocco 0.1 Nicaragua 0.1 Pakistan 2.1 Philippines 14.2 Poland 1.2 Portugal 0.2 Romania 2.2 Russian 8.5 Slovenia 0.7 South Africa 0.1 Syrian 3.3 Turkey 6.7 Ukraine 22.0
Saint Vincent
United Kingdom 0.2

68
United States 0.1 Total 100.0 India 10.5 Russian 5.3 Ukraine 84.2
Sao Tome and Principe
Total 100.0 Bangladesh 3.3 Croatia 0.7 Egypt 6.6 India 29.8 Iraq 2.6 Latvia 4.6 Pakistan 3.3 Philippines 44.4 Russian 2.0 Ukraine 0.7 United Kingdom 2.0
Saudi Arabia
Total 100.0 Seychelles Russian 100.0
Bangladesh 0.7 Chile 0.1 China 9.5 Croatia 4.9 Estonia 0.4 Germany 0.2 Ghana 0.5 India 15.7 Indonesia 11.1 Japan 0.1 Latvia 1.3 Lithuania 0.1 Malaysia 1.6 Mexico 0.1 Myanmar 6.0 Netherlands 0.1 Pakistan 0.2 Philippines 33.1 Poland 1.2 Korea, South 0.1 Romania 0.1 Russian 3.5 Singapore 3.0 Sri Lanka 0.8 Taiwan 1.8 Thailand 3.2 Ukraine 0.6 Yugoslavia 0.1
Singapore
Total 100.0 Turkey 94.7 Ukraine 5.3
Slovakia
Total 100.0 Spain Spain 100.0

69
Sri Lanka Sri Lanka 100.0 Austria 0.2 China 0.2 Denmark 0.2 Finland 0.9 Germany 0.2 Kenya 0.2 Norway 0.2 Philippines 29.7 Poland 8.7 Singapore 0.2 Spain 0.9 Sweden 57.6 United Kingdom 0.5
Sweden
Total 100.0 Bulgaria 3.4 Cape Verde 3.4 Croatia 65.5 Lithuania 6.9 Poland 6.9 Romania 6.9 Sweden 6.9
Switzerland
Total 100.0 Egypt 7.0 Jordan 0.2 Lebanon 1.2 Palestinian Territory 2.1 Romania 3.2 Syrian 84.6 Ukraine 1.7
Syrian
Total 100.0 China 0.1 India 9.5 Myanmar 0.6 Philippines 4.1 Thailand 85.6
Thailand
Total 100.0 Egypt 15.2 Greece 0.7 Italy 0.7 Latvia 0.7 Lithuania 3.4 Norway 0.7 Pakistan 6.9 Philippines 1.4 Romania 2.8 Russian 8.3 Somalia 1.4 Sudan 2.1 Syrian 34.5 Ukraine 21.4
Tonga
Total 100.0

70
Romania 0.0 Turkey 100.0
Turkey
Total 100.0 Germany 16.7 Latvia 25.0 Poland 8.3 Russian 16.7 Tuvalu 25.0 Ukraine 8.3
Tuvalu
Total 100.0 Cambodia 0.1 Georgia 0.4 Moldova Rep 0.2 Russian 1.9 Ukraine 97.4
Ukraine
Total 100.0 Egypt 21.7 India 41.7 Pakistan 6.7 Philippines 28.3 Syrian 1.7
United Arab Emirates
Total 100.0 Australia 0.1 Bangladesh 0.1 Belarus 0.1 Belgium 0.1 Bulgaria 7.8 Canada 0.1 Cape Verde 1.4 Croatia 0.4 Denmark 0.1 Estonia 0.5 Germany 1.2 Ghana 0.2 Guyana 0.5 Hungary 0.1 India 2.9 Ireland 1.0 Latvia 2.4 Lithuania 0.3 Namibia 0.1 Netherlands 0.1 New Zealand 0.9 Nigeria 0.1 Norway 0.7 Pakistan 0.2 Philippines 31.9 Poland 4.9 Romania 3.8 Russian 2.1 South Africa 2.8
United Kingdom
Sri Lanka 0.1

71
Sweden 0.9 Taiwan 1.3 Thailand 1.3 Turkey 1.8 Ukraine 2.6 United Kingdom 25.1 Total 100.0 Australia 0.2 Honduras 1.2 India 3.6 Morocco 0.2 Netherlands 0.2 Philippines 5.8 Trinidad and Tobago 0.2 United States 88.6
United States
Total 100.0 Croatia 0.8 Japan 1.5 Malaysia 8.4 Philippines 61.8 Poland 18.3 Korea, South 6.9 Yugoslavia 2.3
Vanuatu
Total 100.0 India 90.9 Italy 9.1
Venezuela
Total 100.0 Viet Nam Viet Nam 100.0
Belgium 0.1 Croatia 0.4 Denmark 45.3 Egypt 0.1 Faeroe Islands 0.1 Germany 0.4 India 0.8 Latvia 2.7 Lithuania 1.6 Netherlands 0.6 Norway 0.8 Philippines 25.6 Poland 11.1 Russian 0.2 Spain 0.2 Sweden 0.1 Thailand 9.4 Ukraine 0.3 United Kingdom 0.3
Denmark (DIS)
Total 100.0 Australia 0.6 Bulgaria 4.5 Canada 0.3
French Southern (Antarctic) Territory
Croatia 3.1

72
France 40.4 Philippines 24.3 Romania 23.7 Senegal 2.3 United Kingdom 0.8 Total 100.0 Chile 0.9 Colombia 1.8 Cuba 1.8 Germany 18.4 Guatemala 0.9 Honduras 4.4 Peru 4.4 Philippines 43.0 Russian 1.8 Spain 13.2 Ukraine 7.0 United Kingdom 2.6
Madeira (Portugal)
Total 100.0 Australia 0.1 Bangladesh 0.1 Brazil 0.0 Canada 0.0 China 0.8 Croatia 1.3 Denmark 0.1 Estonia 0.1 Ethiopia 0.0 Finland 0.1 France 0.0 Germany 0.0 Greece 0.1 Guinea 0.5 India 18.2 Indonesia 1.5 Latvia 3.6 Lithuania 0.9 Malaysia 0.1 Myanmar 0.0 Norway 10.4 Philippines 52.3 Poland 5.2 Portugal 0.2 Romania 0.1 Russian 1.8 Singapore 0.2 Slovakia 0.0 Spain 0.4 Sweden 0.8 Switzerland 0.0 Ukraine 0.4
Norway (NIS)
United Kingdom 0.6

73
Total 100.0 Denmark 1.4 Spain 98.6
Spain (Csr)
Total 100.0