the global illicit trade environment index
TRANSCRIPT

EUROPE
Commissioned by
The Global Illicit Trade Environment Index A report by The Economist Intelligence Unit

1 © The Economist Intelligence Unit Limited 2018
The Global Illicit Trade Environment Index Europe
Contents
Contents 1
Acknowledgements 2
Introduction 4
Overall results 6
Category 1: Government policy 8
Category 2: Supply and demand 11
Category 3: Transparency and trade 14
Category 4: Customs environment 17
Conclusion 20
Index methodology 22
Sponsors 26

2© The Economist Intelligence Unit Limited 2018
The Global Illicit Trade Environment Index Europe
Acknowledgements
• Carolin Garden, anti-money laundering policy expert, European Banking Authority
• Claire Georges, press officer, Europol
• Suzanne Hoff, international co-ordinator, La Strada International
• Tom Keatinge, director, Centre for Financial Crime and Security Studies, Royal United Services Institute for Defence and Security Studies
• Peggy Chaudhry, associate professor of international business, Villanova University
The Economist Intelligence Unit takes sole responsibility for the construction of the index and the findings of this report.
The Global Illicit Trade Environment Index is based on a similar index that was devised and constructed in 2016 by Chris Clague. The 2018 update and expansion was conducted by Trisha Suresh, Michael Frank, with assistance from Chris Clague. Harald Langer, Chris Clague and Renee Friedman wrote this report, focusing on the Europe results, and Scott Aloysius provided research support. It was edited by Amanda Simms.
During research for the construction of the index and in writing this report, The Economist Intelligence Unit interviewed executives and experts from across the world. Their time and insights are greatly appreciated. They are listed below in alphabetic order by affiliation.

3 © The Economist Intelligence Unit Limited 2018
The Global Illicit Trade Environment Index Europe
The Global Illicit Trade Environment Index is a measure of the extent to which economies enable (or inhibit) illicit trade through their policies and initiatives to combat illicit trade. The index is built around four main categories, each of which comprise a number of indicators. The four categories are government policy, supply and demand, transparency and trade, and the customs environment. This report is focused on how economies in the European region score on the index, and delves into which regional economies are taking the most action, and which ones are doing little to address this issue.

4© The Economist Intelligence Unit Limited 2018
The Global Illicit Trade Environment Index Europe
Introduction
targets for cyber-extortion.5 It also highlights how the globalisation of sports events has led to an increase in unregulated sports betting, which can be linked to money laundering. Europol describes, in its Serious and Organised Crime Threat Assessment (SOCTA) report of 2017, how document fraud, money laundering and e-commerce in illicit goods and services have become new engines for organised crime. “These cross-cutting criminal threats enable and facilitate most, if not all, other types of serious and organised crime,” the report notes.6
These illicit trade flows are bad for governments, which are losing tax revenue, as well as for businesses, which are losing income due to the trade in counterfeits and pirated goods. They are also harmful to consumers who are being exposed to poorly made and unregulated products and whose health is jeopardised by counterfeit pharmaceuticals and adulterated alcohol. In addition, illicit trade amplifies the threat to already-marginalised populations, like the Roma in Europe, by turning them into targets for human traffickers. And, among other ill-effects, it has a broad impact on global biodiversity, as it threatens wildlife, pushing many species closer to extinction to satisfy the growing demand for their use in traditional
Most Europeans will have been exposed to some form of illicit trade, whether it’s street vendors selling counterfeit goods, pirated software or entertainment media, or even the offer of an exotic, and often endangered, animal. Another type of illicit trade, human trafficking, has been reported by major national media outlets, such as the BBC, Der Spiegel and El País. These outlets have published numerous stories about the victims of sex trafficking, such as the brutal kidnapping and smuggling of girls and women from rural Albania1 and the smuggling of Nigerian women to Italy.2 They have also written about the trafficking of migrant workers from Colombia to Spain, where they are kept like slaves on the economy’s pig farms.3 Highlighting this issue further, the European Commission released a report detailing the multiple dimensions and facets of human trafficking.4
International organisations, including the European Union Agency for Law Enforcement Co-operation (Europol) and the OECD, have noted in their research that the dark side of globalisation and technological development is that it provides criminal organisations with new methods to expand their reach across borders. In its 2016 report on illicit trade, the OECD cites the use of social media by criminal networks to identify
1 BBC News (2017). Human trafficking: Poor women and girls targeted in Albania. http://www.bbc.com/news/world-europe-390477872 https://www.theguardian.com/global-development/2017/jan/12/nigerian-women-trafficked-to-italy-for-sex-doubled-20163 El Pais (2018). Spanish police rescue Colombians kept in slave-like conditions on pig farm. https://elpais.com/elpais/2018/04/25/inenglish/1524644819_177572.html
Der Spiegel. Menschenhandel. http://www.spiegel.de/thema/menschenhandel/4 European Parliament (2017). Human trafficking: nearly 16,000 victims in the EU http://www.europarl.europa.eu/news/en/headlines/society/20171012STO85932/human-trafficking-
nearly-16-000-victims-in-the-eu 5 OECD (2016). Illicit Trade: Converging Criminal Networks. OECD Reviews of Risk Management Policies. OECD Publishing, Paris. http://dx.doi.org/10.1787/9789264251847-en.6 Europol (2017). Crime in the age of technology – Europol’s Serious and Organised Crime Threat Assessment 2017. https://www.europol.europa.eu/newsroom/news/crime-in-age-of-
technology-%E2%80%93-europol%E2%80%99s-serious-and-organised-crime-threat-assessment-2017

5 © The Economist Intelligence Unit Limited 2018
The Global Illicit Trade Environment Index Europe
medicines, for keeping as pets or even to be obtained as part of a collection.
To measure how nations are addressing the issue of illicit trade, the Transnational Alliance to Combat Illicit Trade has commissioned The Economist Intelligence Unit to produce the Global Illicit Trade Environment Index. The global index expands upon an Asia-specific version, originally created by The Economist Intelligence Unit in 2016 to score 17 economies in Asia on the extent to which they enabled or prevented illicit trade. The Asian index generated much-needed attention on the issue of illicit trade within the region. Building upon the success of the Asia index, the global index now includes 84 economies, providing a global perspective and new insights on the social and economic impacts of illicit trade.
6© The Economist Intelligence Unit Limited 2018
The Global Illicit Trade Environment Index Europe
Overall results
with a score of 85.6. It owes its performance to ranking in the top ten in two of the four index categories: government policy, where it ranks 1st, and supply and demand, where it ranks 5th. Although Finland does not make it into the top ten in the customs environment category—it comes 16th—its score is only six points lower than the top performer, South Korea.
The differential between countries like Finland, and other economies in the EU’s old core, and the economies on its periphery, exposes a clear fault line in Europe when it comes to preventing illicit trade. Economies that are more exposed to Europe’s geographical periphery are more likely to receive lower total scores. Take, for example, Italy, one of the lowest ranking EU-15 economies. It ranks 37th in the global index. Its southern borders are heavily exposed to Libya, the lowest ranking economy in the index with a score of only 8.6 points. None of the Balkan economies, and none of any of the former Soviet economies, make it into the top half of the index, with the exception of Slovenia. Belarus, Bosnia and Ukraine are ranked at the bottom of the European region with global ranks of 73rd, 74th and 76th respectively. These are all poorer economies with incomes lower than the EU average, a factor likely to influence their citizens’ willingness to accept illicit goods.
It is important to note that the Global Illicit Trade Environment Index does not score an economy’s performance or effectiveness in combating illicit trade. Rather, the index evaluates 84 economies on their structural capability to protect against illicit trade. It is focused on the laws, regulations, systems and effectiveness of governance that contribute to the political and regulatory environment that indicates an economy’s potential to combat illicit trade of different kinds.
The index covers 34 European economies—the 28 members of the EU and six non-members: Bosnia and Herzegovina, Montenegro, and Serbia in the Balkans, and the former Soviet states of Belarus, Russia and Ukraine. As a region, Europe’s average score is significantly higher than the three others covered in the report—the Americas, Asia-Pacific, and the Middle East and Africa. Europe’s score as a whole, however, is largely influenced by the EU-15, the founding members of the EU before its enlargement in 2004. The average score of these economies is 15 points higher (76.4 out of 100 versus an average score of 60.8) than for the newer EU member and non-member economies covered in the index.
Finland is not only the top ranked European economy, but it also tops the overall index,

7 © The Economist Intelligence Unit Limited 2018
The Global Illicit Trade Environment Index Europe
in its own territory, creating an opportunistic environment for arms smuggling and other types of illicit trade.
Ukraine, for its part, occupies a unique position in Europe in that it is the only economy in the region currently involved in an armed conflict
1 85.6 Finland
2 85.1 United Kingdom
3 80.9 Sweden
4 80.5 Austria
5 80.0 Netherlands
6 79.3 Denmark
7 78.9 Germany
8 78.6 Belgium
9 78.3 Luxembourg
10 76.5 Ireland
11 74.1 Spain
12 73.8 France
13 73.1 Malta
14 71.6 Slovenia
15 71.4 Czech Republic
16 71.1 Estonia
17 70.8 Lithuania
18 69.9 Latvia
19 69.6 Slovakia
20 68.5 Hungary
21 68.4 Portugal
22 68.3 Poland
23 66.9 Cyprus
24 65.8 Croatia
25 64.4 Italy
26 61.7 Greece
27 60.8 Romania
28 57.7 Bulgaria
29 52.2 Serbia
30 49.1 Russia
31 49.0 Montenegro
32 41.5 Belarus
33 40.9 Bosnia
34 37.8 Ukraine
100 - 67 66 - 34 33 - 0
Country scores highest to lowestOverall results: Europe

8© The Economist Intelligence Unit Limited 2018
The Global Illicit Trade Environment Index Europe
Category 1: Government policy
interagency co-operation ensured their overall poor performance in this category.
In recent years, the EU has introduced a series of regulations to assist authorities in tackling illicit trade and related financial flows, most recently through new rules that require economies to share anti-money laundering data with tax authorities. Pierre Moscovici, commissioner for economic and financial affairs, taxation and customs, said in January 2018: “We want to give tax authorities crucial information on the individuals behind any company or trust. This is essential for them to be able to identify and clamp down on tax evaders. To do this, tax authorities will now have access to anti-money laundering information.” 7 These measures are critical to fight organised crime, as Europol pointed out in its most recent SOCTA report: “Document fraud, money laundering and the online trade in illicit goods and services are the engines of organised crime. These cross-cutting criminal threats enable and facilitate most, if not all, other types of serious and organised crime. Disrupting document fraud, money laundering schemes and the online trade in illicit goods and services will significantly reduce the ability of organised crime groups (OCGs) to grow their businesses and expand into new markets.”8
The EU provides a strong legal framework for
This index category, which comprises 35% of the overall index score, measures the availability of policy and legal approaches to monitoring and preventing illicit trade. It measures the extent to which an economy has entered into 14 conventions related to illicit trade; its compliance with Financial Action Task Force (FATF) money laundering provisions; its stance on intellectual property (IP) protection its approach towards corruption law enforcement techniques in an economy; the extent of interagency collaboration; and its level of cyber-security preparedness.
Twenty-four European economies—all EU members—rank in the top half of the category globally, with Europe taking up seven of the top ten spots. Finland, as already mentioned, ranks first globally, followed closely by the UK; in 6th through 10th place, in order, come Sweden, the Netherlands, Germany, Belgium and Austria. The non-EU members within the European region rank in the bottom half of the government policy category, with Belarus (65th), Russia (76th) and Ukraine (77th) being the worst performers. These economies were pulled down by their poor showing in particular category measures. For Belarus, it was its absence of interagency co-operation, while for Russia and Ukraine their inability to deal with high corruption levels as well as a lack of
7 EU Commission (2018). Entry into force of new rules to prevent tax evasion and money laundering. https://ec.europa.eu/taxation_customs/node/1033_en8 Europol (2017). Crime in the age of technology – Europol’s Serious and Organised Crime Threat Assessment 2017. https://www.europol.europa.eu/newsroom/news/crime-in-age-of-
technology-%E2%80%93-europol%E2%80%99s-serious-and-organised-crime-threat-assessment-2017

9 © The Economist Intelligence Unit Limited 2018
The Global Illicit Trade Environment Index Europe
recommendations. The regulation also stretches beyond the EU’s border: EU majority-owned subsidiaries located in other economies where the minimum AML requirements are less strict
anti-money laundering (AML) regulations. The most recent, the fourth AML regulation (known as ALMD4) came into effect in June 2017 and provides for the implementation of the FATF’s
FinlandUnited Kingdom
SwedenNetherlands
GermanyBelgiumAustriaFrance
DenmarkMalta
SloveniaIreland
LuxembourgSpain
CyprusCroatia
HungaryLithuania
EstoniaLatvia
Europe averagePoland
Czech RepublicItaly
SlovakiaPortugal
GreeceRomaniaBulgaria
World averageMontenegro
SerbiaBosnia
BelarusRussia
Ukraine
96.3
95.7
88.1
87.0
86.3
85.2
84.9
81.4
80.2
79.4
78.8
78.8
78.2
76.9
74.2
73.4
73.1
72.5
72.2
72.1
72.0
71.8
71.1
70.4
69.2
63.7
62.8
62.6
62.5
62.0
59.3
53.6
52.3
47.7
37.9
35.3
Government policy: Europe results

10© The Economist Intelligence Unit Limited 2018
The Global Illicit Trade Environment Index Europe
and Ukraine rank lowest among the European nations in the government policy category (76th and 77th respectively).
Recently, however, it is Romania (46th on government policy) that has garnered the most attention in the European region for its weakening stance against corruption. In 2017 the Romanian government tried to pass an ordinance that would have lifted criminal sanctions on corruption charges below €48,000.9 The Group of States Against Corruption, the Council of Europe’s anti-corruption body, voiced a stark warning following Romania’s measures to essentially decriminalise corruption.10 That came after a joint statement from the embassies of Belgium, Denmark, Finland, France, Germany, the Netherlands and Sweden urging the Romanian government not to weaken the justice system through the proposed overhaul.11 The Romanian government withdrew the draft law only after hundreds of thousands of its citizens protested on the streets. That fact that it took such an extreme response from its fellow EU members and its own citizens for the government to rescind the law demonstrates the government’s apathy towards enforcing anti-corruption legislation.
than those of the member state must implement the requirements of the member state at those subsidiaries. In April 2018 the European Parliament adopted the 5th Anti-Money Laundering Directive. It is expected that these new rules will increase transparency and reduce the incidence of money laundering and terrorist financing across the EU. As Carolin Garden, anti-money laundering policy expert at the European Banking Authority, says, “We work closely with the European Security Markets Authority (ESMA) and the European Insurance and Occupational Pensions Authority (EIOPA)—to have a consistent and effective approach to AML/CFT [anti-money laundering and countering the financing of terrorism] across the union’s financial services industry and a common supervisory culture. This is important to prevent regulatory arbitrage and to protect the integrity of the EU’s financial system: financial crime respects no borders.”
On the measure of corruption—a strong enabling factor for illicit trade—most European economies do better than the rest of the economies in the global index. However, there is significant deviation within Europe from the regional average. Although the average corruption score for Europe is 55.0, the top ranked European economies (Finland, Luxembourg, Sweden and the UK) are 45 points above the average. Of the wealthier (on a GDP basis) EU economies, Italy ranks particularly low, in 47th place due to its poor showing on dealing with corruption. Italy’s low ranking is at the same level as six of its neighbours—Bosnia, Bulgaria, Greece, Montenegro, Romania and Serbia. Only Russia
9 Financial Times (2017). Romania scraps corruption immunity for politicians. https://www.ft.com/content/11de47e4-ebc9-11e6-930f-061b01e2365510 Euronews (2018). Europe’s corruption watchdog ‘deeply concerned’ over Romania reforms. http://www.euronews.com/2018/04/11/europe-s-corruption-watchdog-deeply-
concerned-over-romania-reforms11 Reuters (2017). EU embassies urge Romania to rethink judicial overhaul. https://www.reuters.com/article/us-romania-judiciary/eu-embassies-urge-romania-to-rethink-judicial-
overhaul-idUSKBN1EF2CR

11 © The Economist Intelligence Unit Limited 2018
The Global Illicit Trade Environment Index Europe
Category 2: Supply and demand
only 25.0 on the indicator, placing it near the bottom of the rankings.
A different picture emerges when looking at the other two indicators that make up this category: the quality of state institutions and perceptions of costs imposed by organised crime on business. Those European economies that have the most effective state institutions are also those that provide the least hospitable environment for the trade in illicit goods, as suggested by their performance in the overall index. This is true not only for the Nordic economies, but also the UK, Luxembourg, Austria, and the Netherlands.
Finland makes it to the top of the European table and to 5th globally in the supply and demand category, with Denmark running a close second. As a result of its strong performance in these indicators, it leads its European peers on half of the index pillars. However, Finland falls down due to its tax and social security burdens and labour market regulations.
Again, we see those economies at the EU’s geographic periphery performing poorly. Italy (ranked 78th, with a score of 23.8) and Greece (ranked 68th, with a score of 36.0), rank in the bottom half on all four supply and demand indicators, with the exception of Greece ranking 34th on the perceptions of organised crime
This category measures the domestic environment that encourages or discourages the supply of and demand for illicit goods, including the level of corporate taxation and social security burdens, the quality of state institutions, labour market regulations, and perceptions of the extent to which organised crime imposes costs on business.
Europe is the top performing region when compared with the average scores of the three other regions in the supply and demand category. However, its margin vis-à-vis the rest of the world in the category is much slimmer than in the others. Europe’s average score is 55.1, about one point above Asia-Pacific’s. This is also the category in which Europe performs most poorly, with just five European economies ranking in the top ten globally.
Europe, as a region, has higher overall tax rates and social security burdens, and more restrictive labour market practices than the other regions in the index. Because EU and non-EU states alike control their own fiscal policies, there is a wide variety in the rankings for the corporate tax and personal tax and social security burdens indicators. Denmark, for example, receives the full marks (100 points) on taxes and labour markets, whereas Sweden, despite having a similar level of GDP per head, receives a score of

12© The Economist Intelligence Unit Limited 2018
The Global Illicit Trade Environment Index Europe
FinlandDenmark
United KingdomLuxembourg
AustriaMalta
SwedenNetherlands
SlovakiaIreland
BelgiumGermany
Czech RepublicEstonia
SpainPortugal
LatviaLithuania
Europe averagePolandCyprus
HungarySlovenia
RussiaWorld average
FranceRomaniaBulgaria
CroatiaSerbia
MontenegroBelarusGreeceBosnia
ItalyUkraine
81.3
79.9
79.6
74.8
72.5
71.8
69.1
67.7
64.4
64.4
63.0
60.9
59.8
59.6
58.2
57.9
56.4
55.2
55.0
54.6
54.5
52.9
52.3
51.7
50.0
48.0
46.2
44.8
43.9
41.4
41.0
36.6
36.0
27.9
23.8
22.2
Supply and demand: Europe results
tax collection rates, it may surprise some to find Italy, the fourth largest economy in Europe, ranked alongside Ukraine (which comes in at 79th place with a score of 22.2), a conflict-ridden
indicator. While both economies have had difficulties in reforming their labour market policies and removing rigidities that encourage an informal labour market and subsequent low

13 © The Economist Intelligence Unit Limited 2018
The Global Illicit Trade Environment Index Europe
12 http://www.oecd.org/eco/growth/ITA-GFG-2018-media.pdf13 EUIPO. IP Perception. https://euipo.europa.eu/ohimportal/en/web/observatory/ip_perception
listened to a representative from a luxury brand give a presentation showing all the linkages between counterfeits [of his brand’s] goods and ISIS,” Ms Chaudhry says, “I asked him if [his firm] was going to developing a messaging strategy around that and he became very uncomfortable.”
transition economy with a GDP per head just a twelfth the size of Italy’s. This is probably due to the high levels of labour informality existing within Italy.12
On the demand side, the problem in Europe, as elsewhere, is consumer attitudes towards illicit goods and especially counterfeits. According to a study conducted by the EU’s Intellectual Property Office (EUIPO), 96% of Europeans agree that protecting IP rights is an important factor in incentivising creativity and innovation. Yet an average of 34% think that buying counterfeit goods to save money is justifiable and 42% think it’s acceptable when the counterfeits are purchased for personal use.13 The inability of European governments to improve the effectiveness of state institutions to combat illicit trade in economies such as Bosnia and Ukraine (each receiving the lowest score in this part of the index) or the other poor performers in Europe’s geographical periphery, Croatia, Greece, Italy, and Romania, makes it questionable whether it would even be worthwhile to try to educate the public on the threats illicit trading activities may pose to their own personal safety. However, given the growing incidence of terror attacks across Europe over the past decade, one approach that could gain traction with consumers, and reduce demand, is explaining how counterfeits and other forms of illicit trade fund international terrorist organisations. But so far, it hasn’t really been tried, according to Peggy Chaudhry, a professor at Villanova University School of Business and expert on anti-counterfeiting strategies. “After I

14© The Economist Intelligence Unit Limited 2018
The Global Illicit Trade Environment Index Europe
Category 3: Transparency and trade
trade in FTZs and customs warehouses. Of all 34 European economies in the index, only Belarus and Ukraine have accepted this additional chapter of the Revised Kyoto Convention. While this boosts Ukraine’s ranking to 13th in the category, Belarus still ranks only 65th because of its poor performance on two of three international reporting indicators (human trafficking and IP) in the category.
To better combat illicit trade, European governments must employ a number of measures: increasing transparency in FTZs; systematically tracking and tracing shipments; and sharing illicit trade data internationally, such as information on the seizures of trafficked humans, counterfeit goods and narcotics. If, for example, the government of the Netherlands, which ranks 23rd on transparency and trade, produced regular reports on national drug seizures, it could move up to 5th position (and 6th in the overall ranking). Unfortunately, current organisational structures and reporting processes among the different police units—the Dutch police force is divided into ten regional units, which have differing measures of responsibility for fighting drug dealing and trafficking—prevent implementation of and stand in the way of better international reporting standards. Croatia, on the other hand, receives full points on the international
This category measures an economy’s transparency as regards illicit trade and the degree to which it exercises governance over its free-trade zones (FTZs) and transhipments. Indicators include: quality of consignment tracking and tracing services; the adoption of Annex D of the Revised Kyoto Convention, which seeks to ensure standardised customs procedures in customs warehouses and free zones; the extent of monitoring and oversight at FTZs; and the extent to which governments report their efforts and share information to fight illicit trade.
None of the 34 European economies rank in the bottom, however, and it still scores better (60.0) on average the Americas (44.1), Asia-Pacific (52.6) and the Middle East and Africa (44.4). Unlike in the other three categories, not a single European economy makes it into the top five best performing countries on transparency and trade.
In 6th place, Sweden is Europe’s top performer on transparency and trade. It does, however, score ten points behind the US, which ranks first overall in the category. This can be attributable to Europe’s main weakness in this category: the non-adoption of Annex D of the Revised Kyoto Convention, a set of guidelines established by the World Customs Organisation to combat illicit

15 © The Economist Intelligence Unit Limited 2018
The Global Illicit Trade Environment Index Europe
As the two most advanced economies in the EU accession process,14 Montenegro and Serbia will surely be looking for help from the EU to improve their performance on the transparency and trade
reporting indicator for regularly publishing data on seizures of IP-infringing goods, as well as providing data on drug seizures compiled by Office for Combating Drug Abuse.
14 Reuters (2018). Serbia on course for EU by 2025, top EU official says. https://www.reuters.com/article/us-eu-balkans/serbia-on-course-for-eu-by-2025-top-eu-official-says-idUSKBN1F80V8
SwedenAustria
GermanyBelgium
United KingdomLuxembourg
UkraineFinland
FranceIreland
ItalyCzech Republic
SpainNetherlands
DenmarkLithuania
PortugalGreece
EstoniaEurope Average
LatviaHungary
CroatiaSlovenia
PolandSlovakia
MaltaWorld average
RomaniaCyprusBosnia
BelarusRussia
BulgariaMontenegro
Serbia
75.0
74.7
73.5
72.9
71.7
71.6
71.1
70.5
70.2
69.7
68.0
67.8
67.6
67.2
66.4
65.7
65.2
64.5
60.0
60.0
59.7
59.4
58.8
57.7
55.2
53.2
53.2
53.0
50.8
47.9
40.6
39.1
38.9
37.8
35.7
33.0
Transparency and trade: Europe results

16© The Economist Intelligence Unit Limited 2018
The Global Illicit Trade Environment Index Europe
indicators. They are both at the bottom of the table in 69th and 72nd place, respectively. For both economies, it is their worst ranking across all the index categories. They owe this to their failure, to date, to adopt Annex D of the Revised Kyoto Convention (like all EU economies) and their poor performance on all other indicators in the category.

17 © The Economist Intelligence Unit Limited 2018
The Global Illicit Trade Environment Index Europe
Category 4: Customs environment
also voted, in 2017, to have the best port infrastructure for the fifth time running by the World Economic Forum. At the bottom of the European table, we find the same three economies as in the overall index, indicating the relative importance of a strong customs environment: Belarus ranks 73rd (38.6), Bosnia 76th (35.7) and Ukraine 80th (27.4). This is Ukraine’s weakest category in the index in terms of rankings, and its performance groups it with economies like Trinidad and Tobago and Venezuela, and below even Myanmar and Pakistan, two other states suffering from internal conflict.
A key to Europe’s overall performance in this category is the EU Customs Union. As members, all EU economies run an AEO programme and a customs recordal system, two of the five indicators in this category of the index.
European economies also rank highly on another key indicator: customs automation, which is a measure of electronic data exchanges, automated border procedures and the use of risk management to reduce opportunities for trade in illicit goods. The European Commission has recognised the importance of automation in aiding customs authorities, stating that, despite limited available resources, a full integration of IT systems remains a priority
This category measures how effectively an economy’s customs service manages its dual mandate to facilitate licit trade while also preventing illicit trade. It consists of five indicators: percentage of shipments physically inspected; the time taken for customs clearance and inspection, the extent of automation of border procedures, the presence of Authorised Economic Operator (AEO) programmes and the presence of customs recordal systems.
Taking into account the continent’s geography, the magnitude of the task placed on European customs authorities becomes clear. The EU has over 65,000 km of coastline, which is more than 1.5 times the earth’s circumference. It has land borders of almost 13,500 km. Despite these geographical challenges, Europe, as a region, still accounts for 21 of the top 30 economies in the customs environment category and represents 88% of those in the top tier. As a region, it scores approximately ten points above the global average, and 15 and 16 points, respectively, above the Americas and the Asia-Pacific regions.
The Netherlands, home to two of the world’s largest ports, Amsterdam and Rotterdam, receives top scores on all customs environment indicators, with the exception of physical inspections (where it ranks 71st). It was

18© The Economist Intelligence Unit Limited 2018
The Global Illicit Trade Environment Index Europe
15 EU Commission (2016). The priorities: EU Strategy and Action Plan for customs risk management. https://ec.europa.eu/taxation_customs/general-information-customs/customs-risk-management/priorities-eu-strategy-action-plan-customs-risk-management_en
facilitation and monitoring, is indeed one of the benefits of increased automation. There are others. One is that it can smooth the customs process, improving clearance and inspection
of the EU’s Strategy and Action Plan for customs risk management.15 Improved risk management, which can help customs agencies better manage their dual mandate of trade
NetherlandsIreland
SpainSlovenia
DenmarkEstonia
GermanySlovakia
LuxembourgFrance
BelgiumFinland
LatviaPortugal
ItalyUnited Kingdom
AustriaSweden
LithuaniaPoland
Czech RepublicHungary
CyprusMalta
Europe averageGreeceCroatia
RomaniaBulgaria
SerbiaRussia
World averageMontenegro
BelarusBosnia
Ukraine
90.2
88.5
88.1
87.9
87.7
87.5
87.4
87.3
86.6
86.5
86.5
86.2
85.9
85.8
85.5
85.4
85.3
85.1
84.9
84.6
83.9
81.6
81.6
81.1
79.0
78.7
78.3
78.0
77.2
74.2
70.9
69.0
51.8
38.6
35.7
27.4
Customs environment: Europe results
19 © The Economist Intelligence Unit Limited 2018
The Global Illicit Trade Environment Index Europe
delegation to the UN acknowledged this issue in a public statement in 2017, but given the status of the conflict and the state of Ukraine’s border protection, it seems unlikely the problem will abate anytime soon.
times, another indicator in this category in which many European economies perform well. The EU member states clear shipments in two hours on average, according to data from the World Banks’ Doing Business report, and the European Commission calculates that EU customs authorities cleared €102,000 (US$119,000) worth of declaration per second, equivalent to an annual trade value of €3.5trn (US$4.1trn).16
A third benefit of automation, on which there is some disagreement, is the way it can potentially reduce opportunities for corruption at customs. One school of thought on this point is that if you limit the number of “corruption points”, or interactions between customs authorities and traders, you can cut off some of the major avenues for illicit trade that are opened and widened by bribery. In a kind of “corruption finds a way” argument, the counter-view is that these corruption points simply migrate to other parts of the supply chain as a result of increased automation and that the net impact, while positive, is possibly not that significant.17
Ukraine’s ranking (80th) in this category, combined with its corruption score, which is the lowest possible, again highlights the vulnerabilities created on Europe’s geographic periphery. Since the conflict with Russia began in 2014, weapons to arm fighters, ranging from AK-47s to grenades and rocket launchers, have been flowing into the country. In recent years, however, they have begun to flow out, purchased by organised crime networks and even far-right groups in countries like France.18 The Ukrainian
16 EU Commission (2016). EU Strategy for Customs Risk Management. Infographic. https://ec.europa.eu/taxation_customs/sites/taxation/files/risk_management_infographic_2016_en.pdf
17 Widdowsen, David (2013). Bordering on corruption: an analysis of corrupt customs practices that impact the trading community. World Customs Journal, Vol. 7, No. 218 https://www.reuters.com/article/us-ukraine-crisis-arms-insight-idUSKCN1050ZE

20© The Economist Intelligence Unit Limited 2018
The Global Illicit Trade Environment Index Europe
Conclusion
criminal groups. As Europol explains in its 2017 SOCTA report: “Migrant smuggling has emerged as a highly profitable and widespread criminal activity for organised crime in the EU. The migrant smuggling business is now a large, profitable and sophisticated criminal market, comparable to the European drug markets.”19
According to Suzanne Hoff of a non-governmental organisation, La Strada International, law enforcement agencies have the legal means to act and combat human trafficking. The problem, however, lies in two areas. First, “in some economies fighting human trafficking is currently not a political priority”. Mr Keatinge has a similar opinion: “Governments with more limited resources inevitably make intervention decisions based on how much illicit trade affects them domestically. This creates opportunities for illicit trade transit routes.”
Second, these economies need to reinforce collaboration between their law enforcement agencies as well as collaborate more internationally. As the OECD concluded in its 2016 report on criminal networks: “Successful disruption of illicit trade requires concerted, multi-stakeholder efforts at national and international level”20. It also requires “involving…the manufacturers and
As a block, the EU is the top performer in the Global Illicit Trade Environment Index. Those nations that were already part of the EU prior to 2004’s enlargement can all be found in the top portion of the index, with the notable exception of Italy and Greece, an outcome that should call attention to vulnerabilities created by economies on the region’s geographic periphery.
Given Europe’s position and its relative wealth, especially in comparison to its neighbours on the southern rim of the Mediterranean and to its immediate east, the supply for illicit goods and services is unlikely to decline. As Tom Keatinge, director at the Centre for Financial Crime and Security Studies at the Royal United Services Institute (RUSI), highlights: “Illicit trade is a market forces issue. The market goes where the money is. The result is that there is inevitably a highway for illicit goods through the Balkans and South-east Europe towards the north, ie, the UK, Germany, Scandinavia.”
The economic strength of the EU is a major pull factor for economic migrants from poorer economies in Africa, the Middle East, Eurasia and Asia. Many of these become victims of smugglers, given the multiple legal obstacles to attaining working permits in Europe. This has created a substantial market for organised
19 Europol (2017). Crime in the age of technology – Europol’s Serious and Organised Crime Threat Assessment 2017. People as a commodity. https://www.europol.europa.eu/socta/2017/people-as-a-commodity.html
20 OECD (2016). Illicit Trade: Converging Criminal Networks. OECD Reviews of Risk Management Policies. OECD Publishing, Paris. http://dx.doi.org/10.1787/9789264251847-en.

21 © The Economist Intelligence Unit Limited 2018
The Global Illicit Trade Environment Index Europe
distributors of impacted industries, consumers and the general public”.21 Or as Mr Keatinge would put it: “To combat illicit trade we need partnerships across borders, between domestic and international agencies, between the private and the public sector. That is the key and that has to be the future.”
21 OECD (2016). Illicit Trade: Converging Criminal Networks. OECD Reviews of Risk Management Policies. OECD Publishing, Paris. http://dx.doi.org/10.1787/9789264251847-en.

22© The Economist Intelligence Unit Limited 2018
The Global Illicit Trade Environment Index Europe
Index methodology
We constructed the Index in consultation with an expert advisory panel:
• Julio Bacio Terracino – deputy head of division at OECD Public Sector Integrity Division, Public Governance Directorate
• Michael Levi – professor of criminology at Cardiff University (UK)
• John M. Sellar – independent anti-smuggling, fraud, and organised crime consultant
This index follows the illicit trade framework from the OECD Task Force on Countering Illicit Trade (TF-CIT).1 According to the OECD, illicit trade refers to “trafficking and illegal trades in drugs, arms, persons, toxic waste, natural resources, counterfeit consumer goods, and wildlife.” Framework examples transcend industry and geography, including illicit trade’s negative impact on health, environment, human vulnerability, terrorism, and government.
Country selection
We selected 84 countries to ensure a representative sample of countries in global supply chains, with particular consideration for illicit trade flows. The selected countries
The Global Illicit Trade Environment Index measures the extent to which a country enables illicit trade, either through action or inaction. Based on the findings from an extensive literature, and input from a panel of illicit trade experts, we built the Index around four main categories, each with four to seven indicators. Those categories are:
• Government policy measures the extent to which countries have comprehensive laws targeting illicit trade. The category focuses on legal authority at relevant stakeholders, and considers intellectual property protection, cyber security and money laundering laws.
• Transparency and trade measures the extent to which the government makes itself publicly accountable in its efforts to combat illicit trade. The category also considers best practices in trade governance.
• Supply and demand considers the institutional and economic levers that can stem or amplify illicit trade flows.
• Customs environment measures how effectively a country’s customs service manages its dual mandate of trade facilitation while preventing illicit trade.
1 http://www.oecd.org/gov/risk/oecdtaskforceoncounteringillicittrade.htm

23 © The Economist Intelligence Unit Limited 2018
The Global Illicit Trade Environment Index Europe
• Survey of experts. Ten indicators are scored based on qualitative desk-based research and interviews with in-country illicit trade experts.
Indicator normalisation
In order to compare data points across countries–as well as to construct aggregate scores for each country–the project team normalised collected data on a scale of zero to 100 using a min-max calculation. While both scores and rankings are relative assessments, scores have more absolute weight as they better capture the distribution of actual outcomes.
Other indicators were normalised as a two, three or four-point rating. For example, “4.5) Customs recordal system” was normalised so that countries without such systems scored 0, countries with partially effective systems scored 50, and countries with effective systems scored 100.
While using normalised values (that is, a score of 0–100) allows for direct comparability with other normalised indicator scores in the 2018 Global Index, we cannot directly compare performance of countries in the 2016 APAC Index and this Index. This is because (a) normalised scores change based on performance of other countries in the sample, and (b) some indicator scoring frameworks and data sources have changed.
represent 95% of global GDP and 95% of trade flows. When selecting countries, we also made sure to include a balance of countries from all regions and levels of development. Regions are classified primarily based on based on the World Bank’s country and lending groups for 2018.2
Indicators by type
The Index includes 14 quantitative indicators and six qualitative indicators. There are four broad categories of indicators:
• EIU country scores. Our country analysts are expert economists who regularly track the business environment and operational risk for their country of study. Analysts score countries based on answers to a set of specific questions for each topic, ensuring comparability across all 84 countries.
• International institution scores. We draw on existing indices or benchmarking exercises from highly reputable international sources, such as the World Bank’s Logistics Performance Index and the Organization for Economic Cooperation and Development’s Trade Facilitation Indicators.
• Participation/availability scores. Countries receive scores for adoption of illicit trade-related international conventions and participation in trade services, such as Authorised Economic Operator (“trusted trade”) programmes.
2 https://datahelpdesk.worldbank.org/knowledgebase/articles/906519-world-bank-country-and-lending-groups
24© The Economist Intelligence Unit Limited 2018
The Global Illicit Trade Environment Index Europe
3 Category weights represent that category’s share of the index. Indicator weights represent that indicator’s share of its category. 4 ITU does not score Hong Kong or Taiwan. Hong Kong has therefore received China’s score. Taiwan has received an average of the scores for four developed East Asian economies: Hong
Kong, Japan, Singapore and South Korea.
Indicators
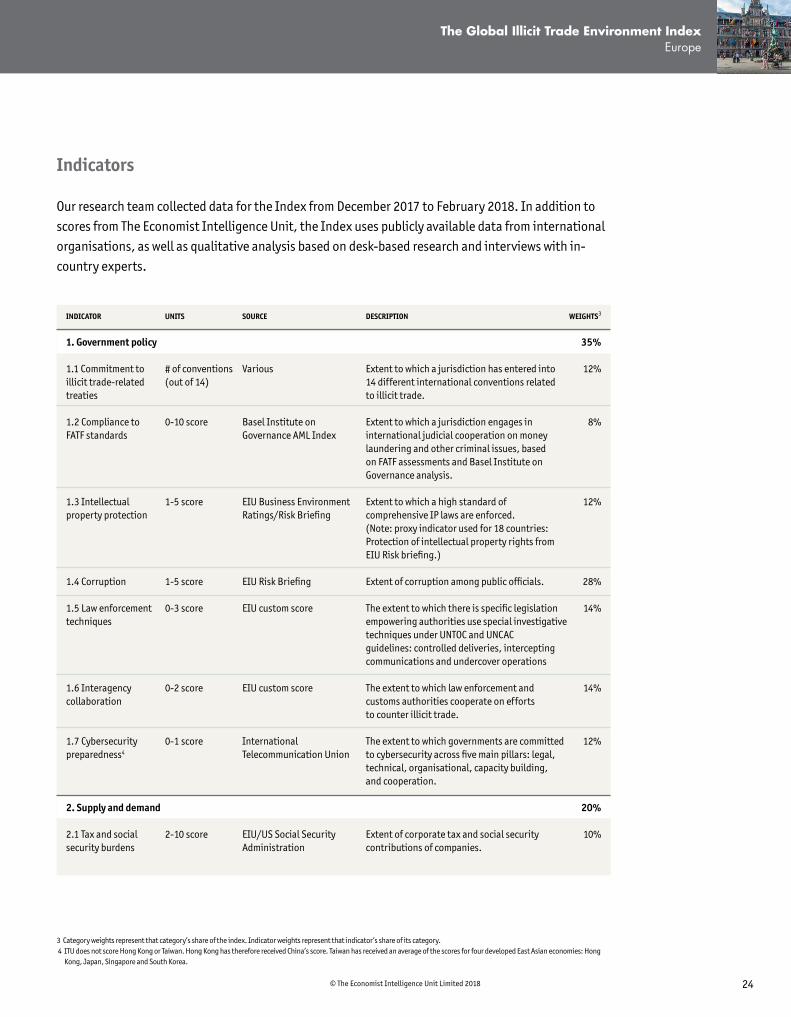
Our research team collected data for the Index from December 2017 to February 2018. In addition to scores from The Economist Intelligence Unit, the Index uses publicly available data from international organisations, as well as qualitative analysis based on desk-based research and interviews with in-country experts.
INDICATOR
1. Government policy
1.1 Commitment to illicit trade-related treaties
1.2 Compliance to FATF standards
1.3 Intellectual property protection
1.4 Corruption
1.5 Law enforcement techniques
1.6 Interagency collaboration
1.7 Cybersecurity preparedness4
2. Supply and demand 2.1 Tax and social security burdens
UNITS
# of conventions (out of 14)
0-10 score
1-5 score
1-5 score
0-3 score
0-2 score
0-1 score
2-10 score
SOURCE
Various
Basel Institute on Governance AML Index
EIU Business Environment Ratings/Risk Briefing
EIU Risk Briefing
EIU custom score
EIU custom score
International Telecommunication Union
EIU/US Social Security Administration
DESCRIPTION
Extent to which a jurisdiction has entered into 14 different international conventions related to illicit trade.
Extent to which a jurisdiction engages in international judicial cooperation on money laundering and other criminal issues, based on FATF assessments and Basel Institute on Governance analysis.
Extent to which a high standard of comprehensive IP laws are enforced. (Note: proxy indicator used for 18 countries: Protection of intellectual property rights from EIU Risk briefing.)
Extent of corruption among public officials.
The extent to which there is specific legislation empowering authorities use special investigative techniques under UNTOC and UNCAC guidelines: controlled deliveries, intercepting communications and undercover operations
The extent to which law enforcement and customs authorities cooperate on efforts to counter illicit trade.
The extent to which governments are committed to cybersecurity across five main pillars: legal, technical, organisational, capacity building, and cooperation.
Extent of corporate tax and social security contributions of companies.
WEIGHTS3
35%
12%
8%
12%
28%
14%
14%
12%
20%
10%

25 © The Economist Intelligence Unit Limited 2018
The Global Illicit Trade Environment Index Europe
5 WEF does not rate five of the countries in the index: Belarus, Belize, Iraq, Libya and Myanmar. For these countries, EIU country analysts applied WEF’s scoring framework to assign a custom score.
6 World Bank LPI does not score Belize for Track and Trace Services. We have assigned Belize an average of Costa Rica, Guatemala and Panama.7 World Bank LPI does not score Armenia or Belize for physical inspection of shipments. For Armenia, we have assigned an average of CIS lower middle income economies (Georgia,
Kyrgyzstan, Moldova, Ukraine, and Uzbekistan). For Belize, we have assigned an average of Costa Rica, Guatemala and Panama.8 OECD’s Trade Facilitation Indicators do not include scores for Iraq or Libya. We have assigned both countries the lowest score based on our research.
2.2 Quality of state institutions
2.3 Labour market regulations
2.4 Perception of organised crime5
3.1 Track and trace services6
3.2 Adoption of Annex D of Revised Kyoto Convention
3.3 FTZ governance
3.4 International reporting
4.1 Percentage of shipments physically inspected7
4.2 Customs clearance and inspection
4.3 Automation8
4.4 Authorised Economic Operator programme
4.5 Customs recordal system
3. Transparency and trade
4. Customs environment
1-5 score
1-5 score
0-7 score
0-5 score
0-4 score
0-2 score
0-6 score
% of shipments
# of hours
0-2 score
0-2 score
0-2 score
EIU Business Environment Ratings/Risk Briefing
EIU Business Environment Ratings/Risk Briefing
World Economic Forum/EIU
World Bank LPI
World Customs Organization
EIU custom score
EIU custom score
World Bank LPI
World Bank Doing Business
OECD Trade Facilitation Indicators
World Customs Organisation
EIU custom score
Effectiveness of country’s public institutions. (Note: proxy indicator used for 18 countries: Quality of bureaucracy from EIU Risk briefing.)
Our restrictiveness of labour laws rating scores countries between 1 and 5 on the degree of restrictiveness on hiring and firing, with 1 being “very high” and 5 being “very low”. (Note: proxy indicator used for 18 countries: Restrictiveness of labour laws from EIU Risk briefing.)
Perception of the extent to which organised crime (mafia-oriented racketeering, extortion) imposes costs on business.
Ability to track and trace consignments.
Adoption of Annex D of Revised Kyoto Convention.
Extent to which countries establish customs offices and authorise inspections of goods in transit in all FTZs.
The extent to which the government reports on its efforts to counter human trafficking, IP infringement, and drug trafficking.
Percentage of shipments physically inspected.
Number of hours, on average, for customs clearance and inspection.
Assessment of electronic exchange of data, automated border procedures, and use of risk management.
Assessment of operational or planned AEO programmes.
Assessment of existence and effectiveness of customs recordal systems.
40%
15%
35%
20%
35%
25%
25%
15%
25%
10%
10%
32%
28%
20%

26© The Economist Intelligence Unit Limited 2018
The Global Illicit Trade Environment Index Europe
TRACIT project sponsors and contributors
• Marazzi and Associati
• Naftna Industrija Srbije (NIS)
• National Petrochemical Industrial Company (Saudi Arabia)
• Pernod Ricard
• Philip Morris International
• Programme for the Endorsement of Forest Certification (PEFC)
• Procter & Gamble
• Richemont
• Unilever
• Universal Music
• AmCham Costa Rica
• Association of Industries of the Dominican Republic (AIRD)
• Authentix
• Brand Protection Group (Brazil)
• British American Tobacco
• Business Council for International Understanding
• Coca Cola Serbia Montenegro
• Crime Stoppers International
• Diageo
• Eurocham Myanmar
• Ideas Matter
• Japan Tobacco International
Companies and relevant organisations have helped us develop this work by sponsoring our research and collaboration with the EIU.

LONDON 20 Cabot Square London E14 4QW United Kingdom Tel: (44.20) 7576 8000 Fax: (44.20) 7576 8500 E-mail: [email protected]
NEW YORK 750 Third Avenue 5th Floor New York, NY 10017, US Tel: (1.212) 554 0600 Fax: (1.212) 586 0248 E-mail: [email protected] HONG KONG 1301 Cityplaza Four 12 Taikoo Wan Rd Taikoo Shing Hong Kong Tel: (852) 2585 3888 Fax: (852) 2802 7638 E-mail: [email protected]
SINGAPORE 8 Cross Street #23-01 Manulife Tower Singapore 048424 Tel: (65) 6534 5177 Fax: (65) 6428 2630 E-mail: [email protected]
GENEVA Rue de l’Athénée 32 1206 Geneva Switzerland Tel: (41) 22 566 2470 Fax: (41) 22 346 9347 E-mail: [email protected]
Whilst every effort has been taken to verify the accuracy of this information, neither The Economist Intelligence Unit Ltd. nor the sponsor of this report
can accept any responsibility or liability for reliance by any person on this report or any of the information, opinions or conclusions set out herein.