the global epidemic of occupational injuries - rand global epidemic of occupational injuries:...
TRANSCRIPT

Dissertation
The Global Epidemic of Occupational Injuries
Counts, Costs, and Compensation
Ujwal Kharel
This document was submitted as a dissertation in May 2016 in partial fulfillment of the requirements of the doctoral degree in public policy analysis at the Pardee RAND Graduate School. The faculty committee that supervised and approved the dissertation consisted of Seth A. Seabury (Chair), Louay Constant, and Krishna Kumar.
PARDEE RAND GRADUATE SCHOOL
For more information on this publication, visit http://www.rand.org/pubs/rgs_dissertations/RGSD377.html
Published by the RAND Corporation, Santa Monica, Calif.
© Copyright 2016 RAND Corporation
R® is a registered trademark
Limited Print and Electronic Distribution Rights
This document and trademark(s) contained herein are protected by law. This representation of RAND intellectual property is provided for noncommercial use only. Unauthorized posting of this publication online is prohibited. Permission is given to duplicate this document for personal use only, as long as it is unaltered and complete. Permission is required from RAND to reproduce, or reuse in another form, any of its research documents for commercial use. For information on reprint and linking permissions, please visit www.rand.org/pubs/permissions.html.
The RAND Corporation is a research organization that develops solutions to public policy challenges to help make communities throughout the world safer and more secure, healthier and more prosperous. RAND is nonprofit, nonpartisan, and committed to the public interest.
RAND’s publications do not necessarily reflect the opinions of its research clients and sponsors.
Support RAND Make a tax-deductible charitable contribution at
www.rand.org/giving/contribute
www.rand.org
iii
The Global Epidemic of Occupational Injuries: Counts, Costs, and
Compensation
Abstract
Reliable data on work-related injuries and fatalities are unavailable for most countries around the
world. This lack of credible data hampers efforts to improve work-place safety, particularly in
developing countries where it is often not even recognized as a public health priority. The first
chapter develops annual estimates of the count and the rate of workplace fatalities for 215
countries. The paper finds that, over the past two decades, the global burden has shifted towards
the low-income parts of the world and that the official counts in most countries severely
underreport their occupational injuries.
The second chapter focuses on the Gulf Cooperation Council (GCC) countries, which rely
heavily on migrant labor. This chapter is an institutional review of work injury compensation
policies in the GCC countries and it assesses how well they protect the labor force that is
primarily comprised of migrant workers. It focuses on the benefits to which injured workers and
their beneficiaries are entitled and compares them against benefits awarded in other countries
with similar labor composition and economy. The chapter finds that work injury compensation
laws in the GCC countries, as they apply to migrant workers, struggle to meet most of the
objectives of a modern worker’s compensation system.
The third chapter presents a case study that further investigates the adequacy of the
compensation benefits by estimating the economic loss when a Nepali migrant worker dies in
Qatar, while recognizing the unique nature of the economic migration: it is legally temporary.
The methodology includes developing the age-earnings profiles of workers in Qatar and Nepal,
modeling the duration of their stay, and assessing the value of their contribution to the household
production. The chapter finds that, even when accounting for the temporary nature of the
economic migration, an overwhelming majority of bereaved Nepali families are entitled to
benefits that are lower than the lost earning potential of their deceased relative.


v
Acknowledgments
First of all, I am extremely thankful to my dissertation committee: Seth Seabury, my committee
chair, Louay Constant, and Krishna Kumar for generously sharing their vast experience,
expertise, and time during what has been a long journey. They are inspirational researchers and I
feel privileged to have been under their tutelage. Krishna and Louay gave me the courage to
pursue this path when it was not clear where it led. Louay was exceptionally helpful when I was
developing the research questions. His thoughts and recommendations have been incorporated
throughout this dissertation. Seth encouraged me to expand the scope of this dissertation and
explore the less-visited topics of occupational injury research. He guided me along the every step
of the way. Without his mentorship, this dissertation would not have been possible. I am also
very grateful to Tim Bushnell, economist at the National Institute for Safety and Health, who, as
the outside reader, gave invaluable, insightful and incisive feedback to enrich this dissertation.
I want to thank the USC Schaeffer Center for Health Policy and Economics for financially
supporting the first chapter of this dissertation. I was also very fortunate to receive generous
supports from the Pardee Dissertation Award for Global Human Progress and David I. J. Wang
Dissertation Award.
The last few years have been a period of great personal and intellectual growth for me, much
credit to the RAND and Pardee RAND family for fostering such a nourishing environment. I
particularly thank Dean Susan Marquis, Associate Deans Rachel Swanger, Gery Ryan and
Stephanie Howard, Jeffrey Wasserman, Mary Parker, Maggie Clay, and Kristina Wallace. Pardee
RAND, of course, would not be what it is without its amazingly talented fellows. I am grateful to
have known them and learnt from them. Particularly, I thank Abdul Tariq and Prodyumna
Goutam for helping me get over the finish line.
Finally, I dedicate this dissertation to my adoring and incredibly adorable wife, Anjana Bhattarai,
whose patience and assurance kept me motivated and, more importantly, sane.


vii
Table of Contents
Acknowledgments .............................................................................................................................. iii
Abbreviations ..................................................................................................................................... ix
List of Tables ....................................................................................................................................... xi
List of Figures ..................................................................................................................................... xiii
Introduction ........................................................................................................................................ xv
1. Global estimates of fatal occupational injuries .............................................................................. 1
Abstract .................................................................................................................................................... 1
Introduction .............................................................................................................................................. 1
Literature review ....................................................................................................................................... 3
Methodology ............................................................................................................................................ 3
Results ..................................................................................................................................................... 13
Discussion ............................................................................................................................................... 18
Policy implications .................................................................................................................................. 19
Conclusion ............................................................................................................................................... 20
Appendices .............................................................................................................................................. 27
2. Work injury compensation policies in the Arabian Gulf countries ............................................... 32
Abstract .................................................................................................................................................. 32
Background ............................................................................................................................................. 32
Literature review ..................................................................................................................................... 35
Analysis ................................................................................................................................................... 42
Conclusions ............................................................................................................................................. 57
Appendix ................................................................................................................................................. 59
3. Estimating the economic costs of occupational fatalities of migrant workers in the GCC Countries
64
Abstract .................................................................................................................................................. 64
Background ............................................................................................................................................. 64
Research objectives ................................................................................................................................ 66
viii
Methodology .......................................................................................................................................... 67
Results ..................................................................................................................................................... 80
Discussion ............................................................................................................................................... 81
Appendices .............................................................................................................................................. 84
Conclusions ........................................................................................................................................ 97
References ....................................................................................................................................... 101
ix
Abbreviations
BLS Bureau of Labor Statistics
FC Fatal Occupational Injury Count
GCC Gulf Cooperation Council
GDP Gross Domestic Product
ILO International Labor Organization
LAC Latin America and Caribbean region
LF Labor Force
MAR Missing At Random
MBP Marginal Benefit of Prevention
MCP Marginal Cost of Prevention
MI Multiple Imputation
MICE Multivariate Imputation by Chained Equations
NLSS Nepal Living Standards Survey
PD Permanent Disability
PPD Permanent Partial Disability
PTD Permanent Total Disability
SESRI Social and Economic Survey Research Institute
TD Temporary Disability
TTD Temporary Total Disability
UAE United Arab Emirates
UNPD United Nations Population Division
USD United States Dollars
WDI World Development Indicators
WHO World Health Organization
WICA Work Injury Compensation Act

xi
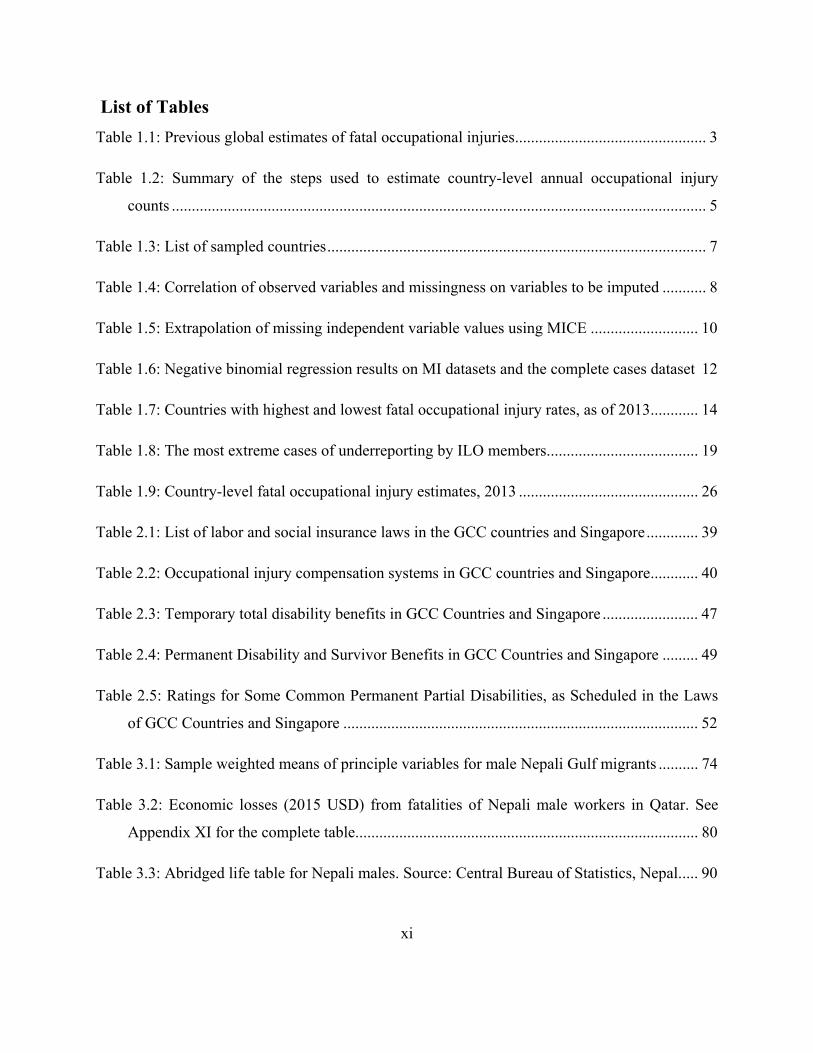
List of Tables
Table 1.1: Previous global estimates of fatal occupational injuries ................................................ 3
Table 1.2: Summary of the steps used to estimate country-level annual occupational injury
counts ...................................................................................................................................... 5
Table 1.3: List of sampled countries ............................................................................................... 7
Table 1.4: Correlation of observed variables and missingness on variables to be imputed ........... 8
Table 1.5: Extrapolation of missing independent variable values using MICE ........................... 10
Table 1.6: Negative binomial regression results on MI datasets and the complete cases dataset 12
Table 1.7: Countries with highest and lowest fatal occupational injury rates, as of 2013 ............ 14
Table 1.8: The most extreme cases of underreporting by ILO members. ..................................... 19
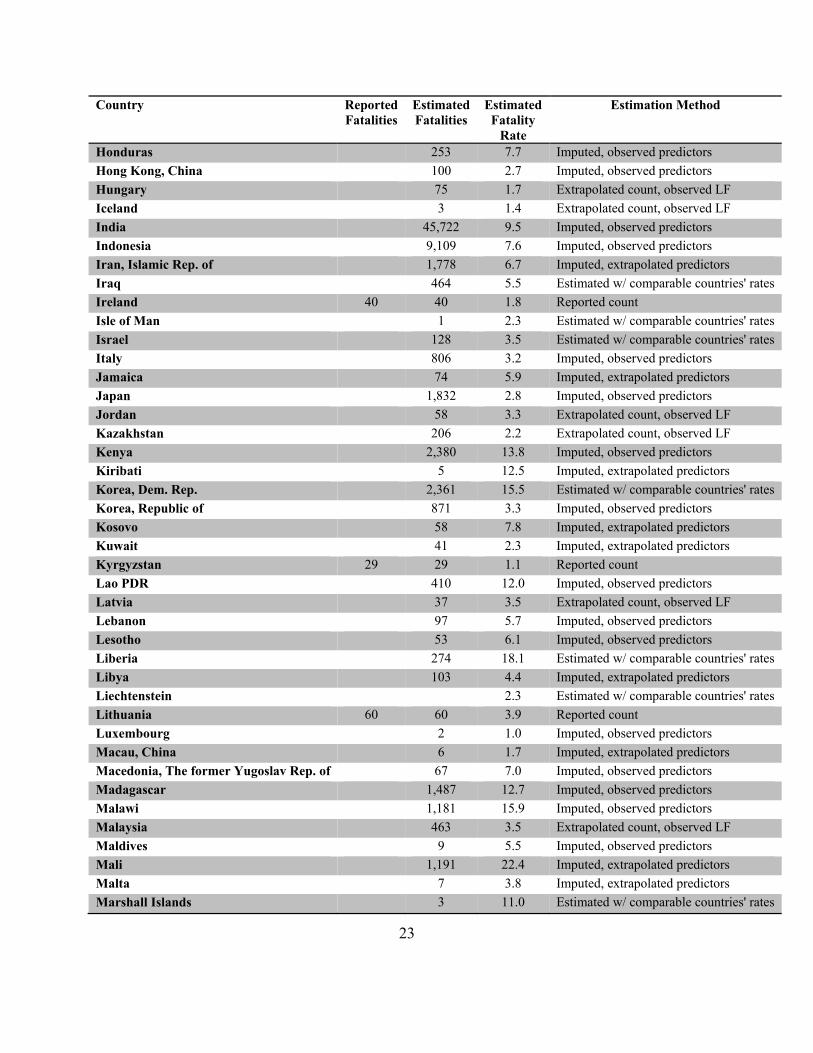
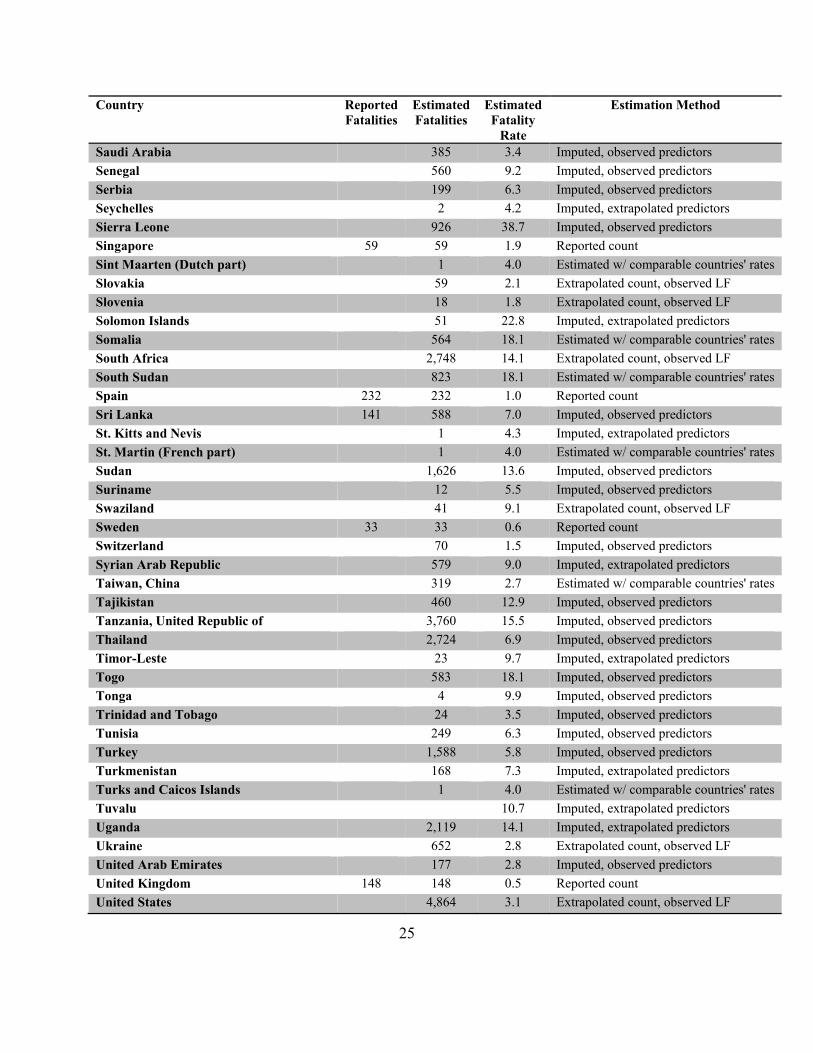
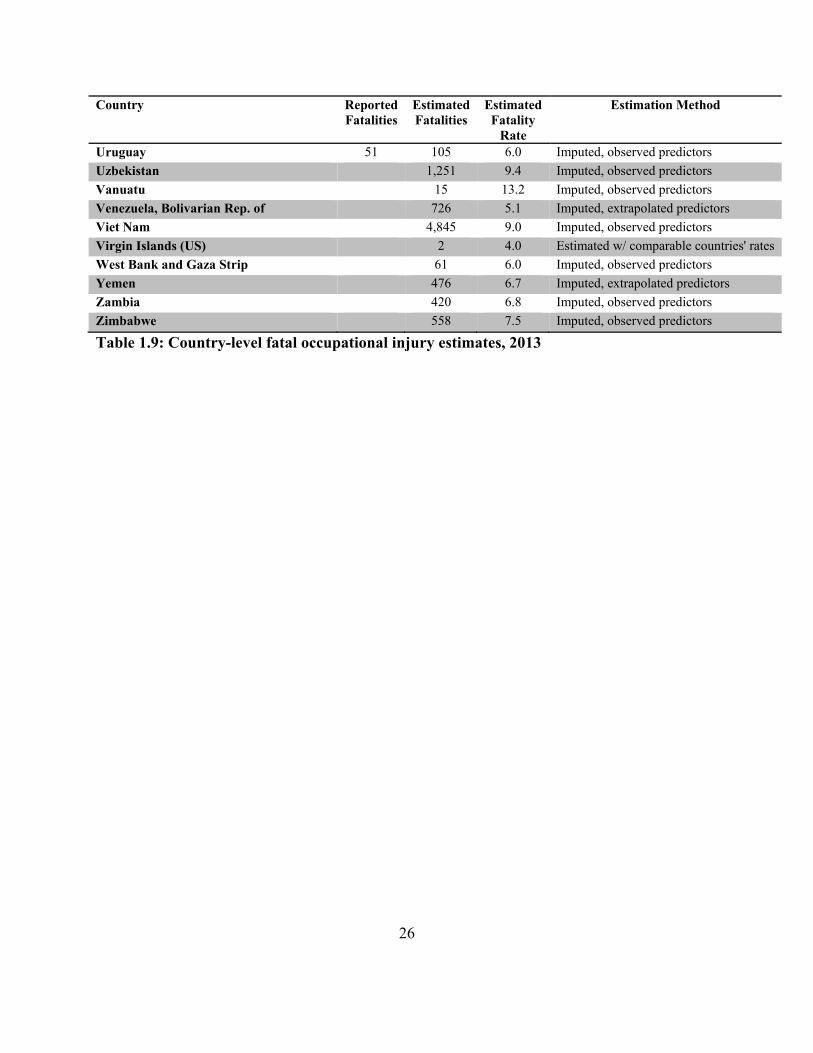
Table 1.9: Country-level fatal occupational injury estimates, 2013 ............................................. 26
Table 2.1: List of labor and social insurance laws in the GCC countries and Singapore ............. 39
Table 2.2: Occupational injury compensation systems in GCC countries and Singapore ............ 40
Table 2.3: Temporary total disability benefits in GCC Countries and Singapore ........................ 47
Table 2.4: Permanent Disability and Survivor Benefits in GCC Countries and Singapore ......... 49
Table 2.5: Ratings for Some Common Permanent Partial Disabilities, as Scheduled in the Laws
of GCC Countries and Singapore ......................................................................................... 52
Table 3.1: Sample weighted means of principle variables for male Nepali Gulf migrants .......... 74
Table 3.2: Economic losses (2015 USD) from fatalities of Nepali male workers in Qatar. See
Appendix XI for the complete table. ..................................................................................... 80
Table 3.3: Abridged life table for Nepali males. Source: Central Bureau of Statistics, Nepal. .... 90


xiii
List of Figures
Figure 1.1: Heat Map of Estimated Fatal Occupational Injury Rates, 2013 ................................. 13
Figure 1.2: Global estimates of fatal occupational injury counts and incidence rates between
1989-2013 ............................................................................................................................. 15
Figure 1.3: Fatal occupational injury rates aggregated across five-year periods by income groups
............................................................................................................................................... 16
Figure 1.4: Distribution of fatal occupational injuries by country income groups ....................... 17
Figure 1.5: Fatal occupational injury rates aggregated across five-year periods by geographical
region .................................................................................................................................... 18
Figure 1.6: Distribution of fatal occupational injuries by geographical region ............................ 18
Figure 1.7: Fatal occupational injuries aggregated across five-year periods by income groups .. 20
Figure 2.1: Employer's incentives for injury prevention under various systems .......................... 44
Figure 2.2: Loss of earnings after a work injury. Adapted from Burton Jr. et al., (1987). ........... 46
Figure 2.3: Total benefits after 7 months of temporary disability ................................................ 48
Figure 2.4: Adequate lump-sum compensation for permanent total disability. ............................ 51
Figure 2.5: Adequate lump sum compensation for permanent partial disability .......................... 54
Figure 2.6: Compensation for permanent total disability under the Qatar Labor Law ................. 57
Figure 3.1: Age-Earnings profiles of male Nepali Workers in Qatar at years of education ......... 75
Figure 3.2: Age-Earnings profiles of male Nepali Workers who returned from the Gulf Region at
years of education ................................................................................................................. 77
Figure 3.3: Economic losses from an occupational fatality of male Nepali migrant workers in
Qatar. ..................................................................................................................................... 81

xv
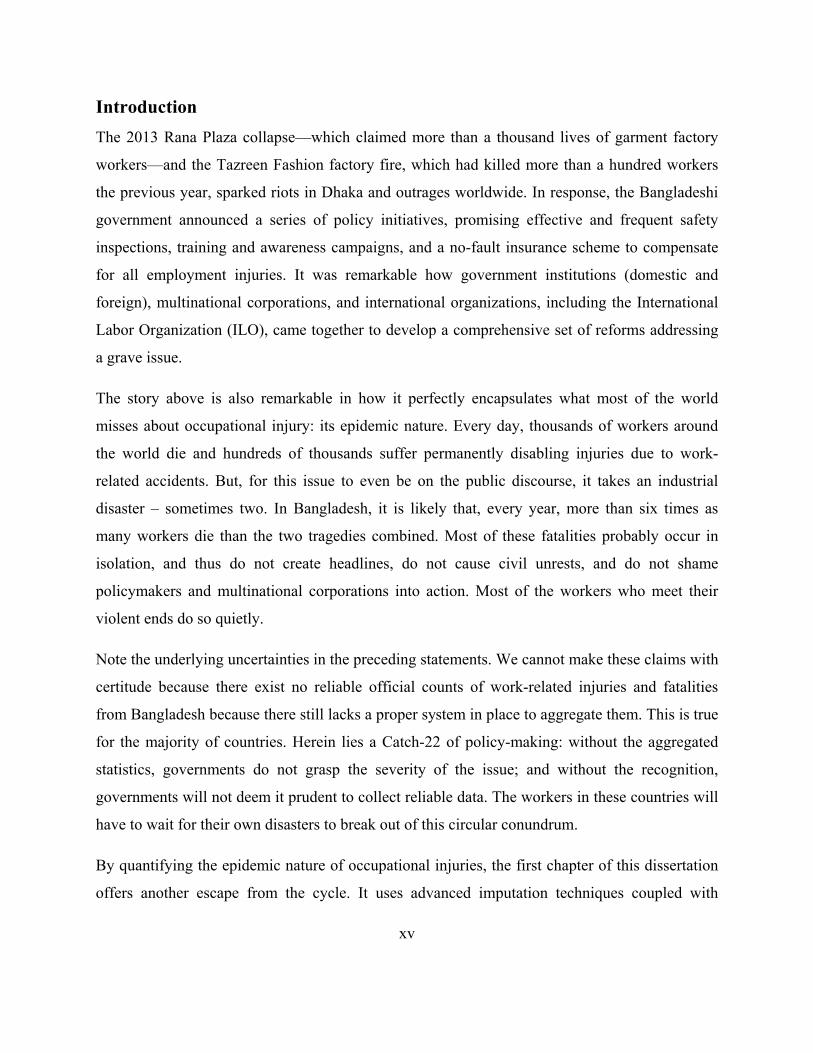
Introduction
The 2013 Rana Plaza collapse—which claimed more than a thousand lives of garment factory
workers—and the Tazreen Fashion factory fire, which had killed more than a hundred workers
the previous year, sparked riots in Dhaka and outrages worldwide. In response, the Bangladeshi
government announced a series of policy initiatives, promising effective and frequent safety
inspections, training and awareness campaigns, and a no-fault insurance scheme to compensate
for all employment injuries. It was remarkable how government institutions (domestic and
foreign), multinational corporations, and international organizations, including the International
Labor Organization (ILO), came together to develop a comprehensive set of reforms addressing
a grave issue.
The story above is also remarkable in how it perfectly encapsulates what most of the world
misses about occupational injury: its epidemic nature. Every day, thousands of workers around
the world die and hundreds of thousands suffer permanently disabling injuries due to work-
related accidents. But, for this issue to even be on the public discourse, it takes an industrial
disaster – sometimes two. In Bangladesh, it is likely that, every year, more than six times as
many workers die than the two tragedies combined. Most of these fatalities probably occur in
isolation, and thus do not create headlines, do not cause civil unrests, and do not shame
policymakers and multinational corporations into action. Most of the workers who meet their
violent ends do so quietly.
Note the underlying uncertainties in the preceding statements. We cannot make these claims with
certitude because there exist no reliable official counts of work-related injuries and fatalities
from Bangladesh because there still lacks a proper system in place to aggregate them. This is true
for the majority of countries. Herein lies a Catch-22 of policy-making: without the aggregated
statistics, governments do not grasp the severity of the issue; and without the recognition,
governments will not deem it prudent to collect reliable data. The workers in these countries will
have to wait for their own disasters to break out of this circular conundrum.
By quantifying the epidemic nature of occupational injuries, the first chapter of this dissertation
offers another escape from the cycle. It uses advanced imputation techniques coupled with

xvi
econometric models to estimate country-level counts of fatal work-related injuries in countries
that either do not report aggregate counts or do so unreliably. The paper finds that there are
approximately 250,000 work-related fatalities ever year and that lower income countries bear the
burden greatly disproportionate to their level of economic activity. Its estimates, conservative by
design, also demonstrate the extreme underreporting of counts by most of the ILO members.
Specifically, more than half of the members whose fatality statistics were found to be unreliable
reported counts that were less than 10% of this paper’s estimates.
This collective failure to appreciate the extent and severity of work-related injuries also rears its
head in the systems in place to compensate the victims. After the two Bangladeshi tragedies,
trust funds, supported by stakeholders and individual donations from around the world, had to be
established to compensate the victims and their families. Again, such compensation model also
misses the epidemic nature of work injuries and relies on headlines and public uproars to ensure
that victims receive their due. The majority of occupational casualties, which occur in isolation,
will not receive wide attention. In absence of an employment injury insurance scheme, injured
workers and their families have to depend on the legal system that, as the second chapter of this
dissertation explores, may inherently favor the employers.
The second chapter compares the work injury compensation systems in a set of affluent countries
in the Arabian Gulf region, and outlines their limitations in protecting their labor force that is
comprised heavily of foreign workers. While migrant workers are one of the groups most
vulnerable to occupational injuries around the world, those in the Gulf Cooperation Council
(GCC) countries (Bahrain, Kuwait, Oman, Qatar, Saudi Arabia, and UAE) are particularly so.
Because the native-born workers constitute a small minority share of the workforce, particularly
in hazardous occupations, almost all of the work-related injuries in these countries are sustained
by migrants, who come from the poorest parts of the world, where economic opportunities are
comparatively scarce. Based on the institutional review of the GCC labor laws, the chapter
concludes that the set of policies in place (i) might fail to provide enough incentives for
employers to provide a safer work environment, (ii) do not cover the more vulnerable sections of
the labor force, and (iii) provide inadequate compensation benefits for the injured workers or
their families.
xvii
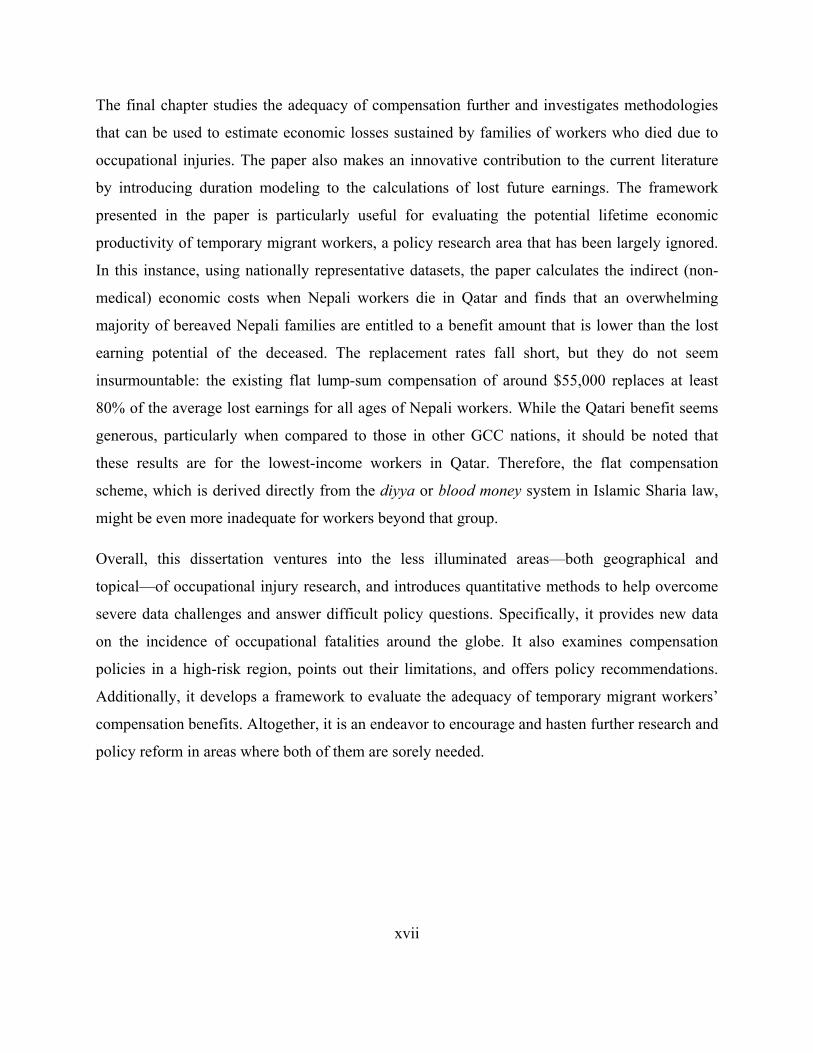
The final chapter studies the adequacy of compensation further and investigates methodologies
that can be used to estimate economic losses sustained by families of workers who died due to
occupational injuries. The paper also makes an innovative contribution to the current literature
by introducing duration modeling to the calculations of lost future earnings. The framework
presented in the paper is particularly useful for evaluating the potential lifetime economic
productivity of temporary migrant workers, a policy research area that has been largely ignored.
In this instance, using nationally representative datasets, the paper calculates the indirect (non-
medical) economic costs when Nepali workers die in Qatar and finds that an overwhelming
majority of bereaved Nepali families are entitled to a benefit amount that is lower than the lost
earning potential of the deceased. The replacement rates fall short, but they do not seem
insurmountable: the existing flat lump-sum compensation of around $55,000 replaces at least
80% of the average lost earnings for all ages of Nepali workers. While the Qatari benefit seems
generous, particularly when compared to those in other GCC nations, it should be noted that
these results are for the lowest-income workers in Qatar. Therefore, the flat compensation
scheme, which is derived directly from the diyya or blood money system in Islamic Sharia law,
might be even more inadequate for workers beyond that group.
Overall, this dissertation ventures into the less illuminated areas—both geographical and
topical—of occupational injury research, and introduces quantitative methods to help overcome
severe data challenges and answer difficult policy questions. Specifically, it provides new data
on the incidence of occupational fatalities around the globe. It also examines compensation
policies in a high-risk region, points out their limitations, and offers policy recommendations.
Additionally, it develops a framework to evaluate the adequacy of temporary migrant workers’
compensation benefits. Altogether, it is an endeavor to encourage and hasten further research and
policy reform in areas where both of them are sorely needed.


1
1. Global estimates of fatal occupational injuries
Abstract
Reliable data on work-related injuries and fatalities are unavailable for most countries around the world. This lack of credible data could hamper efforts to improve work-place safety, particularly in developing countries where workplace safety is often not even recognized as a public health priority. This study provides estimates of the number and rate of workplace fatalities for 215 countries from 1989-2013 using data from the International Labor Organization (ILO). The ILO requires its member countries to report the annual number of fatal occupational injuries, but only 39 countries reported credible statistics during the study period. Counts for the remaining 176 countries are imputed by using negative binomial regression to model a country’s occupational fatalities as a function of the size of the labor force, real Gross Domestic Product (GDP), the real GDP per capita, and the breakdown of economic output by sector. The paper finds that: (i) there were approximately 250,000 work-related fatalities per year, (ii) the global burden has shifted towards the low-income parts of the world, and (iii) the official counts in most countries severely underreport their occupational injuries.
Introduction
Occupational injuries are natural consequences of economic activities, whether it is in coalmines
of West Virginia, U.S. or on rice fields of Cambodia. When injuries inevitably occur, they cause
suffering and economic loss to individuals, families, and societies. In recognition of these costs,
both economic and noneconomic, governments and employers in industrially advanced
countries, for the most part, have taken measures for safety management and injury prevention in
occupational settings. Not coincidentally, countries with better occupational safety regulations
and practices also keep and report reliable statistics of occupational injuries. Accurate counts and
rates of occupational injuries are necessary not only to define policy goals and evaluate
programs, but also to recognize that the very need for an intervention exists in the first place.
Having country-level statistics on occupational injuries would be the first step towards
understanding the severity of this issue. Nationally, a tally of work injuries will help the
government to raise awareness regarding occupational hazards as well as to determine its relative
urgency compared to other policy issues. Unfortunately, reliable statistics on work-related
injuries and fatalities are not available for the most of the world.
The International Labor Organization (ILO) requires its 186 member countries to report annual
number of cases of fatal and non-fatal occupational injuries. However, only a small number of

2
countries report their statistics to ILO every year because only some of the developed countries
have official injury reporting and data aggregation systems. Typically, governments, if they do,
aggregate injury counts either through insurers or directly using reports from the employers, who
are mandated to report accidents to the respective government agencies. It has been found that,
even in the economically advanced countries, under the latter system of aggregating statistics,
only 30%-50% of the occupational injuries are reported (European Agency for Safety and Health
at Work, 2000). In fact, that occupational injuries are underestimated by official counts, even in
the developing world, is well known. For example, it has been estimated that the official U.S.
Bureau of Labor Statistics (BLS) nonfatal occupational injury count could be as low as 31% of
the actual count (Leigh, Marcin and Miller, 2004). Similarly, a Dutch study found that the labor
inspectorate captured only 30.3% of the estimated industrial accident cases in 1993 (Van
Charante and Mulder, 1998). There are several explanations for underreporting of work injuries,
including incentives to do so for the employers (higher injury counts raises insurance premiums,
and may result in more safety inspections by the government agencies; poor safety records mean
workers may demand greater compensating wage differentials, etc.) as well as for the workers
(job insecurity from being labeled “accident-prone”, social stigma) (Leigh, Marcin and Miller,
2004).
There is also significant variation among countries in terms of reporting systems and coverage,
making international comparisons challenging. While the ILO itself is specific about its
definitions of occupational injuries and occupational accidents (ILO defines an occupational
injury as “any personal injury, disease or death resulting from an occupational accident” and an
occupational injury is fatal if it results in death within one year of the accident), the definition
used by the reporting countries vary. For example, some countries may report injury cases that
occurred during the commute to work, and others may not. And, some countries may report
figures only from the public sector and ignore the private one altogether. Moreover, these
inconsistencies in reporting exist not only between countries, but sometimes also between yearly
reports by the same country. For example, a country may report nationwide statistics on a given
year, and then report statistics covering only a certain geographical area the next year.

3
Literature review
There are a handful of studies that address this lack of reliable and standardized international
occupational injury data by estimating country-level counts and rates. The best example is
Hämäläinen, Leena Saarela and Takala (2009), which, in order to calculate accident figures for
non Established Market Economies (EMEs), first estimates fatal and non-fatal occupational
injury rates across six World Health Organization (WHO)’s regions (Africa, Americas, Southeast
Asia, Europe, Eastern Mediterranean, and Western Pacific) by the three economic sectors:
agriculture, industry, and service. The regional rates are based on a small number of
representative countries. For example, the rates for the non-EMEs in the Southeast Asian region
are based on the rates for Korea, Malaysia, and China. The paper, however, chooses not to use
regional estimates for India and China as given their high employment figures; authors speculate
that doing so might overestimate the counts. Instead, rates for India are based on Kazakh and
Malaysian rates and rates for China are computed using Kazakh rates and previous estimates for
China itself1. In the next step, using the estimate accident rates by sector and the total sectorial
employment figures, the authors calculate country-level counts and rates of occupational injuries.
The predecessor to this paper was Takala (1999), which also imputes missing country-level
counts by using rates from countries with “similar or comparable conditions”, and is even less
specific on how the representative countries are chosen. Likewise, Leigh et al. (1999) use rates
from comparable economies when reliable data is lacking and, report regional and global
estimates, rather than national counts.
Study Global estimates by year
Hamalainen et al., 2009 345,436 (1998) 351,203 (2001) 357,948 (2003)
Takala, 1999 335,000 (1994) Leigh et al., 1999 141,813 (1994) Table 1.1: Previous global estimates of fatal occupational injuries
Methodology
This paper builds on previous methodologies used while moving away from speculative
approaches described above. Specifically, using an econometric model, this paper calculates
1 Authors are not clear on why Kazakhstan and Malaysia were chosen as representatives for India and/or China.

4
estimates of national level fatal occupational injury counts and rates for 2152 countries from
years 1989 to 2013.
This paper posits that, instead of directly applying incidence rates from comparable countries,
the fatal occupational injury count for a country can be better estimated using macroeconomic
factors. By definition, occupational injuries are a byproduct of economic activity, measured by
real Gross Domestic Product (GDP). Therefore, all else equal, greater real GDP should mean
greater exposure to risks, and thus higher counts of deaths. Similarly, ceteris paribus, the greater
the size of the population exposed to occupational hazard or the economically active population
(total labor force), the greater should be the count. In addition, as previous studies posit, the
incidence rate of injuries varies by economic sectors and thus country-level injury figures is
likely to depend on the breakdown of economic output by sectors. For example, agricultural and
industrial sectors are known to have higher fatality rates than the service sectors. Therefore, a
country more reliant on the service sector should have fewer cases of fatal work injuries than a
country more dependent on the other sectors. Moreover, overall standard of living in an economy
might also serve as a predictor; a country with higher living standard, as indicated by the GDP
per capita, is more likely to have stronger occupational health and safety regulations and
standards, and thus, a lower fatality rate.
Steps Description Step 1: Sample Selection 1a. Does the country report at least 5 years of fatality counts?
1b. Is the labor force greater than 100,000? 1c. Are the reported values comparable (at least in the same order of magnitude) to previous estimates?
Step 2: Extrapolation of Missing Predictor Values
2a. Compute annual %Change for all predictors
2b. Impute missing annual %Change using MICE
2c. Use the imputed %Change to extrapolate missing predictor values Step 3: Extrapolation of Missing Fatality Counts for Sampled Countries
3a. Individually (multiple) impute the Fatality-Workers ratios for each sampled country with year as the covariate in a linear regression 3b. Multiply the imputed ratio with the numbers of labor force to obtain extrapolated counts
Step 4: Out of sample prediction 4a. Run the negative binomial regression model on the imputed datasets
4b. Use the averaged coefficients to make out-of-sample predictions
Step 5: Estimations for countries with Use the average fatality rates in the country’s income group and region to
2 Estimates are provided for all countries or economies that the World Bank classifies by region and by income. As a result, countries or economies with population of less than 30,000 are excluded.

5
missing imputed predictors estimate fatality counts
Table 1.2: Summary of the steps used to estimate country-level annual occupational injury counts
Step 1: Sample selection
ILOSTAT database contains annual total cases of fatal occupational injuries reported to ILO by
132 member countries. As mentioned before, the reported injury statistics are not standardized
across countries. Therefore, the first stage of sample selection focused on improving the
harmonization of fatality counts. Specifically, an observation was dropped if the reported figure
comes only from certain geographic areas, or if it covered only a particular sector (public or
private), or if it explicitly excluded a certain economic sector or if it exclusively covered the
insured population or compensated occupational injuries or if it included fatalities due to
occupational diseases, not just injuries. After the standardization step, 91 countries in the dataset
had at least one year of reported fatal occupational injury count.
In addition to being unstandardized, some of the figures reported to ILO were obviously
unreliable. For example, India reported only 231 fatal cases in 1995 when the labor force was
about 370 million. To provide a comparison, U.S. reported 6,275 with a labor force of 137
million for the same year. Therefore, in order to weed out unreliable data, three criteria were
used. The first two criteria were adapted from methods used by WHO's country-level COD
(Cause of Death) estimates (WHO, 2014). The first one required that for a country’s data to be
selected in the sample, the country should have at least five years of data, while the second
criterion required that the labor force of the country be of at least 100,000. The final selection
criterion utilized previous estimates to drop series of countries that reported impossibly low
numbers. A country’s series was extrapolated and then compared against the three years of
(1998, 2001, and 2003) of estimates given by the Hämäläinen et al. paper. The series was
dropped if it was found that the fatal count—either reported or extrapolated— for any of the
three years was lower than the Hämäläinen estimates by more than a factor of 10.
Eventually, of the 39 countries were selected to be in the sample. High-income countries were
the majority, while only few (e.g., Fiji, Kyrgyzstan, Swaziland) were developing countries.
Having only a handful of lower income countries, which have considerably higher fatality rates,

6
means that their data points have high leverage3 on the results. However, this is a necessary evil,
since removing these observations and relying more on the high-income countries is likely to
further bias the out-of-sample predictions.
Reported Fatalities Country No. of Years Mean Count Extrapolated Mean Count
Argentina 9 906 923 Austria 11 152 145 Bahrain 20 16 20 Belarus 19 294 276 Botswana 16 45 45 Bulgaria 12 131 133 Chile 8 301 306 Colombia 7 386 443 Cuba 14 106 115 Cyprus 12 12 16 Czech Republic 18 220 211 Denmark 13 72 69 Estonia 6 67 34 Fiji 6 104 116 Hungary 24 176 172 Iceland 13 4 3 Ireland 24 57 56 Jordan 17 44 47 Kazakhstan 19 522 462 Kyrgyzstan 21 62 55 Latvia 20 70 64 Lithuania 23 100 98 Malaysia 9 506 491 Mexico 11 1426 1453 Netherlands 14 89 88 New Zealand 16 81 81 Norway 20 52 49 Romania 25 489 489 Russian Federation 24 4662 4543 Singapore 15 71 68 Slovakia 20 122 110 Slovenia 19 37 33 South Africa 8 631 1397 Spain 25 849 849 Swaziland 7 37 39 Sweden 24 69 70 Ukraine 20 1670 1483 United Kingdom 22 219 212 United States 17 5950 5847
3 Sensitivity analysis by leaving some of these countries out confirms their influence on the results (Appendix V)
7
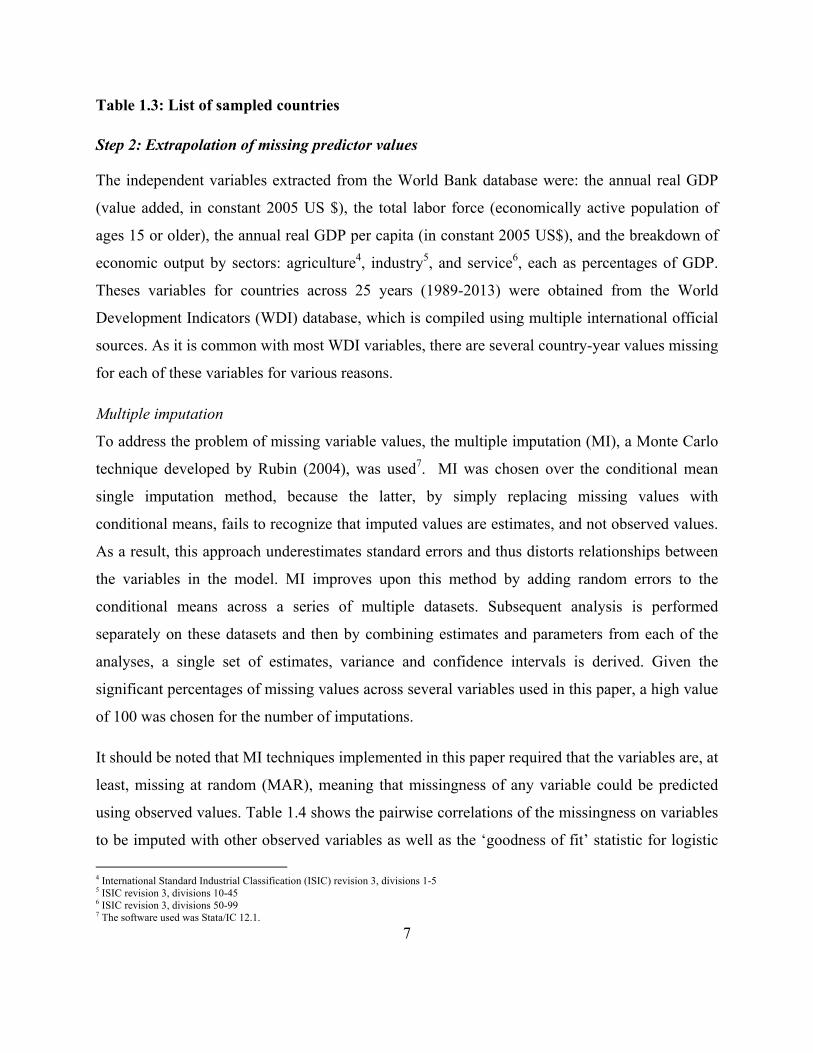
Table 1.3: List of sampled countries
Step 2: Extrapolation of missing predictor values
The independent variables extracted from the World Bank database were: the annual real GDP
(value added, in constant 2005 US $), the total labor force (economically active population of
ages 15 or older), the annual real GDP per capita (in constant 2005 US$), and the breakdown of
economic output by sectors: agriculture4, industry5, and service6, each as percentages of GDP.
Theses variables for countries across 25 years (1989-2013) were obtained from the World
Development Indicators (WDI) database, which is compiled using multiple international official
sources. As it is common with most WDI variables, there are several country-year values missing
for each of these variables for various reasons.
Multiple imputation
To address the problem of missing variable values, the multiple imputation (MI), a Monte Carlo
technique developed by Rubin (2004), was used7. MI was chosen over the conditional mean
single imputation method, because the latter, by simply replacing missing values with
conditional means, fails to recognize that imputed values are estimates, and not observed values.
As a result, this approach underestimates standard errors and thus distorts relationships between
the variables in the model. MI improves upon this method by adding random errors to the
conditional means across a series of multiple datasets. Subsequent analysis is performed
separately on these datasets and then by combining estimates and parameters from each of the
analyses, a single set of estimates, variance and confidence intervals is derived. Given the
significant percentages of missing values across several variables used in this paper, a high value
of 100 was chosen for the number of imputations.
It should be noted that MI techniques implemented in this paper required that the variables are, at
least, missing at random (MAR), meaning that missingness of any variable could be predicted
using observed values. Table 1.4 shows the pairwise correlations of the missingness on variables
to be imputed with other observed variables as well as the ‘goodness of fit’ statistic for logistic
4 International Standard Industrial Classification (ISIC) revision 3, divisions 1-5 5 ISIC revision 3, divisions 10-45 6 ISIC revision 3, divisions 50-99 7 The software used was Stata/IC 12.1.

8
regressions on the missingness of the variables with region and income group indicators as
covariates. The table suggests that the missingness on each of the imputed variables might have
significant relationships with one or more covariates, which is consistent with the MAR
assumption.
Missingness of imputed variables
Covariates Fatality GDP Agriculture Industry GDPPC Population Labor
Pairwise Correlations
Fatality Count - -0.05 -0.03 -0.03 -0.05 . -0.08
Real GDP -0.08 - -0.01 -0.01 0.00 0.00 -0.07
Agriculture Output 0.18 0.01 - -0.01 0.00 . -0.05
Industry Output -0.12 -0.10 0.05 - -0.09 . -0.20
Real GDP Per Capita -0.11 . 0.26 0.22 - . 0.22
Population -0.05 -0.07 -0.10 -0.10 -0.07 - -0.09
Total Labor Force -0.03 -0.05 -0.07 -0.07 -0.05 . -
McFadden’s R2 for logit8
Region and Income Indicators 0.10 0.12 0.11 0.11 0.13 0.13 0.10
Table 1.4: Correlation of observed variables and missingness on variables to be imputed
Missing predictor values were extrapolated in three stages. First, the yearly percentage change
for each variable—when observed values were available for consecutive years—was computed.
Second, the multivariate imputation by chained equations (MICE) method was used to impute
the missing percentage changes. Thirdly, the imputed annual percentage changes were used to
iteratively extrapolate the variables to the missing year(s)9.
The MICE method first imputes missing values in multiple variables sequentially, using a
regression model for each variable, with the other variables as covariates. This process is
repeated for multiple cycles for each imputed dataset to ensure that imputed values are stabilized.
MICE has been found to be the most practical method when missing values occur in several
variables (White, Royston and Wood, 2011).
For the purposes of this paper, the country-level variables for which the annual percentage
changes were included in the MICE univariate linear regression models were the real GDP, the
total labor force, agriculture and industrial outputs as percentages of the GDP, and population. In
8 McFadden himself considers any McFadden’s R2 value between 0.2 to 0.4 to be an ‘excellent fit’ (McFadden, 1977) . 9 See Appendix II for the graphical illustration of results from the extrapolation of the missing predictor values.
9
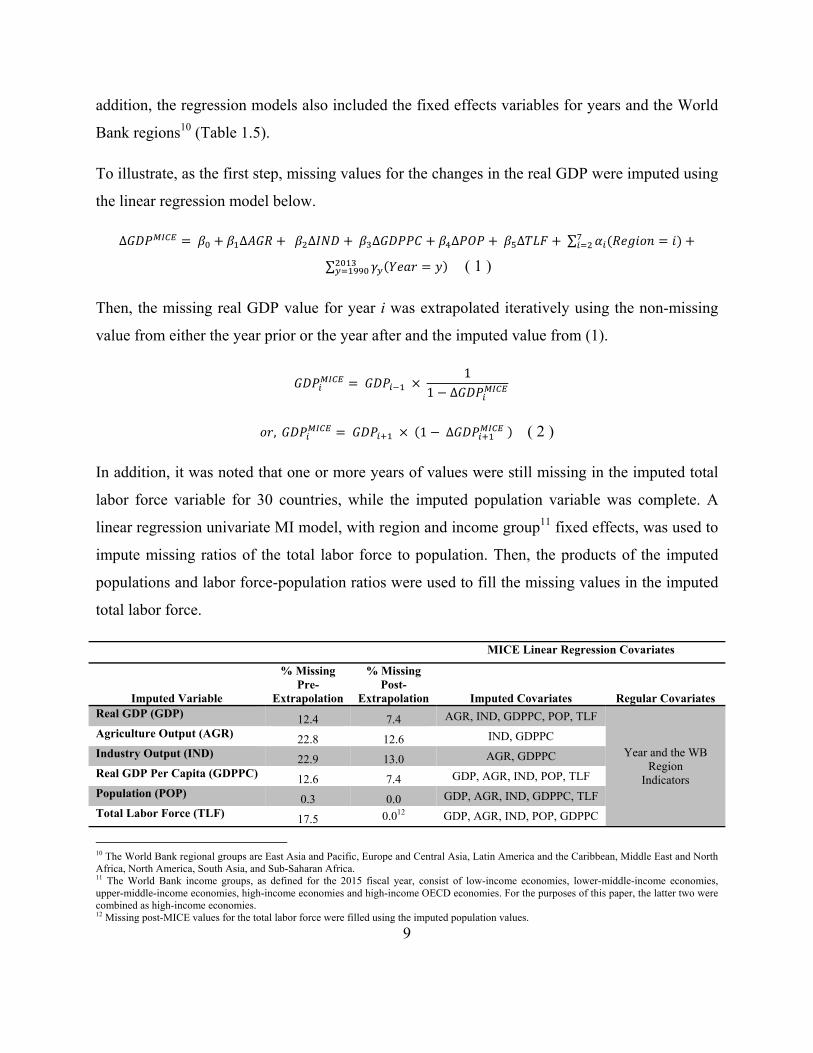
addition, the regression models also included the fixed effects variables for years and the World
Bank regions10 (Table 1.5).
To illustrate, as the first step, missing values for the changes in the real GDP were imputed using
the linear regression model below.
∆ ∆ ∆ ∆ ∆ ∆ ∑
∑ ( 1 )
Then, the missing real GDP value for year i was extrapolated iteratively using the non-missing
value from either the year prior or the year after and the imputed value from (1).
1
1 ∆
, 1 ∆ ( 2 )
In addition, it was noted that one or more years of values were still missing in the imputed total
labor force variable for 30 countries, while the imputed population variable was complete. A
linear regression univariate MI model, with region and income group11 fixed effects, was used to
impute missing ratios of the total labor force to population. Then, the products of the imputed
populations and labor force-population ratios were used to fill the missing values in the imputed
total labor force.
MICE Linear Regression Covariates
Imputed Variable
% Missing Pre-
Extrapolation
% Missing Post-
Extrapolation Imputed Covariates Regular Covariates Real GDP (GDP) 12.4 7.4 AGR, IND, GDPPC, POP, TLF
Year and the WB Region
Indicators
Agriculture Output (AGR) 22.8 12.6 IND, GDPPC
Industry Output (IND) 22.9 13.0 AGR, GDPPC
Real GDP Per Capita (GDPPC) 12.6 7.4 GDP, AGR, IND, POP, TLF
Population (POP) 0.3 0.0 GDP, AGR, IND, GDPPC, TLF
Total Labor Force (TLF) 17.5 0.012 GDP, AGR, IND, POP, GDPPC
10 The World Bank regional groups are East Asia and Pacific, Europe and Central Asia, Latin America and the Caribbean, Middle East and North Africa, North America, South Asia, and Sub-Saharan Africa. 11 The World Bank income groups, as defined for the 2015 fiscal year, consist of low-income economies, lower-middle-income economies, upper-middle-income economies, high-income economies and high-income OECD economies. For the purposes of this paper, the latter two were combined as high-income economies. 12 Missing post-MICE values for the total labor force were filled using the imputed population values.

10
Table 1.5: Extrapolation of missing independent variable values using MICE
Step 3: Extrapolation of missing dependent variable values
For 37 out of 39 selected countries, at least one fatal occupational injury count was missing.
Missing counts were extrapolated (Table 1.2, fourth column) separately for each of these 37
countries by applying the univariate multiple imputation method to the log of the fatal-cases-to-
labor-force ratio, with year as the covariate. Then, the imputed ratios were multiplied by labor
force to obtain the extrapolated values of the fatal occupational injury counts.
Step 4: Out-of-sample prediction
With almost completely imputed predictor variables (Table 1.5) and the completely imputed
outcome variable, the next step involved using the predictive model on the selected countries and
then using the estimates to predict the fatal occupational injury counts for the countries whose
reported counts was either missing or deemed unreliable.
Poisson and negatively binomial are the two most commonly used distributions to model count
data as dependent variables. In this particular context of analyzing occupational injury counts,
both Poisson (Bailer, Reed and Stayner, 1997; Bailer et al., 1998) and negative binomial models
(Ruser, 1991; Strong and Zimmerman, 2005) have been used. Considering the overdispersion
suggested by the differences in unconditional mean and variance of the counts reported by the
selected countries (Appendix IV), a Poisson model was not appropriate for this paper. Instead,
the negative binomial regression model—a more generalized form of Poisson regression that
allows overdispersion–was used13, and it took the following form14 for any country in any given
year:
. . . ( 3 )
or, equivalently,
exp . . .
13 A likelihood ratio test on the overdispersion parameter further confirms that the parameter was highly likely to be nonzero and therefore, supported that the correct model to use in this case was the negative binomial one. 14 The model was selected out of several options—including splines and up to 4th degree polynomials of GDP and GDP per capita as predictors—based on the McFadden’s R2 and the Akaike’s Informational Criterion.
11
where, FC is the fatal occupational injury count, is the regression coefficient for the variable
: imputed values of real GDP, agricultural and industrial outputs as percentages of the GDP,
and the real GDP per capita. LF is the imputed total labor force and serves as the exposure
variable. In addition, to account for within country correlations, data was clustered by country.
The regression equation above was applied to each of the 100 imputed datasets. The MI estimate
of a coefficient was the average of the estimated coefficients across the 100 imputations, while
the standard errors reported were the square roots of the sum of estimated variances from the
imputations and the variance of the estimates themselves across the imputations, adjusted for the
number of imputations (Rubin, 2004):
∑
( 4 )
∑ ∑ ( 5 )
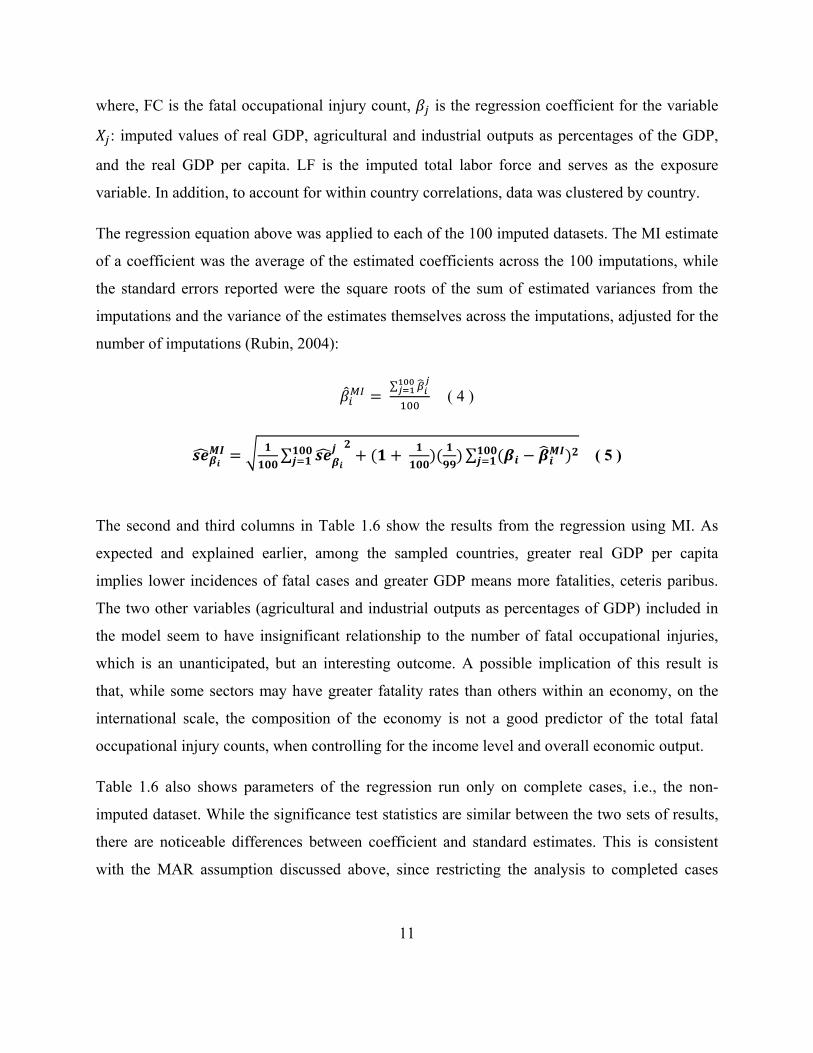
The second and third columns in Table 1.6 show the results from the regression using MI. As
expected and explained earlier, among the sampled countries, greater real GDP per capita
implies lower incidences of fatal cases and greater GDP means more fatalities, ceteris paribus.
The two other variables (agricultural and industrial outputs as percentages of GDP) included in
the model seem to have insignificant relationship to the number of fatal occupational injuries,
which is an unanticipated, but an interesting outcome. A possible implication of this result is
that, while some sectors may have greater fatality rates than others within an economy, on the
international scale, the composition of the economy is not a good predictor of the total fatal
occupational injury counts, when controlling for the income level and overall economic output.
Table 1.6 also shows parameters of the regression run only on complete cases, i.e., the non-
imputed dataset. While the significance test statistics are similar between the two sets of results,
there are noticeable differences between coefficient and standard estimates. This is consistent
with the MAR assumption discussed above, since restricting the analysis to completed cases
12
could result in biased estimates, when data is not missing completely randomly and when the
missingness is correlated with the observed data.
Complete & MI Cases (N = 975) Complete Cases (N = 526)
Coeff. Std. Err. Coeff. Std. Err.
Real GDP Per Capita -2.19E-05*** 4.74E-06 -1.82E-05*** 4.09E-06
Real GDP 3.40E-14* 1.8E-14 4.42e-14** 2.06E-14
Industry Output -0.003 0.014 0.020 0.012
Agriculture Output 0.033 0.031 0.016 0.025
Intercept -9.787*** 0.456 -10.619 0.364
* p<0.10,** p<0.05, *** p<0.001
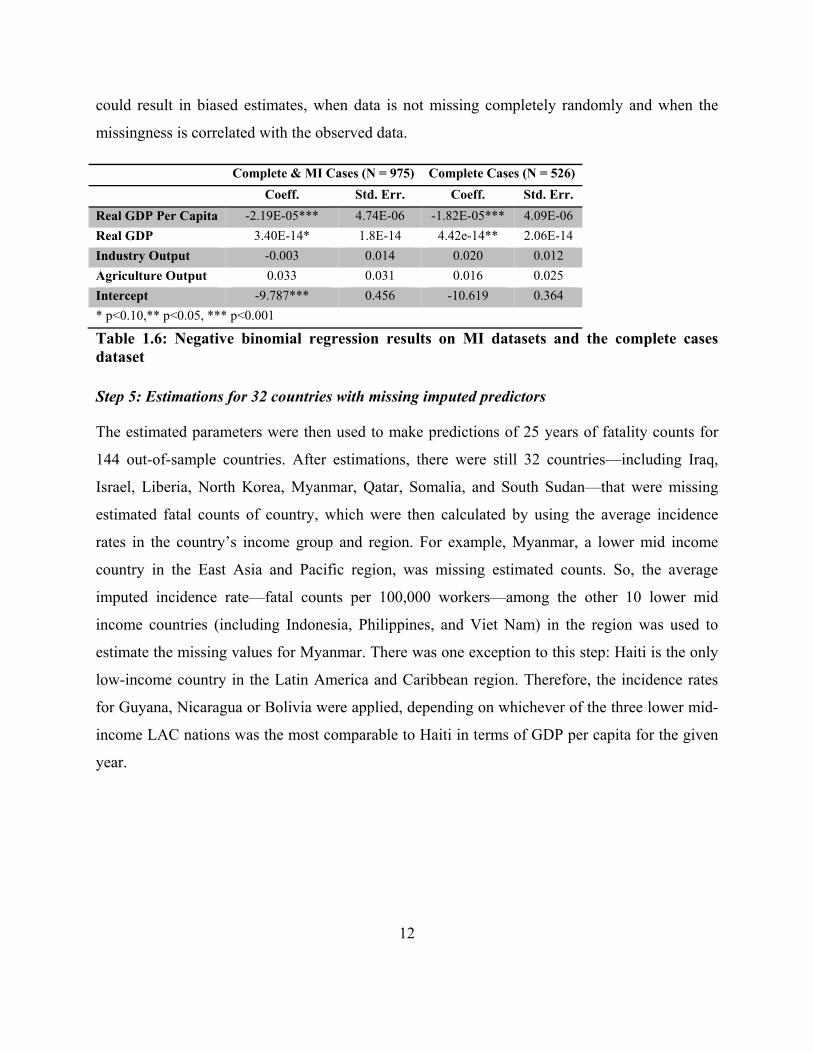
Table 1.6: Negative binomial regression results on MI datasets and the complete cases dataset
Step 5: Estimations for 32 countries with missing imputed predictors
The estimated parameters were then used to make predictions of 25 years of fatality counts for
144 out-of-sample countries. After estimations, there were still 32 countries—including Iraq,
Israel, Liberia, North Korea, Myanmar, Qatar, Somalia, and South Sudan—that were missing
estimated fatal counts of country, which were then calculated by using the average incidence
rates in the country’s income group and region. For example, Myanmar, a lower mid income
country in the East Asia and Pacific region, was missing estimated counts. So, the average
imputed incidence rate—fatal counts per 100,000 workers—among the other 10 lower mid
income countries (including Indonesia, Philippines, and Viet Nam) in the region was used to
estimate the missing values for Myanmar. There was one exception to this step: Haiti is the only
low-income country in the Latin America and Caribbean region. Therefore, the incidence rates
for Guyana, Nicaragua or Bolivia were applied, depending on whichever of the three lower mid-
income LAC nations was the most comparable to Haiti in terms of GDP per capita for the given
year.
13
Results
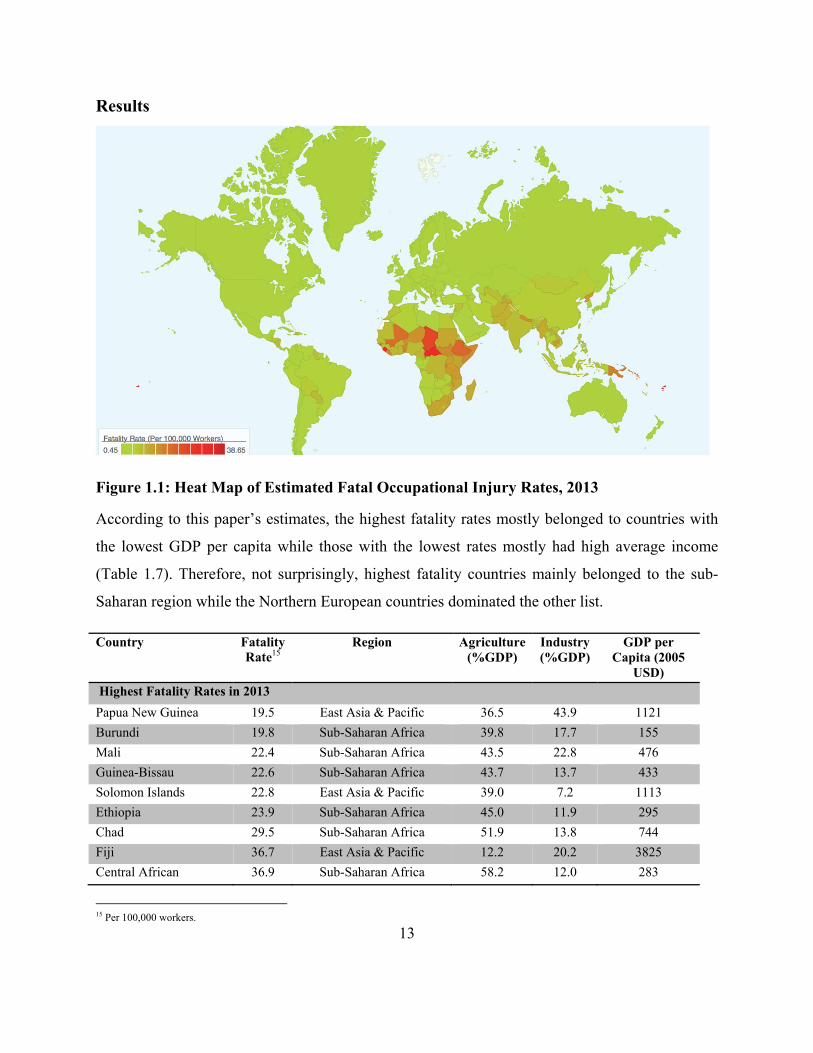
Figure 1.1: Heat Map of Estimated Fatal Occupational Injury Rates, 2013
According to this paper’s estimates, the highest fatality rates mostly belonged to countries with
the lowest GDP per capita while those with the lowest rates mostly had high average income
(Table 1.7). Therefore, not surprisingly, highest fatality countries mainly belonged to the sub-
Saharan region while the Northern European countries dominated the other list.
Country Fatality Rate15
Region Agriculture (%GDP)
Industry (%GDP)
GDP per Capita (2005
USD)
Highest Fatality Rates in 2013
Papua New Guinea 19.5 East Asia & Pacific 36.5 43.9 1121
Burundi 19.8 Sub-Saharan Africa 39.8 17.7 155
Mali 22.4 Sub-Saharan Africa 43.5 22.8 476
Guinea-Bissau 22.6 Sub-Saharan Africa 43.7 13.7 433
Solomon Islands 22.8 East Asia & Pacific 39.0 7.2 1113
Ethiopia 23.9 Sub-Saharan Africa 45.0 11.9 295
Chad 29.5 Sub-Saharan Africa 51.9 13.8 744
Fiji 36.7 East Asia & Pacific 12.2 20.2 3825
Central African 36.9 Sub-Saharan Africa 58.2 12.0 283
15 Per 100,000 workers.
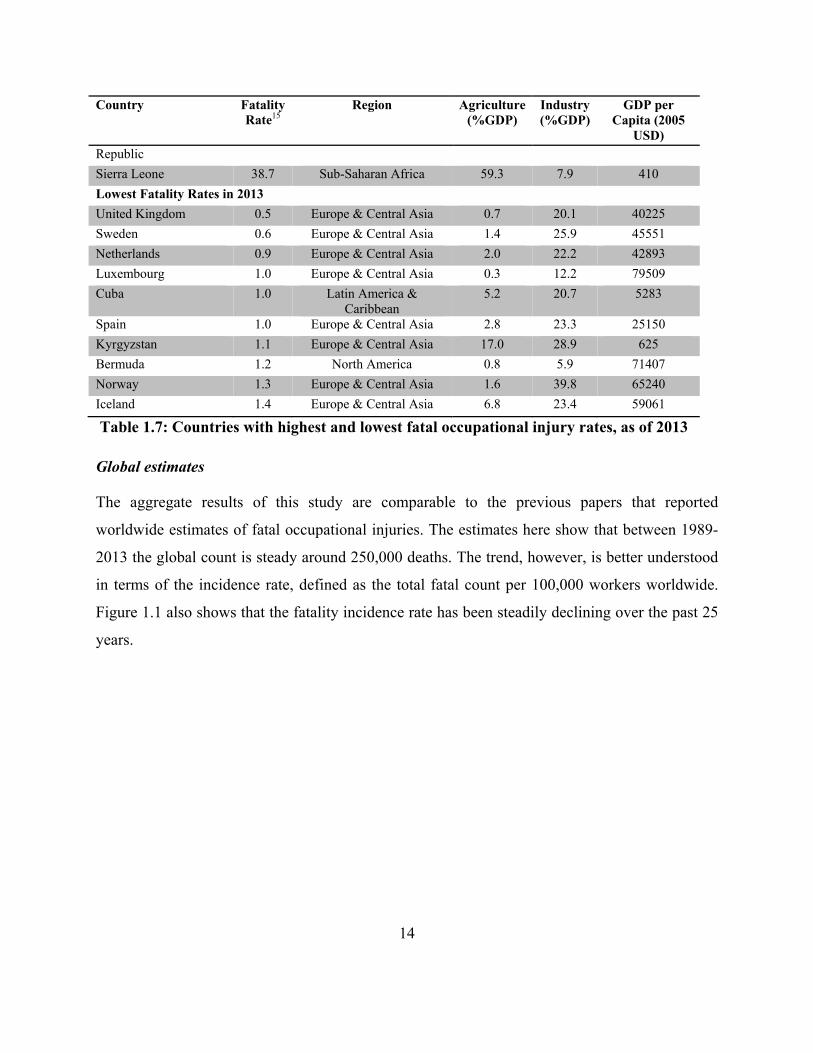
14
Country Fatality Rate15
Region Agriculture (%GDP)
Industry (%GDP)
GDP per Capita (2005
USD) Republic
Sierra Leone 38.7 Sub-Saharan Africa 59.3 7.9 410
Lowest Fatality Rates in 2013
United Kingdom 0.5 Europe & Central Asia 0.7 20.1 40225
Sweden 0.6 Europe & Central Asia 1.4 25.9 45551
Netherlands 0.9 Europe & Central Asia 2.0 22.2 42893
Luxembourg 1.0 Europe & Central Asia 0.3 12.2 79509
Cuba 1.0 Latin America & Caribbean
5.2 20.7 5283
Spain 1.0 Europe & Central Asia 2.8 23.3 25150
Kyrgyzstan 1.1 Europe & Central Asia 17.0 28.9 625
Bermuda 1.2 North America 0.8 5.9 71407
Norway 1.3 Europe & Central Asia 1.6 39.8 65240
Iceland 1.4 Europe & Central Asia 6.8 23.4 59061
Table 1.7: Countries with highest and lowest fatal occupational injury rates, as of 2013
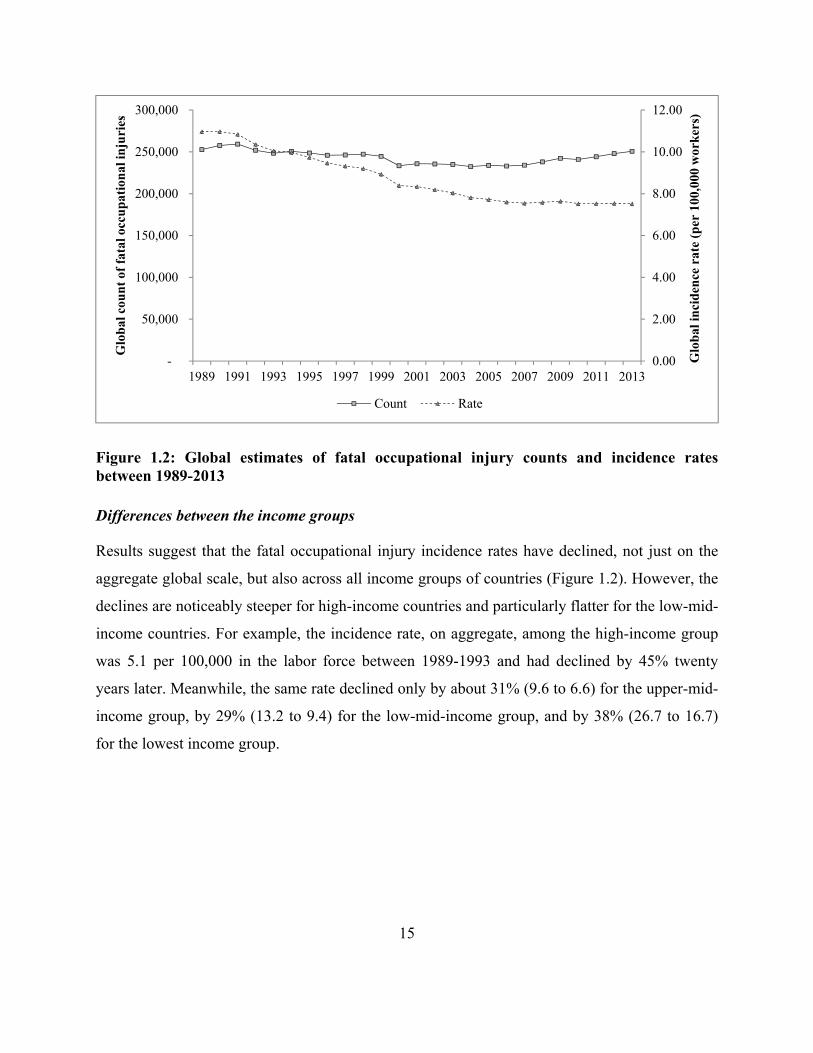
Global estimates
The aggregate results of this study are comparable to the previous papers that reported
worldwide estimates of fatal occupational injuries. The estimates here show that between 1989-
2013 the global count is steady around 250,000 deaths. The trend, however, is better understood
in terms of the incidence rate, defined as the total fatal count per 100,000 workers worldwide.
Figure 1.1 also shows that the fatality incidence rate has been steadily declining over the past 25
years.
15
Figure 1.2: Global estimates of fatal occupational injury counts and incidence rates between 1989-2013
Differences between the income groups
Results suggest that the fatal occupational injury incidence rates have declined, not just on the
aggregate global scale, but also across all income groups of countries (Figure 1.2). However, the
declines are noticeably steeper for high-income countries and particularly flatter for the low-mid-
income countries. For example, the incidence rate, on aggregate, among the high-income group
was 5.1 per 100,000 in the labor force between 1989-1993 and had declined by 45% twenty
years later. Meanwhile, the same rate declined only by about 31% (9.6 to 6.6) for the upper-mid-
income group, by 29% (13.2 to 9.4) for the low-mid-income group, and by 38% (26.7 to 16.7)
for the lowest income group.
0.00
2.00
4.00
6.00
8.00
10.00
12.00
-
50,000
100,000
150,000
200,000
250,000
300,000
1989 1991 1993 1995 1997 1999 2001 2003 2005 2007 2009 2011 2013
Glo
bal
inci
den
ce r
ate
(per
100
,000
wor
ker
s)
Glo
bal
cou
nt
of f
atal
occ
up
atio
nal
inju
ries
Count Rate

16
Figure 1.3: Fatal occupational injury rates aggregated across five-year periods by income groups
Aggregating country-level fatal occupational injury counts by income groups reveals further
insights regarding how the occupational fatalities are distributed around the world. Together,
countries of the two mid-income groups bear the burden of three-quarters of the global work
fatalities (Figure 1.3). To put this in context, in 2013, the total GDP for these two sets of
countries accounted for less than 25% of the world’s aggregate. The low-income countries also
bear the burden greatly disproportional to their economic output: about 17% of total work
fatalities in 2013 against 0.4% of the world’s GDP. A closer look of Figure 1.3 also shows that
over the past 25 years, the distribution of fatal occupational injuries may have shifted slightly
from higher income countries to lower income countries. This is consistent with our finding that
declines in incidence rates were less steep for poorer countries.
5.1 4.3 3.7 3.2 2.8
9.68.3
7.3 6.8 6.6
13.212.1
10.99.6 9.4
27.0
23.4
17.716.4 16.9
0.0
5.0
10.0
15.0
20.0
25.0
30.0
1989-1993 1994-1998 1999-2003 2004-2008 2009-2013
Inci
den
ce r
ate
per
100
,000
wor
ker
s
High Income Countries Upper Mid Income Countries Low Mid Income Countries Low Income Countries
17
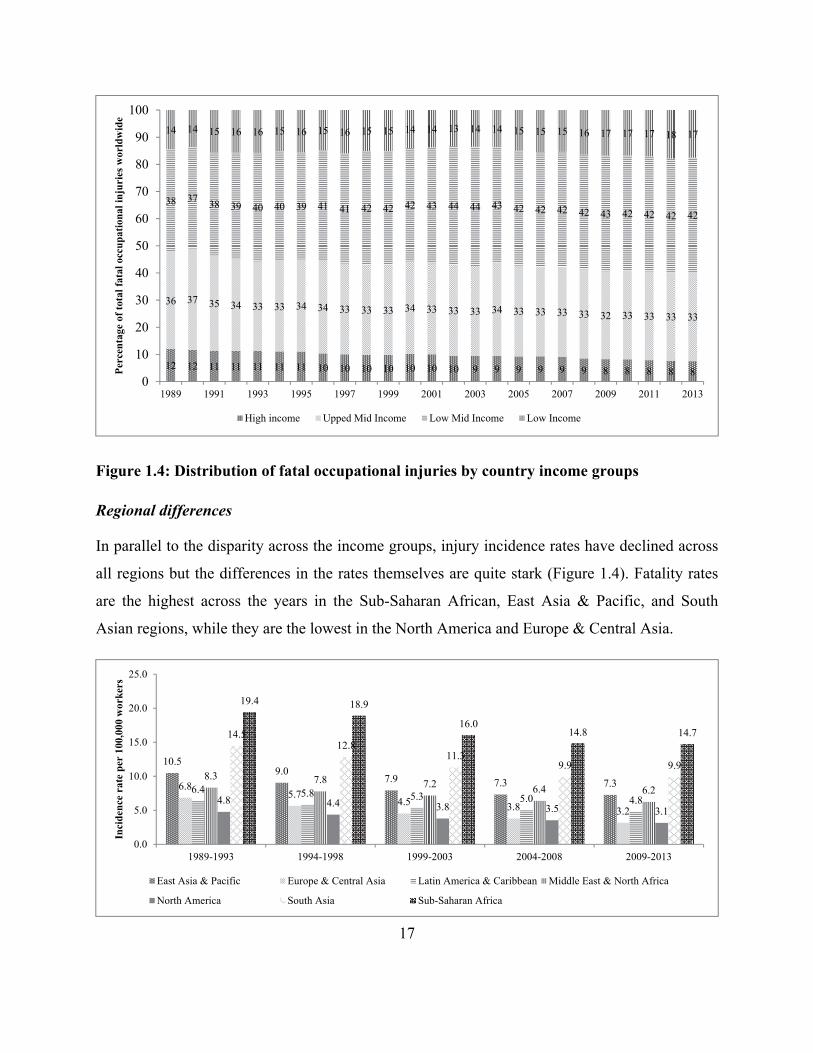
Figure 1.4: Distribution of fatal occupational injuries by country income groups
Regional differences
In parallel to the disparity across the income groups, injury incidence rates have declined across
all regions but the differences in the rates themselves are quite stark (Figure 1.4). Fatality rates
are the highest across the years in the Sub-Saharan African, East Asia & Pacific, and South
Asian regions, while they are the lowest in the North America and Europe & Central Asia.
12 12 11 11 11 11 11 10 10 10 10 10 10 10 9 9 9 9 9 9 8 8 8 8 8
36 37 35 34 33 33 34 34 33 33 33 34 33 33 33 34 33 33 33 33 32 33 33 33 33
38 3738 39 40 40 39 41 41 42 42 42 43 44 44 43 42 42 42 42 43 42 42 42 42
14 14 15 16 16 15 16 15 16 15 15 14 14 13 14 14 15 15 15 16 17 17 17 18 17
0
10
20
30
40
50
60
70
80
90
100
1989 1991 1993 1995 1997 1999 2001 2003 2005 2007 2009 2011 2013
Per
cen
tage
of
tota
l fat
al o
ccu
pat
ion
al in
juri
es w
orld
wid
e
High income Upped Mid Income Low Mid Income Low Income
10.59.0
7.9 7.3 7.36.85.7
4.5 3.8 3.2
6.4 5.8 5.3 5.0 4.8
8.3 7.8 7.2 6.4 6.24.8 4.4 3.8 3.5 3.1
14.512.8
11.39.9 9.9
19.4 18.9
16.014.8 14.7
0.0
5.0
10.0
15.0
20.0
25.0
1989-1993 1994-1998 1999-2003 2004-2008 2009-2013
Inci
den
ce r
ate
per
100
,000
wor
kers
East Asia & Pacific Europe & Central Asia Latin America & Caribbean Middle East & North Africa
North America South Asia Sub-Saharan Africa

18
Figure 1.5: Fatal occupational injury rates aggregated across five-year periods by geographical region
The three regions with the highest fatality rates are also the most populous ones. Therefore,
unsurprisingly, a very high majority (around 80%) of the fatal occupational injuries occur in
these regions, even though together these regions produce only 29% of the global economic
output in dollar value. Using this metric, it can be inferred that the burden falls most
disproportionately on South Asia and Sub Saharan Africa, where respectively 3% and 2% of
global output is produced but 26% and 21% of the fatal work injuries occur.
Figure 1.6: Distribution of fatal occupational injuries by geographical region
Discussion
Estimates presented by this paper come with some caveats. First of all, the estimated counts are
based on statistics reported by a small number of countries, which means any inherent bias in the
sample used is also transmitted to the fatality counts imputed for the remaining countries. It is
generally understood that the official country-level work-injury figures—as discussed earlier in
the paper—underreport the actual numbers, not just in the developing countries, but also in
41 42 40 39 37 37 39 39 38 38 38 38 37 37 37 38 37 36 37 37 36 36 37 36 36
25 24 26 25 25 25 25 26 26 26 26 26 27 26 26 26 26 26 26 25 25 26 26 25 26
14 14 15 16 17 17 17 17 18 18 18 17 17 19 18 18 19 19 19 20 21 20 21 22 21
11 11 10 10 10 10 10 9 8 8 8 8 8 8 7 7 7 7 7 6 6 6 6 5 5
4 4 4 5 5 5 5 5 5 5 5 5 5 5 5 6 6 6 6 6 6 6 6 6 62 2 2 2 2 2 3 3 3 3 3 3 3 3 3 3 3 3 3 3 3 3 3 3 33 3 3 3 3 3 3 3 3 3 3 3 3 3 3 3 3 3 3 2 2 2 2 2 2
0
10
20
30
40
50
60
70
80
90
100
1 3 5 7 9 11 13 15 17 19 21 23 25
Per
cen
tage
of
tota
l fat
al o
ccu
pat
ion
al in
juri
es w
orld
wid
e
East Asia & Pacific South Asia Sub-Saharan Africa Europe & Central Asia
Latin America & Caribbean Middle East & North Africa North America
19
economically advanced ones with relatively sophisticated injury accounting and aggregating
systems. Moreover, as Table 1.3 shows, the sample used is biased towards high-income and
upper-mid-income countries, with just one lower-mid-income country and not a single low-
income country represented. This sample bias is likely to further negatively skew our estimates
for the lower income countries. Unfortunately, this is an unavoidable bias, since the reported
values from the remaining countries were deemed to be unreliable. Relaxing the selection criteria
could increase the sample size and allow for greater variation. However, that would compromise
the reliability of the sample, and thus the accuracy of the estimates.
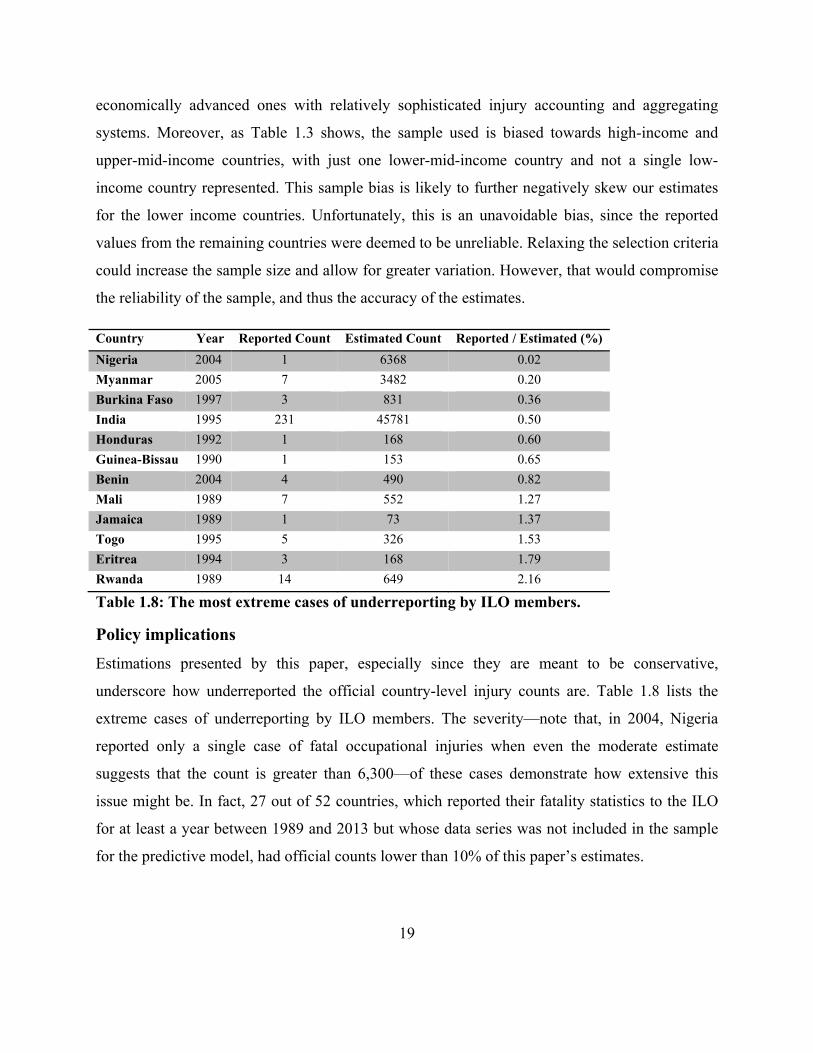
Country Year Reported Count Estimated Count Reported / Estimated (%)
Nigeria 2004 1 6368 0.02
Myanmar 2005 7 3482 0.20
Burkina Faso 1997 3 831 0.36
India 1995 231 45781 0.50
Honduras 1992 1 168 0.60
Guinea-Bissau 1990 1 153 0.65
Benin 2004 4 490 0.82
Mali 1989 7 552 1.27
Jamaica 1989 1 73 1.37
Togo 1995 5 326 1.53
Eritrea 1994 3 168 1.79
Rwanda 1989 14 649 2.16
Table 1.8: The most extreme cases of underreporting by ILO members.
Policy implications
Estimations presented by this paper, especially since they are meant to be conservative,
underscore how underreported the official country-level injury counts are. Table 1.8 lists the
extreme cases of underreporting by ILO members. The severity—note that, in 2004, Nigeria
reported only a single case of fatal occupational injuries when even the moderate estimate
suggests that the count is greater than 6,300—of these cases demonstrate how extensive this
issue might be. In fact, 27 out of 52 countries, which reported their fatality statistics to the ILO
for at least a year between 1989 and 2013 but whose data series was not included in the sample
for the predictive model, had official counts lower than 10% of this paper’s estimates.

20
Such severe underreporting is often a direct result of lack of official injury reporting and data
aggregation systems in developing countries. Unfortunately, unavailability of official counts or
estimates also means that it becomes difficult to place occupational injuries on the public policy
priorities map. As a result, in countries that bear the most of the burden, this issue has received
very little attention, which could be one of the reasons why the occupational fatality counts in
lower income countries have remained steady, if not risen, over the years.
Figure 1.7: Fatal occupational injuries aggregated across five-year periods by income groups
Conclusion
Occupational injuries impose significant global burden, which is distributed disproportionately
among lower income countries and among Asian and African regions. This paper’s estimates,
which are conservative by necessity, reveal the severity of underreporting by countries of their
fatal occupational risks. Every day, thousands of workers around the world die due to work-
related accidents. However, policymakers may not have comprehended the epidemic nature of
this issue, as demonstrated by the lack of any or reliable data aggregating system in most of the
countries.
Country Reported Fatalities
Estimated Fatalities
Estimated Fatality
Rate
Estimation Method
146874 130129 116194 107242 97087
444006415717
395999 390606 399268
488475 502934 507219 495562518672
190546 189970165094 178110
211008
0
200000
400000
600000
1989-1993 1994-1998 1999-2003 2004-2008 2009-2013
High Income Countries Upper Mid Income Countries Low Mid Income Countries Low Income Countries

21
Country Reported Fatalities
Estimated Fatalities
Estimated Fatality
Rate
Estimation Method
Afghanistan 901 11.5 Imputed, observed predictors
Albania 132 10.4 Imputed, observed predictors
Algeria 803 6.5 Imputed, observed predictors
American Samoa 3 11.0 Estimated w/ comparable countries' rates
Andorra 1 2.4 Imputed, extrapolated predictors
Angola 491 6.2 Imputed, observed predictors
Antigua and Barbuda 2 4.5 Imputed, extrapolated predictors
Argentina 728 3.8 Extrapolated count, observed LF
Armenia 151 10.0 Imputed, observed predictors
Aruba 2 3.3 Imputed, extrapolated predictors
Australia 311 2.5 Imputed, observed predictors
Austria 91 91 2.1 Reported count
Azerbaijan 66 254 5.2 Imputed, observed predictors
Bahamas 8 3.6 Imputed, observed predictors
Bahrain 36 4.9 Extrapolated count, observed LF
Bangladesh 6,800 8.8 Imputed, observed predictors
Barbados 0 7 4.2 Imputed, extrapolated predictors
Belarus 163 3.6 Extrapolated count, observed LF
Belgium 119 2.4 Imputed, observed predictors
Belize 12 8.1 Imputed, observed predictors
Benin 766 17.8 Imputed, observed predictors
Bermuda 1.2 Imputed, extrapolated predictors
Bhutan 33 8.3 Imputed, observed predictors
Bolivia 381 7.6 Imputed, observed predictors
Bosnia and Herzegovina 93 6.4 Imputed, observed predictors
Botswana 64 6.2 Extrapolated count, observed LF
Brazil 6,116 5.8 Imputed, observed predictors
Brunei Darussalam 6 2.8 Imputed, observed predictors
Bulgaria 179 5.4 Extrapolated count, observed LF
Burkina Faso 828 10.8 Imputed, observed predictors
Burundi 921 19.8 Imputed, observed predictors
Cabo Verde 16 6.7 Imputed, observed predictors
Cambodia 1,336 15.5 Imputed, observed predictors
Cameroon 956 10.7 Imputed, observed predictors
Canada 491 2.5 Imputed, extrapolated predictors
Cayman Islands 1 4.0 Estimated w/ comparable countries' rates
Central African Republic 806 36.9 Imputed, observed predictors
Chad 1,398 29.5 Imputed, observed predictors
Channel Islands 2 2.3 Estimated w/ comparable countries' rates
Chile 236 2.7 Extrapolated count, observed LF
China 58,200 7.3 Imputed, observed predictors

22
Country Reported Fatalities
Estimated Fatalities
Estimated Fatality
Rate
Estimation Method
Colombia 494 2.1 Extrapolated count, observed LF
Comoros 43 17.6 Imputed, observed predictors
Congo, Dem. Rep. 2,803 10.5 Imputed, observed predictors
Congo, Rep. 91 5.0 Imputed, observed predictors
Costa Rica 130 5.5 Imputed, observed predictors
Croatia 27 88 4.7 Imputed, observed predictors
Cuba 53 1.0 Extrapolated count, observed LF
Curacao 3 4.0 Estimated w/ comparable countries' rates
Cyprus 9 9 1.5 Reported count
Czech Republic 143 2.7 Extrapolated count, observed LF
Côte d'Ivoire 854 10.6 Imputed, observed predictors
Denmark 62 2.1 Extrapolated count, observed LF
Djibouti 18 5.9 Imputed, extrapolated predictors
Dominica 3 8.3 Imputed, extrapolated predictors
Dominican Republic 271 5.7 Imputed, observed predictors
Ecuador 476 6.3 Imputed, observed predictors
Egypt 2,172 7.8 Imputed, observed predictors
El Salvador 191 6.9 Imputed, observed predictors
Equatorial Guinea 17 4.2 Estimated w/ comparable countries' rates
Eritrea 261 8.5 Imputed, extrapolated predictors
Estonia 12 1.7 Extrapolated count, observed LF
Ethiopia 10,779 23.9 Imputed, observed predictors
Faeroe Islands 1 2.3 Estimated w/ comparable countries' rates
Fiji 127 36.7 Extrapolated count, observed LF
Finland 66 2.4 Imputed, observed predictors
France 836 2.8 Imputed, observed predictors
French Polynesia 3 2.7 Estimated w/ comparable countries' rates
Gabon 29 4.7 Imputed, observed predictors
Gambia 140 18.1 Estimated w/ comparable countries' rates
Georgia 163 6.8 Imputed, observed predictors
Germany 1,045 2.5 Imputed, observed predictors
Ghana 1,176 10.6 Imputed, observed predictors
Greece 207 4.1 Imputed, observed predictors
Greenland 1 2.3 Estimated w/ comparable countries' rates
Grenada 2 5.6 Imputed, extrapolated predictors
Guam 2 2.7 Estimated w/ comparable countries' rates
Guatemala 444 7.1 Imputed, observed predictors
Guinea 475 9.7 Imputed, observed predictors
Guinea-Bissau 165 22.6 Imputed, observed predictors
Guyana 29 9.1 Imputed, observed predictors
Haiti 334 7.6 Estimated w/ comparable countries' rates
23
Country Reported Fatalities
Estimated Fatalities
Estimated Fatality
Rate
Estimation Method
Honduras 253 7.7 Imputed, observed predictors
Hong Kong, China 100 2.7 Imputed, observed predictors
Hungary 75 1.7 Extrapolated count, observed LF
Iceland 3 1.4 Extrapolated count, observed LF
India 45,722 9.5 Imputed, observed predictors
Indonesia 9,109 7.6 Imputed, observed predictors
Iran, Islamic Rep. of 1,778 6.7 Imputed, extrapolated predictors
Iraq 464 5.5 Estimated w/ comparable countries' rates
Ireland 40 40 1.8 Reported count
Isle of Man 1 2.3 Estimated w/ comparable countries' rates
Israel 128 3.5 Estimated w/ comparable countries' rates
Italy 806 3.2 Imputed, observed predictors
Jamaica 74 5.9 Imputed, extrapolated predictors
Japan 1,832 2.8 Imputed, observed predictors
Jordan 58 3.3 Extrapolated count, observed LF
Kazakhstan 206 2.2 Extrapolated count, observed LF
Kenya 2,380 13.8 Imputed, observed predictors
Kiribati 5 12.5 Imputed, extrapolated predictors
Korea, Dem. Rep. 2,361 15.5 Estimated w/ comparable countries' rates
Korea, Republic of 871 3.3 Imputed, observed predictors
Kosovo 58 7.8 Imputed, extrapolated predictors
Kuwait 41 2.3 Imputed, extrapolated predictors
Kyrgyzstan 29 29 1.1 Reported count
Lao PDR 410 12.0 Imputed, observed predictors
Latvia 37 3.5 Extrapolated count, observed LF
Lebanon 97 5.7 Imputed, observed predictors
Lesotho 53 6.1 Imputed, observed predictors
Liberia 274 18.1 Estimated w/ comparable countries' rates
Libya 103 4.4 Imputed, extrapolated predictors
Liechtenstein 2.3 Estimated w/ comparable countries' rates
Lithuania 60 60 3.9 Reported count
Luxembourg 2 1.0 Imputed, observed predictors
Macau, China 6 1.7 Imputed, extrapolated predictors
Macedonia, The former Yugoslav Rep. of 67 7.0 Imputed, observed predictors
Madagascar 1,487 12.7 Imputed, observed predictors
Malawi 1,181 15.9 Imputed, observed predictors
Malaysia 463 3.5 Extrapolated count, observed LF
Maldives 9 5.5 Imputed, observed predictors
Mali 1,191 22.4 Imputed, extrapolated predictors
Malta 7 3.8 Imputed, extrapolated predictors
Marshall Islands 3 11.0 Estimated w/ comparable countries' rates

24
Country Reported Fatalities
Estimated Fatalities
Estimated Fatality
Rate
Estimation Method
Mauritania 121 9.6 Imputed, observed predictors
Mauritius 30 5.0 Imputed, observed predictors
Mexico 1,245 2.3 Extrapolated count, observed LF
Micronesia, Fed. Sts. 6 14.2 Imputed, extrapolated predictors
Moldova, Republic of 36 103 8.5 Imputed, observed predictors
Monaco 2.3 Estimated w/ comparable countries' rates
Mongolia 105 8.1 Imputed, observed predictors
Montenegro 17 6.6 Imputed, observed predictors
Morocco 1,017 8.5 Imputed, observed predictors
Mozambique 1,601 13.5 Imputed, observed predictors
Myanmar 4,014 12.8 Estimated w/ comparable countries' rates
Namibia 49 5.7 Imputed, observed predictors
Nepal 2,565 16.9 Imputed, observed predictors
Netherlands 78 0.9 Extrapolated count, observed LF
New Caledonia 3 2.7 Estimated w/ comparable countries' rates
New Zealand 94 3.9 Extrapolated count, observed LF
Nicaragua 245 9.5 Imputed, observed predictors
Niger 981 17.0 Imputed, observed predictors
Nigeria 5,608 10.3 Imputed, observed predictors
Northern Mariana Islands 1 2.7 Estimated w/ comparable countries' rates
Norway 35 1.3 Extrapolated count, observed LF
Oman 65 3.6 Imputed, extrapolated predictors
Pakistan 7,831 11.9 Imputed, observed predictors
Palau 5.1 Imputed, extrapolated predictors
Panama 91 5.0 Imputed, extrapolated predictors
Papua New Guinea 641 19.5 Imputed, extrapolated predictors
Paraguay 326 10.1 Imputed, observed predictors
Peru 977 5.9 Imputed, extrapolated predictors
Philippines 3,042 7.2 Imputed, observed predictors
Poland 841 4.5 Imputed, observed predictors
Portugal 207 3.8 Imputed, observed predictors
Puerto Rico 35 2.8 Imputed, observed predictors
Qatar 56 3.5 Estimated w/ comparable countries' rates
Romania 223 223 2.3 Reported count
Russian Federation 1,697 2.2 Extrapolated count, observed LF
Rwanda 927 16.1 Imputed, observed predictors
Saint Lucia 5 5.3 Imputed, observed predictors
Saint Vincent and the Grenadines 3 6.0 Imputed, observed predictors
Samoa 6 12.8 Estimated w/ comparable countries' rates
San Marino 2.3 Estimated w/ comparable countries' rates
Sao Tome and Principe 7 10.4 Imputed, extrapolated predictors
25
Country Reported Fatalities
Estimated Fatalities
Estimated Fatality
Rate
Estimation Method
Saudi Arabia 385 3.4 Imputed, observed predictors
Senegal 560 9.2 Imputed, observed predictors
Serbia 199 6.3 Imputed, observed predictors
Seychelles 2 4.2 Imputed, extrapolated predictors
Sierra Leone 926 38.7 Imputed, observed predictors
Singapore 59 59 1.9 Reported count
Sint Maarten (Dutch part) 1 4.0 Estimated w/ comparable countries' rates
Slovakia 59 2.1 Extrapolated count, observed LF
Slovenia 18 1.8 Extrapolated count, observed LF
Solomon Islands 51 22.8 Imputed, extrapolated predictors
Somalia 564 18.1 Estimated w/ comparable countries' rates
South Africa 2,748 14.1 Extrapolated count, observed LF
South Sudan 823 18.1 Estimated w/ comparable countries' rates
Spain 232 232 1.0 Reported count
Sri Lanka 141 588 7.0 Imputed, observed predictors
St. Kitts and Nevis 1 4.3 Imputed, extrapolated predictors
St. Martin (French part) 1 4.0 Estimated w/ comparable countries' rates
Sudan 1,626 13.6 Imputed, observed predictors
Suriname 12 5.5 Imputed, observed predictors
Swaziland 41 9.1 Extrapolated count, observed LF
Sweden 33 33 0.6 Reported count
Switzerland 70 1.5 Imputed, observed predictors
Syrian Arab Republic 579 9.0 Imputed, extrapolated predictors
Taiwan, China 319 2.7 Estimated w/ comparable countries' rates
Tajikistan 460 12.9 Imputed, observed predictors
Tanzania, United Republic of 3,760 15.5 Imputed, observed predictors
Thailand 2,724 6.9 Imputed, observed predictors
Timor-Leste 23 9.7 Imputed, extrapolated predictors
Togo 583 18.1 Imputed, observed predictors
Tonga 4 9.9 Imputed, observed predictors
Trinidad and Tobago 24 3.5 Imputed, observed predictors
Tunisia 249 6.3 Imputed, observed predictors
Turkey 1,588 5.8 Imputed, observed predictors
Turkmenistan 168 7.3 Imputed, extrapolated predictors
Turks and Caicos Islands 1 4.0 Estimated w/ comparable countries' rates
Tuvalu 10.7 Imputed, extrapolated predictors
Uganda 2,119 14.1 Imputed, extrapolated predictors
Ukraine 652 2.8 Extrapolated count, observed LF
United Arab Emirates 177 2.8 Imputed, observed predictors
United Kingdom 148 148 0.5 Reported count
United States 4,864 3.1 Extrapolated count, observed LF
26
Country Reported Fatalities
Estimated Fatalities
Estimated Fatality
Rate
Estimation Method
Uruguay 51 105 6.0 Imputed, observed predictors
Uzbekistan 1,251 9.4 Imputed, observed predictors
Vanuatu 15 13.2 Imputed, observed predictors
Venezuela, Bolivarian Rep. of 726 5.1 Imputed, extrapolated predictors
Viet Nam 4,845 9.0 Imputed, observed predictors
Virgin Islands (US) 2 4.0 Estimated w/ comparable countries' rates
West Bank and Gaza Strip 61 6.0 Imputed, observed predictors
Yemen 476 6.7 Imputed, extrapolated predictors
Zambia 420 6.8 Imputed, observed predictors
Zimbabwe 558 7.5 Imputed, observed predictors
Table 1.9: Country-level fatal occupational injury estimates, 2013

27
Appendices
Appendix I: Methodology used to estimate country-level annual occupational injury counts

28
Appendix II: Illustrations of extrapolated predictor values, averaged across 100 imputations
Country: Afghanistan
0.00E+00
5.00E+09
1.00E+10
1.50E+10
1989 1991 1993 1995 1997 1999 2001 2003 2005 2007 2009 2011 2013
Real GDP (2005 US$)
Avg. Extrapolated Observed
0
100
200
300
400
500
1989 1991 1993 1995 1997 1999 2001 2003 2005 2007 2009 2011 2013
Real GDP Per Capita (2005 US$)
Avg. Extrapolated Observed
0
10
20
30
40
50
60
70
1989 1991 1993 1995 1997 1999 2001 2003 2005 2007 2009 2011 2013
Agricultural Output (%GDP)
Observed Avg. Extrapolated
0
10
20
30
40
1989 1991 1993 1995 1997 1999 2001 2003 2005 2007 2009 2011 2013
Industrial Output (%GDP)
Observed Avg. Extrapolated

29
Appendix III: Illustrations of extrapolated fatality counts for sampled countries, averaged
across 100 imputations
0200400600800
100012001400
1989 1991 1993 1995 1997 1999 2001 2003 2005 2007 2009 2011 2013
Argentina
Imputed Observed
0
20
40
60
80
100
1989 1991 1993 1995 1997 1999 2001 2003 2005 2007 2009 2011 2013
Denmark
Imputed Observed
0
200
400
600
800
1000
1989 1991 1993 1995 1997 1999 2001 2003 2005 2007 2009 2011 2013
Malaysia
Observed Imputed

30
Appendix IV: Evidence of Overdispersion of the Fatal Counts in the Predictive Model Sample
Fatal Counts (Observed and Imputed) Country Mean Variance Variance/Mean Argentina 923 20793 22.52 Austria 145 1175 8.08 Bahrain 20 93 4.71 Belarus 276 7782 28.22 Botswana 45 453 10.08 Bulgaria 133 928 6.96 Chile 306 2697 8.83 Colombia 443 3232 7.29 Cuba 115 2295 19.91 Cyprus 16 30 1.82 Czech Republic 211 2462 11.65 Denmark 69 60 0.87 Estonia 34 482 13.99 Fiji 116 121 1.04 Hungary 172 10529 61.30 Iceland 4 2 0.50 Ireland 56 220 3.90 Jordan 47 333 7.11 Kazakhstan 462 74472 161.17 Kyrgyzstan 55 1858 33.86 Latvia 64 691 10.83 Lithuania 98 1101 11.20 Malaysia 491 8982 18.30 Mexico 1453 21133 14.54 Netherlands 88 212 2.40 New Zealand 81 248 3.07 Norway 49 136 2.77 Romania 489 20839 42.58 Russian Federation 4543 5278682 1161.87 Singapore 68 134 1.97 Slovakia 110 2222 20.18 Slovenia 33 150 4.51 South Africa 1397 519777 372.09 Spain 849 136054 160.22 Swaziland 39 6 0.16 Sweden 70 377 5.39 Ukraine 1483 475800 320.75 United Kingdom 212 3707 17.49 United States 5847 270039 46.18
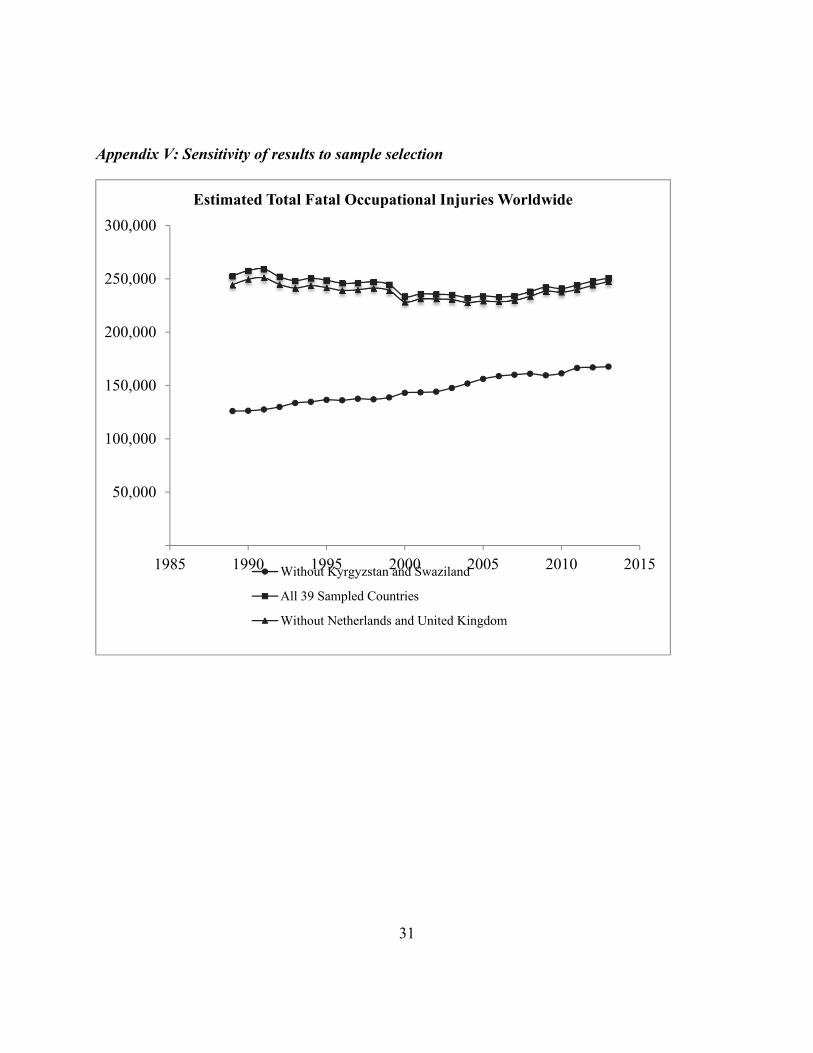
31
Appendix V: Sensitivity of results to sample selection
50,000
100,000
150,000
200,000
250,000
300,000
1985 1990 1995 2000 2005 2010 2015
Estimated Total Fatal Occupational Injuries Worldwide
Without Kyrgyzstan and Swaziland
All 39 Sampled Countries
Without Netherlands and United Kingdom

32
2. Work injury compensation policies in the Arabian Gulf countries
Abstract
This paper is an institutional review of work injury compensation policies in the Gulf Cooperation Council GCC countries and it assesses how well they protect the labor force that is primarily comprised of migrant workers. It focuses on the benefits to which injured workers and their beneficiaries are entitled and compares them against benefits awarded in other countries with similar labor composition and economy. The paper finds that work injury compensation laws in the GCC countries, as they apply to migrant workers, struggle to meet most of the objectives of a modern worker’s compensation system.
Background
The history of injury compensation is as ancient as recorded history itself. In fact, the oldest
extant legal text, the code of Ur-Nammu, contains a compensation schedule for losses of various
body parts. For example, under the 4,000-year-old code, the loss of a foot was compensated by
10 silver shekels while a lost nose was compensated by 2/3 of a silver mina (Kramer, 1981),
which amounted to 40 silver shekels during Sumerian times. Other ancient legal systems—
Greek, Roman, Arab, and Chinese—also included similar injury indemnity schemes.
The modern history of work injury laws begins with the advent of the Industrial Revolution. As
production and manufacturing processes increasingly used electricity- and steam-powered
machinery and tools starting with the late eighteenth century, occurrences of workplace accidents
and injuries rose rapidly as well. The prevalent notion regarding accidents during the
technological revolution was that they were caused by human error. Industrialists would claim
that accidents were caused by careless workers, while others would blame industrialists for being
more concerned with their profit margins than with safe working conditions (Loimer and
Guarnieri, 1996). Note that both sides of the workplace safety debate would blame the human
element.
33
The trinity of employers’ defenses
The English and American common laws prior to the late nineteenth century reflect this
commonly held notion that work accidents occurred due to negligence on someone’s part. With
no specific acts regarding work injury compensation, disputes would be settled through the tort
law, either within the judicial system or through negotiations outside the court. Regardless of
how a settlement would be reached, employers had an upper hand. Their ironclad defense would
often include one or more of the following three principles: contributory negligence, the fellow
servant rule, and the assumption of risk. Contributory negligence meant that the employer was
not responsible if the worker bore any fault for the injury. Suppose a freight conductor, who was
responsible for checking faulty equipment, fell off the train due to a loose handrail, then his
employer, the Railroad Company, would not be held liable. Such was the case in Martin v. the
Wabash Railroad in 1905 (Kramer, 1981). The second principle, the fellow servant rule, asserted
that the employer was not responsible if a fellow worker was at fault for the injury. This rationale
was exercised in a 1842 case called Farwell v. Boston & Worcester Railroad, in which an injured
engineer of a passenger train was disallowed to recover compensation from the railroad company
because the injury was established to have occurred due to the negligence of the switch-man, a
fellow employee (Bohlen, 1926). The final principle was the assumption of risk. In other words,
the employee, by agreeing to a contract with full knowledge of the hazards involved, accepted
inherent risks and thus needed not be compensated for injuries (Guyton, 1999). The ruling judge
in the Farwell case, Massachusetts Chief Justice Lemuel Shaw, explained his decision by
applying the third rationale: “he who engages in the employment of another for the performance
of specified duties and services, for compensation, takes upon himself the natural and ordinary
risks and perils incident to the performance of such services, and in legal presumption, the
compensation is adjusted accordingly.”
Together, the trinity of defense principles described above would give an employer considerable
latitude to refuse indemnity to an injured worker. In fact, Epstein (1981) claims that this system
effectively functioned with a simple rule: no employers would have to compensate any worker
for injuries arising from any occupational accident. As explained by Prosser (1972), the
foundation for this rule was the belief in contractual freedom with assumptions of fully mobile
34
labor force, unlimited demand for labor, and free agency of the worker. In other words, since the
worker willingly and under no economic constrains accepted the risks that came with the
contract, the employer was free of liability for injuries. These assumptions regarding lack of
economic constraints also provided the basic criticisms of the common law: in reality, labor is
never completely mobile; labor demand has limits; and equally important, a worker does not
have perfect knowledge of risks involved when signing the contract.
The modern workers’ compensation system
Criticisms of the common law started to gain traction in Europe and United States towards the
end of the nineteenth century and at the turn of the next, especially with the much-condemned
high profile court cases such as those mentioned above. The existing perception regarding
workplace accidents also began to change. Workplace injuries, except for cases of willful
disregard, started to be viewed as natural consequences of industrial processes and thus
employers, not employees, should assume the costs of injuries (Haller Jr, 1988). Furthermore, as
large corporations began to replace small businesses, what became apparent was the unfairness
of a system in which an injured worker was mired in a legal battle against a large company with
a team of lawyers. For example, under the American common law practice, it was estimated that
only one out of eight workers injured in the early 20th century received compensation from their
employers. Moreover, only one-third of the indemnity won reached workers after legal expenses
(Haller Jr, 1988). In response to criticisms and changing views, the United Kingdom parliament
passed the Employers’ Liability Act of 1880. The act allowed the worker to seek compensation if
the injury resulted from defective method or machinery, or due to negligence of the fellow
worker. In Germany, a pioneering bill was passed in 1884, covering workers’ accidents through
a social insurance system, funded by a tax on the wages. This accident bill became a model
eventually adopted by compensation systems around the world. In 1897, United Kingdom
replaced the earlier act with the Workmen’s Compensation Act, which did away with liability
conditional on negligence and defined occupational injury as “personal injury by accident arising
out of and in the course of employment” (Epstein, 1981), which is a more comprehensive
definition currently used by compensation laws around the world.

35
Modern-day insurance-based compensation systems were developed in view of inequities and
inefficiencies of implementing worker’s compensation laws through court systems. Under such
systems, workers relinquish their rights to sue employers for work injuries in exchange for being
insured either through their employers or through a social security program. Most developed
nations now have at least some form of insurance to provide occupational injury compensation.
For instance, in Japan, the workforce is insured through an insurance system financed by
premiums collected from employers. In Singapore and the United Kingdom, businesses are
required to be privately insured against liabilities from workplace injuries. In United States, the
system varies by state. For example, Californian employers have to be covered either through
private insurance or through state funds while Texan employers are allowed to opt out of an
insurance scheme but they would do so at the risk of legal liability without the trinity of defenses
that was available under the common law.
The Gulf Cooperation Council Countries
The workers’ compensation laws in GCC (Gulf Cooperation Council) countries—Bahrain,
Kuwait, Oman, Qatar, Saudi Arabia, and the United Arab Emirates (UAE)— are relatively new,
and, as a result, are based on the modern perception on occupational accidents. In general, the
Gulf legal systems are a mixture of the Islamic Sharia and the English common law, reflecting
the British influence in the region until the 1970s. While the two court systems—Sharia and
civil—coexist, the former is primarily concerned with domestic and familiar issues. Therefore,
work-related issues, including occupational injuries, are adjudicated through the civil courts.
Literature review
Besides unique legal and political contexts, workers’ compensation laws in the GCC countries
are especially intriguing for because all six nations rely heavily on foreign labor. For example,
foreigners made up 95% and 85% of the total labor force in Qatar and UAE respectively (See
Appendix I). No other set of countries comes anywhere close to these figures. Now, add to this
the fact that most of the foreign workers are temporary migrants from poorest regions of the
world and have virtually no pathway to citizenships in the countries where they work in the most
36
hazardous industries. How well does a government protect an at-risk population that is not and
will never be its subject?
Studies from around the world have consistently shown greater risks of occupational fatalities
and non-fatal injuries among migrant workers than among native workers. In Europe, migrant
workers are twice as vulnerable to occupational accidents as native workers (Nygren-Krug,
2004). In the United States, industries with greatest percentages of occupational fatalities also
have the highest percentages of migrant workers (Schenker, 2010). Migrant workers are more
vulnerable to injuries because they are more willing to accept high-risk, low-reward work that
local workers refuse. In addition, language, cultural differences, poor communication and
unfamiliarity with operations machinery raise the risks.
Reports suggest that migrant workers in the GCC countries face even greater health and safety
risks due to poorer working and living conditions. It is estimated that, in Dubai alone, an average
of two Asian migrant workers die on construction sites every day (Keane and McGeehan, 2008).
Barss et al. (2009) found that 96% of occupational injury hospitalizations in UAE from 2003-
2005 were of migrant workers and concluded that occupational injuries among construction,
agricultural, and industrial workers in the country have been found to be disproportionally higher
than in other industrialized countries. Similarly, Al-Dawood (2000) found that, in Saudi Arabia,
the incidence rate of severe occupational injury requiring hospital admission was four times
higher for non-Saudi workers. Only 1.5% of those hospitalized were Saudis. A similar study in
Qatar found that 99% of trauma admissions following occupational injuries were non-Qataris.
Moreover, occupational injury incidence rates for Indian and Nepali migrant workers were
respectively about five and ten times higher than for Qatari workers (Al-Thani et al., 2015).
When occupational injuries inevitably occur, they cause great suffering and economic loss to
individuals, families, and societies. In order to mitigate this social cost, governments often focus
on the prevention and use a two-prong approach: regulation and compensation. The first prong
seeks to reduce the rate of occurrence through regulation and enforcement of safety standards,
while the second incentivizes employers to prevent injuries by imposing some of the costs on

37
them through indemnity benefits or insurance. This paper focuses on the latter instrument in the
GCC countries.
In addition to providing economic incentives for safety and injury prevention, a modern worker’s
compensation system has three other primary objectives (as identified by the 1972 report of the
U.S. National Commission on State Workmen’s Compensation Laws): (i) broad coverage of
workers and occupational injuries and diseases, (ii) significant replacement of lost income of the
injured worker, (iii) and prompt medical care and rehabilitation services for the worker. Studies
evaluating compensation programs often look at how these systems meet their objectives in
practice. This paper takes a slightly higher-level approach and instead assesses the laws
themselves for two reasons. The first one, a practical issue, is that most of the Gulf countries do
not have proper employment injury reporting and claims systems in place and thus do not have
the data needed available. In addition, it is also a herculean task to track income and experience
of injured migrant workers in the GCC countries. This difficult undertaking is paramount for any
empirical research looking at this particular issue. The second reason, equally important if not
more, is that it is not obvious if the GCC laws themselves meet the objectives defined above. If
the laws are already lacking, then the implementations of the programs therein are even more
unlikely to meet the aims of a modern compensation system.
Work injury legislations in the GCC countries
While the GCC nations, except for Oman, do not have a separate legislation for work injury
compensation, they all have at least some articles in their labor and social insurance laws (Table
2.1), which define occupational injuries and compensation for medical costs and lost earnings.
Table 2.1 also includes Singapore’s Work Injury Compensation Act (WICA) since, given the
economy’s comparable income per capita and reliance on foreign labor (Appendix I), the Act
serves a useful comparison to the laws in GCC countries.
Note that in Kuwait, Qatar, Saudi Arabia, and the UAE, foreign workers are covered only under
the labor law. Since the aim here is to assess laws as they apply to migrant workers, this paper
focuses on the labor laws for these four countries. In Bahrain and Saudi Arabia, however, both
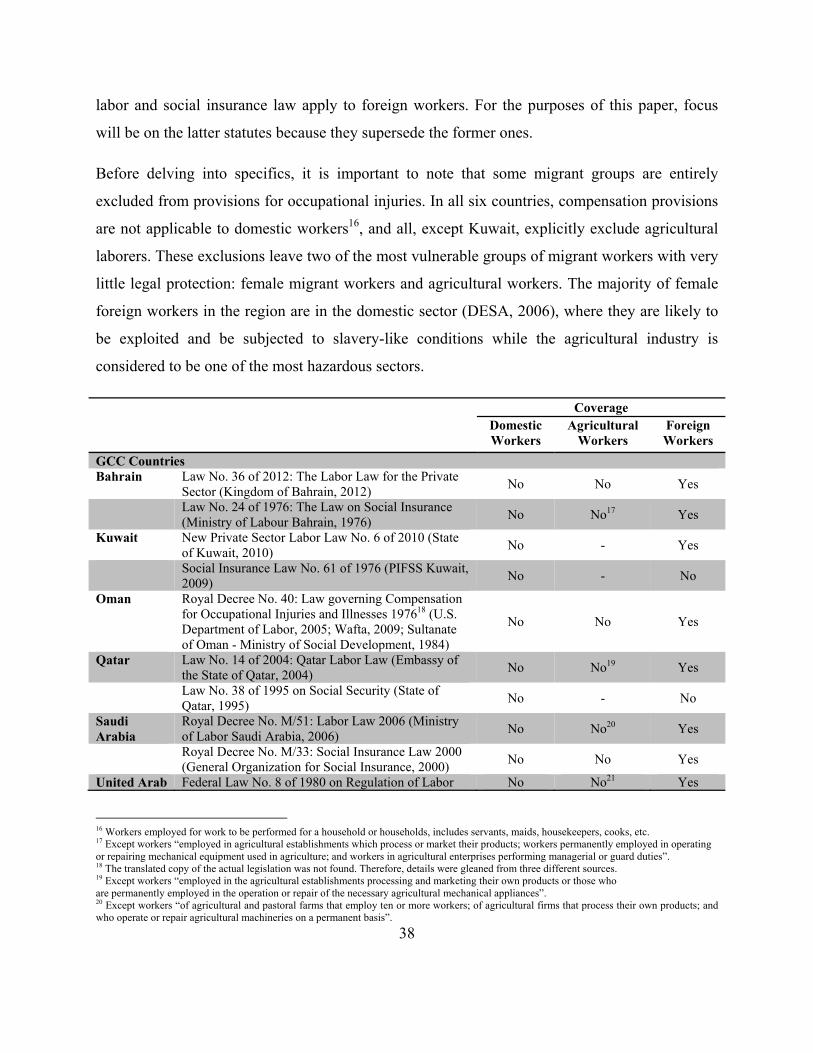
38
labor and social insurance law apply to foreign workers. For the purposes of this paper, focus
will be on the latter statutes because they supersede the former ones.
Before delving into specifics, it is important to note that some migrant groups are entirely
excluded from provisions for occupational injuries. In all six countries, compensation provisions
are not applicable to domestic workers16, and all, except Kuwait, explicitly exclude agricultural
laborers. These exclusions leave two of the most vulnerable groups of migrant workers with very
little legal protection: female migrant workers and agricultural workers. The majority of female
foreign workers in the region are in the domestic sector (DESA, 2006), where they are likely to
be exploited and be subjected to slavery-like conditions while the agricultural industry is
considered to be one of the most hazardous sectors.
Coverage Domestic Workers
Agricultural Workers
Foreign Workers
GCC Countries Bahrain Law No. 36 of 2012: The Labor Law for the Private
Sector (Kingdom of Bahrain, 2012) No No Yes
Law No. 24 of 1976: The Law on Social Insurance (Ministry of Labour Bahrain, 1976)
No No17 Yes
Kuwait New Private Sector Labor Law No. 6 of 2010 (State of Kuwait, 2010)
No - Yes
Social Insurance Law No. 61 of 1976 (PIFSS Kuwait, 2009)
No - No
Oman Royal Decree No. 40: Law governing Compensation for Occupational Injuries and Illnesses 197618 (U.S. Department of Labor, 2005; Wafta, 2009; Sultanate of Oman - Ministry of Social Development, 1984)
No No Yes
Qatar Law No. 14 of 2004: Qatar Labor Law (Embassy of the State of Qatar, 2004)
No No19 Yes
Law No. 38 of 1995 on Social Security (State of Qatar, 1995)
No - No
Saudi Arabia
Royal Decree No. M/51: Labor Law 2006 (Ministry of Labor Saudi Arabia, 2006)
No No20 Yes
Royal Decree No. M/33: Social Insurance Law 2000 (General Organization for Social Insurance, 2000)
No No Yes
United Arab Federal Law No. 8 of 1980 on Regulation of Labor No No21 Yes
16 Workers employed for work to be performed for a household or households, includes servants, maids, housekeepers, cooks, etc. 17 Except workers “employed in agricultural establishments which process or market their products; workers permanently employed in operating or repairing mechanical equipment used in agriculture; and workers in agricultural enterprises performing managerial or guard duties”. 18 The translated copy of the actual legislation was not found. Therefore, details were gleaned from three different sources. 19 Except workers “employed in the agricultural establishments processing and marketing their own products or those who are permanently employed in the operation or repair of the necessary agricultural mechanical appliances”. 20 Except workers “of agricultural and pastoral farms that employ ten or more workers; of agricultural firms that process their own products; and who operate or repair agricultural machineries on a permanent basis”.

39
Coverage Domestic Workers
Agricultural Workers
Foreign Workers
Emirates Relations (Ministry of Labour and Social Affairs, 1980)
Federal Law No. 7 of 1999 for Pension and Social Security (General Pension and Social Security Authority, 1999)
No - No
Singapore Work Injury Compensation Act, 2008 (Ministry of Manpower, 2008)
No Yes Yes
Table 2.1: List of labor and social insurance laws in the GCC countries and Singapore
Definitions of occupational injury in the GCC countries
While the definition of occupational injury varies by country, most nations characterize it as “an
injury resulting from a work-related accident or an accident in the course of employment.”
Legislations in GCC countries and Singapore use similar language and include injuries arising
due to commuting accidents under this definition (Appendix II). These laws are also consistent in
treating occupational diseases22 the same as injuries. In fact, the Bahrain Social Insurance law,
the Qatar Labor law, the Saudi Arabia Social Insurance law, and the UAE Labor law explicitly
define occupational diseases under work-related injuries.
Compensation delivery systems
A more obvious differentiation between the laws is types of delivery systems they mandate
(Table 2.2). Under the Bahraini and Saudi laws, compensation for occupational injuries are
provided through the social insurance system to which employers are required to contribute 3%
and 2% respectively. On the other hand, the Kuwaiti, Qatari, and Emirati laws set up liability
systems, in which employers are to directly compensate workers or their survivors for medical
costs and lost income resulting from temporary disability (TD), permanent disability (PD), and
death. Employers may self-insure or purchase private insurance against the liabilities. In between
these two systems are the ones under the Singaporean WICA and Omani Royal Decree No. 4023,
which while holding employers liable for compensation also mandate them to be privately
insured.
21 Except workers “employed in the agricultural corporations engaged in processing their products or those permanently engaged in operating or repairing mechanical machines required for Agriculture”. 22 Often specified as various chemical poisonings and their complications, illnesses and symptoms resulting from radioactive exposure, skin cancer, chronic inflammation and ulceration of skin or eyes, pneumoconiosis resulting from certain dusts, hearing loss, vision loss, etc. 23 Omani Royal Decree No. 40 actually covers workplace injury compensation under the social insurance system, which however is applicable only to Omanis. Employers are mandated to insure against non-Omani employees’ injuries through private insurance.

40
Laws Compensation system
Benefits Insurance Contribution (% of wages)
Conditions Voiding Entitlements
Bahrain Social Insurance Law
Social Insurance - Employer: 3% [1][2][3][4][5][6][7][8]
Kuwait Labor Law Employer’s
Liability Medical costs, TD,
PD & death - [1][6][7][8]
Oman Royal Decree No. 40
Private insurance Medical costs, TD,
PD & death - [1][6][7][8]
Qatar Labor Law Employer’s
Liability Medical costs, TD,
PD & death - [1][3][4][6][7][9]
Saudi Arabia Social Insurance Law
Social insurance - Employer: 2% -
UAE Labor Law Employer’s
Liability Medical costs, TD,
PD & death - [1][3][4][6][7][9]
Singapore WICA Private insurance Medical costs, TD,
PD & death - [1][2][6][10][11]
Conditions that void worker's entitlements 1 Intentional infliction of injury 2 Intentional mistreatment of injury 3 Refusal to abide by the medical instructions for treatment 4 Refusal of medical examinations 5 Refusals to abstain from activities health does not permit 6 Injury occurred due to acts committed under the influence of alcohol 7 Injury occurred due to acts committed under the influence of drugs 8 Injury occurred due to willful disregard of conspicuous safety instructions unless death or PD > 25% 9 Injury occurred due to willful disregard of conspicuous safety instructions 10 Injury occurred due to acts committed under the influence of drugs not prescribed by a medical practitioner 11 Injury suffered a fight or an attempted assault
Table 2.2: Occupational injury compensation systems in GCC countries and Singapore
A common feature of all these systems—or any workers’ compensation system in the world—is
that the worker is supposed to immediately report his injury to the employer, who in turn,
depending on the system, reports the injury to either the social insurance authority or the
insurance company or the labor department. It is a well-established fact that nonfatal workplace
injuries are underreported around the world, even in countries that are known to have well-
developed systems. OECD (1989) recognizes that employers may underreport injuries because
they fear greater monitoring or higher premiums. Meanwhile, employees may not report their
injuries if they fear “loss of attendance bonuses, or other personal disadvantages, such as
becoming prime candidates for redundancy”.
41
Kafala
The employee fears of personal disadvantages might be greater in the GCC countries because
they24 have visa-sponsorship systems, commonly called kafala. Under such a system, the
employer is responsible for the legal status of the worker, and thus can threaten an aggrieved
migrant employee with deportation. In a 2009 survey conducted by the World Bank, 16% of 312
migrant Nepali workers who had returned from four GCC countries—Saudi Arabia, Qatar,
U.A.E, and Kuwait—reported that their employer had threatened them with deportation or
denouncement to authorities. Furthermore, some employers may have misused their authority to
force their workers to surrender their passports: 25% of the surveyed returning workers had their
identification confiscated by their employers. Moreover, almost half of the returnees reported to
have suffered from either an occupational injury or an occupational illness and a quarter of them
faced at least some violence or abuse at work. The data also support widely believed reports of
poor enforcements of labor and contract laws (Saif, 2009). About 11% thought it was very likely
that they would have been fired had they fallen ill for a week. More egregiously, 37% of the
workers received less payment than it had been agreed upon while 24% of them had their wages
unjustly delayed. When receiving even the basic salary on time is not certain (Naithani and Jha,
2009), it can be expected that obtaining compensation benefits could be a tough proposition for
an injured migrant worker. A worker seeking to file a claim or a dispute against the employer is
also likely to encounter linguistic difficulties, since most migrant workers are from South Asia
and Southeast Asia and do not speak either Arabic or English, the languages of most official
forms and documents. To illustrate, half of the respondents in the above-mentioned survey
reported to have had linguistic difficulties at work. Even after the worker files a complaint
successfully, the employer seem to be able to simply ignore the ruling (Keane and McGeehan,
2008) due to poor enforcement.
24 Bahrain officially repealed the Kafala system in 2009, however Human Rights watchdogs report poor enforcement of the law.
42
Analysis
Employer’s incentives for safety and injury prevention
In light of the undue authority employers have over workers as well as the evidence of poor
compliance and enforcement of labor laws in the GCC countries, it becomes even more
important to look into employer’s financial incentives for injury prevention—as noted earlier, a
primary objective of a compensation system—under different types of compensation delivery
systems. In order to do so, the analytic framework developed by Victor, Cohen and Phelps
(1982) is used.
According to the framework, when considering improving safety standards of its workplace, a
profit-maximizing firm weighs the costs of investing in additional safety against the additional
benefits of doing so. Victor et al. identify two categories of firm’s marginal cost of prevention
(MCP): out-of-pocket (e.g., safety equipment, training, incentive programs) and forgone
production (e.g., lower efficiency and level of output). The model assumes that MCP remains
constant as each unit of prevention increases. On the other hand, the three most significant
marginal benefits of prevention (MBP) are lower cost of injury compensation (via lower
insurance premiums or lower liability payments), lower compensating wage differentials, and
lower inspection rate by the regulating agency. Assumes diminishing returns to investing in
prevention, and the model expects the firm to invest in safety up to the point where MCP equals
MBP (Appendix III).
The relevant portion of the framework here is MBP, particularly the injury compensation cost.
Since injuries are not foreseeable, the cost of compensation is inherently uncertain. Specifically,
MBP is driven by two uncertainties: (i) the probability of an injury, and (ii) the probability of a
successful claim by the injured worker. In other words, if injuries in the workplace are already
less likely or if it is unlikely that the worker can file a successful claim, then investment in safety
is less beneficial to the firm.
Now applying the framework to three types of compensation systems (Table 2.2) used in the
Gulf, it can be seen that, ceteris paribus, the employer’s incentives are different under each
43
system. Under the mandated private insurance system of Oman and Singapore, the employer
lowers its insurance premiums by lowering injury rates. Such incentives do not exist under the
social insurance system in place in Bahrain and Saudi Arabia, since the premium rates are tied
only to wages and not the risks. It may be argued that lower injury rates means employers can
pay lower wage differentials to workers, which means lower wages and thus lower total premium
paid to the social insurance agency. However, since premiums are only 2-3% of wages, the
employer’s savings from premium payments via the lower compensation wage differential may
be negligible.
The third system—employer’s liability—theoretically should provide employers with similar
incentives as the other two systems. However, this paper posits that the second uncertainty
driving MBP (that the injured worker may be able to file a successful claim) may have greater
influence under this system, when it is combined with the Kafala scheme. Unlike the other two
systems, the system requires that the worker seek compensation from the employer directly and
thus, as soon as an injury occurs, the worker is in a potentially adversarial situation with the
employer, who holds a considerably greater authority over the former. First, the worker
justifiably has a greater fear of “personal disadvantage” and thus is less likely to report the
injury. Secondly, even if the worker decides to file a claim, there are several reasons, including
those described above and numerous contributory negligence clauses in the laws (See column
Conditions Voiding Entitlements in Table 2.2), for the lower likelihood of successfully collecting
the compensation.

44
Figure 2.1: Employer's incentives for injury prevention under various systems
To sum the arguments made above, all things equal, an employer enjoys greater benefits from
injury prevention under a private insurance system than under the other two types of delivery
system. Figure 2.1 shows that, as a result, this system is likely to provide greater investment in
safety. One of the key difference between the private system in Oman and the social systems
employed in Bahrain and Saudi Arabia is that in the latter systems, the insurance premium is
independent of the injury rate. In order to improve employer incentives, these two nations may
want to study other national systems, such as Japan’s Workers' Accident Compensation
Insurance, which vary the premium rate paid by the employer according to the likelihood of
injury in the workplace.
Next, this paper assesses various benefits an injured worker may receive under laws listed in
Table 2.2.

45
Medical costs of work injuries
In Kuwait, Oman, Qatar, UAE, and Singapore employers are liable for the costs of medical
examinations and treatment arising out of an occupational injury. For example, the UAE Labor
Law specifies that costs include hospital admission, diagnostic examinations, medications,
artificial limbs, and apparatus needed by disabled persons. Employers are also supposed to cover
transportation costs during the course of the treatment. However, not all laws are explicit in
what those costs include. The Qatar labor law simply states that the injured employee is “entitled
to receive medical treatment appropriate to his condition at the cost of the employer in
accordance with the decision of the competent medical authority”, without delving into specifics.
The law also doesn’t explicitly include transportation costs. The Singapore WICA also doesn’t
mention transportation costs but does indicate that employers are liable for all costs incurred for
the medical treatment. However, it places a time limit of one year and the total employer’s
liability is capped at SGD 30,000 per worker per accident.
In the remaining two countries, Bahrain and Saudi Arabia, the respective social insurance
agencies are to provide medical care, which includes services of general practitioners, specialists
and medical aids; dental services; diagnostics; hospital care; medication; and artificial limbs etc.
They are also supposed to cover all transportation expenses during the treatment.
Benefits adequacy
One of the common criteria used in evaluation of occupational injury compensation benefits is
adequacy, which is measured as the percentage of lost earnings due to a temporary or permanent
disability or death. The consensus in labor economics literature is that for disability benefits25 to
be adequate, two-thirds of the lost earnings should be replaced (National Commission, 1972;
Berkowitz and Burton Jr, 1987; Seabury et al., 2011). Using this criterion, this paper evaluates
and compares benefits provided for temporary total disability (TTD), permanent total disability
(PTD), permanent partial disability (PPD) and death under the laws in the GCC countries and
Singapore. Figure 2.2 illustrates how a worker loses income after an occupational injury. A
notable aspect of the graph is how the potential wage continues to increase with time, reflecting 25 Note that the consensus on death benefits is less clear. This chapter uses the PTD standard for death as well, since laws in the GCC countries mostly treat them identically.
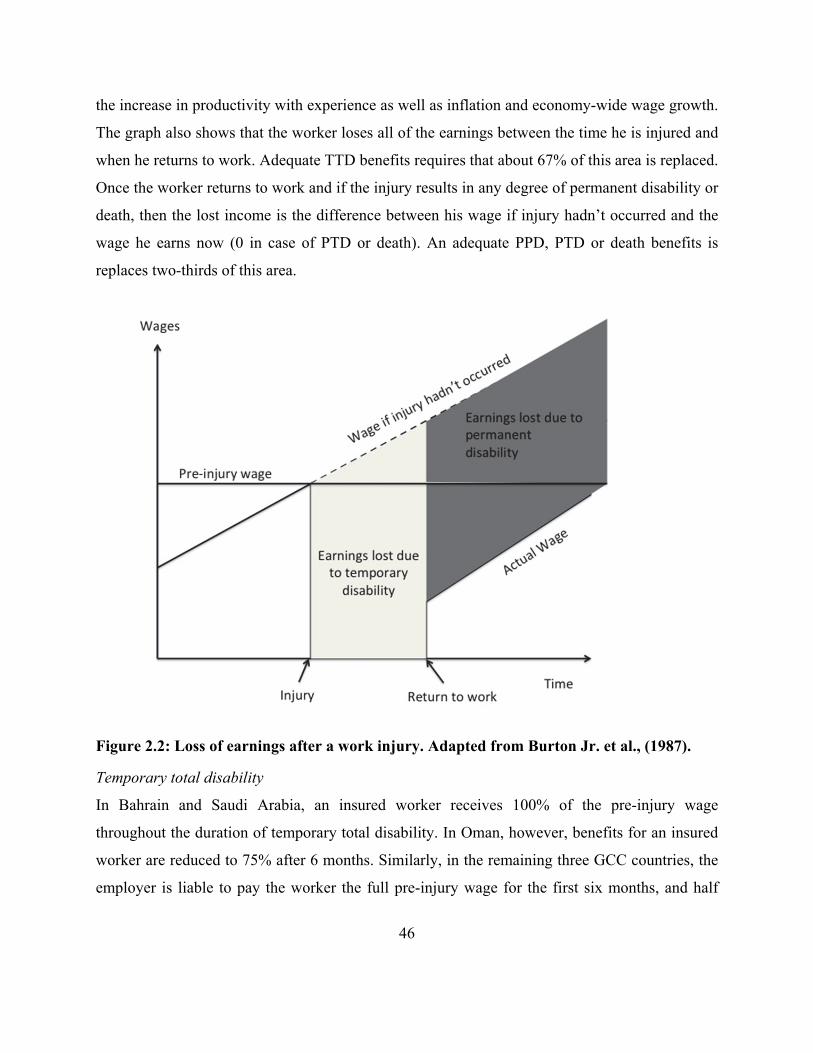
46
the increase in productivity with experience as well as inflation and economy-wide wage growth.
The graph also shows that the worker loses all of the earnings between the time he is injured and
when he returns to work. Adequate TTD benefits requires that about 67% of this area is replaced.
Once the worker returns to work and if the injury results in any degree of permanent disability or
death, then the lost income is the difference between his wage if injury hadn’t occurred and the
wage he earns now (0 in case of PTD or death). An adequate PPD, PTD or death benefits is
replaces two-thirds of this area.
Figure 2.2: Loss of earnings after a work injury. Adapted from Burton Jr. et al., (1987).
Temporary total disability
In Bahrain and Saudi Arabia, an insured worker receives 100% of the pre-injury wage
throughout the duration of temporary total disability. In Oman, however, benefits for an insured
worker are reduced to 75% after 6 months. Similarly, in the remaining three GCC countries, the
employer is liable to pay the worker the full pre-injury wage for the first six months, and half

47
after. The Singaporean WICA differentiates between the employee whose temporary incapacity
requires hospitalization and the one whose does not. The employer is required to pay 100% of
the pre-injury wage for 60 days to the hospitalized worker. If the worker is not hospitalized, then
employer has to compensate the worker for only 14 days.
Laws Benefits (% of Wages) Max. Duration
Bahrain Social Insurance Law 100% -
Kuwait Labor Law 100% for 6 months, 50% after 6 months -
Oman Royal Decree No. 40 100% for 6 months; 75% after 6 months -
Qatar Labor Law 100% for 6 months, 50% after 6 months -
Saudi Arabia Social Insurance Law 100% -
UAE Labor Law 100% for 6 months, 50% after 6 months -
Singapore WICA 100 % for 60 days and 2/3 after if hospitalized; 100 % for 14 days and 2/3 after if not hospitalized
1 year
Table 2.3: Temporary total disability benefits in GCC Countries and Singapore
For an easier comparison across countries, Figure 2.3 shows total disability compensation for a
worker who has been temporarily incapacitated for 7 months. The figure shows that, in terms of
benefits for a temporary disability lasting more than 6 months, Bahraini and Saudi laws are the
most generous while the Singaporean law is the least.

48
Figure 2.3: Total benefits after 7 months of temporary disability
In terms of adequacy, it should first be noted that TTD benefits are tied to pre-injury wages, as it
is the norm across the world. Assuming wages do not change greatly within the 6 months, it can
be argued that temporary total disability benefits extended by the laws in the GCC countries are
likely to meet the criterion. However, after 6 months, it can be reasonably concluded that
compensations under the Qatari, Omani, and Emirati laws are not adequate because the benefits
would be only the half of the pre-injury wage.
Permanent total disability
The worker’s entitlement for any degree of permanent disability is also tied to the pre-injury
wages, except in Qatar where the amount of compensation is fixed in accordance with the Sharia
law. Generally, a migrant worker with PTD receives a lump sum figure that varies greatly
between the nations (See Table 2.4, third column).
Note that the PTD compensation under the Bahraini law is different from the other laws in that it
is in the form of the monthly pension, although the law is not clear on the delivery system for
beneficiaries living abroad. Assuming permanently and totally disabled migrant workers living
700650 675 650
700650
533483
0
100
200
300
400
500
600
700
800
Bahrain Kuwait Oman Qatar SaudiArabia
UAE Singapore, ifhospitalized
Singapore ifnot
hospitalized
Percentage
of pre‐injury wage

49
abroad continue to receive 80% of their monthly pre-injury wage, it is clear that the benefits will
be adequate only up to the point in time when the potential post-injury wage is 120% of the pre-
injury earnings.
Benefits
Countries Permanent Total Disability/Death
Average26 PTD Benefit
Migrant WorkersPermanent Partial Disability
Bahrain Pension = 80% × MW (Min. ~ $80/Month)
~$256/Month If %D is less than 30%, 36 × %D × 80% × MW
Otherwise, Pension = %D × 80% × MW
Kuwait27
PTD: 2000 × DW (Max: ~$44,230)
Death: 1500 × DW (Max: ~$33,170)
~$24,620 2000 × %D × DW
Oman 36 × MW ~$11,520 36 × %D × MW
Qatar ~$54,920 ~$54,920 %D × $54,920
Saudi Arabia 84 × MW
(Max: ~$88,000) ~$26,880
If %D is less than 50%, and if age is less than 40, 60 × %D × MW
otherwise, (100-Age) × %D × MW. If %D is greater than 50%, 60 × %D × MW
(Max. ~$44,000)
UAE 24 × MW ~$7,680 24 × %D × MW
Singapore
(Function of age)28 × MW PTD, Age = 30: 164 × MW
(Min-Max: ~$53,300 - $159,160)Death, Age = 30: 123 × MW
(Min-Max: ~$41,620 - $124,120)
~$53,300 (Function of age) × %D × MW Age = 30, 164 × %D × MW
Table 2.4: Permanent Disability and Survivor Benefits in GCC Countries and Singapore
Note: MW stands for Monthly Wage, DW for Daily Wage and %D for percentage disability.
As noted earlier, PTD benefits under the remaining laws are in the form of lump-sum
compensations. In order to evaluate and compare these benefits, the following definition for
adequacy is used.
23
11
26 For a worker that earns $320/per month working 6 days a week. 27 The Kuwait Labor Law legal text does not actually contain the figures reported, which were obtained from http://www.kuwaitiah.net/ministry.html. 28 Appendix VI.
50
where is the adequate lump-sum compensation for permanent total disability at t, which is
the number of additional years the worker would have worked if the completely disabling injury
had not occurred. is the worker’s pre-injury monthly earnings, is the annual wage growth
rate the worker would have experienced and is the rate at which the worker discounts future
earnings.
Some further simplifying assumptions are made. First, is fixed at 6.4% per year, which is the
three-year average of nominal wage growth rate across the Gulf, according to surveys29
conducted by GulfTalent (2015). Second, is 6.3%, which is the sum of three-year average
inflation and the real interest rate across the GCC countries (Appendix V). Figure 2.4 illustrates
what percentage of the annual pre-injury wage would be adequate as a lump-sum compensation
benefit, depending on the number of working years the injured had left. For example, the lump-
sum amount a worker entitled to under the UAE law is 200% of the pre-injury wage, which is
only adequate if the worker would have worked additional three years had the injury not
occurred. Similarly, we can see that the Omani benefit is adequate for less than 5 years for
additional work, the Kuwaiti benefit for less than 9 years, the Saudi benefit for less than 11
years. In comparison, a 30-year-old injured worker in Singapore is entitled to a lump sum PTD
compensation that is adequate even if he had more than 20 additional earning years. Similarly,
for a 55-year-old, more than 14 years of earnings is adequately covered in Singapore.
29 Survey data was collected across 22,000 professionals, earning $12,000 to $200,000 per year, an income bracket that likely misses most of the at-risk migrant workers in question here. However, these are the most comprehensive figures across the Gulf region. So, the paper further assumes similar nominal wage growth rate for lower-income migrant workers.

51
Figure 2.4: Adequate lump-sum compensation for permanent total disability.
Because the compensation amount under the Qatar labor law is fixed, adequacy directly depends
on the pre-injury income. If the worker was earning $320 per month, then the compensation
benefit is adequate for about 22 additional years of employment. However, adequacy declines
quickly as the wage increases: a worker earning $1,000 per month is entitled to adequate
compensation only if he would have worked for another seven years.
Permanent partial disability
In the case of permanent partial disability (PPD), the injured worker is entitled to an amount that
is calculated as the product of the entitlement for the permanent total disability and the
percentage of disability, which is determined either according to a schedule attached to the law
or by the attending physician or an appointed medical board. Comparing some of the scheduled
disabilities commonly caused by occupational injuries (Table 2.5), it can be seen that: (i) ratings
are more or less the same across the GCC countries, and (ii) Singapore assigns slightly greater
ratings for losses.
Overall, as with PTD benefits, entitlements for PPDs vary greatly by country. Using the same
example as in Table 2.4, suppose a 30-year-old migrant worker who was earning a basic salary
of $320 per month loses the index finger of his dominant hand due to a work injury. Then, he

52
would be entitled to a lump-sum compensation of $1,106 in Bahrain, $2,560 in Kuwait30, $1,382
in Oman, $8,238 in Qatar31, $2,880 in Saudi Arabia32, $922 in UAE and $7,347 in Singapore.
Losses and disability ratings
Laws Right arm from the elbow
Hearing Vision-1 eye Index finger-right hand
Bahrain 65 55 35 12 Kuwait Determined by the attending physician or a medical arbitration panel Oman 65 55 40 12 Qatar33 60 50 45 15 Saudi Arabia Determined by a medical board UAE Labor 60 50 45 15 Singapore 75 60 50 14
Table 2.5: Ratings for Some Common Permanent Partial Disabilities, as Scheduled in the Laws of GCC Countries and Singapore
In order to evaluate the adequacy of these lump-sum benefits, the following slightly modified
version of the earlier definition is used.
23
11
where is the adequate lump-sum compensation for permanent partial disability at t and is
the disability percentage. The definition above makes two additional simplifying assumptions.
First, the wage post-injury continues to grow at the same rate as the potential wage without
injury. Secondly, the period of temporary disability is negligible.
Figure 2.5 illustrates what percentage of the annual pre-injury wage would be adequate as a
lump-sum compensation for PPD, depending on the number of working years the injured had
left. The first graph shows that for a worker with 25% disability, the lump-sum compensation
under the UAE law is 50% of the pre-injury wage, which is only adequate if the worker had 3
remaining working years left. Similarly, we can see that the Bahraini benefit is adequate for less
than 4 years for additional work, the Omani benefit is for less than 5 years, and the Kuwaiti
benefit is for less than 9 years. In Saudi Arabia, the compensation is computed differently for
30 Assuming the medical examiner determines a disability of 12% for the lost finger. 31 1 QAR = 0.27 USD, as of 9/18/2015. 32 Assuming the medical examiner determines a disability of 12% for the lost finger. 33 From the Qatar Labor Act No. 3 of 1962 since the Schedule 2 for the current law was not available.
53
workers above 40. For a worker below 40, the Saudi benefit is 125% of the pre-injury wage,
which is only adequate if he had less than 8 work years left. A worker of age 55, on the other
hand, is entitled to a lump-sum amount that is 94% of the pre-injury wage, which is adequate
only if the worker had less than 6 years left to work. In Qatar, as before, PPD benefits are
independent of the worker’s income, which means whether the compensation is adequate
depends on how much the worker was making before the injury. If the worker was earning $320
per month, then the compensation benefit is adequate for about 22 additional years of
employment. However, adequacy declines quickly as the wage increases: a worker earning
$1,000 per month is entitled to adequate compensation only if he would have worked for another
7 years. In comparison, a 30-year-old injured worker in Singapore is entitled to a lump sum PPD
compensation that is adequate even if he had more than 20 additional earning years. Similarly,
for a 55-year-old, more than 14 years of earnings is adequately covered in Singapore.
The second Figure 2.5 graph shows the adequate lump-sum compensation if the disability is
55%. The conclusions drawn earlier for benefit adequacy under the Kuwaiti, the Omani, the
Qatari, the Emirati, and the Singaporean laws hold even when the disability rating is higher. The
Bahraini law differs in that for disability greater than 30%, the worker receives, rather than
lump-sum compensation, a monthly pension, which is the product of the disability rating and
80% of pre-injury wage. Again, as with the PTD benefit under the law, this pension will be
adequate only up to the point in time when the potential post-injury wage is 120% of the pre-
injury earnings. The Saudi law, on the other hand, compensates PPD with a lump-sum amount,
regardless of what the disability rating is. However, if the disability is greater than 50%, the
compensation scheme is slightly different from the one described above. After that point, all
workers, regardless of their age, are entitled to an amount that is adequate only if the worker had
less than 8 years left as an earner.

54
Figure 2.5: Adequate lump sum compensation for permanent partial disability
Death benefits
If the injury is fatal, beneficiaries are entitled to death benefits. Eligible beneficiaries include the
spouse, sons and daughters under the age of majority, and other dependents. In Bahrain, Oman,
Qatar, Saudi Arabia, and UAE, the entitlement is equal to that received by a worker who suffers
a PTD. Therefore, conclusions made regarding adequacy for PTD benefits for these countries
also apply to adequacy of death benefits. In Kuwait, survivors receive three-quarters of the
benefit amount for PTD, i.e., a lump-sum compensation equal to 365% of the pre-injury monthly
wage, which is only adequate if the deceased worker had less than 6 earning years left (See

55
Figure 2.4). In Singapore, survivor benefits, depending on the age of the deceased, range from
around three-quarters to two-thirds of PTD benefits.
To sum, while TTD benefits under the GCC laws are likely to meet the adequacy criterion,
compensation under the laws in the GCC countries for PTD, PPD, and death are adequate only if
the worker had limited earning periods left, ranging from 3 to 11 years. In comparison, lump-
sum benefits under the Singapore WICA seem to recognize that a younger worker could be
losing many more years of earnings.
Benefits equity
The second common criterion used to evaluate occupational injury compensation benefits is
equity (Berkowitz and Burton Jr, 1987; Reville et al., 2005). Simply stated, under an equitable
compensation program, workers who lose the same earnings capacity are entitled to receive same
benefits. In addition, an equitable program also ensures that workers with different lost earnings
receive benefits proportional to their losses. In real world scenarios, it is not reasonable to
assume a linear relationship between the lost earnings and compensation. However, there should
at least be a positive relationship (Reville et al., 2005).
Disability ratings
In regards to equity, the most questionable aspect of the Gulf and Singaporean laws is disability
ratings used to calculate PPD benefits (See Table 2.5). For example, suppose a ceramist and a
porter in UAE both lose the index fingers on the dominant hands during the course of their
employment. It is reasonable to assume that the earnings capacity lost by the ceramist would be
different than that by the porter. Nonetheless, since this is a scheduled disability, under the
Emirati law, both of them would be deemed to have lost 15% of their earnings due to the injury.
However, it should be noted that this is not the case in all six countries. The Kuwaiti and Saudi
laws do not have a schedule for disability ratings. Instead, either the attending physician or a
medical board assesses the loss of earning capacity arising from a permanent disability.
56
Age
Another possibly inequitable aspect of the Gulf laws is not accounting for the age of the injured
worker. A younger worker has more working years left and thus loses more income due to
disability or death. This is very relevant in this context because low-income migrant workers in
the Gulf countries, the group most likely to suffer occupational injuries, tend to be young, in
their twenties and early thirties (Gardner et al., 2013). In addition to being an equity issue, age is
also relevant in discussions regarding adequacy, since benefits in GCC countries are generally in
the form of lump sum amounts and, as discussed above, are only adequate if the worker had 3 to
11 earnings years left at the time of the injury.
Only the Saudi law recognizes the difference between earnings losses faced by workers of
different age, however it does so only in calculating PPD compensation when the disability is
less than 50%. In contrast, entitlements under Singapore WICA—whether for PTD, PPD or
death—increase as the age decreases. For example, for a permanent total disability, a 25-year-old
worker is compensated 170 months of monthly wages while a 45-year old worker is
compensated for 134 months.
Pre-injury wage
The third discussion regarding equity concerns Qatar exclusively, since benefits in all other
countries studied are tied to the pre-injury wage. In contrast, the Qatar labor law ties PTD, PPD,
and death benefits to the fixed diyya amount of QAR 200,000. This means all workers,
regardless of their pre-injury wage, receive the same amount of compensation. Figure 2.6
illustrates the inequity of this compensation scheme. Suppose two workers, earning $200 and
$800, suffer PTD due to an employment injury. Assume both workers had 20 additional years
remaining as earners. Adequate lump-sum compensation benefit for the lower-income worker
would be about $32,320, and for the other worker it would be around $129,270. Under the Qatar
labor law, however, both workers receive the same amount, violating the equity principle that
requires at least a positive relationship between the lost earnings and compensation.
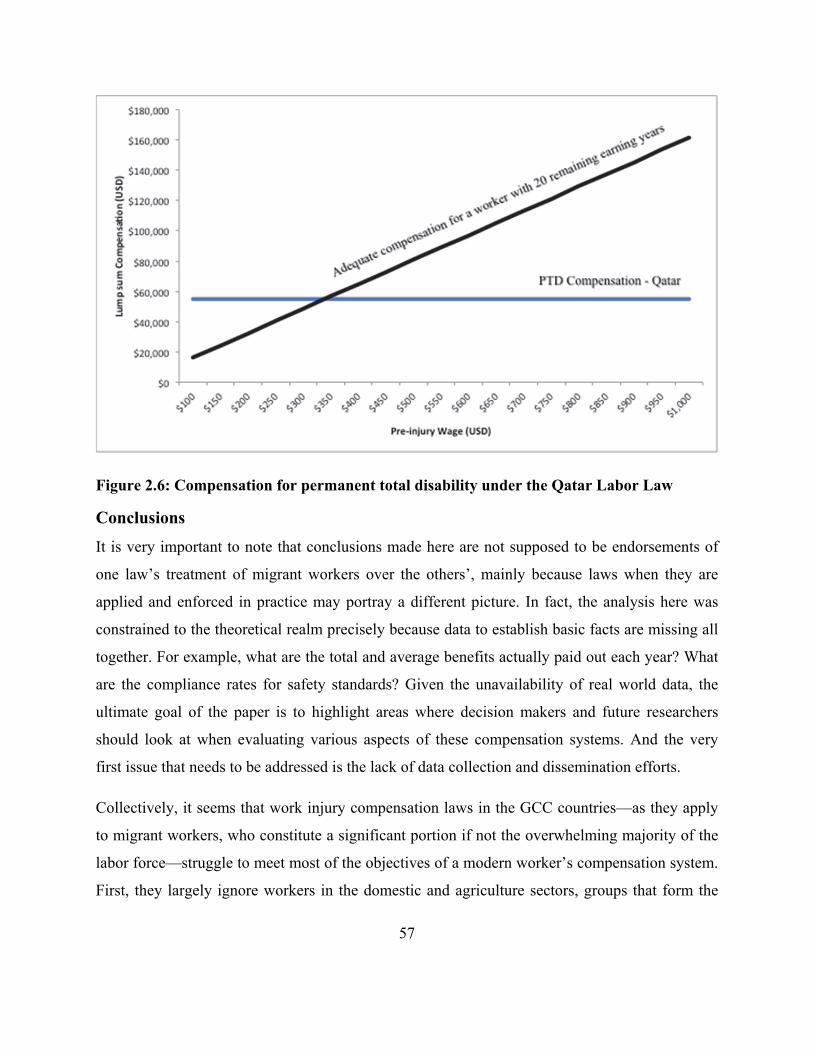
57
Figure 2.6: Compensation for permanent total disability under the Qatar Labor Law
Conclusions
It is very important to note that conclusions made here are not supposed to be endorsements of
one law’s treatment of migrant workers over the others’, mainly because laws when they are
applied and enforced in practice may portray a different picture. In fact, the analysis here was
constrained to the theoretical realm precisely because data to establish basic facts are missing all
together. For example, what are the total and average benefits actually paid out each year? What
are the compliance rates for safety standards? Given the unavailability of real world data, the
ultimate goal of the paper is to highlight areas where decision makers and future researchers
should look at when evaluating various aspects of these compensation systems. And the very
first issue that needs to be addressed is the lack of data collection and dissemination efforts.
Collectively, it seems that work injury compensation laws in the GCC countries—as they apply
to migrant workers, who constitute a significant portion if not the overwhelming majority of the
labor force—struggle to meet most of the objectives of a modern worker’s compensation system.
First, they largely ignore workers in the domestic and agriculture sectors, groups that form the

58
most vulnerable population of migrant workers. Second, while the laws are more or less clear on
employer’s liability for occupational injuries and diseases, employer’s incentives for providing
safe work environment might be diminished in presence of Kafala visa-sponsorship systems.
Because they are in control of workers’ visas, employers might be able to ignore safety standards
and avoid any grievances from their employees. And finally, even though the laws seemingly
cover medical costs and provide adequate temporary disability benefits, indemnity entitlements
of the worker or his survivors for permanent disability or death seem inadequate and inequitable.
One of the main reasons these issues arise is because benefits are computed as lump-sum
payments without properly accounting for total future earnings potential of the worker.
Individually, some systems are better designed than others to theoretically meet the needs of a
modern compensation program. The analytical framework based on economic theory suggests
that the Bahraini, the Omani, and the Saudi systems may give employers better incentives to
provide safer work environment, although the Bahrain and the Saudi social insurance systems
may want to consider reevaluating their premium rate schedule. In terms of adequacy of
permanent disability and death benefits, while laws in all six GCC nations do not meet the well-
established criterion and fall behind the law in Singapore—a country similarly dependent on
migrant labor, the UAE labor law is lagging particularly more. Finally, with respect to benefits
equity, all six laws again fall behind the Singaporean WICA, but the Qatar labor law does so
more than others.

59
Appendix
Appendix I: Income per Capita and Foreign Labor Composition of the GCC Countries and
Singapore
Country GDP Per Capita
($)34
Labor Force
Foreign Labor Force
Foreign Labor
Force %
Reference Date
Source
Bahrain 24,694.7 694909 538480 77%35 2015-Q1
Labour Market Regulatory Authority
Kuwait 52,196.2 1146376 929245 81% 2011 Central Statistical Bureau
Oman 21,523.4 1517355 1311301 86%36 2015-Jun
National Centre for Statistics and Information
Qatar 93,714.1 1814938 1716431 95% 2015-Q1
Ministry of Development Planning and Statistics
Saudi Arabia 25,819.1 11739303 6161814 52% 2014
Central Department of Statistics and Information
United Arab Emirates
43,048.9 4891000 4157350 85%37 2014 CIA The World Factbook
Singapore 55,979.8 3530800 1345600 38% 2014-Jun Ministry of Manpower
34 Source: The World Bank 2013 35 Employed Workers 36 Employed Workers in Private Sector 37 Estimated

60
Appendix II: Definitions of Occupational Injury in the laws of the GCC Countries and
Singapore
Law Definition
Coverage
Commuting Accidents
Occupational Diseases
Bahrain Social Insurance Law
Any injury to the workers as a result of an accident arising out during the course of the performance of his work or because thereof.
Yes Yes and defined
Kuwait Labor Law Not explicitly defined Yes Yes, but not defined
Oman Royal Decree No. 40
Any injury resulting from accidents happening in the course of work or due to it.
Yes Yes and defined
Qatar Labor Law Any injury resulting from an accident happening to the worker during the performance of his work or by reason thereof.
Yes Yes and defined
Saudi Arabia Social Insurance Law
Accident sustained by the contributor during work or from which it resulted.
Yes Yes and defined
UAE Labor Law Any other accident sustained by the worker during the performance or as a result of his work
Yes Yes and defined
Singapore WICA Any injury caused by an accident that (i) happened during working hours/overtime or while on official duties (“in the course of employment”) and (ii) happened due to work (“out of employment”).
Yes Yes and defined
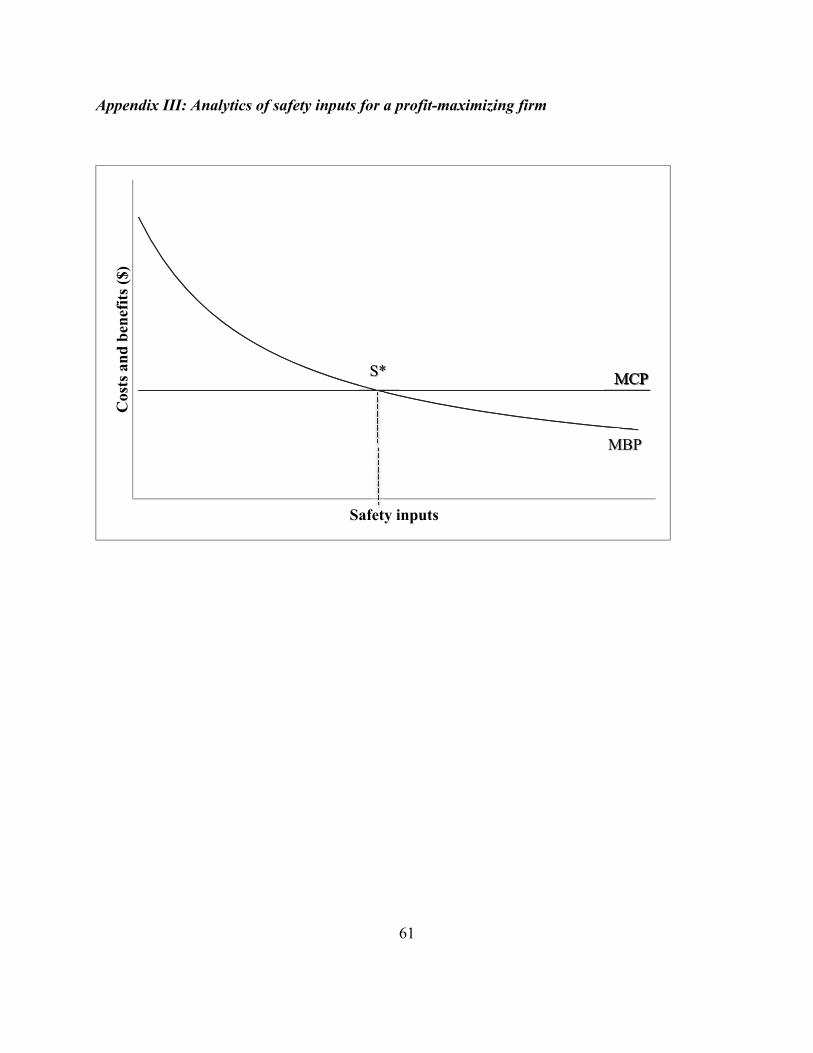
61
Appendix III: Analytics of safety inputs for a profit-maximizing firm
C
osts
an
d b
enef
its
($)
Safety inputs
MCP
MBP
MCPS*

62
Appendix IV: Multiplying Factors for Permanent Total Disability and Death Benefits Under
the Singapore WICA
0
20
40
60
80
100
120
140
160
180
200
<=14
16
18
20
22
24
26
28
30
32
34
36
38
40
42
44
46
48
50
52
54
56
58
60
62
64
>=66
Multiplying Factor
F(Age) for Death F(Age) for PTD

63
Appendix V: Wage Growth, Inflation and Real Interest Rate across the GCC Countries
% Rise in Nominal Base Salary
2013 2014 201538 3-Year Average
Bahrain 4 5.9 7 5.6
Kuwait 5.4 5.7 5 5.4
Oman 7.4 7.6 7.2 7.4
Qatar 5.6 6.5 8.3 6.8
Saudi Arabia 6.7 7.5 7.1 7.1
UAE 5.3 6.2 7.1 6.2
Average 6.4
Source: GulfTalent (2015)
Inflation
2013 2014 201539 3-Year Average
Bahrain 3.2 2.7 1.9 2.6 Kuwait 2.8 2.9 2.4 2.7 Oman 1.3 1 2.3 1.5 Qatar 3.1 3 3.5 3.2 Saudi Arabia 3.7 2.7 2.6 3.0 UAE 1.1 2.3 2.1 1.8
Average 2.5
Source: GulfTalent (2015)
% Change in Real Interest Rate
2013 2014 201540 3-Year Average
Bahrain 3.7 4.4 7.5 5.2
Kuwait -2.3 4.3 8.8 3.6
Oman 0.7 7 3.3 3.7
Qatar -1.4 3.6 4.9 2.4
Average 3.8
Source: The World Bank’s World Development Indicators
38 Projected. 39 Projected. 40 Projected.
64
3. Estimating the economic costs of occupational fatalities of migrant
workers in the GCC Countries
Abstract Recent reports from the Arabian Gulf countries suggest high incidences occupational fatalities among low-skilled migrant workers. One of the distressing aspects of these fatalities is that the economic burden falls squarely on the families of the deceased workers. A quick look at the workers’ compensation policy in the region reveals that the systems in place do not adequately compensate the bereaved families for the economic loss. This paper presents a case study that further evaluates the adequacy of the compensation benefits by estimating the economic loss when a Nepali migrant worker dies in Qatar, while recognizing the unique nature of the economic migration: it is legally temporary. The methodology includes developing the age-earnings profiles of workers in Qatar and Nepal, modeling the duration of their stay, and assessing the value of their contribution to the household production. Data used primarily comes from nationally representative surveys conducted by the Qatar University and the Central Bureau of Statistics in Nepal. The paper finds that, even when accounting for the temporary nature of the economic migration, an overwhelming majority of bereaved Nepali families are entitled to benefits that are lower than the lost earning potential of their deceased family member.
Background
The United Nations Population Division (UNPD) estimated that there were 232 million
international migrants41 worldwide in 2013. About 50% of international migrants are
economically active42 and if their family members are also counted, the figure rises to about 90
per cent (ILO, 2013). While the driving forces behind the international migration flows are
complex—a significant portion of the population leaves the home country due to wars, famine,
and repression—most migrants cross national borders seeking better economic opportunities
(ILO, 2004). Therefore, it is not surprising that almost 71% of international migrants today are
from the developing regions and about half of them moved to the developed regions (DESA,
2013). Sender countries have also experienced some positive effects of the migration outflow: it
is estimated that, in 2013, developing countries received $414 billion in remittance, three times
greater than development aid they received (Ratha et al., 2013). Meanwhile, developed countries
have benefitted from inflow of migrant workers who often fulfill demands for cheap labor.
41 The UNPD report defines international migrants as foreign-born or foreign citizens. 42 The ILO defines economically active population as people who “furnish the supply of labor for the production of goods and services during a specified time-reference period.”
65
There are, however, unsavory aspects to the international economic migration. One of which is
that migrant workers have been consistently found to face greater risks of fatal and non-fatal
occupational injuries than native workers. In Europe, migrant workers are twice as vulnerable to
occupational accidents as native workers (Nygren-Krug, 2004). In the United States, industries
with greatest percentages of occupational fatalities also have the highest percentages of migrant
workers (Schenker, 2010). It is widely accepted that migrant workers are more vulnerable to
injuries because they are more willing to accept high-risk, low-reward work that local workers
refuse. In addition, language, cultural differences, poor communication and unfamiliarity with
the machinery raise the risks.
This double-edged nature of the economic migration is most obvious in the six nations of the
Gulf Cooperation Council (GCC)—Bahrain, Kuwait, Oman, Qatar, Saudi Arabia, and United
Arab Emirates. Foreign workers make up the great majority of total labor force in the GCC
countries—85% in UAE and 95% in Qatar. The six nations annually receive more than 3 million
migrant workers from impoverished Asian countries of Bangladesh, India, Nepal, Pakistan, Sri
Lanka, Philippines, Indonesia and Vietnam (Baruah, 2013). Most of this flow43, which is
temporary and comprises of low- and semi-skilled workers, is primarily driven by economic
disparities and wage differentials. Rapid economic growth in the GCC countries means high
demand of low-skilled workers in the manufacturing and construction sectors. Meanwhile, lack
of employment opportunities and low human capital in the sender countries mean high supply of
low-skilled labor. As it is globally, economies on the sending side of this migration flow have
been boosted by remittances sent by the workers abroad. For example, remittances contribute to
about 30% of Nepal’s GDP (DOFE, 2014).
However, one of the costs of the economic boost is the safety of the workers. Barss et al. (2009)
found that 96% of occupational injury hospitalizations in UAE from 2003-2005 were of migrant
workers and concluded that occupational injuries among construction, agricultural, and industrial
workers in the country have been found to be disproportionally higher than in other
industrialized countries. Similarly, Al-Dawood (2000) found that, in Saudi Arabia, the incidence
rate of severe occupational injury requiring hospital admission was four times higher for non-
43 According to a survey (SESRI, see below for details) of low-income migrant workers in Qatar, workers stay for about 6 years, on average.

66
Saudi workers. Only 1.5% of those hospitalized were Saudis. A similar study in Qatar found that
99% of trauma admissions following occupational injuries were non-Qataris. Moreover,
occupational injury incidence rates for Indian and Nepali migrant workers were respectively
about five and ten times higher than for Qatari workers (Al-Thani et al., 2015). And, it has been
estimated that, in Dubai alone, an average of two Asian migrant workers die on construction sites
every day (Keane and McGeehan, 2008).
Research objectives
Occupational injuries are tragic byproducts of economic activities that are beneficial economy-
wide to both the GCC countries and the sender countries. However, the burden of the injuries
squarely falls on the migrant workers and their families. The spread-benefits-concentrated-costs
nature of the work injuries applies not just in this context, but is rather universal. Around the
world, one of the approaches to address this imbalance is the worker’s compensation system,
whose primary purpose, in addition to incentivizing employers to prevent injuries, is to
compensate workers or their families for their economic losses. As described in the second
chapter, the GCC countries do have systems in place to provide workers or workers’ families
with indemnity for work-related injuries and deaths. However, the GCC systems, as they apply
to migrant workers, do not meet the standards of a modern worker’s compensation systems, as
defined in the report of the U.S. National Commission on State Workmen’s Compensation Laws
(National Commission, 1972). The most discernible failure of the GCC laws is that the
indemnity benefit seems to inadequately compensate for the economic loss to the injured worker
or the family. Additionally, since the benefits are generally in the form of lump-sum amounts
independent of the deceased’s age, they are particularly inadequate younger workers, who have
more productive years left. Age is highly relevant in this context because the migrant workers in
the region tend to be in their twenties and early thirties.
The research goal is to explore this shortcoming further, while also recognizing the unique nature
of the economic migration to the GCC countries: it is legally temporary. Workers arrive with
work contracts usually lasting a couple of years and their work visa tied to the employment
contract. While, in some cases, workers may stay for a decade or more; it is rare that they would
stay there permanently, especially since they normally arrive without families and practically no

67
pathway to naturalization in the host country (Fargues, 2011). Therefore, the research objectives
are two-fold. The first aim is to study the adequacy of the GCC workers compensation systems
in greater detail. And, in doing so, the second aim is to develop a framework to estimate
economic losses of injured workers who would eventually return to their home countries.
The paper focuses on workers in a single GCC country, Qatar, and from one sender country,
Nepal. This particular flow has been at the center of several recent news reports highlighting
labor issues in the Gulf, including high incidences of occupational injuries among migrant
workers. Another reason to pick this set of countries is that Qatar has the greatest foreign-
workers-to-labor-force ratios among the GCC countries while Nepal has the greatest outflow of
workers-to-population ratio in Asia. More importantly, the highest incidences of occupational
injuries, both fatal and non-fatal, in Qatar are among Nepali workers (Al-Thani et al., 2015).
Data constraints limit the scope of this paper to fatalities. Furthermore, the paper will estimate
economic costs of fatalities among male workers only, which does not necessarily limit the scope
by much: of 815 deaths of Nepali migrant workers in Qatar between 2008 and 2015, only 4 were
of female workers (DOFE, 2016).
Methodology
The specific goal of this paper is to evaluate how well the death indemnity benefit in Qatar
replaces the economic losses caused by life-ending occupational injuries to migrant workers, at
various ages. The economic cost of workplace injuries suffered by migrant workers is a topic that
has received little attention in the policy research world. There has not been any research directly
addressing this policy area in the GCC countries. In fact, this paucity of studies exists around the
globe. However, there are several studies—even though none are specific to migrant workers—
that estimate economic costs of fatal workplace injuries.
These studies have employed various methods to tackle challenges faced when measuring
economic costs of fatal occupational injuries. The primary challenge is answering the question:
how much would the deceased worker have earned in the remainder of his or her lifetime? It is a
difficult one because the answer requires a counterfactual prediction of the worker’s future
behavior as well as predictions of employer and household behaviors. In addition, there are costs
68
that are even harder to quantify, namely the impact on the wellbeing and quality of life of
household members of the deceased. Approaches that have been implemented in economic and
health literature to address these challenges can be categorized under three basic methods (Weil,
2001).
I. Contingent valuation survey method
Contingent valuation surveys ask workers either how much earnings they would be willing to
forgo for reducing the probability of death or how much additional earnings they would require
to accept higher probability of death. The value a worker places on his or her life is then
estimated using this willingness to pay or willingness to accept. A wide variety of survey
instruments have been used to elicit estimates for the value workers place on their lives.
Viscusi, Magat and Huber (1991) used an iterative computer program that asked respondents to
make a series of pairwise comparisons between different locations, which were used to measure
respondents’ willingness to pay to reduce the risk of contracting chronic bronchitis. Locations
differed in two attributes: the cost of living and the probability of contracting chronic bronchitis.
After estimating the willingness to pay, the following utility model was used to estimate the
value of loss. If Xa is the probability of contracting chronic bronchitis in location A, Xb is the
probability of contracting it in location B, U1(CB) is the utility with chronic bronchitis, U1(H) is
the utility in a healthy state, U2(I) is the utility derived from income net living expenses I, then
willingness to pay $Z to choose A over B means that:
U CB
U H (i)
If U2(.), the utility for income is assumed to linear, then the value of loss upon contracting
chronic bronchitis (L), if given by a simple equation:
U H U CB (ii)
Gerking, De Haan and Schulze (1988) elicited perceived risks of accidental deaths by asking
respondents to assign categorical values (steps in a risk ladder) to seven example occupations for
their risk of fatality. Then, half of the respondents were asked the amount their annual wages

69
would have to be increased for them to keeping working on a job if the categorical value they
assigned for the job increases by 1. The other half was asked how much of their annual wages
they were willing to forgo if the categorical value provided for the job decreases by 1. The
survey was designed as such to contrast contingent valuations for fatal risks derived using
willingness to pay against willingness to accept.
Direct elicitation of the wage-risk preferences of workers is the main advantage of the contingent
valuation survey method. Hypothetical questionnaire means that survey can be tailored to
precisely match the needs of the research. However, the theoretical nature of this method is also
its greatest drawback: respondents may not provide accurate, thoughtful answers due to the lack
of familiarity with the scenarios presented and due to the lack of incentives to do so. Estimates of
values of life derived using the contingent valuation method can be affected by trivial survey
design aspects, such as, how questions are ordered or how risks are described. Meanwhile,
estimates of willingness to pay can be insensitive to nontrivial aspects, such as, the change in the
probability of fatality (Hammitt, 2000). This method might also be less practical for this paper’s
purpose because of the challenging aspects of conducting surveys in the GCC countries.
II. Compensating wage differentials method
The theory behind the compensating wage differentials method, or the hedonic wage method, is
that the labor market compensates workers for the risks of occupational injury or fatality and
thus the implied value the worker places on his life can be estimated using this wage differential.
Firms face the tradeoff between the cost to provide a safer work environment and the cost of
higher compensation for employees to work in a riskier environment. Meanwhile, employees
face the above-mentioned wage-risk trade-off. Wages are set in the marketplace through the
interaction of these trade-offs in forms of the demand and supply of the labor. Therefore, in order
to estimate compensating wage differentials or wage premiums for fatality risks, other factors
that influence demand and supply in the labor market have to be controlled. The general model
of this approach is to use the hedonic wage equation (Viscusi, 1993):
∑ (iii)

70
where is the wage rate, is the constant term, are the individual and job characteristic
variables, is the fatality risk, is the risk of nonfatal injury, is the compensation benefits,
and is the random error term. The coefficient for the fatality risk ( ) measures the willingness
to accept an increase in risk, which can then be linearly extrapolated to estimate the value for
life.
Kniesner and Leeth (1991) estimate and compare compensating wage differentials in
manufacturing industries in Japan, Australia, and United States using the standard hedonic wage
model. Due to the lack of individual-level data for Japan and Australia, aggregate-level data on
proportion of female workers, employees per firm, new hire rate, and separation rate are used
instead of characteristic variables. The model for United States, however, includes age, sex, and
marital status.
Moore and Viscusi (1988) include the expected discounted life years lost variable, which is the
product of and discounted remaining life, as a regressor in the standard hedonic wage model.
The discounted remaining life is calculated using the worker’s rate of time preference and life
expectancy tables. The reason for including the variable is to capture two influences: (i) future
life at risk decreases with age, and (ii) expected date of death for a worker of a given age moves
further in the future with his or her age.
The compensating wage differentials method is likely to give more accurate estimates of
economic costs and is the preferred method in economic literature. However, critics have pointed
out that it relies too heavily on wide-ranging set of assumptions regarding worker’s ability to
factor in occupational risks, labor mobility, symmetric information regarding risk between
employers and employees, all competitive labor markets (Weil, 2001)—which is problematic in
this context, considering migrant workers in the GCC countries have limited rights and are often
tied to the employers due to the Kafala visa sponsorship systems.
III. Human capital method
The human capital method, or direct and indirect costs method, or the cost of illness method, is
the most commonly used method to estimate economic costs of injury or fatalities in medical
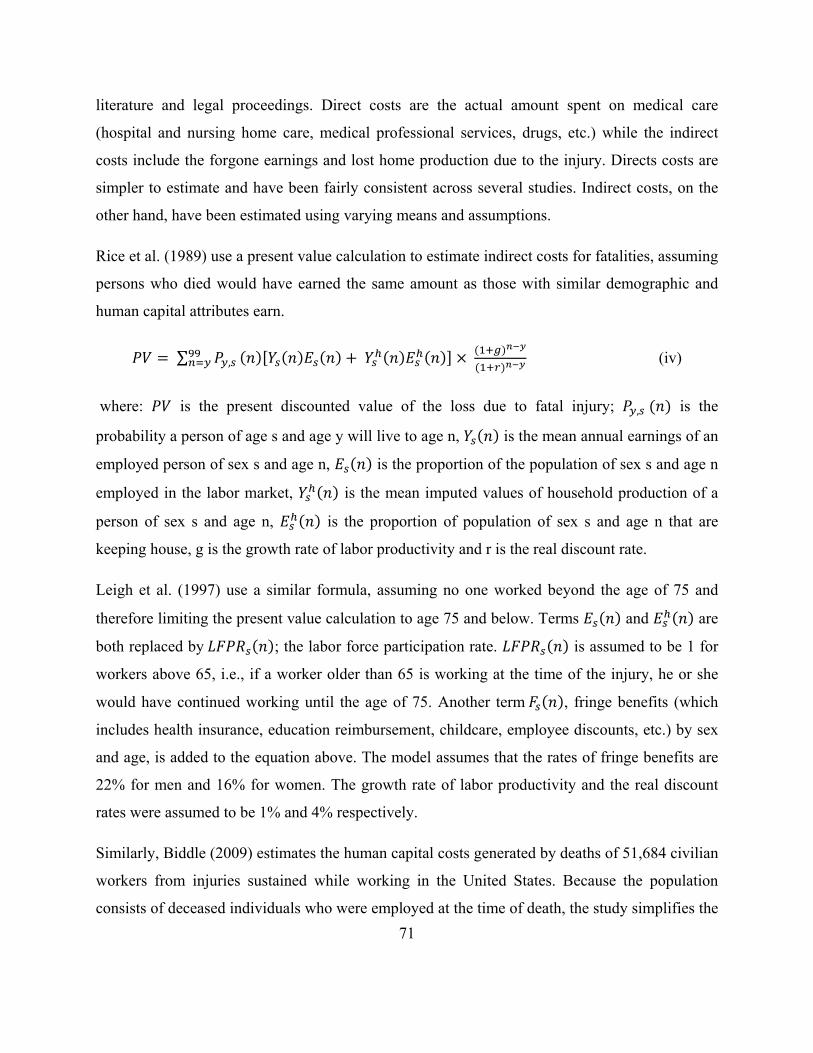
71
literature and legal proceedings. Direct costs are the actual amount spent on medical care
(hospital and nursing home care, medical professional services, drugs, etc.) while the indirect
costs include the forgone earnings and lost home production due to the injury. Directs costs are
simpler to estimate and have been fairly consistent across several studies. Indirect costs, on the
other hand, have been estimated using varying means and assumptions.
Rice et al. (1989) use a present value calculation to estimate indirect costs for fatalities, assuming
persons who died would have earned the same amount as those with similar demographic and
human capital attributes earn.
∑ , (iv)
where: is the present discounted value of the loss due to fatal injury; , is the
probability a person of age s and age y will live to age n, is the mean annual earnings of an
employed person of sex s and age n, is the proportion of the population of sex s and age n
employed in the labor market, is the mean imputed values of household production of a
person of sex s and age n, is the proportion of population of sex s and age n that are
keeping house, g is the growth rate of labor productivity and r is the real discount rate.
Leigh et al. (1997) use a similar formula, assuming no one worked beyond the age of 75 and
therefore limiting the present value calculation to age 75 and below. Terms and are
both replaced by ; the labor force participation rate. is assumed to be 1 for
workers above 65, i.e., if a worker older than 65 is working at the time of the injury, he or she
would have continued working until the age of 75. Another term , fringe benefits (which
includes health insurance, education reimbursement, childcare, employee discounts, etc.) by sex
and age, is added to the equation above. The model assumes that the rates of fringe benefits are
22% for men and 16% for women. The growth rate of labor productivity and the real discount
rates were assumed to be 1% and 4% respectively.
Similarly, Biddle (2009) estimates the human capital costs generated by deaths of 51,684 civilian
workers from injuries sustained while working in the United States. Because the population
consists of deceased individuals who were employed at the time of death, the study simplifies the
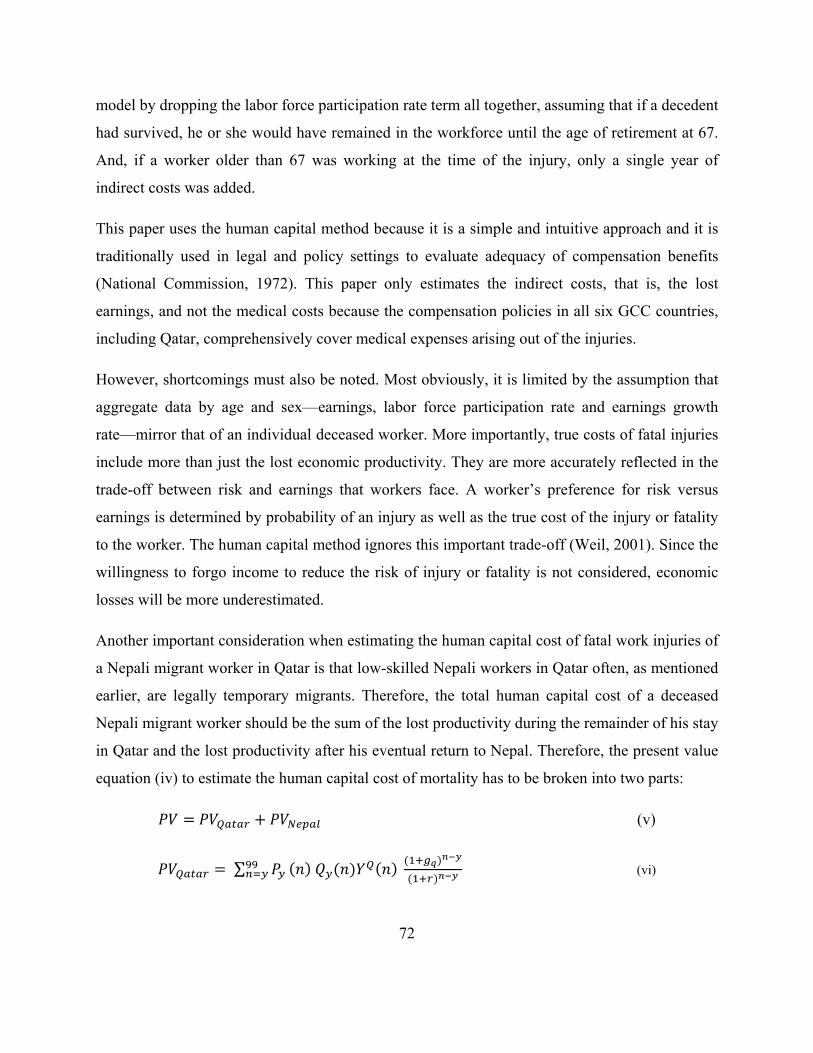
72
model by dropping the labor force participation rate term all together, assuming that if a decedent
had survived, he or she would have remained in the workforce until the age of retirement at 67.
And, if a worker older than 67 was working at the time of the injury, only a single year of
indirect costs was added.
This paper uses the human capital method because it is a simple and intuitive approach and it is
traditionally used in legal and policy settings to evaluate adequacy of compensation benefits
(National Commission, 1972). This paper only estimates the indirect costs, that is, the lost
earnings, and not the medical costs because the compensation policies in all six GCC countries,
including Qatar, comprehensively cover medical expenses arising out of the injuries.
However, shortcomings must also be noted. Most obviously, it is limited by the assumption that
aggregate data by age and sex—earnings, labor force participation rate and earnings growth
rate—mirror that of an individual deceased worker. More importantly, true costs of fatal injuries
include more than just the lost economic productivity. They are more accurately reflected in the
trade-off between risk and earnings that workers face. A worker’s preference for risk versus
earnings is determined by probability of an injury as well as the true cost of the injury or fatality
to the worker. The human capital method ignores this important trade-off (Weil, 2001). Since the
willingness to forgo income to reduce the risk of injury or fatality is not considered, economic
losses will be more underestimated.
Another important consideration when estimating the human capital cost of fatal work injuries of
a Nepali migrant worker in Qatar is that low-skilled Nepali workers in Qatar often, as mentioned
earlier, are legally temporary migrants. Therefore, the total human capital cost of a deceased
Nepali migrant worker should be the sum of the lost productivity during the remainder of his stay
in Qatar and the lost productivity after his eventual return to Nepal. Therefore, the present value
equation (iv) to estimate the human capital cost of mortality has to be broken into two parts:
(v)
∑ (vi)
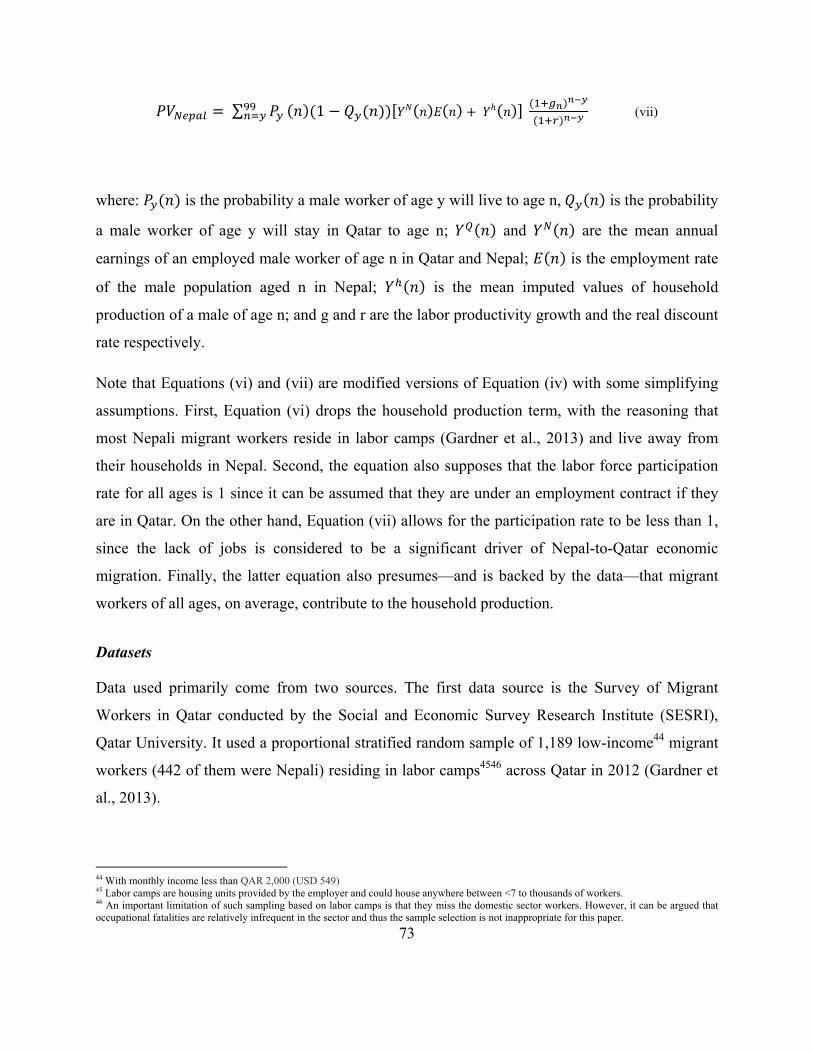
73
∑ 1 (vii)
where: is the probability a male worker of age y will live to age n, is the probability
a male worker of age y will stay in Qatar to age n; and are the mean annual
earnings of an employed male worker of age n in Qatar and Nepal; is the employment rate
of the male population aged n in Nepal; is the mean imputed values of household
production of a male of age n; and g and r are the labor productivity growth and the real discount
rate respectively.
Note that Equations (vi) and (vii) are modified versions of Equation (iv) with some simplifying
assumptions. First, Equation (vi) drops the household production term, with the reasoning that
most Nepali migrant workers reside in labor camps (Gardner et al., 2013) and live away from
their households in Nepal. Second, the equation also supposes that the labor force participation
rate for all ages is 1 since it can be assumed that they are under an employment contract if they
are in Qatar. On the other hand, Equation (vii) allows for the participation rate to be less than 1,
since the lack of jobs is considered to be a significant driver of Nepal-to-Qatar economic
migration. Finally, the latter equation also presumes—and is backed by the data—that migrant
workers of all ages, on average, contribute to the household production.
Datasets
Data used primarily come from two sources. The first data source is the Survey of Migrant
Workers in Qatar conducted by the Social and Economic Survey Research Institute (SESRI),
Qatar University. It used a proportional stratified random sample of 1,189 low-income44 migrant
workers (442 of them were Nepali) residing in labor camps4546 across Qatar in 2012 (Gardner et
al., 2013).
44 With monthly income less than QAR 2,000 (USD 549) 45 Labor camps are housing units provided by the employer and could house anywhere between <7 to thousands of workers. 46 An important limitation of such sampling based on labor camps is that they miss the domestic sector workers. However, it can be argued that occupational fatalities are relatively infrequent in the sector and thus the sample selection is not inappropriate for this paper.
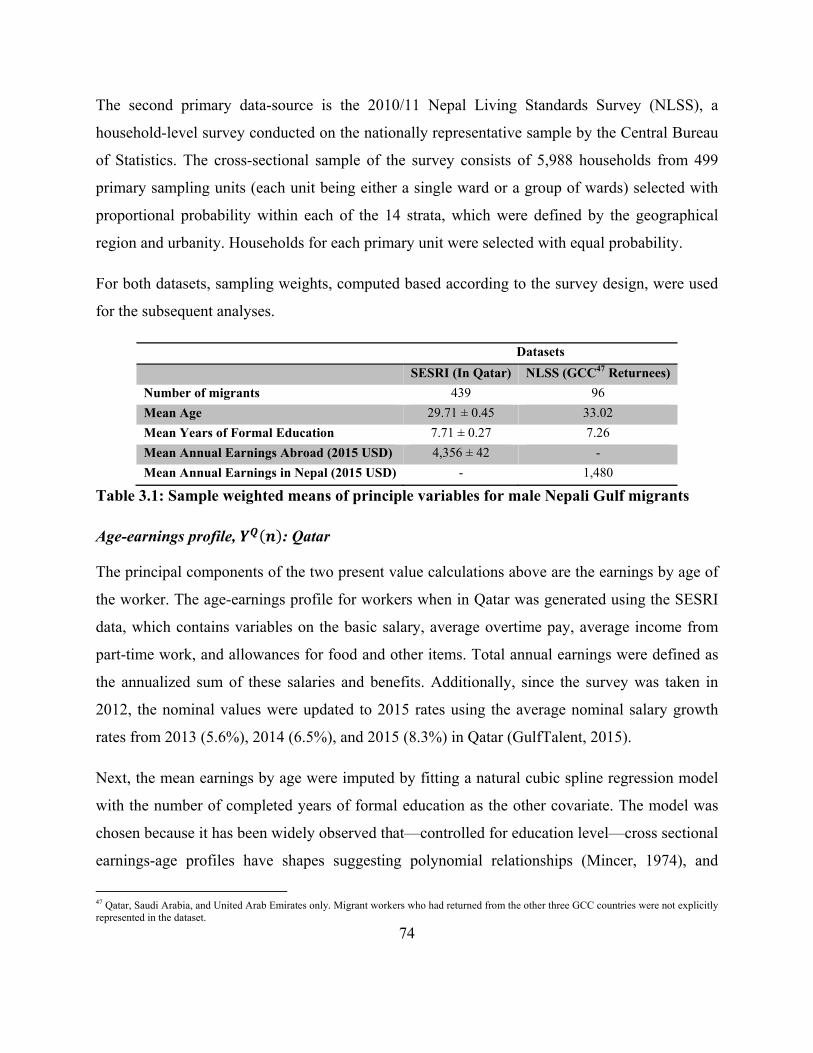
74
The second primary data-source is the 2010/11 Nepal Living Standards Survey (NLSS), a
household-level survey conducted on the nationally representative sample by the Central Bureau
of Statistics. The cross-sectional sample of the survey consists of 5,988 households from 499
primary sampling units (each unit being either a single ward or a group of wards) selected with
proportional probability within each of the 14 strata, which were defined by the geographical
region and urbanity. Households for each primary unit were selected with equal probability.
For both datasets, sampling weights, computed based according to the survey design, were used
for the subsequent analyses.
Datasets
SESRI (In Qatar) NLSS (GCC47 Returnees)
Number of migrants 439 96
Mean Age 29.71 ± 0.45 33.02
Mean Years of Formal Education 7.71 ± 0.27 7.26
Mean Annual Earnings Abroad (2015 USD) 4,356 ± 42 -
Mean Annual Earnings in Nepal (2015 USD) - 1,480
Table 3.1: Sample weighted means of principle variables for male Nepali Gulf migrants
Age-earnings profile, : Qatar
The principal components of the two present value calculations above are the earnings by age of
the worker. The age-earnings profile for workers when in Qatar was generated using the SESRI
data, which contains variables on the basic salary, average overtime pay, average income from
part-time work, and allowances for food and other items. Total annual earnings were defined as
the annualized sum of these salaries and benefits. Additionally, since the survey was taken in
2012, the nominal values were updated to 2015 rates using the average nominal salary growth
rates from 2013 (5.6%), 2014 (6.5%), and 2015 (8.3%) in Qatar (GulfTalent, 2015).
Next, the mean earnings by age were imputed by fitting a natural cubic spline regression model
with the number of completed years of formal education as the other covariate. The model was
chosen because it has been widely observed that—controlled for education level—cross sectional
earnings-age profiles have shapes suggesting polynomial relationships (Mincer, 1974), and
47 Qatar, Saudi Arabia, and United Arab Emirates only. Migrant workers who had returned from the other three GCC countries were not explicitly represented in the dataset.

75
because a natural cubic fit provides greater smoothness at the knots than other piecewise
polynomial models. The splines were constructed with knots at ages 22, 28, and 40, placed at
equal percentile intervals of the variable, as suggested by Harrell (2015).
ln (viii)
Equation (viii) shows the fitted model, in which and are the spline variables. See
Appendix I for more details regarding the model and Appendix II for the age-earning profile,
computed by holding the years of formal education at 8, the median among Nepali workers in
Qatar.
Figure 3.1: Age-Earnings profiles of male Nepali Workers in Qatar at years of education
Age-earnings profile, : Nepal
The age-earnings profile for the returnee workers was generated using the NLSS dataset, which
contains person-level variables on the number of hours worked and daily wages (both cash and
in-kind payments) on wage jobs, monthly payments and benefits from salaried jobs, and earnings
(both cash and in-kind) from short-term contract work. Earnings from the different job types
3000
3500
4000
4500
5000
5500
18 23 28 33 38 43 48 53 58 63 68 73 78 83 88 93 98
Ann
ual E
arni
ngs
in U
SD
Age
12 years
8 years
10 years
6 years

76
were then aggregated at the individual level, and then updated to 2015 USD48 values using the
Nepal Wage and Salary Index49.
Next, as with the Qatari profile, a natural cubic spline regression model was used. In addition to
age splines—with equal percentile interval knots at 22, 37, and 56—and years of education, this
model also included the indicator variable for the workers who had returned from the Persian
Gulf nations.
ln (ix)
Equation (ix) shows the fitted model, in which the dummy variable is the one
change from the Qatari model. The indicator50 identifies the workers who had returned to Nepal
from Qatar, Saudi Arabia, and United Arab Emirates. The variable was included to account for
the notion that, all else equal, a returnee from the gulf country may have greater labor
productivity, and thus higher earnings, than the rest of the population. Regression results do
show a significant positive coefficient51 for the variable. See Appendix III for the results and
more details regarding the model and Appendix IV for the age-earning profile, computed by
holding the years of formal education at 8, the median among Nepali workers in Qatar as well as
returnees from Qatar in the NLSS dataset.
48 1 USD = 99.5 NPR, average exchange rate of 2015. 49 Complied by Nepal Rastra Bank, the Central Bank of Nepal. 50 96 out of 3200 workers in the sample qualified as a gulfMigrant under this definition. 51 Higher productivity among returnee gulf migrants is an interesting result that certainly requires further, more detailed, research on its own, which is beyond the scope of this paper. Any such research should also look into the potential omitted variable bias from not including job market experience in the model: a returnee migrant is likely to have more work experience than his counterpart in Nepal.
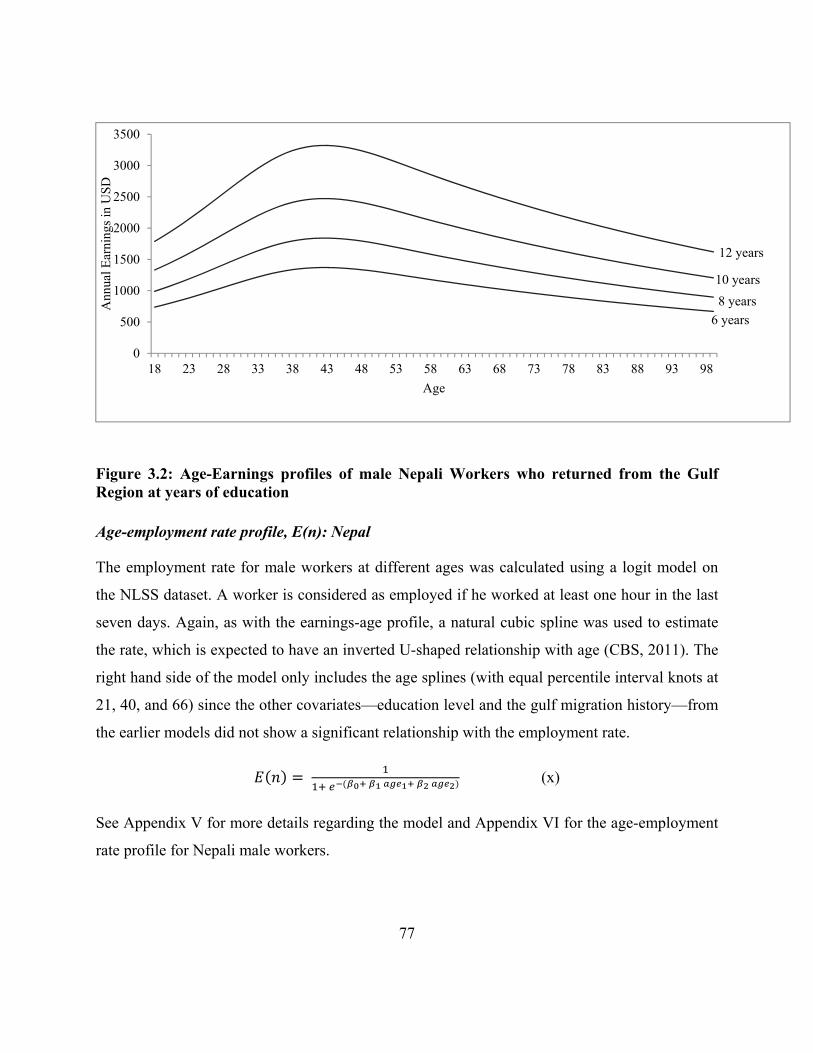
77
Figure 3.2: Age-Earnings profiles of male Nepali Workers who returned from the Gulf Region at years of education
Age-employment rate profile, E(n): Nepal
The employment rate for male workers at different ages was calculated using a logit model on
the NLSS dataset. A worker is considered as employed if he worked at least one hour in the last
seven days. Again, as with the earnings-age profile, a natural cubic spline was used to estimate
the rate, which is expected to have an inverted U-shaped relationship with age (CBS, 2011). The
right hand side of the model only includes the age splines (with equal percentile interval knots at
21, 40, and 66) since the other covariates—education level and the gulf migration history—from
the earlier models did not show a significant relationship with the employment rate.
(x)
See Appendix V for more details regarding the model and Appendix VI for the age-employment
rate profile for Nepali male workers.
0
500
1000
1500
2000
2500
3000
3500
18 23 28 33 38 43 48 53 58 63 68 73 78 83 88 93 98
Ann
ual E
arni
ngs
in U
SD
Age
12 years
8 years
10 years
6 years

78
Probability of survival,
Equations (vi) and (vii) both contain the probability of survival term, , which is calculated
using the abridged life table constructed by the Central Bureau of Statistics based on the 2011
National Population Census data (Pradhan, Acharya and Das, 2014). First, the abridged table was
expanded by using the Heligman-Pollard function (Heligman and Pollard, 1980), which is an
eight parameter model of the probability that a person of a given age survives an additional year
and is considered to be one of the best tools to inflate an abridged life table (Ibrahim, 2008).
is, then, computed as:
∏ (xi)
where: is the probability that a Nepali male of age x reaches age x+1. (See Appendix VII and
VIII for additional details and the estimated values respectively.)
It is important to note here that by using values estimated for the entire population, the paper
assumes that the mortality profile for the workers in Qatar and the male population in Nepal are
alike. Ideally, this assumption—necessary due to unavailability of data—would be tested since it
can be argued that by choosing to work abroad under environments that possibly are more
hazardous, migrant workers reveal lower levels of risk-averseness, which may be correlated with
the mortality rates.
Probability of staying,
Equations (vi) and (vii) both also contain the term, which is the probability of staying in
Qatar. The SESRI survey asked workers how long they intended to stay and the responses among
Nepali migrants ranged from 1 month to 20 years, with a mean of 2.87 years. The intended
duration was found to be unrelated to other variables, such as age, total income, occupation, and
even the number of years of they had already spent in Qatar. Therefore, assuming a constant
unconditional hazard rate, the survival function can be written as:
(xii)
79
where, .
0.349 .
Since is assumed to be same for workers of all ages, the annualized probability—that a
worker aged y stays till he is of age n—can be modeled as:
. (xiii)
It should be noted that this is a single exit duration model, which is another simplifying
assumption. In reality, workers often migrate back and forth. In a 2009 survey conducted by the
World Bank in Nepal (WB, 2011), 68 of the 139 migrants who had come back from Qatar said
they were either very likely or somewhat likely to return. The survey also shows that more than a
quarter of the workers had gone to work abroad twice or more.
Household production, : Nepal
NLSS also asked respondents to report the numbers of hours spent, during the past seven days,
on household chores: fetching water, collecting firewood, collecting fodder, husbandry,
knitting/weaving, processing preserved food, household repair, cooking/serving food, cleaning,
shopping, caring for the elderly, babysitting, and other activities. The average total hours spent in
these household activities, together with the mean hourly wage rate of NRS 55.6152 (USD 0.56)
for male workers in the agricultural and sector, was used to impute the value of household
production at age groups (See Appendix X).
Other parameters: , , and
Given the model projects economic productivity up to 81 years into the future, the paper uses the
long-term rates. International Labor Organization (ILO) estimates that the labor productivity53
growth in Nepal ( between 1992-2012 to be 2.05% and the growth in Qatar ( during the
period to be 1.89% (ILO, 2014). Estimating the real discount rate ( ) for Nepal male migrant
workers is less straightforward. Since there have not been any studies regarding individual time
preference bias for this population, this paper uses the average real interest rate of 3.34% in
52 Updated to the 2015 values using the Nepal Wage and Salary Index. 53 Defined as GDP per person employed.
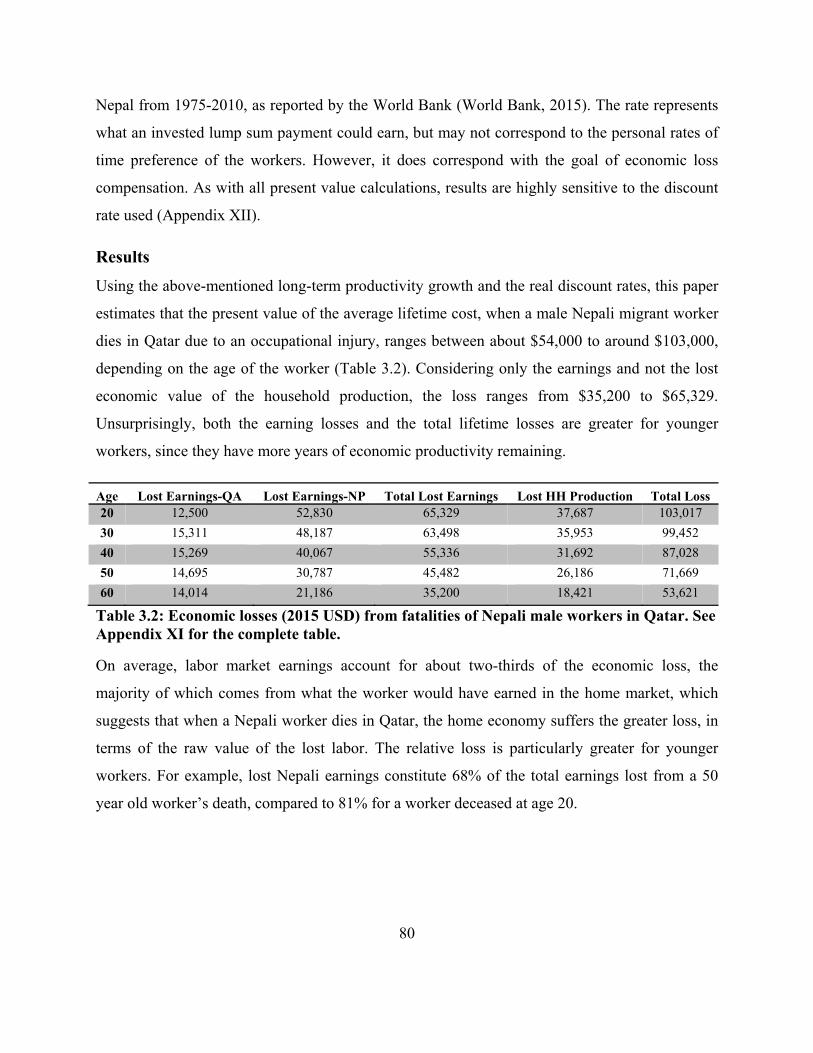
80
Nepal from 1975-2010, as reported by the World Bank (World Bank, 2015). The rate represents
what an invested lump sum payment could earn, but may not correspond to the personal rates of
time preference of the workers. However, it does correspond with the goal of economic loss
compensation. As with all present value calculations, results are highly sensitive to the discount
rate used (Appendix XII).
Results
Using the above-mentioned long-term productivity growth and the real discount rates, this paper
estimates that the present value of the average lifetime cost, when a male Nepali migrant worker
dies in Qatar due to an occupational injury, ranges between about $54,000 to around $103,000,
depending on the age of the worker (Table 3.2). Considering only the earnings and not the lost
economic value of the household production, the loss ranges from $35,200 to $65,329.
Unsurprisingly, both the earning losses and the total lifetime losses are greater for younger
workers, since they have more years of economic productivity remaining.
Age Lost Earnings-QA Lost Earnings-NP Total Lost Earnings Lost HH Production Total Loss 20 12,500 52,830 65,329 37,687 103,017
30 15,311 48,187 63,498 35,953 99,452
40 15,269 40,067 55,336 31,692 87,028
50 14,695 30,787 45,482 26,186 71,669
60 14,014 21,186 35,200 18,421 53,621
Table 3.2: Economic losses (2015 USD) from fatalities of Nepali male workers in Qatar. See Appendix XI for the complete table.
On average, labor market earnings account for about two-thirds of the economic loss, the
majority of which comes from what the worker would have earned in the home market, which
suggests that when a Nepali worker dies in Qatar, the home economy suffers the greater loss, in
terms of the raw value of the lost labor. The relative loss is particularly greater for younger
workers. For example, lost Nepali earnings constitute 68% of the total earnings lost from a 50
year old worker’s death, compared to 81% for a worker deceased at age 20.

81
Figure 3.3: Economic losses from an occupational fatality of male Nepali migrant workers in Qatar.
The Qatar Labor Law prescribes a flat lump-sum fatal occupational injury compensation of
approximately $55,000 for all workers, regardless of current earnings or the age of the worker.
For a deceased worker of age 30 (the average for low-income male Nepali migrant in Qatar, See
Table 3.1), the lump-sum amount replaces only 55% of the total expected economic loss of
$99,452 and 87% of the remaining expected lifetime labor market earnings. The replacement rate
for the total loss is less than 100% for workers below age 60, and the rate for earnings losses is
less than 100% for workers aged 40 and younger, the category that captures 90% of the low-
income male Nepali workers in Qatar.
Discussion
As mentioned before, the human capital method used in this paper has been known to produce
conservative estimates, since relying solely on the earnings data ignores the wage-risk
preferences of the workers. Another reason why these estimates are conservative is because they
are based on a simplifying assumption that workers who return to Nepal do not go back to Qatar
or other destination where they are likely to earn more they would at home. Therefore, for these
reasons, it can be expected that the economic costs of fatalities of the migrant workers are higher
82
than what this paper estimates. And, it needs to be noted that economic costs, even when
accurately estimated, fall short of the true costs, which would include deceased and his
survivors’ pain and suffering.
Despite these limitations, estimates presented here could serve Qatari policymakers as useful
yardsticks to assess the adequacy of their compensation benefits. Under the current system, even
when accounting for the temporary nature of the economic migration, an overwhelming majority
of bereaved Nepali families are entitled to benefits that are lower than the lost earning potential
of their deceased family member. However, while the replacement rates are low, they do not
seem insurmountable for a wealthy nation: the existing benefit replaces at least 80% of the lost
earnings for all Nepali migrant workers. The policymakers could also consider fixing the
inequities of the current system: because the lump-sum compensation scheme is flat, the
replacement rates are worse for higher income workers and for younger workers, who have
greater remaining lifetime earnings. As an alternative, the policymakers could look into the
Singaporean compensation scheme, where the benefit is computed as the product of the current
wages and an age-based multiplier.
When considering these policy changes, the decision makers could use this paper to assess the
economic costs of fatalities for migrant workers from other countries as well. Two facts about
this case study should be considered when generalizing the results of this paper in this regard.
First, of all foreign nationalities working in Qatar, Nepalese earn the lowest mean monthly basic
salary in Qatar. Secondly, Nepal also has the lowest GDP per capita, suggesting that, on average,
workers from other nationalities may earn more than their Nepali counterparts when they return
home. Both of these arguments imply that the current replacement rates may be even lower for
workers from other countries.
Results can also be generalized to infer the adequacy of compensation schemes in the other GCC
countries; where death benefits for a migrant worker’s death are also in form of lump-sum
payments, but are tied to the current wages instead of a flat amount. Assuming that earning-age
profiles and duration of stays of Nepali migrant workers are comparable in the other GCC
countries—a survey that suggests that they are (WB, 2011)—and given that death benefits in all
83
five are considerably lower than in Qatar (See Appendix XIII), further research is likely to show
that the replacement rates are even lower in those nations.
Future research could also look into the adequacy of compensation for non-fatal disabling
occupational injuries, which are certainly more frequent and thus affect more lives. However,
quantitative analysis on this topic would be undoubtedly more challenging, particularly due to
the lack of data and the transnational nature of such research. However, we can speculate that—
based on the analysis on this essay as well as the first one—the current disability benefits in the
GCC countries also fall short of compensating for the economic loss, particularly for younger
workers.

84
Appendices
Appendix I: The Natural Cubic Spline Regression Model for Age-Earnings Profile for Male
Nepali Workers in Qatar
ln
The first spline, , is the same as the original age variable, while is computed as
follows54:
22 40 28 28 40 22 40 28 22
40 22
where,
, 0
0, 0
Regression Results
Estimates Std. Err.
7.330284*** .2020921
.0311226*** .0098608
-.0343333** 0.014
.0280572*** .0068389
* p<0.10,** p<0.05, *** p<0.001
54 Source: STATA base reference manual

85
Appendix II: 2015 Age-Earnings55 Profile of male Nepali Workers in Qatar
Age Earnings in USD Age Earnings in USD
Age Earnings in USD
18 3344 46 4615 74 4218 19 3450 47 4600 75 4205 20 3559 48 4585 76 4191 21 3671 49 4571 77 4178 22 3787 50 4556 78 4164 23 3907 51 4541 79 4151 24 4027 52 4527 80 4138 25 4146 53 4512 81 4124 26 4261 54 4498 82 4111 27 4367 55 4483 83 4098 28 4462 56 4469 84 4085 29 4542 57 4455 85 4072 30 4607 58 4440 86 4059 31 4659 59 4426 87 4046 32 4698 60 4412 88 4033 33 4725 61 4398 89 4020 34 4742 62 4384 90 4007 35 4749 63 4370 91 3994 36 4749 64 4356 92 3981 37 4743 65 4342 93 3969 38 4733 66 4328 94 3956 39 4720 67 4314 95 3943 40 4705 68 4300 96 3930 41 4690 69 4286 97 3918 42 4675 70 4273 98 3905 43 4660 71 4259 99 3893 44 4645 72 4245 45 4630 73 4232
55 Assumes 8 years of formal education.

86
Appendix III: The Natural Cubic Spline Regression Model for the Age-Earnings Profile of
male Nepali Workers who returned from the Gulf Region
ln
The first spline, , is the same as the original age variable, while is computed as
follows56:
22 55.9 37 37 55.9 22 55.9 37 22
55.9 22
where,
, 0
0, 0
Regression Results
Estimates Std. Err.
4.582654*** .2092858
.0364801*** .0070582
-.0378935*** .0096122
.0280572*** .0089263
.4787063*** .1040187
* p<0.10,** p<0.05, *** p<0.001
56 Source: STATA base reference manual
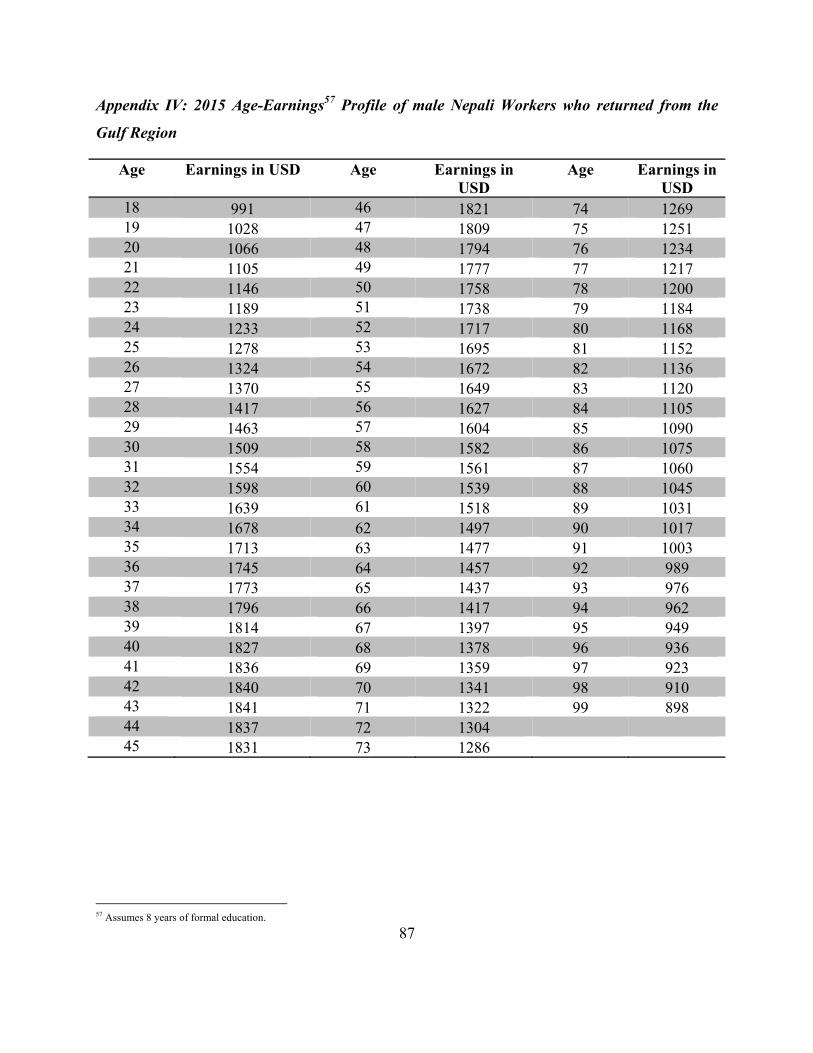
87
Appendix IV: 2015 Age-Earnings57 Profile of male Nepali Workers who returned from the
Gulf Region
Age Earnings in USD Age Earnings in USD
Age Earnings in USD
18 991 46 1821 74 1269 19 1028 47 1809 75 1251 20 1066 48 1794 76 1234 21 1105 49 1777 77 1217 22 1146 50 1758 78 1200 23 1189 51 1738 79 1184 24 1233 52 1717 80 1168 25 1278 53 1695 81 1152 26 1324 54 1672 82 1136 27 1370 55 1649 83 1120 28 1417 56 1627 84 1105 29 1463 57 1604 85 1090 30 1509 58 1582 86 1075 31 1554 59 1561 87 1060 32 1598 60 1539 88 1045 33 1639 61 1518 89 1031 34 1678 62 1497 90 1017 35 1713 63 1477 91 1003 36 1745 64 1457 92 989 37 1773 65 1437 93 976 38 1796 66 1417 94 962 39 1814 67 1397 95 949 40 1827 68 1378 96 936 41 1836 69 1359 97 923 42 1840 70 1341 98 910 43 1841 71 1322 99 898 44 1837 72 1304 45 1831 73 1286
57 Assumes 8 years of formal education.

88
Appendix V: The Natural Cubic Spline Regression Model for Age-Employment Rate Profile of
Nepali Male Workers
1
1
The first spline, , is the same as the original age variable, while is computed as
follows58:
21 66 40 40 66 21 66 40 21
66 21
where,
, 0
0, 0
Regression Results
Estimates Std. Err.
-1.31703*** .1872356
.120164*** .0063803
-.1704362*** .0081355
* p<0.10,** p<0.05, *** p<0.001
58 Source: STATA base reference manual

89
Appendix VI: 2015 Age-Employment Rate Profile of male Nepali Workers
Age Employment Rate
Age Employment Rate
Age Employment Rate
18 69.97% 46 94.92% 74 67.67% 19 72.43% 47 94.79% 75 65.54% 20 74.77% 48 94.63% 76 63.35% 21 76.97% 49 94.43% 77 61.10% 22 79.03% 50 94.18% 78 58.80% 23 80.94% 51 93.89% 79 56.47% 24 82.70% 52 93.56% 80 54.10% 25 84.31% 53 93.17% 81 51.72% 26 85.77% 54 92.74% 82 49.32% 27 87.09% 55 92.24% 83 46.93% 28 88.27% 56 91.68% 84 44.56% 29 89.33% 57 91.06% 85 42.21% 30 90.26% 58 90.37% 86 39.89% 31 91.08% 59 89.60% 87 37.62% 32 91.81% 60 88.75% 88 35.40% 33 92.43% 61 87.82% 89 33.25% 34 92.98% 62 86.80% 90 31.16% 35 93.45% 63 85.69% 91 29.14% 36 93.85% 64 84.49% 92 27.20% 37 94.18% 65 83.20% 93 25.35% 38 94.46% 66 81.82% 94 23.58% 39 94.68% 67 80.36% 95 21.90% 40 94.84% 68 78.80% 96 20.31% 41 94.96% 69 77.16% 97 18.80% 42 95.03% 70 75.43% 98 17.38% 43 95.06% 71 73.61% 99 16.05% 44 95.05% 72 71.71% 45 95.00% 73 69.73%

90
Appendix VII: Expanding the Abridged Life Table Using the Heligman-Pollard Model
Age lx Age lx 0 100000 40 88597 1 95531 45 86718 5 94520 50 83929 10 94029 55 79794 15 93644 60 73725 20 92957 65 65207 25 91998 70 53870 30 91028 75 39819 35 89949 80+ 88597
Table 3.3: Abridged life table for Nepali males. Source: Central Bureau of Statistics, Nepal.
The Heligman-Pollard Model:
1
where is the probability that a person of age x survives to age x+1 and:
where (See the second and fourth columns Table above) is the number of survivors at age x
from an original live births of 100,000. MATLAB’s lifetablefit and then lifetablegen tools use
this model to generate a full life table series from the values in the abridged table. The
estimated parameter values for the life table above were:
Parameter Estimated Values Parameter Estimated Values
A 0.0045 E 6.4655
B 0.0195 F 22.4784
C 0.1441 G 0.0001
D 0.0012 H 1.0947

91
Appendix VIII: Probability of Surviving an Additional Year by Age for Adult Nepali Males
Age Probability Age Probability Age Probability 18 to 19 0.99839 45 to 46 0.99454 72 to 73 0.94195 19 to 20 0.99824 46 to 47 0.99405 73 to 74 0.93680 20 to 21 0.99811 47 to 48 0.99351 74 to 75 0.93123 21 to 22 0.99800 48 to 49 0.99292 75 to 76 0.92521 22 to 23 0.99793 49 to 50 0.99228 76 to 77 0.91871 23 to 24 0.99787 50 to 51 0.99157 77 to 78 0.91169 24 to 25 0.99785 51 to 52 0.99079 78 to 79 0.90413 25 to 26 0.99783 52 to 53 0.98994 79 to 80 0.89600 26 to 27 0.99783 53 to 54 0.98901 80 to 81 0.88727 27 to 28 0.99782 54 to 55 0.98799 81 to 82 0.87790 28 to 29 0.99782 55 to 56 0.98688 82 to 83 0.86786 29 to 30 0.99781 56 to 57 0.98566 83 to 84 0.85714 30 to 31 0.99778 57 to 58 0.98433 84 to 85 0.84570 31 to 32 0.99774 58 to 59 0.98288 85 to 86 0.83352 32 to 33 0.99768 59 to 60 0.98130 86 to 87 0.82058 33 to 34 0.99761 60 to 61 0.97957 87 to 88 0.80687 34 to 35 0.99751 61 to 62 0.97769 88 to 89 0.79238 35 to 36 0.99738 62 to 63 0.97564 89 to 90 0.77710 36 to 37 0.99724 63 to 64 0.97340 90 to 91 0.76104 37 to 38 0.99706 64 to 65 0.97096 91 to 92 0.74420 38 to 39 0.99686 65 to 66 0.96830 92 to 93 0.72660 39 to 40 0.99663 66 to 67 0.96541 93 to 94 0.70826 40 to 41 0.99637 67 to 68 0.96226 94 to 95 0.68922 41 to 42 0.99608 68 to 69 0.95884 95 to 96 0.66951 42 to 43 0.99575 69 to 70 0.95512 96 to 97 0.64919 43 to 44 0.99539 70 to 71 0.95108 97 to 98 0.62832 44 to 45 0.99498 71 to 72 0.94670 98 to 99 0.60695

92
Appendix IX: Probability That a Nepali Male Workers of Age 18 Stays in Qatar Till Age N
0
0.1
0.2
0.3
0.4
0.5
0.6
0.7
0.8
0.9
1
18 38 58 78 98
Pro
bab
ilit
y of
Sta
yin
g
Age N

93
Appendix X: Imputed Value of Household Production for Nepali Male Workers
Household Production Age Category Mean Total Hours Per Week Imputed Value - Annualized (USD)
18-29 11.44 595 30-39 16.64 865 40-49 17.31 900 50-59 21.20 1102 60-69 21.29 1107 70-79 14.89 774 80+ 8.61 448

94
Appendix XI: Economic Losses from Fatalities of Nepali Male Workers in Qatar (2015 USD)
Age Lost Earnings Qatar Lost Earnings Nepal Total Lost Earnings Lost HH Production Total Loss 18 11,780 53,134 64,914 37,910 102,824 19 12,137 53,008 65,145 37,800 102,946 20 12,500 52,830 65,329 37,687 103,017 21 12,865 52,599 65,463 37,569 103,033 22 13,229 52,313 65,542 37,446 102,988 23 13,587 51,974 65,561 37,314 102,875 24 13,930 51,581 65,511 37,172 102,683 25 14,251 51,135 65,386 37,015 102,401 26 14,542 50,638 65,180 36,837 102,017 27 14,797 50,091 64,888 36,630 101,518 28 15,010 49,499 64,509 36,381 100,890 29 15,181 48,863 64,043 36,074 100,118 30 15,311 48,187 63,498 35,953 99,452 31 15,404 47,477 62,882 35,558 98,439 32 15,465 46,736 62,201 35,156 97,357 33 15,496 45,968 61,464 34,749 96,213 34 15,504 45,176 60,679 34,335 95,015 35 15,491 44,363 59,854 33,915 93,769 36 15,463 43,532 58,994 33,486 92,481 37 15,423 42,685 58,108 33,048 91,156 38 15,375 41,824 57,199 32,599 89,799 39 15,323 40,951 56,274 32,137 88,411 40 15,269 40,067 55,336 31,692 87,028 41 15,214 39,174 54,388 31,204 85,591 42 15,159 38,271 53,430 30,706 84,136 43 15,103 37,359 52,462 30,199 82,661 44 15,047 36,440 51,487 29,678 81,165 45 14,990 35,513 50,503 29,142 79,645 46 14,933 34,579 49,512 28,586 78,097 47 14,874 33,639 48,513 28,003 76,516 48 14,815 32,693 47,509 27,385 74,894 49 14,756 31,742 46,498 26,719 73,217 50 14,695 30,787 45,482 26,186 71,669 51 14,633 29,828 44,462 25,445 69,907 52 14,571 28,867 43,437 24,696 68,134 53 14,507 27,903 42,410 23,939 66,349 54 14,441 26,938 41,380 23,173 64,553 55 14,374 25,974 40,348 22,400 62,748 56 14,306 25,010 39,316 21,618 60,934 57 14,236 24,048 38,284 20,828 59,112 58 14,164 23,089 37,253 20,031 57,284 59 14,090 22,135 36,225 19,227 55,452 60 14,014 21,186 35,200 18,421 53,621

95
Appendix XII: Sensitivity of the Economic Losses59 to Selected Discount Rates
Real Discount Rate
Lost Earnings Qatar
Lost Earnings Nepal
Total Lost Earnings
Lost HH Production
Total Loss
0.00% 16,452 126,207 142,659 101,690 244,349
3.34%* 15,181 48,863 64,043 36,074 100,118
5.00% 14,644 34,172 48,816 24,299 73,115
10.00% 13,310 15,930 29,240 10,405 39,645
* Rate used for the results section.
59 For a 29 year old worker in 2015 USD

96
Appendix XIII: Lump-sum compensations for occupational fatality in the GCC Countries
Countries60 Death Benefits61 (Approx. USD)
Kuwait $18,645
Oman $11,520
Qatar $54,920
Saudi Arabia $26,880
UAE $7,680
60 Bahraini benefit are in form of monthly pensions and thus not easily comparable 61 For a worker that earns $320/per month working 6 days a week

97
Conclusions
This dissertation investigated global occupational injury research topics that have been largely
unexplored for various reasons, including lack of reliable data. The first chapter directly
addressed that challenge and provided the first quantitative model to predict country-level fatal
occupational injury counts. As the chapter conservatively estimated, every year approximately
250,000 workers worldwide die from injuries sustained in work-related accidents.
The chapter also looked at the distribution of the fatalities across countries. It showed that lower
income countries bear the burden disproportionate to their levels of economic activity: 17% of
the total work fatalities occur in the poorest group of 31 countries that produce 0.4% of the world
GDP. The chapter also found that official government counts tend to severely underestimate this
epidemic. For example, more than half of the ILO members reported figures that were less than
10% of this paper’s estimates.
The key takeaway from the analysis in Chapter 1 is that there is a great need for reliable work
injury accounting systems in most countries. Quantifying the number of fatal occupational
injuries is first step towards recognizing the epidemic nature of this problem, which is in turn the
first step towards remedying it. Since most occupational injuries occur as isolated events, their
pervasiveness is likely to remain hidden or be severely underrated without a proper monitoring
system in place. Currently, most governments in the developing world collect injury statistics
directly from the employers, who are mandated to report all accidents. Such systems—due to
reasons including poor compliance and enforcement—miss 50%-70% of the occupational
injuries even in economically advanced countries (European Agency for Safety and Health at
Work, 2000).
One alternative to the current approach might be to collect data directly from the insurers of
work injury compensation. However, employers insuring against their liability to injured workers
is not a common practice in many countries, particularly less developed countries where fatal
injuries are the most common. As the second chapter revealed, there are clear differences in
work injury compensation systems even among a small set of neighboring countries with very
similar political, cultural and economic makeups, including their heavy reliance on foreign labor.

98
Among the six Gulf Cooperation Council (GCC) countries, in two (Bahrain and Saudi Arabia),
work injury claims are processed by their respective social insurance agencies, which require
employers to pay a small percentage of the wages as premiums; one (Oman) mandates employers
to be privately insured; and in the remaining three (Kuwait, Qatar, and UAE), employers are not
required to be insured at all.
Switching to an insurance-based compensation system would help governments in these
countries (and others around the world) collect more reliable statistics. More importantly in this
context, an insurance-based system could also give the employers greater incentives to improve
workplace safety. Theoretically, ceteris paribus, there should not be much difference in terms of
employer’s incentives under the two types of systems. However, as the second chapter explains,
all else may not be equal. Given the systemic advantages and considerable authority employers
have over migrant workers under the Kafala visa sponsorship, the probability that the injured
worker reports and then files a successful compensation claim might be lower under the current
system than in a system in which the worker does not get placed in a potentially adversarial
situation with the employer.
The other key recommendation for the policymakers of the GCC nations concerns the adequacy
of compensation benefits. The institutional review found that the lump-sum compensation
benefit fixed under the laws in four of the six Arab countries replace two-thirds62 of the lost
present value discounted earnings of permanently disabled or the deceased worker, but only if
they had less than 3-1163 years left on the workforce. Note that the mean and median ages for
low-skilled migrant workers in the GCC countries tend to be in the late twenties to early thirties.
As a reference point, the work injury compensation law in Singapore, a country with comparable
income per capita and reliance on foreign labor, is more generous and replaces 20 years of lost
discounted earnings.
The third chapter further developed the framework that the GCC policymakers can use to
evaluate the adequacy of benefits they provide to temporary migrant workers. Specifically, using
62 The two-thirds income replacement is generally considered as the standard for disability benefits. Note that the consensus on death benefits is less clear. The chapter uses the PTD standard for death as well, since laws in the GCC countries mostly treat them identically. 63 Less than 3 years for UAE, 5 for Oman, 9 for Kuwait, and 11 for Saudi Arabia. Qatari law specifies a flat compensation sum that does not take into account the current earnings of the worker. Bahraini law does not specify lump-sum compensations.
99
nationally representative datasets, it estimated the economic burden placed upon a Nepali male
migrant worker’s family when he dies from an accident working in Qatar. The estimated loss
was then used to evaluate the adequacy of the death benefits under the Qatari law: the flat
compensation scheme of approximately $55,000 replaces at least 80% of the average lost
lifetime earnings for all ages of Nepali male workers. While the Qatari benefit seems generous,
particularly when compared to those in other GCC nations as well as in other economically
advanced countries, it should be noted that these results are for the lowest-income workers in
Qatar. Flat compensation benefit—which is unusual both regionally and globally—means that
the lump-sum amount is not dependent on the worker’s earnings. Therefore, the replacement rate
would be considerably lower for workers earning more.
Implicitly, the chapter also provides an estimate of value of a statistical life (VSL) that can be
used to crudely gauge the global economic burden of fatal occupational injuries. The total
economic loss upon the death of a 40-year-old male worker, ignoring his earnings in the Qatari
market, is around $72,000, roughly 175 times the Nepali GDP per capita (in 2005 constant US
$). As a reference point from the other end of the income level range, Viscusi and Aldy (2003)
estimated the median VSL of $7 million for prime-aged U.S. workers, which puts the VSL-GDP
per capita ratio around 166. Applying the third chapter’s ratio to the 2013 country-level fatality
figures from the first, this back-of-the-envelope calculation estimates that the global economic
burden is more than $200 billion per year. The aggregate amount is, obviously, sensitive to the
values placed on the lost lives.
In addition to drawing attention to extensiveness of occupational injuries and the uneven
distribution of the burden, offering recommendations for collecting injury statistics, and
providing policymakers with instruments to evaluate their compensation systems, this
dissertation also aims to point out the knowledge gaps that should concern reformers and future
researchers alike. Most obviously, in order to understand another dimension of this epidemic, we
need estimates of the occupational injuries that are non-fatal, which are likely to affect far greater
number of workers around the world. While the methodology developed in this dissertation
could be used to develop such estimates, sample selection would pose greater challenges because
underreporting of non-fatal occupational injuries have been found to be significantly higher,

100
even in countries that have sophisticated aggregated systems. Similarly, estimating economic
losses from non-fatal but permanently disabling injuries is a considerably greater challenge,
particularly in the context used by this dissertation. Nonetheless, it is a very important task, since
incidence rates for such injuries are far higher than for fatalities.

101
References
Al-Dawood, Kasim, "Non-fatal occupational injuries requiring admission to hospitals in Al-Khobar City, Saudi Arabia: prospective cohort study," Croatian medical journal, Vol. 41, No. 3, 2000, pp. 323-326.
Al-Thani, Hassan, Ayman El-Menyar, Rafael Consunji, Ahammed Mekkodathil, Ruben Peralta, Katharine A Allen, and Adnan A Hyder, "Epidemiology of occupational injuries by nationality in Qatar: Evidence for focused occupational safety programmes," Injury, 2015.
Bailer, A John, LD Reed, and Leslie T Stayner, "Modeling fatal injury rates using Poisson regression: a case study of workers in agriculture, forestry, and fishing," Journal of Safety Research, Vol. 28, No. 3, 1997, pp. 177-186.
Bailer, A John, Leslie T Stayner, Nancy A Stout, Laurence D Reed, and Stephen J Gilbert, "Trends in rates of occupational fatal injuries in the United States (1983-92)," Occupational and Environmental Medicine, Vol. 55, No. 7, 1998, pp. 485-489.
Barss, Peter, Ken Addley, Michal Grivna, Cristina Stanculescu, and Fikri Abu-Zidan, "Occupational injury in the United Arab Emirates: epidemiology and prevention," Occupational Medicine, Vol. 59, No. 7, 2009, pp. 493-498.
Baruah, Nilim, "Trends and Outlook for Labour Migration in Asia," The Third ADBI-OECD-ILO Roundtable on Labour Migration in Asia, Bangkok, 2013. As of 08/15/2013:
http://www.adbi.org/files/2013.01.23.cpp.sess1.2.baruah.labour.migration.asia.pdf
Berkowitz, Monroe, and John F Burton Jr, Permanent Disability Benefits in Workers' Compensation: ERIC, 1987.
Biddle, Elyce Anne, The Cost of fatal injuries to civilian workers in the United States, 1992-2001: Department of Health and Human Services, Public Health Service, Centers for Disease Control and Prevention, National Institute for Occupational Safety and Health, 2009.
Bohlen, Francis Hermann, Studies in the Law of Torts: Bobbs-Merrill Company, 1926.
CBS, Nepal Living Standards Survey 2010/11 Statistical Report, Central Bureau of Statistics, 2011.
DESA, International Migration in the Arab Region, Beirut, Lebanon: Department of Economic and Social Affairs, United Nations, 2006.
———, International Migration Report, Department of Economic and Social Affairs, United Nations, 2013.
DOFE, Labour Migration for Employment; A Status Report for Nepal: 2013/2014, Nepal: Department of Foreign Employment Ministry of Labour and Employment, 2014.
102
———, Labour Migration for Employment; A Status Report for Nepal: 2014/2015, Nepal: Department of Foreign Employment Ministry of Labour and Employment, 2016.
Embassy of the State of Qatar, Qatar Labor Law, 2004. http://www.qatarembassy.net/page/qatar-labor-law
Epstein, Richard A, "The Historical Origins and Economic Structure of Workers' Compensation Law," Georgia Law Review, Vol. 16, 1981, p. 775. http://chicagounbound.uchicago.edu/cgi/viewcontent.cgi?article=2237&context=journal_articles
European Agency for Safety and Health at Work, The state of occupational safety and health in the European Union: pilot study, Vol. 1: European Communities, 2000.
Fargues, Philippe, "Immigration without inclusion: Non-nationals in nation-building in the Gulf States," Asian and Pacific Migration Journal, Vol. 20, No. 3-4, 2011, pp. 273-292.
Gardner, Andrew, Silvia Pessoa, Abdoulaye Diop, Kaltham Al-Ghanim, Kien Le Trung, and Laura Harkness, "A Portrait of Low-Income Migrants in Contemporary Qatar," Journal of Arabian Studies, Vol. 3, No. 1, 2013, pp. 1-17.
General Organization for Social Insurance, Social Insurance Law, 2000. http://www.gosi.gov.sa/portal/web/guest/regulation/
General Pension and Social Security Authority, Federal Law No. 7 Year 1999 for Pension and Social Security, 1999. https://www.dm.gov.ae/wps/wcm/connect/a56bab0048dbf6469a0b9a15e00830e5/Info-FederalLawNo.%287%29Year1999forPensionandSocialSecurity-e.pdf?MOD=AJPERES
Gerking, Shelby, Menno De Haan, and William Schulze, "The marginal value of job safety: A contingent valuation study," Journal of risk and uncertainty, Vol. 1, No. 2, 1988, pp. 185-199.
GulfTalent, Employment and Salary Trends in the Gulf, Dubai, United Arab Emirates: GulfTalent, 2015. http://www.gulftalent.com/resources/market-research-reports/employment-and-salary-trends-in-the-gulf-2015-41
Guyton, Gregory P, "A brief history of workers' compensation," The Iowa orthopaedic journal, Vol. 19, 1999, p. 106.
Haller Jr, John S, "Industrial accidents--worker compensation laws and the medical response," Western Journal of Medicine, Vol. 148, No. 3, 1988, p. 341.
Hämäläinen, Päivi, Kaija Leena Saarela, and Jukka Takala, "Global trend according to estimated number of occupational accidents and fatal work-related diseases at region and country level," Journal of Safety Research, Vol. 40, No. 2, 2009, pp. 125-139.

103
Hammitt, James K, "Valuing mortality risk: theory and practice," Environmental Science & Technology, Vol. 34, No. 8, 2000, pp. 1396-1400.
Harrell, Frank, Regression modeling strategies: with applications to linear models, logistic and ordinal regression, and survival analysis: Springer, 2015.
Heligman, Larry, and John H Pollard, "The age pattern of mortality," Journal of the Institute of Actuaries, Vol. 107, No. 01, 1980, pp. 49-80.
Ibrahim, Rose Irnawaty, "Expanding an abridged life table using the Heligman-Pollard Model," Matematika, Vol. 24, 2008, pp. 1-10.
ILO, "Towards a fair deal for migrant workers in the global economy," International Labor Conference, 92nd Session, International Labor Office, Geneva, 2004.
———, "Integrating Labour Migration into the 2013 UN High-level Dialogue on International Migration and Development, and the Post-2015 UN Development Agenda," 2013. http://www.un.org/esa/population/meetings/HLD2013/documents/ILO_HLD_position_paper.pdf
———, Global Employment Trends 2014: Risk of a Jobless Recovery, Geneva: International Labor Organization, 2014.
Keane, David, and Nicholas McGeehan, "Enforcing migrant workers' rights in the United Arab Emirates," International Journal on Minority and Group Rights, Vol. 15, No. 1, 2008, pp. 81-115.
Kingdom of Bahrain, Unofficial English Tranlation: Law No. 36 of 2012 The Labour Law for the Private Sector, 2012. http://www.ilo.org/dyn/natlex/natlex_browse.details?p_lang=en&p_isn=91026
Kniesner, Thomas J, and John D Leeth, "Compensating wage differentials for fatal injury risk in Australia, Japan, and the United States," Journal of risk and uncertainty, Vol. 4, No. 1, 1991, pp. 75-90.
Kramer, Samuel Noah, History begins at Sumer: Thirty-nine firsts in recorded history: University of Pennsylvania press, 1981.
Leigh, J Paul, James P Marcin, and Ted R Miller, "An estimate of the US government’s undercount of nonfatal occupational injuries," Journal of Occupational and Environmental Medicine, Vol. 46, No. 1, 2004, pp. 10-18.
Leigh, J Paul, Steven B Markowitz, Marianne Fahs, Chonggak Shin, and Philip J Landrigan, "Occupational injury and illness in the United States: estimates of costs, morbidity, and mortality," Archives of Internal Medicine, Vol. 157, No. 14, 1997, p. 1557.

104
Leigh, James, Petra Macaskill, Eeva Kuosma, and John Mandryk, "Global burden of disease and injury due to occupational factors," Epidemiology-Baltimore, Vol. 10, No. 5, 1999, pp. 626-631.
Loimer, Hermann, and Michael Guarnieri, "Accidents and acts of God: a history of the terms," American journal of public health, Vol. 86, No. 1, 1996, pp. 101-107.
McFadden, Daniel, "Quantitative methods for analyzing travel behavior of individuals: some recent developments," 1977.
Mincer, Jacob A, "Age and Experience Profiles of earnings," Schooling, experience, and earnings: NBER, 1974, pp. 64-82.
Ministry of Labor Saudi Arabia, Labor Law, 2006. http://www.ilo.org/dyn/natlex/docs/MONOGRAPH/74429/89847/F2095468703/SAU74429 Arab.pdf
Ministry of Labour and Social Affairs, Federal Law No. 8 on Regulation of Labor Relations, 1980. http://www.ilo.org/dyn/natlex/docs/ELECTRONIC/11956/69376/F417089305/ARE11956.pdf
Ministry of Labour Bahrain, Bahrain Law No. 24 of 1976 The law on social insurance, 1976. http://www.ilo.org/dyn/natlex/docs/ELECTRONIC/7240/83058/F299677839/BHR7240.pdf
Ministry of Manpower, Work Injury Compensation Act, 2008, code edition dated May 2008. As of August 15, 2015:
http://www.mom.gov.sg/workplace-safety-and-health/work-injury-compensation
Moore, Michael J, and W Kip Viscusi, "The quantity‐adjusted value of life," Economic Inquiry,
Vol. 26, No. 3, 1988, pp. 369-388.
Naithani, Pranav, and AN Jha, "Challenges faced by expatriate workers in Gulf Cooperation Council countries," International Journal of Business and Management, Vol. 5, No. 1, 2009, p. p98.
National Commission, The Report of the National Commission on State Workmen’s Compensation Laws, Washington, D.C.: The National Commission on State Workmen’s Compensation Laws, 1972. http://workerscompresources.com/?page_id=28
Nygren-Krug, Helena, International migration, health and human rights: World Health Organization, 2004.
OECD, "Chapter 4: Occupational Accidents in OECD Countries," Employment Outlook 1989, Paris, France, 1989.
105
PIFSS Kuwait, Social Security Guide in Kuwait, 2009. http://www.pifss.gov.kw/upload/pifss_e_guide_eng_212.pdf
Pradhan, Mahesh Chand, Yadu Nath Acharya, and Ramesh Chandra Das, Chapter 8: Life Table Analysis of Nepal, Central Bureau of Statistics, 2014.
Prosser, William L, Handbook of the Law of Torts, 4th ed., 1972.
Ratha, D, C Eigen-Zucchi, S Plaza, H Wyss, and S Yi, "Migration and remittance flows: Recent trends and outlook, 2013–2016," Migration and Development Brief, Vol. 21, 2013, p. 2.
Reville, Robert T, Seth A Seabury, Frank W Neuhauser, John F Burton Jr, and Michael D Greenberg, An evaluation of California’s permanent disability rating system: RAND Corporation, 2005.
Rice, Dorothy P, Ellen J MacKenzie, AS Jones, SR Kaufman, GV DeLissovoy, W Max, E McLoughlin, TR Miller, LS Robertson, and DS Salkever, "Cost of injury in the United States: A report to Congress," 1989.
Rubin, Donald B, Multiple imputation for nonresponse in surveys, Vol. 81: John Wiley & Sons, 2004.
Ruser, John W, "Workers' compensation and occupational injuries and illnesses," Journal of Labor Economics, 1991, pp. 325-350.
Saif, Ibrahim, The Oil Boom in the GCC Countries, 2002-2008: Old Challenges, Changing Dynamics: Carnegie Endowment for International Peace, 2009.
Schenker, Marc B., "A global perspective of migration and occupational health," American Journal of Industrial Medicine, Vol. 53, No. 4, 2010, pp. 329-337. http://dx.doi.org/10.1002/ajim.20834
Seabury, Seth A, Robert T Reville, Stephanie Williamson, Christopher F McLaren, Adam Gailey, Elizabeth Wilke, and Frank W Neuhauser, Workers' Compensation Reform and Return to Work, Santa Monica, California: RAND Corporation, 2011.
State of Kuwait, New Private Sector Labour Law No. 6 of 2010, 2010. http://www.ilo.org/dyn/natlex/docs/MONOGRAPH/83616/93041/F734599679/KWT83616 English 2.pdf
State of Qatar, Law No. 38 of 1995 on Social Security, 1995. http://www.almeezan.qa/LawPage.aspx?id=3979&language=ar
Strong, Larkin L, and Frederick J Zimmerman, "Occupational injury and absence from work among African American, Hispanic, and non-Hispanic White workers in the national longitudinal survey of youth," American journal of public health, Vol. 95, No. 7, 2005, p. 1226.
106
Sultanate of Oman - Ministry of Social Development, The Social Security Act, 1984. http://mosd.gov.om/rules/%D9%82%D8%A7%D9%86%D9%88%D9%86 %D8%A7%D9%84%D8%B6%D9%85%D8%A7%D9%86 %D8%A7%D9%84%D8%A7%D8%AC%D8%AA%D9%85%D8%A7%D8%B9%D9%8A.pdf
Takala, Jukka, "Global estimates of fatal occupational accidents," Epidemiology-Baltimore, Vol. 10, No. 5, 1999, pp. 640-646.
U.S. Department of Labor, Bureau of International Labor Affairs,, Oman Labor Rights Report, 2005. http://www.dol.gov/ilab/reports/pdf/OmanMLRRFINAL.pdf
Van Charante, Anton W Moll, and Paul G Mulder, "Reporting of industrial accidents in the Netherlands," American journal of epidemiology, Vol. 148, No. 2, 1998, pp. 182-190.
Victor, Richard B, Lisa R Cohen, and Charles E Phelps, "Workers' Compensation and Workplace Safety," Santa Monica, Calif: Rand Corporation, 1982.
Viscusi, Kip W, Wesley A Magat, and Joel Huber, "Pricing environmental health risks: survey assessments of risk-risk and risk-dollar trade-offs for chronic bronchitis," Journal of Environmental economics and management, Vol. 21, No. 1, 1991, pp. 32-51.
Viscusi, W Kip, "The value of risks to life and health," Journal of economic literature, Vol. 31, No. 4, 1993, pp. 1912-1946.
Viscusi, W Kip, and Joseph E Aldy, "The value of a statistical life: a critical review of market estimates throughout the world," Journal of risk and uncertainty, Vol. 27, No. 1, 2003, pp. 5-76.
Wafta, Nabil, The National Occupational Safety and Health Profile of the Sultanate of Oman, Ministry of Manpower in collaboration with the International Labor Organization, 2009. http://www.ilo.org/wcmsp5/groups/public/---ed_protect/---protrav/---safework/documents/policy/wcms_187855.pdf
WB, Large-scale Migration and Remittance in Nepal: Issues, Challenges, and Opportunities, The World Bank Group, 2011.
Weil, David, "Valuing the economic consequences of work injury and illness: a comparison of methods and findings," American Journal of Industrial Medicine, Vol. 40, No. 4, 2001, pp. 418-437.
White, Ian R, Patrick Royston, and Angela M Wood, "Multiple imputation using chained equations: Issues and guidance for practice," Statistics in medicine, Vol. 30, No. 4, 2011, pp. 377-399.
WHO, WHO methods and data sources for country-level causes of death 2000-2012, Geneva: World Health Organization, 2014.

107
World Bank, "World Development Indicators Data Tables," edited by World Bank, 2015. As of 2015:
http://data.worldbank.org/indicator/FR.INR.RINR/countries/1W-MV?page=1&display=default