the global environmental engineers, 2015, 71-78 71
TRANSCRIPT
The Global Environmental Engineers, 2015, 2, 71-78 71
E-ISSN: 2410-3624/15 © 2015 Avanti Publishers
Measurement of PM2.5 and Water-Soluble Ions at Central Tokyo, Japan and Source Apportionment
Shiori Ota1, Junya Hanasaki2, Kazuhiro Toki2, Takuto Horigome2, Akihiro Takemasa2, Yuri Ohkoshi3, Nami Takahashi3 and Yoshika Sekine1, 3, *
1Graduate School of Science, Tokai University, Kanagawa, Japan 2Tokai University Bosei Senior High School, Tokyo, Japan 3Department of Chemistry, School of Science, Tokai University, Kanagawa, Japan
Abstract: Air pollution by fine particulate matter, PM2.5 has been inviting considerable concerns in East Asia. This study then aimed to characterize PM2.5 and its water-soluble ions collected at Shibuya, central Tokyo, Japan from July 2013 to May 2015, in order to better understand the air pollution mechanism and potential sources of PM2.5 of the city. Analytical results showed the PM2.5 was a mixture of aggregates of formless particles and its concentration ranged from 5.4 to 39µg/m3, with a mean of 14 ± 6.7µg/m3 (n=46). SO4
2- and NH4+ were abundant in PM2.5 and their presence mostly
determined the variation of PM2.5 level. High concentration episodes were found in the season when air masses came from Asian continent, and a long-range transport of urban aerosols and soil-derived particles was suggested by changes in the chemical compositions.
Keywords: PM2.5, water-soluble ions, source apportionment, Tokyo.
1. INTRODUCTION
Air pollution by fine particulate matter, PM2.5 (defined as PM less than 2.5µm in aerodynamic diameter) has been inviting considerable concerns in East Asia because of severe pollution levels in China [1, 2], and its adverse effects on human health. Increased mortality by pulmonary and/or cardiovascular diseases due to exposure to PM2.5 has been documented in a number of cohort studies such as Harvard Six Cities Study [3-5], American Cancer Society (ACS) cohort study [6-8], Great Britain Study [9] and other valuable studies summarized in ref [10]. Association of increased daily mortality with short-term exposure to PM2.5 has been also reported by epidemiological studies carried out in Chinese cities [11, 12]. However, unlike other countries, no remarkable relationship has been found between fine particles and excess mortality in Japan [10]. PM2.5 is a mixture of various particles emitted and/or generated from natural and anthropogenic sources, and hence appearance of adverse health effects may depend on the chemical composition of PM2.5 at the receptor site. Therefore, understanding chemical components and source apportionment of PM2.5 using the chemical fingerprint is important for pollution control of the complex media.
*Address correspondence to this author at the Department of Chemistry, School of Science, Tokai University, Kanagawa, Japan; Tel: +81-463-58-1211; Fax: +81-463-58-9543; E-mail: [email protected]
Water-soluble components are known to account for majority of the PM2.5 mass [13, 14]. The major ions such as sulfate (SO4
2-), nitrate (NO3-) and ammonium
ion (NH4+) have effects on the hygroscopic nature and
acidity of aerosol, while their concentrations in air vary with seasons and geological locations [13]. Then, this study aimed to characterize PM2.5 and its water-soluble ions collected at Shibuya, central Tokyo, Japan from July 2013 to May 2015, in order to better understand the air pollution mechanism and potential sources of PM2.5 of the city, employing correlation analysis and trajectory analysis. The correlation analysis has been widely used for source apportionment of particulate matters, because significant mutual correlations between seasonal variations of air concentrations in PM and its components may show a possibility of sharing the common emission source by the paired variables [15]. Air trajectories are also used to study source–receptor relationship in environmental research by calculating airflow pattern from an emission source (forward) or from a sampling site (backward) [16, 17]. In this study, the back trajectory analysis was used to investigate the potential source area of high concentration episodes of PM2.5 at central Tokyo.
2. METHODS 2.1. Sampling Site
Figure 1 shows the geographical location of Shibuya, Tokyo, Japan. Routine sampling of PM2.5 was conducted at the open-air space of the school building

72 The Global Environmental Engineers, 2015, Vol. 2, No. 2 Ota et al.
of Tokai University Bosei Senior High School located at Shibuya, Tokyo. Shibuya is one of the biggest cities in central Tokyo, Japan, having a population density of 13,540 people per km². The city is used to refer to a fashion center of Japan, particularly for young people. The sampling site locates in cultural and residential area of the city.
2.2. Collection of PM2.5 Samples
PM2.5 was collected on a quartz fiber filter (QMA 47mmφ, Whatman) at a flow rate of 16.7L/min for 7 days by PM2.5 sampler (Thermo Fisher Scientific, Partisol® - FRM Model 2000). Both before and after sampling, filters were conditioned more than 24 hours under constant temperature (20℃) and relative humidity (50 ± 5%), then the weight of filter was quantified by using a microbalance. The concentration of PM2.5 was determined by the weight difference and total sampling volume of air. Note that routine collection of PM2.5 and measurement of PM2.5 concentration were carried out by high school students, and subsequent chemical analysis was conducted by staffs of Tokai University.
2.3. FE-SEM and EPMA Analysis
Morphology of individual fine particles consisting of the PM2.5 at Shibuya was observed by Field Emission Scanning Electron Microscope (FE-SEM, Hitachi,
S-4800) at Tokai University (Kanagawa, Japan), after coated with a thin Au film to achieve higher quality secondary electron images. Distribution of major ions as particles on the quartz fiber filter was also analyzed by using Electron Probe Micro Analyzer (EPMA, Shimadzu, EPMA-1610) at Tokai University. EPMA is a non-destructive analytical tool used to determine the chemical composition of small volumes of solid materials within 10~30 cubic micrometers. The sample is bombarded with an electron beam, and signals that come from the sample are collected and displayed as like a map.
2.4. Water-Soluble Ion Analysis
After measurement of PM2.5 concentration, the filters were cut into 14mmφ pieces by a pierce punch. The two pieces were transferred into a test tube together and water-soluble ions in PM2.5 were extracted in 10mL ultrapure water (Milli-Q) with a mild shaking for 90 min. After filtration by a disposable cellulose acetate membrane filter having 0.20µm of pore size (Advantec, DISMIC-25CS), the filtrate was served for ion analysis. Concentrations of the water-soluble ions (Na+, NH4
+, K+, Mg2+, Ca2+, Cl-, NO3
-, SO42-) were determined by
ion chromatography (IC) systems.
The IC system for the determination of cation consisted of Shimadzu LC-20AD with a conductivity detector COD-10AVP. The following conditions were used: column, φ 4.6×150mm, 7µm, Shim-pack IC-C4 (Shimadzu); eluent, 2.5mM oxalic acid solution at 1.0ml/min (isocratic); oven temperature, 40℃; injection volume, 20µL. The IC system for anion consisted of Dionex ICS-90 with a chemical suppressor AMMS III. The following conditions were used: separation column, 4.0 × 250mM, IonPac AS9-HC (Dionex) with a guard column IonPacAG4 (Dionex); eluent, 5mM sodium carbonate at 1.0ml/min (isocratic), scavenger for the chemical suppressor, 15mM sulfuric acid solution at 1.0ml/min; oven temperature, 40℃; injection volume, 25µL. Dilution series of reagent grade NaCl, NH4Cl, KCl, MgCl2, CaCl2, NaCl, NaNO3 and Na2SO4 in ultrapure water were used for calibration and determination. All the reagents were obtained from Kanto Chemical, Japan.
Significant contamination by field handling and during storage was slightly found in storage blanks for anions, limit of detection (LOD) was defined as three-fold the standard deviation of the blank for anions and of 1.0µL ml-1 of standard solutions for cations (3σ). The LODs resulted in 0.0053µg/m3 for Na+, 0.0030µg/m3 for
Figure 1: Location of sampling site, Shibuya, central Tokyo, Japan.

Measurement of PM2.5 and Water-Soluble Ions at Central Tokyo The Global Environmental Engineers, 2015, Vol. 2, No. 2 73
NH4+, 0.0023µg/m3 for K+, 0.0032µg/m3 for Mg2+,
0.013µg/m3 for Ca2+, 0.0010µg/m3 for Cl-, 0.0029µg/m3 for NO3
- and 0.0036µg/m3 for SO42-.
2.5. Back Trajectory Analysis
In order to characterize the general behavior of air masses in a given sampling period and to evaluate the relative contributions by local sources and long-range transportation to the total PM2.5, three-day backward trajectories from the sampling site (longtitude: 139.7, latitude: 35.6) were computed beginning every 24h during the sampling duration using the Meteorological Data Explorer (METEX) program (Center for Global Environmental Research, National Institute for Environmental Studies) developed by Zeng et al. [16, 17] and available from the METEX website. The altitude above ground level was set to 500m.
3. RESULTS AND DISCUSSION
3.1. Morphology and Elemental Map of PM2.5
Figure 2 shows a typical FE-SEM image of fine particles collected on the quartz fiber filter at Shibuya, Tokyo. The aggregates of formless particles were attached on the surface of fiber webs. These particles seemed a mixture of different particles and the shape and structure was not uniform, so it was very difficult to identify the particles by visual observations.
Figure 2: A typical FE-SEM image of the PM2.5 sample collected at Shibuya, Tokyo (x3000).
EPMA analysis showed significant abundances of major elements such as Al, C, Ca, Fe, K, Mg, N, Na, O, S, Si and Ti in the PM2.5 sample. Among the elements, Si and O are major components of the quartz fiber itself, and certain amount of Al, Ca, Mg and Na are contained as impurities of the filter [18]. Excluding
these elements, relatively higher abundance was found for C and S. Figure 3 shows elemental distribution maps of C and S in a focus window of 480×480µm length. Carbon (red dot) was widely distributed in all over the sample with higher content. This means fine particles containing carbon, usually referred to elemental carbon (EC) and organic carbon (OC), are major components of PM2.5 collected at Shibuya, Tokyo. Meanwhile, the picture also shows the presence of S (red dot) with very fine and dispersed signals. Comparing with carbon, S-containing particles were much finer than those containing carbon, probably because of most of S-containing aerosols such as water-soluble sulfate are secondary particles converted from gases.
3.2. Concentration of PM2.5 and Water-Soluble Ions
Mean concentrations and standard deviations of PM2.5 and water-soluble ions were summarized in Table 1. For the convenience in investigating seasonal differences, the results were classified into four seasons; spring (March to May), summer (June to August), autumn (September to November), and winter (December to February). The mean values and standard deviations at each season were also
Figure 3: Elemental distribution maps of C and S on the PM2.5 sample collected at Shibuya, Tokyo.
74 The Global Environmental Engineers, 2015, Vol. 2, No. 2 Ota et al.
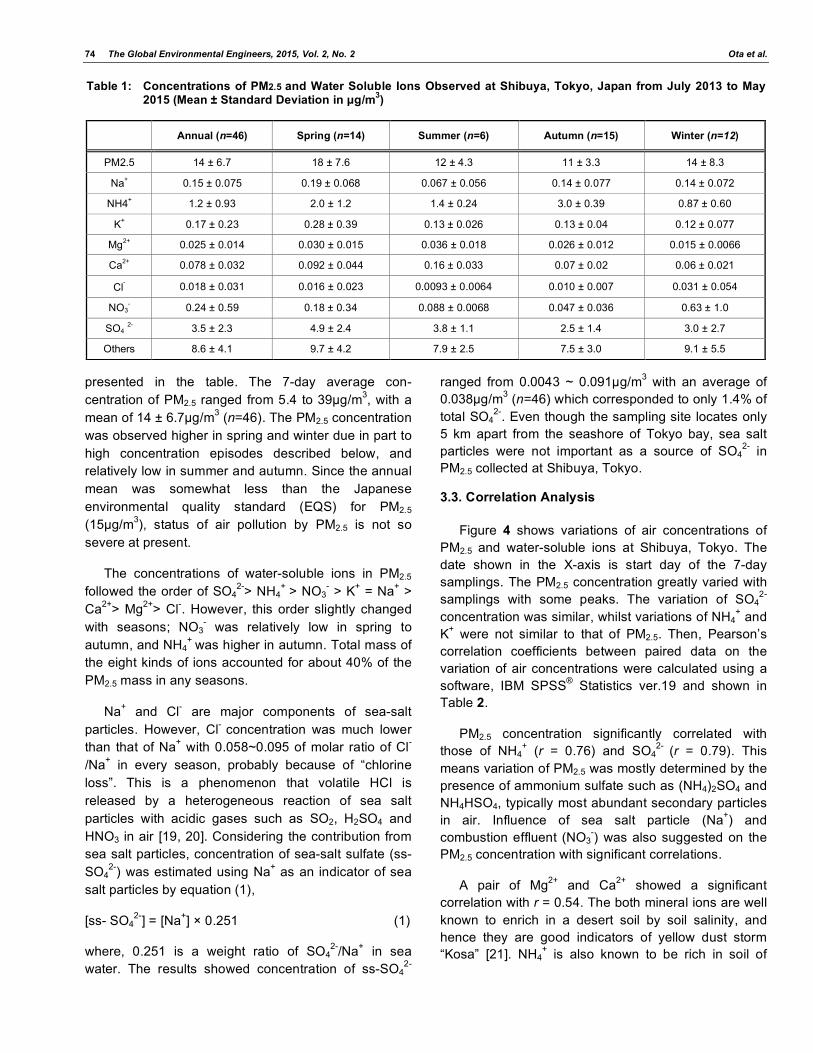
presented in the table. The 7-day average con-centration of PM2.5 ranged from 5.4 to 39µg/m3, with a mean of 14 ± 6.7µg/m3 (n=46). The PM2.5 concentration was observed higher in spring and winter due in part to high concentration episodes described below, and relatively low in summer and autumn. Since the annual mean was somewhat less than the Japanese environmental quality standard (EQS) for PM2.5 (15µg/m3), status of air pollution by PM2.5 is not so severe at present.
The concentrations of water-soluble ions in PM2.5 followed the order of SO4
2-> NH4+ > NO3
- > K+ = Na+ > Ca2+> Mg2+> Cl-. However, this order slightly changed with seasons; NO3
- was relatively low in spring to autumn, and NH4
+ was higher in autumn. Total mass of the eight kinds of ions accounted for about 40% of the PM2.5 mass in any seasons.
Na+ and Cl- are major components of sea-salt particles. However, Cl- concentration was much lower than that of Na+ with 0.058~0.095 of molar ratio of Cl-
/Na+ in every season, probably because of “chlorine loss”. This is a phenomenon that volatile HCl is released by a heterogeneous reaction of sea salt particles with acidic gases such as SO2, H2SO4 and HNO3 in air [19, 20]. Considering the contribution from sea salt particles, concentration of sea-salt sulfate (ss-SO4
2-) was estimated using Na+ as an indicator of sea salt particles by equation (1),
[ss- SO42-] = [Na+] × 0.251 (1)
where, 0.251 is a weight ratio of SO42-/Na+ in sea
water. The results showed concentration of ss-SO42-
ranged from 0.0043 ~ 0.091µg/m3 with an average of 0.038µg/m3 (n=46) which corresponded to only 1.4% of total SO4
2-. Even though the sampling site locates only 5 km apart from the seashore of Tokyo bay, sea salt particles were not important as a source of SO4
2- in PM2.5 collected at Shibuya, Tokyo.
3.3. Correlation Analysis
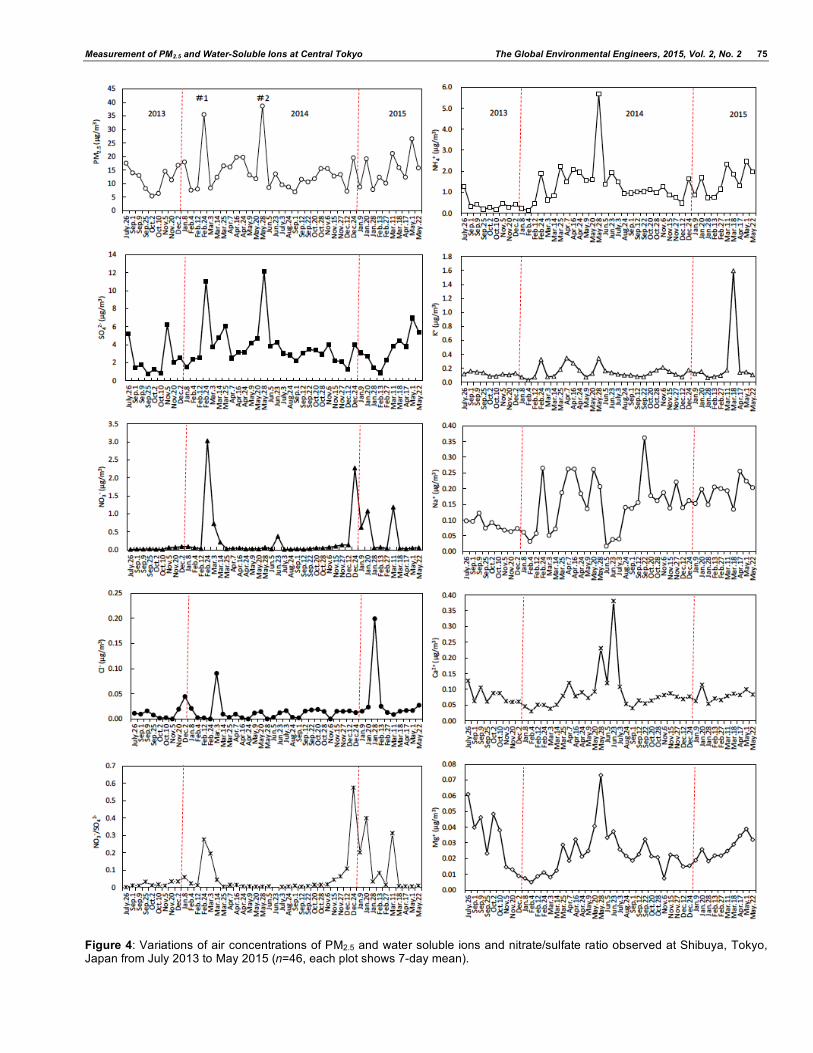
Figure 4 shows variations of air concentrations of PM2.5 and water-soluble ions at Shibuya, Tokyo. The date shown in the X-axis is start day of the 7-day samplings. The PM2.5 concentration greatly varied with samplings with some peaks. The variation of SO4
2- concentration was similar, whilst variations of NH4
+ and K+ were not similar to that of PM2.5. Then, Pearson’s correlation coefficients between paired data on the variation of air concentrations were calculated using a software, IBM SPSS® Statistics ver.19 and shown in Table 2.
PM2.5 concentration significantly correlated with those of NH4
+ (r = 0.76) and SO42- (r = 0.79). This
means variation of PM2.5 was mostly determined by the presence of ammonium sulfate such as (NH4)2SO4 and NH4HSO4, typically most abundant secondary particles in air. Influence of sea salt particle (Na+) and combustion effluent (NO3
-) was also suggested on the PM2.5 concentration with significant correlations.
A pair of Mg2+ and Ca2+ showed a significant correlation with r = 0.54. The both mineral ions are well known to enrich in a desert soil by soil salinity, and hence they are good indicators of yellow dust storm “Kosa” [21]. NH4
+ is also known to be rich in soil of
Table 1: Concentrations of PM2.5 and Water Soluble Ions Observed at Shibuya, Tokyo, Japan from July 2013 to May 2015 (Mean ± Standard Deviation in µg/m3)
Annual (n=46) Spring (n=14) Summer (n=6) Autumn (n=15) Winter (n=12)
PM2.5 14 ± 6.7 18 ± 7.6 12 ± 4.3 11 ± 3.3 14 ± 8.3
Na+ 0.15 ± 0.075 0.19 ± 0.068 0.067 ± 0.056 0.14 ± 0.077 0.14 ± 0.072
NH4+ 1.2 ± 0.93 2.0 ± 1.2 1.4 ± 0.24 3.0 ± 0.39 0.87 ± 0.60
K+ 0.17 ± 0.23 0.28 ± 0.39 0.13 ± 0.026 0.13 ± 0.04 0.12 ± 0.077
Mg2+ 0.025 ± 0.014 0.030 ± 0.015 0.036 ± 0.018 0.026 ± 0.012 0.015 ± 0.0066
Ca2+ 0.078 ± 0.032 0.092 ± 0.044 0.16 ± 0.033 0.07 ± 0.02 0.06 ± 0.021
Cl- 0.018 ± 0.031 0.016 ± 0.023 0.0093 ± 0.0064 0.010 ± 0.007 0.031 ± 0.054
NO3- 0.24 ± 0.59 0.18 ± 0.34 0.088 ± 0.0068 0.047 ± 0.036 0.63 ± 1.0
SO4 2- 3.5 ± 2.3 4.9 ± 2.4 3.8 ± 1.1 2.5 ± 1.4 3.0 ± 2.7
Others 8.6 ± 4.1 9.7 ± 4.2 7.9 ± 2.5 7.5 ± 3.0 9.1 ± 5.5
Measurement of PM2.5 and Water-Soluble Ions at Central Tokyo The Global Environmental Engineers, 2015, Vol. 2, No. 2 75
Figure 4: Variations of air concentrations of PM2.5 and water soluble ions and nitrate/sulfate ratio observed at Shibuya, Tokyo, Japan from July 2013 to May 2015 (n=46, each plot shows 7-day mean).

76 The Global Environmental Engineers, 2015, Vol. 2, No. 2 Ota et al.
Table 2: Correlation Coefficients between Paired Data of PM2.5 and Water-Soluble Ions
PM2.5 Na+ NH4 + K+ Mg2+ Ca2+ Cl- NO3- SO4
2-
PM2.5 1
Na+ .41 1
NH4+ .76 .43 1
K+ .27 .11 .30 1
Mg2+ .28 .18 .52 .12 1
Ca2+ .29 -.07 .52 .11 .54 1
Cl- -.19 -.05 -.15 -.09 -.17 -.14 1
NO3- .47 .19 .17 .06 -.23 -.04 -.02 1
SO42- .79 .29 .77 .23 .32 .31 -.19 .39 1
Values expressed in bold are significant at 1% significance level.
China. Therefore, the significant correlation of NH4
+, Ca2+ and Mg2+ indicates a possible long-range trans-portation of soil dust from China to central Tokyo.
3.4. High Concentration Episodes
As can be seen in Figure 4, two remarkable peaks were found in PM2.5 and SO4
2- concentrations at the samples collected at Feb.24~Mar.2, 2014 (#1) and May 28~June 3, 2014 (#2). Figure 5 shows 3-day backward air trajectories corresponding to #1 and #2. As for #1, air trajectories came from Asian continent including northern part of China with remarkable peaks of SO4
2- and NO3
- concentrations. Since the mass ratio of NO3-/
SO42- has been used as an indicator of relative
importance of mobile versus stationary sources in the air pollution [13], there were previously several reports on the ratio: 0.53 at Jinan in winter [13], 0.63 at Beijing [22], 0.60 at Shanghai [23], 0.95 at Seoul, Korea [24]. Since the mass ratio apparently increased at #1 with 0.28, this suggests #1 sample is a mixture of urban aerosol particles transported from urban cities in Asian continent and fine particles originated from domestic sources of Japan.
Meanwhile, air trajectories of #2 came from China or around national borders on the sea, and passed through western part of Japan. According to Aeolian Dust Information by Japan Meteorological Agency [25], a long-range transport of yellow sand was observed in wide areas of western Japan during the sampling. Therefore, soil-derived particles from dessert areas in the continent were involved in the PM2.5 sample with peaks of NH4
+, Ca2+ and Mg2+. Then, SO42-
concentration became also high because of formation of salt with these cations.
Figure 5: Three-day backward air trajectories during 7-day samplings, calculated for #1 (Feb.24~Mar.2, 2014) and #2 (May 28~June 3, 2014).

Measurement of PM2.5 and Water-Soluble Ions at Central Tokyo The Global Environmental Engineers, 2015, Vol. 2, No. 2 77
4. CONCLUSION
By investigating the concentrations of PM2.5 and water-soluble ions at Shibuya, central Tokyo for 2 years, the following findings were obtained. Present status of air pollution by PM2.5 was not so severe at the sampling site with a mean concentration of 14 ± 6.7µg/m3 during the observation. SO4
2- and NH4+
were abundant in PM2.5 and their presence mostly determined the variation of PM2.5 level. High concentration episodes were found in the season when air masses came from Asian continent, and a long-range transport of urban aerosols and soil-derived particles was suggested by correlations with indicator ions.
ACKNOWLEDGEMENT
This research activity was supported by Japan Science and Technology Agency (JST) Supporting Science Club program and JSPS KAKENHI Grant number 26410198. Authors awfully thank Mr. Yoshio Yamashita and Science Club members of Bosei Senior High School.
REFERENCES
[1] Deng J, Du K, Wang K, Yuan CS and Zhao J. Long-term atmospheric visibility trend in Southeast China, 1973-2010. Atmos Environ 2012; 59: 11-21. http://dx.doi.org/10.1016/j.atmosenv.2012.05.023
[2] Nawahda A, Yamashita K, Ohara T, Kurokawa J and Yamaji K. Evaluation of premature mortality caused by exposure to PM2.5 and ozone in East Asia: 2000, 2005, 2020. Water Air and Soil Pollution 2012; 223(6): 3445-3459. DOI: 10.1007/s11270-012-1123-7 http://dx.doi.org/10.1007/s11270-012-1123-7
[3] Dockery DW, Pope CA 3rd, Xu X, Spengler JD, Ware JH, Fay ME, et al. An association between air pollution and mortality in six US cities. N Engl J Med 1993; 329: 1753-1759. http://dx.doi.org/10.1056/NEJM199312093292401
[4] Krewski D, Burnett RT, Goldberg MS, Hoover K, Siemiatycki J, et al. Validation of the Harvard Six Cities Study of particulate air pollution and mortality. N Engl J Med 2004; 350(2): 198-199. http://dx.doi.org/10.1056/NEJM200401083500225
[5] Laden F, Schwartz J, Speizer FE and Dockery DW. Reduction in fine particulate air pollution and mortality: Extended follow-up of the Harvard Six Cities Study. Am J Respir Crit Care Med 2006; 173(6): 667-672. http://dx.doi.org/10.1164/rccm.200503-443OC
[6] Pope CA 3rd, Thun MJ, Namboodiri MM, Dockery DW, Evans JS, Speizer FE, et al. Particulate air pollution as a predictor of mortality in a prospective study of U.S. adults. Am J Respir Crit Care Med 1995; 151(3 Pt 1): 669-674. http://dx.doi.org/10.1164/ajrccm/151.3_Pt_1.669
[7] Pope CA 3rd, Burnett RT, Thun MJ, Calle EE, Krewski D, Ito K, et al. Lung cancer, cardiopulmonary mortality, and long-term exposure to fine particulate air pollution. J Am Med Assoc 2002; 287(9): 1132-1141. http://dx.doi.org/10.1001/jama.287.9.1132
[8] Pope CA 3rd, Burnett RT, Thurston GD, Thun MJ, Calle EE, Krewski D, et al. Cardiovascular mortality and long-term exposure to particulate air pollution - Epidemiological evidence of general pathophysiological pathways of disease. Circulation 2004; 109(1): 71-77. http://dx.doi.org/10.1161/01.CIR.0000108927.80044.7F
[9] Elliott P, Shaddick G, Wakefield JC, Hoogh Cd and Briggs DJ. Long-term associations of outdoor air pollution with mortality in Great Britain. Thorax 2007; 62(12): 1088-1094. http://dx.doi.org/10.1136/thx.2006.076851
[10] Sekine Y. Human health effect of particulate matter 2.5 (PM2.5). Indoor Environment 2014; 17(1): 19-35. http://dx.doi.org/10.7879/siej.17.19
[11] Cao J, Wang Q, Chow JC, Watson JG, Tie X, Shen Z, Wang P and An Z. Impacts of aerosol compositions on visibility impairment in Xi’an, China. Atmos Environ 2012; 59: 559-566. http://dx.doi.org/10.1016/j.atmosenv.2012.05.036
[12] Ma Y, Chen R, Pan G, Xu X, Song W, Chen B and Kan H. Fine particulate air pollution and daily mortality in Shenyang, China. Sci Total Environ 2011; 409(13): 2473-2477. http://dx.doi.org/10.1016/j.scitotenv.2011.03.017
[13] Gao X, Yang L, Cheng S, Gao R, Zhou Y, Xue L, et al. Semi-continuous measurement of water-soluble ions in PM2.5 in Jinan, China: Temporal variations and source apportionments. Atmos Environ 2011; 45(33): 6048-6056. http://dx.doi.org/10.1016/j.atmosenv.2011.07.041
[14] Hashimoto Y, Kim H-K, Otoshi T and Sekine Y. Monitoring of atmospheric aerosol components by multi-elemental neutron activation analysis in Seoul, Korea, April 1987-March 1989, J Japan Soc Air Pollut 1990; 25(5): 313-323. http://doi.org/10.11298/taiki1978.26.51
[15] Shon ZH, Kim KH, Song SK, Jung K, Kim NJ and Lee JB. Relationship between water-soluble ions in PM2.5 and their precursor, gases in Seoul megacity. Atmos Environ 2012; 59: 540-550. http://dx.doi.org/10.1016/j.atmosenv.2012.04.033
[16] Zeng J, Tohjima Y, Fujinuma Y, Mukai H and Katsumoto M. A study of trajectory quality using methane measurements from Hateruma Island. Atmos Environ 2003; 37(14): 1911-1919. http://dx.doi.org/10.1016/S1352-2310(03)00048-7
[17] Zeng J, Matsunaga T and Mukai H. METEX - A flexible tool for air trajectory calculation. Environ Model Softw 2010; 25(4): 607-608. http://dx.doi.org/10.1016/j.envsoft.2008.10.015
[18] Otoshi T, Sekine Y and Hashimoto Y. Application of Teflon Fiber Filter to Atmospheric Aerosol Monitoring. Journal of Japan Society of Air Pollution 1990; 25(4): 280-286. http://doi.org/10.11298/taiki1978.25.4_280
[19] Martens CS, Wesolowski JJ, Harris RC and Karfer R. Chlorine loss from Puerto Rican and San Francisco Bay area marine aerosols. J Geophys Res 1973; 78(36): 8778-8792. http://dx.doi.org/10.1029/JC078i036p08778
[20] Pio CA and Lopes DA. Chlorine loss from marine aerosol in a coastal. J Geophys Res 1998; 103(D19): 25263-25272. http://dx.doi.org/10.1029/98JD02088
[21] Tanaka S, Tajima M and Hashimoto Y. Variation of chemical composition of the atmospheric aerosol in Japan by Kosa phenomenon. NIPPON KAGAKU KAISHI 1986; 1986(5): 713-719. http://dx.doi.org/10.1246/nikkashi.1986.713
[22] Wang Y, Zhuang GS, Tang AH, Yuan H, Sun YL, Chen S, et al. The ion chemistry and the source of PM2.5 aerosol in Beijing. Atmos Environ 2005; 39(21): 3771-3784. http://dx.doi.org/10.1016/j.atmosenv.2005.03.013
[23] Wang Y, Zhuang GS, Zhang XY, Huang K, Xu C, Tang AH, et al. The ion chemistry, seasonal cycle, and sources of PM2.5 and TSP aerosol in Shanghai. Atmos Environ 2006;
78 The Global Environmental Engineers, 2015, Vol. 2, No. 2 Ota et al.
40(16): 2935-2952. http://dx.doi.org/10.1016/j.atmosenv.2005.12.051
[24] Kim HS, Huh JB, Hopke PK, Holsen TM and Yi SM. Characteristics of the major chemical constituents of PM2.5 and smog events in Seoul, Korea in 2003 and 2004. Atmos
Environ 2007; 41(32): 6762-6770. http://dx.doi.org/10.1016/j.atmosenv.2007.04.060
[25] Japan Meteorological Agency. Aeolian Dust Information. http://www.jma.go.jp/en/kosa/
Received on 12-11-2015 Accepted on 27-11-2015 Published on 31-12-2015
DOI: http://dx.doi.org/10.15377/2410-3624.2015.02.02.4
© 2015 Ota et al.; Avanti Publishers. This is an open access article licensed under the terms of the Creative Commons Attribution Non-Commercial License (http://creativecommons.org/licenses/by-nc/3.0/) which permits unrestricted, non-commercial use, distribution and reproduction in any medium, provided the work is properly cited.