the global energy transition - suzhou · the global energy transition paul simons ... the carbon...
TRANSCRIPT

© OECD/IEA 2016 © OECD/IEA 2016
The Global Energy Transition
Paul Simons
Deputy Executive Director International Energy Agency
Suzhou, 30 October 2016
© OECD/IEA 2016
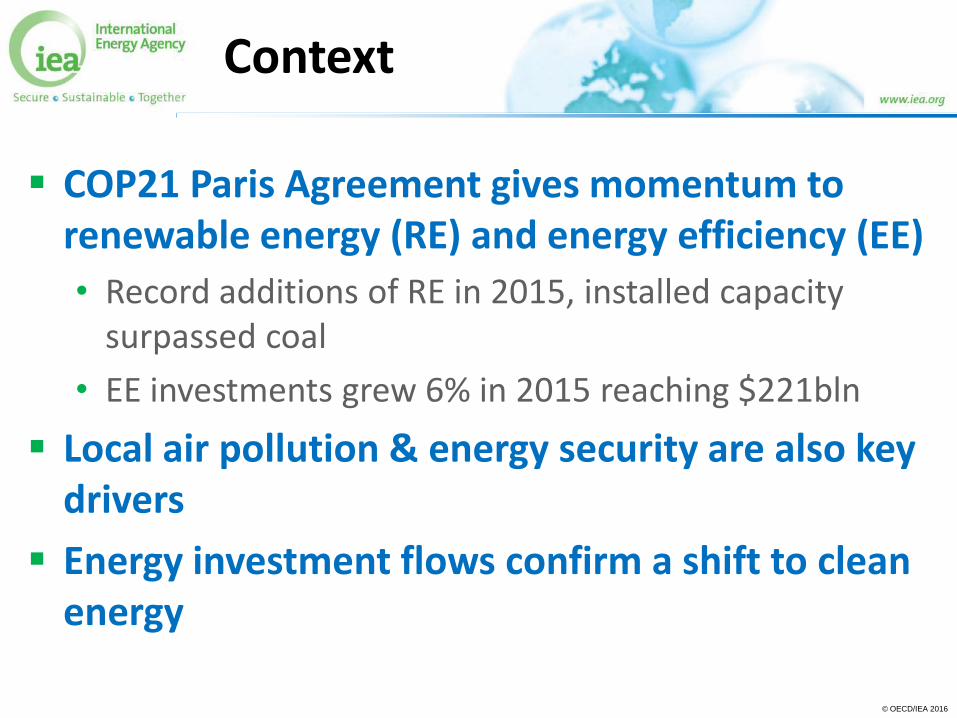
COP21 Paris Agreement gives momentum to renewable energy (RE) and energy efficiency (EE)
• Record additions of RE in 2015, installed capacity surpassed coal
• EE investments grew 6% in 2015 reaching $221bln
Local air pollution & energy security are also key drivers
Energy investment flows confirm a shift to clean energy
Context
© OECD/IEA 2016
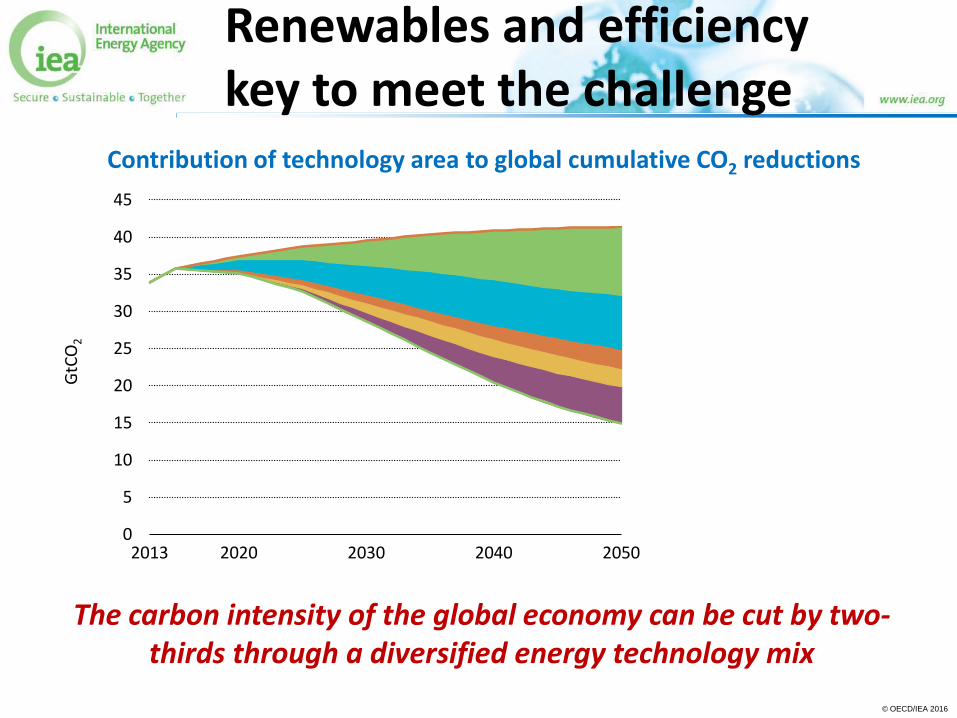
The carbon intensity of the global economy can be cut by two-thirds through a diversified energy technology mix
Contribution of technology area to global cumulative CO2 reductions
Renewables and efficiency key to meet the challenge
0
5
10
15
20
25
30
35
40
45
2013 2020 2030 2040 2050
GtC
O2
Renewables 32%
Energy efficiency 32%
Fuel switching 10%
Nuclear 11%
CCS 15% 2DS
4DS

© OECD/IEA 2016
An 8% reduction in 2015 global energy investment results from a $200 billion decline in fossil fuels, while the share of renewables, networks and efficiency expands
Power Generation
23% Biofuels and Solar
Heat 1%
Renewables 17%
USD 1.8 trillion
Investment flows signal a reorientation of the global energy system
Oil & Gas 46%
Coal 4%
Electricity Networks
14%
Energy Efficiency
12%
Global Energy Investment, 2015
Thermal Power
7%
© OECD/IEA 2016
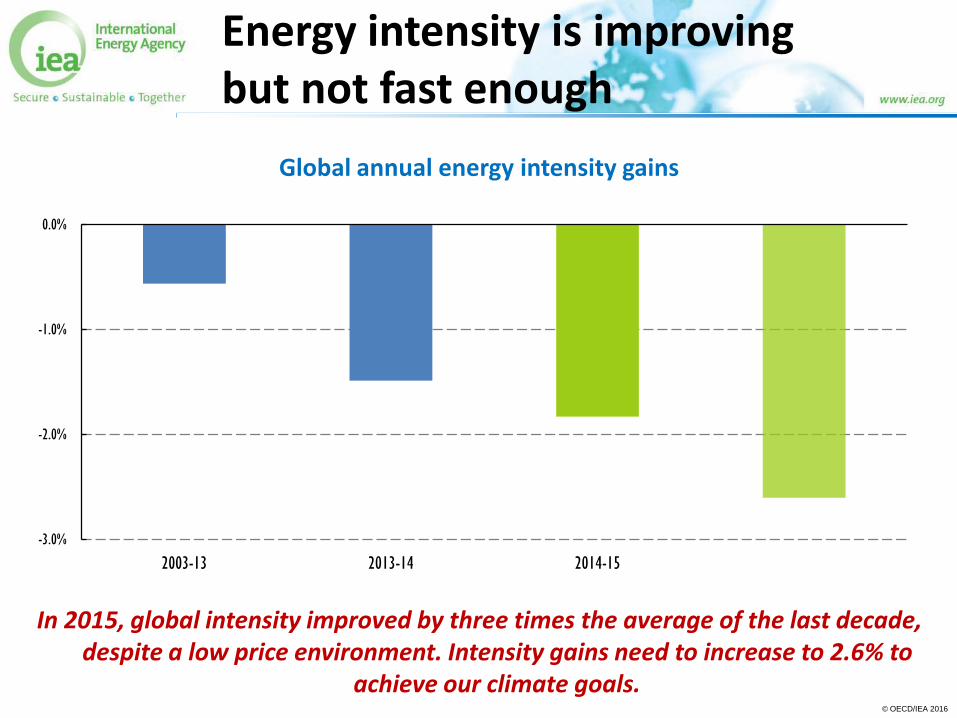
Energy intensity is improving but not fast enough
Global annual energy intensity gains
In 2015, global intensity improved by three times the average of the last decade, despite a low price environment. Intensity gains need to increase to 2.6% to
achieve our climate goals.
-3.0%
-2.0%
-1.0%
0.0%
2003-13 2013-14 2014-15 2016-30
(2 degree goal)

© OECD/IEA 2016
China is an energy efficiency heavyweight
Primary energy savings from efficiency gains since 2000 and renewable energy supply in China
Dramatic progress on energy efficiency saved 350 million tonnes of coal in 2014. Energy savings are as large as China’s renewable energy supply.
0
100
200
300
400
2008 2009 2010 2011 2012 2013 2014
Mtoe
Energy savings
Renewable energy
supply

© OECD/IEA 2016
Vehicle fuel economy standards have helped to moderate price falls
Sales and average annual fuel economy of light-duty trucks, United States
Light-duty truck sales hit record levels in the United States in 2015, but standards ensured overall new vehicle fleet efficiency still improved.
6.5
7.5
8.5
9.5
10.5
11.5
0
2
4
6
8
10
2010 2011 2012 2013 2014 2015
Lge per 10
0 km
Sales (m
illions)
Fuel economy
(right axis)
© OECD/IEA 2016
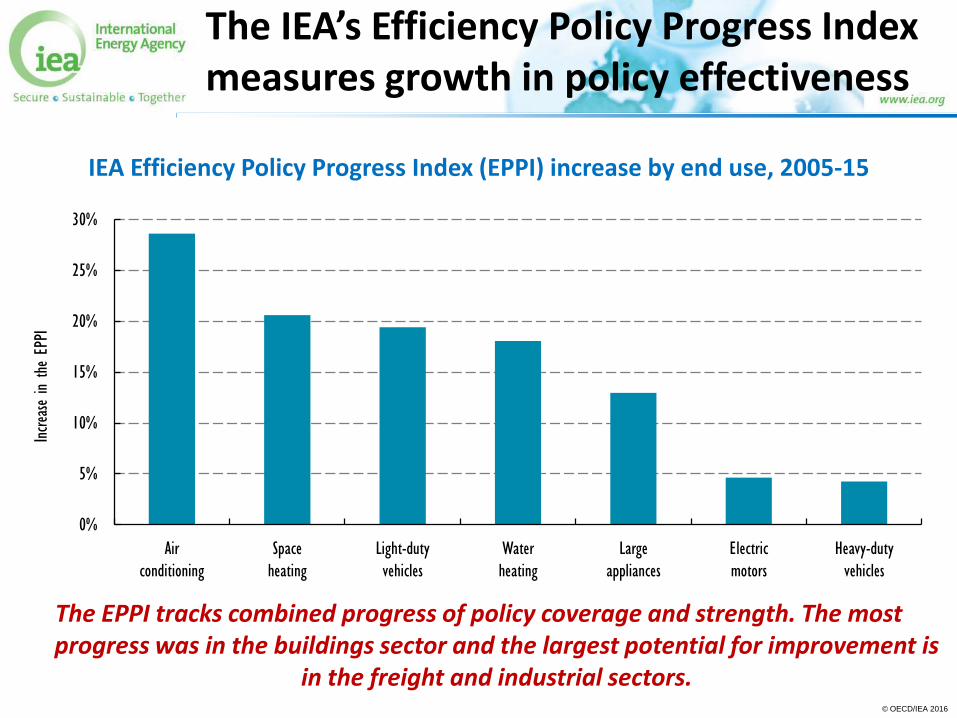
The IEA’s Efficiency Policy Progress Index measures growth in policy effectiveness
IEA Efficiency Policy Progress Index (EPPI) increase by end use, 2005-15
The EPPI tracks combined progress of policy coverage and strength. The most progress was in the buildings sector and the largest potential for improvement is
in the freight and industrial sectors.
0%
5%
10%
15%
20%
25%
30%
Air
conditioning
Space
heating
Light-duty
vehicles
Water
heating
Large
appliances
Electric
motors
Heavy-duty
vehicles
Increase in
the EP
PI

© OECD/IEA 2016
Renewables to remain fastest growing source of electricity generation
Generation from renewables to rise by almost two-fifths over 2015-2021, pushing their share of total electricity generation from 23% to 28%
Indexed electricity generation by fuel (2001-21)
100
120
140
160
180
200
220
240
260
280
2001 2003 2005 2007 2009 2011 2013 2015 2017 2019 2021
2001
=10
0
Global power generation Coal Natural gas Renewable electricity generation
© OECD/IEA 2016
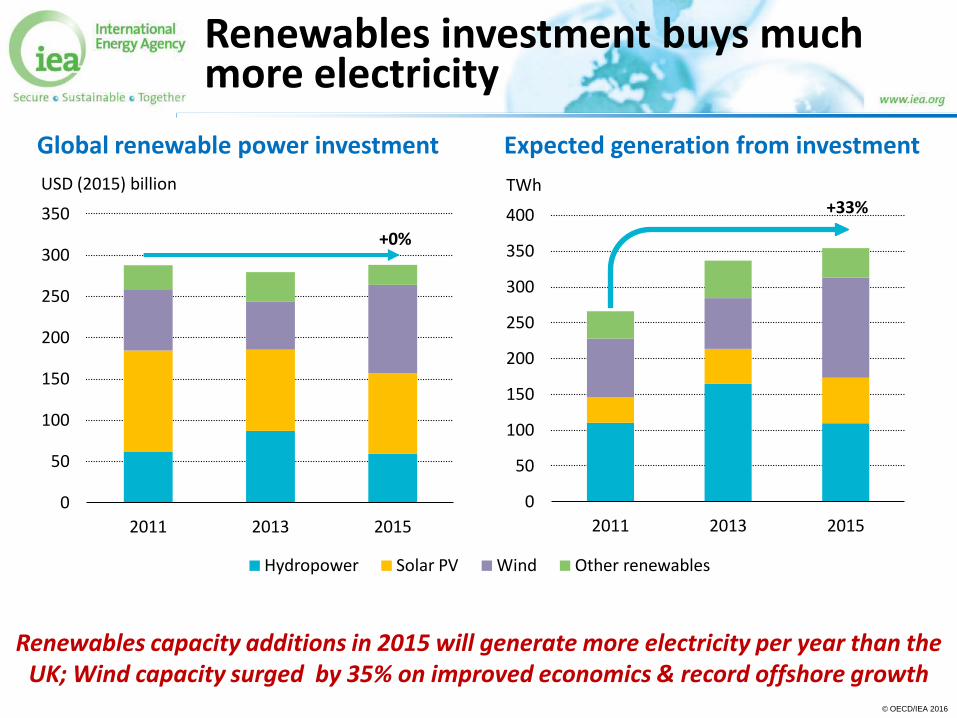
Renewables investment buys much more electricity
Renewables capacity additions in 2015 will generate more electricity per year than the UK; Wind capacity surged by 35% on improved economics & record offshore growth
0
50
100
150
200
250
300
350
2011 2013 2015
USD (2015) billion
Hydropower Solar PV Wind Other renewables
0
50
100
150
200
250
300
350
400
2011 2013 2015
TWh +33%
+0%
Global renewable power investment Expected generation from investment

© OECD/IEA 2016
Solar PV costs continue to decline with increasing competition
Utility-scale solar PV generation costs to fall by another quarter over 2015-21; competitive tenders may result in even faster cost reductions
Utility-scale solar PV generation cost and contract prices
0
100
200
300
400
500
2011 2012 2013 2014 2015 2016 2017 2018 2019 2020 2021
USD/
MWh
Global reference UAE Brazil South Africa Germany Mexico Chile
Forecast
Tendered prices:

© OECD/IEA 2016
71%
8%
15%
4%
2%
Hydropower
Bioenergy
Wind
Solar PV
Other renewables
Solar PV & wind account for almost 2/3 of rise in renewables generation; total renewable electricity overpasses 7600 TWh by 2021, equivalent to EU+US today
Renewable electricity generation by source 2015 Renewable electricity generation by source 2021
Wind and solar PV compensate for slower hydropower growth
© OECD/IEA 2016
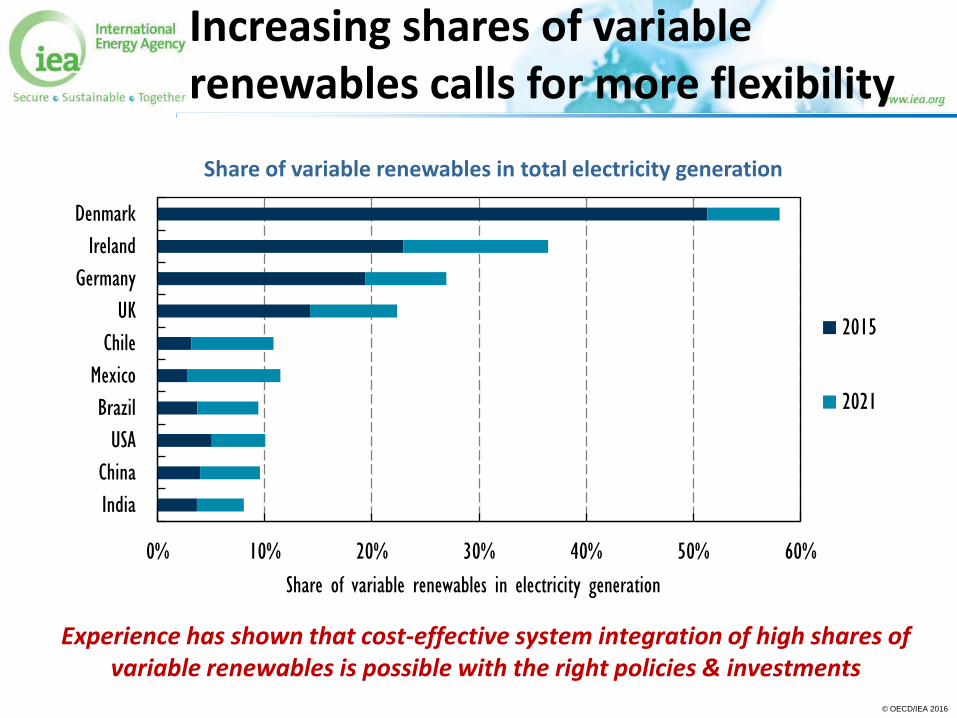
Experience has shown that cost-effective system integration of high shares of variable renewables is possible with the right policies & investments
Share of variable renewables in total electricity generation
0% 10% 20% 30% 40% 50% 60%
India
China
USA
Brazil
Mexico
Chile
UK
Germany
Ireland
Denmark
Share of variable renewables in electricity generation
2015
2021
Increasing shares of variable renewables calls for more flexibility
© OECD/IEA 2016
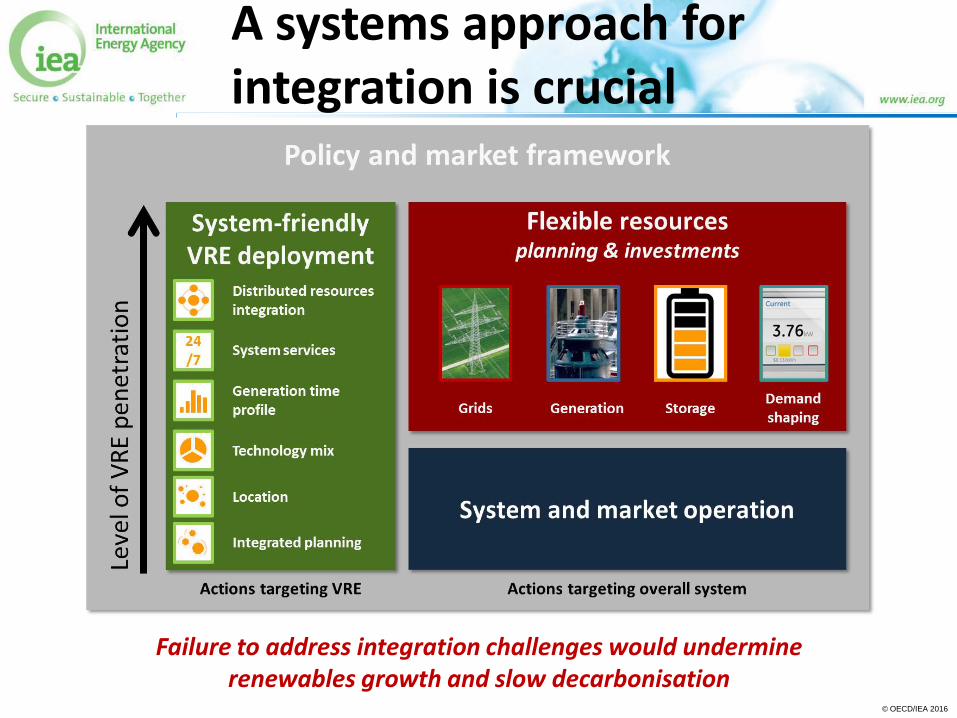
A systems approach for integration is crucial
Failure to address integration challenges would undermine renewables growth and slow decarbonisation
© OECD/IEA 2016
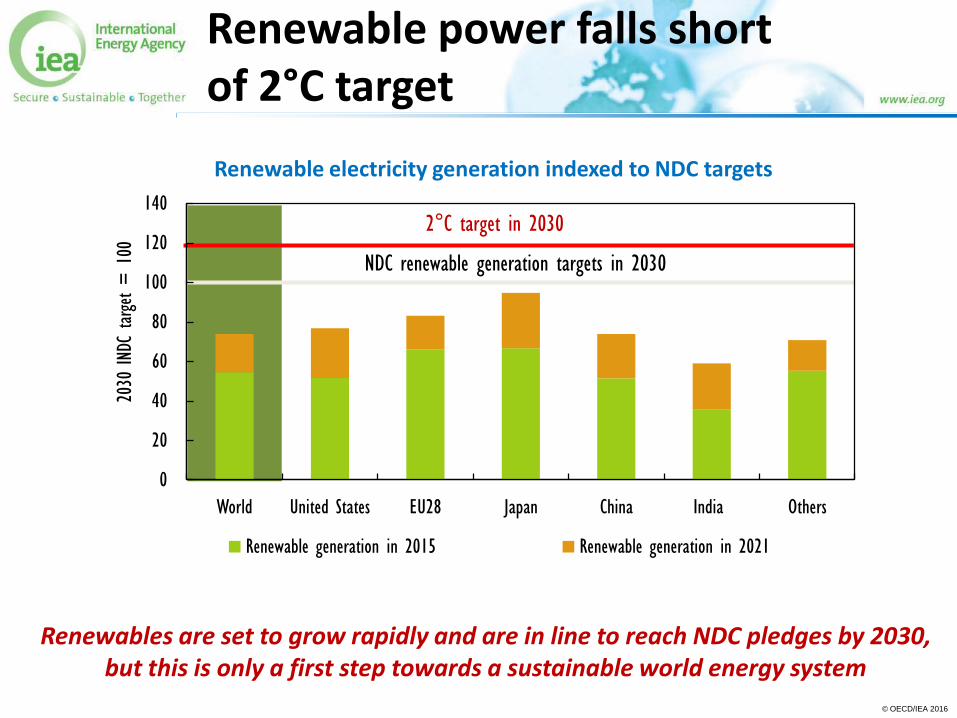
Renewable power falls short of 2°C target
Renewables are set to grow rapidly and are in line to reach NDC pledges by 2030, but this is only a first step towards a sustainable world energy system
Renewable electricity generation indexed to NDC targets
NDC renewable generation targets in 2030
2°C target in 2030
0
20
40
60
80
100
120
140
World United States EU28 Japan China India Others
2030
IND
C target =
100
Renewable generation in 2015 Renewable generation in 2021

© OECD/IEA 2016
Renewables to dominate electricity growth, but less progress in heat and transport
The share of renewables rises in all sectors, despite persistent challenges in heat & transport; interactions between energy efficiency & renewables become critical
Share of renewables in electricity, heat and transport sectors
0%
5%
10%
15%
20%
25%
30%
2009 2010 2011 2012 2013 2014 2015 2016 2017 2018 2019 2020 2021
Share of ren
ewab
les in sector de
man
d
Renewable electricity Renewable heat Biofuels in road transport

© OECD/IEA 2016
Concluding remarks
Clear signs of progress
• Success of technology progress, market innovation and political leadership
We are not on track to below 2 degrees yet
• Efficiency improvements are not fast enough
• More progress needed in heating and transport
An energy system approach is critical to achieve transformation
• Across technologies – renewables and efficiency
• Across sectors – electricity, heating, transport
Continued policy push needed to achieve transformation