the global diamond industry - antwerp world … global diamond industry | bain & company, inc....
TRANSCRIPT

THE GLOBAL DIAMOND INDUSTRYPortrait of growth

This work was commissioned by AWDC and prepared by Bain. This work is based on secondary market research, analysis of financial information avail-able or provided to Bain & Company and AWDC, and a range of interviews with customers, competitors and industry experts. Bain & Company and AWDC have not independently verified this information and make no representation or warranty, express or implied, that such information is accurate or complete. Projected market and financial information, analyses and conclusions contained herein are based (unless sourced otherwise) on the information described above and on Bain & Company’s and AWDC’s judgment, and should not be construed as definitive forecasts or guarantees of future perfor-mance or results. Neither Bain & Company nor AWDC nor any of their subsidiaries or their respective officers, directors, shareholders, employees or agents accept any responsibility or liability with respect to this document. This document is copyright Bain & Company, Inc. and AWDC and may not be published, copied or duplicated, in whole or in part, without the written permission of Bain and AWDC.
Copyright © 2012 Bain & Company, Inc. and Antwerp World Diamond Centre private foundation (AWDC). All rights reserved.

The Global Diamond Industry | Bain & Company, Inc.
Contents
Note to readers . . . . . . . . . . . . . . . . . . . . . . . . . . . . . . . . . . . . . . . . . . . . . . 1
1. Major developments in the diamond industry in 2011 . . . . . . . . . . . . . . . . . . . 2
2011 market overview . . . . . . . . . . . . . . . . . . . . . . . . . . . . . . . . . . . . . . . . . 2
Business update . . . . . . . . . . . . . . . . . . . . . . . . . . . . . . . . . . . . . . . . . . . . . 8
Key takeaways . . . . . . . . . . . . . . . . . . . . . . . . . . . . . . . . . . . . . . . . . . . . . 12
2. Introduction to key market reviews: Supporting demand outlook . . . . . . . . . . . 13
The purpose of our country reviews . . . . . . . . . . . . . . . . . . . . . . . . . . . . . . . 13
How we conducted the surveys . . . . . . . . . . . . . . . . . . . . . . . . . . . . . . . . . . 13
3. Major diamond markets: Similarities and contrasts . . . . . . . . . . . . . . . . . . . . 15
Local differences in diamond preferences, ownership
and psychological associations . . . . . . . . . . . . . . . . . . . . . . . . . . . . . . . . . . 15
Role of diamonds in engagements and gift-giving . . . . . . . . . . . . . . . . . . . . . 17
Consumer priorities and the importance of authenticity. . . . . . . . . . . . . . . . . . 18
Key takeaways . . . . . . . . . . . . . . . . . . . . . . . . . . . . . . . . . . . . . . . . . . . . . 21
4. The US diamond market . . . . . . . . . . . . . . . . . . . . . . . . . . . . . . . . . . . . . . . 22
Fundamentals of the US diamond market . . . . . . . . . . . . . . . . . . . . . . . . . . . 22
Sources of the US consumer demand . . . . . . . . . . . . . . . . . . . . . . . . . . . . . . 26
Developments and trends in US retail . . . . . . . . . . . . . . . . . . . . . . . . . . . . . . 30
Key takeaways . . . . . . . . . . . . . . . . . . . . . . . . . . . . . . . . . . . . . . . . . . . . . 34

The Global Diamond Industry | Bain & Company, Inc.
5. The diamond market in China . . . . . . . . . . . . . . . . . . . . . . . . . . . . . . . . . . . 36
Fundamentals of the Chinese diamond market . . . . . . . . . . . . . . . . . . . . . . . 36
Sources of Chinese consumer demand . . . . . . . . . . . . . . . . . . . . . . . . . . . . . 38
Developments and trends in Chinese retailing . . . . . . . . . . . . . . . . . . . . . . . . 42
Key takeaways . . . . . . . . . . . . . . . . . . . . . . . . . . . . . . . . . . . . . . . . . . . . . 46
6. The diamond market in India . . . . . . . . . . . . . . . . . . . . . . . . . . . . . . . . . . . 47
Fundamentals of the Indian diamond market . . . . . . . . . . . . . . . . . . . . . . . . . 47
Sources of Indian consumer demand . . . . . . . . . . . . . . . . . . . . . . . . . . . . . . 49
Developments and trends in Indian retail . . . . . . . . . . . . . . . . . . . . . . . . . . . 52
Key takeaways . . . . . . . . . . . . . . . . . . . . . . . . . . . . . . . . . . . . . . . . . . . . . 55
7. Supply-demand balance through 2020:
An attractive outlook for rough diamond producers . . . . . . . . . . . . . . . . . . . . 56
Global rough diamond demand model: Methodology . . . . . . . . . . . . . . . . . . 56
Global rough diamond demand model: Base case scenario . . . . . . . . . . . . . . 63
Global rough diamond demand model: Two additional scenarios . . . . . . . . . . 63
Global rough diamond supply model: Methodology . . . . . . . . . . . . . . . . . . . 65
Global rough diamond supply model: Base case scenario . . . . . . . . . . . . . . . 65
Global rough diamond supply model: Two additional scenarios . . . . . . . . . . . 68
Global rough diamond supply-demand balance 2012–2020 . . . . . . . . . . . . . 69
Potential risks and disruptive factors . . . . . . . . . . . . . . . . . . . . . . . . . . . . . . . 69
Key takeaways . . . . . . . . . . . . . . . . . . . . . . . . . . . . . . . . . . . . . . . . . . . . . 71

The Global Diamond Industry | Bain & Company, Inc.
Conclusion . . . . . . . . . . . . . . . . . . . . . . . . . . . . . . . . . . . . . . . . . . . . . . . . 73
Glossary . . . . . . . . . . . . . . . . . . . . . . . . . . . . . . . . . . . . . . . . . . . . . . . . . 74
The Global Diamond Industry | Bain & Company, Inc.
Page 1
Note to readers
Welcome to the second annual report on the global diamond industry, prepared by Bain & Company together with the Antwerp World Diamond Centre (AWDC). Last year’s report, Lifting the Veil of Mystery, shed light on the dynamics and development of an industry known for its complexity and opacity. We are pleased that it was well received by industry players and the investment community.
Building on that solid foundation, AWDC and Bain & Company have renewed their collaboration and prepared a new report for 2012. Here we add depth and context to our examination of the diamond market by taking a detailed look at the dynamics of consumer demand across the globe. Although the jewelry market is the main source of demand for diamonds, the overall industry is much larger: from the producers of rough diamonds to dealers, cutters and polishers to retail sales. In order to understand what drives growth of rough diamonds, one needs to examine factors behind the consumption of diamond jewelry.
This report analyzes the demand fundamentals that will shape the diamond industry’s near- and medium-term future and offers evidence for a positive outlook. We start with a review of 2011. We discuss how the long-term supply-demand balance affects prices and how macroeconomic developments and changing consumer preferences are influencing the industry.
For the first time, the report also presents a highly detailed view of the consumer preferences, based on surveys of more than 5,000 diamond consumers around the world. We describe the similarities and differences among consumers in the US, China, India, Russia and in large EU countries (UK, Germany, France and Italy). We then explore the three largest diamond markets—the US, China and India—which together account for about 60% of global demand.
We conclude with an update on the outlook for the diamond industry through 2020. The updated supply forecast is based on the latest developments of key diamond miners and the largest diamond mines worldwide. The 2020 demand outlook is based on our extensive market analysis and consumer research.
Readers seeking a quick overview of the report’s conclusions will find a summary of key takeaways at the end of each chapter. We hope you will find the insights in the report useful and compelling. We look forward to discussing it with you.
Bain & Company Antwerp World Diamond Centre (AWDC)
Yury Spektorov Ari EpsteinPartner Chief Executive Officer
Olya Linde Stephane Fischler Partner President
Pierre-Laurent WetliPartner

The Global Diamond Industry | Bain & Company, Inc.
Page 2
1. Major developments in the diamond industry in 2011
2011 market overview
Natural diamonds are among the world’s most precious natural resources. In 2011, diamond miners, such as ALROSA, BHP Billiton, De Beers, Rio Tinto and smaller companies, produced 124 million carats of rough diamonds, valued at $15 billion. Once out of the ground, the rough stones moved through the so-called diamond pipeline—a value chain that runs from dealers to diamond cutters and polishers to jewelry manufacturers to retail stores and finally to consumers. The value-added along the way is impressive, as $15 billion in rough diamonds becomes $24 billion in polished diamonds, which in turn goes into diamond jewelry with a resulting retail value of $71 billion (see Figure 1.1).
In this and following chapters we analyze the key factors driving demand for diamond jewelry. These factors carry important long-term implications for the overall diamond industry and rough diamond producers in particular.
Diamond jewelry sales reached all-time high
Despite lingering concerns about the global economy, the diamond industry was surprisingly resilient in 2011. Although it appeared the recession would slow sales of diamond jewelry, overall demand has continued to grow. This performance is in line with the broader luxury category, which defied economic headwinds to hit an all-time high in sales in 2011 (see Figure 1.2).
Rough diamond production value
Polished diamond value in jewelry
Diamond jewerly retail sales
15
24
71
Sources: IDEX; Tacy Ltd. and Chaim Even-Zohar; Diamond Value Chain 2010
Value, $ billions, 2011
Figure 1.1: Diamond pipeline: Diamond value growth from production to retail

The Global Diamond Industry | Bain & Company, Inc.
Page 3
Diamonds were as resilient as the overall luxury category. Last year we projected that sales of diamond jewelry would return to pre-crisis levels by 2013—a projection that some observers called over-optimistic. In fact, sales surpassed their pre-crisis peak in 2011, two years earlier than we anticipated. Overall, 2011 saw retail sales of diamond jewelry reach a new high, growing 18% from 2010 (see Figure 1.3).
China and India are at the forefront of diamond demand growth
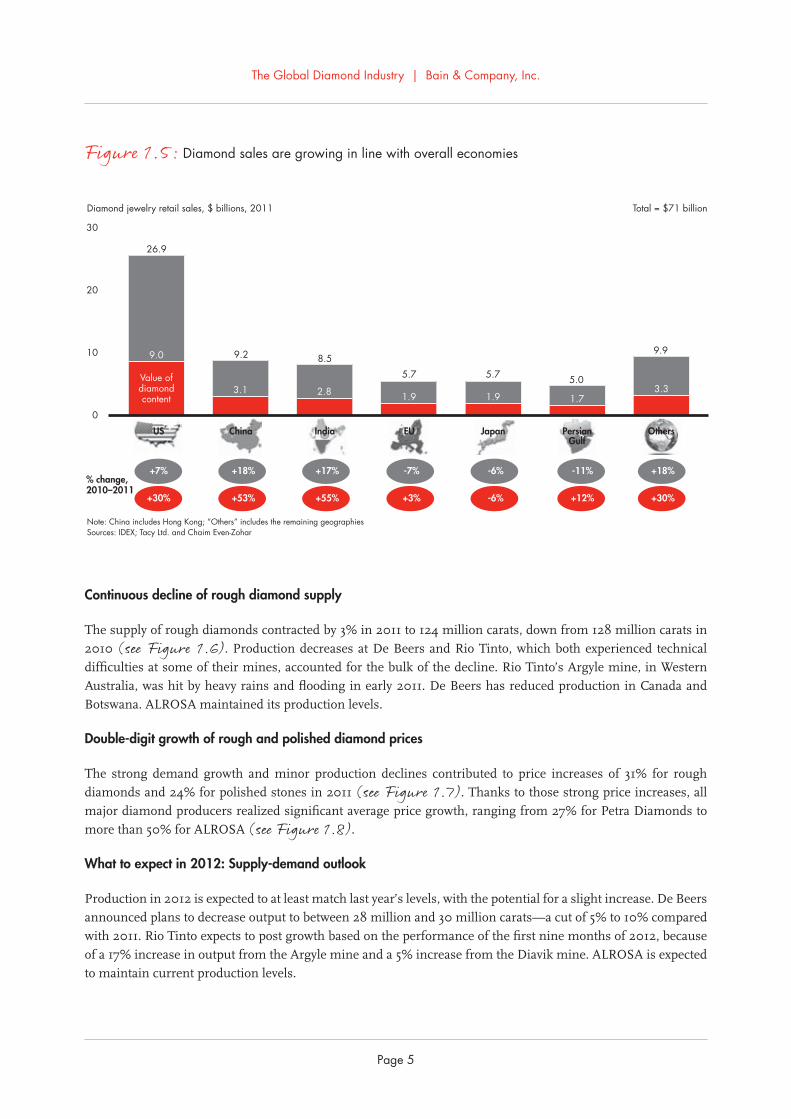
China and India, buoyed by strong economic advances in both countries, accounted for most of the demand growth. China’s economy expanded by 9% during 2010-2011, slower than its 13% to 14% growth rate before the global financial crisis, but still far faster than any of the world’s other major economies. India’s GDP, meanwhile, grew at a solid 7% during those years, continuing its upward trajectory (see Figure 1.4). As wealth increases in both countries, diamond sales are skyrocketing. China (including Hong Kong) is now the world’s second-largest diamond jewelry market after the US, with demand growing 18% from 2010 to 2011. India is the third largest, with growth of 17% during the same period (see Figure 1.5).
Powered by strong demand, the diamond market in both countries is developing rapidly. The number of retail jewelry outlets is soaring, and a growing number of consumers are adopting the Western practice of giving gifts of diamond jewelry to celebrate engagements, weddings and anniversaries. Many consumers are coming to view diamonds as investments.
Some more established markets grew more slowly or suffered setbacks in 2011. The US, the world’s largest diamond jewelry market, posted a 7% gain in sales as the country’s economy rebounded, with a 1.7% increase in 2011 GDP. Consumer confidence there continues to strengthen. European sales of diamond jewelry fell slightly from 2010 to 2011, while sales in Japan slid by 6%.
146
Note: Nominal pricesSource: Bain “Luxury Goods Worldwide Market Study“
Global luxury goods sales, Index, 2005 = 100 ($184 billion)
CAGR13%
CAGR17%CAGR
-13%
2005 2006 2007 2008 2009 2010 2011
100109
127133
116
CRISIS REBOUNDEXPANSION
125
Figure 1.2: 2011 saw a peak for luxury goods consumption

The Global Diamond Industry | Bain & Company, Inc.
Page 4
9.2%
7.2%
4.3%
7.8%
3.9%
1.6%
1.7%
-0.7%
9.2%
6.6%
-7.8%
-0.1%
-0.6%
-3.5%
-4.2%
-5.5%
Source: International Monetary Fund
Real GDP growth
EXPANSION 2006–2007
CRISIS 2008–2009
REBOUND 2010–2011
China
India
Russia
Persian Gulf
World
EU
US
Japan
14.2%
10.0%
8.5%
4.3%
5.4%
3.4%
1.9%
2.2%
Developing countries Developed countries
Figure 1.4: Emerging economies are still growing fast
Sources: IDEX; Tacy Ltd. and Chaim Even-Zohar; Bain analysis
Global diamond jewelry retail sales, $ billions
2005 2006 2007 2008 2009 2010 2011
62
6973
65
59 60
71
18 18 2018
1618
24
EXPANSION CRISIS REBOUND
CAGR9%
CAGR5%
CAGR-9%
CAGR-11%
CAGR18%
CAGR33%
Value of diamond content
Figure 1.3: Diamond jewelry recovered in line with the economy, but value of diamond content increased even faster
The Global Diamond Industry | Bain & Company, Inc.
Page 5
Continuous decline of rough diamond supply
The supply of rough diamonds contracted by 3% in 2011 to 124 million carats, down from 128 million carats in 2010 (see Figure 1.6). Production decreases at De Beers and Rio Tinto, which both experienced technical difficulties at some of their mines, accounted for the bulk of the decline. Rio Tinto’s Argyle mine, in Western Australia, was hit by heavy rains and flooding in early 2011. De Beers has reduced production in Canada and Botswana. ALROSA maintained its production levels.
Double-digit growth of rough and polished diamond prices
The strong demand growth and minor production declines contributed to price increases of 31% for rough diamonds and 24% for polished stones in 2011 (see Figure 1.7). Thanks to those strong price increases, all major diamond producers realized significant average price growth, ranging from 27% for Petra Diamonds to more than 50% for ALROSA (see Figure 1.8).
What to expect in 2012: Supply-demand outlook
Production in 2012 is expected to at least match last year’s levels, with the potential for a slight increase. De Beers announced plans to decrease output to between 28 million and 30 million carats—a cut of 5% to 10% compared with 2011. Rio Tinto expects to post growth based on the performance of the first nine months of 2012, because of a 17% increase in output from the Argyle mine and a 5% increase from the Diavik mine. ALROSA is expected to maintain current production levels.
ChinaUS India Japan PersianGulf
Others
+30% +55% +30%+12%+53% -6%
+7% +17%
+3%
-7% +18%-11%+18% -6%
Note: China includes Hong Kong; “Others” includes the remaining geographiesSources: IDEX; Tacy Ltd. and Chaim Even-Zohar
30
20
10
0
Diamond jewelry retail sales, $ billions, 2011 Total = $71 billion
26.9
9.2 8.5
5.7 5.7 5.0
9.99.0
3.1 2.8 1.9 1.9 1.73.3
% change,2010–2011
Value of diamond content
EU
Figure 1.5: Diamond sales are growing in line with overall economies

The Global Diamond Industry | Bain & Company, Inc.
Page 6
200
150
100
502005 2006 2007 2008 2009 2010 2011 2012
Roughdiamonds
Polisheddiamonds
Sources: Polishedprices.com (Diamond Prices Overall Index); Kimberley Process Statistics
Price index, 2005 = 100
CAGR2%
CAGR-14%
CAGR24%
CAGR5%
CAGR-12%
CAGR31%
CRISIS REBOUNDEXPANSION
Figure 1.7: Rough prices exhibit continuous climb since the crisis
200
150
100
50
0
Note: Smaller players include BHP Billiton, Catoca mine, Harry Winston, Petra Diamonds; Others include DRC, Angola, Zimbabwe, Australia, Botswana, Canada, Russia, South Africa, Brazil, China, Congo, Central African Republic, Ghana, Guyana, Guinea, India, Indonesia, Lesotho, Liberia, Namibia, Sierra Leone, Tanzania, Togo, Venezuela Source: Kimberley Process Statistics
2005 2006 2007 2008 2009 2010 2011
177 176168
163
120128 124
Global rough diamond production, millions of carats
De Beers Rio Tinto Smaller players OthersALROSA
Figure 1.6: Supply of rough diamonds contracted slightly in 2011

The Global Diamond Industry | Bain & Company, Inc.
Page 7
Only nine months into 2012, it is difficult to forecast full-year consumer demand. The surprisingly strong growth posted in 2011 and uncertainty around fourth-quarter holiday sales in 2012 introduced significant variables into the demand outlook for the year.
The Indian diamond market reflects the country’s uncertain economic position. The Indian government devalued its currency by 20% in the early part of 2011. The devaluation effectively raised jewelry prices by the same amount for Indian consumers. The recent increase in the export tax on diamonds, which froze the market in its tracks for several days in 2012, has further constrained the market. So have tighter lending policies by Indian banks, which have made it difficult for some Indian polishers to finance new purchases of wholesale diamonds. As a result, despite the strong growth in domestic consumer demand for diamonds, the import of rough diamonds declined by 36% from July 2011 to July 2012.
Despite these disruptions, the long-term projections in India are extremely positive. In fact, diamonds could be an accelerator that drives the overall luxury market. The country still has only a few high-end diamond retailers, and there is no Indian equivalent of Tiffany or Cartier. While tastes are still evolving among Indian consumers, the country reflects a huge long-term opportunity. It has the potential to become one of the largest global markets for luxury goods, including diamonds.
A similar phenomenon is happening in China—a bumpy 2012, but solid long-term growth. Imports of polished diamonds fell 14% during the first six months of 2012, compared with the same period last year. It is likely that China’s uncertain economic growth prospects have lowered confidence levels among consumers and distributors, resulting in a temporary dip in the market.
*ALROSA mines and sells two categories of diamonds: gem-quality diamonds at an average price of $197/ct (65% of volume) and non-gem qualitySources: Annual reports; publication analysis
53%
35%
29%27%
ALROSA De Beers Harry Winston PetraDiamonds
$130* $207 $137 $218Average price2011
Percent change of average price by producer, 2010–2011
Figure 1.8: Rough diamond producers showed strong growth in realized prices in 2011

The Global Diamond Industry | Bain & Company, Inc.
Page 8
These small bumps in the road do nothing to dim China’s long-term growth prospects. Retailers in China are still pressing ahead with ambitious expansion plans, and the country should remain a very attractive market for diamonds in the long term.
Thus far in 2012, US demand remains relatively stable, although the country’s economic uncertainty is pushing some consumers to gravitate toward cheaper jewelry and smaller stones. In Europe, the ongoing Eurozone crisis has continued to erode the market. As a result of Europe’s economic issues, many market participants expect flat demand for the year across the European region. Affluent tourists, particularly those from Asia and the Middle East, have propped up the retail market in both the US and Europe. Several retailers report that these shoppers are among their most enthusiastic purchasers and the source of many of their largest diamond sales.
The final unknown regarding 2012 is the impact of year-end holiday sales. In addition to weddings and engagements, the diamond jewelry business is increasingly driven by gift purchases. The industry rings up a substantial portion of its annual sales during the fourth quarter, specifically during the holiday season. Until the results for the holiday sales are confirmed, it is too early to tell how the year will finish.
Business update
Actual and potential ownership shifts
The diamond industry tends to be extremely conservative and stable. It has a long history in which a handful of players dominated rough diamond production. Many wholesalers and polishers are generations-old family businesses. Because the industry is so bound by tradition, any disruption in the pipeline tends to spark concerns. Several such disruptions occurred in 2011, but we do not expect these events to have significant long-term impact.
Specifically, several big rough diamond producers have changed either their ownership structures or their business or financial strategies. The most significant is De Beers, which the Oppenheimer family agreed to sell to Anglo American Corporation in 2011, an event that reverberated through the diamond industry. The Oppenheimers had been involved with De Beers for nearly a century, the period when De Beers dominated the industry. Despite the concerns of many industry players, the sale was a financial transaction, not an expression of diminished confidence in the diamond business. The Oppenheimer family had already sold most of its stake in De Beers, and the 2012 transaction merely represented the sale of the final 40%. Anglo American announced that the company will retain the brand within its portfolio and has emphasized that it remains committed to the diamond sector. Overall, analysts do not expect any noticeable change in the operations of De Beers.
Another shift comes from BHP Billiton. In November of 2012 the company announced the sale of its Ekati diamond mine stake in Canada to Harry Winston Diamond Corp. for $500 million. Under the deal, BHP Billiton’s employees working in Northern Canada and in diamonds marketing in Antwerp, Belgium, will join Harry Winston. Harry Winston already owns a 40% share in the neighboring Diavik diamond mine.
Additionally, Rio Tinto announced plans to sell its diamond operations. The company, similarly to BHP Billiton, has shifted priorities away from diamonds, which represent only a small part of its overall portfolio. Both companies have been seeing reduced revenues from their diamond operations as their mines decline in production.
The sale of the diamond business by BHP Billiton and stated intentions of Rio Tinto will likely have only a limited impact on the diamond market.

The Global Diamond Industry | Bain & Company, Inc.
Page 9
The fourth potential ownership shift is ALROSA, the state-owned Russian producer, which has some public shares available, but has been considering a broader IPO for several years. One of the reasons that ALROSA has not yet gone public is that it does not have an urgent need to raise cash. Given the strong sales and average prices of diamonds in 2010 and 2011, ALROSA currently needs no additional capital. In addition to the possibility of an IPO, the Russian government is considering a partial privatization of the company, as part of a wider plan to reduce the government’s stakes in state-owned companies. The timing of privatization is still unclear, and even if it were to happen within the next few months, it is unlikely to affect the overall production levels.
The fake diamond caper of 2011
Perhaps more worrisome than any actual or potential change in corporate control was the appearance in 2011 of a large batch of synthetic diamonds believed by their dealer to be natural. An analysis by a grading lab revealed that the entire batch was synthetic. The event was unsettling, raising concerns that high-quality counterfeit diamonds had slipped into the market. The batch in question was created through a process known as chemical vapor deposition (CVD), which produces stones that a diamond dealer cannot distinguish from natural diamonds without special equipment. The event highlighted the importance of diamond certificates to ensure the authenticity of purchased stones.
Production boost in Zimbabwe
Zimbabwe has the potential to produce a significant volume of rough diamonds. No one yet knows exactly how big that volume could be, but it is clearly substantial. In the past, there were real questions about the country’s capacity to get these diamonds out of the ground. We have seen Zimbabwe producing 7.6 million carats in the first six months of 2012, nearly as much as it did during all of 2011.
We expect the potential increase in Zimbabwe’s production volume to have only a marginal impact on the overall supply-demand dynamic. Any production increase will affect volume more than value, as diamonds from Zimbabwe are of relatively lower quality, with an average price per carat of $56 in 2011.
Continuous allure of investing in diamonds but significant challenges remain
The final major development in 2011 was the continued interest in developing investment vehicles focused on diamonds. Despite a weak global economy, the diamond market has held up with strong prices, even as other assets have declined or moved sideways. Some investors are looking for innovative new ways to capitalize on this trend. Gold and silver have established a clear precedent for such investments. Exchange traded funds (ETFs) focused on gold, for example, grew at an annualized 35% from 2008 through 2010, as many investors fled to the metal during the financial crisis (see Figure 1.9).
Diamonds have several appealing characteristics as a potential investment tool. Investors consider them to be a “safe haven”—a portable, physical asset whose value remains stable when the stock market is volatile or declining. Diamonds also offer a way to balance portfolios, since their prices do not correlate with the performance of other investments.
Despite these virtues, diamonds have idiosyncrasies that will likely limit investment demand. Each diamond is unique, its value dependent on its cut, color, clarity and carat (the “four Cs,” in diamond parlance). Those four variables can combine in as many as 16,000 different ways. As a result, every diamond valuation is subjective to some extent (see Figure 1.10). Indeed, two appraisers can differ in their valuations of the same diamond by as

The Global Diamond Industry | Bain & Company, Inc.
Page 10
Homogeneous quality NO
Value is preserved during division or reshaping NO
Objective and direct valuation NO
Easy transportation and convenient storage YES YES
Volume sufficient for use as currency YES NO
Relatively high liquidity YES
YES
YES
YES
NO
Limited reserves YES YES
Spot price YES In process
Infeasible to economically mass produce YES NO
Aesthetic value YES YES
Valuation
Diamonds
Financial
characteristics
Other
Gold Specific features
Source: Bain analysis
Figure 1.10: Diamonds are more complex to value than gold
2,500
2,000
1,500
1,000
500
0
Total global gold ETF holdings (by quarter), tonnes
Note: 2011 figures for Q1 and Q2 onlySources: World Gold Council; Gold Investment Digest Q1 2011
CAGR 56%
CAGR 9%
2005 2006 2007 2008 2009 2010 2011
Figure 1.9: Gold continues to draw strong interest from investors

The Global Diamond Industry | Bain & Company, Inc.
Page 11
much as 30%. Moreover, there is no spot market for rough or polished diamonds, which are primarily sold through private contracts, with no public disclosure of negotiated prices.
Based on those considerations, we do not expect that investment demand will have a significant impact on the industry’s overall supply-demand balance in the industry. Nonetheless, the industry could take several steps to improve diamonds’ investment appeal.
First, it could improve price transparency by creating electronic trading platforms for diamonds. IDEX runs Guaranteed Diamond Transactions (GDT) system that collects and supplies polished diamond price data to a number of firms. Several other players are currently developing trading platforms, including Rapaport Net and DIAMDAX. For example, DODAQ is partnering with AWDC to launch DIAMDAX, the online exchange that offers an online trading platform for polished diamonds using real-time spot prices.
Second, instead of offering investment-level information on all diamonds, a fund can limit its focus to a narrow category of diamonds. For example, a fund could specialize in diamonds of specific clarity and size, particularly large stones. A few funds are already demystifying the market for investors lacking industry expertise and offering them a range of options. The Hong Kong-based Novel Diamond Fund I, for example, focuses on colored diamonds. The Index IQ fund plans to hold only one-carat, gem-quality diamonds.
Several ways to invest in diamonds
There are currently several different ways for individuals and institutions to invest in diamonds. One option is to buy stock in publicly traded companies focusing on diamond production as their core business. Among such companies are ALROSA, Gem Diamonds, Harry Winston and Petra Diamonds.
Alternatively, individuals and institutions can invest in diamond-industry operations, for example, by securitizing inventory. Diamond Asset Advisors (DAA), established in 2011 with capital of $100 million, has made one such investment. (DAA infused an additional $150 million in 2012.) Under its business model, diamonds are sourced by experts at Harry Winston but owned by DAA. When Harry Winston sells the diamonds through its retail outlets, ownership transfers from DAA to Harry Winston and then directly to the consumer. Investors in the DAA fund gain access to the diamond market, with complete price transparency, while Harry Winston gains access to external funding for acquiring inventory and opening new stores. If both partners agree, they have the option of establishing a second fund with a similar business model. As of yet, it is not clear how well the business model is working out.
Yet another approach is to invest in physical stones, acquiring, holding and selling diamonds through trading platforms. One such platform, the Singapore Diamond Exchange (SDX), was launched in 2011. Established as an “exclusive private investment platform for private investors to acquire diamond portfolios at wholesale prices as a hedge against market volatility,” the fund aims to manage about $100 million in diamond portfolios in the next three to five years.
Under SDX’s business model, the exchange helps buyers source polished diamonds and publishes quarterly reports on global diamond prices. For its services, it collects 2% of the transaction value when a diamond changes hands. It also manages individual accounts for clients, issuing quarterly portfolio reports and valuations based on IDEX online prices. All payments are processed through Antwerp Diamond Bank.
Because of the strong interest in diamond investing in China, several financial institutions in that country are pioneering new approaches. ICBC (Industrial and Commercial Bank of China) together with Shandong Trust

The Global Diamond Industry | Bain & Company, Inc.
Page 12
jointly launched a diamond trust with the size of $3 million, which they offer only to their private banking clients. In 2011, China Merchants Bank (CMB) launched a one-of-a-kind trading platform as part of its private banking service for wealthy individuals. Boasting a database of international diamonds that customers can search to buy and trade, it currently holds more than 200 diamonds of three carats or larger in its inventory, all with GIA certificates. CMB also offers an exit mechanism by listing clients’ holdings in the database.
Finally, in the future individuals may be able to invest in ETFs that are backed by diamonds held in vaults, similar to gold and silver ETFs already on the market. In March 2012, a company called Index IQ filed a request with the US Securities and Exchange Commission (SEC) to launch an ETF backed by physical diamonds. The fund’s objective is to invest in diamond parcels at wholesale prices, focusing on one-carat gem-quality diamonds stored in Antwerp. The fund aims to issue exchange-traded shares priced by the net asset value of its diamond inventory. As of yet, such ETFs are not available.
Key takeaways
• The “diamond pipeline” enjoyed a robust 2011. The industry’s mines yielded 124 million carats of rough diamonds, valued at $15 billion. Those stones were worth $24 billion after moving through the chain of dealers, cutters and polishers, on their way to making diamond jewelry worth $71 billion at retail.
• Global diamond jewelry sales grew strongly in 2011, increasing from 2010 by 18% to $71 billion, near the pre-crisis peak of $73 billion in 2007. Rising consumer demand in China and India accounted for most of the growth.
• The supply of rough diamonds contracted by 3% in 2011, to 124 million carats down from 128 million carats in 2010. Production decreases at two companies—De Beers and Rio Tinto—accounted for most of the decline.
• Prices for rough diamonds increased by 31% in 2011. Polished stone prices rose 24%.
• We expect prices to continue rising in the mid-term, as production is likely to remain level or increase slightly, while demand will grow.
• Despite a number of shifts in the industry—such as De Beers completing its sale to Anglo American, BHP Billiton announcing the sale of Ekati mine to Harry Winston, the potential sale of diamond assets by Rio Tinto and increased production in Zimbabwe—the supply-demand dynamic in the long-term will likely remain relatively stable.
• Investor interest in diamonds continues, but their idiosyncrasies, as well as a lack of price transparency and liquidity in the market, are inhibiting the development of an investment market.
The Global Diamond Industry | Bain & Company, Inc.
Page 13
2. Introduction to key market reviews: Supporting demand outlook
The purpose of our country reviews
We undertook a detailed review of three key markets—the US, China and India—in order to learn more about the trends and forces driving past, present and future demand for diamonds. We focused on those markets because, as the three largest diamond-consuming countries, they will heavily influence the supply-demand balance for the years to come.
Our review is multidimensional—encompassing historical trends, macroeconomic forces behind spending, consumer preferences and attitudes, and the development of the retail landscape in each country. We employed a variety of research tools to profile each market, including a review of industry data; secondary research in specialist and general-news publications; surveys of consumers and retail store visits. We also conducted interviews with diamond-industry insiders at all levels of the value chain, from rough manufacturers to dealers and jewelry manufacturers to retail representatives. By examining each diamond market through multiple lenses, the review provides a solid empirical foundation for our demand forecast. Each individual review includes:
The diamond market fundamentals specific to each country: Beginning with a brief recap of each market’s diamond-jewelry heritage, including historical milestones in each market’s development, this section provides a socioeconomic context for each market’s size and growth.
Local drivers of consumer demand: This section pulls together perspectives on observable spending preferences and popular taste in each market.
Development and trends in the trade: Observations of retailers’ behavior in this section serve as an acid test of market assessments and consumer trends.
How we conducted the surveys
To compare and contrast the attitudes and preferences of consumers in different markets, we conducted an online survey from July through September 2012, polling women 15 years and older. We surveyed consumers in China, India, the US, Europe (France, Germany, Italy and UK) and Russia.
Our sampling model sorted respondents by several attributes, including age, marital status, geography and income. Affluent women, who account for the largest share of diamond demand, were overrepresented in the sample; the survey results are therefore not fully representative for the overall population in those countries.
The survey aimed to gain insights into several specific topics, including:
• Ownership levels and purchase patterns of diamond jewelry
• Consumer perceptions and preferences regarding diamonds and diamond jewelry
• Evolution of the diamond engagement ring custom
The Global Diamond Industry | Bain & Company, Inc.
Page 14
• Consumer awareness of the “four Cs” of diamonds (carat, clarity, color and cut); importance of the four Cs in purchase decisions
• Investment potential
• Perception of synthetic diamonds and consumers’ willingness to buy them
• Awareness of and willingness to pay extra for quality certificates or branded diamonds
In total, we surveyed 13,000 women across the globe of whom 5,200 own at least one piece of diamond jewelry. In addition, we surveyed 1,000 US men who married in the last 10 years to test the diamond engagement ring trend.
In the subsequent chapters, we share the results of our investigation, representing the synthesized results of the consumer survey, industry data analysis, trade interviews and secondary research. Based on these results, we draw implications for the diamond demand for the next 10 years.
The Global Diamond Industry | Bain & Company, Inc.
Page 15
3. Major diamond markets: Similarities and contrasts
Local differences in diamond preferences, ownership and psychological associations
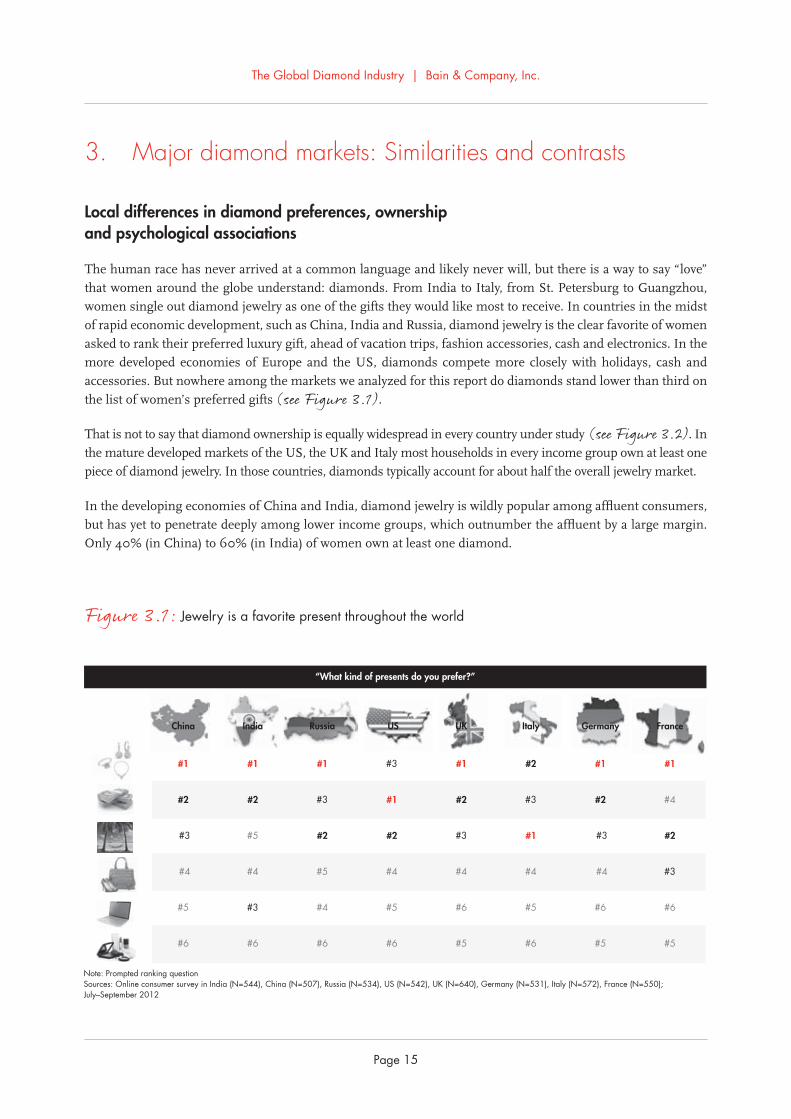
The human race has never arrived at a common language and likely never will, but there is a way to say “love” that women around the globe understand: diamonds. From India to Italy, from St. Petersburg to Guangzhou, women single out diamond jewelry as one of the gifts they would like most to receive. In countries in the midst of rapid economic development, such as China, India and Russia, diamond jewelry is the clear favorite of women asked to rank their preferred luxury gift, ahead of vacation trips, fashion accessories, cash and electronics. In the more developed economies of Europe and the US, diamonds compete more closely with holidays, cash and accessories. But nowhere among the markets we analyzed for this report do diamonds stand lower than third on the list of women’s preferred gifts (see Figure 3.1).
That is not to say that diamond ownership is equally widespread in every country under study (see Figure 3.2). In the mature developed markets of the US, the UK and Italy most households in every income group own at least one piece of diamond jewelry. In those countries, diamonds typically account for about half the overall jewelry market.
In the developing economies of China and India, diamond jewelry is wildly popular among affluent consumers, but has yet to penetrate deeply among lower income groups, which outnumber the affluent by a large margin. Only 40% (in China) to 60% (in India) of women own at least one diamond.
Note: Prompted ranking questionSources: Online consumer survey in India (N=544), China (N=507), Russia (N=534), US (N=542), UK (N=640), Germany (N=531), Italy (N=572), France (N=550); July–September 2012
#1 #1 #1 #3 #1 #2 #1 #1
#2 #2 #3 #1 #2 #3 #2 #4
#3 #5 #2 #2 #3 #1 #3 #2
#4 #4 #5 #4 #4 #4 #4 #3
#5 #3 #4 #5 #6 #5 #6 #6
#6 #6 #6 #6 #5 #6 #5 #5
UK India Italy France China Russia US Germany
“What kind of presents do you prefer?”
Figure 3.1: Jewelry is a favorite present throughout the world

The Global Diamond Industry | Bain & Company, Inc.
Page 16
40% 60% 40% 85% 80% 85% 75% 70%
100%
80
60
40
20
0
Sources: Online consumer survey in India (N=544), China (N=507), Russia (N=534), US (N=542), UK (N=640), Germany (N=531), Italy (N=572), France (N=550); July–September 2012
Total % of households with at least one diamond(estimated)
>106–10
2–5
1
None
UK India Italy France China Russia US Germany
“How many pieces of diamond jewelry do you own?”
Penetration rate of diamond jewelry for highest and lowest strata (estimated)
Country China India Russia US UK Italy Germany France
% of households with at least one diamond, lowest income* 20% 55% 30% 80% 75% 80% 70% 65%
% of households with at least one diamond, highest income** 90% 95% 85% 95% 85% 95% 80% 75%
*Households with highest income in developed countries – disposable income per household >$100K, in developing countries – disposable income per household >$60K**Households with lowest income in developed countries – disposable income per household <$50K, in developing countries – disposable income per household <$5KNote: Prompted question; penetration is weighted average by income levels based on income distribution in each countrySource: Online consumer survey in India (N=544), China (N=507), Russia (N=534), US (N=542), UK (N=640), Germany (N=531), Italy (N=572), France (N=550); July–September 2012
Figure 3.2: Diamond ownership is widespread in developed markets, less so in others

The Global Diamond Industry | Bain & Company, Inc.
Page 17
France and Germany—along with much of continental Europe—represent a middle ground. In those countries, diamond jewelry is fairly popular across all income groups, and 60% to 80% of households in every income group own at least one piece of diamond jewelry. Ownership of multiple pieces is common among more affluent consumers. Diamonds make up a moderate share of the jewelry markets in those countries.
In every market we studied in depth, diamonds carry a strong, positive emotional charge for women, but the emotions vary across cultures. In China, diamonds conjure up the feeling of eternity—an association that is utterly absent from the mind of the typical Indian woman. For Indian women, as with their American counterparts, diamonds mean “expensive” and are closely associated with conspicuous wealth.
Diamonds also carry an additional association with security—above all, economic security—in the developing markets of China, India and Russia. Because women in those countries perceive diamonds, in part, as a store of value, it is possible that a market for investment diamonds could develop in those countries (see Figure 3.3).
Role of diamonds in engagements and gift-giving
Despite these local differences, women in all the markets we studied agree on one thing—diamond rings mean marriage. In every country diamond rings are a powerful symbol of engagement, weddings and love. This is the common foundation of the diamond jewelry markets.
Not every country has adopted the practice of giving engagement rings to the same degree, however (see Figure 3.4). In the UK and the US, for example, diamond rings feature in 80% to 85% of all marriages. In those two countries, a diamond ring is an integral part of the engagement ritual. The idea of proposing marriage
No
Yes
Estimatedinterest 15%50% 20% 15%45% 25% 15% 10%
Note: Prompted questionSource: Online consumer survey in India (N=544), China (N=507), Russia (N=534), US (N=542), UK (N=640), Germany (N=531), Italy (N=572), France (N=550); July–September 2012
“Have you ever considered diamonds specifically as investment?”
UK India Italy France China Russia US Germany
100%
80
60
40
20
0
Figure 3.3: Invest in diamonds? Maybe in developing markets

The Global Diamond Industry | Bain & Company, Inc.
Page 18
without offering a ring is simply unthinkable to most couples. In Germany, by contrast, only some 40% of married women wear a diamond engagement ring, and the association of diamonds with love is generally weaker.
In China, India and Russia the custom of formalizing an engagement with a diamond ring is growing in popularity. As the economies in those three countries continue to develop and a growing number of people attain middle-class status, the Western practice of giving diamond engagement rings is rapidly gaining a foothold.
In every market we studied, women received 60% to 80% of their diamonds as a gift. Their involvement in the selection process varies widely, however, which is something smart retailers will want to consider as they shape their marketing approaches to each country. American and Russian women like to be surprised—they may give their husbands or boyfriends a strong hint of what sort of diamond would delight them, but they let the man pick out the jewelry. Chinese and Indian women are far more directly involved. Their suitors may be paying the bill, but the women often take charge of selecting the stones and settings.
Consumer priorities and the importance of authenticity
Another near-universal we found is that when it comes to diamond jewelry, design is what matters most to a woman. In most regions, clarity is the next most important consideration, ahead of size and color. Secondary considerations include price, the brand of the diamond or jewelry and the stone’s country of origin.
Left unspoken is an equally important selection criterion: authenticity. In every country we studied, the reaction of consumers to synthetic diamonds was overwhelmingly negative. Wherever we asked consumers about their
UK India Italy France China Russia US Germany
No
Yes
Source: Online consumer survey in India (N=544), China (N=507), Russia (N=534), US (N=542), UK (N=640), Germany (N=531), Italy (N=572), France (N=550); July–September 2012
“Have you ever received a diamond engagement ring?”
80%60% 70% 60%60% 55% 85% 40%
Peneration rate of diamond engagement ring (estimated)
100%
80
60
40
20
0
Figure 3.4: The popularity of engagement rings varies widely by region

The Global Diamond Industry | Bain & Company, Inc.
Page 19
thoughts regarding synthetic diamonds, the most frequent answers were “cheap” and “fake”—reassuring words to any rough diamond producer worried that synthetic diamonds might someday supplant the real thing the way CDs supplanted vinyl records or digital photography has made film nearly obsolete.
Interestingly, “fake” and “cheap” was the most prominent association in China, Russia, Germany, the UK and the US, while Italians and French more often just said “fake” (see Figure 3.5). On the whole, though, the emotional resonance of diamonds for women is so powerful that the market faces little substitution risk from synthetic alternatives.
The importance of authenticity also helps explain why quality certificates are so accepted and relied upon in many markets, especially developing ones (see Figure 3.6). The availability of such certificates is consumers’ primary consideration when choosing a retailer in China, India and Russia. Certificates are less important—though hardly negligible—when choosing a store in the developed markets of continental Europe, the UK and the US, where trust in retailers is generally higher and consumers enjoy stronger legal protections. In those more developed markets, service quality is the leading consideration for store choice.
Name recognition counts, too, and on that score, global leaders of the luxury category such as Tiffany and Cartier have a decided advantage over the competition in most markets (see Figure 3.7). Tiffany claims the largest share of the female mind in the US, UK and Russia. Cartier has the edge in France, Italy and China, where Cartier was one of the first foreign jewelry retailers to set up shop. The notable exception to the dominance of the global brands is India, where the international names are surprisingly absent from the scene. There, local brands such as Tanishq and Nakshatra are top-of-mind by some distance. They have entrenched themselves in public consciousness so deeply that it will be difficult to dislodge them.
India France China Russia
UK Italy US Germany
Note: Unprompted question; size of font shows frequency of mentioningSource: Online consumer survey in India (N=544), China (N=507), Russia (N=534), US (N=542), UK (N=640), Germany (N=531), Italy (N=572), France (N=550); July–September 2012
“What words come to mind when you think about synthetic diamonds?”
Figure 3.5: A chilly reception for synthetics in every market

The Global Diamond Industry | Bain & Company, Inc.
Page 20
Note: Prompted ranking questionSource: Online consumer survey in India (N=544), China (N=507), Russia (N=534), US (N=542), UK (N=640), Germany (N=531), Italy (N=572), France (N=550); July–September 2012
UK India Italy France China Russia US Germany
Service quality #3 #4 #3 #1 #1 #1 #1 #1
Selection of brands/styles #2 #2 #2 #2 #2 #3 #2 #2
Quality certificates
#1 #1 #1 #3 #3 #2 #3 #3
Discounts #4 #6 #5 #4 #4 #4 #5 #5
Location #6 #7 #6 #5 #5 #5 #4 #4
Many outlets #5 #5 #4 #6 #6 #6 #6 #6
Family jeweler ranked #3 in importance
“How important are the following criteria when�deciding from which store to buy?”
Figure 3.6: Certificates matter in emerging markets, service in the West
Note: Unprompted question; size of font shows frequency of mentioningSource: Online consumer survey in India (N=544), China (N=507), Russia (N=534), US (N=542), UK (N=640), Germany (N=531), Italy (N=572), France (N=550); July–September 2012
“What brands come to mind when you think about diamond jewelry?”
India France China Russia
Italy US Germany UK
Figure 3.7: What’s the best-known brand? Depends where you ask

The Global Diamond Industry | Bain & Company, Inc.
Page 21
Key takeaways
• In both emerging and developed markets, diamond jewelry is at or near the top of most women’s lists of preferred presents. In China, India and Russia, diamonds are far and away women’s favorite gift.
• The popularity and penetration of diamond jewelry is high in the US, UK and Italy, where diamonds make up about half the jewelry market. Penetration and popularity are moderate in most of continental Europe. And in China, India and Russia, diamonds have been embraced by the affluent but have scarcely penetrated lower economic groups.
• Chinese women, unlike Indian women, associate diamonds with eternity. For American and Indian women, diamonds carry a strong monetary association as well as a positive emotional charge. Across all markets, diamond rings symbolize engagement, marriage and love.
• Nonetheless, adoption of the diamond engagement ring tradition is uneven. In the US and UK about 80% to 85% of engagements are formalized with a diamond, but in Germany the percentage is only 40%. Engagement rings are becoming increasingly popular in continental Europe as well as China, India and Russia.
• Most women receive diamonds as a gift. Women in China and India are closely involved in choosing their jewelry, whereas American and Russian women prefer to be surprised.
• The availability of quality certificates is the top determinant of store choice for shoppers in China, India and Russia. In the US and other developed markets where trust in retailers and consumer protections are stronger, service quality is the leading criterion for store choice.
• Luxury retailers Cartier and Tiffany are top-of-mind diamond destinations for consumers in most countries except for India, where Tanishq and Nakshatra are the best-known consumer brands.

The Global Diamond Industry | Bain & Company, Inc.
Page 22
4. The US diamond market
Fundamentals of the US diamond market
The American market: A triumph of advertising
Without De Beers and N.W. Ayers advertising agency, would the US diamond market today account for 40% of global demand (see Figure 4.1), with $27 billion in annual revenues, more than three times those of China or India? Quite possibly not. In 1939, De Beers engaged N.W. Ayers to produce an advertising campaign promoting diamonds. N.W. Ayers answered the challenge with a revolution: a long-running campaign that helped create the world’s largest diamond market. Its unforgettable slogan: “A diamond is forever.”
The campaign ignited popular interest. Long before “viral” became a marketing term, De Beers’ advertising quickly convinced American men that a diamond was the ultimate love offering and women that no courtship was complete without a diamond engagement ring. Diamonds assumed an exalted place in popular culture, appearing prominently in fiction, movies and songs—no one who has seen Marilyn Monroe sing “Diamonds Are a Girl’s Best Friend” in Gentlemen Prefer Blondes will soon forget the experience. Within three years of the campaign’s debut, demand and prices were on the rise, and by 1960 five in 10 American engagements were sealed with a diamond ring.
The campaign was highly effective in molding popular tastes. It trained consumers to value diamonds for their size—anything less than a carat was frowned upon—and clarity. And by positioning diamonds as a timeless
46% 51% 38%
2000 2005 2011
US share*Including Hong KongSources: "Jewelry Retail Chains 2012" (RBC Research); IDEX; Tacy Ltd. and Chaim Even-Zohar; publication analysis
Global diamond jewelry market, $ billions
56
61
71
OtherRussiaGulf
India
China*
EU
Japan
US
CAGR(2000–2011) (2005–2011)
2%
0%21%6%
16%
26%
-1%
-6%
0%
2%
5%18%16%
22%
32%
-2%
-9%
-3%
Figure 4.1: US: Colossus of the global diamond jewelry market
The Global Diamond Industry | Bain & Company, Inc.
Page 23
keepsake, De Beers ensured that few women would resell their diamonds and thereby disrupt the supply-demand balance.
An elite taste spreads to the mass market
Diamonds were hardly unknown in the US before De Beers’ game-changing marketing campaign, but they were far out of reach of the average American. Wealthy Americans acquired a taste for diamonds following the fall of Napoleon III in 1870. Many beleaguered European aristocrats, who at the time owned the bulk of the world’s diamonds, were forced to auction off their assets. Their diamond collections often ended up in the hands of US business tycoons.
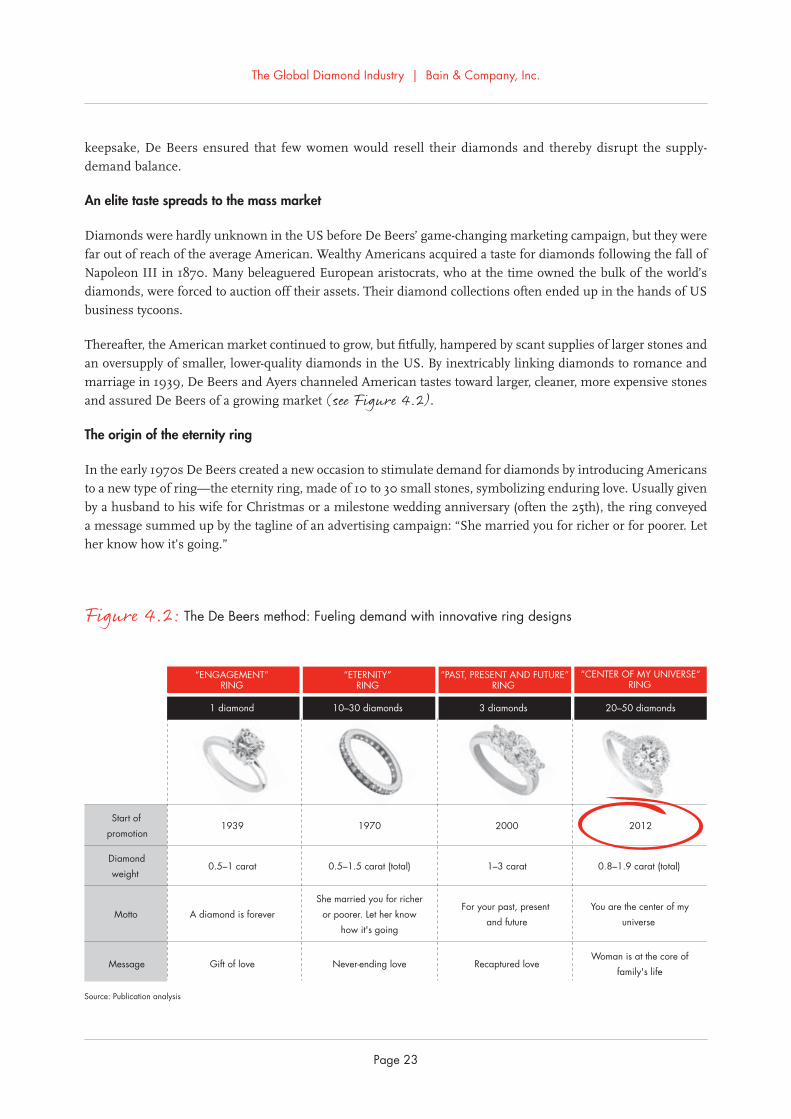
Thereafter, the American market continued to grow, but fitfully, hampered by scant supplies of larger stones and an oversupply of smaller, lower-quality diamonds in the US. By inextricably linking diamonds to romance and marriage in 1939, De Beers and Ayers channeled American tastes toward larger, cleaner, more expensive stones and assured De Beers of a growing market (see Figure 4.2).
The origin of the eternity ring
In the early 1970s De Beers created a new occasion to stimulate demand for diamonds by introducing Americans to a new type of ring—the eternity ring, made of 10 to 30 small stones, symbolizing enduring love. Usually given by a husband to his wife for Christmas or a milestone wedding anniversary (often the 25th), the ring conveyed a message summed up by the tagline of an advertising campaign: “She married you for richer or for poorer. Let her know how it’s going.”
Start of
promotion 1939 1970 2000
Diamond
weight 0.5–1 carat 0.5–1.5 carat (total) 1–3 carat 0.8–1.9 carat (total)
Motto A diamond is forever
She married you for richer
or poorer. Let her know
how it's going
For your past, present
and future
Message Gift of love Never-ending love Recaptured love
“PAST, PRESENT AND FUTURE”
RING
10–30 diamonds 1 diamond 3 diamonds 20–50 diamonds
“ENGAGEMENT“ RING
“ETERNITY” RING
2012
You are the center of my
universe
Woman is at the core of
family's life
“CENTER OF MY UNIVERSE“RING
Source: Publication analysis
Figure 4.2: The De Beers method: Fueling demand with innovative ring designs

The Global Diamond Industry | Bain & Company, Inc.
Page 24
The marketing campaign steered American tastes in a new direction. Advertising, that once emphasized size, now stressed color, cut and quality. As a result, the average size of a diamond sold in the US in the 1970s dropped to 0.3 carat, down from 1 carat in the 1960s. Just as important, the campaign created the expectation in the minds of American couples that their union required two diamond rings—one at the outset of a marriage, and a second when it had proved its durability.
More rings for her collection
De Beers lost its central position in the diamond market in the early 2000s; however its determination to stimulate demand with canny marketing did not change. In 2000, De Beers introduced the three-stone “past, present and future” ring, with two diamonds of one carat surrounding a central diamond of three carats and symbolizing recaptured, rekindled love. Rolled out during a period of rapidly rising housing prices and easy consumer credit, the ads promoting the ring encouraged Americans to buy larger stones and helped propel the diamond market to new heights.
The 2012 holiday season will see the debut of a new De Beers advertising campaign, a new style of ring and a fresh attempt to recalibrate consumer tastes. The “Center of My Universe” ring is made up of 25 to 50 stones ranging in weight from 0.8 to 1.9 carats and expresses a message from a husband to his wife that is well-suited to the times: “Whatever the demands and distractions of contemporary life, you’re No. 1 in my eyes—the center of my universe.”
A market in need of a boost
The industry is watching the campaign closely, because the US diamond market could use an infusion of excitement. At $27 billion, the market today remains the world’s largest, but it stands at a level comparable to
2005 2006 2007 2008 2009 2010 2011
$42K $44K $46K $47K $47K $49K $51K
5053
55 53
48 49
55
3234
37
31
25 25 27
CAGR5%
CAGR8%
CAGR-6%
CAGR-18%
CAGR7%
CAGR5%
GDP per capita
*Including setting; GDP in real prices (2011)Sources: Euromonitor; IMF; IDEX; Tacy Ltd. and Chaim Even-Zohar
US jewelry market, $ billionsCAGR
(2005–2011)1%
7%
-3%
3%
Diamond jewelry* Other jewelry
Figure 4.3: Diamond sales slumped during the last recession but are showing healthy recovery

The Global Diamond Industry | Bain & Company, Inc.
Page 25
2000 (see Figure 4.3). The 2008–2009 financial crisis hit diamonds harder than the overall jewelry and watches market, whose revenues fell 6% per annum from 2007 through 2009. Over the same period, diamond jewelry sales plunged 18%—to $25.1 billion from $36.5 billion—as consumers turned to other types of jewelry, bought smaller stones or simply kept their money in their pockets.
Since the crisis, sales have bounced back along with the rest of the luxury sector. Total diamond revenues still have not returned to their 2007 peak. Nonetheless, the US diamond market is huge. For example, its annual revenues are double those of the US mobile phone market.
Diamond industry players have spent heavily on advertising to revive the market. In 2011, the top three specialty chains—Signet, Tiffany and Zales—poured $333 million into advertising across all channels, including social media and other Internet outlets. That outlay was below the 2008 record spending amount of $360 million, but well up from nearly $315 million that they spent annually in 2008 and 2009.
Despite the setbacks of recent years, diamonds remain the cornerstone of the US jewelry market, claiming about 50% of sector revenues (see Figure 4.4). Out of all developed economies, only Japan has a comparable penetration rate, thanks to that country’s extensive borrowings from American culture and De Beers’ strong influence over Japanese consumer preferences. What’s more, diamonds did not lose their appeal to women, and across all age groups and income levels, ownership of multiple diamond pieces is common. Revenues are likely to climb further as the economy and personal incomes rebound, but it will be some time, if ever, before US diamond sales return to the heady growth rates of previous decades. For that kind of performance, the industry is looking to the fast-emerging economies of India and China.
World average
US
51%
51%
64%
36%
73%
27%
86%
14% 18%
82%
49%
49%
Japan Russia India China EU*
*Based on 2009 dataNote: Diamond jewelry including settingSources: Euromonitor; IDEX; Tacy Ltd. and Chaim Even-Zohar; "Jewelry Retail Chains 2012" (RBC Research); publication analysis
Jewelry market by type of jewelry, 2011
Diamond jewelry Other jewelry
Figure 4.4: Diamonds still rule the US jewelry market

The Global Diamond Industry | Bain & Company, Inc.
Page 26
Sources of the US consumer demand
US consumer: Still hungry for diamonds, but…
Through good times and bad, diamonds have held a special place in the minds of US consumers. Diamonds appeal to both their emotional and pragmatic sides—when asked, women associate diamonds with wealth, using words like “expensive” and “shiny,” as well as words with romantic connotations such as “beautiful,” “wedding” and “engagement.” Diamonds retain a strong link with weddings and other celebrations of love, while a woman’s first piece of diamond jewelry is most often a ring or earrings received as a gift at Christmas or when the man in her life proposes (see Figure 4.5). Engagements and weddings account for the largest share of purchase occasions (30%), followed by Christmas and birthdays. Valentine’s Day and wedding anniversaries are not far behind.
Even as demand falters, consumers still budget generously for engagement rings (see Figure 4.6). About 70% of the American men we surveyed claimed they spent more than $1,000 on their spouse’s engagement ring, and about half said they spent more than one month’s salary. About 30% spent more than $5,000. As a testament to the enduring influence of De Beers’s marketing messages, more than 50% of the diamonds on engagement rings are one carat or more.
Yet survey and other data suggest that diamonds have lost some of their magical appeal at least where younger consumers are concerned. Jewelry is still the preferred luxury purchase of American women, ahead of cars and clothes, and diamonds are traditionally their favorite kind of jewelry. But diamonds came only third when women were asked to rank a list of presents in order of preference. Cash was the clear first and second preference of the 500-plus women we surveyed over the summer, followed by holidays and travel. Of greater concern, perhaps, are
Wedding anniversary
First diamond jewelry Other diamond jewelry
100%
80
60
40
20
0
Note: Prompted question; other includes graduation, confirmation, inheritanceSource: Online consumer survey (N=542, July–September 2012)
Other
Spontaneous decision
Birth of a child
Wedding
Valentine’s Day
Christmas
Birthday
Engagement
“For which occasion(s) did you receive/purchase diamond jewelry?”
Percent of respondents
Figure 4.5: For American women, diamonds and celebrations go together

The Global Diamond Industry | Bain & Company, Inc.
Page 27
the survey findings regarding engagement rings. The custom of sealing engagements with a diamond ring, once nearly universal, has begun to slow down—since its peak in 2000 through 2005, the engagement ring practice has retracted three to five percentage points (see Figure 4.7).
Tight budgets might be holding down ring sales. About half of male survey respondents cited their desire to save money as the reason for not buying a ring (see Figure 4.8). Interestingly enough, engagement ring purchases rose as the income level of respondents increased.
Young people are not interested in diamonds?
Lack of interest in diamond engagement rings among younger consumers may be a short-term phenomenon. The young women ages 15 to 24 whom we surveyed showed the least interest of all groups in jewelry as a present. The share of women naming jewelry as their preferred present jumped sharply as the age of the respondents increased, raising the question of whether we are seeing a generational turn away from jewelry toward electronics and other must-have items.
Among older women, diamonds continue to exert an almost hypnotic hold. More than two-thirds of survey respondents own at least two pieces of diamond jewelry, with ring-earring combinations being the most common (see Figure 4.9); 12% of survey respondents own 10 or more pieces. Those women are generally more affluent than the overall survey population, with annual household incomes of $75,000 or more. Most are 35 to 55 years old and live in the western or northwestern US.
100%
80
60
40
20
0
100%
80
60
40
20
0
Note: Prompted questionSource: Online consumer survey (N=1,008, August 2012)
Price of the engagement ring Number of monthly salaries
More than $10,000 More than 3 months
$5,000–$10,000 2 to 3 months
1 to 2 months
Half to 1 month
Less than half
$2,500–$5,000
$1,000–$2,500
Less than $1,000
“How many monthly salaries did you spend on the engagement ring?”
Percent of respondents Percent of respondents
Figure 4.6: More than 50% of respondents spent at least one month’s salary (more than $2,500) on the engagement ring

The Global Diamond Industry | Bain & Company, Inc.
Page 28
100%
80
60
40
20
0
Note: Prompted questionSource: Online consumer survey (N=2,920, July–September 2012)
No
Yes, other ring
Yes, diamond ring
Decided to save money
Decided to spend on another present (e.g., traveling)
Other reason
“Did you buy an engagement ring?” “Why did you decide not to purchase an engagement ring?”
Percent of respondents
All respondents No engagement ring
Figure 4.8: Tight incomes bite into engagement ring sales
100%
80
60
40
20
0
Note: Prompted questionSource: Online consumer survey (N=2,920, July–September 2012)
Diamond engage-ment ring practice penetration
Total Before 1990
1990–2000 2001–2005 2006–2010 2011–2012
71% 66% 72% 73% 70% 69%
No
Yes, other ring
Yes, diamond
ring
“Did you buy an engagement ring?”
Percent of respondents
Figure 4.7: The engagement ring tradition endures through tough times

The Global Diamond Industry | Bain & Company, Inc.
Page 29
Consumer tastes are well defined
American women know what they want in a diamond (see Figure 4.10). When asked what matters to them most in choosing a diamond, they specified design by a large margin over cut and clarity. Size came in a fairly distant fourth, just ahead of price. Curiously, however, that hierarchy of preferences changes when the subject is engagement rings. In that case, size matters much more than clarity, cut or design. Women are less definite about the quantitative characteristics—carat, clarity, color and cut—of the diamonds in their collections, but about half could recall at least the carat and cut of their largest diamond. Although most women are aware of at least one diamond certifying body (the GIA, in most cases), quality certificates do not factor heavily in their purchase decisions, indicating that in the US, at least, women trust their jewelers.
American women also show a strong streak of traditionalism in their diamond preferences. Although their awareness of fancy colored diamonds is high, with about 70% of those surveyed saying they had heard of them, a large plurality prefer colorless stones. Very few have tried to sell their diamonds, probably because of their high emotional value, and few have considered diamonds as investments.
Although the brand of the diamond is not a key criterion for purchase decisions, about 60% of consumers surveyed indicated they would be willing to pay a premium, ranging from 5% to 20%, for a branded diamond.
Percent of respondents
100%
80
60
40
20
0
Note: Prompted question; overall penetration is weighted average of penetration by income level based on US income distributionSource: Online consumer survey (N=1,107, July–September 2012)
$25–50K $75–100K$50–75K $100–150K $150K+ Total
>10 >10 >10 >10>10
>10
>10
6–10 6–10
6–10 6–10
6–10
6–10
2–52–5
2–5 2–5
2–5
2–5
1 1
1 1
1
1
NoneNone None None
NoneNone
“How many pieces of diamond jewelry do you own?”
Figure 4.9: High diamond jewelry penetration among all income segments

The Global Diamond Industry | Bain & Company, Inc.
Page 30
Developments and trends in US retail
The US retail scene: Only the strong survive
The story about diamond demand would not be complete without an understanding of retail trends. The availability and variety of diamond jewelry influence consumer behavior, just as it does with other types of goods.
The US diamond retailing environment has been in turmoil in recent years, with nearly 5,000 specialty stores disappearing since 2000 (see Figure 4.11). Most closed their doors during and after the late-2000s recession, when almost 3,500 stores went out of business. When three national chains went into liquidation, 857 outlets were lost. Those three chains—Whitehall Jewelers, Friedman Jewelers and Bailey Banks & Biddle, a unit of Finlay Enterprises—were caught in a classic squeeze when US financial markets seized up in 2008. Consumer demand retracted, and amid a clampdown on credit availability, the jewelers were unable to finance their inventories. The three chains together accounted for roughly $1 billion in annual diamond sales.
They were hardly the only casualties of the economic turmoil. Three other major chains—Ultra Diamonds, Shane Co. and Robbins Bros.—reorganized through bankruptcy proceedings, blaming the recession and a plunge in holiday sales. Many surviving retailers, including familiar names like Cartier, Fred Meyer, Macy’s, Signet and Zales, closed some of their outlets. Zales shrank the most, shuttering 145 outlets, while Cartier closed only two.
Other retailers rushed to fill the void. Discounters Costco, Target and Wal-Mart opened new outlets in their big-box stores while at the other end of the market, Tiffany added eight stores. Middle-market department store chain Kohl’s also expanded, opening 69 new outlets.
100%
80
60
40
20
0
Note: Prompted ranking questionSource: Online consumer survey (N=542, July–September 2012)
Design Clarity Color Size Price Country of origin
Fancy color
Brand of diamond
#4–9
#3
#2
#1impor-tance
“What are the most important characteristics of diamond jewelry?”
Percent of respondents
Figure 4.10: Design is the determining factor in diamond jewelry choices

The Global Diamond Industry | Bain & Company, Inc.
Page 31
The specialty sector shrinks
A new, though still highly fragmented, retailing landscape is coming into focus as the dust from the shakeout settles. Specialty stores now have a smaller footprint, as the number of outlets shrank from about 25,800 in early 2008 to 22,300 in 2011. The specialty stores’ share of the jewelry and watches market slid by 7% in 2011 from 50% in 2000, and revenues have grown at only a 1% compound annual rate over the same period (see Figure 4.12). Discount stores and online retailers have enlarged their share of jewelry locations and revenues, and that trend appears likely to hold. Online jewelry revenues have grown at a compound annual rate of more than 20% since 2000, while discount-store revenues have grown at a compound annual rate of 7%. Leading discounters have been adding jewelry counters to their big-box stores at a furious pace—category leader Wal-Mart alone added more than 120 jewelry outlets from 2009 through 2011 and plans to add 200 outlets in 2012.
Other retail channels that grew through the decade should also see their share of the revenue pool increase: television shopping channels, online retailers and multi-channel sellers. The leading online players are Amazon.com ($400 million in 2011) and Blue Nile ($300 million). Jewelry TV, a home shopping network, showed strong growth, increasing revenues to $400 million in 2011, up 21% since 2009. Shopping-channel leader QVC, on the other hand, saw its jewelry revenues fall about 30% over the same period.
After the shakeout, a new retail landscape
The realignment of the US jewelry retail landscape will likely maintain its present course at least through 2015. The overall jewelry and watches market should grow at around 4% a year through 2015, reaching total revenues of $75 billion to $80 billion. The downsizing of the specialty sector should continue, dropping to about 20,500 outlets in 2015. By that time, there will likely be about 30,000 jewelry outlets at department and discount stores.
Sources: US Bureau of Labor Statistics; publication analysis
Number of specialty stores, thousands2001
2003
2000
2011
2010
2009
2008
200720062005
20022004
Net closed Majorliquidations
2011
27.2
22.2-0.9
-4.1 FriedmanWhitehall
Finlay
Figure 4.11: The recession accelerated the specialty-store shakeout

The Global Diamond Industry | Bain & Company, Inc.
Page 32
For the most part, the survivors will emerge from the downturn in solid condition. Leading retailers such as Signet (Kay Jewelers, Jared and other banners), Zales, Tiffany and Macy’s have a strong foundation of consumer trust to build on, as do many of the remaining local independents. What’s more, the industry stalwarts have impressive name recognition. When asked what brands come to mind when they think about jewelry, our survey population named Tiffany, which is synonymous with luxury in the US, and Kay Jewelers, a heavy advertiser during the holiday season. Mass-market retail chains Zales and Jared were also mentioned frequently.
Shoppers seek out high-quality service
Service is the main differentiator among retailers; consumers cited it as their leading criterion when choosing a diamond store (see Figure 4.13). Next in importance in consumers’ minds is the selection of brands and styles, followed by the availability of quality certificates. It should be added, though, that a large number of those surveyed (about 40%) said they would not pay a premium for a certified diamond.
Consumers are likely to find a large selection of diamonds offered in whatever store they choose. Judging from our store checks in New York City, most retailers devote at least 70% of their shelf space to diamond jewelry. Many department stores give as much as 90% of their space to diamonds, while specialty stores usually top out at 80%. Right-hand (or non-engagement) rings, marketed to affluent single women, are increasingly popular and have helped offset diminished engagement ring sales.
Women are the target customers
Women are jewelers’ target audience, and most stores devote only a token amount of space to men’s diamond jewelry. Jewelers arrange their displays with women in mind, whether the shopper is a man, a woman or a couple.
Ross-Simons
JewelryTV
Cartier
Helzberg
Sources: National Jeweler, US Census Bureau
29 10 10 4 14100%
80
60
40
20
0
Zale Corp.
JC Penney
Sears
Macy’s
Costco
Wal-Mart Blue Nile
Amazon
Tiffany & Co.
Signet
Specialty stores
Departmentstores
Discounters Internet Other channels
QVC
OtherOther Other
OtherOther
1% 0% 7% >20% 4%CAGR(2000–2011)
Retail jewelry and watches market in the US, $ billions, 2011
Figure 4.12: Retail channels still highly fragmented

The Global Diamond Industry | Bain & Company, Inc.
Page 33
Lone male shoppers are not infrequent, but they are not relying solely on their own judgment (see Figure 4.14). Our survey indicates that women strongly influence men’s purchasing decisions when they are shopping for an engagement ring, which is still the dominant entry point into the diamond market. In fact, one man in two told us his girlfriend either influenced his choice before the purchase or helped pick it out.
Men appear more likely to consider quantitative evidence in their purchase decisions—around 60% of the men we surveyed could recall the size, color and cut of the diamond in the engagement ring they bought, compared with five in 10 women. About 50% of the male respondents to our survey told us that they bought other pieces of diamond jewelry for their wives or fiancées after buying the engagement ring. Rings, earrings and necklaces were their most frequent choices.
100%
80
60
40
20
0
Note: Prompted ranking questionSource: Online consumer survey (N=542, July–September 2012)
#4–6
Service quality Selection of brands/styles
Qualitycertificates
Discounts Location Many outlets
#3
#2
#1(most
importantcriteria)
“How important are the following criteria when deciding from which store to buy?”
Percent of respondents by level of importance for each criterion
Figure 4.13: Shoppers look for stores with good service and a wide selection

The Global Diamond Industry | Bain & Company, Inc.
Page 34
Key takeaways
• The US is far and away the world’s largest diamond market. Its $27 billion in revenues are more than three times the revenues of No. 2 market China or No. 3 market India—and twice those of the US mobile phone market.
• The US market is largely the creation of De Beers, whose long-running “Diamonds are forever” promotional campaign turned diamonds into the premier symbol of luxury and romance.
• Women continue to crave diamonds, but popularity of diamond engagement rings among younger consumers is marginally slowing down. It is unclear whether this is a temporary phenomenon or a long-term trend, but younger women show a growing preference for other luxury goods, especially consumer electronics.
• The 2008–2009 financial crisis hit the US market hard, as diamond jewelry sales fell 18% from 2008 to 2009. The market has rebounded somewhat, but 2011 revenues were only slightly above those of 2000.
• Retail trends play an important role in reflecting and shaping the consumer demand. The specialty retail sector has consolidated in recent years, with the disappearance of more than 5,000 specialty stores. Despite the change, the sector remains very viable, and Internet outlets and discounters are playing an increasingly prominent role.
100%
80
60
40
20
0
Note: Prompted questionSource: Online consumer survey (N=1,008 – men, N=542 – women, July–September 2012)
Men Women
No
No, it was a surprise
Indicated before
Was present at purchase
Yes, otherYes, the store assistant oriented
me toward something else
Yes, my girlfriend was present at the purchase
Yes, my girlfriend influenced the decision before the purchase
“Were you influenced by someone else when selecting the engagement ring?” “Did you influence the decision?”
Percent of respondents
Figure 4.14: A woman’s prerogative: Choosing the ring

The Global Diamond Industry | Bain & Company, Inc.
Page 35
• Discount stores such as Wal-Mart, Costco and Target are aggressively adding new jewelry counters, capturing share from specialty stores.
• Though not among the top five purchasing criteria (and low awareness and importance vs. jewelry brands), consumers recognize diamond brands and are willing to pay a premium for a branded stone.

The Global Diamond Industry | Bain & Company, Inc.
Page 36
5. The diamond market in China
Fundamentals of the Chinese diamond market
Diamonds in China: A recent arrival
All but unknown in China two centuries ago, diamond jewelry is still a relative newcomer on China’s jewelry scene. Traditionally, the Chinese have favored gold and jade, which have age-old cultural associations with good fortune, prosperity and security. Diamond jewelry did not arrive in China until the first half of the 19th century, when Western traders, military officers and government administrators moved their households to the mainland. Upper-class Chinese soon acquired a taste for the stones, regarding them as the ultimate luxury good; until the 1949 revolution, diamond ownership was limited to the wealthiest strata of Chinese society.
No longer. The buying spree has propelled China to the No. 2 spot in the global diamond market, and with a compound annual growth rate of 32% since 2005, it is the fastest-growing market by some distance (see Figure 5.1).
Domestically, diamond jewelry is the fastest-growing segment of the $65 billion Chinese jewelry market, its share rising from 10% ($1.8 billion) in 2005 to almost 15% ($9.2 billion) in 2011 (see Figure 5.2). Although plain gold and jade pieces remain the prevailing consumer jewelry preference, accounting for 60% of the market, diamonds are catching on quickly among the swelling ranks of the country’s well-to-do (defined as households with annual incomes of more than $15,000). In fact, about 90% of affluent households now own at least one piece of diamond jewelry.
1% 3% 13%
2000 2005 2011
China share, %* Including Hong KongSources: “Jewelry Retail Chains 2012” (RBC Research); IDEX; Tacy Ltd. and Chaim Even-Zohar; publication analysis
CAGR(2000–2011) (2005–2011)
Global diamond jewelry market, $ billions
56
61
712%
0%21%6%
16%
26%
-1%
-6%
0%
2%
5%18%16%
22%
32%
-2%
-9%
-3%
OtherRussiaGulf
India
China*
EU
Japan
US
Figure 5.1: China’s jewelry market: No. 2 and growing fast

The Global Diamond Industry | Bain & Company, Inc.
Page 37
Demographic trends suggest that the growth spurt will likely continue for some time. Affluent Chinese make up just about 5% of the country’s 1.34 billion population, while approximately 95% of Chinese make less than $15,000 a year. Only about 20% of lower-income Chinese own diamond jewelry. In the US and Europe, by contrast, around 90% of all households own at least one diamond. As China’s wealth and middle class expand and retailers open new locations in Tier-2 and Tier-3 cities, diamonds should penetrate much more deeply into the market.
Government moves to open the market
A combination of economic, regulatory and cultural factors account for the rapid development of diamond retail in China. Following the government’s late-1970s economic reforms, the diamond polishing and trading industry put down roots in the country. Yet the retail market for diamond jewelry was virtually nonexistent until leading international brands such as Tiffany, Cartier and De Beers entered the market in the 1990s, trumpeting their arrival with large-scale advertising campaigns. China’s rapid economic development and growing enthusiasm for Western culture spurred the subsequent emergence of competing retailers, including independent shops and both regional and national chains. In the late 1990s and into the early 2000s, the market received a major boost when the government lowered tariffs and taxes on diamonds and opened the Shanghai Diamond Exchange, which affords diamond-industry players a secure, transparent venue for trading in rough and polished diamonds.
Retailers have aggressively fueled the demand for diamonds with advertising campaigns that leverage popular enthusiasm for Western culture and Western-style consumption in all its forms, including holidays like Christmas and Valentine’s Day. Diamond producers and retailers invest hundreds of millions of dollars a year in advertising,
2005 2006 2007 2008 2009 2010 2011
$2K $2K $3K $3K $4K $4K $5K 21%GDP per capita
*Including Hong KongNote: GDP in real prices (2011) Sources: Euromonitor; IDEX; Tacy Ltd. and Chaim Even-Zohar; analyst reports; CEIC; EIU; publication analysis
CAGR18%
CAGR31%
CAGR(2005–2011)
22%
21%
32%
Diamond jewelry Other jewelry
Diamond jewelry market in China*, $ billions
2
2022
26
3338
48
65
2 3 3 48 9
Figure 5.2: In a surging jewelry market, diamonds lead the way

The Global Diamond Industry | Bain & Company, Inc.
Page 38
with the top five retailers spending up to about $150 million collectively. Foreign retailers such as Tiffany, Cartier and Bulgari are among the biggest spenders, reflecting their eagerness to establish brand awareness and name recognition with the vast Chinese population.
Sources of Chinese consumer demand
Chinese consumers flock to diamonds
The investment is already paying off. The Chinese population, especially the more prosperous segments, has embraced diamond jewelry. Most upper-income households we surveyed own multiple pieces of diamond jewelry (typically two to five pieces), and ownership of multiple pieces is not uncommon even in households with annual incomes below $15,000. Upper-income households show a marked preference for more expensive jewelry pieces, with pieces in the $1,300–$3,000 price range predominating their collections. Indeed, there is nothing the Chinese would rather buy with their spare cash—diamond jewelry is by far China’s fastest-growing discretionary purchase. The $9 billion diamond jewelry category grew more than 30% per year from 2005 through 2011, outpacing luxury handbags (25% growth), automobiles (22%), packaged holidays (18%), premium cosmetics (17%) and mobile phones (17%).
Chinese consumers simply cannot own enough diamonds. They are the No. 1 icon of luxury and the most desired gift of affluent Chinese women, well ahead of cash, packaged holidays, clothing, electronics or cosmetics (see Figure 5.3). Diamonds are also the most potent symbol that one has “arrived” economically in the new China, and the more visible they are, the better. A fashionably accessorized Chinese woman will arrive at a social event wearing multiple diamonds, typically in the form of rings, pendants and necklaces, as earrings are considered insufficiently conspicuous (see Figure 5.4). As a shopper at a Chow Tai Fook store in Shanghai told us: “Compared with rings or necklaces, a diamond earring is not obvious enough. With the same amount of money I would rather buy a diamond pendant, which makes me look more gorgeous.”
To Chinese women, diamonds mean endless love
As in most other cultures, Chinese women are the predominant consumers of diamond jewelry, and the gems evoke a powerful emotional response from them. Diamonds are strongly associated with eternity and status in the Chinese woman’s mind, which helps explain why engagements and weddings are the most frequent occasions for jewelry purchases, accounting for 35% of diamond purchases. Other “love” occasions—birthdays, anniversaries and Valentine’s Day—are also popular times to buy diamonds. The strong association with eternity offers retailers an opportunity to develop compelling marketing messages for their brands (see Figure 5.5).
Rings and necklaces are the most common entry point to the world of diamond jewelry. A woman’s first piece of diamond jewelry is most often a wedding ring, and “marriage” and “love” are usually what springs to a Chinese woman’s mind when she hears the words “diamond ring” (see Figure 5.6). The gifting of engagement and wedding rings is a relatively new custom in China, but the practice has spread far and wide, and since 1990, a steadily growing number of Chinese brides-to-be have received a diamond ring from their betrothed or his family. Their rings tend to be relatively large and expensive, in part because of China’s historical one-child population policy, which spurs families to give very generous wedding gifts, having only one child to buy for.

The Global Diamond Industry | Bain & Company, Inc.
Page 39
100%
80
60
40
20
0
Note: Prompted questionSource: Online consumer survey (N=507, July–September 2012)
Percent of respondents
Other diamondjewelry
Firstdiamondjewelry
“What diamond jewelry do you own?”
Figure 5.4: Women favor rings and necklaces over other types of jewelry
100%
80
60
40
20
0
Note: Prompted ranking questionSource: Online consumer survey (N=507, July–September 2012)
#4–6preference
#3preference
#2preference
#1preference
Most-preferred jewelry:74% prefer diamond jewelry20% prefer jewelry with other gems6% prefer plain jewelry
“What kind of presents do you prefer?”
Percent of respondents
Jewelry Money/cash Electronics(iPads, smartphones)
Clothes, bags, shoes
Holidays/trips Cosmetics/perfumes
Figure 5.3: Jewelry is also the gift women prefer most

The Global Diamond Industry | Bain & Company, Inc.
Page 40
100%
80
60
40
20
0
“For which occasion(s) did you receive/purchase diamond jewelry?”
Note: Prompted questionSource: Online consumer survey (N=507, July–September 2012)
First diamond jewelry Other diamond jewelry
Other
Spontaneous occasion
Chinese New Year
Valentine’s Day
Wedding anniversary
Birthday
Engagement/marriage
Percent of respondents
Note: Unprompted question; size of font shows frequency of mentioningSource: Online consumer survey (N=507, July–September 2012)
“What comes to mind when you think about ‘diamond rings’?”
Figure 5.6: For Chinese women, weddings are the time for diamonds
Figure 5.5: To Chinese women, diamonds mean eternity and status

The Global Diamond Industry | Bain & Company, Inc.
Page 41
What do Chinese women look for in a diamond? Cut, carat and quality
Chinese women have clearly defined tastes in wedding diamonds. They look for large, well-cut, high-quality stones, usually set in a band of white gold or platinum. Many Chinese weddings now include a costume change. The ceremony begins with the couple in Western-style formal clothing, the bride wearing white veil and dress, liberally festooned with diamonds. Midway through the proceedings, the bride changes into a traditional red dress adorned with gold and jade jewelry.
For all their emotional appeal, diamonds also have strong practical value for Chinese women, judging from their recall of their diamonds’ “four Cs” (carat, cut, clarity and color). While most women cannot specify the cut or clarity of their stones, most can recall their carat size (see Figure 5.7). They also can recall their color, but that is no surprise in a market where only the wealthiest consumers have shown an interest in colored diamonds. Colored diamonds, it seems, are too often confused for lesser gemstones.
For the Chinese consumer, the right number of diamonds is “more”
An engagement ring usually marks the beginning of a diamond-jewelry collection, but few women stop there if they can afford to buy more (see Figure 5.8). Fifty percent of the women in our consumer survey, which skewed to upper-income women, own at least one diamond ring and at least one necklace; 40% own at least one diamond pendant in addition to at least one ring, and necklace-pendant repertoires are also common. Less frequently seen are collections that include earrings, bracelets, watches and loose stones in addition to rings and necklaces. Most women in our survey who own multiple pieces of diamond jewelry are 25 to 44 years old and live in the Tier-1 cities of Beijing, Shanghai, Guangzhou and Shenzen. Some 80% of those women have monthly incomes of 10,000 CNY (roughly $1,500), compared with 50% of other diamond-owning women in our survey.
100%
80
60
40
20
0
Note: Prompted questionSource: Online consumer survey (N=507, July–September 2012)
No
YesYes
YesYes
No
No
No
Carat Color Clarity Cut
“Do you know the characteristics of diamonds you own?”
Percent of respondents
Figure 5.7: Carat and cut stick in women’s minds

The Global Diamond Industry | Bain & Company, Inc.
Page 42
Developments and trends in Chinese retailing
China’s fast-changing retail landscape
Consumers in China’s main population centers usually do not have to look far to find diamonds. There are approximately 58,000 jewelry stores in China, and the vast majority occupy the mass or premium-mass segments of the market. As is typical of retail markets in the early stages of development, the retail scene is highly fragmented. The 30 largest retail chains—a list headed by Lao Feng Xiang, with around 2,000 outlets; Chow Tai Seng, also with around 2,000; China Gold, with 1,600; Yuyuan, with 1,500; and Chow Tai Fook, with 1,500—control only around 30% of the market, equal to a bit more than 17,000 stores. The rest of the mass and premium-mass segment consists of smaller chains and independent shops (see Figure 5.9).
The elite and prestige end of the market, with only around 100 stores currently in operation, belongs largely to foreign retailers including Tiffany, Cartier and Bulgari. A handful of foreign retailers have a relatively well-established presence in China—Cartier, for example, has been there since the early 1990s. Other high-end retailers, however, such as Graff and Harry Winston, planted their flags in China only in the past few years.
The Internet is a very small segment of diamond sales today but is expected to take off in the next three to five years. Companies like Kela and ZBird have been heavily investing in e-commerce efforts.
6–10>10
6–10Percent of respondents
100%
80
60
40
20
0
Note: Prompted question; overall penetration is weighted average of penetration by income level Sources: Online consumer survey (N=1,739, July–September 2012); Euromonitor
<$3.5K $3.5K–$10K $10K–$20K $20K–$60K >$60K
51% 38% 8% 2% 1% 100%% of total population
2–5
2–5
2–5
2–5
2–5
2–5
1
1
1
11
1
None
NoneNone None
None
None
6–106–10
6–10
>10>10
“How many pieces of diamond jewelry do you own?”
>10
Figure 5.8: Diamond jewelry penetration varies widely by income
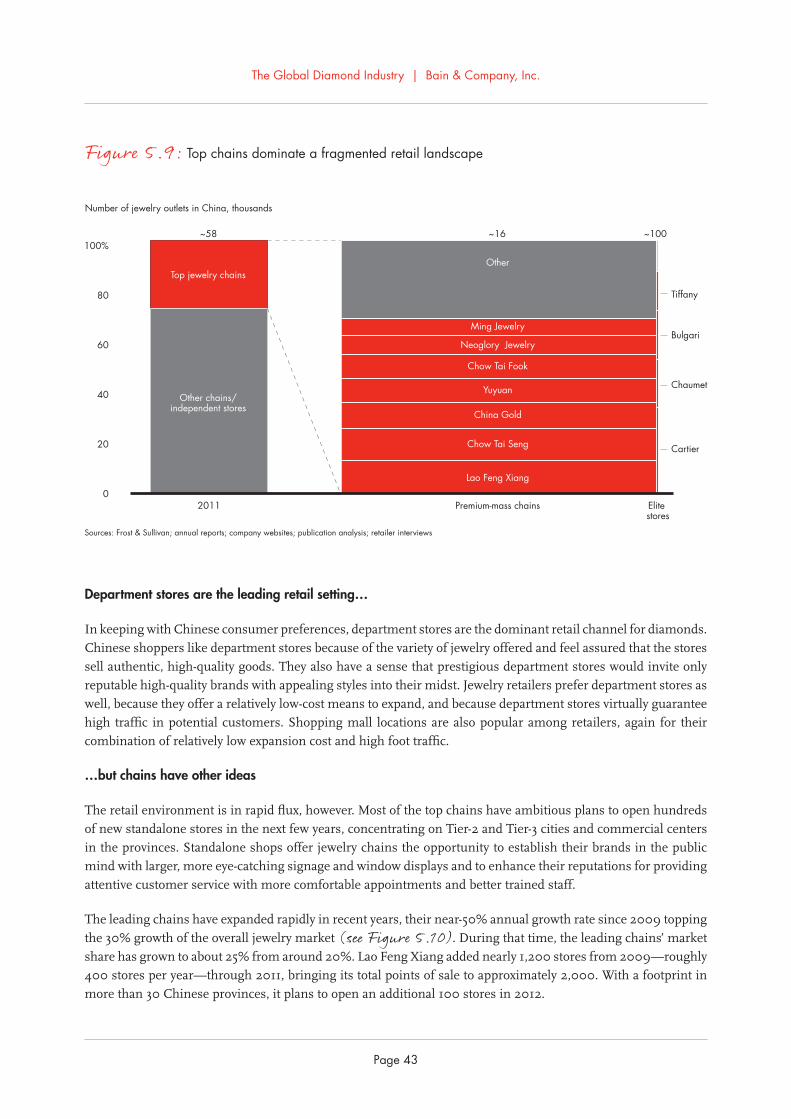
The Global Diamond Industry | Bain & Company, Inc.
Page 43
Department stores are the leading retail setting…
In keeping with Chinese consumer preferences, department stores are the dominant retail channel for diamonds. Chinese shoppers like department stores because of the variety of jewelry offered and feel assured that the stores sell authentic, high-quality goods. They also have a sense that prestigious department stores would invite only reputable high-quality brands with appealing styles into their midst. Jewelry retailers prefer department stores as well, because they offer a relatively low-cost means to expand, and because department stores virtually guarantee high traffic in potential customers. Shopping mall locations are also popular among retailers, again for their combination of relatively low expansion cost and high foot traffic.
…but chains have other ideas
The retail environment is in rapid flux, however. Most of the top chains have ambitious plans to open hundreds of new standalone stores in the next few years, concentrating on Tier-2 and Tier-3 cities and commercial centers in the provinces. Standalone shops offer jewelry chains the opportunity to establish their brands in the public mind with larger, more eye-catching signage and window displays and to enhance their reputations for providing attentive customer service with more comfortable appointments and better trained staff.
The leading chains have expanded rapidly in recent years, their near-50% annual growth rate since 2009 topping the 30% growth of the overall jewelry market (see Figure 5.10). During that time, the leading chains’ market share has grown to about 25% from around 20%. Lao Feng Xiang added nearly 1,200 stores from 2009—roughly 400 stores per year—through 2011, bringing its total points of sale to approximately 2,000. With a footprint in more than 30 Chinese provinces, it plans to open an additional 100 stores in 2012.
100%
80
60
40
20
0
Sources: Frost & Sullivan; annual reports; company websites; publication analysis; retailer interviews
2011 Premium-mass chains Elite stores
Tiffany
Bulgari
Chaumet
Cartier
Other
Ming Jewelry
Neoglory Jewelry
Chow Tai Fook
Yuyuan
China Gold
Chow Tai Seng
Lao Feng Xiang
Top jewelry chains
Other chains/independent stores
Number of jewelry outlets in China, thousands
~58 ~16 ~100
Figure 5.9: Top chains dominate a fragmented retail landscape

The Global Diamond Industry | Bain & Company, Inc.
Page 44
Chow Tai Fook, meanwhile plans to add about 200 points of sale a year through 2016, capitalizing on its sector-leading brand recognition and status as a DTC sightholder (DTC stands for Diamond Trading Company, the rough diamond distribution of De Beers), which gives it privileged access to high-quality raw and loose stones. Between 2009 and 2011 alone, Chow Tai Fook added more than 400 stores, bringing its total points of sale to around 1,450. It has also been actively exploring the Internet’s potential as a sales channel.
Chow Tai Seng is also pursuing Internet as well as store sales. From 2009 through 2011 it doubled its total points of sale, to 2,000, providing a ready outlet for production from its company-owned mines and jewelry factories.
Retailers at the upper end of the market have equally ambitious plans, though the absolute number of store openings is much lower. Cartier has been the most aggressive, adding 13 stores from 2009 through 2011 to bring its total in China to 35. It now has a retail presence in 17 Chinese provinces. Chaumet is not far behind. With 20 stores in 2011, up from two in 2009, its stores can be found in 15 provinces, and it plans to add 10 more stores in 2012. Tiffany, whose 16 stores in 2011 were up from nine in 2009, plans to add 30 more stores by 2015.
Retailers are looking outside the biggest cities for growth
Most retailers are focusing on Tier-2 and Tier-3 cities for future expansion. Tier-2 cities consist of Chongqing, Tianjin and the other 26 provincial capitals. Tier-3 is made up of the remaining prefectural cities. The residents of these cities are growing increasingly wealthy, with the ranks of the affluent increasing 26% per year, compared with 16% per year in Tier-1 cities. Their consumption patterns, moreover, are following the trend established earlier in the Tier-1 cities. The leading retailers have concentrated 80% of their recent expansion in Tier-2 and Tier-3 locations, although foreign players have largely remained within Tier-2 cities. Leading local chains, by
Beijing Caishikou
TSLCartier
Sources: Company websites; retailer interviews; publication analysis
~5
2009 2012F 2015F
~12
~10
Chow Sang SangEastern Gold Jade
Ming Jewelry
Chow Tai Fook
Yuyuan
Lao Feng Xiang
Chow Tai Seng
15
10
5
0
Number of outlets by top 10 jewelry chains in China, thousands
Figure 5.10: The top chains are expanding their retail networks aggressively

The Global Diamond Industry | Bain & Company, Inc.
Page 45
contrast, are already well established in many Tier-3 cities. The retailers are simply following the numbers. Although Tier-1 cities today account for one-third of diamond jewelry sales, they hold only 5% of China’s population. The opportunities for new business clearly lie in the Tier-2 and Tier-3 cities (see Figure 5.11). They or their environs are home to several hundred million people, and retailers are counting on their growing appetite for the good life to power growth.
What customers look for in a diamond retailer
Survey data suggest that shoppers in those cities will seek out retailers with reputations for trustworthiness and quality. Homegrown chains such as Chow Tai Fook and Chow Sang Sang, and to a lesser extent Lao Feng Xiang and Chow Tai Seng, have already established such reputations, as have foreign players such as Tiffany and Cartier. Stores that offer quality certificates from one or more of the leading certifying bodies have a leg up, as consumers cite quality certificates as their leading criterion when deciding where to buy diamonds. They also look for a wide selection of styles and brands, and place a high value on service, but indicate lesser priority for discounts, number of outlets or location.
When it comes to merchandise mix and display, retailers take varying approaches. As a general rule, international retailers and diamond-focused Chinese players such as I Do, Kimberlite and Tesiro devote the majority—and some cases the entirety—of their shelf space to diamonds. Based on our store checks in Shanghai, China-based chains give more space to plain jewelry, including chains, earrings and wedding bands, as well as jade and gemstones. Stores tend to reserve a large counter for diamonds in a prominent portion of the selling space, although Chow Sang Sang, for one, has multiple diamond counters for different brands or styles, as well as a separate counter for promotional items.
100%
80
60
40
20
0
Note: Tier-1 cities are Beijing, Shanghai, Shenzhen, Guangzhou; Tier-2 cities are Chongqing, Tianjin and all remaining provincial capitals and other major cities; Tier-3 cities are remaining prefectural citiesSources: company websites; retailer interviews; annual reports; publication analysis
Tier-1
Tier-2
Tier-3
6 7 13 221 293 414
Bulgari Tiffany Cartier Ming Jewelry 3D-Gold Chow Tai Fook
Number of outlets in China opened since 2009
Figure 5.11: The next battleground: Tier-2 and Tier-3 cities

The Global Diamond Industry | Bain & Company, Inc.
Page 46
Key takeaways
• China has grown rapidly into the world’s second-largest market for diamonds, with annual sales approaching $9 billion.
• Rising wealth, popular fascination with Western culture and the fast-expanding middle class have powered the market’s growth, with a boost from lower taxes and tariffs.
• Approximately 90% of affluent households (those with annual incomes of $15,000 or more) own at least one piece of diamond jewelry, and most own multiple diamonds.
• Market penetration among lower-income Chinese, who make up half the country’s 1.34 billion population, is much lower, representing a large growth opportunity for diamond retailers. Some 20% of households making less than $15,000 per year own at least one diamond.
• Diamonds have strong emotional and spiritual resonance for Chinese women, who associate them with eternity and high status. The custom of giving diamond engagement rings is catching on quickly in China.
• Chinese women like highly visible diamond jewelry, preferring rings, necklaces and pendants to earrings. Stones of one carat or more are popular, and even mass- and premium mass-market stores in large cities often have several large stones on display.
• Retail expansion plays a key role in promoting diamond availability in all regions, established and emerging, in China.
• The retail scene is highly fragmented, with independent and local chain stores dominating the mass- and premium-mass segments, which account for 95% of annual sales.
• Foreign prestige retailers such as Tiffany, Cartier and Bulgari dominate the high end of the market. Most foreign players spend 5% or more of annual China sales on advertising to build brand awareness and identity.
• Diamond retailers are expanding at breathtaking speed. Retailers are focusing on Tier-2 and Tier-3 cities where personal incomes are growing quickly and consumption patterns mirror those of larger cities, where diamonds are wildly popular.

The Global Diamond Industry | Bain & Company, Inc.
Page 47
6. The diamond market in India
Fundamentals of the Indian diamond market
India’s long and storied diamond history
No place on earth has a longer or closer association with diamonds than India. The country is said to be the home of the first diamond mines, and the first written mention of commerce in diamonds appeared in Sanskrit some 3,000 years ago. India’s Golconda mines produced some of the world’s most famous (or notorious) diamonds, including the legendary Koh-i-noor crystal and the Hope Diamond, which remain objects of popular fascination for their size, brilliance and colorful ownership histories. As recently as the 19th century, India was the principal source of diamonds, prior to the discovery of diamonds in Brazil and South Africa. Today, all but one Indian mine has been depleted, but the country remains the center of the cutting and polishing crafts. Approximately 90% of the world’s rough diamonds, representing more than 50% of their total value, are polished in India.
Much more recent is India’s emergence as the world’s third-largest market for diamond jewelry (see Figure 6.1). The country’s annual sales of $8.5 billion, or about 12% of global demand, surpass Japan, the European Union and the Gulf region.
Buoyed by surging demand for all kinds of jewelry—up 19% per year since 2005—diamonds’ share of the Indian jewelry market has grown from 24% in 2005 to 27% in 2011 (see Figure 6.2). In fact, diamonds are India’s second fastest-growing discretionary purchase, trailing mobile phones but well ahead of packaged holidays, clothing and motor vehicles.
3% 4% 12%
2000 2005 2011
India, % of total
*Including Hong KongSources: "Jewelry Retail Chains 2012" (RBC Research); IDEX; Tacy Ltd. and Chaim Even-Zohar; publication analysis
Global diamond jewelry market, $ billions
56
61
71
OtherRussiaGulf
India
China*
EU
Japan
US
CAGR(2000–2011) (2005–2011)
2%
0%21%6%
16%
26%
-1%
-6%
0%
2%
5%18%16%
22%
32%
-2%
-9%
-3%
Figure 6.1: India’s jewelry market: No. 3 and growing fast

The Global Diamond Industry | Bain & Company, Inc.
Page 48
The diamond market has benefited from several new drivers of demand in the past decade. Amid growing personal incomes and rapid urbanization, many Indians have adopted Western traditions such as solitaire engagement rings and Valentine’s Day celebrations. Jewelry retailers have aggressively pushed new product categories such as “everyday diamonds,” which are popular among young working women. Many also offer financing schemes, such as installment-payment plans, to facilitate purchases for the emergent middle class. What’s more, survey data indicates that a growing proportion of Indian consumers view diamonds as an investment, or at least a hard asset of durable value. Certificates of quality, which count heavily in purchasing decisions, and merchants’ buy-back offers have encouraged this mindset.
A fast-developing market, nurtured by the trade
The industry itself has accelerated the rapid development of India’s diamond market. Leading producers, retailers and industry associations have sponsored lavish advertising campaigns, many featuring top Bollywood stars and beauty queens, to stoke public fascination with the gems. As demand and industry revenues increase, top-tier retailers are stepping up their ad spending. Although industry-wide advertising figures are unreliable, the four largest retailers—Tanishq, TBZ, Gitanjali and PCJ—collectively spend about $100 million on advertising and promotion every year.
Some of the most memorable recent advertising campaigns include the $3 million series of commercials touting the Forevermark diamond brand from DTC (Diamond Trading Company, the rough diamond distribution arm of De Beers) in 2007, and Tanishq’s 2012 ad blitz, which ran from January through April at a cost of $3 million to $4 million. Timed for the run-up to the wedding season and the Hindu and Jain festival Akshaya Tritiya, the
Note: GDP in real prices (2011) Sources: IDEX; Tacy Ltd. and Chaim Even-Zohar; Euromonitor
Diamond jewelry market in India, $ billions
$0.7K $0.8K $0.9K $1.0K $1.2K $1.4K $1.6K 14%GDP per capita
2005 2006 2007 2008 2009 2010 2011
CAGR18%
CAGR21%
Diamond jewelry Other jewelry
3
1112
16
1921
26
31
2 3 3
67
9
CAGR(2005–2011)
19%
18%
22%
Figure 6.2: Diamonds set the pace for India’s fast-growing jewelry market

The Global Diamond Industry | Bain & Company, Inc.
Page 49
campaign’s television ads, with their high production values, atmospheric music and glamorous stars, further cemented Tanishq’s standing as India’s top-of-mind diamond retailer.
Sources of Indian consumer demand
A national love affair with diamonds
Indian women, like women in many countries, love jewelry and single it out in surveys as their preferred gift, well ahead of cash, handbags and electronics (see Figure 6.3). Jewelry is also the leading symbol of luxury, beating out cars, watches, fashion accessories and other Western-style markers of affluence. Some 90% of affluent Indian women own diamond jewelry, as do about 50% of Internet-savvy women in lower economic strata (see Figure 6.4). Not all this jewelry is purchased—many women own diamonds passed down from their mothers, grandmothers or other family members.
Most diamond jewelry—roughly 60%—is purchased for “love occasions” such as weddings or engagements, birthdays and anniversaries. Those are the celebrations where 70% of women receive their first piece of diamond jewelry. Engagements and weddings account for about 20% to 25% of purchase occasions among the women surveyed for this report, but the percentage—and the purchase value—is likely much higher among the general population. By tradition, both the bride’s and the groom’s families give gifts of jewelry to the newlyweds, signifying each family’s affluence as well as the enduring nature of the couple’s union. Diamonds are also popular gifts to celebrate religious festivals, the birth of a child and Valentine’s Day (one of many Western cultural imports that have caught on quickly in India).
The typical Indian woman’s first piece of diamond jewelry is a ring or a pair of earrings. Over time, she will add pendants, necklaces and bracelets to her repertoire, usually purchasing or receiving them for her engagement,
100%
80
60
40
20
0
Note: Prompted ranking questionSource: Online consumer survey (N=544, July-September 2012)
#4–6
#3
#2
#1preference
Most-preferred jewelry:79% prefer diamond jewelry12% prefer jewelry with other gems6% prefer plain jewelry3% prefer costume jewelry
“What kind of presents do you prefer?”
Percent of respondents
Jewelry Money/cash Electronics(iPads, smartphones)
Clothes, bags, shoes
Holidays/trips Cosmetics/perfumes
Figure 6.3: Jewelry: The gift Indian women want most

The Global Diamond Industry | Bain & Company, Inc.
Page 50
wedding or to mark a wedding anniversary or the birth of a child. Although engagement rings are not a recent addition to Indian culture, the popularity of diamond engagement rings has spread widely in the past 20 to 30 years. Today many Indian brides-to-be announce their status with a diamond on the left hand. Design preferences have shifted over the years, and diamond solitaires have largely supplanted the heavy gold bands studded with multiple small stones that prevailed in the past (see Figure 6.5).
Indian consumer tastes are well developed
India’s jewelry shoppers are very particular about the qualities they look for in a diamond. They value a stone’s clarity above all, ahead of size, cut and color. Tanishq played to this preference in a recent series of advertisements that emphasized the clarity of its stones. Women also look for certain design characteristics, though their preferences shift depending on the type of jewelry they are buying (see Figure 6.6). Trendy designs are the popular choice for more lighthearted occasions such as birthdays and Valentine’s Day, while evergreen designs—classic looks that are neither too trendy nor too traditional—are favored for everyday wear. Weddings are a different matter. By a wide margin, women opt for traditional designs for their wedding jewelry.
Indian women prize diamonds for their beauty, and about half of those surveyed can specify at least some of the “four Cs” for their stones: carat (size), clarity, cut and color. The typical Indian woman also has a pronounced pragmatic streak, however, and for her, much of a diamond’s appeal lies in its monetary value—“expensive” is the first word that most often comes to mind when diamonds are mentioned. Words like “forever” and “eternity,” on the other hand, are not top-of-mind for Indian women, though they are in many other diamond-consuming countries (see Figure 6.7).
100%
80
60
40
20
0
Note: Prompted question; overall penetration is weighted average of penetration by income level based on India income distribution�Sources: Online consumer survey (N=1,077, July–September 2012); Euromonitor
% of total population
<2 Lac INR(4K USD)
2–5 Lac INR(4–9K USD)
5–10 Lac INR(9–18K USD)
10–30 Lac INR(18–54K USD)
>30 Lac INR(>54K USD)
Weightedaverage
90% 8% 1% 1% 0.2% 100%
2–5
2–5
2–5
2–5
2–5
2–5
1
1
11 1
1
None
NoneNone
None
>106–10
6–10
6–10
6–10
6–10
>10>10
>10
>10
“How many pieces of diamond jewelry do you own?”
Percent of respondents
Figure 6.4: Diamonds are popular among all income groups

The Global Diamond Industry | Bain & Company, Inc.
Page 51
100%
80
60
40
20
0
*Evergreen jewelry is a jewelry of a classic styleSource: Online consumer survey (N=544, July–September 2012)
Does not matter
Birthday Valentine’s Day Anniversary Festive Wedding/Engagement
Traditional
Evergreen*
Trendy
“What designs of diamond jewelry do you prefer for various occasions?”
Percent of respondents
Figure 6.6: Women favor trendy designs, except for weddings
100%
80
60
40
20
0
Note: Prompted question; only engaged/married respondentsSource: Online consumer survey (N=544, July–September 2012)
Engagement before1990
Engagement between
1990–2000
Engagement between
2000–2005
Engagement after 2005
Yes
No
Consumer preference shifting from ‘gold heavy ring studded with multiple small diamonds’ to ‘solitaire ring with one big diamond’
“Have you ever received a diamond engagement ring?”
Percent of respondents
Figure 6.5: The engagement ring practice has slightly increased, style preferences are shifting

The Global Diamond Industry | Bain & Company, Inc.
Page 52
Would Indian consumers invest in diamonds?
Survey results indicate that nearly half of Indian women consider diamonds specifically as an investment, a much higher percentage than found in large diamond markets such as the US, European Union and Russia. This view appears to be an artifact of the long-held Indian view of diamonds as a form of insurance against financial reversals. The willingness of many consumers to regard diamonds as an investment may present a marketing opportunity to some diamond-industry players.
Developments and trends in Indian retail
The changing face of diamond retailing
The jewelry retail environment is large and diverse, with more than 300,000 stores, ranging from tiny storefronts in Mumbai’s Zaveri Bazar to lavish specialty stores in stylish shopping malls (see Figure 6.8). Indeed, India is home to several times more stores than are found in the US and Europe combined. The retail landscape is highly fragmented, and about 95% of purchases are from independent local boutiques. Family-owned shops remain a key part of the ecosystem, as Indian consumers are highly loyal to their local jewelers, which their families in many cases have patronized for generations.
Still, organized chains are making inroads with consumers. Some 3,000 to 3,500 chain outlets are currently operating nationwide, and about 25 chains have 20 or more locations. At present, chains account for only 1% of diamond sales by number of outlets and 5% by sales value, but they are outgrowing the overall market. They are
Note: Unprompted question; size of font shows frequency of mentioningSource: Online consumer survey (N=544, July–September 2012)
“Forever”, “eternity”, etc., are not top-of-mind for Indian women
“What comes to mind when you think about ‘diamonds’?”
Figure 6.7: For Indian women, diamonds bridge the practical and the emotional

The Global Diamond Industry | Bain & Company, Inc.
Page 53
already more popular than family jewelers among the Internet-savvy population surveyed for this report. Most chains—some 90%—are positioned in the mass-market space, while about 10% occupy the prestige or premium category. With 55% of chain outlets under their control, Gitanjali, Cygnus and Diti dominate the mass chain-store sector; Tanishq and Orra loom largest at the premium end, with about 60% of total chain outlets in the segment.
The hierarchy of India’s organized retailers
From their respective positions atop the mass and high-end segments, Gitanjali and Tanishq are leading the transformation of the retail landscape (see Figure 6.9). Gitanjali’s market coverage, with about 1,100 outlets, is second to none, while Tanishq tops all comers in brand recognition and sales. Tanishq is also by far the best-known retail brand, and its name pops up almost as frequently as “expensive” and “beautiful” when women are asked what first comes to mind when they hear the word “diamond.” The halo of its owner, the Tata Group, India’s most trusted business group for decades, has helped cement Tanishq’s firm position as the nation’s most trusted jewelry retailer.
Gitanjali and Tanishq are hardly alone, however. Many other chains have ambitious growth plans, driving the modernization of the retailing landscape across the country. Most chains are spreading across multiple regions of the country, with particular focus on Tier-2 and Tier-3 cities such as Coimbatore, Nagpur and Vadodara. With relatively sparse store coverage in such regions, chain retailers will have ample room for growth for years to come.
Stores that offer shoppers quality certificates for their diamonds enjoy a distinct advantage—consumers told us that the availability of certificates is their primary consideration when choosing a retailer (see Figure 6.10). Their awareness of the various certifying agencies—the IGI, GIA and AGS—is relatively high.
Note: Organized chain includes all stores with >INR500M turnover or >10 storesSources: CARE report; analyst reports; publication analysis
2011 Premium-mass chains
Organized stores (~1%)
Elite stores
Rosyblue(Orra)
PCJ
Titan (Tanishq)
Other
Shrenuj (Diti)*
Laxmi Diamond (Cygnus)
Gitanjali
Unorganized/Independent
stores(~99%)
Number of jewelry outlets in India, thousands
~300 ~2.9 ~0.3
Figure 6.8: Independents dominate the retail scene, but chains are coming on strong

The Global Diamond Industry | Bain & Company, Inc.
Page 54
Note: Unprompted question; size of font shows frequency of mentioningSource: Online consumer survey (N=544, July–September 2012)
“What brands come to mind when you think about diamond jewelry?”
Figure 6.9: Local names earn Indian consumers’ trust
100%
80
60
40
20
0
Note: Prompted ranking questionSource: Online consumer survey (N=544, July–September 2012)
Service qualitySelection of brands/styles
Familyjeweler
Qualitycertificates
Discounts LocationMany outlets
#1criteria
#2
#3
#4–6
“How important are the following criteria when deciding from which store to buy?”
Percent of respondents
Figure 6.10: When choosing a store, consumers look for certificates and selection

The Global Diamond Industry | Bain & Company, Inc.
Page 55
Key takeaways
• Home to the world’s first diamond mines and the center of the cutting and polishing industry, India is the third-largest global diamond market, with annual revenues approaching $8.5 billion, and growing rapidly.
• Diamonds are the country’s second fastest-growing discretionary purchase, trailing only mobile phones. Many Indians have adopted Western holidays such as Christmas and Valentine’s Day, and diamonds are the most desired gift on such occasions. Diamond engagement rings are also a well-established custom.
• About 90% of India’s affluent women own diamonds, with most receiving their first diamond to celebrate a wedding, engagement, birthday or anniversary.
• Rings and earrings are the most widely owned jewelry types. Many women, even in lower-income strata, also have necklaces, pendants and bracelets in their repertoires.
• Women have well-developed tastes in diamonds, valuing a stone’s clarity ahead of its cut, size and color. They favor different designs for different occasions, opting for evergreen looks for everyday wear and trendy styles for lighthearted occasions such as birthdays and Valentine’s Day.
• Traditional solitaires, usually set in a yellow gold band, are by far the preferred design for weddings and engagements.
• There are an astonishing 300,000 jewelry stores in India, seven times more than in the US and six times more than in China. Independents dominate the retail space, but large national chains are making inroads.
• Gitanjali, Cygnus and Diti are the biggest chain-store players and are claiming a growing share of the mass- and premium-mass segments. The prestige market is dominated by Tanishq, whose compelling advertising has made its brand synonymous with diamonds in India.
• Retailing is in the midst of an expansion drive, focused on Tier-2 and Tier-3 cities such as Nagpur and Vadodara, where incomes are rising and consumers are clamoring for luxury goods.

The Global Diamond Industry | Bain & Company, Inc.
Page 56
7. Supply-demand balance through 2020: An attractive outlook for rough diamond producers
Over the next decade, a range of possible scenarios—based on macroeconomic trends and an increasing appetite for diamond jewelry in key markets—indicates that demand for rough diamonds will outpace supply. This imbalance translates into a positive outlook for diamond producers and support for a potential long-term price increase.
Global rough diamond demand model: Methodology
The main engine for rough diamond demand is consumer demand for polished diamond jewelry. To forecast consumer demand, therefore, we undertook a thorough review of key consumer markets to understand the primary motivators of consumer demand, as well as the secondary factors that could influence the rate of demand growth (see Figures 7.1 and 7.2). Rising national wealth is one such primary motivator, because diamond demand almost invariably increases in tandem with GDP growth. Shifting consumer tastes, such as the adoption in emerging markets of the Western practice of gifting diamond engagement rings, are a secondary factor, influencing demand at the margins as consumers opt for diamond jewelry over other luxury purchases.
Thus, an accurate forecast of demand requires a detailed look not simply at the macroeconomic picture but also at the finer points of consumer psychology and behavior. To grasp these finer points, we trace changes over time
1
2
3
4
5
Historical trend review
Identification of key demand drivers
Demand drivers forecasts
Forecast of polished diamond demand
by geography
Conversion into rough diamond demand in
volume and value terms
• Analyze historical correlation between polished diamond consumption and multiple macroeconomical factors (disposable income, middle-class indicators, urban population) as well as cultural/tradition shifts and changes in penetration of diamonds in the overall jewelry spend
• Conduct consumer research at major diamond markets aiming at consumers’ preferences study in order to support/explain market statistical data
• Identify the best indicators (drivers) to explain evolution of polished diamond demand in each of key regions
• Identify forecast values of key demand drivers up to 2020 for three scenarios: base, high and low
• Evaluate consumption in other regions
• Forecast polished diamond demand in volume terms in key regions based on historical correlations with identified drivers
• Demand for rough diamonds is derived using historical ratio of polished diamonds to total rough diamond production (~20%)
• Convert forecast of polished diamond demand into 1) demand for rough diamonds in volume and 2) demand for rough diamonds in value
• Gather and analyze data of historical consumption of polished diamonds in volume and value by region in 2000–2011
Source: Bain analysis
Figure 7.1: Demand-forecast methodology is based on historical consumption analysis and customer behavior and preferences

The Global Diamond Industry | Bain & Company, Inc.
Page 57
in spending patterns on diamond jewelry, ownership of diamonds by populations at different income levels, the dynamics of disposable income, urban population shifts, growth in the size of the middle class and luxury-goods preferences among consumers.
All these factors combine to shape the trajectory of current and future consumer demand. In addition to taking into account the macroeconomic effects of the 2008–2009 financial crisis and the speed of the recovery in 2010–2011, we considered how consumption patterns have changed over time and how shifting tastes and levels of diamond ownership would likely influence demand in the future. We then ran a variety of scenarios to gauge the likely effects of different macroeconomic growth rates on consumer behavior and, ultimately, demand. Figure 7.1 presents our demand-forecast methodology in graphic form.
In developed regions such as the US, Europe and Japan, a key driver of diamond consumption is total disposable income. To forecast diamond demand in these countries, we looked at projections of disposable income for each region from the Economist Intelligence Unit. Other factors, such as engagement ring penetration, patterns of diamond ownership and historical trends in the overall share of diamonds in jewelry, give a good idea of the likely trajectory of future demand.
By following our methodology, it becomes clear that global diamond demand, like the global economy itself, is growing at two different speeds. In developed countries, there is relatively little headroom for faster growth, because diamond ownership is already widespread and the custom of giving diamond engagement rings is well entrenched (see Figure 7.3). As a result, the rate of macroeconomic growth will be the primary factor determining incremental diamond purchases in developed markets, influenced at the margins by advertising and promotion (see Figure 7.4).
Macroeconomics
Social factors
Country-specific preferences
Trade
DRIVERS EFFECT ON DIAMOND DEMAND
• Diamond jewelry penetration (of total amount of jewelry)• Diamond engagement rings penetration• Women’s preferences
• Growth of middle class will expand the number of potential buyers of diamond jewelry: – Diamond jewelry is much more prevalent in affluent segments – Affluent segments tend to buy more expensive diamond jewelry
• Adoption of Western traditions, e. g., diamond engagement rings and diamonds as gifts for Valentine’s Day, anniversaries, etc. will create additional purchase occasions
• Increase in supply footprint stimulates demand by offering availability of choice and additional marketing – Highest growth achieved in online discounter segments – Leading jewelry chains in India and China are expanding nationwide
• Supply footprint
• Economic momentum will drive wealth• Wealth drives demand for diamond jewelry
• Gross domestic product (GDP)• Personal disposable income (PDI)
• Size of middle class• Population growth
1
2
3
4
Source: Bain analysis
Figure 7.2: Key drivers include both economic and social factors

The Global Diamond Industry | Bain & Company, Inc.
Page 58
In China and India, on the other hand, demographics are changing much more rapidly, with proportionately greater effect on demand (see Figure 7.5). In Tier-1 cities such as Shanghai and Delhi, where the economy is well developed and many consumers have adopted Western consumption practices, the potential demand growth rate is relatively lower than in Tier-2 and Tier-3 cities. It is in these smaller cities that the middle class is growing most rapidly (overall, a combined 196 million Chinese and Indian households are expected to join the middle class by 2020, expanding its ranks to half the population of both countries). As consumers in these cities and surrounding areas acquire more wealth and adopt Western consumption styles, they will power diamond demand growth in both countries.
Historical differences in the affinity for diamonds will also influence the way markets will develop in India and China. Indians have had a passionate, centuries-old love affair with diamonds, a preference visible in the comparative rates of diamond ownership per household. Although India’s middle-class population is smaller than China’s, it has a greater appetite for diamonds at all income levels (see Figure 7.6). In fact, the average middle-class Indian household spends twice as much on diamonds as the average Chinese middle-class household, despite the Chinese household’s higher level of disposable income. In 2011, for example, the average Indian household with more than $10,000 in disposable income spent about twice as much on diamond jewelry than its Chinese middle-class counterpart with more than $15,000 in disposable income. As a result, although the absolute number of middle-class households in India is expected to be lower than in China, the Indians’ higher per-capita diamond spending will offset the population disparity, driving India’s overall spending on diamonds to rough equivalence with China’s by 2020. Figure 7.6 details recent spending patterns in both countries as well as the US.
100%
80
60
40
20
0Total % of
households with at least
1 diamond
Diamond engage-ment ring practice
penetration
Middle-classhouseholds
share
Total % of diamond jewelry in jewelry market
83%84%
81%
49%
Note: US middle-class household annual disposable income is more than $25,000Sources: IDEX; Tracy Ltd. and Chaim Even-Zohar; EIU; Euromonitor
Key diamond market indicators
Figure 7.3: US is a highly developed market with limited growth potential

The Global Diamond Industry | Bain & Company, Inc.
Page 59
35
30
25
20
15
10
5
0
4.8%
6.5%
1.8%
1.8%
2.1%
2011 2012F 2013F 2014F 2015F 2016F 2017F 2018F 2019F 2020F
US Europe Japan China IndiaSource: EIU
Total personal disposable income by region, $ trillions (real 2005)
25 25 26 26 27 28 2929 30
31
CAGR(2011–2020)
2.5%
Source: EIU
Total personal disposable income by region, $ trillions (real 2005)
Region 2011 2012F 2013F 2014F 2015F 2016F 2017F 2018F 2019F 2020F CAGR (2011–2020)
US 10.2 10.4 10.6 10.8 11.1 11.3 11.5 11.8 12.0 12.3 2.1%
Europe 8.9 9.1 9.2 9.4 9.6 9.7 9.9 10.1 10.3 10.5 1.8%
Japan 2.8 2.8 2.9 2.9 3.0 3.0 3.1 3.1 3.2 3.2 1.8%
China 2.0 2.1 2.2 2.4 2.5 2.7 2.9 3.1 3.3 3.5 6.5%
India 1.0 1.0 1.1 1.2 1.2 1.3 1.3 1.4 1.5 1.5 4.8%
Figure 7.4: Total personal disposable income forecast through 2020

The Global Diamond Industry | Bain & Company, Inc.
Page 60
2005
0.6
0.8
31.4
India
China
US
0.7
1.0
32.8
0.8
1.1
32.2
0.8
1.4
32.7
2007 2009 2011
*Annual disposable income of middle-class households in US—more than $25,000, in China—more than $15,000, in India—more than $10,000Source: Euromonitor
Spending on diamond jewelry per one middle-class household, $
~$140
~$100
~$30
~$130
~$90
~$40
~$80
~$60
~$20
~$90
~$70
~$40
IndiaUS China
Personal disposable income per capita, $K
Figure 7.6: Spending on diamond jewelry per household in India is approximately twice that of China and only 30% below the US, even though average disposable income is one-fortieth as that of the US
250
200
150
100
50
0
Forecast
2000
6%
2%
10%
6%
18%
21%
26%
32%
39%
47%
% total, India
% total, China
2005 2011 2015F 2020F
CAGR(2011–2020)
11%
11%
Note: Middle class in India—households with annual disposable income of more than US$10,000; middle class in China (incl. Hong Kong)—households with annual disposable income of more than US$15,000Source: Euromonitor
Middle class in China and India, millions of households
9 1125 20
91
40
148
64
226
101
India China
Figure 7.5: Middle class is expanding rapidly in both China and India, with a corresponding increase in demand for diamonds

The Global Diamond Industry | Bain & Company, Inc.
Page 61
In addition, in both India and China, advertising and promotion have the potential to increase diamonds’ share of overall jewelry spending (see Figure 7.7). Today, diamonds claim a smaller share of jewelry purchases in both countries than do diamonds in more developed markets. If the industry succeeds in cultivating a stronger preference for diamonds over other forms of jewelry in key emerging markets, there is room for diamonds to claim a larger share of total jewelry sales, with a positive impact on demand.
Another path to greater growth is to accelerate adoption of Western cultural diamond traditions, such as gifts for engagement and weddings, Valentine’s Day presents and anniversary diamond rings (see Figures 7.8 and 7.9). Although the transition to Western-style consumption patterns is already well under way in the developing world, levels of both diamond ownership and engagement ring purchases are far lower in China, India and Russia than in the US. By boosting the percentage of households owning diamonds and encouraging greater adoption on the engagement ring practice, the industry could significantly improve diamond demand.
The final key component of diamond consumption is the spread of organized diamond retailing into Tier-2 and Tier-3 cities. For example, in China the number of middle-class households has been growing at a 26% rate, compared with 16% in Tier-1 cities (see Figure 7.10). Retailers are pushing aggressively into these regions, adding stores and online channels and increasing consumers’ purchase options. Sales growth in these regions, and the need for retailers to add to their inventories to support their expansion drive, will significantly affect demand in coming years.
*Based on 2009 dataNote: Diamond jewelry including settingSources: Euromonitor; IDEX; Tracy Ltd. and Chaim Even-Zohar; “Jewelry Retail Chains 2012” (RBC Research); publication analysis
Diamond jewelry Other jewelry
Jewelry market by type of jewelry, 2011
World average
US
51%
51%
64%
36%
73%
27%
86%
14% 18%
82%
49%
49%
Japan Russia India China EU*
Figure 7.7: In the jewelry markets of both China and India, diamonds have room to grow

The Global Diamond Industry | Bain & Company, Inc.
Page 62
US
Note: Prompted question; penetration is weighted average by income levels based on income distributions in each countrySource: Online consumer survey in India (N=544), China (N=507), Russia (N=534), US (N=542); July–September 2012
Penetration rate of diamond engagement rings (estimated) 60% 60% 50% 85%
Yes
No
“Have you ever received a diamond engagement ring?”
India China Russia Percent of respondents
100%
80
60
40
20
0
Figure 7.9: Adoption of Western culture traditions will contribute to further growth in popularity of diamond enagagement rings
Note: Prompted question; penetration is weighted average by income levels based on income distribution in each countrySource: Online consumer survey in India (N=544), China (N=507), Russia (N=534), US (N=542), UK (N=640), Germany (N=531), Italy (N=572), France (N=550); July–September 2012
100%
80
60
40
20
0Penetration rate of diamond jewelry (estimated) 40% 60% 40% 80%
India China Russia US6–10 >10
>10
6–10
6–10
2–5
2–52–52–5
1
111
None
6–10
NoneNone
None
“How many pieces of diamond jewelry do you own?”
Percent of respondents
Figure 7.8: There is significant potential to bring diamond penetration in emerging markets to the levels of developed countries

The Global Diamond Industry | Bain & Company, Inc.
Page 63
Global rough diamond demand model: Base case scenario
During the next decade, we project that global demand for diamonds will grow in line with the historical trends. We base our forecast on macroeconomic factors, particularly the speedy recovery from the economic crisis, the expanding middle class in China and India and the increase in total private consumption levels. Influencing those large-scale quantitative trends are more qualitative considerations, notably the continued cultural shifts in developing countries toward Western traditions.
In the base case as shown in Figure 7.11, incorporating forecasts for all key regions, we expect global rough diamond demand to grow at an average annual rate of 5.9%, to more than $26 billion by 2020 (in 2011 prices).
Emerging markets will account for the majority of that growth: Nearly 50% of new diamond consumption is expected to come from India and China (see Figure 7.12). We expect their share of global diamond demand to expand to 36% by 2020, up from 25% today. At the same time, the combined share of diamond spending in the US, Europe and Japan will drop to 40% from more than 50% today.
Global rough diamond demand model: Two additional scenarios
Two additional scenarios consider the effect on demand of higher- and lower-than-expected GDP growth (see Figure 7.13). Our lower-growth scenario assumes that growth will slow dramatically, leading to worldwide recession. Should this scenario come to pass, demand growth in developed countries would stagnate or turn negative. Demand in China and India would continue to grow, but at a slower pace than that envisioned in our baseline forecast.
Note: Tier-1 cities are Beijing, Shanghai, Shenzhen, Guangzhou; Tier-2 cities are Chongqing, Tianjin and all remaining provincial capitals and other major cities; Tier-3 cities are remaining prefectural citiesSource: Publication analysis
China population and jewelry consumption Leading chains are planning major expansion
Tier 3
Tier 2
Tier 1
~5K
Number of stores�2009
Population2011
Jewelry market2011
Number of stores�2015F
~12K Beijing CaishikouTSL
Cartier
Chow Sang SangEastern Gold Jade
Ming Jewelry
Chow Tai Fook
Yuyuan
Lao Feng Xiang
Chow Tai Seng
Figure 7.10: Jewelry retail chains in China are expanding into less developed regions

The Global Diamond Industry | Bain & Company, Inc.
Page 64
Europe
Change in rough diamond consumption by region, $ billions (real 2011)
2011 Developed countries Developing countries 2020FSources: EIU; Euromonitor; IDEX; Tracy Ltd. and Chaim Even-Zohar
Other
Other
Other
Other
Gulf
Gulf
Gulf
India
India
China
China
India
China
Japan
Japan
Europe
Europe
US
USUS
15.6
3.2
7.3 26.1
30
20
10
0
Global rough diamond consumption, $ billions (real 2011)
*Including Hong KongNote: Demand projection for polished diamonds was converted into demand for rough diamonds using historical ratesSources: IDEX, Tacy Ltd. and Chaim Even-Zohar; Kimberley Process Statistics
2005 2007
Other
Persian Gulf
India
China*
JapanEurope
US
CAGR(2011–2020)
Total: 5.9%
2009 2011 2013F 2015F 2017F 2019F 2020F
Forecast
$15.6B
$26.1B
229
45
211345
Total, $ billionsChina & India, %US, %
162539
182637
151840
202935
223233
253531
263630
Figure 7.12: Most of the growth in demand for diamonds will come from China and India through 2020
Figure 7.11: Demand for diamonds is forecast to grow at 5.9% a year (by value)

The Global Diamond Industry | Bain & Company, Inc.
Page 65
Our more optimistic scenario assumes higher-than-expected GDP growth. Should that occur, total private consumption would increase, pushing diamond spending higher in developed countries. At the same time, the number of middle-class families in China and India would grow at a faster rate than that envisioned in our baseline scenario, pushing demand to levels higher than forecast in the base case.
Global rough diamond supply model: Methodology
As in last year’s report, our base forecast for the global supply of rough diamonds relies primarily on current and historical production levels at existing mines (see Figure 7.14). We also factored in the publicly announced production plans of mine operators, as well as experts’ production forecasts for all new mines expected to come online between now and 2020. Since last year, new information regarding company plans and the progress of several mining projects has come to light, leading us to revise our long-term supply forecast downward from our 2011 outlook.
Global rough diamond supply model: Base case scenario
Our base scenario assumes a modest growth in mining output, an assumption rooted in our expectation that some existing mines will shift production underground, while a handful of new mines will come online. We also assume that no major new diamond deposits will be discovered.
Turning to specific producers, we assume moderate production growth for De Beers, which significantly slowed production during the economic crisis. ALROSA, for its part, did not slow production during the downturn, as it
2.0
1.5
1.0
0.5
Forecast
2005 2007 2009 2011 2013F 2015F 2017F 2019F 2020F
High
Base
Low
CAGR(2011–2020)
7.1%
5.9%
5.1%
Global rough diamond consumption, indexed value in 2011 prices; 2011 = 1.00 ($16 billion)
0.740.740.74
0.770.770.77
HighBaseLow
1.001.001.00
1.251.181.15
0.530.530.53
1.401.301.26
1.561.431.38
1.751.591.50
1.851.671.56
Sources: IDEX; Tracy Ltd. and Chaim Even-Zohar; Kimberley Process Statistics
Figure 7.13: Three potential scenarios show the range of likely demand through 2020

The Global Diamond Industry | Bain & Company, Inc.
Page 66
had a ready buyer in Gokhran, the Russian State Precious Metals and Gems Repository, which holds the government’s strategic reserve of precious minerals. Given that the majority of ALROSA’s mines are in their mid-life stage and the company is launching new projects, our base scenario assumes slight growth in ALROSA’s production levels.
We expect Rio Tinto, another major producer, to increase production modestly during the period covered by our forecast. The company has announced plans to go underground at the Argyle mine in Western Australia in 2013, with the goal of producing volumes of 20 million carats per year. The technical challenges of shifting production underground are significant, however, and the company’s production target, while feasible, may be overly aggressive. Based on our consultations with industry experts, we have adopted a more conservative assumption of 15 million carats of annual production in our baseline forecast and adopt Rio Tinto’s own forecast for our more aggressive scenario.
BHP Billiton (with the pending sale of diamond assets to Harry Winston), the last of the major players, has only one mine, Ekati. We forecast its production to decline through 2020.
Another notable source of production growth in the base scenario is Zimbabwe, which we expect to produce about 12 million carats per year in 2012 and maintain this production level through 2020. Mining in Marange has begun, and four companies out of five with concessions in that geographical area are in 2012 being assessed through compliance examinations by the Kimberley Monitoring team.
In addition to existing production sites, 14 new mines are projected to begin production between now and 2020, with the first output due as early as the end of 2012 (see Figure 7.15). The largest is Gahcho Kue, a joint venture between De Beers and Mountain Province in Canada’s Northwest Territories (De Beers owns a 51% majority stake). Projections call for Gahcho Kue to produce up to 6 million carats annually by 2020.
Data gathering and historical trend analysis
Production forecast for the major players
Production forecast for all the remaining
mines
Production forecast for the new mines
Conversion of production forecast by volume into value
• Individually analyze stated production plans and latest public announcements for top mines and major players (ALROSA, BHP Billiton, De Beers, Harry Winston, Petra Diamonds and Rio Tinto), representing approximately 70% of production in 2011
• Conduct extensive expert interviews to verify the information and support forecasted production levels; account for ownership structure
• Forecast steady production rates at historical levels; make adjustments for special cases (i.e. Zimbabwe, Angola) based on expert interviews
• Analyze the remaining production on a country level (approximately 30% of total production in 2011) based on Kimberley Process statistics
• Conduct extensive expert interviews to verify the information and support forecasted production levels
• Analyze in detail published feasibility studies as well as companies’ announced production plans for the forecasted period
• Convert forecast of rough diamond supply in volume into rough diamond supply in value using 2011 average prices to account for difference in rough diamond quality between mines
• Gather average price per carat data on a mine/producer/country level (depending on detail level of volume forecast)
• Gather and analyze historical rough diamond production data in volume terms by region and major mines for 2005–2011 (Kimberley Process, company reports, expert interviews)
1
2
3
4
5
Source: Bain analysis
Figure 7.14: Supply forecast methodology is based on publicly announced plans and expert opinion
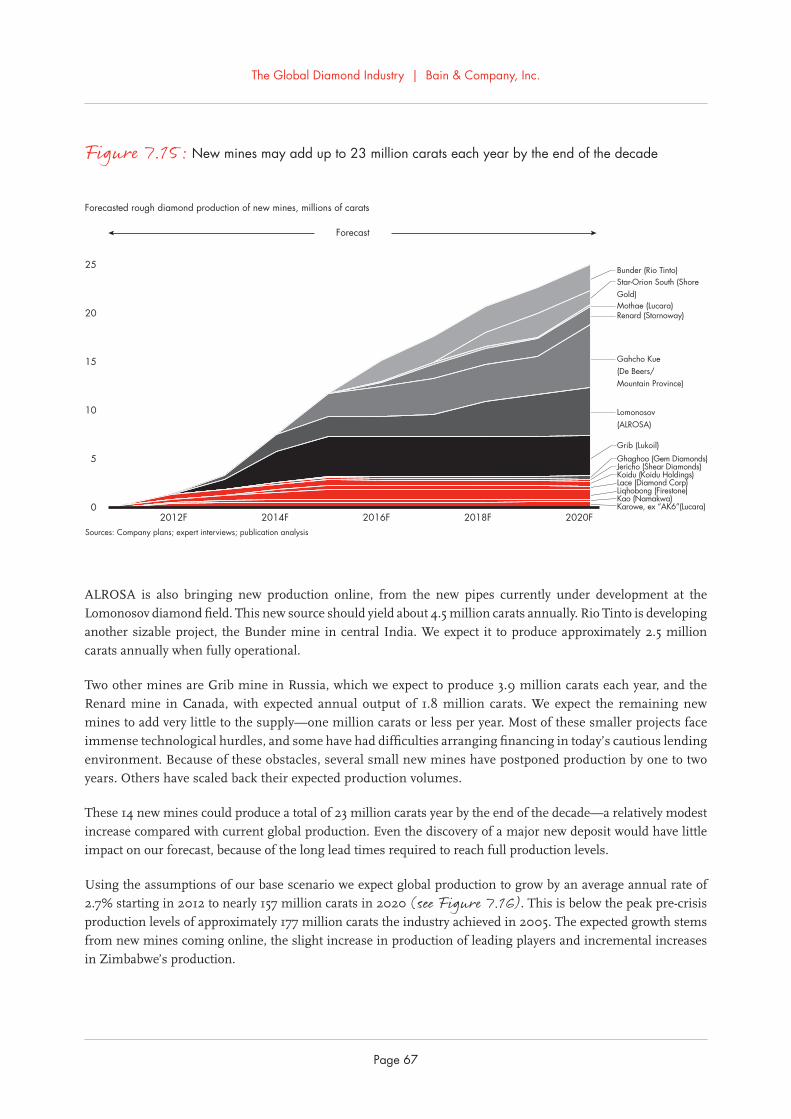
The Global Diamond Industry | Bain & Company, Inc.
Page 67
ALROSA is also bringing new production online, from the new pipes currently under development at the Lomonosov diamond field. This new source should yield about 4.5 million carats annually. Rio Tinto is developing another sizable project, the Bunder mine in central India. We expect it to produce approximately 2.5 million carats annually when fully operational.
Two other mines are Grib mine in Russia, which we expect to produce 3.9 million carats each year, and the Renard mine in Canada, with expected annual output of 1.8 million carats. We expect the remaining new mines to add very little to the supply—one million carats or less per year. Most of these smaller projects face immense technological hurdles, and some have had difficulties arranging financing in today’s cautious lending environment. Because of these obstacles, several small new mines have postponed production by one to two years. Others have scaled back their expected production volumes.
These 14 new mines could produce a total of 23 million carats year by the end of the decade—a relatively modest increase compared with current global production. Even the discovery of a major new deposit would have little impact on our forecast, because of the long lead times required to reach full production levels.
Using the assumptions of our base scenario we expect global production to grow by an average annual rate of 2.7% starting in 2012 to nearly 157 million carats in 2020 (see Figure 7.16). This is below the peak pre-crisis production levels of approximately 177 million carats the industry achieved in 2005. The expected growth stems from new mines coming online, the slight increase in production of leading players and incremental increases in Zimbabwe’s production.
25
20
15
10
5
0
Sources: Company plans; expert interviews; publication analysis
Bunder (Rio Tinto)Star-Orion South (Shore Gold)Mothae (Lucara)Renard (Stornoway)
Lomonosov (ALROSA)
Gahcho Kue (De Beers/Mountain Province)
Grib (Lukoil)
Ghaghoo (Gem Diamonds)Jericho (Shear Diamonds)Koidu (Koidu Holdings)Lace (Diamond Corp)Liqhobong (Firestone)Kao (Namakwa)Karowe, ex “AK6”(Lucara)
2012F 2014F 2016F 2018F 2020F
Forecast
Forecasted rough diamond production of new mines, millions of carats
Figure 7.15: New mines may add up to 23 million carats each year by the end of the decade

The Global Diamond Industry | Bain & Company, Inc.
Page 68
Global rough diamond supply model: Two additional scenarios
In addition to the base case, we ran two alternative scenarios, one based on higher-than-expected mining output through 2020 and the other assuming lower-than-expected output (see Figure 7.17). Both scenarios factor in potential developments within the industry as well as external, geopolitical factors that could affect producers.
The first, more conservative scenario assumes that new mines do not come online and some of the major mines reach their full potential at a slower pace than expected. This scenario could come to pass if the global economy remains weak and technical complications prevent mines from reaching their projected capacity. For example, it supposes that Rio Tinto and Petra Diamonds do not meet their full potential plans, that ALROSA production remains stable at its current levels and that new mines do not come online as anticipated. This scenario also assumes that Zimbabwe fails to maintain the expected 2012 production level of roughly 12 million carats per year. If all these negative contingencies are realized, we expect global production to remain flat through 2020.
Our more aggressive scenario proceeds from the assumption that production volumes will exceed current projections. Specifically, it assumes that Zimbabwe and Angola will step up production as their political environments stabilize. This scenario also assumes that Rio Tinto and Petra Diamonds reach their target outputs. According to this scenario, the diamond supply would increase 4% per year, reaching about 180 million carats by 2020, with a value of about $21 billion.
One note on our valuation methodology: As we have previously stated, not all diamonds are of equal quality, and their prices range from $28 to about $400 per carat. Diamonds from Zimbabwe and the Democratic Republic of
200
150
100
50
0
Global rough diamond production forecast, millions of carats
Note: Smaller players include Catoca mine, BHP Billiton, Petra Diamonds, Harry Winston and Gem Diamonds; “Other mines” includes all the remaining production in Angola, Australia, Canada, DRC, Russia, South Africa, Zimbabwe and other minor producing countriesSources: Expert interviews; Kimberley Process Statistics; publication analysis
CAGR(2011–2020)
2.7%
Forecast
New mines
Other mines
Smaller players
Rio Tinto
De Beers
ALROSA
2.4%
-1.5%
5.2%
0.5%
1.8%
Total (millions of carats)
2005 2007 2009 2011 2013F 2015F 2017F 2019F 2020F
177 168 120 124 140 155 160 160 157
Figure 7.16: Total rough diamond supply is forecast to reach 157 million carats by 2020

The Global Diamond Industry | Bain & Company, Inc.
Page 69
Congo tend to be of lower quality and value. As a result, our study uses the average price per carat per mine in 2011 to project future supply in dollar terms (see Figure 7.18).
Global rough diamond supply-demand balance 2012–2020
Our updated projection for the coming decade finds that through 2020, worldwide demand for diamonds, growing 5.9% annually, will outstrip supply, growing 2.5% annually (see Figure 7.19). Historically, supply deficits have led to firm prices. This trend held in 2011, when supply failed to keep pace with rapidly rebounding demand and rough diamond prices climbed 31%.
Potential risks and disruptive factors
We are confident that our methodology and multiple scenarios allow for a range of market conditions, but we caution that the diamond industry is prone to potential disruptions. Among the risks that industry players and potential investors should factor into their analyses and plans are:
Extended economic turbulence. Several years after the global financial crisis, developed markets are still feeling the after-effects in the form of persistent high unemployment and sovereign debts, volatile capital markets and listless economic growth. More specifically, the European debt crisis still shows no sign of resolution, nor does the political instability in the Middle East. While we have included a low-demand scenario for the diamond industry, another substantial contraction in the global economy could drop diamond sales below the levels anticipated in our worst-case projection.
200
150
100
50
0
Forecast
High
Base
Low
4.2%
2.7%
0.4%
CAGR(2011–2020)
Sources: Company plans; Kimberley Process Statistics; publication analysis
Global rough diamond production forecast, millions of carats
2005 2007 2009 2011 2013F 2015F 2017F 2019F 2020F
177177177
168168168
124124124
148140136
120120120
172155140
178160138
180160131
179157129
HighBaseLow
Figure 7.17: Three potential scenarios show the range of likely production volumes through 2020

The Global Diamond Industry | Bain & Company, Inc.
Page 70
2.0
1.5
1.0
0.5
Forecast
High
Base
Low
7.1%
5.9%
5.1%
High
Base
Low
3.5%
2.5%
0.1%
CAGR(2011–2020)
Global rough diamond supply and demand forecast, indexed value, 2011 = 1.00
2005 2007 2009 2011 2013F 2015F 2017F 2019F 2020F
Note: Historical values are presented in 2011 dollarsSources: IDEX, Tacy Ltd. and Chaim Even-Zohar; Kimberley Process Statistics; company plans; expert interviews; publication analysis
DemandSupply
1.5
1.0
0.5
Forecast
High
Base
Low
3.5%
2.5%
0.1%
CAGR(2011–2020)
Global rough diamond production forecast, indexed value, 2011 = 1.00
2005 2007 2009 2011 2013F 2015F 2017F 2019F 2020F
1.331.331.33
1.461.461.46
1.001.001.00
1.171.121.09
0.950.950.95
1.331.241.12
1.371.281.09
1.381.271.03
1.371.251.01
HighBaseLowSources: Company plans; expert interviews; publication analysis
Figure 7.19: We project that global demand for rough diamonds will exceed supply through 2020
Figure 7.18: Three potential scenarios show the range of likely production value through 2020

The Global Diamond Industry | Bain & Company, Inc.
Page 71
We believe that the likelihood of another deep downturn is low, though far from nonexistent. Most indicators point to the global economy’s continued slow recovery, in keeping with the improvements registered in 2011 and the first nine months of 2012.
Development of an investment market for diamonds. Another potentially disruptive factor would be the development of a sizable investment market for diamonds. This could lead to a possible increase in demand, which in turn could drive prices higher and create an even stronger outlook for producers. The most promising potential markets for diamonds as an investment would likely be developing markets such as China, India and Russia. Consumers in these markets consider high inflation a real possibility and are seeking a hedge against it. Should inflation accelerate in those countries, we believe many consumers would turn to diamonds as a store of value, leading to significant gains in consumption. A positive feedback loop would develop, with greater demand leading to increased prices, which in turn would fuel still greater demand.
Synthetic gem-quality diamonds. Greater consumer interest in synthetic gem-quality diamonds could negatively affect the market for natural stones. This is a remote risk, we believe. For consumers to embrace synthetics on a large scale, the price of high-quality synthetic stones would have to drop considerably—an unlikely event, barring a manufacturing breakthrough and a rapid turn to large-scale production. Such a development is not outside the realm of possibility, but it does not pose a realistic threat to the diamond industry in the next decade. Compounding the unlikelihood of this risk is consumers’ general aversion to synthetic stones and their willingness to pay a premium for natural stones.
Decline in demand due to absence of generic marketing. Generic marketing contributed greatly to the development of all the major diamond markets. While generic marketing has been replaced by branded advertising, many in the industry worry that it won’t be enough and lead to slower growth, especially in developing markets such as India and China. While the possibility of growth slowdown exists, the evidence so far does not support this assertion.
Unexpected supply increase. Another potential factor that could substantially alter our forecast is the discovery and rapid development of a major new source of natural diamonds. Again, this is a relatively low-probability event, given that no major new deposits have been discovered in the past 20 years. Moreover, even if an operator discovered one or more significant deposits in the near term, it would need a decade or more to develop a mine and achieve full production. Even so, the possibility does exist. Such discoveries are by definition surprising—certainly no one anticipated that Canada or Australia would become sources of major new diamond supplies before they emerged in the late 1980s and early 1990s.
Key takeaways
• We expect world diamond demand to grow at an average annual rate of 5.9% each year, to nearly $26 billion (in 2011 prices) by 2020.
• By 2020, India and China will account for 50% of incremental global demand, and together will overtake the US as the largest diamond jewelry market.
• We expect the global supply of rough diamonds to grow by an average annual rate of 2.7% starting in 2012 to nearly 157 million carats in 2020. This is 12% below the peak pre-crisis production levels of 177 million carats that the industry achieved in 2005. In value terms, the supply is expected to grow by an average rate of 2.5%.

The Global Diamond Industry | Bain & Company, Inc.
Page 72
• Our current production forecast is slightly lower than last year’s, due to changes in company plans, financial difficulties experienced by new projects and the technical challenges of moving major diamond mines underground.
• In the next decade, demand for rough diamonds is set to outpace supply under all considered scenarios, indicating a strong positive long-term outlook and solid pricing prospects for the industry.
• Several disruptive factors continue to pose a threat to negatively impact the diamond supply-demand balance, but all of these factors are unlikely to significantly impact the industry in the long term.

The Global Diamond Industry | Bain & Company, Inc.
Page 73
Conclusion
Looking ahead: Implications for industry players
In the preceding pages, we have taken a detailed and comprehensive look at the state of the world diamond market, encompassing a review of current fundamentals, the outlook for supply and demand and the preferences and behavior of consumers in key national markets. Our findings inform several implications for any company competing in the diamond sector.
A bright outlook, but uncertainties remain
The diamond market has sustained its recovery from the financial crisis of 2008, growing 18% and reaching $71 billion in retail diamond jewelry sales in 2011. The pace of growth should remain firm, judging from the robust condition of fundamentals in the key markets of India, China and the US. Those three countries will likely account for roughly 70% of demand growth through 2020. The demand outlook is also strongly positive in Russia, Turkey and Latin America, whose fast-developing economies can support their populations’ growing appetite for luxury goods.
Several short- to medium-term risks could cloud this outlook. Fiscal issues in the US, such as the abrupt reimposition of taxes waived several years ago, could reduce consumers’ discretionary income significantly. The euro zone stubborn recession, meanwhile, has been deepened by debt concerns, crimping consumer spending. And the economic slowdown in China could be a foretaste of lagging growth in other developing markets.
In a diverse market, one size does not fit all
The world’s diamond markets have one thing in common: In every national market, growing wealth and household incomes are the factors that fuel demand growth. Yet the differences among regions are as important as their similarities. To succeed in both developed and developing markets, prepared players will keep a few considerations in mind.
First, although wealth is expanding rapidly in emerging markets, household incomes remain substantially below those in developed economies. Further, within countries such as China and India, there are profound differences among the incomes of residents of Tier-1 cities and those in smaller cities, and residents of different regions (incomes in coastal China, for instance, far exceed incomes in interior provinces). As a result, diamond industry players will want to take a local approach when positioning their offerings, seek out market opportunities in specific value segments and align costs with uneven revenue bases.
Tastes and customs also vary widely by regions. Each region has its own traditions regarding gifts and its own diamond jewelry preferences. The diamond engagement ring tradition has penetrated some cultures much more deeply than others, and there is wide local variation in service expectations and criteria for store choice.
A successful strategy, then, will likely involve a different route for each region, supported by marketing campaigns tailored to local preferences and traditions. By fusing time-tested promotional magic with up-to-date marketing science, diamond-industry players can sustain current levels of diamond spending in developed markets and lift the developing world’s diamond spending to a new level.

The Global Diamond Industry | Bain & Company, Inc.
Page 74
Glossary
Added value—portion of revenues/profits captured by a specific segment in an industry value chain
CAGR—compound annual growth rate, a year-on-year growth rate over a specified period of time
Carat—one of the four main diamond characteristics along with color, cut and clarity. 1 carat = 250 mg
CSO—refer to DTC
CVD—chemical vapor deposition, a high-temperature but normal pressure process to grow diamonds
Developed countries—countries that have highly developed economies, advanced technological infrastructure and high per capita income (e.g., the US, countries of EU, Japan)
Developing countries—countries with low living standards and low Human Development Index (e.g., China, India, Russia)
Diamond pipeline—a value chain that runs from dealers to diamond cutters and polishers to jewelry manufacturers to retail stores and finally to consumers
DTC—Diamond Trading Company (formerly CSO—Central Selling Organization), selling and marketing arm of De Beers
ETF—exchange traded fund, an investment fund traded on stock exchanges which holds assets such as stocks, commodities or bonds
Four Cs—four main diamond characteristics which define the quality of a stone: carat, color, cut and clarity
Gem-quality diamonds—diamonds used for jewelry manufacturing
Grade—diamond concentration in the ore body. Typically measured in carats per ton of ore
HPHT—high-pressure high-temperature, a process using large presses to grow synthetic diamonds
IDEX—International Diamond Exchange, one of the major diamond research and publishing agencies, based in Israel
Industrial diamonds—diamonds used for non-jewelry purposes in manufacturing processes across various industries (construction, high-tech, etc.)
IPO—initial public offering, a process by which a private company transforms into a public one through the first sale of stock by a company to the public
Kimberley process (KP)—certification scheme aimed at prevention of conflict diamond sales
Penetration rate—degree to which a product (e.g., diamond engagement ring) is known and used

The Global Diamond Industry | Bain & Company, Inc.
Page 75
Personal disposable income—amount of money that households have available for spending and saving after paying income taxes
Privatization—a process of transferring ownership of a business from the public sector (a government) to the private sector
R2—coefficient indicating level of interrelationships of data series
Reserves—diamond deposits that can be economically extracted currently
Resources—diamond deposits that have been found to be valuable and that could potentially be economically extracted at a later point in time
Spot market—a market where daily prices are set at the level of the supply-demand equilibrium
Synthetic diamonds—diamonds produced in laboratories under HPHT or CVD methods
The Global Diamond Industry | Bain & Company, Inc.
Page 76
Key contacts for the report
This report was prepared by Yury Spektorov, Olya Linde and Pierre-Laurent Wetli from Bain & Company, together with Ari Epstein and Stephane Fischler from AWDC.
The authors were supported by a global team, including Manish Goyal, Jessie Xue, Aleksey Groshev, Evgeniya Ivanova, Alexander Boldyrev, Ekaterina Gaponenko, Christie Gao, Yevgeniy Dzyabura, Andrii Kladchenko, Maria Shiroyan, Manav Singh, Vidur Ahluwalia, Benjamin Cherian and Bain’s Mining and Luxury Goods practices.
Media contacts:Cheryl KraussBain & CompanyPhone: +1 646 562–78–63Mobile: +1 917 783–00–13Email: [email protected]
Kim van WeynsbergheAWDCPhone: +32 3 222–05–00Email: [email protected]
Ari EpsteinChief Executive Officer, AWDC
Stephane FischlerPresident, AWDC
Yury SpektorovPartner, Bain & Company
Olya LindePartner, Bain & Company
Pierre-Laurent WetliPartner, Bain & Company

For more information, visit www.bain.com
Shared Ambition, True Results
Bain & Company is the management consulting firm that the world’s business leaders come to when they want results.
Bain advises clients on strategy, operations, technology, organization, private equity and mergers and acquisitions. We develop practical, customized insights that clients act on and transfer skills that make change stick. Founded in 1973, Bain has 48 offices in 31 countries, and our deep expertise and client roster cross every industry and economic sector. Our clients have outperformed the stock market 4 to 1.
What sets us apart
We believe a consulting firm should be more than an adviser. So we put ourselves in our clients’ shoes, selling outcomes, not projects. We align our incentives with our clients’ by linking our fees to their results and collaborate to unlock the full potential of their business. Our Results Delivery® process builds our clients’ capabilities, and our True North values mean we do the right thing for our clients, people and communities—always.