the geographies of austerity - michael kitson: … geographies of austerity michael kitsona, ron...
TRANSCRIPT
The geographies of austerity
Michael Kitsona, Ron Martinb and Peter Tylerc
aJudge Business School, University of Cambridge, Trumpington Street, Cambridge CB2 1AG, UK,[email protected] of Geography, University of Cambridge, Downing Place, Cambridge CB2 3EN, UK,[email protected] of Land Economy, University of Cambridge, Silver Street, Cambridge CBE 9EP, UK,[email protected]
From boom to bust
As late as mid-2007, to most observers, the global
economic scene looked rosy. It seemed as though
the laws of economics had changed: the advanced
economies had rid themselves of inflation, the busi-
ness cycle had been expunged and stable growth
firmly established. Such was the conviction that
a new economic era had arrived that in 2003 the
Governor of the Bank of England described the
previous decade as being NICE—a period of
‘non-inflationary consistent expansion’ (King,
2003). And in March 2007, Gordon Brown, the
UK’s Chancellor of the Exchequer confidently an-
nounced that ‘‘my report to the country is of rising
employment and rising investment, continuing low
inflation, and low interest and mortgage rates .built on the foundation of the longest period of
economic stability and sustained growth in our
country’s history’’ (Brown, 2007). There was an
optimistic assessment that the new economic order
was being driven by new technology and new ‘cre-
ative classes’, supported by policies of financial
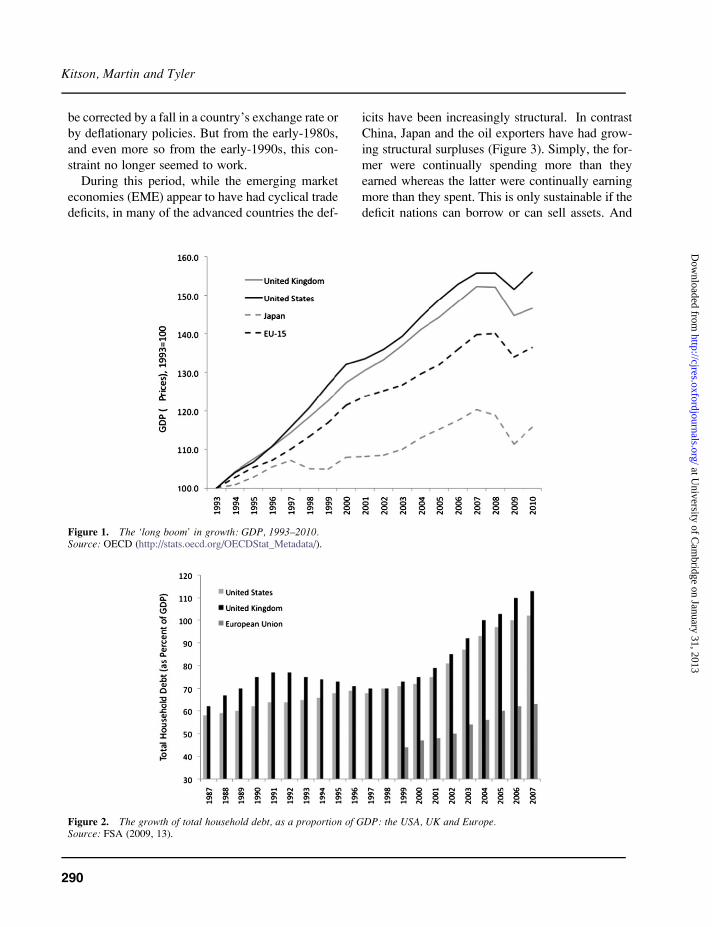
prudence by states. Certainly, in terms of steadily
rising levels of gross domestic product (GDP), es-
pecially in the USA and UK (see Figure 1), there
appeared to be strong grounds for such optimism.
What we now know, of course, is that this ‘long
boom’ or ‘great moderation’ (Stock and Watson,
2002) was built in large part on an unsustainable
growth model. Underpinning much of that growth
was a dramatic rise in household debt, in the case of
the USA and UK to over 100% of GDP (Figure 2).
The increase in household debt was driven by a per-
fect storm: asset price inflation in housing and stock
markets; cheap goods from China and elsewhere in
the Far East; a glut of savings, in China, Japan and
the oil exporters; a global financial system, which
unleashed from regulation, was developing ever
more ‘creative’ ways of making money (partly by
funding and fuelling the rising tide of household
mortgage debt); and the optimism of the ‘long
boom’ itself. The simple process was that consum-
ers in many advanced economies could borrow
cheaply to spend, and the resultant increase in con-
sumer demand stimulated economic growth. Both
the USA and UK in particular experienced rapid
growth from the early-1990s onwards, much of it
driven by consumption. In previous periods, such
a process was kept in check by the ‘balance of pay-
ments constraint’—whereby the growth of con-
sumption would increase imports leading to
a balance of payments deficit, which in turn would
� The Author 2011. Published by Oxford University Press on behalf of the Cambridge Political Economy Society. All rights reserved.For permissions, please email: [email protected]
Cambridge Journal of Regions, Economy and Society 2011, 4, 289–302
doi:10.1093/cjres/rsr030
at University of C
ambridge on January 31, 2013
http://cjres.oxfordjournals.org/D
ownloaded from
be corrected by a fall in a country’s exchange rate or
by deflationary policies. But from the early-1980s,
and even more so from the early-1990s, this con-
straint no longer seemed to work.
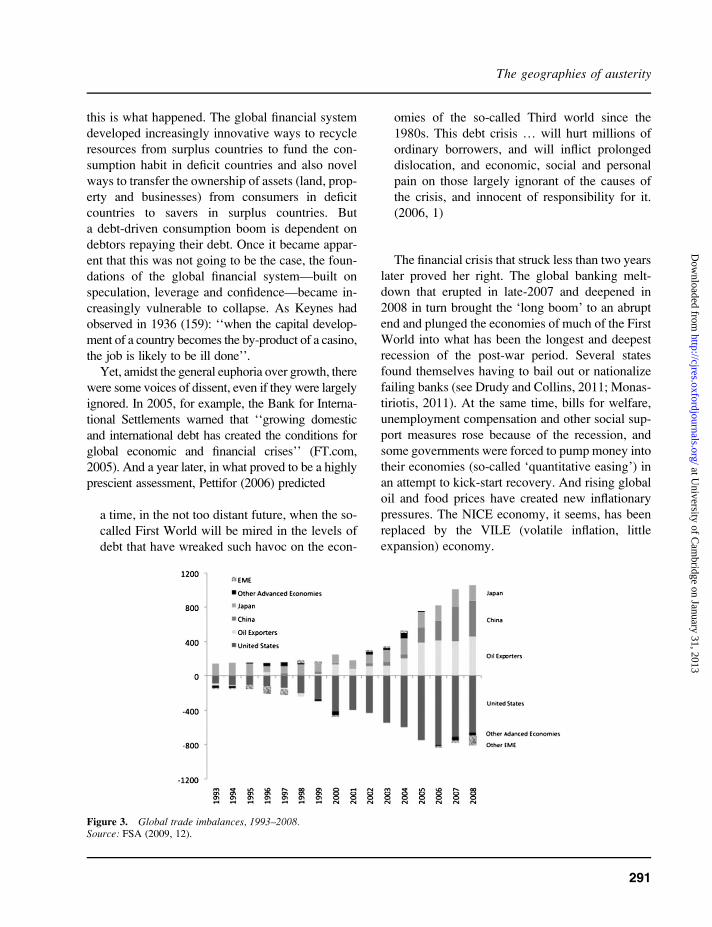
During this period, while the emerging market
economies (EME) appear to have had cyclical trade
deficits, in many of the advanced countries the def-
icits have been increasingly structural. In contrast
China, Japan and the oil exporters have had grow-
ing structural surpluses (Figure 3). Simply, the for-
mer were continually spending more than they
earned whereas the latter were continually earning
more than they spent. This is only sustainable if the
deficit nations can borrow or can sell assets. And
Figure 1. The ‘long boom’ in growth: GDP, 1993–2010.Source: OECD (http://stats.oecd.org/OECDStat_Metadata/).
Figure 2. The growth of total household debt, as a proportion of GDP: the USA, UK and Europe.Source: FSA (2009, 13).
Kitson, Martin and Tyler
290
at University of C
ambridge on January 31, 2013
http://cjres.oxfordjournals.org/D
ownloaded from
this is what happened. The global financial system
developed increasingly innovative ways to recycle
resources from surplus countries to fund the con-
sumption habit in deficit countries and also novel
ways to transfer the ownership of assets (land, prop-
erty and businesses) from consumers in deficit
countries to savers in surplus countries. But
a debt-driven consumption boom is dependent on
debtors repaying their debt. Once it became appar-
ent that this was not going to be the case, the foun-
dations of the global financial system—built on
speculation, leverage and confidence—became in-
creasingly vulnerable to collapse. As Keynes had
observed in 1936 (159): ‘‘when the capital develop-
ment of a country becomes the by-product of a casino,
the job is likely to be ill done’’.
Yet, amidst the general euphoria over growth, there
were some voices of dissent, even if they were largely
ignored. In 2005, for example, the Bank for Interna-
tional Settlements warned that ‘‘growing domestic
and international debt has created the conditions for
global economic and financial crises’’ (FT.com,
2005). And a year later, in what proved to be a highly
prescient assessment, Pettifor (2006) predicted
a time, in the not too distant future, when the so-
called First World will be mired in the levels of
debt that have wreaked such havoc on the econ-
omies of the so-called Third world since the
1980s. This debt crisis . will hurt millions of
ordinary borrowers, and will inflict prolonged
dislocation, and economic, social and personal
pain on those largely ignorant of the causes of
the crisis, and innocent of responsibility for it.
(2006, 1)
The financial crisis that struck less than two years
later proved her right. The global banking melt-
down that erupted in late-2007 and deepened in
2008 in turn brought the ‘long boom’ to an abrupt
end and plunged the economies of much of the First
World into what has been the longest and deepest
recession of the post-war period. Several states
found themselves having to bail out or nationalize
failing banks (see Drudy and Collins, 2011; Monas-
tiriotis, 2011). At the same time, bills for welfare,
unemployment compensation and other social sup-
port measures rose because of the recession, and
some governments were forced to pump money into
their economies (so-called ‘quantitative easing’) in
an attempt to kick-start recovery. And rising global
oil and food prices have created new inflationary
pressures. The NICE economy, it seems, has been
replaced by the VILE (volatile inflation, little
expansion) economy.
Figure 3. Global trade imbalances, 1993–2008.Source: FSA (2009, 12).
The geographies of austerity
291
at University of C
ambridge on January 31, 2013
http://cjres.oxfordjournals.org/D
ownloaded from
From bust to austerity
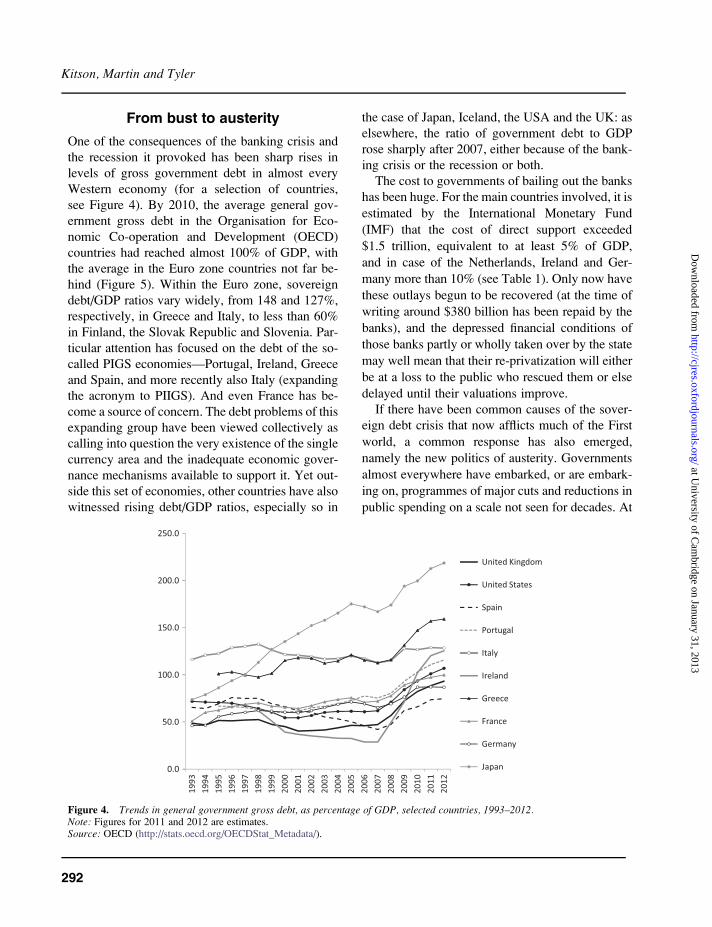
One of the consequences of the banking crisis and
the recession it provoked has been sharp rises in
levels of gross government debt in almost every
Western economy (for a selection of countries,
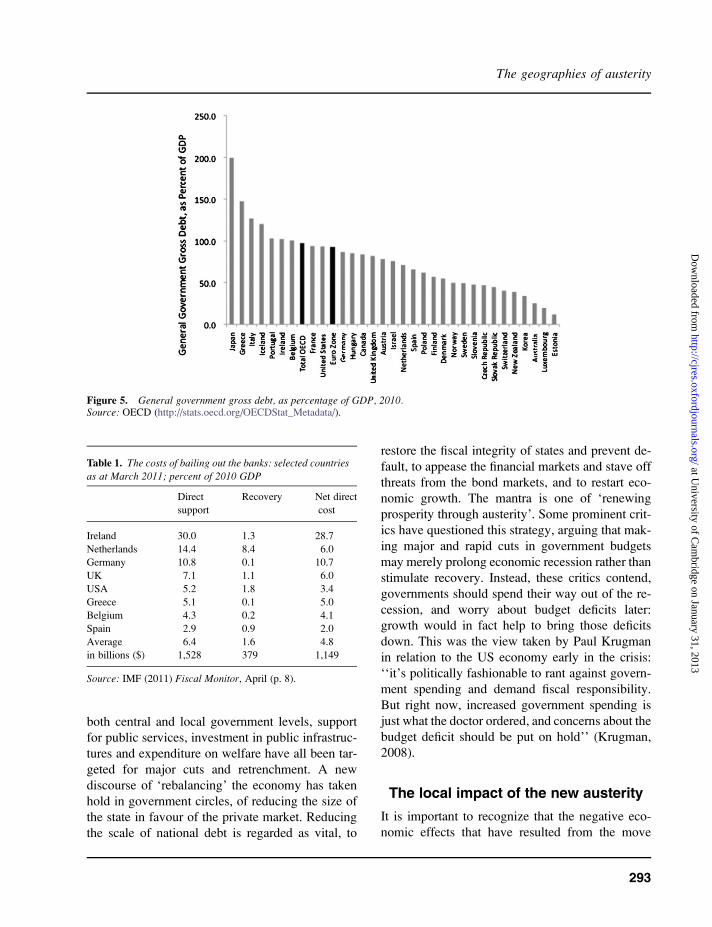
see Figure 4). By 2010, the average general gov-
ernment gross debt in the Organisation for Eco-
nomic Co-operation and Development (OECD)
countries had reached almost 100% of GDP, with
the average in the Euro zone countries not far be-
hind (Figure 5). Within the Euro zone, sovereign
debt/GDP ratios vary widely, from 148 and 127%,
respectively, in Greece and Italy, to less than 60%
in Finland, the Slovak Republic and Slovenia. Par-
ticular attention has focused on the debt of the so-
called PIGS economies—Portugal, Ireland, Greece
and Spain, and more recently also Italy (expanding
the acronym to PIIGS). And even France has be-
come a source of concern. The debt problems of this
expanding group have been viewed collectively as
calling into question the very existence of the single
currency area and the inadequate economic gover-
nance mechanisms available to support it. Yet out-
side this set of economies, other countries have also
witnessed rising debt/GDP ratios, especially so in
the case of Japan, Iceland, the USA and the UK: as
elsewhere, the ratio of government debt to GDP
rose sharply after 2007, either because of the bank-
ing crisis or the recession or both.
The cost to governments of bailing out the banks
has been huge. For the main countries involved, it is
estimated by the International Monetary Fund
(IMF) that the cost of direct support exceeded
$1.5 trillion, equivalent to at least 5% of GDP,
and in case of the Netherlands, Ireland and Ger-
many more than 10% (see Table 1). Only now have
these outlays begun to be recovered (at the time of
writing around $380 billion has been repaid by the
banks), and the depressed financial conditions of
those banks partly or wholly taken over by the state
may well mean that their re-privatization will either
be at a loss to the public who rescued them or else
delayed until their valuations improve.
If there have been common causes of the sover-
eign debt crisis that now afflicts much of the First
world, a common response has also emerged,
namely the new politics of austerity. Governments
almost everywhere have embarked, or are embark-
ing on, programmes of major cuts and reductions in
public spending on a scale not seen for decades. At
150.0
200.0
250.0
0.0
50.0
100.0
1993
1994
1995
1996
1997
1998
1999
2000
2001
2002
2003
2004
2005
2006
2007
2008
2009
2010
2011
2012
United Kingdom
United States
Spain
Portugal
Italy
Ireland
Greece
France
Germany
Japan
Figure 4. Trends in general government gross debt, as percentage of GDP, selected countries, 1993–2012.Note: Figures for 2011 and 2012 are estimates.Source: OECD (http://stats.oecd.org/OECDStat_Metadata/).
Kitson, Martin and Tyler
292
at University of C
ambridge on January 31, 2013
http://cjres.oxfordjournals.org/D
ownloaded from
both central and local government levels, support
for public services, investment in public infrastruc-
tures and expenditure on welfare have all been tar-
geted for major cuts and retrenchment. A new
discourse of ‘rebalancing’ the economy has taken
hold in government circles, of reducing the size of
the state in favour of the private market. Reducing
the scale of national debt is regarded as vital, to
restore the fiscal integrity of states and prevent de-
fault, to appease the financial markets and stave off
threats from the bond markets, and to restart eco-
nomic growth. The mantra is one of ‘renewing
prosperity through austerity’. Some prominent crit-
ics have questioned this strategy, arguing that mak-
ing major and rapid cuts in government budgets
may merely prolong economic recession rather than
stimulate recovery. Instead, these critics contend,
governments should spend their way out of the re-
cession, and worry about budget deficits later:
growth would in fact help to bring those deficits
down. This was the view taken by Paul Krugman
in relation to the US economy early in the crisis:
‘‘it’s politically fashionable to rant against govern-
ment spending and demand fiscal responsibility.
But right now, increased government spending is
just what the doctor ordered, and concerns about the
budget deficit should be put on hold’’ (Krugman,
2008).
The local impact of the new austerity
It is important to recognize that the negative eco-
nomic effects that have resulted from the move
Figure 5. General government gross debt, as percentage of GDP, 2010.Source: OECD (http://stats.oecd.org/OECDStat_Metadata/).
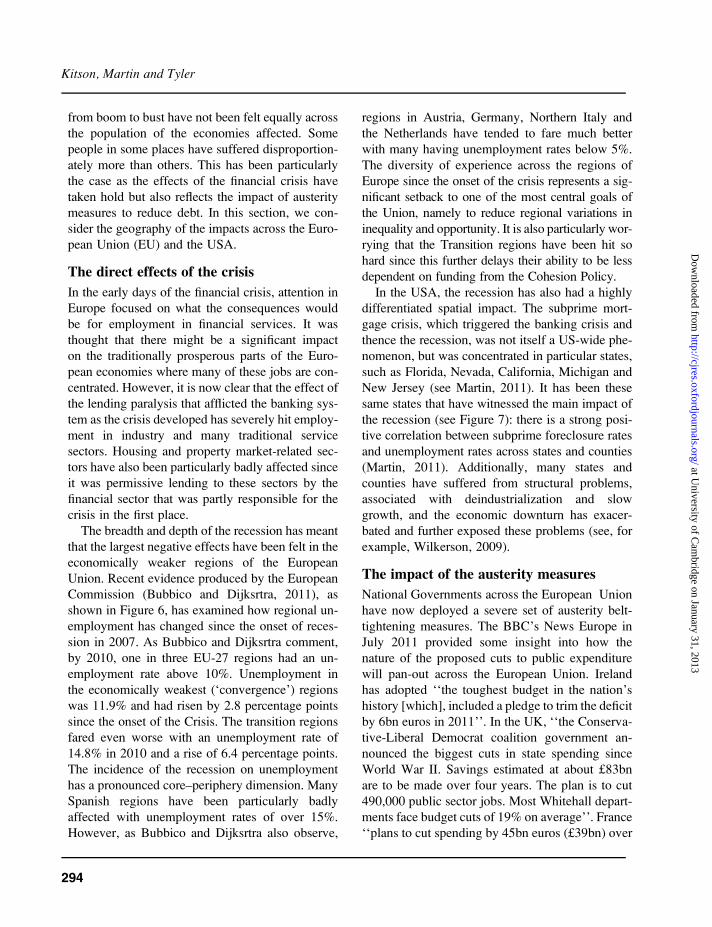
Table 1. The costs of bailing out the banks: selected countries
as at March 2011; percent of 2010 GDP
Direct
support
Recovery Net direct
cost
Ireland 30.0 1.3 28.7
Netherlands 14.4 8.4 6.0
Germany 10.8 0.1 10.7
UK 7.1 1.1 6.0
USA 5.2 1.8 3.4
Greece 5.1 0.1 5.0
Belgium 4.3 0.2 4.1
Spain 2.9 0.9 2.0
Average
in billions ($)
6.4
1,528
1.6
379
4.8
1,149
Source: IMF (2011) Fiscal Monitor, April (p. 8).
The geographies of austerity
293
at University of C
ambridge on January 31, 2013
http://cjres.oxfordjournals.org/D
ownloaded from
from boom to bust have not been felt equally across
the population of the economies affected. Some
people in some places have suffered disproportion-
ately more than others. This has been particularly
the case as the effects of the financial crisis have
taken hold but also reflects the impact of austerity
measures to reduce debt. In this section, we con-
sider the geography of the impacts across the Euro-
pean Union (EU) and the USA.
The direct effects of the crisis
In the early days of the financial crisis, attention in
Europe focused on what the consequences would
be for employment in financial services. It was
thought that there might be a significant impact
on the traditionally prosperous parts of the Euro-
pean economies where many of these jobs are con-
centrated. However, it is now clear that the effect of
the lending paralysis that afflicted the banking sys-
tem as the crisis developed has severely hit employ-
ment in industry and many traditional service
sectors. Housing and property market-related sec-
tors have also been particularly badly affected since
it was permissive lending to these sectors by the
financial sector that was partly responsible for the
crisis in the first place.
The breadth and depth of the recession has meant
that the largest negative effects have been felt in the
economically weaker regions of the European
Union. Recent evidence produced by the European
Commission (Bubbico and Dijksrtra, 2011), as
shown in Figure 6, has examined how regional un-
employment has changed since the onset of reces-
sion in 2007. As Bubbico and Dijksrtra comment,
by 2010, one in three EU-27 regions had an un-
employment rate above 10%. Unemployment in
the economically weakest (‘convergence’) regions
was 11.9% and had risen by 2.8 percentage points
since the onset of the Crisis. The transition regions
fared even worse with an unemployment rate of
14.8% in 2010 and a rise of 6.4 percentage points.
The incidence of the recession on unemployment
has a pronounced core–periphery dimension. Many
Spanish regions have been particularly badly
affected with unemployment rates of over 15%.
However, as Bubbico and Dijksrtra also observe,
regions in Austria, Germany, Northern Italy and
the Netherlands have tended to fare much better
with many having unemployment rates below 5%.
The diversity of experience across the regions of
Europe since the onset of the crisis represents a sig-
nificant setback to one of the most central goals of
the Union, namely to reduce regional variations in
inequality and opportunity. It is also particularly wor-
rying that the Transition regions have been hit so
hard since this further delays their ability to be less
dependent on funding from the Cohesion Policy.
In the USA, the recession has also had a highly
differentiated spatial impact. The subprime mort-
gage crisis, which triggered the banking crisis and
thence the recession, was not itself a US-wide phe-
nomenon, but was concentrated in particular states,
such as Florida, Nevada, California, Michigan and
New Jersey (see Martin, 2011). It has been these
same states that have witnessed the main impact of
the recession (see Figure 7): there is a strong posi-
tive correlation between subprime foreclosure rates
and unemployment rates across states and counties
(Martin, 2011). Additionally, many states and
counties have suffered from structural problems,
associated with deindustrialization and slow
growth, and the economic downturn has exacer-
bated and further exposed these problems (see, for
example, Wilkerson, 2009).
The impact of the austerity measures
National Governments across the European Union
have now deployed a severe set of austerity belt-
tightening measures. The BBC’s News Europe in
July 2011 provided some insight into how the
nature of the proposed cuts to public expenditure
will pan-out across the European Union. Ireland
has adopted ‘‘the toughest budget in the nation’s
history [which], included a pledge to trim the deficit
by 6bn euros in 2011’’. In the UK, ‘‘the Conserva-
tive-Liberal Democrat coalition government an-
nounced the biggest cuts in state spending since
World War II. Savings estimated at about £83bn
are to be made over four years. The plan is to cut
490,000 public sector jobs. Most Whitehall depart-
ments face budget cuts of 19% on average’’. France
‘‘plans to cut spending by 45bn euros (£39bn) over
Kitson, Martin and Tyler
294
at University of C
ambridge on January 31, 2013
http://cjres.oxfordjournals.org/D
ownloaded from
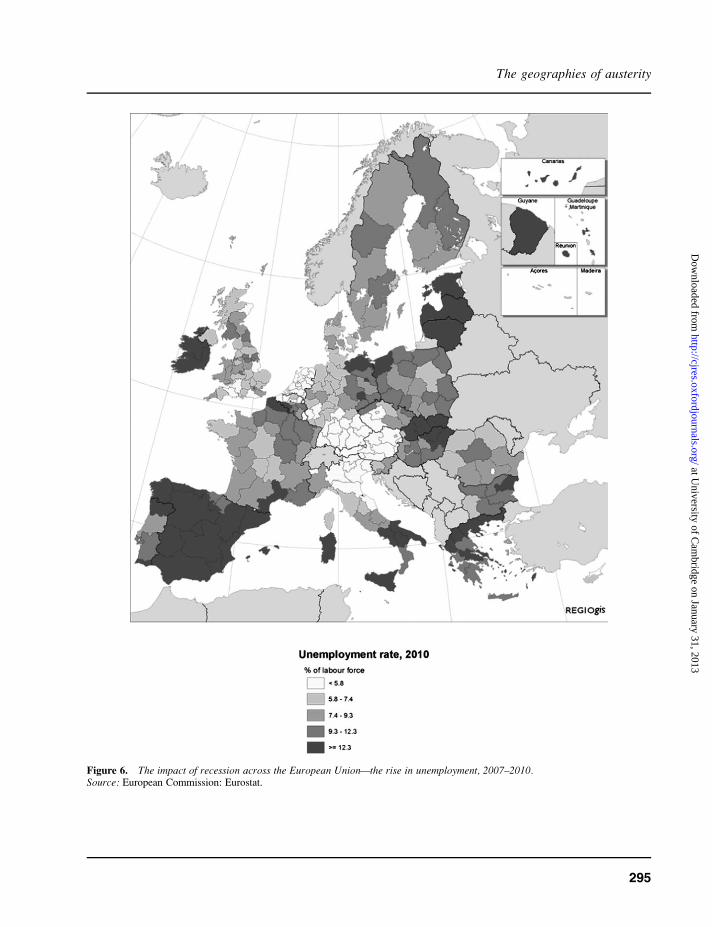
Figure 6. The impact of recession across the European Union—the rise in unemployment, 2007–2010.Source: European Commission: Eurostat.
The geographies of austerity
295
at University of C
ambridge on January 31, 2013
http://cjres.oxfordjournals.org/D
ownloaded from

the next three years’’. In the Netherlands ‘‘the cen-
tre-right coalition formed after months of negotia-
tion on 8 October said it wanted to cut the budget
by 18bn euros ($24bn; £15bn) by 2015’’. In Spain,
‘‘the government has approved an austerity budget
for 2011 which includes a tax rise for the rich and
8% spending cuts’’. In Italy, ‘‘the parliament adop-
ted a new 70bn-euro austerity package on 15 July,
2011’’ and this comes ‘‘a year after the government
had approved austerity measures worth 24bn euros
for 2011–12’’ and in Germany ‘‘the government
plans to cut the budget deficit by a record 80bn
euros by 2014. The total deficit in 2009 was 3.1%
of GDP, but it is projected to be above 5% for
2010’’ (BBC News Europe, 2011).
There is much concern that these proposed cut-
backs in government expenditure across Europe
might well do more harm than good. As the Council
for Europe has observed:
Fiscal solutions to the current crisis need to ensure
that the avoidance of current fiscal catastrophes
does not simply lay the groundwork for future,
perhaps bigger, social crises (New Europe, 2010).
Reductions in public expenditure will lead to job
losses in the public sector and whilst it is not yet
clear how they will be distributed across the regions
of the European Union, it is important that the re-
gional consequences for some of the most de-
pressed regions be considered carefully (Centre
for Cities, 2011). The UK provides some insight
into this issue. The UK was relatively quick to cut
public expenditure. Perhaps predictably, the axe has
tended to fall heavily on capital expenditure and
there must be concern as to what may be the con-
sequences of this on economic growth and well-
being in the future. However, there are also exten-
sive cuts proposed to welfare benefits, housing and
Figure 7. The geography of recession across the USA (Unemployment Rates, July 2011–June 2011 Averages). Data from Bureau ofLabor Statistics (http://www.bls.gov.data).
Kitson, Martin and Tyler
296
at University of C
ambridge on January 31, 2013
http://cjres.oxfordjournals.org/D
ownloaded from
defence. Whilst no parts of government have es-
caped, some, like health and education, have fared
better (HM Treasury, 2010). Despite assurances by
government that the impact of reductions in expen-
diture should not fall disproportionately on those
who are relatively less well off in British society,
there are many who feel that this is a difficult prom-
ise for government to keep. Thus, the Institute for
Fiscal Studies has observed that low-income house-
holds of working age have the most to lose from the
UK Chancellor’s 2010 Austerity Budget (Browne
and Levell, 2010). MacLeavy (2011) also high-
lights how the cutbacks may present a particular
challenge to the financial security and autonomy
of women in British society. The geographical im-
pact of reductions in public expenditure has also
attracted recent comment (Centre for Centre for
Cities, 2011). The evidence suggests that many of
the local authority districts with the highest unem-
ployment in July 2011 have relatively high concen-
trations of public sector jobs (see Figure 8). In fact,
a simple correlation of unemployment in the dis-
tricts of England with the relative concentration of
public sector jobs shows that some of those parts of
England that have historically been the most
economically depressed and which have suffered
the most from the recession are particularly exposed
to reductions in job opportunities in the public sector.
Figure 8 reveals a North–South divide in the concen-
tration of public sector employment with the rela-
tively disadvantaged North tending to have some
of the highest concentrations.
In the USA, there are similar concerns (Wolff
2011). Wolff and Fraad-Wolff (2011) have com-
mented recently that:
A national campaign is now fully launched to
make local public sector employees pick up a ma-
jor share of the costs of the economic crisis.
Years of rising spending and falling revenue
have carved a path of destruction through federal,
state, and local budgets. Deficits and debts have
mounted, eroding taxpayer support for govern-
ment spending, in general and for public employees
particularly. In response to deep economic pains in
middle class communities, major efforts are under
way, from California to Maine, to balance budgets
through major cuts in services, wages, benefits, and
employment. (Wolff and Fraad-Wolff, 2011)
In the US, the economic downturn has depressed
state tax revenues while increasing the need for
higher social spending on unemployment compen-
sation, social support and the like (see Lobao and
Adua, 2011; Walker and Bardhan, 2011). In some
cases, political considerations have also contributed
to undermining state finances. For example, the fact
that a qualified majority is sometimes necessary to
approve major budgetary decisions can impede de-
cision making, as in California. In some other
states, tax reduction granted at the peak of the long
boom has led to the emergence of large shortfalls
during the recession: Arizona and New York are
examples. And some local government entities also
stopped contributing to public sector pension funds
when they thought they were sufficiently funded,
which resulted in subsequent shortfalls, as in the
case of Illinois (Lucas, 2011)
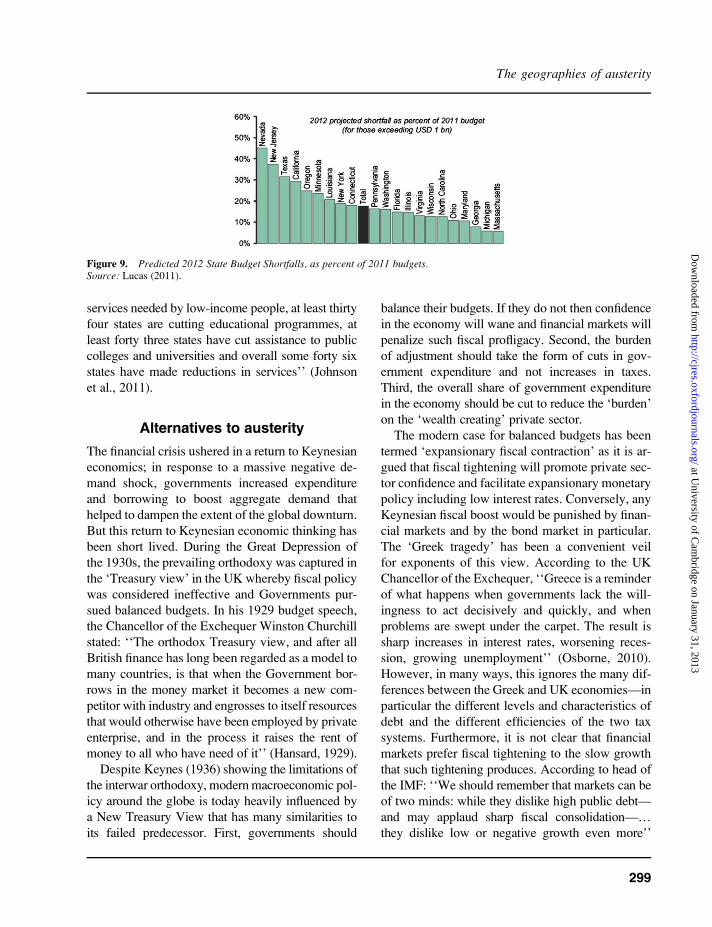
The upshot is that there are a number of states
in which local budget shortfalls are likely to ex-
ceed $1billion in 2011–2012. In some cases, the
shortfall is predicted to exceed 25% of the 2011
budget (Lucas, 2011; see Figure 9). Many states
have had to increase taxes and reduce spending,
which have had further negative effects on their
local economies (Glasmeier and Lee-Chuvala, 2011).
And the new austerity measures announced by the
Federal Government which will cut aid to states and
local communities are almost certain to compound
the problems in such areas still further.
It is very likely therefore that the impact of the
new austerity measures announced by the Federal
government will be felt most by those very areas that
have already suffered most from the recession.
Recent analysis undertaken by the Centre on Budget
and Policy Priorities (Johnson et al., 2011) indicates
that ‘‘at least thirty one states have implemented cuts
that will restrict low-income children’s families’
eligibility for health insurance or reduce their access
to health care services, at least twenty nine states are
cutting medical, rehabilitative, home care or other
The geographies of austerity
297
at University of C
ambridge on January 31, 2013
http://cjres.oxfordjournals.org/D
ownloaded from
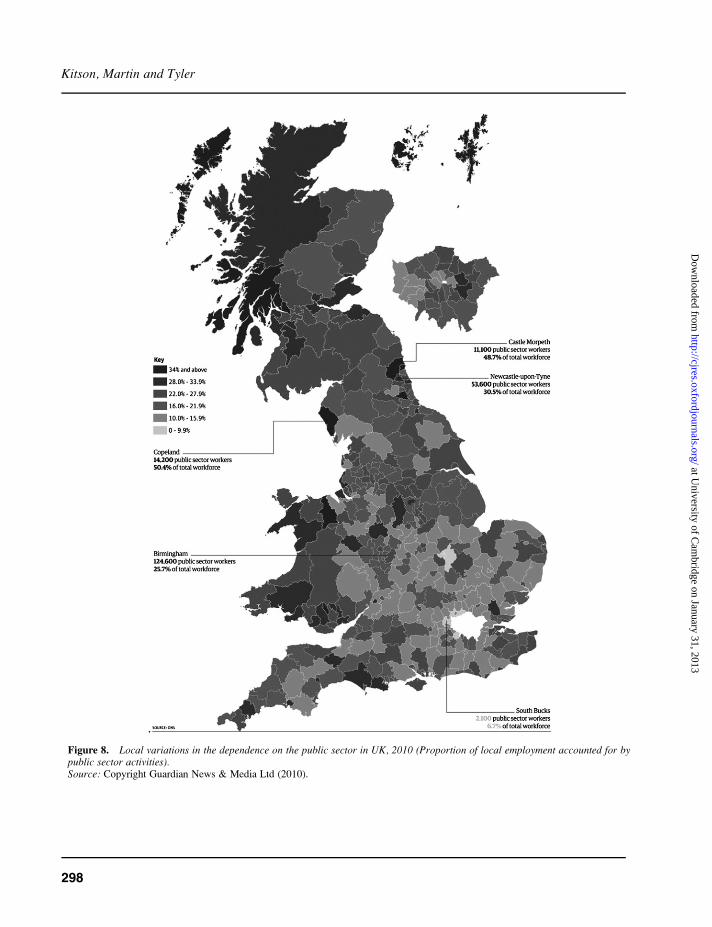
Figure 8. Local variations in the dependence on the public sector in UK, 2010 (Proportion of local employment accounted for bypublic sector activities).Source: Copyright Guardian News & Media Ltd (2010).
Kitson, Martin and Tyler
298
at University of C
ambridge on January 31, 2013
http://cjres.oxfordjournals.org/D
ownloaded from
services needed by low-income people, at least thirty
four states are cutting educational programmes, at
least forty three states have cut assistance to public
colleges and universities and overall some forty six
states have made reductions in services’’ (Johnson
et al., 2011).
Alternatives to austerity
The financial crisis ushered in a return to Keynesian
economics; in response to a massive negative de-
mand shock, governments increased expenditure
and borrowing to boost aggregate demand that
helped to dampen the extent of the global downturn.
But this return to Keynesian economic thinking has
been short lived. During the Great Depression of
the 1930s, the prevailing orthodoxy was captured in
the ‘Treasury view’ in the UK whereby fiscal policy
was considered ineffective and Governments pur-
sued balanced budgets. In his 1929 budget speech,
the Chancellor of the Exchequer Winston Churchill
stated: ‘‘The orthodox Treasury view, and after all
British finance has long been regarded as a model to
many countries, is that when the Government bor-
rows in the money market it becomes a new com-
petitor with industry and engrosses to itself resources
that would otherwise have been employed by private
enterprise, and in the process it raises the rent of
money to all who have need of it’’ (Hansard, 1929).
Despite Keynes (1936) showing the limitations of
the interwar orthodoxy, modern macroeconomic pol-
icy around the globe is today heavily influenced by
a New Treasury View that has many similarities to
its failed predecessor. First, governments should
balance their budgets. If they do not then confidence
in the economy will wane and financial markets will
penalize such fiscal profligacy. Second, the burden
of adjustment should take the form of cuts in gov-
ernment expenditure and not increases in taxes.
Third, the overall share of government expenditure
in the economy should be cut to reduce the ‘burden’
on the ‘wealth creating’ private sector.
The modern case for balanced budgets has been
termed ‘expansionary fiscal contraction’ as it is ar-
gued that fiscal tightening will promote private sec-
tor confidence and facilitate expansionary monetary
policy including low interest rates. Conversely, any
Keynesian fiscal boost would be punished by finan-
cial markets and by the bond market in particular.
The ‘Greek tragedy’ has been a convenient veil
for exponents of this view. According to the UK
Chancellor of the Exchequer, ‘‘Greece is a reminder
of what happens when governments lack the will-
ingness to act decisively and quickly, and when
problems are swept under the carpet. The result is
sharp increases in interest rates, worsening reces-
sion, growing unemployment’’ (Osborne, 2010).
However, in many ways, this ignores the many dif-
ferences between the Greek and UK economies—in
particular the different levels and characteristics of
debt and the different efficiencies of the two tax
systems. Furthermore, it is not clear that financial
markets prefer fiscal tightening to the slow growth
that such tightening produces. According to head of
the IMF: ‘‘We should remember that markets can be
of two minds: while they dislike high public debt—
and may applaud sharp fiscal consolidation—.they dislike low or negative growth even more’’
Figure 9. Predicted 2012 State Budget Shortfalls, as percent of 2011 budgets.Source: Lucas (2011).
The geographies of austerity
299
at University of C
ambridge on January 31, 2013
http://cjres.oxfordjournals.org/D
ownloaded from
(Lagarde, 2011). Financial markets, of course, act in
volatile and unpredictable ways—often with no
regard to economic fundamentals. Even so, in the
current era of very cheap money, it is highly unlikely
that, for most advanced countries, the positive
impact of maintaining fiscal deficits in a period of
slow growth would be offset by tantrums in bond
markets.
The other aspects of the New Treasury View focus
on the need to reducegovernment expenditure andnot
to increase taxation. The case for this might be argued
to be driven more by prejudice than by sound macro-
economic analysis. If government deficits need to be
reduced, then increasing taxation causes less pain than
cutting expenditure—it has a smaller depressing im-
pact on domestic expenditure as part of the increase
in taxes would otherwise have been saved or spent on
imports. So why the arguments for cutting govern-
ment expenditure—be they those of the Tea Party in
the US or seemingly more reasoned arguments from
the EU or from the British Government?
Frequently, the case is made that the private sector
creates wealth and the public sector does not. This is
simply wrong-headed, not just in terms of national
income accounting but also in terms of analyzing
what workers do. The notion that the work of a hair-
dresser or a management consultant produces wealth
but the work of a teacher or a doctor does not is
simply not tenable. Another argument is that taxes
should not or cannot be raised. Even some of the
very rich refute this. In the US, Warren Buffet has
argued: ‘‘My friends and I have been coddled long
enough by a billionaire-friendly Congress . it’s
time for our government to get serious about shared
sacrifice’’ (quoted in Fifield, 2011).
Arguably, cuts in government expenditure are
bearing the brunt of the austerity agenda not because
of fiscal expediency, but because governments and
politicians in many countries are pursuing a long-
run agenda to reduce the role of the state in the
economy. But this will be difficult and painful.
The share of government in the economy has in-
creased in all OECD countries since the Second
World War—primarily because of increases in
expenditure on education, health and social protec-
tion. There are powerful economic drivers that have
led to increases in expenditure on health and educa-
tion: they are highly income elastic services—as
countries become richer, citizens want better educa-
tion and to live longer and healthier lives, and they
are services that can be often be supplied more effi-
ciently by the state than by the private sector. For
both economic and political reasons, it will be very
difficult to makemajor permanent cuts in expenditure
on health and education. This suggests that the bur-
den of fiscal retrenchment will fall on social protec-
tion. It will be the poor, the unemployed and the sick
who will feel the pain. And as the previous section
showed, some places will suffer far more than others.
The current turmoil in the world economy has led
many commentators to conclude that all policy
options have been exhausted. This is wrong: there
are alternatives. First, governments could slow the
process of fiscal retrenchment until economies show
sustained recovery. Second, when economies have
recoveredmore of the burden of adjustment could be
borne by increases in taxation—and, of course, this
will happen automatically through fiscal stabilizers
as economic growth is one of the best methods
of increasing tax revenues. Third, governments
could invest in rebuilding the capacity of their
economies.
Although much of the focus has been on the cy-
clical impact of the crisis, it has also harmed the long-
term growth potential of many economies through
reducing investment and the erosion of capital
stocks. National investment strategies are required
to build and modernize infrastructure and capacity.
The private sector cannot be relied on to invest in
such areas—not simply because of chaos in financial
markets but because the returns to such investments
are economy-wide rather than investor specific. The
returns will be manifest in economic growth in the
future, which of course will lead to higher tax reve-
nue. Currently, there is much concern about the bur-
den of debt that will be passed on to future
generations. It would be better to pay attention to
the burden of slow growth that will be passed on
to others if fiscal retrenchment and stagnant invest-
ment continue in the present. Promoting growth will
not only depend on sound macroeconomic policies,
but a rethink of the role and design of regional and
Kitson, Martin and Tyler
300
at University of C
ambridge on January 31, 2013
http://cjres.oxfordjournals.org/D
ownloaded from
local policies in order that all people in all places
both contribute and benefit from economic recovery.
References
BBC News Europe. (2011) EU austerity drive country bycountry. BBC News Europe, 20 July. Available onlineat: http://www.bbc.co.uk/news/10162176 [Accessed20 September 2011].
Brown, G. (2007) Budget Statement to the House of Com-mons Delivered by the Rt Hon Gordon Brown MP,Chancellor of the Exchequer. Available online at:http://www.harddowdy.com/budget/21_03_07_budg-et_speech.pdf [Accessed 20 September 2011]
Browne, J. and Levell, P. (2010) The Distributional Effect ofTax and Benefit Reforms to Be Introduced between June2010 and April 2014: A Revised Assessment, Institute forFiscal Studies, IFS Briefing Note BN108. Availableonline at: http://www.ifs.org.uk/bns/bn108.pdf [Accessed20 September 2011]
Bubbico, R. L. and Dijksrtra, L.Unemployment Rates inEuropean Regions, 2010. Short Note 03/2011.Regio.c.3(2011) 936361.
Centre for Cities. (2011) Cities Outlook 2011. London:Centre for Cities.
Drudy, P. J. and Collins, M. L. (2011) Ireland: from boomto austerity. Cambridge Journal of Regions, Economyand Society, 4: 339–354.
Fifield, A. (2011) Buffett calls for tax rises for rich. Fi-nancial Times, August 15 Available online at: http://www.ft.com/cms/s/0/0ee8f794-c75f-11e0-9cac-00144feabdc0.html#axzz1YV6Q3pXx [Accessed 20September 2011]
FSA. (2009) The Turner Review: A Regulatory Responseto the Global Banking Crisis. London: Financial Serv-ices Authority.
FT.com. (2005) BIS warns on domestic and internationaldebt. The Financial Times Limited, 27 June. Availableonline at: http://www.ft.com/cms/s/0/198d1cf4-e73f-11d9-a721-00000e2511c8.html#axzz1WWlo3U32[Accessed 27 June 2011].
Glasmeier, A. and Lee-Chuvala, C. (2011) Austerity inAmerica: gender and community—consequences ofrestructuring the public sector. Cambridge Journal ofRegions, Economy and Society, 4: 457–474.
Guardian.co.uk Datablog. (2010) The Public SectorEmployment Map of Britain. Available online at:http://www.guardian.co.uk/news/datablog/2010/nov/16/public-sector-employment-statistics-map-by-authority[Accessed 20 September 2011]
Hansard. (1929) HC Deb 15 April 1929, vol. 227, cc53–6.Available online at: http://hansard.millbanksystems.com/commons/1929/apr/15/disposal-of-surplus [Accessed 20September 2011]
HM Treasury. (2010) Budget 2010. London: The StationeryOffice, Available online at: http://cdn.hm-treasury.gov.uk/junebudget_complete.pdf [Accessed 20 September 2011]
IMF. (2011) Fiscal Monitor - Shifting gears. Tackling chal-lenges on the road to fiscal adjustment. April 2011.Wash-ington, DC: International Monetary Fund,PublicationServices, Available online at: http://www.imf.org/external/pubs/ft/fm/2011/01/pdf/fm1101.pdf [Accessed 20 Sep-tember 2011]
Johnson, N., Oloff, P. and Williams, E. (2011) An Updateon State Budget Cuts. Washington, DC: Center on Bud-get and Policy Priorities, Available online at: http://www.cbpp.org/cms/?fa=view&id=3076 [Accessed 9February 2010].
Keynes, J. M. (1936) The General Theory of Employ-ment, Interest and Money. London: Macmillan.
King, M. (2003) Speech Given by Mervyn King, Gover-nor of the Bank of England to East Midlands Develop-ment Agency/Bank of England dinner, Leicester.Available online at: http://www.bankofengland.co.uk/publications/speeches/2003/speech204.pdf [Accessed14 October 2003].
Krugman, P. (2008) Let’s get fiscal. The New York Times,16 October. Available online at: http://www.nytimes.com/2008/10/17/opinion/17krugman.html?adxnnl=1&adxnnlx=1313579138-6DAqOqba4ucgxBAH4LOKLw[Accessed 20 September 2011]
Lagarde, C. (2011) ‘Don’t let fiscal brakes stall global re-covery’: A Commentary by Christine Lagarde, Manag-ing Director, International Monetary Fund. FinancialTimes, August 16. Available online at: http://www.imf.org/external/np/vc/2011/081611.htm [Accessed 20September 2011]
Lobao, L. and Adua, L. (2011) State rescaling and localgovernments’ austerity policies across the USA, 2001–2008. Cambridge Journal of Regions, Economy andSociety, 4: 419–435.
Lucas, J.-M. (2011) US State and Local GovernmentFinances: From Recession to Austerity. Conjoncture.Paris: Michel Pebereau, April 2011 copyright BNPParibas. Available online at: http://research.bnpparibas.com/applis/www/RechEco.nsf/ConjonctureByDateEN/50295B95134B87D7C125786F00439852/$File/C1104_A1.pdf?OpenElement [Accessed 20September 2011]
MacLeavy, J. (2011) A ‘new politics’ of austerity, work-fare and gender? The UK coalition government’s wel-fare reform proposals. Cambridge Journal of Regions,Economy and Society, 4: 355–367.
Martin, R. L. (2011) The local geographies of the financialcrisis: from the housing bubble to recession and beyond.Journal of Economic Geography, 11: 587–618.
Monastiriotis, V. (2011) Making geographical sense ofthe Greek austerity measures: compositional effects
The geographies of austerity
301
at University of C
ambridge on January 31, 2013
http://cjres.oxfordjournals.org/D
ownloaded from
and long-run implications. Cambridge Journal ofRegions, Economy and Society, 4: 323–337.
New Europe. (2010) Council of Europe Issues Warningon Local Government Cutbacks. New Europe, Is-sue 904. Available online at: http://www.neurope.eu/articles/102832.php [Accessed 27 September 2010].
Osborne, G. (2010) Speech by the Chancellor of the Ex-chequer, the Rt Hon George Osborne MP, on the OBRand spending announcements, 17 May.
Pettifor, A. (2006) The Coming First World Debt Crisis.London: Palgrave.
Stock, J. H. and Watson, M. W. (2002) Has the businesscycle changed and why? National Bureau of EconomicResearch, Working papers, No. 9127.
Walker, R. and Bardhan, A. (2011) California shrugged:fountainhead of the great recession. Cambridge Jour-nal of Regions, Economy and Society, 4: 303–322.
Wilkerson, C. R. (2009) Recession and recovery acrossthe nation: lessons from history. Federal ReserveBank of Kansas Economic Review, Second Quarter:5–24.
Wolff, R. (2011) Capitalism and ‘austerity’ in Europeand the US. State Nature, Winter. Available online at:http://www.stateofnature.org/capitalismAusterity.html[Accessed 20 September 2011].
Wolff, R. and Fraad-Wolff, M. (2011) Public SectorSqueeze. Available online at: http://rdwolff.com/content/public-sector-squeeze [Accessed 1 February 2011].
Kitson, Martin and Tyler
302
at University of C
ambridge on January 31, 2013
http://cjres.oxfordjournals.org/D
ownloaded from